Article

Diabetes-Related β-Cell Dysfunction Across COVID-19 and Metabolic Syndrome Is More Closely Associated with Chronic Oxidative Stress than with Transient Hypoxia

1
Clinic of Endocrinology, University Hospital “Georgi Stranski”—Pleven, 5800 Pleven, Bulgaria
2
Department of Cardiology, Pulmonology, Endocrinology and Rheumatology, Medical University—Pleven, 5800 Pleven, Bulgaria
3
Department of Anatomy, Histology, Cytology and Biology, Biology Division, Medical University—Pleven, 5800 Pleven, Bulgaria
4
Department of Clinical Immunology, Allergology and Clinical Laboratory, Clinical Laboratory Division, Medical University—Pleven, 5800 Pleven, Bulgaria
*
Author to whom correspondence should be addressed.
Diabetology 2026, 7(4), 71; https://doi.org/10.3390/diabetology7040071
Submission received: 14 February 2026 / Revised: 11 March 2026 / Accepted: 23 March 2026 / Published: 2 April 2026
(This article belongs to the Special Issue Beta-Cell Failure and Death: A Cornerstone in Diabetes Pathogenesis)

Abstract

Aims/hypothesis: Hypoxia and oxidative stress have been implicated in both metabolic syndrome and COVID-19-associated dysglycaemia, yet it remains unclear whether shared or distinct mechanisms underlie β-cell dysfunction across these conditions. We investigated hypoxia- and oxidative stress-related pathways in relation to β-cell function during acute COVID-19, post-COVID metabolic states, and COVID-negative metabolic syndrome. Methods: In this prospective observational study, 100 adults were stratified into three groups: active COVID-19 (n = 32), post-COVID with newly diagnosed carbohydrate metabolism disorders (n = 35), and COVID-negative individuals with metabolic syndrome (n = 33). Circulating markers of hypoxia (HIF-1α), oxidative stress (8-epi-prostaglandin F2α), and antioxidant response (NFE2L2) were measured alongside α- and β-cell functional markers, including C-peptide, proinsulin, glucagon, and derived indices of β-cell processing and secretory efficiency. Non-parametric statistical analyses were applied. Results: Circulating HIF-1α levels differed significantly across study groups (p < 0.001), with the highest concentrations observed during active COVID-19, intermediate levels in COVID-negative individuals with metabolic syndrome, and the lowest levels in the post-COVID group. In contrast, oxidative stress, assessed by 8-epi-prostaglandin F2α, differed significantly across groups (p < 0.001), increasing from acute COVID-19 to post-COVID and reaching the highest levels in metabolic syndrome; however, the difference between the post-COVID and metabolic syndrome groups did not remain significant after correction for multiple testing. NFE2L2 concentrations did not differ significantly between groups. Marked β-cell dysfunction was observed predominantly in COVID-negative individuals with metabolic syndrome, characterized by reduced C-peptide levels, elevated glucagon concentrations, increased proinsulin/C-peptide ratios, and reduced C-peptide/glucose ratios (all overall group comparisons p < 0.001). In contrast, β-cell secretory indices were relatively preserved during acute and post-COVID states despite pronounced alterations in hypoxia and oxidative stress markers. Conclusions/interpretation: Hypoxia- and oxidative stress-related pathways exhibit distinct, context-dependent patterns across acute COVID-19, post-COVID dysglycaemia, and metabolic syndrome. Acute COVID-19 is characterized by pronounced hypoxia signalling with relative preservation of β-cell function, whereas chronic metabolic syndrome is associated with sustained oxidative stress and impaired β-cell processing and secretory efficiency. These findings suggest that diabetes-related β-cell dysfunction is more closely associated with chronic oxidative and metabolic stress than with transient infection-related hypoxia during SARS-CoV-2 infection.

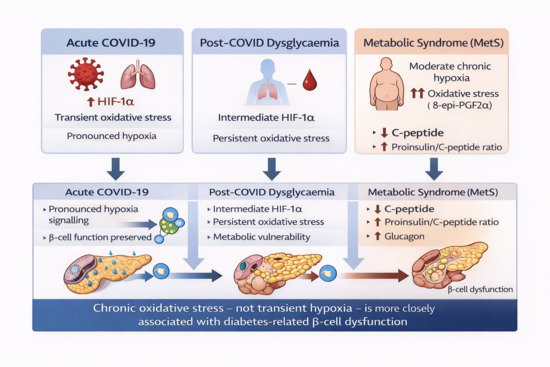
Graphical Abstract

1. Introduction

Pancreatic β-cell dysfunction represents a central event in the development and progression of dysglycaemia across metabolic syndrome (MetS), type 2 diabetes (T2DM), and infection-related metabolic disturbances. β-cells are uniquely vulnerable to metabolic and inflammatory stress due to their high secretory demand and relatively limited intrinsic antioxidant capacity [1,2]. Chronic exposure to hyperglycaemia and lipotoxicity promotes endoplasmic reticulum (ER) stress, mitochondrial dysfunction, impaired proinsulin processing, and progressive secretory failure [3,4,5].
Hypoxia has emerged as an important contributor to metabolic dysregulation. In obesity and MetS, adipose tissue expansion results in local hypoxia, leading to activation of hypoxia-inducible factors (HIFs), particularly HIF-1α [6,7,8]. HIF-1α–mediated transcriptional responses influence glucose metabolism, angiogenesis, inflammation, and mitochondrial function, thereby contributing to systemic insulin resistance (IR) and metabolic inflexibility [6,9,10,11]. However, while hypoxia-related pathways have been extensively studied in obesity and cardiometabolic disease, their direct contribution to β-cell functional impairment remains incompletely defined.
Beyond classical metabolic disease, hypoxia also represents a prominent pathophysiological feature of COVID-19. Acute SARS-CoV-2 infection may induce systemic and tissue-level hypoxic stress, immune dysregulation, endothelial dysfunction, and pro-thrombotic changes [12,13,14,15]. Persistent hypoxia-related signalling has been implicated as a contributor to post-COVID metabolic sequelae, including new-onset diabetes and worsening of pre-existing glycaemic control [16,17,18,19]. Nevertheless, the existing literature has primarily described hypoxia-associated responses in COVID-19 without fully integrating these findings with long-term metabolic outcomes.
Oxidative stress constitutes a fundamental driver of β-cell dysfunction in metabolic disease. Excess reactive oxygen species (ROS) generation impairs insulin gene expression, proinsulin processing, and mitochondrial ATP production, while promoting chronic low-grade inflammation [1,2,20,21,22]. In the context of COVID-19, systemic oxidative stress has been demonstrated to persist beyond the acute phase and associate with prolonged post-COVID syndrome, consistent with sustained redox imbalance [23]. Hypoxia and oxidative stress are tightly interconnected processes, with hypoxia promoting ROS generation and oxidative stress further stabilizing HIF-1α signalling, potentially establishing a self-perpetuating cycle of cellular injury [11,24,25].
Several reviews have highlighted overlapping pathogenic mechanisms between COVID-19 and cardiometabolic disturbances, including inflammatory, hypoxic, and redox-mediated pathways; however, these mechanisms have predominantly been examined in isolation rather than through integrated comparative analyses [7,8,26]. Although both hypoxia and oxidative stress have been implicated in MetS and COVID-19-related dysglycaemia, comparative studies evaluating these pathways across acute infection, post-COVID metabolic disturbances, and classical MetS remain limited. Previous studies have typically investigated hypoxia signalling or oxidative stress independently. For example, HIF-1α-mediated metabolic reprogramming has been implicated in SARS-CoV-2 infection, while chronic oxidative stress has long been recognized as a key contributor to MetS and β-cell vulnerability [1,20,24,26,27]. However, integrated biomarker-based comparisons of these pathways across acute infection, post-infectious metabolic disturbances, and classical MetS remain limited.
We therefore hypothesized that diabetes-related β-cell dysfunction across these clinical contexts would correlate more closely with markers of chronic oxidative stress than with transient hypoxia-related activation. To test this hypothesis, we performed an integrated biomarker-based evaluation of hypoxia- and oxidative stress-related pathways in individuals with acute COVID-19, post-COVID condition, and MetS without prior SARS-CoV-2 infection.

2. Methods

2.1. Study Aim and Design

This prospective observational study aimed to investigate hypoxia- and oxidative stress-related pathways in relation to pancreatic β-cell dysfunction across three clinical and metabolic states: active COVID-19, post-COVID-19, and COVID-19–negative individuals with MetS. Participants were prospectively enrolled, and cross-sectional comparisons were performed between the study groups. The study was designed to allow direct comparison of hypoxia- and oxidative stress-related biomarkers across acute infectious, post-infectious, and chronic metabolic conditions, in order to test the study hypothesis regarding the relative contribution of hypoxia and chronic oxidative stress to β-cell dysfunction.

2.2. Study Population and Grouping

A total of 100 adult participants (34 men and 66 women) were recruited and allocated into three groups according to SARS-CoV-2 infection status and metabolic characteristics.
Group 1: Active COVID-19
This group included adults hospitalized with laboratory-confirmed SARS-CoV-2 infection, defined by a positive polymerase chain reaction (PCR) test at admission. Blood sampling was performed during hospitalization within the acute phase of infection (7–14 days from symptom onset). Blood samples were collected prior to the initiation of pharmacological treatment, including antibiotic therapy, systemic glucocorticoids, or other COVID-19-related medications. This time frame was selected to capture biomarker levels during the acute phase of SARS-CoV-2 infection.
Group 2: Post-COVID-19
This group comprised individuals with newly diagnosed disturbances of carbohydrate metabolism, identified ≥6 months after recovery from COVID-19 (PCR-confirmed). This time interval was selected to ensure evaluation during the post-acute phase of COVID-19, beyond the period of acute infection and early recovery. The median interval between the acute SARS-CoV-2 infection and study enrolment was 7 months (IQR 6–9 months). All participants in this group had:
  • documented normoglycaemia prior to SARS-CoV-2 infection;
  • no history of antidiabetic or metabolic treatment before COVID-19.
Group 3: COVID-19–negative individuals with MetS
This group comprised individuals with MetS, defined according to the 2009 harmonized criteria [28], without evidence of prior SARS-CoV-2 infection, confirmed by:
  • negative PCR testing;
  • absence of clinical history suggestive of COVID-19 supported by negative serological testing where available.
MetS represents a chronic metabolic condition characterized by long-standing IR, dyslipidemia, and central obesity. Disturbances in glucose homeostasis (including T2DM, prediabetes, or IR with normoglycaemia) were identified during the study evaluation and included both newly diagnosed and previously recognized cases.
All participants across the three groups were unvaccinated against COVID-19 prior to enrolment.

2.3. Inclusion Criteria

Participants were eligible for inclusion if they met all of the following criteria:
  • age ≥18 years;
  • ability to provide written informed consent;
  • laboratory-confirmed SARS-CoV-2 infection by positive PCR test at hospitalization (Group 1);
  • documented SARS-CoV-2 infection confirmed by PCR testing with a minimum interval of 6 months after the acute phase (Group 2);
  • newly diagnosed carbohydrate metabolism disorders following SARS-CoV-2 infection with documented normoglycaemia prior to COVID-19 (Group 2);
  • diagnosis of MetS according to harmonized criteria [28], defined by the presence of at least three of five components (Group 3);
  • negative PCR test for SARS-CoV-2 and no anamnestic, clinical, or documented evidence of prior COVID-19 infection. When available, serological testing for SARS-CoV-2 antibodies was reviewed to further exclude previous infection (Group 3).

2.4. Exclusion Criteria

Participants were excluded if any of the following were present:
  • age <18 years or >90 years;
  • pregnancy or breastfeeding;
  • pre-existing type 1 or type 2 diabetes mellitus prior to SARS-CoV-2 infection (Group 2);
  • prior vaccination against COVID-19 (all groups);
  • known autoimmune disease;
  • severe or decompensated cardiovascular, respiratory, gastrointestinal, renal, or active malignant disease;
  • treatment with biological agents, immunosuppressive therapy, or cytotoxic drugs within the preceding 12 months;
  • systemic glucocorticoid therapy during COVID-19 treatment at doses ≥ 0.5–1.0 mg/kg/day methylprednisolone (or equivalent) for more than 10 days;
  • chronic systemic glucocorticoid use.

2.5. Ethics Approval and Informed Consent

The study was conducted after obtaining approval from the Ethics Committee of the Medical University of Pleven (Protocol No. 72/23.06.2023) and in accordance with the ethical principles of the Declaration of Helsinki.
All participants provided written informed consent prior to enrolment, confirming their voluntary participation and consent for the publication of de-identified clinical data. Participants were informed about the study objectives, procedures, and their right to withdraw at any time without consequences.

2.6. Clinical and Metabolic Assessment

All participants underwent a standardized clinical and metabolic evaluation, including detailed medical history, anthropometric measurements, and laboratory investigations.
Body mass index (BMI) was calculated as body weight (kg) divided by height squared (m2). BMI assessment was not feasible in hospitalized patients with acute COVID-19 (Group 1) due to clinical instability and infection control restrictions; therefore, anthropometric comparisons were limited to Groups 2 and 3.
Routine biochemical measurements included fasting plasma glucose, glycated haemoglobin (HbA1c), lipid profile (total cholesterol, triglycerides, HDL-cholesterol, LDL-cholesterol), and uric acid.

2.7. Assessment of COVID-19 Disease Severity

The severity of SARS-CoV-2 infection was assessed using a clinical severity classification in accordance with the recommendations of the National Health Commission of China [29]. COVID-19 was categorized into four clinical forms:
  • Mild, defined by mild clinical symptoms without radiological evidence of pneumonia;
  • Moderately severe, defined by the presence of fever and/or respiratory symptoms with radiological evidence of pneumonia;
  • Severe, defined by respiratory distress (respiratory rate > 30 breaths/min), oxygen saturation ≤ 93% at rest, and/or a ratio of arterial partial pressure of oxygen to fractional inspired oxygen (PaO2/FiO2) ≤ 300 mmHg;
  • Critical, defined by respiratory failure requiring mechanical ventilation, shock, non-pulmonary organ failure, and/or admission to an intensive care unit.
Among patients in the active COVID-19 group (Group 1; n = 32), disease severity was distributed as follows: 6 individuals (18.75%) had mild disease, 7 (21.88%) had moderately severe disease, 16 (50.0%) had severe disease, and 3 (9.38%) had critical disease. The in-hospital mortality rate in this group was 6.25% (2 cases), and the mean duration of hospital stay was 10.45 days.
In the post-COVID group (Group 2; n = 35), six individuals (17.14%) required hospitalization during the acute phase of COVID-19. In these patients, disease severity was classified as moderately severe, characterized by radiologically confirmed pneumonia with stable vital signs, including oxygen saturation ≥ 94% on room air and respiratory rate < 30 breaths per minute. None of the hospitalized post-COVID patients required supplemental oxygen therapy or admission to an intensive care unit. The remaining participants (n = 29; 82.86%) were managed on an outpatient basis during the acute phase of infection. Detailed severity grading was not available for the non-hospitalized outpatient cohort.
Clinical management of hospitalized patients followed standard treatment protocols in place during the study period and included antibiotic therapy, low-dose systemic glucocorticoids (e.g., methylprednisolone 32 mg/day or dexamethasone 6 mg/day or equivalent), anticoagulation, and symptomatic treatment.
Disease severity was included for descriptive purposes but was not incorporated as a covariate in the primary analyses due to limited subgroup sizes.

2.8. Oral Glucose Tolerance Test and Insulin Measurements

A 75 g oral glucose tolerance test (OGTT) was performed in participants without previously diagnosed DM in Groups 2 and 3. Plasma glucose and serum insulin concentrations were measured at fasting, 60 min, and 120 min after glucose ingestion.
Impaired fasting glucose (IFG), impaired glucose tolerance (IGT), and diabetes mellitus (DM) were defined according to World Health Organization criteria [30,31].
IR and hyperinsulinaemia were defined based on elevated fasting and/or post-load insulin concentrations relative to plasma glucose values during the OGTT, in accordance with established clinical practice. This approach enabled classification of participants into insulin-resistant/hyperinsulinaemic and normoglycaemic subgroups.
Type 1 diabetes mellitus (T1DM), including latent autoimmune diabetes in adults (LADA), was defined by the presence of all of the following criteria: low fasting C-peptide concentration, indicating insulin deficiency; positivity for at least one pancreatic islet autoantibody (where available); requirement for insulin therapy to achieve glycaemic control [32].

2.9. Laboratory Measurements

Fasting venous blood samples were collected under standardized conditions, centrifuged within 30 min of collection, aliquoted, and stored at −80 °C until batch analysis. Repeated freeze–thaw cycles were avoided, and samples were thawed only once prior to analysis.
Circulating hypoxia-related signalling was assessed by measuring hypoxia-inducible factor-1α (HIF-1α). Oxidative stress was evaluated using plasma 8-epi-prostaglandin F2α (8-epi-PGF2α). Antioxidant response was assessed by nuclear factor erythroid 2-related factor 2 (NFE2L2). Pancreatic β-cell and α-cell function was assessed by measuring fasting serum C-peptide, proinsulin, and glucagon concentrations.
Hypoxia-related biomarker
Circulating HIF-1α concentrations were measured using a commercially available ELISA kit (Human HIF-1α ELISA Kit, E-EL-H6066, Elabscience, Houston, TX, USA). The detection range was 62.5–4000 pg/mL, and the analytical sensitivity was 37.5 pg/mL.
Oxidative stress biomarker
Plasma 8-epi-prostaglandin F2α (8-epi-PGF2α) levels were quantified using a human ELISA kit (Human 8-epi-PGF2α ELISA Kit, E-EL-0041, Elabscience, Houston, TX, USA). The detection range was 15.63–1000 pg/mL, and the analytical sensitivity was 9.38 pg/mL.
Antioxidant response biomarker
Nuclear factor erythroid 2-related factor 2 (NFE2L2) concentrations were measured using a human ELISA kit (Human NFE2L2 ELISA Kit, E-EL-H1564, Elabscience, Houston, TX, USA). The detection range was 0.16–10 ng/mL, and the analytical sensitivity was 0.1 ng/mL.
Pancreatic hormone biomarkers
Glucagon concentrations were measured using a human ELISA kit (Human GC/Glucagon ELISA Kit, E-EL-H2237, Elabscience, Houston, TX, USA). The detection range was 31.25–2000 pg/mL, and the analytical sensitivity was 18.75 pg/mL.
Proinsulin concentrations were quantified using a human ELISA kit (Human PI/Proinsulin ELISA Kit, E-EL-H2234, Elabscience, Houston, TX, USA). The detection range was 0.31–20 pg/mL, and the analytical sensitivity was 0.19 pg/mL.
C-peptide concentrations were measured using an electrochemiluminescence immunoassay (Elecsys C-peptide, cobas e 100 analyzer; Roche Diagnostics, Mannheim, Germany; Cat. No. 03184897190). The analytical measurement range was 0.003–13.3 nmol/L (0.010–40.0 ng/mL).
Serum insulin concentrations were measured using an electrochemiluminescence immunoassay (ECLIA) on an automated analyzer according to the manufacturer’s protocol.
All ELISA assays were performed according to the manufacturer’s instructions. All samples were analyzed in duplicate, and concentrations were calculated from standard calibration curves provided with each kit.
The proinsulin/C-peptide ratio was calculated as an index of β-cell prohormone processing stress using the formula:
Proinsulin/C-peptide ratio = [proinsulin (pmol/L)/C-peptide (pmol/L)] × 100 [33].
C-peptide concentrations were converted from ng/mL to pmol/L using a conversion factor of 331.
β-cell secretory efficiency relative to glycaemia was estimated using the fasting C-peptide-to-glucose ratio:
C-peptide/glucose ratio = [C-peptide (ng/mL)/fasting plasma glucose (mg/dL)] × 100 [34,35].
Due to limited sample volume and assay availability, not all biomarkers were measured in every participant. The number of individuals included in each analysis is reported in the corresponding tables.

2.10. Statistical Analysis

Statistical analyses were performed using IBM SPSS Statistics, version 25 (IBM Corp., Armonk, NY, USA). Continuous variables are presented as mean ± standard deviation (SD) and median with interquartile range (IQR), as appropriate.
Normality of data distribution was assessed using the Shapiro–Wilk test. As at least one group for each variable demonstrated a non-normal distribution, non-parametric statistical methods were applied for primary group comparisons.
Comparisons among more than two groups were performed using the Kruskal–Wallis test, followed by Dunn’s post hoc test with Bonferroni correction when the omnibus test was significant. Two-group comparisons were conducted using the Mann–Whitney U test.
Associations between continuous variables were evaluated using Spearman’s rank correlation coefficient (ρ). To account for multiple testing, false discovery rate (FDR) correction was applied using the Benjamini–Hochberg procedure where specified.
To further evaluate group differences while accounting for potential demographic confounding, generalized linear models (GLM) were constructed using a gamma distribution with a log link function (gamma, log link). Biomarker concentrations were included as dependent variables, study group was included as a categorical independent variable, and age and sex were included as covariates. Regression coefficients (β), exponentiated coefficients (eβ), and 95% confidence intervals (CI) were reported.
All statistical tests were two-sided, and a p value < 0.05 was considered statistically significant. For post hoc comparisons, adjusted p values were used to determine statistical significance.

3. Results

3.1. Basic Metabolic Characteristics of the Study Population

3.1.1. Metabolic Profile of Group 1 (Active COVID-19)

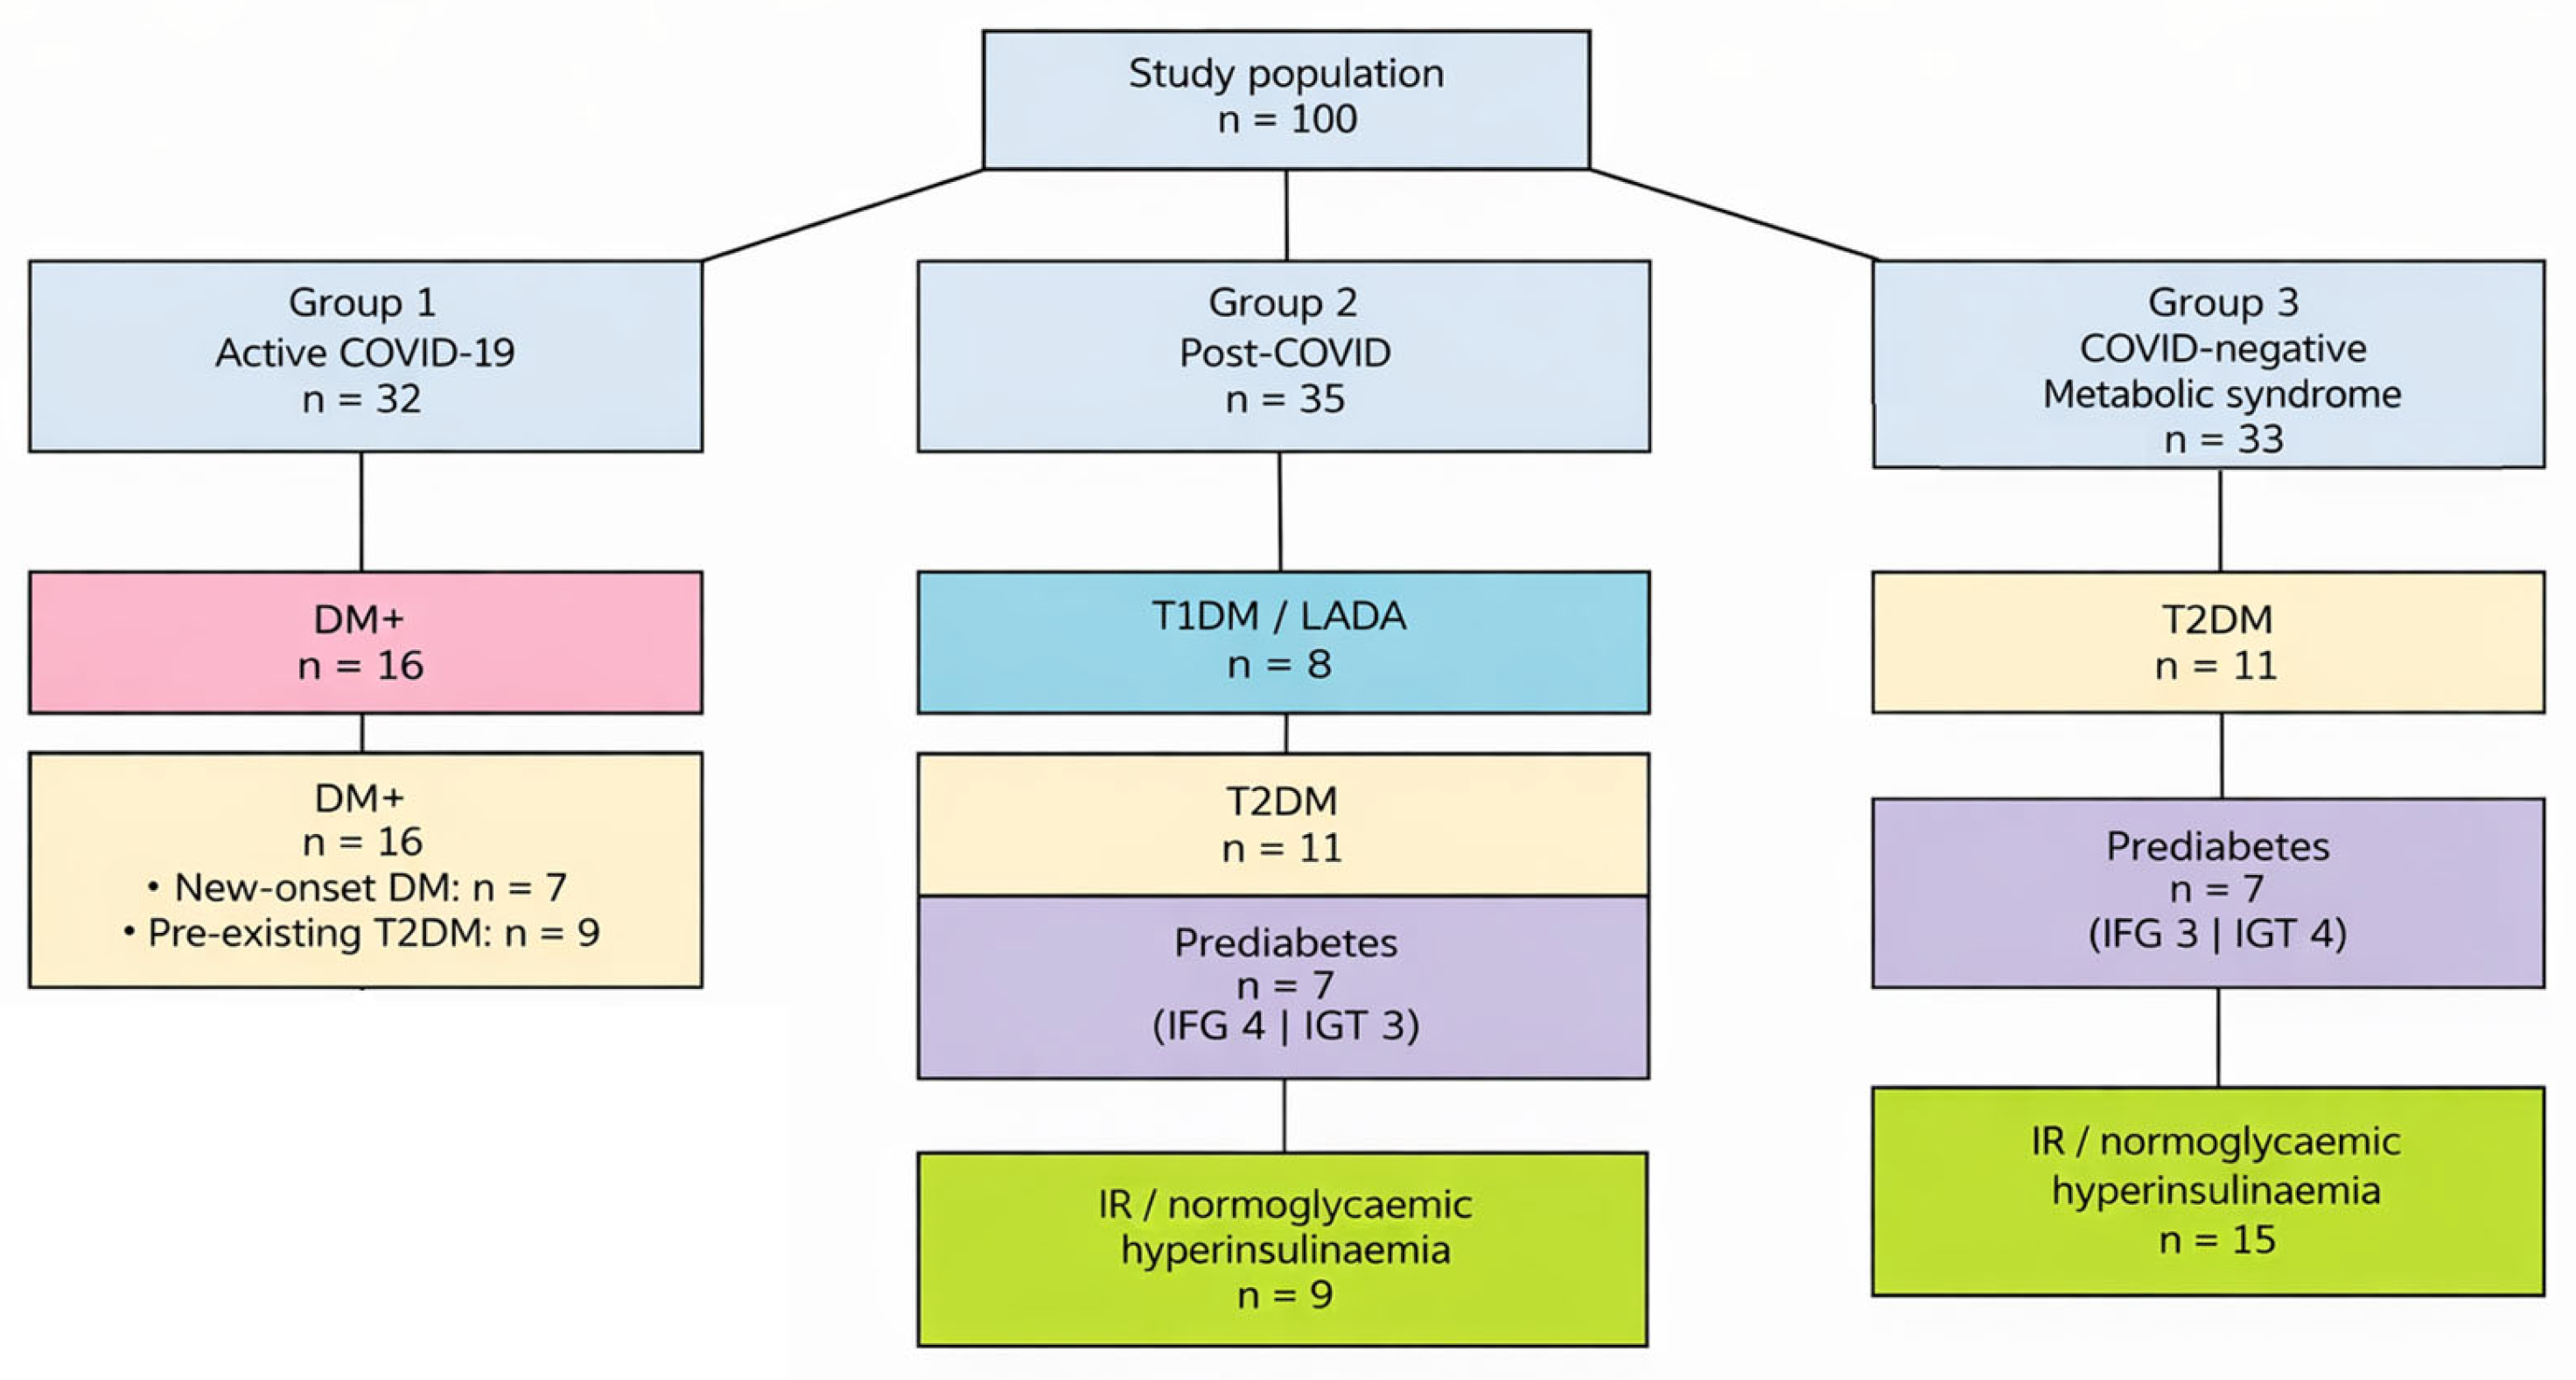
Group 1 comprised 32 individuals with PCR-confirmed acute SARS-CoV-2 infection. Sixteen participants (50.0%) had DM. Of these, seven individuals (21.9%) were newly diagnosed with diabetes during hospitalization for COVID-19 (three women and four men), while nine participants (28.1%) had pre-existing T2DM (three women and six men). Diabetes was diagnosed according to World Health Organization (WHO) criteria [30].
Among participants with pre-existing T2DM (n = 9), one individual (11.1%) was receiving insulin therapy at the time of hospitalization, whereas eight individuals (88.9%) were treated with non-insulin oral antidiabetic agents.

3.1.2. Metabolic Profile of Group 2 (Post-COVID-19)

Group 2 included 35 individuals with newly diagnosed disturbances of carbohydrate metabolism identified after previous SARS-CoV-2 infection. All participants had PCR-confirmed COVID-19 at least 6 months prior to enrolment and reported normoglycaemia before the acute infection.
The newly identified metabolic abnormalities included: T2DM (n = 11), autoimmune diabetes, including T1DM and LADA (n = 8), prediabetes (n = 7), comprising impaired fasting glucose (IFG; n = 4) and impaired glucose tolerance (IGT; n = 3), normoglycaemia with IR and/or hyperinsulinemia (n = 9).
Diabetes, IFG, and IGT were defined according to WHO criteria [30,31]. IR and hyperinsulinemia were identified based on insulin responses during the oral glucose tolerance test. None of the participants had received pharmacological treatment for metabolic disorders prior to study inclusion.

3.1.3. Metabolic Profile of Group 3 (COVID-19–Negative with MetS)

Group 3 comprised 33 unvaccinated individuals with MetS and no evidence of prior SARS-CoV-2 infection, confirmed by negative PCR testing and clinical history. MetS was diagnosed according to the 2009 harmonized criteria (Alberti et al.) [28].
Participants were stratified into metabolic subgroups analogous to those in Group 2, excluding autoimmune diabetes. These included T2DM (n = 11), prediabetes (n = 7), comprising IFG (n = 3) and IGT (n = 4), and normoglycaemia with IR and/or hyperinsulinaemia (n = 15).
At enrolment, 24 participants were newly diagnosed with metabolic disturbances, whereas nine participants had previously established T2DM and were receiving non-insulin antidiabetic therapy. Thus, although a substantial proportion of cases were newly identified during study screening, all individuals in this group fulfilled diagnostic criteria for MetS, reflecting the presence of an underlying chronic cardiometabolic condition (Figure 1).

3.2. Circulating HIF-1α Levels

3.2.1. Circulating HIF-1α Levels Across Study Groups

Circulating HIF-1α concentrations differed significantly among the three study groups (Kruskal–Wallis test: H = 32.97, p < 0.001; Table 1). Patients with active COVID-19 exhibited markedly higher HIF-1α levels compared with both post-COVID individuals and COVID-negative individuals with MetS.
Median HIF-1α concentrations were highest in the active COVID-19 group, intermediate in the COVID-negative individuals with MetS, and lowest in the post-COVID group.
Post hoc Dunn–Bonferroni analysis confirmed significantly elevated HIF-1α concentrations in the active COVID-19 group compared with the post-COVID group (p < 0.001) and the COVID-negative MetS group (p = 0.012). A significant difference was also observed between the post-COVID and COVID-negative groups (p = 0.013). Detailed pairwise comparisons are provided in Supplementary Table S1.

3.2.2. HIF-1α Levels Stratified by Diabetes Status

When stratified by diabetes status, circulating HIF-1α concentrations differed significantly across the six subgroups defined by study group and diabetes status (Kruskal–Wallis test: H = 37.87, p < 0.001; Table 2). Across all three study groups, individuals with diabetes exhibited numerically higher HIF-1α concentrations than their non-diabetic counterparts.
Post hoc Dunn–Bonferroni analysis demonstrated that diabetic patients with active COVID-19 had significantly higher HIF-1α levels than both diabetic and non-diabetic individuals in the post-COVID group (p < 0.001 for both comparisons), as well as compared with non-diabetic COVID-negative individuals with MetS (p = 0.005). Detailed pairwise comparisons are provided in Supplementary Table S2.
Within-group analyses using the Mann–Whitney U test did not reveal significant differences in circulating HIF-1α concentrations between diabetic and non-diabetic individuals in either the active COVID-19 group (p = 0.219) or the post-COVID group (p = 0.585). In contrast, among COVID-negative patients with MetS, individuals with diabetes exhibited significantly higher HIF-1α levels compared with their non-diabetic counterparts (p = 0.030; Supplementary Table S3).

3.2.3. Age- and Sex-Adjusted GLM Analysis of HIF-1α

In age- and sex-adjusted generalized linear models (GLM), the association between active COVID-19 status and circulating HIF-1α levels was attenuated and no longer statistically significant after adjustment (eβ = 0.97; p = 0.929).
In contrast, post-COVID participants exhibited significantly lower HIF-1α levels compared with MetS controls (eβ = 0.58; p = 0.026). The comparison between active and post-COVID phases showed a non-significant trend toward higher HIF-1α levels during acute infection (eβ = 1.68; p = 0.089).3.2.4. HIF-1α Levels Across Metabolic Subgroups in Post-COVID and COVID-Negative MetS Cohorts
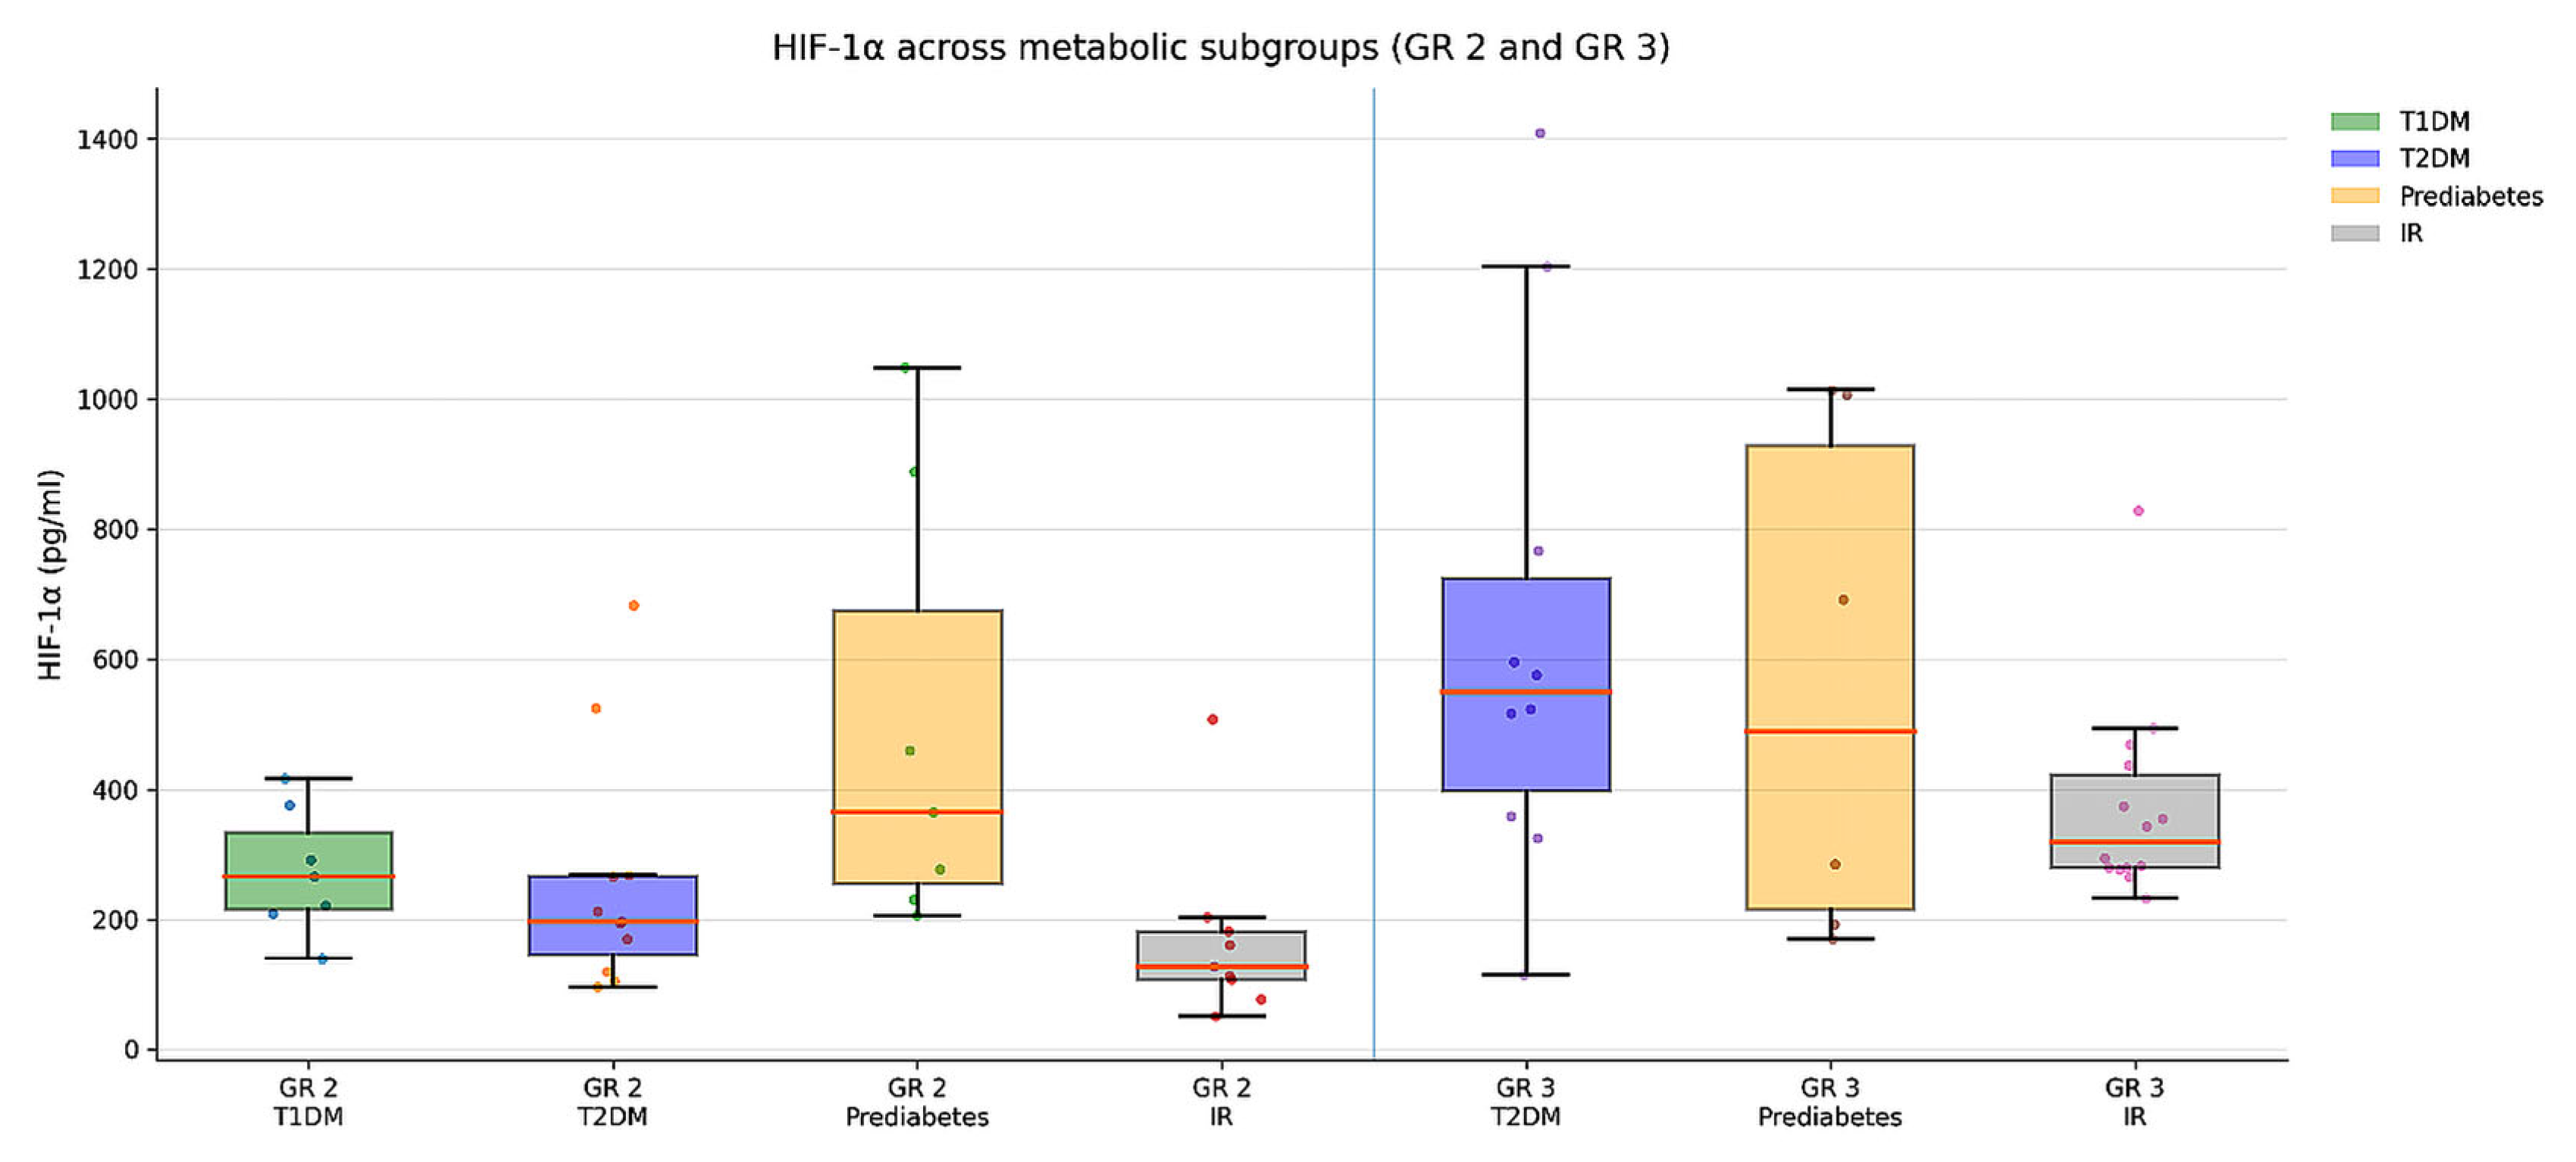
To further characterize metabolic heterogeneity, circulating HIF-1α concentrations were analysed across metabolic subgroups within the post-COVID (Group 2) and COVID-negative MetS (Group 3) cohorts (Figure 2; Supplementary Table S4).
In the post-COVID group, HIF-1α levels differed significantly among metabolic subgroups (Kruskal–Wallis test: H = 11.95, p = 0.0076). Individuals with IR exhibited the lowest circulating HIF-1α concentrations, whereas higher levels were observed in participants with prediabetes and T1DM. Post hoc pairwise comparisons using Mann–Whitney U tests with false discovery rate (FDR) correction identified significant differences between the insulin-resistant subgroup and both the prediabetes and T1DM subgroups (q < 0.05; Supplementary Table S5).
In contrast, no statistically significant differences in circulating HIF-1α concentrations were observed across metabolic subgroups within the COVID-negative MetS group (Kruskal–Wallis test: H = 5.35, p = 0.069), despite numerically higher median values in individuals with T2DM. No post hoc comparisons remained significant after FDR correction in this group.
To evaluate whether prior COVID-19 status modified HIF-1α levels within comparable metabolic phenotypes, matched subgroups (prediabetes, IR, and T2DM) were compared between Groups 2 and 3. Circulating HIF-1α concentrations differed significantly between post-COVID and COVID-negative participants within the IR (q = 0.010) and T2DM (q = 0.011) subgroups after FDR correction, whereas no difference was observed within the prediabetes subgroup (Supplementary Table S6).

3.3. Circulating 8-epi-PGF2α Levels

3.3.1. Circulating 8-epi-PGF2α Levels Across Study Groups

Circulating 8-epi-prostaglandin F2α (8-epi-PGF2α) concentrations differed significantly among the three study groups (Kruskal–Wallis test: H = 32.44, p < 0.001; Table 3). Median 8-epi-PGF2α levels were lowest in patients with active COVID-19, intermediate in post-COVID individuals, and highest in COVID-negative participants with MetS. Adjusted analyses accounting for age and sex are presented in Section 3.3.3.
Post hoc Dunn–Bonferroni analysis demonstrated significantly lower 8-epi-PGF2α concentrations in the active COVID-19 group compared with both the post-COVID group (p = 0.0007) and the COVID-negative MetS group (p < 0.001). No statistically significant difference was observed between the post-COVID and COVID-negative MetS groups after correction for multiple testing (Supplementary Table S7).

3.3.2. 8-epi-PGF2α Levels Stratified by Diabetes Status

When stratified by diabetes status, circulating 8-epi-prostaglandin F2α (8-epi-PGF2α) concentrations differed significantly across the six subgroups defined by study group and diabetes status (Kruskal–Wallis test: H = 34.06, p < 0.001; Table 4). Across all study groups, individuals with diabetes exhibited numerically higher 8-epi-PGF2α levels compared with their non-diabetic counterparts.
Post hoc Dunn–Bonferroni analysis demonstrated that 8-epi-PGF2α concentrations in both diabetic and non-diabetic individuals with active COVID-19 differed significantly from those observed in non-diabetic COVID-negative individuals with MetS (adjusted p < 0.001 for both comparisons). No statistically significant differences were observed between diabetic and non-diabetic individuals within the active COVID-19 or post-COVID groups after correction for multiple testing (Supplementary Table S8).
Within-group comparisons by diabetes status
Within-group analyses using the Mann–Whitney U test revealed no statistically significant differences in circulating 8-epi-PGF2α concentrations between diabetic and non-diabetic individuals in either the active COVID-19 or post-COVID groups. In contrast, among COVID-negative individuals with MetS, participants with diabetes exhibited significantly higher 8-epi-PGF2α levels compared with their non-diabetic counterparts (p = 0.030; Supplementary Table S9).

3.3.3. Age- and Sex-Adjusted GLM Analysis 8-epi-PGF2α

In age- and sex-adjusted GLM (gamma, log link), circulating 8-epi-PGF2α levels were significantly lower in the active COVID-19 group compared with the COVID-negative MetS group (eβ = 0.55; p < 0.001), corresponding to an approximately 45% reduction. Post-COVID participants also demonstrated significantly lower 8-epi-PGF2α levels compared with MetS controls (eβ = 0.75; p = 0.036), corresponding to an approximately 25% reduction.
The comparison between acute and post-COVID phases showed a borderline trend toward lower 8-epi-PGF2α levels during acute infection (eβ = 0.73; p = 0.051). These findings indicate that oxidative stress differences remained significant after adjustment for age and sex.

3.3.4. 8-epi-PGF2α Levels Across Metabolic Subgroups in Post-COVID and COVID-Negative MetS Cohorts

To further assess oxidative stress across metabolic phenotypes, circulating 8-epi-PGF2α concentrations were analyzed across metabolic subgroups within the post-COVID (Group 2) and COVID-negative MetS (Group 3) cohorts (Table 5).
In the post-COVID group, no statistically significant differences in circulating 8-epi-PGF2α levels were observed across metabolic subgroups (Kruskal–Wallis test: H = 3.74, p = 0.291). Similarly, 8-epi-PGF2α concentrations did not differ significantly across metabolic subgroups within the COVID-negative MetS group (Kruskal–Wallis test: H = 5.26, p = 0.072), despite numerical variation between subgroups.
Post hoc pairwise comparisons did not identify any differences that remained significant after false discovery rate (FDR) correction in either cohort (Supplementary Table S10).
To evaluate whether prior COVID-19 status modified oxidative stress levels within comparable metabolic phenotypes, matched metabolic subgroups were compared between Groups 2 and 3. No statistically significant differences in circulating 8-epi-PGF2α concentrations were detected between post-COVID and COVID-negative participants within matched metabolic phenotypes after FDR correction (Supplementary Table S11).

3.4. Circulating NFE2L2 Levels

3.4.1. Circulating NFE2L2 Levels Across Study Groups

Circulating nuclear factor erythroid 2-related factor 2 (NFE2L2) concentrations did not differ significantly among the three study groups (Kruskal–Wallis test: H = 3.42, p = 0.181; Table 6).

3.4.2. NFE2L2 Levels Stratified by Diabetes Status

When stratified by diabetes status, circulating NFE2L2 concentrations did not differ significantly across the six subgroups defined by study group and diabetes status (Kruskal–Wallis test: H = 5.76, p = 0.330; Table 7).
Within-group comparisons by diabetes status
Within-group analyses using the Mann–Whitney U test revealed no statistically significant differences in circulating NFE2L2 concentrations between diabetic and non-diabetic individuals in any study group (all p > 0.05; Supplementary Table S12).

3.4.3. Age- and Sex-Adjusted GLM Analysis NFE2L2

In age- and sex-adjusted GLM (gamma, log link), no statistically significant differences in circulating NFE2L2 levels were observed between the study groups. Compared with the COVID-negative MetS group, neither the active COVID-19 group (p = 0.632) nor the post-COVID group (p = 0.991) demonstrated significant differences in NFE2L2 concentrations. The comparison between acute and post-COVID phases was likewise non-significant (p = 0.607).

3.4.4. NFE2L2 Levels Across Metabolic Subgroups in Post-COVID and COVID-Negative MetS Cohorts

Circulating NFE2L2 concentrations differed significantly across metabolic subgroups within the post-COVID group (Group 2) (Kruskal–Wallis test: H = 10.85, p = 0.013; Table 8). The relatively large standard deviation observed in the T1DM/LADA subgroup reflects the small sample size and substantial inter-individual variability within this subgroup, including one markedly elevated value. In contrast, no statistically significant differences in NFE2L2 levels were observed across metabolic subgroups within the COVID-negative MetS group (Group 3) (Kruskal–Wallis test: H = 1.64, p = 0.440).
Post hoc pairwise comparisons within the post-COVID cohort using Mann–Whitney U tests with false discovery rate (FDR) correction identified a significant difference between individuals with T1DM and those with prediabetes (q = 0.048). No other pairwise comparisons remained statistically significant after correction (Supplementary Table S13).
To assess whether prior COVID-19 status modified antioxidant response within comparable metabolic phenotypes, matched metabolic subgroups were compared between Groups 2 and 3. No statistically significant differences in circulating NFE2L2 concentrations were detected between post-COVID and COVID-negative participants within matched metabolic phenotypes after FDR correction (Supplementary Table S14).

3.5. β-Cell Functional Markers Across Study Groups

To assess whether alterations in hypoxia- and oxidative stress-related pathways were accompanied by changes in and β-cell and α-cell function, circulating levels of C-peptide, proinsulin, and glucagon were compared across the three study groups (Table 9).
Significant group-wise differences were observed for C-peptide (H = 19.65, p < 0.001) and glucagon (H = 21.91, p < 0.001), whereas proinsulin levels did not differ significantly among the three study groups (H = 3.83, p = 0.147).
Post hoc Dunn–Bonferroni analyses demonstrated that C-peptide concentrations were significantly lower in the COVID-negative group with MetS compared with both the active COVID-19 (p = 0.004) and post-COVID groups (p < 0.001), with no significant difference between the active COVID-19 and post-COVID groups.
Similarly, glucagon concentrations were significantly higher in the COVID-negative MetS group compared with both the active COVID-19 (p = 0.013) and post-COVID groups (p < 0.001), whereas no significant difference was observed between the active COVID-19 and post-COVID groups.

Age- and Sex-Adjusted GLM Analysis

In age- and sex-adjusted GLM (gamma, log link), C-peptide levels remained significantly higher in both the active COVID-19 and post-COVID groups compared with COVID-negative MetS controls (eβ = 4.62 and 6.42, respectively; both p < 0.001). No significant difference was observed between the active and post-COVID groups (p = 0.336).
Similarly, glucagon concentrations were significantly lower in both the active COVID-19 and post-COVID groups compared with MetS controls (eβ = 0.67; p = 0.014 and eβ = 0.68; p = 0.008, respectively), with no significant difference between the two COVID-19-related groups (p = 0.913). These associations remained robust after adjustment for age and sex.
In contrast, proinsulin levels did not differ significantly between groups in adjusted analyses (all p > 0.05).

3.6. β-Cell Processing and Secretory Efficiency Ratios Across Study Groups

To further characterize β-cell processing and secretory efficiency, the proinsulin/C-peptide and C-peptide/glucose ratios were compared across the three study groups (Table 10). Both ratios differed significantly among groups (Kruskal–Wallis tests: p < 0.001 for both).
Post hoc Dunn–Bonferroni analyses demonstrated higher proinsulin/C-peptide ratios in the COVID-negative MetS group compared with the post-COVID group (p < 0.001), while the post-COVID group exhibited lower values than the active COVID-19 group (p = 0.020). No significant difference was observed between the active COVID-19 and COVID-negative MetS groups.
In addition, the C-peptide/glucose ratio was significantly reduced in the COVID-negative MetS group compared with both the active COVID-19 (p = 0.048) and post-COVID groups (p < 0.001), with no significant difference between the active COVID-19 and post-COVID groups.

Age- and Sex-Adjusted GLM Analysis

In age- and sex-adjusted GLM (gamma, log link), the C-peptide/glucose ratio remained significantly higher in both the active COVID-19 and post-COVID groups compared with COVID-negative MetS controls (eβ = 2.80; p = 0.007 and eβ = 3.90; p < 0.001, respectively; Table 11). No significant difference was observed between the active and post-COVID groups (p = 0.359).
For the proinsulin/C-peptide ratio, adjusted analyses demonstrated significantly lower values in the post-COVID group compared with MetS controls (eβ = 0.26; p = 0.002). No significant difference was observed between the active COVID-19 and COVID- negative MetS groups (p = 0.604). Direct comparison between active and post-COVID groups revealed significantly higher proinsulin/C-peptide ratios during the acute phase (eβ = 2.85; p = 0.038).

3.7. Summary of Adjusted GLM Analyses

A summary of age- and sex-adjusted GLM analyses across all biomarkers is presented in Table 11.
Table 11. Summary of age- and sex-adjusted GLM (gamma, log link) analyses across biomarkers.
BiomarkerComparisonβeβ95% CI (eβ)p-Value
8-epi-PGF2αAcute COVID vs. MetS−0.600.550.38–0.78<0.001
Post-COVID vs. MetS−0.290.750.57–0.980.036
Acute vs. Post−0.320.730.54–1.000.051
NFE2L2Acute COVID vs. MetS−0.130.880.52–1.490.632
Post-COVID vs. MetS≈0.001.000.67–1.490.991
Acute vs. Post−0.130.880.53–1.440.607
HIF-1αAcute COVID vs. MetS−0.030.970.51–1.830.929
Post-COVID vs. MetS−0.540.580.36–0.940.026
Acute vs. Post0.521.680.92–3.060.089
GlucagonAcute COVID vs. MetS−0.400.670.49–0.920.014
Post-COVID vs. MetS−0.390.680.51–0.900.008
Acute vs. Post−0.010.990.74–1.320.913
C-peptideAcute COVID vs. MetS1.534.621.91–7.53<0.001
Post-COVID vs. MetS1.866.422.96–9.02<0.001
Acute vs. Post−0.330.720.39–1.380.336
ProinsulinAcute COVID vs. MetS0.471.610.75–3.420.219
Post-COVID vs. MetS0.301.350.92–1.980.255
Acute vs. Post−0.170.840.58–1.420.688
C-peptide/Glucose
ratio
Acute COVID vs. MetS1.032.801.32–5.940.007
Post-COVID vs. MetS1.363.902.15–7.07<0.001
Acute vs. Post−0.330.720.35–1.460.359
Proinsulin/C-peptide ratioAcute COVID vs. MetS−0.310.730.23–2.360.604
Post-COVID vs. MetS−1.360.260.11–0.610.002
Acute vs. Post1.052.851.06–7.650.038
β represents the regression coefficient on the log scale and eβ the exponentiated coefficient (ratio of means). MetS was used as the reference group where applicable. Values are presented with 95% confidence intervals (CI). MetS, metabolic syndrome.

3.8. Correlation Analyses Between Hypoxia, Oxidative Stress, and β-Cell Stress Markers

Within-group Spearman rank correlation analyses were performed as a sensitivity assessment to explore relationships between hypoxia-related signaling (HIF-1α), oxidative stress (8-epi-PGF2α), and β-cell processing stress (Proinsulin/C-peptide ratio) (Supplementary Table S15). False discovery rate (FDR) correction was applied within each study group.
After correction for multiple testing, no statistically significant correlations were observed in either the active COVID-19 or post-COVID groups. In contrast, within the COVID-negative MetS group, circulating HIF-1α levels were inversely correlated with the proinsulin/C-peptide ratio (ρ = −0.60, FDR-adjusted q = 0.019), indicating a group-specific association between hypoxia-related signaling and β-cell processing stress.
No other correlations remained significant after FDR correction.

4. Discussion

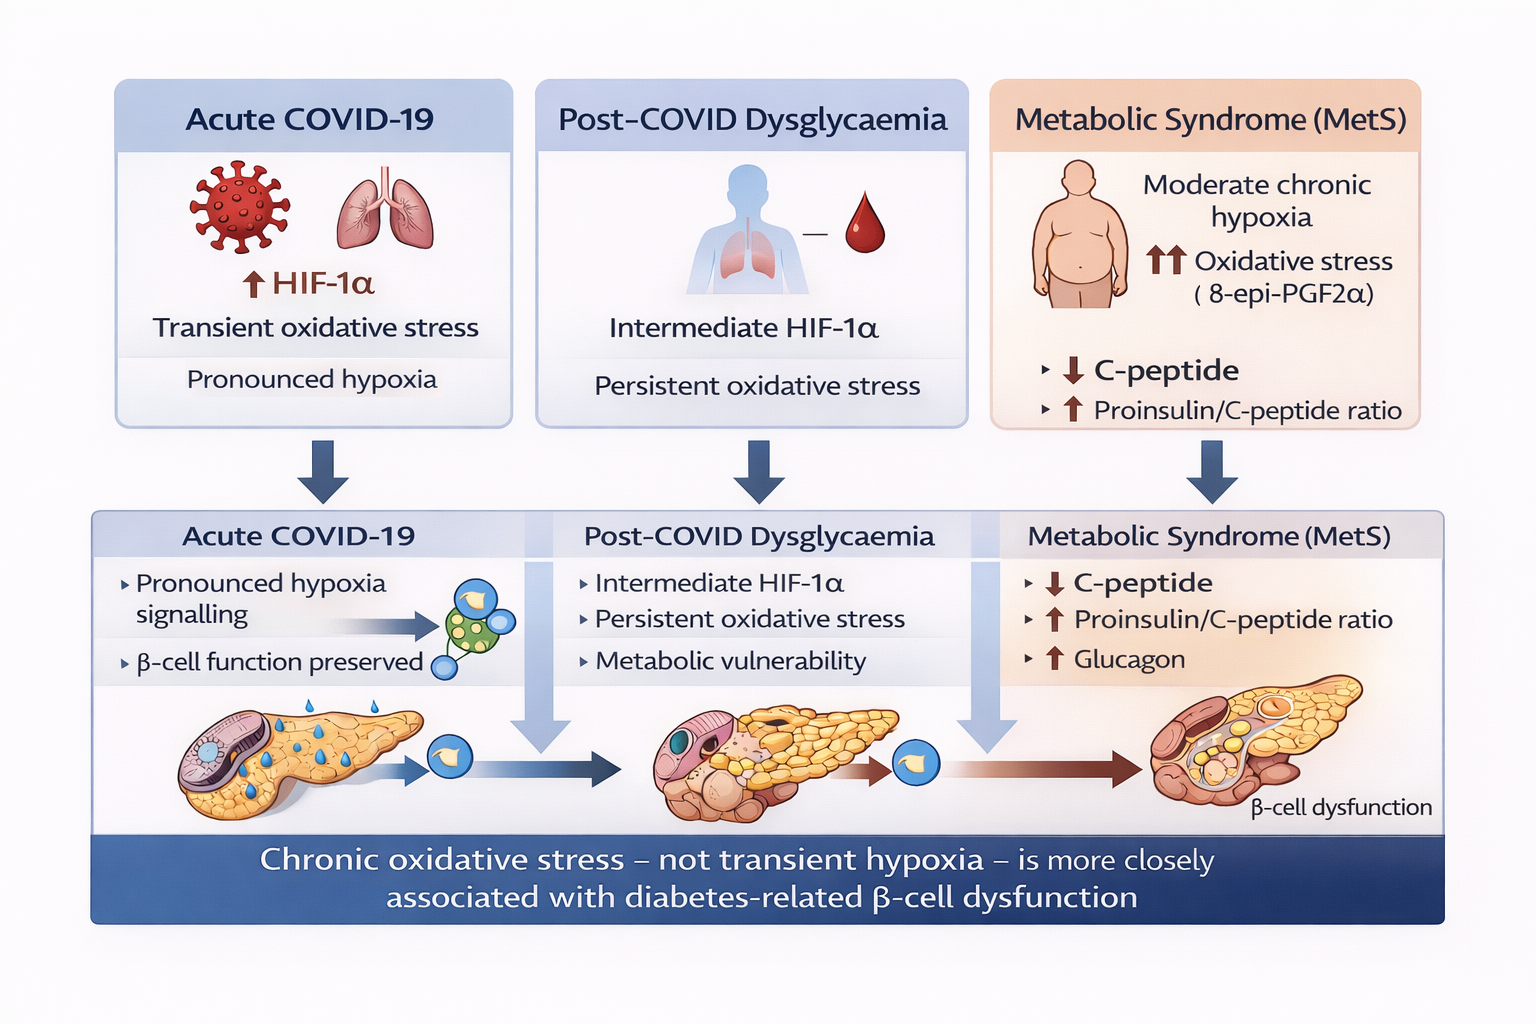
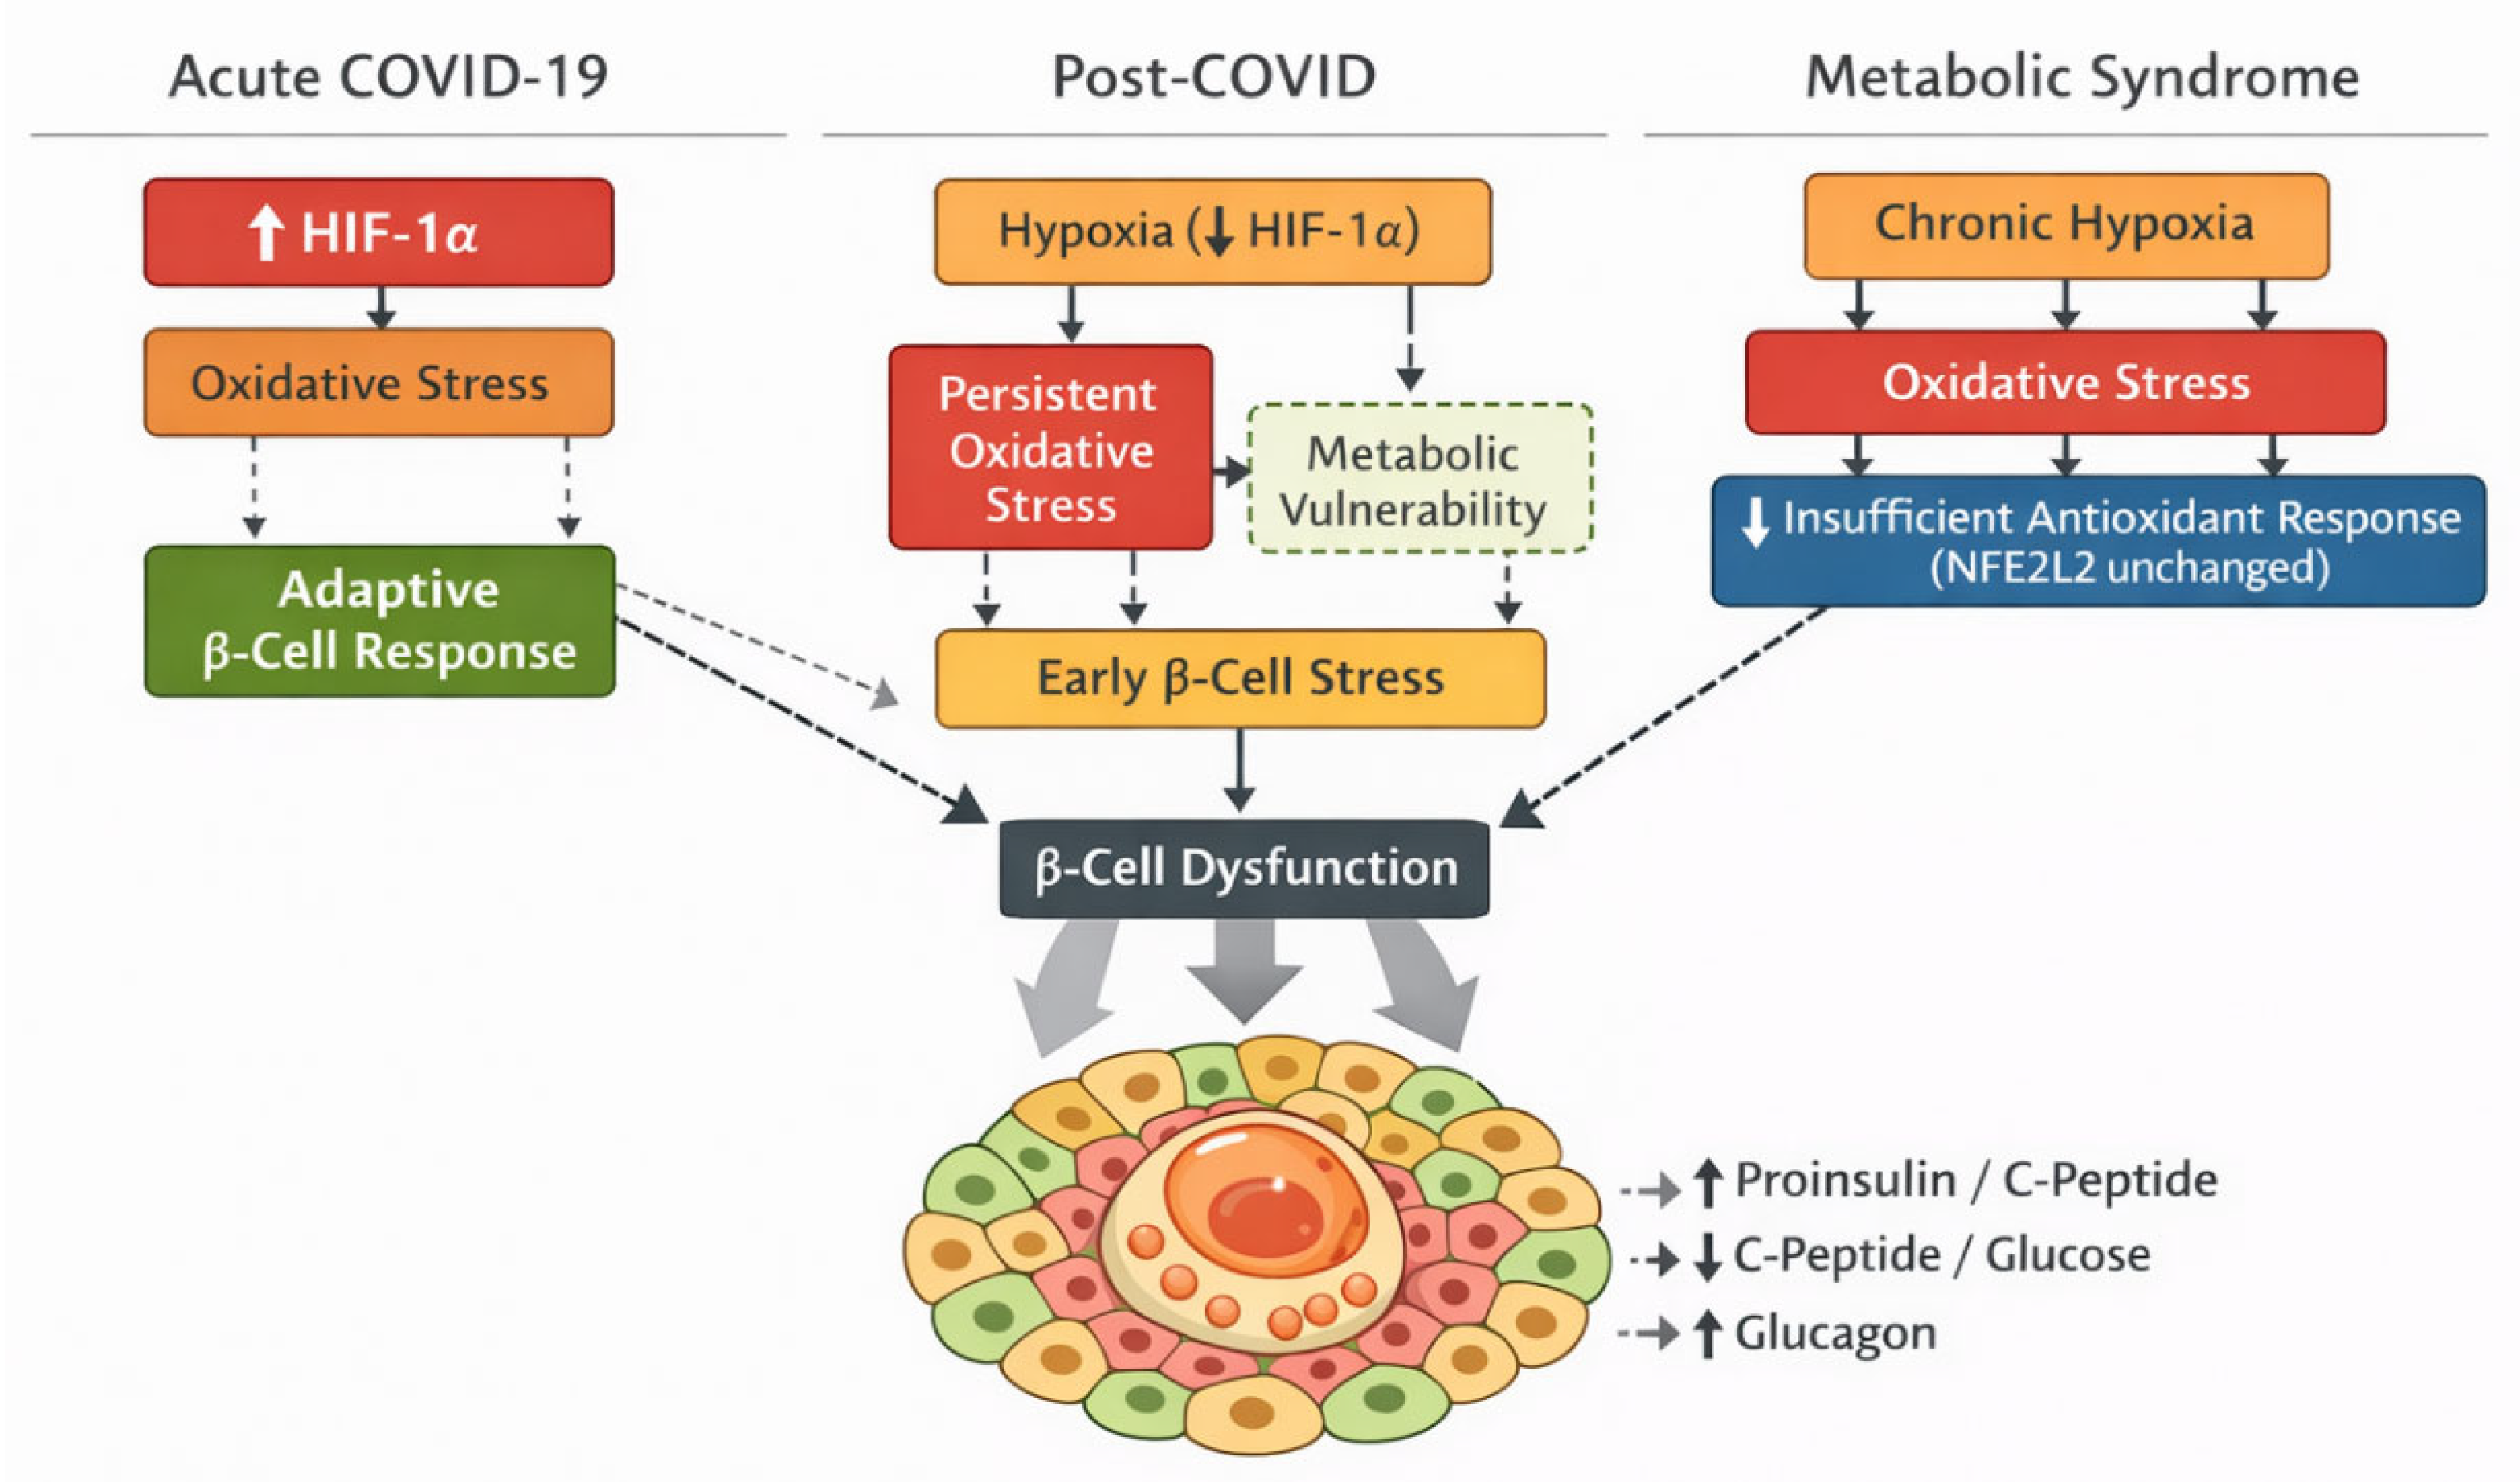
The present study provides a comprehensive assessment of hypoxia- and oxidative stress-related pathways in relation to β-cell function across acute COVID-19, post-COVID, and COVID-negative classical MetS states (Figure 3). By integrating circulating markers of hypoxia (HIF-1α), oxidative stress (8-epi-PGF2α), and antioxidant response (NFE2L2) with detailed indices of β-cell secretion and prohormone processing, our findings offer novel insights into how transient infectious stress and chronic metabolic stress differentially shape β-cell vulnerability.
Current literature increasingly supports the concept that chronic metabolic stress—including glucotoxicity, lipotoxicity, and endoplasmic reticulum stress—represents a central determinant of β-cell vulnerability in metabolic disease. In this context, the present study does not seek to challenge this established framework, but rather to examine whether infection-related hypoxia during COVID-19 exerts an independent and sustained impact on β-cell function beyond chronic metabolic stress mechanisms.
We observed pronounced activation of hypoxia-related signalling during acute COVID-19, reflected by markedly elevated circulating HIF-1α concentrations, with partial attenuation in the post-COVID phase. In contrast, oxidative stress, assessed by circulating 8-epi-PGF2α, increased from acute COVID-19 to post-COVID and was highest in COVID-negative individuals with MetS, although differences between the post-COVID and MetS groups did not remain significant after correction for multiple testing. Notably, these alterations occurred in the absence of significant differences in circulating NFE2L2 levels, suggesting that systemic antioxidant responses may be insufficient to counterbalance sustained oxidative stress, particularly in chronic metabolic disease.
Importantly, alterations in hypoxia- and oxidative stress-related markers were accompanied by distinct patterns of β-cell dysfunction. While β-cell secretory capacity appeared relatively preserved during acute and post-COVID states, COVID-negative individuals with MetS exhibited clear evidence of impaired β-cell processing and secretory efficiency. This was reflected by elevated proinsulin/C-peptide ratios, reduced C-peptide/glucose ratios, and increased circulating glucagon concentrations. Together, these findings are consistent with chronic β-cell stress and defective hormone processing characteristic of established metabolic disease, rather than with transient infection-related perturbations.
Despite marked group-wise differences in hypoxia and oxidative stress markers, neither circulating HIF-1α nor 8-epi-PGF2α levels were consistently associated with diabetes status across groups. These findings suggest that hypoxia-related signalling and oxidative stress primarily reflect the broader metabolic and inflammatory milieu rather than acting as isolated determinants of diabetes onset.
The schematic summarizes context-dependent activation of hypoxia-related and oxidative stress pathways in acute COVID-19, post-COVID, and COVID-negative MetS states, and their relationship to β-cell functional outcomes (Figure 3). Acute COVID-19 is characterized by marked hypoxia signalling with relatively preserved β-cell function, whereas chronic MetS is associated with sustained oxidative stress, an insufficient antioxidant response, and impaired β-cell processing and secretory efficiency. Solid arrows indicate associations directly supported by the present data, while dashed arrows represent proposed mechanistic links.

4.1. Hypoxia Signalling in Acute Infection and Chronic Metabolic Stress: Implications for β-Cell Function

Hypoxia signalling emerged as a prominent but context-dependent feature across the studied disease states. During acute COVID-19, circulating HIF-1α levels were markedly elevated, consistent with the profound systemic hypoxia and inflammatory burden characteristic of severe viral infection. In this setting, activation of hypoxia-inducible pathways likely represents an adaptive response aimed at maintaining cellular energy homeostasis and supporting immune and metabolic demands under conditions of reduced oxygen availability [13,14]. Experimental and clinical studies have shown that HIF-1α activation during acute hypoxic stress promotes glycolytic metabolism, angiogenic signalling, and immune cell function, all of which are critical during severe infection [11].
Following recovery from SARS-CoV-2 infection, HIF-1α levels were substantially lower than during acute disease, indicating partial resolution of hypoxia-related stress. Nevertheless, hypoxia signalling did not fully return to levels observed in COVID-negative individuals with MetS, suggesting the persistence of subclinical alterations in oxygen sensing or cellular metabolism in the post-COVID state. This intermediate phenotype is consistent with accumulating evidence that COVID-19 may induce long-lasting disturbances in tissue oxygen utilization, mitochondrial function, and microvascular integrity, even after apparent clinical recovery [16,17].
In contrast, COVID-negative individuals with MetS exhibited a distinct pattern of hypoxia signalling. Rather than the marked elevations observed during acute infection, circulating HIF-1α levels in this group were moderately increased, consistent with chronic low-grade hypoxia associated with adipose tissue expansion, impaired microcirculation, and increased metabolic oxygen demand [7,8]. Adipose tissue hypoxia has been widely implicated in the pathogenesis of IR and metabolic inflammation, primarily through sustained activation of HIF-dependent pathways that differ fundamentally from the acute hypoxic responses seen during infection [6].
These differences in hypoxia signalling may have important implications for β-cell function. Acute hypoxia during infection appears to be tolerated without overt disruption of β-cell secretory capacity, likely reflecting short-term adaptive mechanisms and metabolic flexibility. In contrast, chronic hypoxia associated with MetS may contribute to progressive β-cell stress through impaired mitochondrial function, altered proinsulin processing, and increased susceptibility to secretory dysfunction [3,36]. Notably, pancreatic β-cells are particularly sensitive to sustained hypoxic stress due to their high metabolic demand and limited capacity for anaerobic energy production [37].
Importantly, age- and sex-adjusted analyses attenuated the association between acute COVID-19 and circulating HIF-1α levels, suggesting that part of the observed hypoxia signal may reflect demographic characteristics or disease severity rather than an independent determinant of β-cell dysfunction. This finding suggests that hypoxia signalling during acute infection may reflect the broader inflammatory and clinical context of severe viral illness rather than acting as an independent driver of β-cell dysfunction, although indirect interactions with inflammatory and mitochondrial pathways cannot be excluded. In contrast, post-COVID individuals exhibited significantly lower HIF-1α levels than MetS controls after adjustment, reinforcing the transient nature of infection-related hypoxia signalling.
Taken together, our findings indicate that hypoxia signalling plays fundamentally different roles in acute infectious stress and chronic metabolic disease. While acute hypoxia during COVID-19 likely reflects a transient adaptive response, sustained low-grade hypoxia in MetS may contribute to β-cell vulnerability, particularly in combination with chronic oxidative and metabolic stress.

4.2. Oxidative Stress and Inadequate Antioxidant Responses as Drivers of β-Cell Dysfunction

Oxidative stress represents a central mechanism linking hypoxia, inflammation, and metabolic dysfunction, and our findings highlight its differential involvement across acute COVID-19, post-COVID, and chronic metabolic disease. Circulating levels of 8-epi-PGF2α, a robust marker of lipid peroxidation and systemic oxidative stress, differed across all study groups, increased from acute COVID-19 to post-COVID and was highest in COVID-negative individuals with MetS, although the difference between the post-COVID and MetS groups did not remain statistically significant after correction for multiple testing. This pattern suggests a shift from transient oxidative stress during acute infection toward sustained oxidative burden in chronic metabolic disease.
During acute COVID-19, increased oxidative stress likely reflects intense inflammatory activation, mitochondrial dysfunction, and immune-mediated reactive oxygen species (ROS) production. In this context, oxidative stress is closely intertwined with hypoxia signalling, as reduced oxygen availability and HIF-1α activation promote metabolic reprogramming and ROS generation [11,23]. Importantly, such oxidative stress appears to be largely transient and may be at least partially reversible upon resolution of the acute infectious insult.
In contrast, the persistence of elevated 8-epi-PGF2α levels in the post-COVID cohort indicates incomplete normalization of redox homeostasis following SARS-CoV-2 infection. Emerging evidence suggests that mitochondrial dysfunction, endothelial injury, and low-grade inflammation may persist for months after COVID-19, contributing to prolonged oxidative stress even in the absence of overt hypoxemia [38,39]. This sustained oxidative burden may increase metabolic vulnerability, particularly in individuals with pre-existing risk factors such as IR or obesity.
The highest oxidative stress levels were observed in COVID-negative individuals with MetS, consistent with extensive literature implicating chronic oxidative stress in the pathogenesis of IR, dyslipidemia, and β-cell dysfunction [20,22]. In MetS, excess nutrient availability, adipose tissue inflammation, and mitochondrial overload lead to continuous ROS production, creating a pro-oxidant environment that differs fundamentally from the acute, inflammation-driven oxidative stress observed during infection.
Notably, despite pronounced increases in oxidative stress markers, circulating levels of NFE2L2 did not differ significantly across disease states. As NFE2L2 (NRF2) is a master regulator of antioxidant defense, its limited systemic activation in the presence of sustained oxidative stress suggests an inadequate compensatory response, particularly in chronic metabolic disease. Impaired NFE2L2 signalling has been implicated in the progression of IR and β-cell failure, as insufficient antioxidant capacity renders β-cells highly susceptible to oxidative damage [40,41,42].
Given the central role of NFE2L2 (NRF2) in regulating cellular antioxidant defence, pharmacological activation of NRF2 signalling has been proposed as a potential therapeutic strategy in metabolic disease [40,41,42]. Our findings, showing limited systemic NFE2L2 activation despite increased oxidative stress in MetS, raise the possibility that enhancing NRF2-mediated antioxidant responses may preferentially benefit chronic metabolic conditions characterized by sustained oxidative stress rather than transient infection-associated dysglycaemia.
Interestingly, NFE2L2 levels differed across metabolic phenotypes within the post-COVID cohort, suggesting heterogeneity in antioxidant responses that may warrant further investigation.
Given their high metabolic activity and relatively low intrinsic antioxidant defenses, pancreatic β-cells are especially vulnerable to oxidative stress [2]. Sustained lipid peroxidation and ROS exposure can disrupt proinsulin processing, impair insulin granule maturation, and promote β-cell dedifferentiation. The unfavourable β-cell processing and secretory efficiency ratios observed in individuals with MetS in the present study are consistent with this mechanism and suggest that chronic oxidative stress may represent an important contributor to β-cell dysfunction in metabolic disease, rather than in acute or post-infectious states.
Notably, differences in circulating 8-epi-PGF2α remained statistically significant after adjustment for age and sex, supporting the interpretation that sustained oxidative stress represents a robust and context-independent feature of metabolic vulnerability. This contrasts with hypoxia signalling, which appeared more sensitive to demographic adjustment, further emphasizing the central role of chronic oxidative stress in β-cell dysfunction.
Collectively, these findings suggest that oxidative stress represents a convergent pathway linking hypoxia, inflammation, and metabolic overload, with its pathogenic impact largely determined by duration and context. Because the present study is observational, causal relationships cannot be established; however, the observed pattern is consistent with oxidative stress contributing to the link between chronic metabolic stress and β-cell dysfunction rather than merely reflecting disease severity. In contrast to the transient oxidative stress observed during acute infection, sustained oxidative stress in MetS may exert deleterious effects on β-cell integrity and function.

4.3. β-Cell Processing Dysfunction as a Convergent Endpoint of Hypoxia and Oxidative Stress

β-cell dysfunction represents a critical convergence point for hypoxia- and oxidative stress-related pathways, and our findings suggest that disturbances in β-cell processing and secretory efficiency emerge predominantly in the context of chronic metabolic stress rather than acute or post-infectious states. By examining multiple complementary markers—including C-peptide, proinsulin, glucagon, and derived β-cell efficiency ratios—we captured distinct aspects of β-cell functional integrity across disease states.
In COVID-negative individuals with MetS, β-cell dysfunction was characterized by reduced C-peptide levels, elevated glucagon concentrations, and unfavorable β-cell processing and secretory efficiency ratios, including increased proinsulin/C-peptide and reduced C-peptide/glucose ratios. These alterations are well-recognized indicators of impaired proinsulin processing, defective insulin granule maturation, and diminished β-cell secretory capacity, all of which reflect chronic β-cell stress and loss of functional reserve [33,34,43,44]. This pattern supports the concept that β-cell dysfunction in MetS reflects cumulative cellular injury rather than acute stress responses. In contrast, β-cell secretory indices appeared relatively preserved during acute COVID-19 and in the post-COVID state, despite marked alterations in hypoxia and oxidative stress markers.
The proinsulin/C-peptide ratio is considered a sensitive marker of β-cell endoplasmic reticulum (ER) stress and defective prohormone processing [38,39]. Elevated ratios indicate impaired conversion of proinsulin to mature insulin, a process that is particularly vulnerable to oxidative stress and mitochondrial dysfunction. Sustained exposure to ROS disrupts ER homeostasis, impairs prohormone convertase activity, and promotes accumulation of incompletely processed proinsulin [4]. The pronounced elevation of this ratio in MetS, but not in acute or post-COVID states, underscores the importance of chronic rather than transient stress in driving β-cell processing failure.
Importantly, adjusted analyses further demonstrated significantly lower proinsulin/C-peptide ratios in the post-COVID group compared with MetS controls, whereas no significant difference was observed between acute COVID-19 and MetS after adjustment. Moreover, the ratio was significantly higher during acute infection than in the post-COVID phase. These findings suggest a phase-dependent modulation of β-cell processing stress, with transient alterations during acute infection but persistent impairment confined primarily to chronic MetS.
Similarly, the reduced C-peptide/glucose ratio observed in MetS reflects diminished insulin secretory efficiency relative to prevailing glycaemic load, consistent with β-cell exhaustion and reduced functional adaptability [4,45]. This finding aligns with experimental data demonstrating that chronic hypoxia and oxidative stress impair glucose-stimulated insulin secretion by disrupting mitochondrial ATP generation and calcium signalling in β-cells [2,13]. Together, these abnormalities suggest that sustained metabolic stress may compromise both insulin synthesis and secretion, ultimately contributing to progressive β-cell dysfunction.
Notably, age- and sex-adjusted GLM analyses confirmed that C-peptide levels remained significantly higher in both acute and post-COVID groups compared with MetS controls, with effect sizes exceeding fourfold in acute infection and sixfold in the post-COVID state. The persistence of this association after adjustment indicates that enhanced endogenous insulin secretion in COVID-19-related states is not attributable to demographic differences, but likely reflects compensatory hyperinsulinaemia in response to IR rather than intrinsic β-cell failure [46]. This pattern is consistent with compensatory hyperinsulinaemia secondary to infection-related IR rather than intrinsic β-cell failure, a phenomenon previously described in acute systemic inflammatory states [37,43].
The concomitant elevation of glucagon levels in MetS further supports the presence of islet dysfunction extending beyond β-cells. Dysregulated α-cell activity and hyperglucagonaemia are increasingly recognized as key contributors to hyperglycaemia and metabolic deterioration in T2DM [47]. Oxidative stress and intra-islet signalling disturbances may impair paracrine insulin-mediated suppression of glucagon secretion, thereby exacerbating metabolic dysregulation and increasing β-cell workload [48].
Notably, the relative preservation of β-cell functional indices in acute and post-COVID cohorts suggests that short-term hypoxia and oxidative stress alone are insufficient to induce overt β-cell processing failure. Instead, the transition from adaptive to maladaptive β-cell responses appears to depend on the duration and persistence of metabolic stress. This distinction may help explain why diabetes risk after COVID-19 is heterogeneous and strongly modulated by pre-existing metabolic vulnerability rather than by infection-related hypoxia per se.
Pharmacological activation of NRF2 pathways may represent a potential strategy to enhance antioxidant defense and preserve β-cell function, particularly in chronic metabolic conditions such as MetS.
These findings align with the prevailing view that chronic metabolic stress constitutes the primary driver of β-cell dysfunction. The absence of persistent β-cell processing impairment in acute and post-COVID cohorts, despite marked hypoxia signalling, reinforces the concept that infection-related hypoxia alone is insufficient to induce durable β-cell failure in the absence of sustained metabolic overload.
Collectively, our findings indicate that transient infectious stress is associated with compensatory β-cell activation, whereas chronic metabolic stress is linked to impaired β-cell processing and secretory efficiency. These results support a model in which hypoxia and oxidative stress act as upstream stressors whose impact on glucose homeostasis is ultimately mediated through β-cell dysfunction. In chronic MetS, sustained oxidative and metabolic stress, accompanied by low-grade hypoxia, progressively overwhelms β-cell adaptive capacity, leading to impaired hormone processing and dysregulated islet hormone secretion. In contrast, acute infection appears to elicit largely reversible β-cell responses, underscoring the central role of chronicity in determining the transition from adaptive compensation to maladaptive β-cell dysfunction.

4.4. Metabolic Phenotype–Specific Differences and Heterogeneity of Stress Responses

Beyond overall group-wise differences, our analyses revealed substantial heterogeneity in hypoxia-, oxidative stress–, and β-cell-related markers across metabolic phenotypes, underscoring the importance of metabolic context in shaping cellular stress responses. In the post-COVID cohort, circulating HIF-1α levels differed across metabolic subgroups, with lower concentrations observed in individuals with IR compared with those with diabetes or prediabetes. This pattern may reflect relatively preserved β-cell secretory capacity and compensatory hyperinsulinaemia in insulin-resistant states, in contrast to more advanced β-cell dysfunction in diabetes-related phenotypes [34,43].
In contrast, no significant subgroup differences in HIF-1α were detected within the COVID-negative cohort with MetS, which may reflect a more homogeneous exposure to chronic low-grade hypoxia across metabolic phenotypes in long-standing metabolic disease. Chronic adipose tissue hypoxia, impaired microvascular perfusion, and sustained metabolic oxygen demand in MetS may override phenotype-specific differences, leading to persistently elevated but relatively uniform hypoxia signalling [7,8].
For oxidative stress, subgroup differences were less pronounced, particularly after correction for multiple testing, consistent with oxidative stress representing a common downstream consequence of metabolic overload rather than a phenotype-specific process. This observation aligns with prior reports indicating that lipid peroxidation and ROS generation are broadly elevated across insulin-resistant and diabetic states, largely independent of glycaemic classification or diabetes subtype [20,22].
Importantly, β-cell functional impairment was most evident in chronic MetS, where unfavourable β-cell processing and secretory efficiency ratios were consistently observed across diabetic phenotypes. These findings support the concept that β-cell vulnerability is determined not solely by glycaemic status but by the cumulative burden of metabolic stress, oxidative injury, and impaired cellular adaptation over time [4,37]. Collectively, these results emphasize that metabolic phenotype modifies the biological impact of hypoxia and oxidative stress, contributing to heterogeneous β-cell responses across disease states.
Although sex distribution differed across study groups, age- and sex-adjusted GLM analyses did not demonstrate consistent sex-dependent effects on primary stress-related biomarkers or β-cell functional indices. These findings suggest that the observed differences are predominantly attributable to disease state rather than sex-specific biological variation, although larger studies would be required to fully explore potential sex-modulated responses.

4.5. Implications for Post-COVID Diabetes Risk

Exploratory correlation analyses provided additional support for a context-dependent relationship between hypoxia-related signalling and β-cell processing stress. Notably, an inverse association between circulating HIF-1α levels and the proinsulin/C-peptide ratio was observed exclusively in individuals with MetS, whereas no robust correlations were detected in the acute or post-COVID cohorts after correction for multiple testing. These findings suggest that hypoxia-related signalling may influence β-cell processing primarily in the setting of chronic metabolic stress rather than during transient infectious insults.
The present findings have important implications for understanding diabetes risk following SARS-CoV-2 infection. Although hypoxia- and oxidative stress-related pathways were markedly altered during acute and post-COVID states, these alterations were not paralleled by consistent differences in β-cell functional indices indicative of diabetes status. This observation indicates that activation of these pathways alone may be insufficient to drive diabetes onset after COVID-19, and instead reflects a broader stress response shaped by the underlying metabolic milieu.
Our data support the concept that post-COVID diabetes risk is strongly modulated by pre-existing metabolic vulnerability rather than by infection-related hypoxia per se. Individuals with features of MetS exhibited the most pronounced β-cell processing abnormalities, indicating that chronic metabolic stress primes β-cells for dysfunction and may lower the threshold for metabolic decompensation when exposed to additional insults such as infection, inflammation, or oxidative stress [34,43]. In this context, COVID-19 may act as a precipitating or unmasking factor rather than a primary causal driver of diabetes.
The relative preservation of β-cell secretory indices in the post-COVID cohort further suggests that β-cell dysfunction following SARS-CoV-2 infection is not universal and may be reversible in the absence of sustained metabolic stress. This heterogeneity aligns with epidemiological evidence indicating that excess diabetes risk after COVID-19 is concentrated among individuals with obesity, IR, or prediabetes, whereas metabolically healthy individuals appear to be less susceptible [18,19].
Taken together, these findings indicate that post-COVID diabetes risk should be interpreted within the broader context of metabolic vulnerability, with particular attention to β-cell susceptibility in individuals with established metabolic risk factors such as obesity, IR, or prediabetes. Interventions aimed at improving insulin sensitivity, reducing oxidative stress, and preserving β-cell function may therefore be more effective in mitigating post-COVID metabolic complications than strategies targeting hypoxia-related pathways alone.

5. Strengths and Limitations

The present study has several notable strengths. First, it integrates circulating markers of hypoxia, oxidative stress, and antioxidant response with detailed indices of β-cell function, enabling a multidimensional assessment of stress-related pathways across acute COVID-19, post-COVID, and chronic metabolic disease states. Second, the inclusion of both post-infectious and COVID-negative MetS cohorts allowed direct comparison between transient infectious stress and long-standing metabolic stress, strengthening the biological interpretation of observed differences. Third, the use of complementary β-cell markers—including proinsulin/C-peptide and C-peptide/glucose ratios—provided sensitive insight into β-cell processing and secretory efficiency beyond conventional glycaemic measures.
Several limitations should also be acknowledged. The cross-sectional design precludes causal inference and limits conclusions regarding temporal relationships between hypoxia, oxidative stress, and β-cell dysfunction. Sample sizes within metabolic subgroups were modest, which may have reduced statistical power to detect subtle phenotype-specific differences, necessitating cautious interpretation of subgroup analyses. In addition, circulating biomarkers were used as systemic proxies for tissue-specific processes and may not fully reflect local hypoxic or oxidative stress responses within pancreatic islets or adipose tissue. Finally, residual confounding by unmeasured factors—such as medication exposure, duration of metabolic disease, or lifestyle variables—cannot be excluded.
The study population included a higher proportion of women, which may partly reflect referral patterns in metabolic clinics. Although age- and sex-adjusted analyses were performed, residual sex-related differences in metabolic and inflammatory responses cannot be completely excluded. Despite these limitations, the internal consistency of findings across multiple complementary biomarkers supports the robustness of the observed patterns and reinforces the interpretation that chronic metabolic stress appears to be more closely associated with β-cell dysfunction than transient infection-related hypoxia.


6. Conclusions

In summary, hypoxia- and oxidative stress-related pathways show distinct patterns across acute COVID-19, post-COVID states, and chronic MetS, with distinct implications for β-cell function. Acute SARS-CoV-2 infection is characterized by marked activation of hypoxia-related signalling with comparatively lower oxidative stress and without overt impairment of β-cell processing. In contrast, chronic MetS is associated with sustained oxidative stress, insufficient antioxidant responses, and impaired β-cell processing and secretory efficiency. These findings suggest that infection-related hypoxia represents a largely transient stress response, whereas chronic oxidative and metabolic stress plays a more prominent role in the development of β-cell dysfunction.

Supplementary Materials

The following supporting information can be downloaded at: https://www.mdpi.com/article/10.3390/diabetology7040071/s1, Table S1. Post hoc Dunn–Bonferroni pairwise comparisons of circulating HIF-1α levels across study groups; Table S2. Post-hoc Dunn–Bonferroni pairwise comparisons of circulating HIF-1α levels stratified by study group and diabetes status; Table S3. Within-group comparisons of circulating HIF-1α concentrations between diabetic and non-diabetic participants; Table S4. Circulating HIF-1α levels across metabolic subgroups in the post-COVID (Group 2) and COVID-negative MetS (Group 3) cohorts; Table S5. Post hoc pairwise comparisons of circulating HIF-1α levels across metabolic subgroups in the post-COVID cohort (Group 2); Table S6. Comparisons of circulating HIF-1α levels between post-COVID (Group 2) and COVID-negative metabolic syndrome (Group 3) participants within matched metabolic phenotypes; Table S7. Post hoc Dunn–Bonferroni pairwise comparisons of circulating 8-epi-PGF2α levels across study groups; Table S8. Post hoc Dunn–Bonferroni pairwise comparisons of circulating 8-epi-PGF2α levels across study groups stratified by diabetes status; Table S9. Post hoc Dunn–Bonferroni pairwise comparisons of circulating 8-epi-PGF2α levels across study groups stratified by diabetes status; Table S10. Post hoc pairwise comparisons of circulating 8-epi-PGF2α levels across metabolic subgroups within the post-COVID (Group 2) and COVID-negative metabolic syndrome (Group 3) cohorts; Table S11. Comparisons of circulating 8-epi-PGF2α levels between post-COVID (Group 2) and COVID-negative metabolic syndrome (Group 3) participants within matched metabolic phenotypes; Table S12. Within-group comparisons of circulating NFE2L2 concentrations between diabetic and non-diabetic participants; Table S13. Post hoc pairwise comparisons of circulating NFE2L2 levels across metabolic subgroups within the post-COVID cohort (Group 2); Table S14. Comparisons of circulating NFE2L2 levels between post-COVID (Group 2) and COVID-negative metabolic syndrome (Group 3) participants within matched metabolic phenotypes; Table S15. Within-group Spearman correlations between hypoxia-, oxidative stress-, and β-cell-related markers.

Author Contributions

Conceptualization, V.T. and K.T.; methodology, V.T., M.T., K.T., M.A. and I.G.; software, V.T., M.T. and K.T.; validation, M.A. and I.G.; formal analysis, V.T., M.T., M.A. and I.G.; investigation, V.T., M.T. and K.T.; writing—original draft preparation, V.T.; writing—review and editing, V.T. and K.T.; supervision, K.T. All authors have read and agreed to the published version of the manuscript.

Funding

The study was conducted with a grant from the Medical University–Pleven—Project No. D6/2023—“Changes in pancreatic beta cell function in COVID-19”.

Institutional Review Board Statement

The study was conducted in accordance with the Declaration of Helsinki, and approved by the Ethics Committee of Medical University Pleven (Protocol No72, 23 June 2023) for studies involving humans.

Informed Consent Statement

Informed consent was obtained from all subjects involved in the study.

Data Availability Statement

The original contributions presented in this study are included in the article/supplementary material. Further inquiries can be directed to the corresponding author.

Acknowledgments

We wish to thank Mircho Vukov for the statistical analysis. The authors acknowledge Medical University—Pleven, Bulgaria, for financial support.

Conflicts of Interest

The authors declare that there is no conflict of interest.

Abbreviations

DMDiabetes mellitus
DM+/DM−Participants with diabetes mellitus/participants without diabetes mellitus
ECLIAElectrochemiluminescence immunoassay
ELISAEnzyme-linked immunosorbent assay
FDRFalse discovery rate
HbA1cGlycated haemoglobin
HIF-1αHypoxia-inducible factor 1 alpha
IFGImpaired fasting glucose
IGTImpaired glucose tolerance
IRInsulin resistance
IQRInterquartile range
LADALatent autoimmune diabetes in adults
MetSMetabolic syndrome
NFE2L2Nuclear factor erythroid 2-related factor 2
OGTTOral glucose tolerance test
PCRPolymerase chain reaction
ROSReactive oxygen species
T1DMType 1 diabetes mellitus
T2DMType 2 diabetes mellitus
8-epi-PGF2α8-epi-prostaglandin F2α

References

  1. Lenzen, S. Oxidative stress: The vulnerable β-cell. Diabetologia 2008, 51, 1723–1736. [Google Scholar] [CrossRef]
  2. Robertson, R.P. Chronic oxidative stress as a central mechanism for glucose toxicity in pancreatic islet β-cells. Diabetes 2004, 53, S119–S124. [Google Scholar] [CrossRef]
  3. Jonas, J.C.; Laybutt, D.R.; Steil, G.M.; Trivedi, N.; Pertusa, J.G.; Van de Casteele, M.; Weir, G.C.; Henquin, J.C. Chronic hyperglycaemia triggers loss of pancreatic β-cell differentiation. J. Biol. Chem. 2001, 276, 21301–21306. [Google Scholar]
  4. Back, S.H.; Kaufman, R.J. Endoplasmic reticulum stress and type 2 diabetes. Annu. Rev. Biochem. 2012, 81, 767–793. [Google Scholar] [CrossRef] [PubMed]
  5. Maechler, P.; Wollheim, C.B. Mitochondrial function in normal and diabetic β-cells. Nature 2001, 414, 807–812. [Google Scholar] [CrossRef] [PubMed]
  6. Gonzalez, F.J.; Xie, C.; Jiang, C. The role of hypoxia-inducible factors in metabolic diseases. Nat. Rev. Endocrinol. 2018, 15, 21–32. [Google Scholar] [CrossRef] [PubMed]
  7. Trayhurn, P. Hypoxia and adipose tissue function and dysfunction in obesity. Physiol. Rev. 2013, 93, 1–21. [Google Scholar] [CrossRef]
  8. Ye, J. Emerging role of adipose tissue hypoxia in obesity and insulin resistance. Int. J. Obes. 2009, 33, 54–66. [Google Scholar] [CrossRef]
  9. Wang, R.; Sun, Q.; Wu, X.; Liu, H.; Li, Y.; Xu, H.; Zhang, Y.; Zhao, Y.; Zhou, X.; Liu, J.; et al. Hypoxia as a double-edged sword to combat obesity and comorbidities. Cells 2022, 11, 3735. [Google Scholar] [CrossRef]
  10. Norouzirad, R.; González-Muniesa, P.; Ghasemi, A. Hypoxia in obesity and diabetes: Potential therapeutic effects of hyperoxia and nitrate. Oxid. Med. Cell Longev. 2017, 2017, 5350267. [Google Scholar] [CrossRef]
  11. Semenza, G.L. Hypoxia-inducible factors in physiology and medicine. Cell 2012, 148, 399–408. [Google Scholar] [CrossRef]
  12. Kotagiri, P.; Mescia, F.; Hanson, A.L.; Graf, B.A.; Hubbard, J.J.; Spreafico, R.; Saeed, M.; Hill, D.L.; Shields, A.M.; Bashford-Rogers, R.J.M.; et al. The impact of hypoxia on B cells in COVID-19. EBioMedicine 2022, 77, 103878. [Google Scholar] [CrossRef] [PubMed]
  13. da Silva, F.P.G.; Matte, R.; Wiedmer, D.B.; Spiller, F.; Fernandes, H.S.; de Oliveira, R.; Zeni, R.C.; Fernandes, D.; Moreira, J.C.; Ritter, C. HIF-1α pathway in COVID-19, a scoping review of its modulation and related treatments. Int. J. Mol. Sci. 2025, 26, 4202. [Google Scholar] [CrossRef] [PubMed]
  14. Serebrovska, Z.O.; Chong, E.Y.; Serebrovska, T.V.; Tumanovska, L.V.; Xi, L. Hypoxia, HIF-1α, and COVID-19: From pathogenic factors to potential therapeutic targets. Acta Pharmacol. Sin. 2020, 41, 1539–1546. [Google Scholar] [CrossRef] [PubMed]
  15. Bonaventura, A.; Vecchié, A.; Dagna, L.; Martinod, K.; Dixon, D.L.; Van Tassell, B.W.; Dentali, F.; Montecucco, F.; Massberg, S.; Levi, M.; et al. Endothelial dysfunction and immunothrombosis as key pathogenic mechanisms in COVID-19. Nat. Rev. Immunol. 2021, 21, 319–329. [Google Scholar] [CrossRef]
  16. Nalbandian, A.; Sehgal, K.; Gupta, A.; Madhavan, M.V.; McGroder, C.; Stevens, J.S.; Cook, J.R.; Nordvig, A.S.; Shalev, D.; Sehrawat, T.S.; et al. Post-acute COVID-19 syndrome. Nat. Med. 2021, 27, 601–615. [Google Scholar] [CrossRef]
  17. Soriano, J.B.; Murthy, S.; Marshall, J.C.; Relan, P.; Diaz, J.V. A clinical case definition of post-COVID-19 condition. Lancet Infect. Dis. 2022, 22, e102–e107. [Google Scholar] [CrossRef]
  18. Xie, Y.; Al-Aly, Z. Risks and burdens of incident diabetes in long COVID. Lancet Diabetes Endocrinol. 2022, 10, 311–321. [Google Scholar] [CrossRef]
  19. Barrett, C.E.; Koyama, A.K.; Alvarez, P.; Chow, W.; Lundeen, E.A.; Perrine, C.G.; Pavkov, M.E.; Rolka, D.B.; Wiltz, J.L.; Bull-Otterson, L.; et al. Risk for newly diagnosed diabetes after COVID-19. Morb. Mortal. Wkly. Rep. 2022, 71, 59–65. [Google Scholar] [CrossRef]
  20. Roberts, C.K.; Sindhu, K.K. Oxidative stress and metabolic syndrome. Life Sci. 2009, 84, 705–712. [Google Scholar] [CrossRef]
  21. Hurrle, S.; Hsu, W.H. The etiology of oxidative stress in insulin resistance. Biomed. J. 2017, 40, 257–262. [Google Scholar] [CrossRef]
  22. Masenga, S.K.; Kabwe, L.S.; Chakulya, M.; Kirabo, A. Mechanisms of oxidative stress in metabolic syndrome. Int. J. Mol. Sci. 2023, 24, 7898. [Google Scholar] [CrossRef] [PubMed]
  23. Eijk, L.E.V.-V.; Bulthuis, M.L.; van der Gun, B.T.; Wold, K.I.; Veloo, A.C.; González, M.F.V.; de Borst, M.H.; Dunnen, W.F.D.; Hillebrands, J.-L.; van Goor, H.; et al. Systemic oxidative stress associates with the development of post-COVID-19 syndrome in non-hospitalized individuals. Redox Biol. 2024, 76, 103310. [Google Scholar] [CrossRef] [PubMed]
  24. Codo, A.C.; Davanzo, G.G.; Monteiro, L.B.; Souza, G.F.; Muraro, S.P.; Virgilio-da-Silva, J.V.; Prodonoff, J.S.; Carregari, V.C.; de Biagi, C.A.O., Jr.; Crunfli, F.; et al. Elevated glucose levels favor SARS-CoV-2 infection and monocyte response through a HIF-1α/glycolysis-dependent axis. Cell Metab. 2020, 32, 437–446. [Google Scholar] [CrossRef] [PubMed]
  25. Santos, A.A.C.; Silva, M.D.S.; Gomes, G.F.; Santos, J.V.; Oliveira, R.C.; Pereira, L.F.S.; Souza, D.R.; Costa, M.R.; Almeida, J.R.; Rodrigues, T.S.; et al. Molecular and cellular mechanisms involved in tissue metabolic disturbances in SARS-CoV-2 infection. Front. Microbiol. 2022, 13, 1037467. [Google Scholar] [CrossRef]
  26. Makhoul, E.; Akl, E.G.; Abou Hassan, O.K.; Haddad, F.G.; Eid, A.H.; Kobeissy, F.H.; Mondello, S.; DePalma, R.G.; Zaraket, H.; Zibara, K.; et al. COVID-19 versus metabolic syndrome: Overlapping pathogenic pathways and mechanistic insights. Front. Med. 2022, 9, 873297. [Google Scholar]
  27. Delgado-Roche, L.; Mesta, F. Oxidative stress as key player in severe acute respiratory syndrome coronavirus infection. Arch. Med. Res. 2020, 51, 384–387. [Google Scholar] [CrossRef]
  28. Alberti, K.G.M.M.; Eckel, R.H.; Grundy, S.M.; Zimmet, P.Z.; Cleeman, J.I.; Donato, K.A.; Fruchart, J.C.; James, W.P.T.; Loria, C.M.; Smith, S.C., Jr.; et al. Harmonizing the metabolic syndrome. Circulation 2009, 120, 1640–1645. [Google Scholar] [CrossRef]
  29. National Health Commission of the People’s Republic of China. Diagnosis and treatment protocol for novel coronavirus pneumonia (trial version 7). Chin. Med. J. 2020, 133, 1087–1095. [Google Scholar] [CrossRef]
  30. World Health Organization. Definition and Diagnosis of Diabetes Mellitus and Intermediate Hyperglycaemia; WHO: Geneva, Switzerland, 2006. [Google Scholar]
  31. World Health Organization. Use of Glycated Haemoglobin (HbA1c) in the Diagnosis of Diabetes Mellitus; WHO: Geneva, Switzerland, 2011. [Google Scholar]
  32. Buzzetti, R.; Zampetti, S.; Maddaloni, E. Adult-onset autoimmune diabetes: Current knowledge and implications for management. Nat. Rev. Endocrinol. 2017, 13, 674–686. [Google Scholar] [CrossRef]
  33. Røder, M.E.; Porte, D., Jr.; Schwartz, R.S.; Kahn, S.E. Disproportionately elevated proinsulin levels reflect impaired β-cell secretory capacity. J. Clin. Endocrinol. Metab. 1998, 83, 604–608. [Google Scholar]
  34. Kahn, S.E.; Prigeon, R.L.; McCulloch, D.K.; Boyko, E.J.; Bergman, R.N.; Schwartz, M.W.; Neifing, J.L.; Ward, W.K.; Beard, J.C.; Palmer, J.P. Quantification of the relationship between insulin sensitivity and β-cell function. Diabetes 1993, 42, 1663–1672. [Google Scholar] [CrossRef] [PubMed]
  35. Mari, A.; Schmitz, O.; Gastaldelli, A.; Oestergaard, T.; Nyholm, B.; Ferrannini, E. Meal and oral glucose tests for the assessment of β-cell function. Am. J. Physiol. Endocrinol. Metab. 2002, 283, E1159–E1166. [Google Scholar] [CrossRef] [PubMed]
  36. Wiederkehr, A.; Wollheim, C.B. Impact of mitochondrial calcium on the coupling of metabolism to insulin secretion. Cell Calcium 2008, 44, 64–76. [Google Scholar] [CrossRef] [PubMed]
  37. Cantley, J.; Ashcroft, F.M. Q&A: Insulin secretion and type 2 diabetes. Nature 2015, 526, 460–461. [Google Scholar]
  38. Wu, K.E.; Fazal, F.M.; Parker, K.R.; Zou, J.; Chang, H.Y. Long-term consequences of COVID-19. Annu. Rev. Biomed. Data Sci. 2022, 5, 89–113. [Google Scholar]
  39. Lopez-Leon, S.; Wegman-Ostrosky, T.; Perelman, C.; Sepulveda, R.; Rebolledo, P.A.; Cuapio, A.; Villapol, S. More than 50 long-term effects of COVID-19. Sci. Rep. 2021, 11, 16144. [Google Scholar] [CrossRef]
  40. Uruno, A.; Motohashi, H. The Keap1–Nrf2 system as an in vivo sensor for electrophiles. Free Radic. Biol. Med. 2011, 50, 156–164. [Google Scholar] [CrossRef]
  41. Chartoumpekis, D.V.; Kensler, T.W. The Keap1/Nrf2 pathway in metabolic disease. Mol. Metab. 2013, 2, 321–328. [Google Scholar]
  42. Yagishita, Y.; Uruno, A.; Chartoumpekis, D.V.; Kensler, T.W.; Yamamoto, M. Nrf2 represses the onset of type 1 diabetes in non-obese diabetic mice. Mol. Cell Biol. 2014, 34, 4003–4015. [Google Scholar] [CrossRef]
  43. Ferrannini, E.; Mari, A. β-cell function in type 2 diabetes. Metabolism 2014, 63, 1217–1227. [Google Scholar] [CrossRef]
  44. Mykkänen, L.; Haffner, S.M.; Hales, C.N.; Rönnemaa, T.; Laakso, M. Proinsulin-to-insulin ratio and insulin sensitivity. Diabetes 1997, 46, 1990–1995. [Google Scholar] [CrossRef]
  45. Palmer, J.P.; Fleming, G.A.; Greenbaum, C.J.; Herold, K.C.; Jansa, L.D.; Kolb, H.; Lachin, J.M.; Polonsky, K.S.; Pozzilli, P.; Skyler, J.S.; et al. C-peptide as an outcome measure for type 1 diabetes trials. Diabetes 2004, 53, 250–264. [Google Scholar] [CrossRef]
  46. Wahren, J.; Ekberg, K.; Johansson, J.; Henriksson, M.; Pramanik, A.; Johansson, B.L.; Rigler, R.; Jörnvall, H. Role of C-peptide in human physiology. Am. J. Physiol. Endocrinol. Metab. 2000, 278, E759–E768. [Google Scholar] [CrossRef]
  47. Unger, R.H.; Cherrington, A.D. Glucagonocentric restructuring of diabetes. J. Clin. Investig. 2012, 122, 4–12. [Google Scholar] [CrossRef]
  48. Quesada, I.; Tudurí, E.; Ripoll, C.; Nadal, A. Physiology of the pancreatic α-cell and glucagon secretion. J. Endocrinol. 2008, 199, 5–19. [Google Scholar] [CrossRef]
Figure 1. Study population and metabolic classification across the three study groups. Participants were stratified according to SARS-CoV-2 infection status and further classified into metabolic subgroups including diabetes, prediabetes, and IR with normoglycaemia.
Diabetology 07 00071 g001
Figure 2. Distribution of circulating HIF-1α levels across metabolic subgroups in the post-COVID (Group 2) and COVID-negative MetS (Group 3) cohorts. Box-and-whisker plots show the median, interquartile range, and range. Individual data points are shown. For visual clarity, extreme values in the Group 2 T1DM and Group 3 T2DM subgroups were excluded using the 1.5 × IQR criterion; all statistical analyses were performed on the complete datasets as described in the Methods.
Diabetology 07 00071 g002
Figure 3. Conceptual model integrating hypoxia- and oxidative stress-related pathways with β-cell dysfunction across COVID-19 and metabolic states.
Diabetology 07 00071 g003
Table 1. Circulating HIF-1α levels across study groups.
VariableGroup 1
(Active COVID-19)
Group 2
(Post-COVID)
Group 3
(COVID-Negative MetS)
p Value †
HIF-1α (pg/mL)n = 28n = 35n = 31H = 32.97,
p < 0.001
Mean ± SD1321.51 ± 1224.92358.76 ± 478.73558.87 ± 458.98
Median (IQR)1035.67 (796.09)212.22 (220.37)373.96 (558.87)
p values were calculated using the Kruskal–Wallis test across the three study groups.
Table 2. Circulating HIF-1α levels stratified by diabetes status across study groups.
VariableGroup 1
(Active COVID-19)
Group 2
(Post-COVID)
Group 3
(COVID-Negative MetS)
p Value †
HIF-1α (pg/mL)DM−DM+DM−DM+DM−DM+
n = 12n = 16n = 16n = 19n = 20n = 11H = 37.87
p < 0.001
Mean ± SD1214.50 ± 1518.221401.76 ± 997.21312.77 ± 288.45397.48 ± 600.08428.56 ± 255.97795.92 ±
641.71
Median (IQR)873.81 (1067.41)1112.42 (702.72)204.50 (264.22)221.53 (152.05)318.79 (196.24)575.69
(547.95)
p values were calculated using the Kruskal–Wallis test across the six subgroups.
Table 3. Circulating 8-epi-PGF2α levels across study groups.
VariableGroup 1
(Active COVID-19)
Group 2
(Post-COVID)
Group 3
(COVID-NegativeMetS)
p Value †
8-epi-PGF2α
(pg/mL)
n = 22n = 23n = 18H = 32.44,
p < 0.001
Mean ± SD46.74 ± 8.8162.64 ± 19.5885.81 ± 55.25
Median (IQR)44.17 (3.86)58.06 (12.92)69.96 (21.30)
p values were calculated using the Kruskal–Wallis test across the three study groups.
Table 4. Circulating 8-epi-PGF2α levels stratified by diabetes status across study groups.
VariableGroup 1
(Active COVID-19)
Group 2
(Post-COVID)
Group 3
(COVID-Negative MetS)
p Value †
8-epi-PGF2α
(pg/mL)
DM−DM+DM−DM+DM−DM+
n = 12n = 10n = 10n = 13n = 14n = 3H = 34.06,
p < 0.001
Mean ± SD46.39 ± 6.2747.15 ± 11.5266.29 ± 27.7559.83 ± 10.2991.42 ± 59.6659.64 ± 6.14
Median (IQR)44.22
(2.42)
43.73
(4.23)
57.27
(25.71)
58.46
(9.35)
74.18
(15.84)
58.59
(6.07)
p values were calculated using the Kruskal–Wallis test across the six subgroups. Post hoc pairwise comparisons were performed using Dunn–Bonferroni correction.
Table 5. Circulating 8-epi-PGF2α levels across metabolic subgroups in the post-COVID (Group 2) and COVID-negative MetS (Group 3) cohorts.
8-epi-PGF2α
GroupMetabolic SubgroupIndividuals (n)Median (IQR)Mean ± SDOverall
Comparison
Group 2
(Post-COVID)
T1DM/LADA664.06 (29.52)65.61 ± 11.05H = 3.74,
p = 0.291
T2DM756.59 (21.41)55.78 ± 8.12
Prediabetes (IFG + IGT)470.17 (91.95)83.47 ± 41.32
IR/hyperinsulinaemia655.06 (31.69)58.92 ± 12.84
Group 3
(COVID-Negative MetS)
T2DM358.59 (12.14)59.64 ± 6.14
Prediabetes (IFG + IGT)575.70 (231.32)111.86 ± 93.77H = 5.26,
p = 0.072
IR/hyperinsulinaemia972.67 (48.96)79.43 ± 18.74
Abbreviations: IFG, impaired fasting glucose; IGT, impaired glucose tolerance; IR, insulin resistance; MetS, metabolic syndrome; T1DM, type 1 diabetes mellitus; LADA, latent autoimmune diabetes in adults; T2DM, type 2 diabetes mellitus. Statistical analysis: Group comparisons were performed using the Kruskal–Wallis test. Data are presented as median (interquartile range) and mean ± standard deviation.
Table 6. Circulating NFE2L2 levels across study groups.
VariableGroup 1
(Active COVID-19)
Group 2
(Post-COVID)
Group 3
(COVID-Negative MetS)
p Value †
NFE2L2 (pg/mL)n = 28n = 34n = 31H = 3.42,
p = 0.181
Mean ± SD229.23 ± 69.04244.86 ± 330.49220.53 ± 104.53
Median (IQR)226.90 (77.05)171.79 (100.42)214.31 (153.11)
p value from the Kruskal–Wallis test across Groups 1–3.
Table 7. Circulating NFE2L2 levels stratified by diabetes status across study groups.
VariableGroup 1
(Active COVID-19)
Group 2
(Post-COVID)
Group 3
(COVID-Negative MetS)
p Value †
NFE2L2 (pg/mL)DM−DM+DM−DM+DM−DM+
n = 12n = 16n = 15n = 14n = 20n = 11H = 5.76,
p = 0.330
Mean ± SD228.68 ± 72.36 229.64 ± 68.85184.36 ± 93.50292.63 ± 433.57200.05 ± 100.15257.26 ± 106.55
Median (IQR)220.61
(92.71)
230.03
(65.86)
157.23 (104.31)182.51
(89.39)
188.77 (92.23)239.40
(207.90)
p values were calculated using the Kruskal–Wallis test across the six subgroups.
Table 8. Circulating NFE2L2 levels across metabolic subgroups in the post-COVID (Group 2) and COVID-negative MetS (Group 3) cohorts.
NFE2L2
GroupMetabolic SubgroupIndividuals (n)Median (IQR)Mean ± SDOverall
Comparison
Group 2
(Post-COVID)
T1DM/LADA8243.94 (1958.76)469.29 ± 647.51H = 10.85,
p = 0.013
T2DM11163.23 (131.83)176.29 ± 43.85
Prediabetes (IFG + IGT)6128.80 (126.98)124.71 ± 44.19
IR/hyperinsulinaemia9220.62 (282.03)231.41 ± 92.74
Group 3
(COVID-Negative MetS)
T2DM11239.40 (258.61)246.73 ± 91.45
Prediabetes (IFG + IGT)6163.23 (179.54)168.42 ± 64.28H = 1.64,
p = 0.440
IR/hyperinsulinaemia14214.31 (362.51)219.84 ± 102.77
Abbreviations: IFG, impaired fasting glucose; IGT, impaired glucose tolerance; IR, insulin resistance; MetS, metabolic syndrome; T1DM, type 1 diabetes mellitus; LADA, latent autoimmune diabetes in adults; T2DM, type 2 diabetes mellitus. Statistical analysis: Group comparisons were performed using the Kruskal–Wallis test. Data are presented as median (interquartile range) and mean ± standard deviation.
Table 9. β-cell functional markers across study groups.
VariableGroup 1
(Active COVID-19)
Group 2
(Post-COVID)
Group 3
(COVID-Negative MetS)
p Value †
C-peptide (ng/mL)n = 31n = 32n = 25H = 19.65,
p < 0.001
Mean ± SD1.21 ± 1.211.54 ± 1.290.41 ± 0.61
Median (IQR)0.70 (1.30)1.32 (1.78)0.24 (0.37)
Post hoc
Dunn–Bonferroni
GR1 vs. GR2: NSGR1 vs. GR3:
p = 0.004
GR2 vs. GR3:
p < 0.001
Proinsulin (pmol/L)n = 25n = 35n = 21H = 3.83,
p = 0.147
Mean ± SD5.94 ± 3.624.28 ± 4.245.75 ± 5.55
Median (IQR)5.32 (6.47)3.16 (2.33)3.61 (5.36)
Glucagon (pg/mL)n = 25n = 34n = 21H = 21.91,
p < 0.001
Mean ± SD6456.68 ± 2391.165403.88 ± 1999.438152.59 ± 1492.96
Median (IQR)5782.69 (3066.92)4893.64 (2234.37)7847.44 (2530.04)
Post hoc
Dunn–Bonferroni
GR1 vs. GR2: NSGR1 vs. GR3:
p = 0.013
GR2 vs. GR3:
p < 0.001
† Overall p values were calculated using the Kruskal–Wallis test across Groups 1–3.
Table 10. β-cell processing and secretory efficiency ratios across study groups.
VariableGroup 1
(Active COVID-19)
Group 2
(Post-COVID)
Group 3
(COVID-NegativeMetS)
p Value †
Proinsulin/C-peptide ration = 25n = 31n = 19H = 18.57,
p < 0.001
Mean ± SD5.56 ± 6.053.28 ± 5.2910.05 ± 8.93
Median (IQR)2.61 (8.51)1.05 (2.76)7.35 (14.30)
Post hoc
Dunn–Bonferroni
GR1 vs. GR2:
p = 0.020
GR1 vs. GR3: NSGR2 vs. GR3:
p < 0.001
C-peptide/glucose
ratio
n = 28n = 30n = 25H = 14.68,
p < 0.001
Mean ± SD0.89 ± 0.811.35 ± 1.260.45 ± 0.69
Median (IQR)0.56 (1.00)1.03 (1.19)0.24 (0.29)
Post hoc
Dunn–Bonferroni
GR1 vs. GR2: NSGR1 vs. GR3:
p = 0.048
GR2 vs. GR3:
p < 0.001
† Overall p values were calculated using the Kruskal–Wallis test across Groups 1–3.
Disclaimer/Publisher’s Note: The statements, opinions and data contained in all publications are solely those of the individual author(s) and contributor(s) and not of MDPI and/or the editor(s). MDPI and/or the editor(s) disclaim responsibility for any injury to people or property resulting from any ideas, methods, instructions or products referred to in the content.