1. Introduction
Diabetes mellitus (DM) is a widespread metabolic disease that affects hundreds of millions of adults worldwide, with type 2 DM (T2DM) accounting for the majority of cases [
1]. Beyond classical hyperglycemia and insulin resistance, T2DM is associated with chronic inflammation, dyslipidemia and oxidative stress, which contribute to the development of peripheral neuropathy (DPN) [
2]. DPN involves progressive loss of sensory and motor fibers, leading to demyelination, axonal degeneration and Schwann cell dysfunction [
3,
4,
5]. Although peripheral nerves are the primary sites of structural damage in DPN, emerging evidence suggests that the central nervous system, particularly the spinal cord, may also undergo functional and metabolic changes that contribute to neuropathic symptoms [
6]. However, it remains unclear whether diabetes-associated alterations in CNS lipid composition primarily reflect increased lipid synthesis and remodeling or early structural degradation of myelin membranes. Therefore, we hypothesized that chronic exposure to diabetic and obesity-associated metabolic conditions would be associated with early changes in spinal cord lipid composition and membrane enzyme activity, potentially preceding overt structural damage.
Diabetic neuropathy involves central mechanisms including hyperexcitability of spinal dorsal horn neurons and activation of glial cells [
7]. These changes can contribute to enhanced nociceptive transmission and central sensitization in animal models of diabetes [
7]. Moreover, dyslipidemia has been implicated as a modifiable risk factor for neuropathy, with abnormal lipid metabolism contributing to oxidative stress, mitochondrial dysfunction, and neuronal membrane alterations in both peripheral and central nervous tissues [
8]. These central changes may be influenced by underlying metabolic disturbances, such as altered lipid metabolism, which can modulate membrane composition and inflammatory signaling in the spinal cord. Given these potential links between neuronal hyperexcitability and metabolism, examining specific lipid alterations in the spinal cord may provide future insight into neuropathic changes.
Emerging data from animal models, such as Zucker Diabetic Fatty (ZDF) rats, indicate that T2DM can induce metabolic and neurotransmitter alterations in the spinal cord before overt structural damage occurs [
9]. For example, ZDF rats display mechanical hyperalgesia and allodynia alongside increased extracellular glutamate levels and reduced GLT-1 expression in the dorsal horn of the spinal cord [
9], suggesting that central metabolic dysfunction may occur independently of peripheral nerve injury.
Given the central role of lipids in neuronal membrane integrity and inflammatory processes, profiling specific fatty acids in the spinal cord can provide insight into early metabolic changes associated with diabetic neuropathy. Saturated fatty acids (SFAs) and monounsaturated fatty acids (MUFA) are central to lipid metabolic regulation and membrane composition. Thus, distinguishing between degradation-driven and synthesis-driven lipid shifts remains an important unresolved question. In T2DM, excessive dietary carbohydrates and SFAs could alter de novo fatty acid synthesis, potentially influencing inflammation and cellular metabolism [
10,
11]. Ratios of 16:1 to 16:0 and 18:1 to 18:0 serve as indirect estimates of stearoyl-CoA desaturase-1 (SCD1) activity and can indicate changes in fatty acid synthesis and desaturation [
10,
12]. Although direct data on SCD1 activity in the diabetic spinal cord are lacking, previous studies in the brain of mice with a model of neurodegenerative disease demonstrated a disease-associated increase in palmitic, palmitoleic, and oleic acids [
13]. While this model differs from our diabetic rat model in species, tissue (brain vs. spinal cord), and pathology, these findings suggest that quantification of SFA, MUFA and PUFA can capture metabolically relevant alterations in the CNS and may serve as a first step to identify potential lipid changes.
In addition to SFA and MUFA alterations, polyunsaturated fatty acids (PUFAs) may also reflect neural changes. PUFAs are essential components of myelin and neuronal membranes influencing membrane fluidity, signal transduction and inflammatory regulation. Different stages of CNS disorders can alter either overall PUFA levels or the relative proportions of specific PUFAs [
13]. For this study, several PUFAs were selected based on their roles in myelin structure, lipid metabolism, inflammation, and demyelination, providing insight into neuroinflammatory and metabolic changes in the diabetic spinal cord [
14,
15,
16,
17,
18,
19]. These observations could establish whether specific changes in fatty acids are detectable and could guide future studies.
Because altered lipid composition may influence the function of membrane-bound proteins, changes in fatty acids may also affect the function of ATPases such as Na
+/K
+-ATPase and Ca
2+-ATPase, which are critical for maintaining ionic homeostasis and neuronal excitability. Reduced ATPase activity has been reported in diabetic brain tissue, potentially mediated by impaired insulin signaling, oxidative stress, and altered magnesium homeostasis [
20,
21]. Similar reductions have been observed in diabetic peripheral nerves, with a decrease in sciatic nerve Na
+/K
+-ATPase activity reported in long-term diabetic ZDF rats [
22]. Functional consequences of such alterations in the spinal cord are largely unknown, yet they may contribute to early neuronal dysfunction in diabetes [
20,
21].
Despite extensive research on peripheral neuropathy, the mechanisms underlying spinal cord involvement in diabetes remain poorly understood. Investigation of lipid metabolism and membrane enzyme activity, which have not been extensively studied, may provide useful insights into these processes, given the multifactorial pathophysiology of diabetic complications, with hyperglycemia and oxidative stress playing key roles [
23,
24].
The aim of this pilot study was to investigate fatty acid composition, estimated SCD1 and delta-5 desaturase (D5D) activity indices, and ATPase activity in the spinal cord of ZDF rats, with the goal of identifying early lipid and enzyme-related alterations in the spinal cord that may precede structural neuropathic damage and help define targets for future mechanistic studies.
2. Materials and Methods
2.1. Animal Model
The initial experimental cohort consisted of 16 ZDF lean control rats and 16 Zucker diabetic fatty (ZDF) rats. One control rat died during the study. By 36 weeks of age, 8 of the ZDF rats developed diabetes, characterized by hyperglycemia, while the other 8 remained obese but non-diabetic, with glycemia below 10 mmol/L and hyperinsulinemia. For our analyses, we used samples from 13 control rats, 7 obese (non-diabetic) ZDF rats, and 7 diabetic ZDF rats. Finally, the two ZDF groups of male rats included in our study were as follows: the first group, ZDF fa/ + (lean) rats, carrying one normal and one mutated leptin receptor allele, served as metabolically normal lean controls (CONT; n = 13). The second group, ZDF fa/fa rats, homozygous for the leptin receptor mutation and genetically predisposed to obesity and type 2 diabetes, were divided at 36 weeks of age based on fasting glycemia with a cutoff of 10 mmol/L. Rats with glycemia above this threshold were designated as diabetic (ZDF-Dia; n = 7), while those below were classified as obese but non-diabetic (ZDF-Fat; n = 7). All experimental rats were placed in the breeding facility at the Department of Toxicology and Laboratory Animal Breeding, Centre of Experimental Medicine, Slovak Academy of Sciences, Dobra Voda, Slovak Republic. The experimental procedures were approved by the Department of Animal Wellness, State Veterinary, and Food Administration of the Slovak Republic (approval number Ro-493/18-221/3) in accordance with the European Convention for the Protection of Vertebrae Animals used for Experimental and other Scientific Purposes, Directive 2010/63/EU of the European Parliament.
Throughout the experiment, animals were maintained under a controlled 12:12 h light/dark cycle, at a constant temperature of 20 to 22 °C, with water and food available ad libitum. Rats were fed with maternal milk (1st–3rd week), a standard pellet diet (3rd–7th week), and from the 8th week they received Purina Rodent LabDiet 5008, London, UK (composition: 23.5% protein, 6.5% fat—ether extract, 7.5% fat—acid hydrolysis, 3.8% fiber, 6.8% ash; caloric representation: 26.85% proteins, 16.71% fat and 56.44% carbohydrates).
At 38 to 39 weeks of age, rats were anesthetized with 2.5% sevoflurane in an induction chamber until the loss of the righting reflex, followed by decapitation. The spinal cord was rapidly excised and stored at −80 °C until analysis. Glucose concentration was measured in whole blood using a glucometer (FreeStyle Optium, Abbott, Maidenhead, UK). Plasma insulin was determined by enzyme-linked immunosorbent assay (ELISA) using a rat/mouse insulin kit (EZRMI-13K; Merck-Millipore, Darmstadt, Germany). Throughout the experiment, non-fasting blood samples were collected from the tail under sevoflurane anesthesia to monitor the development of diabetes. Fasting blood samples collected at 36 weeks of age were used for group allocation. The detailed experimental design, including changes in body weight, non-fasting blood glucose, and plasma insulin, has been described previously [
25].
2.2. Determination of Fatty Acids by Gas Chromatography
2.2.1. Methylation and Transesterification of the Samples
A 50 mg spinal cord sample was weighed into a 2 mL vial and frozen at −20 °C. Subsequently, the sample was lyophilized for 24 h. Next, 1 mL of a freshly prepared saturated solution of diazomethane in hexane (GC grade, Sigma-Aldrich, St. Louis, MO, USA) and 10 μL of heptadecanoic acid (C17:0) at a concentration of 10,000 ppm were added to the lyophilized sample, serving as an internal standard. Diazomethane was generated in situ by alkaline decomposition of Diazald (99%, Sigma-Aldrich, St. Louis, MO, USA) using potassium hydroxide (ACS reagent, ≥85%, pellets, Sigma-Aldrich, St. Louis, MO, USA). The diazomethane solution was freshly prepared or stored for no longer than one week. To prepare this solution, diazomethane bubbled through hexane for several hours until the solution turned slightly yellow. The heptadecanoic acid (≥98%, Sigma-Aldrich, St. Louis, MO, USA) internal standard was added to monitor the methylation process. If unreacted C17:0 acid was detected in the sample, a new diazomethane solution was prepared. The reaction mixture was left to stand for 1–2 days, after which it was centrifuged, and two 400 µL aliquots of the clear solution were collected. While the reaction between the acid and diazomethane to form the methyl ester occurred immediately, prolonged extraction time was required to quantitatively recover the free fatty acids (FFA) from the lyophilized spinal cord. The first 400 µL aliquot was analyzed by gas chromatography with flame-ionization detection (GC-FID) to quantify FFAs in the spinal cord, determined as methyl esters formed after methylation with diazomethane.
To the second 400 µL aliquot, 50 µL of sodium methoxide (reagent grade, 95%, powder, Sigma-Aldrich, St. Louis, MO, USA) in dry methanol (suitable for HPLC, gradient grade, ≥99.8%, Supelco, Bellefonte, PA, USA) was added. This solution was prepared by diluting a saturated solution of sodium methoxide in methanol (1:1). The vials were then closed and shaken for 15 min at 45 °C. Next, 30 µL of oxalic acid (≥99.0% (RT), crystals, puriss. p.a., Sigma-Aldrich, St. Louis, MO, USA) dissolved in ether was added to neutralize the reaction mixture and remove sodium methanolate by forming a precipitate of sodium oxalate, which was then removed by centrifugation. Subsequently, 20 µL of acetic acid methyl ester (ReagentPlus, 99%, Sigma-Aldrich, St. Louis, MO, USA) was added to the sample to suppress hydrolysis; in the event of hydrolysis, preferential decomposition of the acetic acid methyl ester would occur. Finally, the prepared sample was analyzed by GC-FID to determine fatty acids (FA) contained in triglycerides or phospholipids, while FFAs remained unreacted and eluted at different retention times.
2.2.2. Fatty Acids Measurement
The levels of free and total (free + esterified) fatty acids (from C14:0 to C24:1) were determined after extraction from the tissue and subsequent derivatization (methylation). After lyophilization, hexane saturated with diazomethane (methylating agent) was added to each sample. After 24 h, the samples were centrifuged, and the supernatant was collected for analysis. The reaction was carried out in anhydrous methanol in the presence of a basic catalyst (0.5 M sodium methoxide in methanol). Fatty acid analysis was performed by gas chromatography with flame ionization detection (GC-FID) (Agilent 7890A, Agilent Technologies, Santa Clara, CA, USA) using a DB-23 column (Agilent J&W, Santa Clara, CA, USA; 60 m × 0.25 mm, film thickness 0.25 µm) with the following temperature program: initial temperature 60 °C (1 min), then increased at a rate of 25 °C/min to 195 °C, followed by 5 °C/min to 245 °C, with an isothermal phase at 245 °C for 15 min. Data were processed using Agilent ChemStation software (Rev. B.04.03). Each fatty acid was quantified and expressed as a percentage of the total area of chromatographic peaks (% relative abundance) based on the detected fatty acids. A total of 21 fatty acids were identified in the analysis, including 9 saturated fatty acids (SFA) and 16 unsaturated fatty acids (UFA). The UFAs were further subdivided into 7 monounsaturated fatty acids (MUFA) and 9 polyunsaturated fatty acids (PUFA). From these, the following fatty acids were selected for detailed analysis based on their highest relative abundance or relevance to myelin damage: from the SFA group, palmitic acid (C16:0) and stearic acid (C18:0) were chosen. From the MUFA group, palmitoleic acid (C16:1) and oleic acid (C18:1) were selected. Finally, from the PUFA group, eicosadienoic acid (C20:2), dihomo-γ-linolenic acid (C20:3), arachidonic acid (C20:4), and adrenic acid (C22:4) were included. GC-FID analyses were performed with knowledge of sample identity; however, all samples were processed using the same standardized analytical protocol to minimize potential bias.
2.3. Determination of ATPase Activities in the Spinal Cord Homogenates
Samples were homogenized in 50 mM TRIS-HCl buffer (Merck KGaA, Darmstadt, Germany) using Potter-Elvehjem homogenizer (Carl Roth GmbH + Co. KG, Karlsruhe, Germany). In a 0.5% spinal cord homogenate, total ATPase activity (Na
+, K
+, Ca
2+, Mg
2+) and basal Mg
2+-ATPase activity were determined spectrophotometrically, as described by Luthra, 1982 [
26]. ATPase activity was measured under four experimental conditions, each corresponding to a specific reaction mixture:
| Condition | Components | ATPase Activity |
| A | ATP (0.5 mM) | Hydrolytic cleavage of Pi |
| B | ATP (0.5 mM) + Mg2+ (3.1 mM) | Ca2+-dependent and Basal activity |
| C | ATP (0.5 mM) + Mg2+ (3.1 mM)
+ EGTA (50 µM) | Basal activity |
| D | ATP (0.5 mM) + Mg2+ (3.1 mM)
+ Na+ (68 mM) + K+ (28 mM) | Total activity |
EGTA (Merck KGaA, Darmstadt, Germany) was used as a Ca2+-chelating agent. Each sample was incubated with the respective reaction mixture at 37 °C for 20 min. After incubation, each sample was mixed with chloroform–methanol (2:1, v/v) to extract the inorganic phosphate. The mixture was then centrifuged at 3000 rpm for 3 min, and the supernatant was collected.
In the supernatant, inorganic phosphate (Pi) was determined by forming a phosphomolybdate complex in acidic solution, which was subsequently reduced to a blue-colored complex. After incubation for 20 min at 45 °C, Pi was measured spectrophotometrically at 760 nm. Protein concentration was determined according to [
27], and ATPase activity was expressed as nkat per mg of protein. Na
+/K
+-ATPase and Ca
2+-ATPase activities were calculated as the differences between the corresponding measurements.
2.4. Statistical Analysis
The Shapiro–Wilk test was used to assess normality. For normally distributed data, one-way analysis of variance (ANOVA) followed by Tukey’s post hoc test was applied to compare multiple groups. When normality was not met, the Kruskal–Wallis test with Dunn’s post hoc test was used as a nonparametric alternative. Data are presented as means ± standard error of the mean (SEM) for parametric variables or as medians with interquartile ranges (IQR; Q1–Q3) for nonparametric variables. A p-value < 0.05 was considered statistically significant in all analyses. Statistical analyses were performed using GraphPad Prism 8.0.1.
4. Discussion
In type 2 diabetes mellitus (T2DM), metabolic disturbances affect both peripheral and central nervous systems, contributing to oxidative stress and neuroinflammation, which are key mechanisms in diabetic neuropathy development [
28,
29]. These systemic changes provide the context for investigating lipid composition and membrane enzyme activity in the spinal cord.
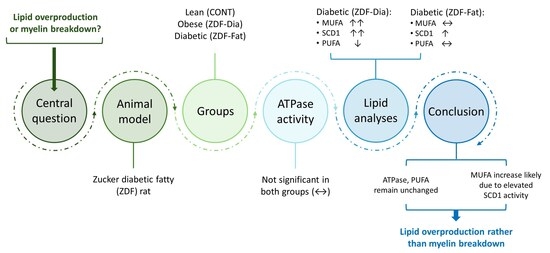
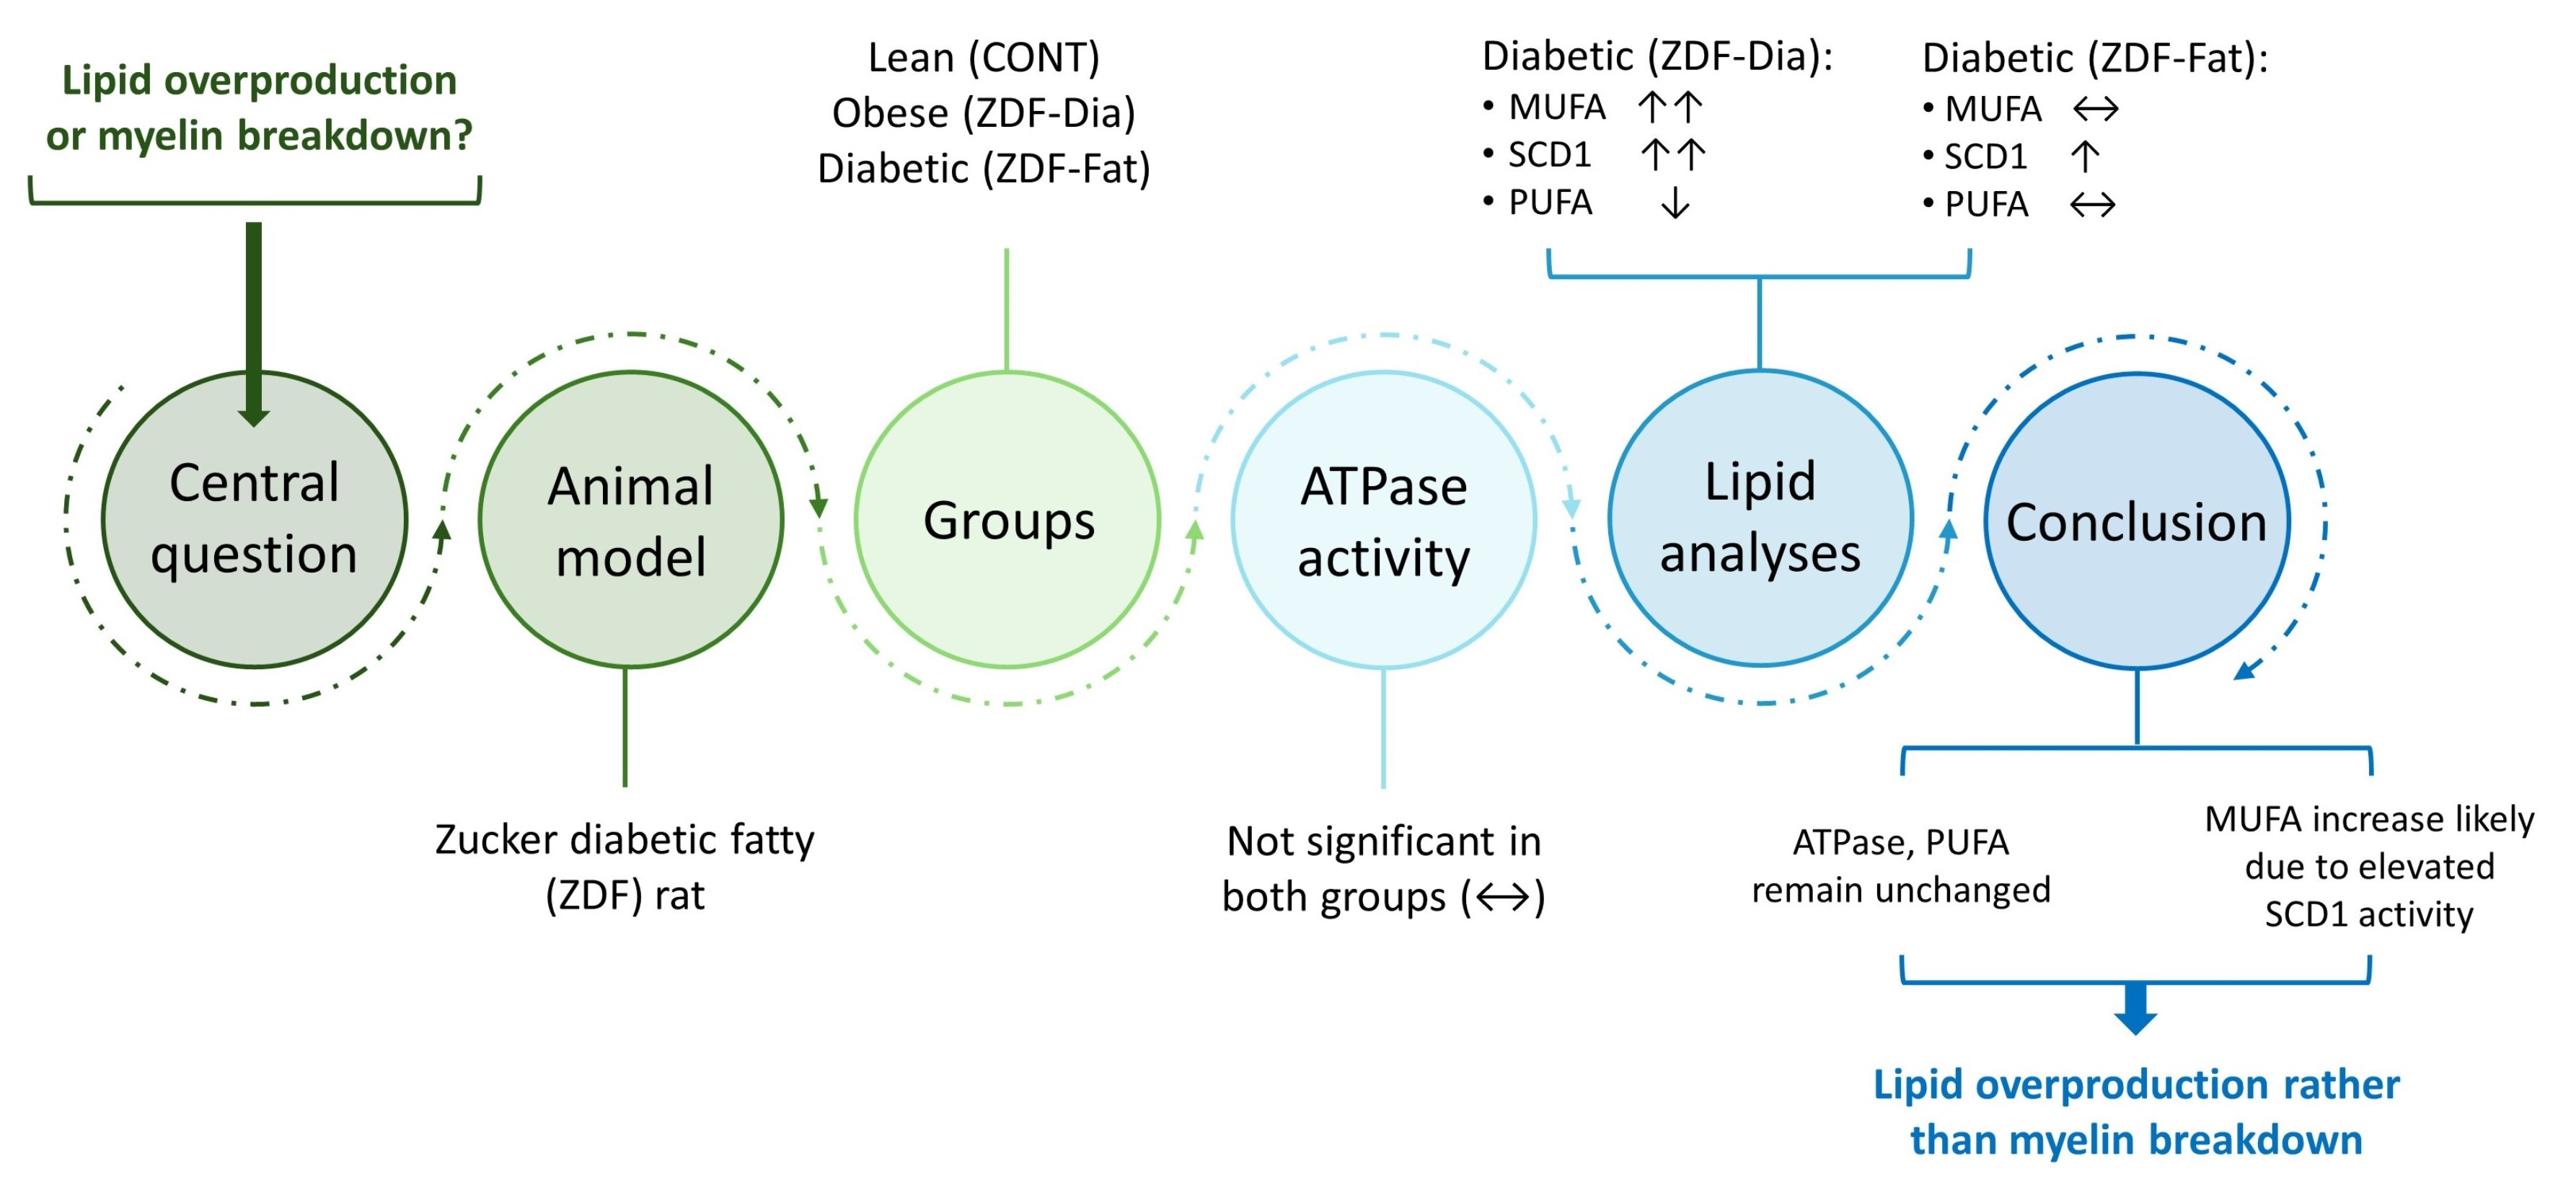
The working hypothesis of this pilot study was that chronic exposure to diabetic and obesity-associated metabolic conditions would be associated with early alterations in spinal cord lipid composition and membrane enzyme activity, preceding overt structural damage. In this context, the primary objective was exploratory: to identify which fatty acid classes or indices show the most prominent shifts and may therefore represent relevant targets for future mechanistic investigation.
In this study, we investigated the lipid profile, estimation of desaturase activity by measuring the activity indices (SCD1 and D5D), and ATPase activities (total, Mg2+-, Na+/K+-, and Ca2+-ATPase) in the spinal cord of Zucker Diabetic Fatty (ZDF) rats, comparing diabetic (ZDF-Dia), obese non-diabetic (ZDF-Fat), and lean controls (CONT). Given the exploratory nature of the study, statistical analyses were designed to minimize false-positive findings; the implications of sample size and statistical power are therefore considered collectively in the limitations discussed at the end of this section.
Previous studies have reported reduced Na
+/K
+-ATPase activity in diabetic brain tissue, regulated by magnesium homeostasis and insulin signaling [
20,
21]. Contrary to these observations, we detected no significant differences in any ATPase activities at physiological Mg
2+ concentration (3.1 mM). Importantly, ATPase activity was intentionally assessed under basal (physiological) conditions in order to evaluate the direct impact of chronic exposure to obesity or diabetes on membrane enzyme function, without applying additional ex vivo stressors. These measurements therefore reflect enzyme activity in spinal cord tissue already exposed in vivo to the metabolic environment of obesity and diabetes. Our findings suggest that basal membrane enzyme function remains preserved in the spinal cord despite diabetes (ZDF-Dia) or obesity (ZDF-Fat). Nevertheless, future studies employing challenge-based approaches (e.g., oxidative or metabolic stress conditions) may help to determine whether stress-induced or more subtle functional alterations become apparent under increased metabolic demand.
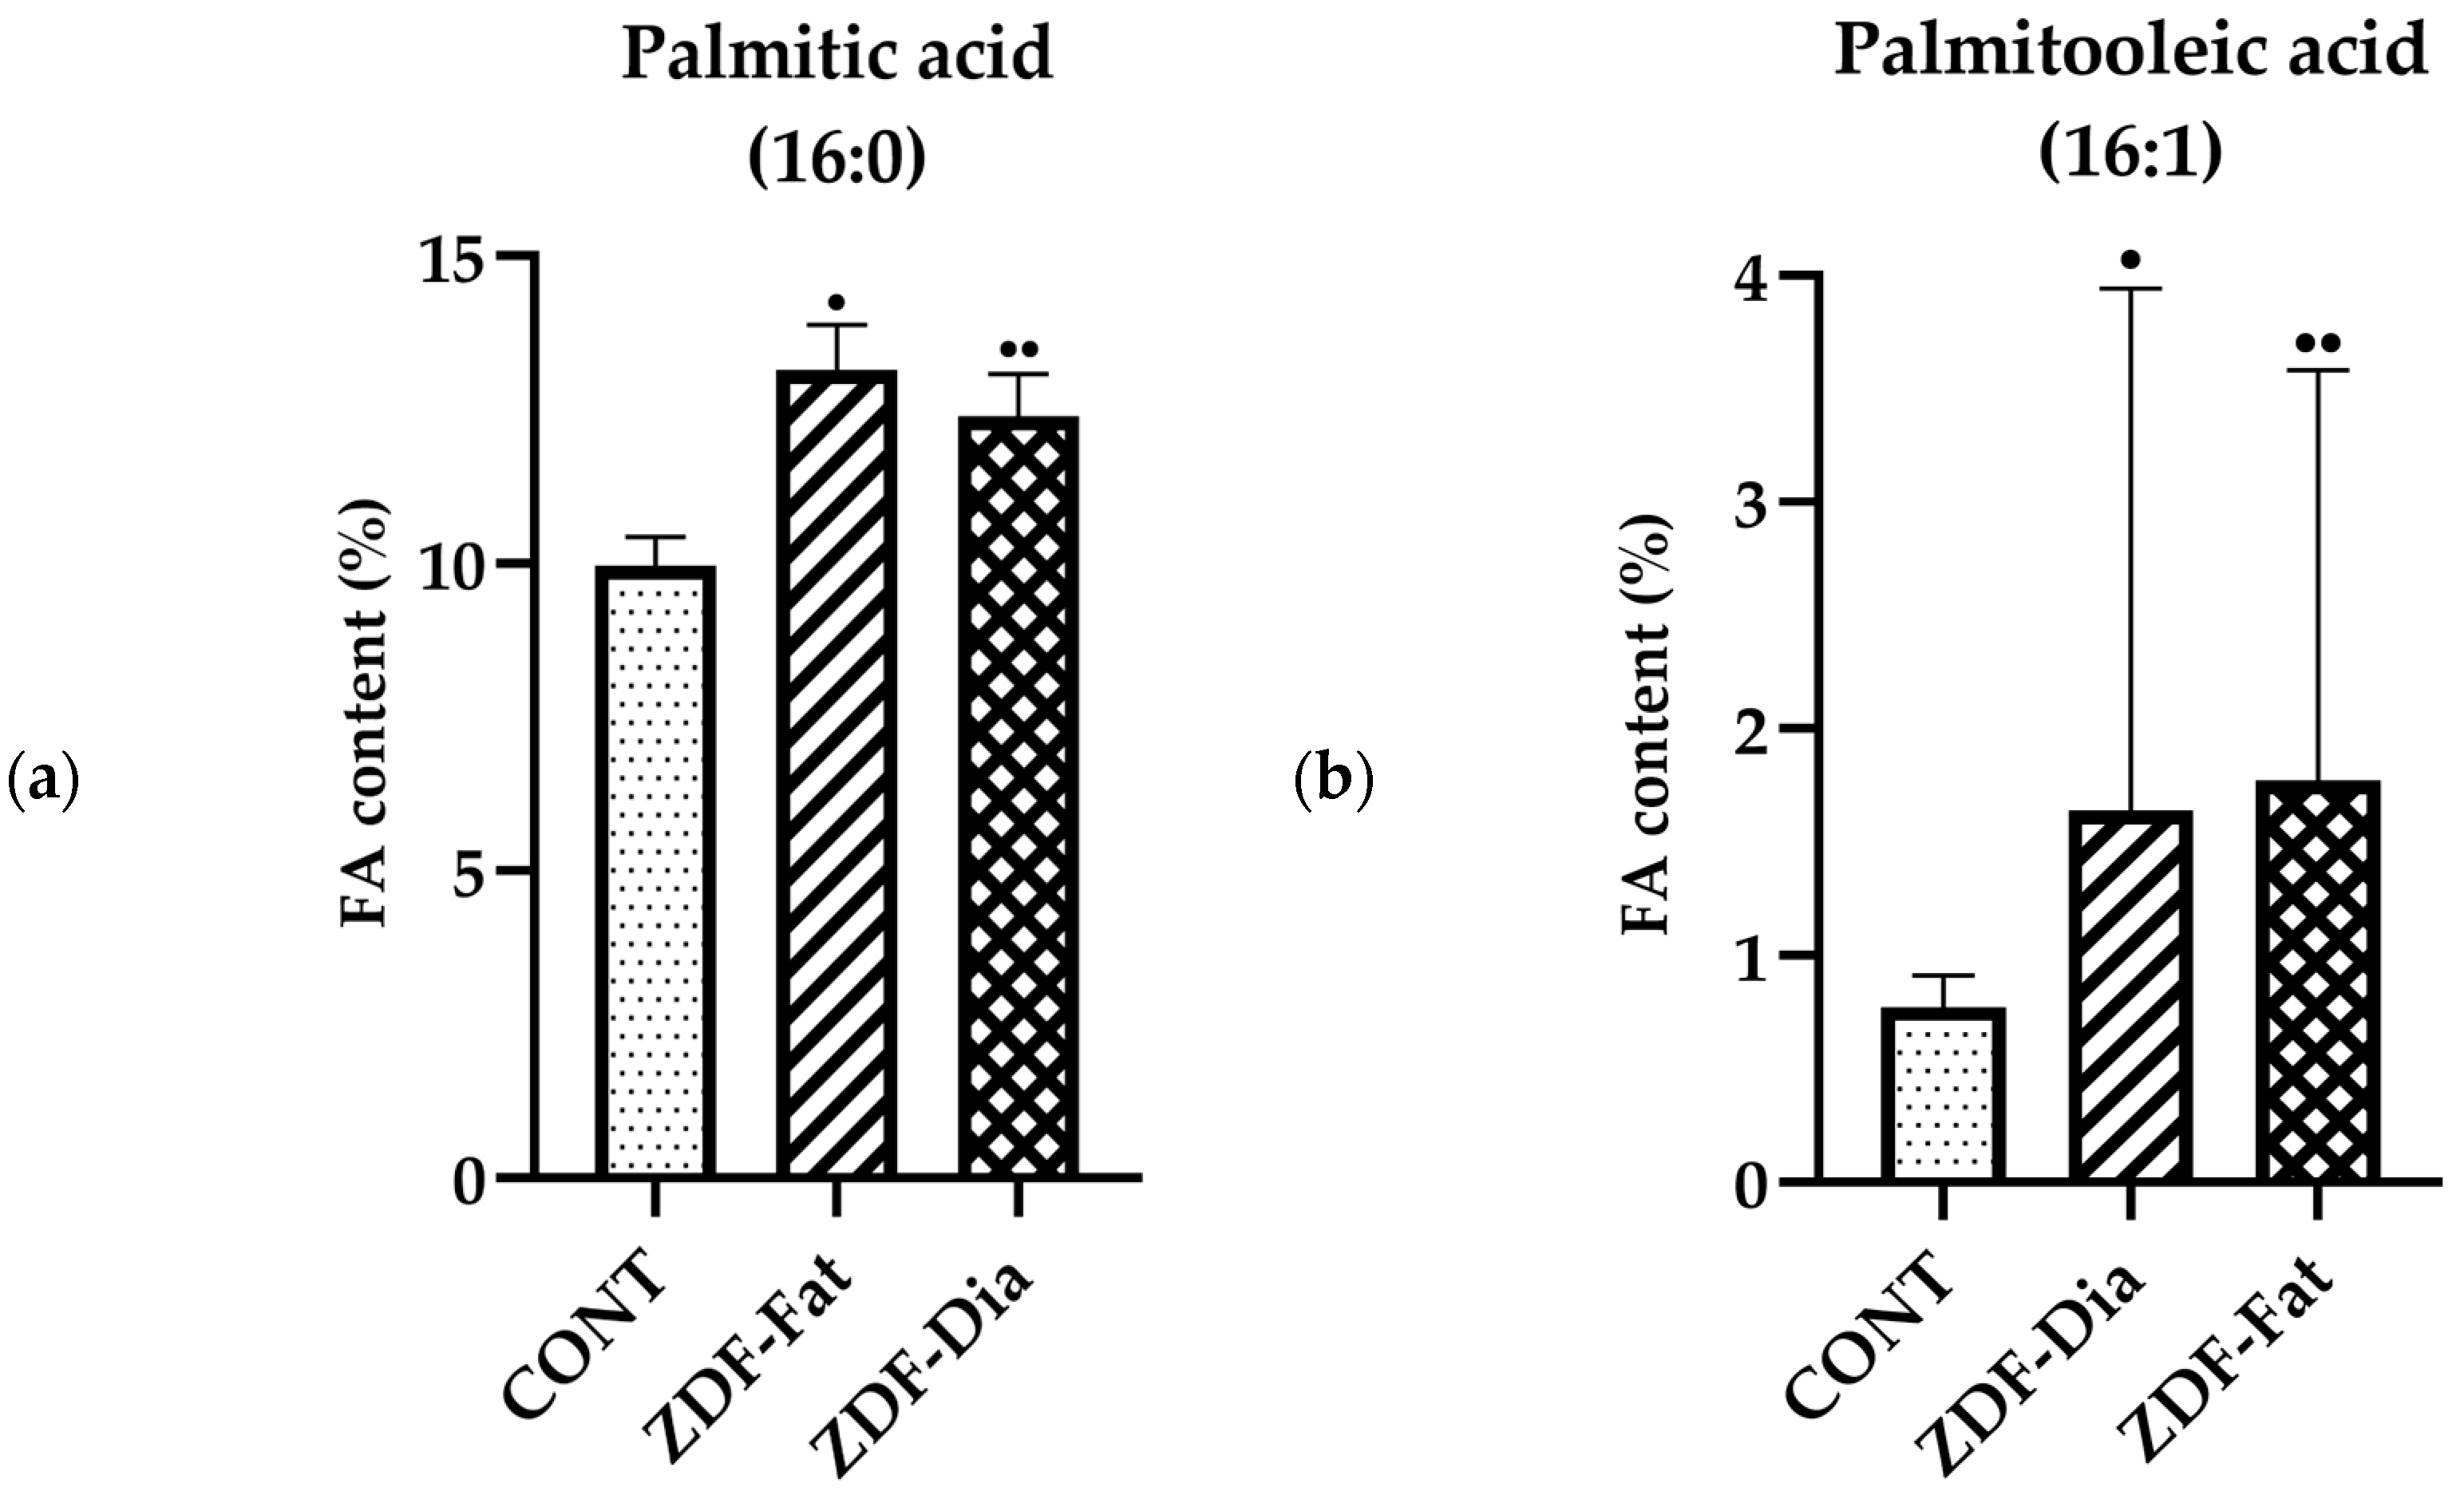
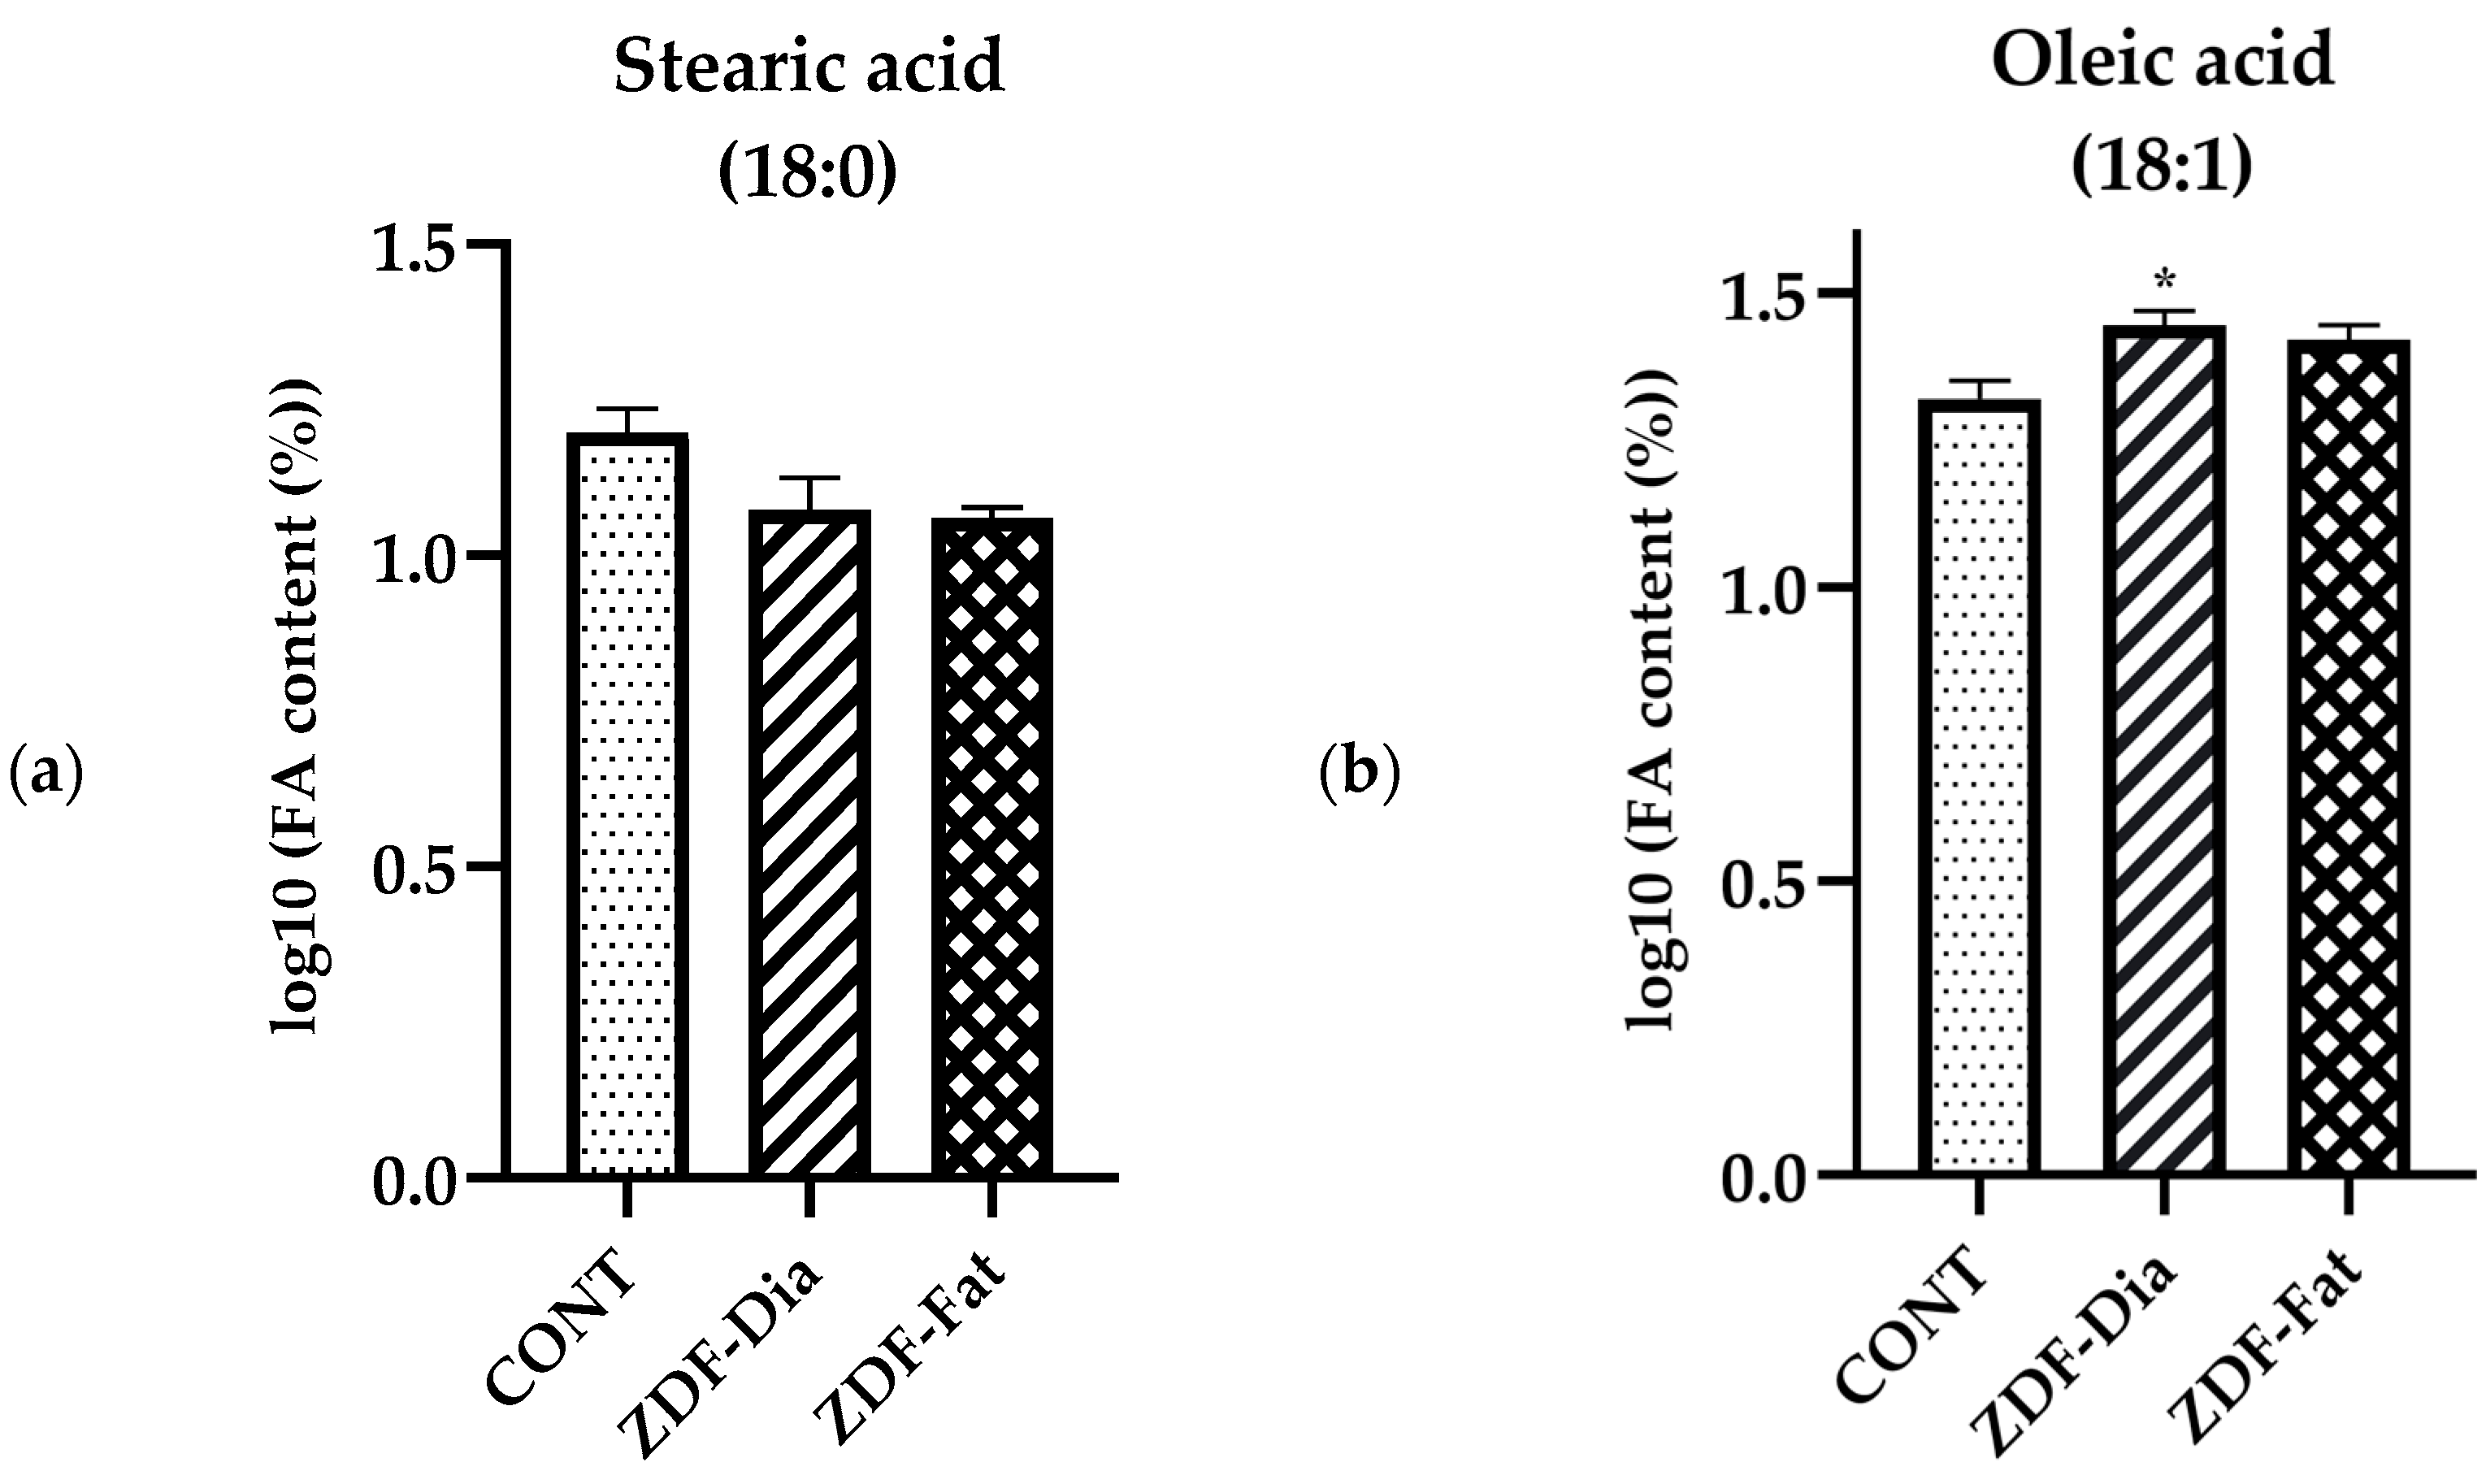
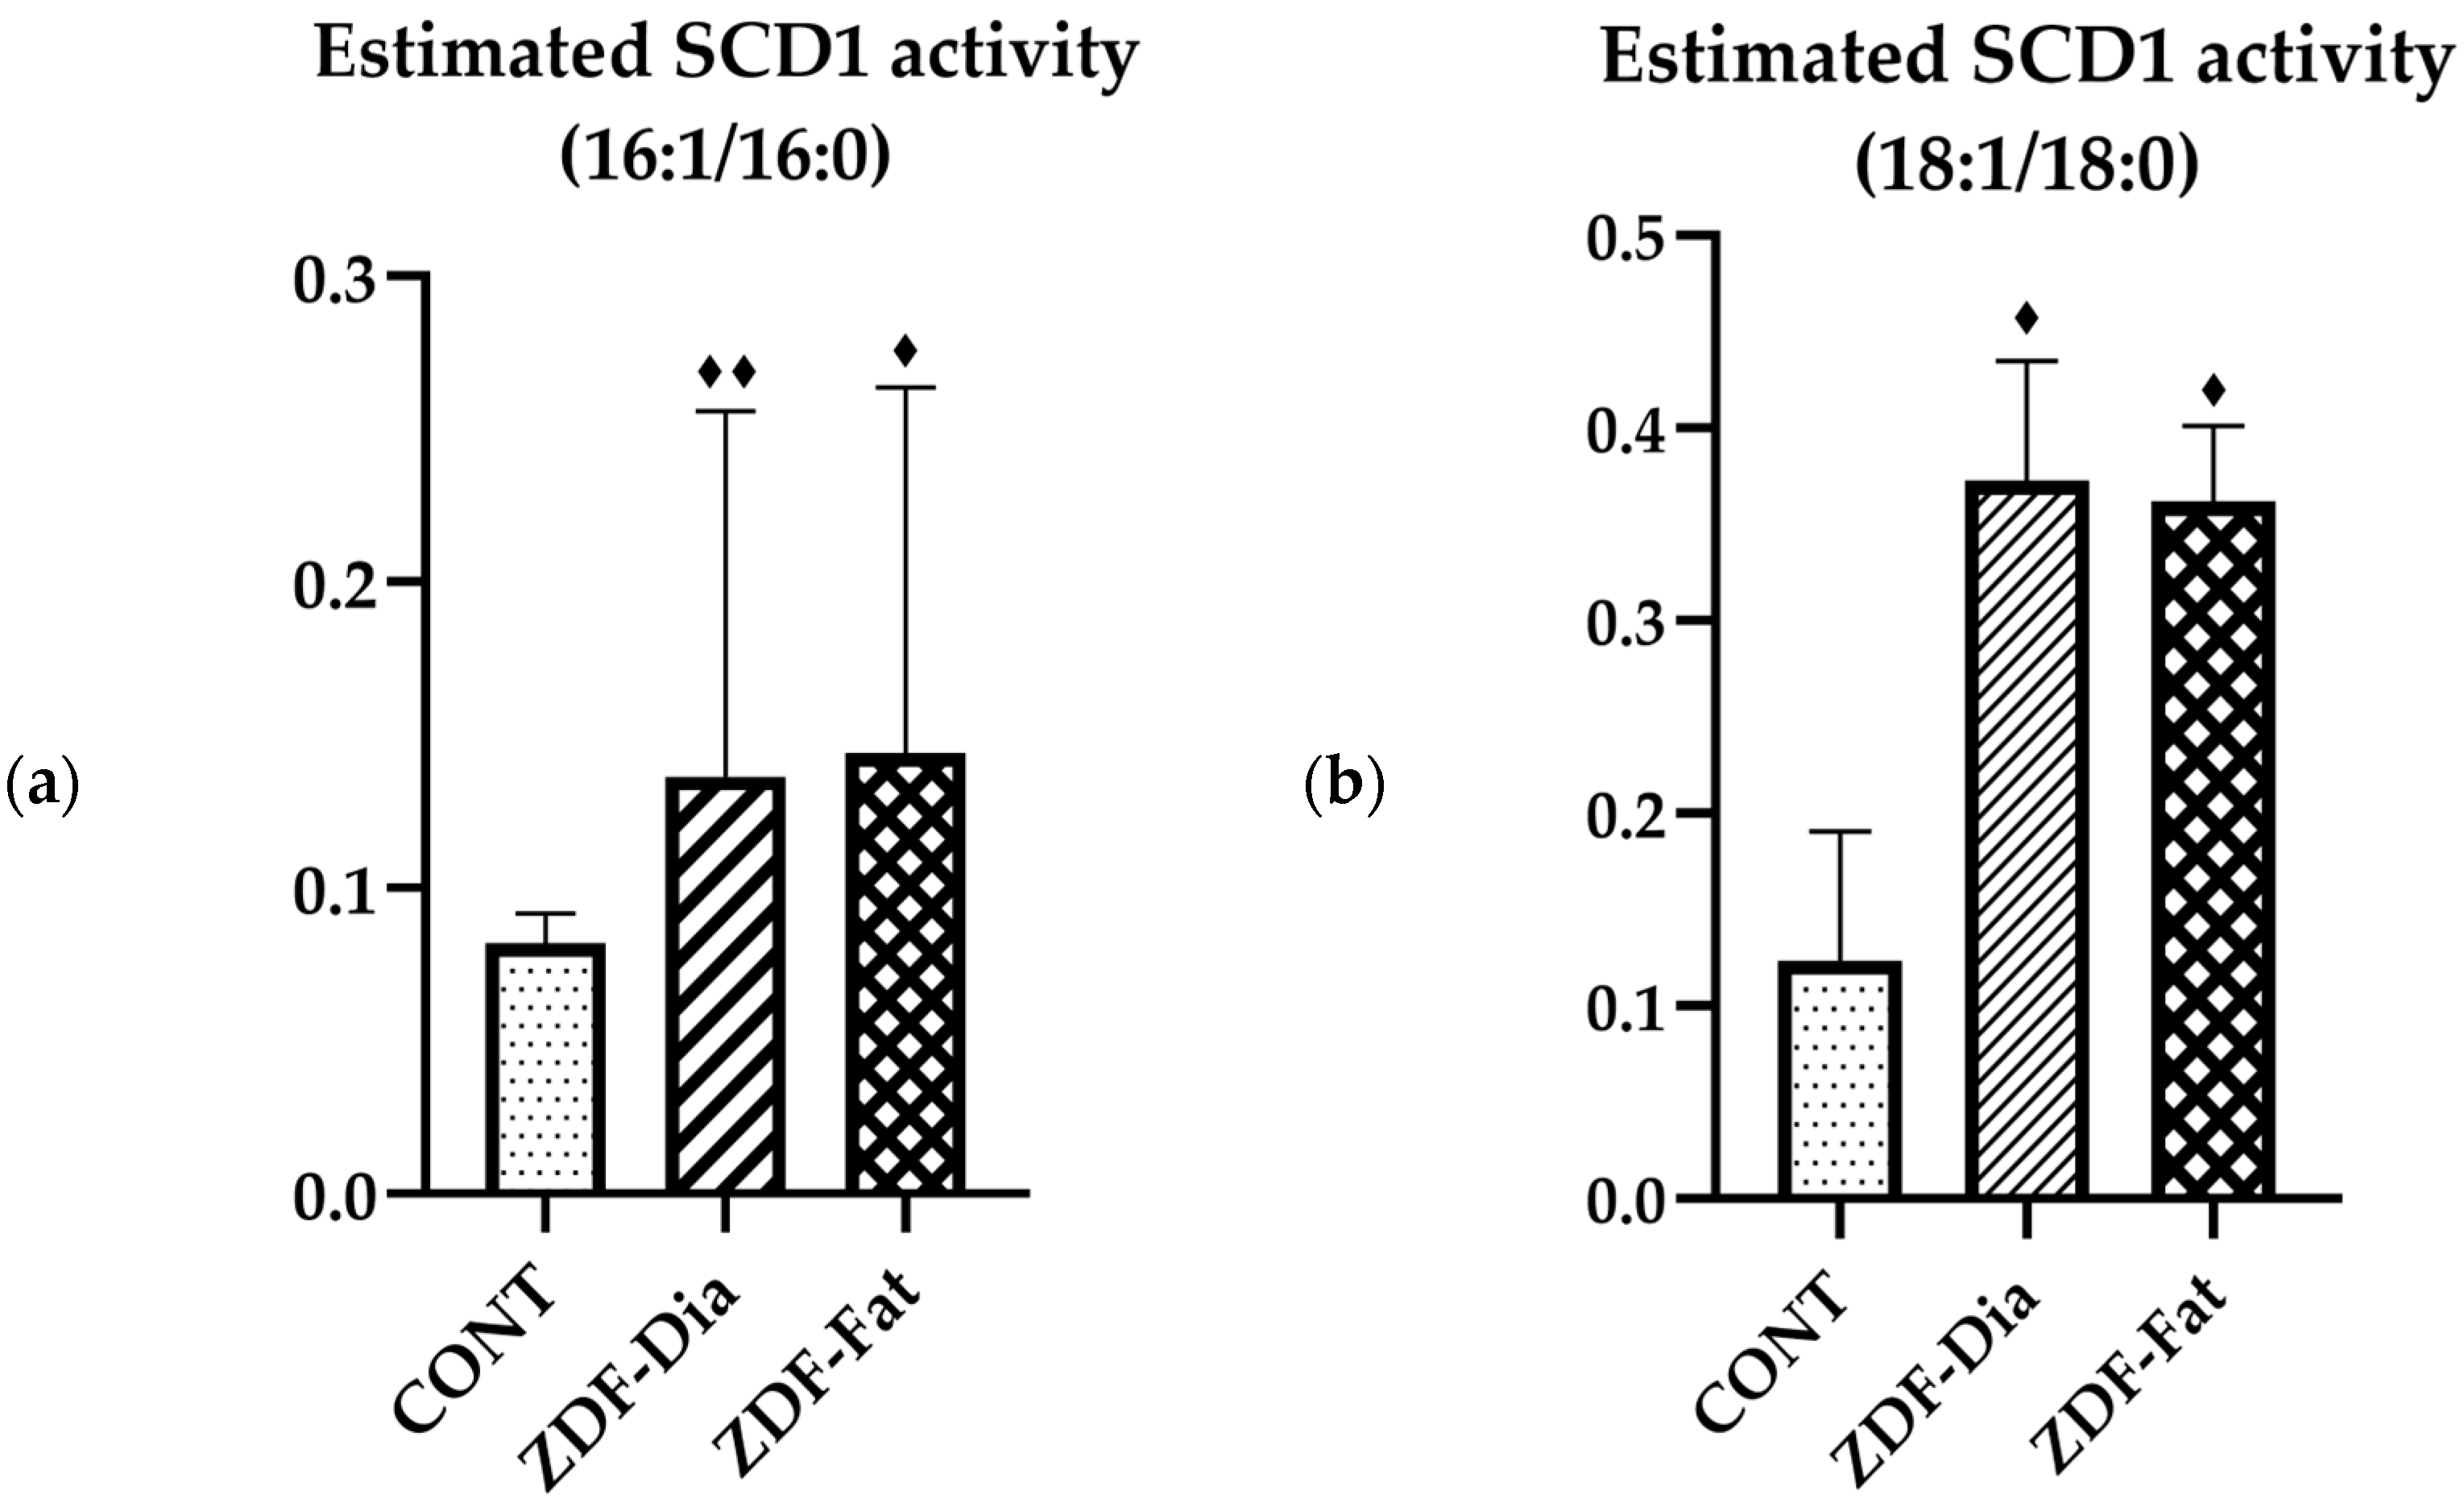
Total fatty acid content in the spinal cord was not significantly altered; however, free monounsaturated fatty acids (MUFAs) were elevated. Specifically, levels of palmitoleic acid (16:1) and oleic acid (18:1) were increased in diabetic rats, whereas in obese rats an increase was observed only for palmitoleic acid. The 16:1/16:0 and 18:1/18:0 ratios were significantly increased in both ZDF groups, consistent with increased SCD1-related desaturation, a key enzyme converting saturated fatty acids to MUFAs. Estimation of SCD1 activity using fatty acid ratios has been validated in adipose tissue, corresponding well with gene expression [
30], and elevated 18:1/18:0 ratios have been reported in insulin-resistant individuals [
30]. Increased SCD1 activity has been implicated in diabetes-related metabolic dysregulation and neural tissue alterations [
10]. However, these associations are based on indirect measures, and tissue-specific validation and particularly in central nervous system tissue, it remains limited. Direct measurements of SCD1 gene and protein expression are warranted to confirm these findings. Nevertheless, these ratios represent indirect estimates and may also be modulated by changes in fatty acid uptake, de novo lipogenesis, or triglyceride lipolysis. Together, our results suggest that elevated free MUFAs indicate early metabolic alterations in the spinal cord in the absence of detectable enzymatic impairment in the present experimental setting.
Although no previous work has investigated the lipid profile in the spinal cord in diabetes, related studies have reported altered glutamatergic signaling in ZDF rats, including reduced GLT-1 expression and increased extracellular glutamate levels in the dorsal horn [
9]. This supports the notion that the spinal cord is a sensitive site for early metabolic and functional alterations in diabetes and provides a functional context for our observation of early MUFA changes.
Free polyunsaturated fatty acids (PUFAs) were significantly decreased only in diabetic animals, whereas the levels of the selected individual fatty acids (eicosadienoic acid C20:2, dihomo-γ-linolenic acid C20:3, arachidonic acid C20:4, and adrenic acid C22:4) remained unchanged. This pattern suggests subtle, distributed reductions across multiple PUFA types without producing overt changes in specific myelin-associated lipids. The delta-5 desaturase activity index (20:4/20:3) was also unchanged; however, this does not preclude more nuanced alterations in PUFA turnover or compartmentalization. Alternatively, the observed discrepancy may partly reflect biological variability in PUFA composition in central nervous system tissue, while still supporting the presence of subtle metabolic alterations. Given the critical role of PUFAs in myelin structure and neuroinflammatory modulation, their relative stability suggests preserved myelin integrity at this stage of spinal cord involvement in diabetes. Together with unchanged ATPase activities, these findings support the conclusion that demyelination or severe membrane damage may not yet be predominant features. This is consistent with the concept that metabolic changes precede degenerative neuropathic alterations [
29].
Our observations are conceptually supported by studies in other CNS disorders, such as Krabbe disease, where analysis of twitcher mouse brains revealed increases in palmitoleic acid (C16:1) and decreases in plasmalogen derivatives [
13]. These changes correlated with neuroinflammation and oligodendrocyte apoptosis, highlighting that subtle alterations in fatty acid composition may serve as early metabolic markers of CNS pathology, even before overt structural damage occurs [
23,
24]. The parallel between these findings and our data in ZDF spinal cord suggests that early lipid remodeling may be a generalizable feature of metabolic stress in neural tissues.
Our findings align with clinical data showing associations between elevated plasma palmitic, palmitoleic, and oleic acids and increased T2DM risk, independent of insulin sensitivity and secretion [
31]. This highlights the potential role of enhanced SCD1-mediated MUFA production in diabetes-related metabolic dysfunction. Importantly, the increase in free MUFAs in the spinal cord may reflect altered lipid synthesis or remodeling rather than membrane breakdown, supported by unchanged levels of myelin-related fatty acids and stable Na
+/K
+-ATPase activity. It is essential to note that contributions from fatty acid transport, de novo lipogenesis, or lipid turnover cannot be excluded.
The present findings suggest that, at this stage of disease progression, alterations are more consistent with shifts in lipid composition and desaturation indices rather than clear evidence of membrane destruction or enzymatic failure. These data do not allow discrimination between increased synthesis, altered trafficking, or redistribution of fatty acids; however, they help to narrow the focus toward specific monounsaturated fatty acids and desaturation-related pathways that warrant direct molecular assessment in subsequent studies. Despite the relatively small sample size, non-parametric statistical tests with post hoc corrections were applied to minimize false-positive results. SCD1 and D5D activities were inferred from fatty acid ratios; future studies should include direct gene and protein measurements, larger cohorts, and expanded fatty acid panels (including elongase activity) to clarify mechanisms linking lipid metabolism to diabetic neuropathy. Finally, it should be emphasized that the present findings were obtained in a well-established animal model of T2DM. Therefore, further studies in humans will be necessary to confirm the translational relevance of these observations.




 ,
,