
Review

Infrared Thermography in Diabetic Foot Assessment: Review

by
Thelma I. Morales-Ramírez
1,
Daniel Román-Rojas
2 and
Aurora Espinoza-Valdez
1,*
1
Departamento de Ciencias Computacionales/CUCEI, Universidad de Guadalajara, Guadalajara 44430, Jalisco, Mexico
2
Departamento de Fisiología/CUCS, Universidad de Guadalajara, Guadalajara 44340, Jalisco, Mexico
*
Author to whom correspondence should be addressed.
Diabetology 2026, 7(3), 47; https://doi.org/10.3390/diabetology7030047
Submission received: 9 January 2026 / Revised: 6 February 2026 / Accepted: 27 February 2026 / Published: 3 March 2026
(This article belongs to the Special Issue Prevention and Care of Diabetic Foot Ulcers)

Abstract

One of the most common and severe complications of diabetes mellitus is diabetic foot, making early detection a public health priority. Infrared thermography is a promising noninvasive technique for identifying abnormal thermal patterns associated with inflammation, neuropathy, angiopathy, and tissue damage. This technique involves acquiring infrared radiation emitted by the skin and processing it to generate thermal maps that reflect underlying physiological changes. However, the reliability of thermographic assessments depends on strict technical conditions, including sensor performance, environmental control, and reproducible measurements. Despite its advantages, the clinical adoption of thermography is limited by the absence of standardized acquisition protocols and the influence of external and physiological factors on temperature measurements. Addressing these challenges is essential to ensure the accurate interpretation and validation of results. Recent advances, such as the incorporation of artificial intelligence algorithms and the development of portable, low-cost devices, offer new opportunities to enhance thermography’s applicability in clinical settings and home monitoring.

1. Introduction

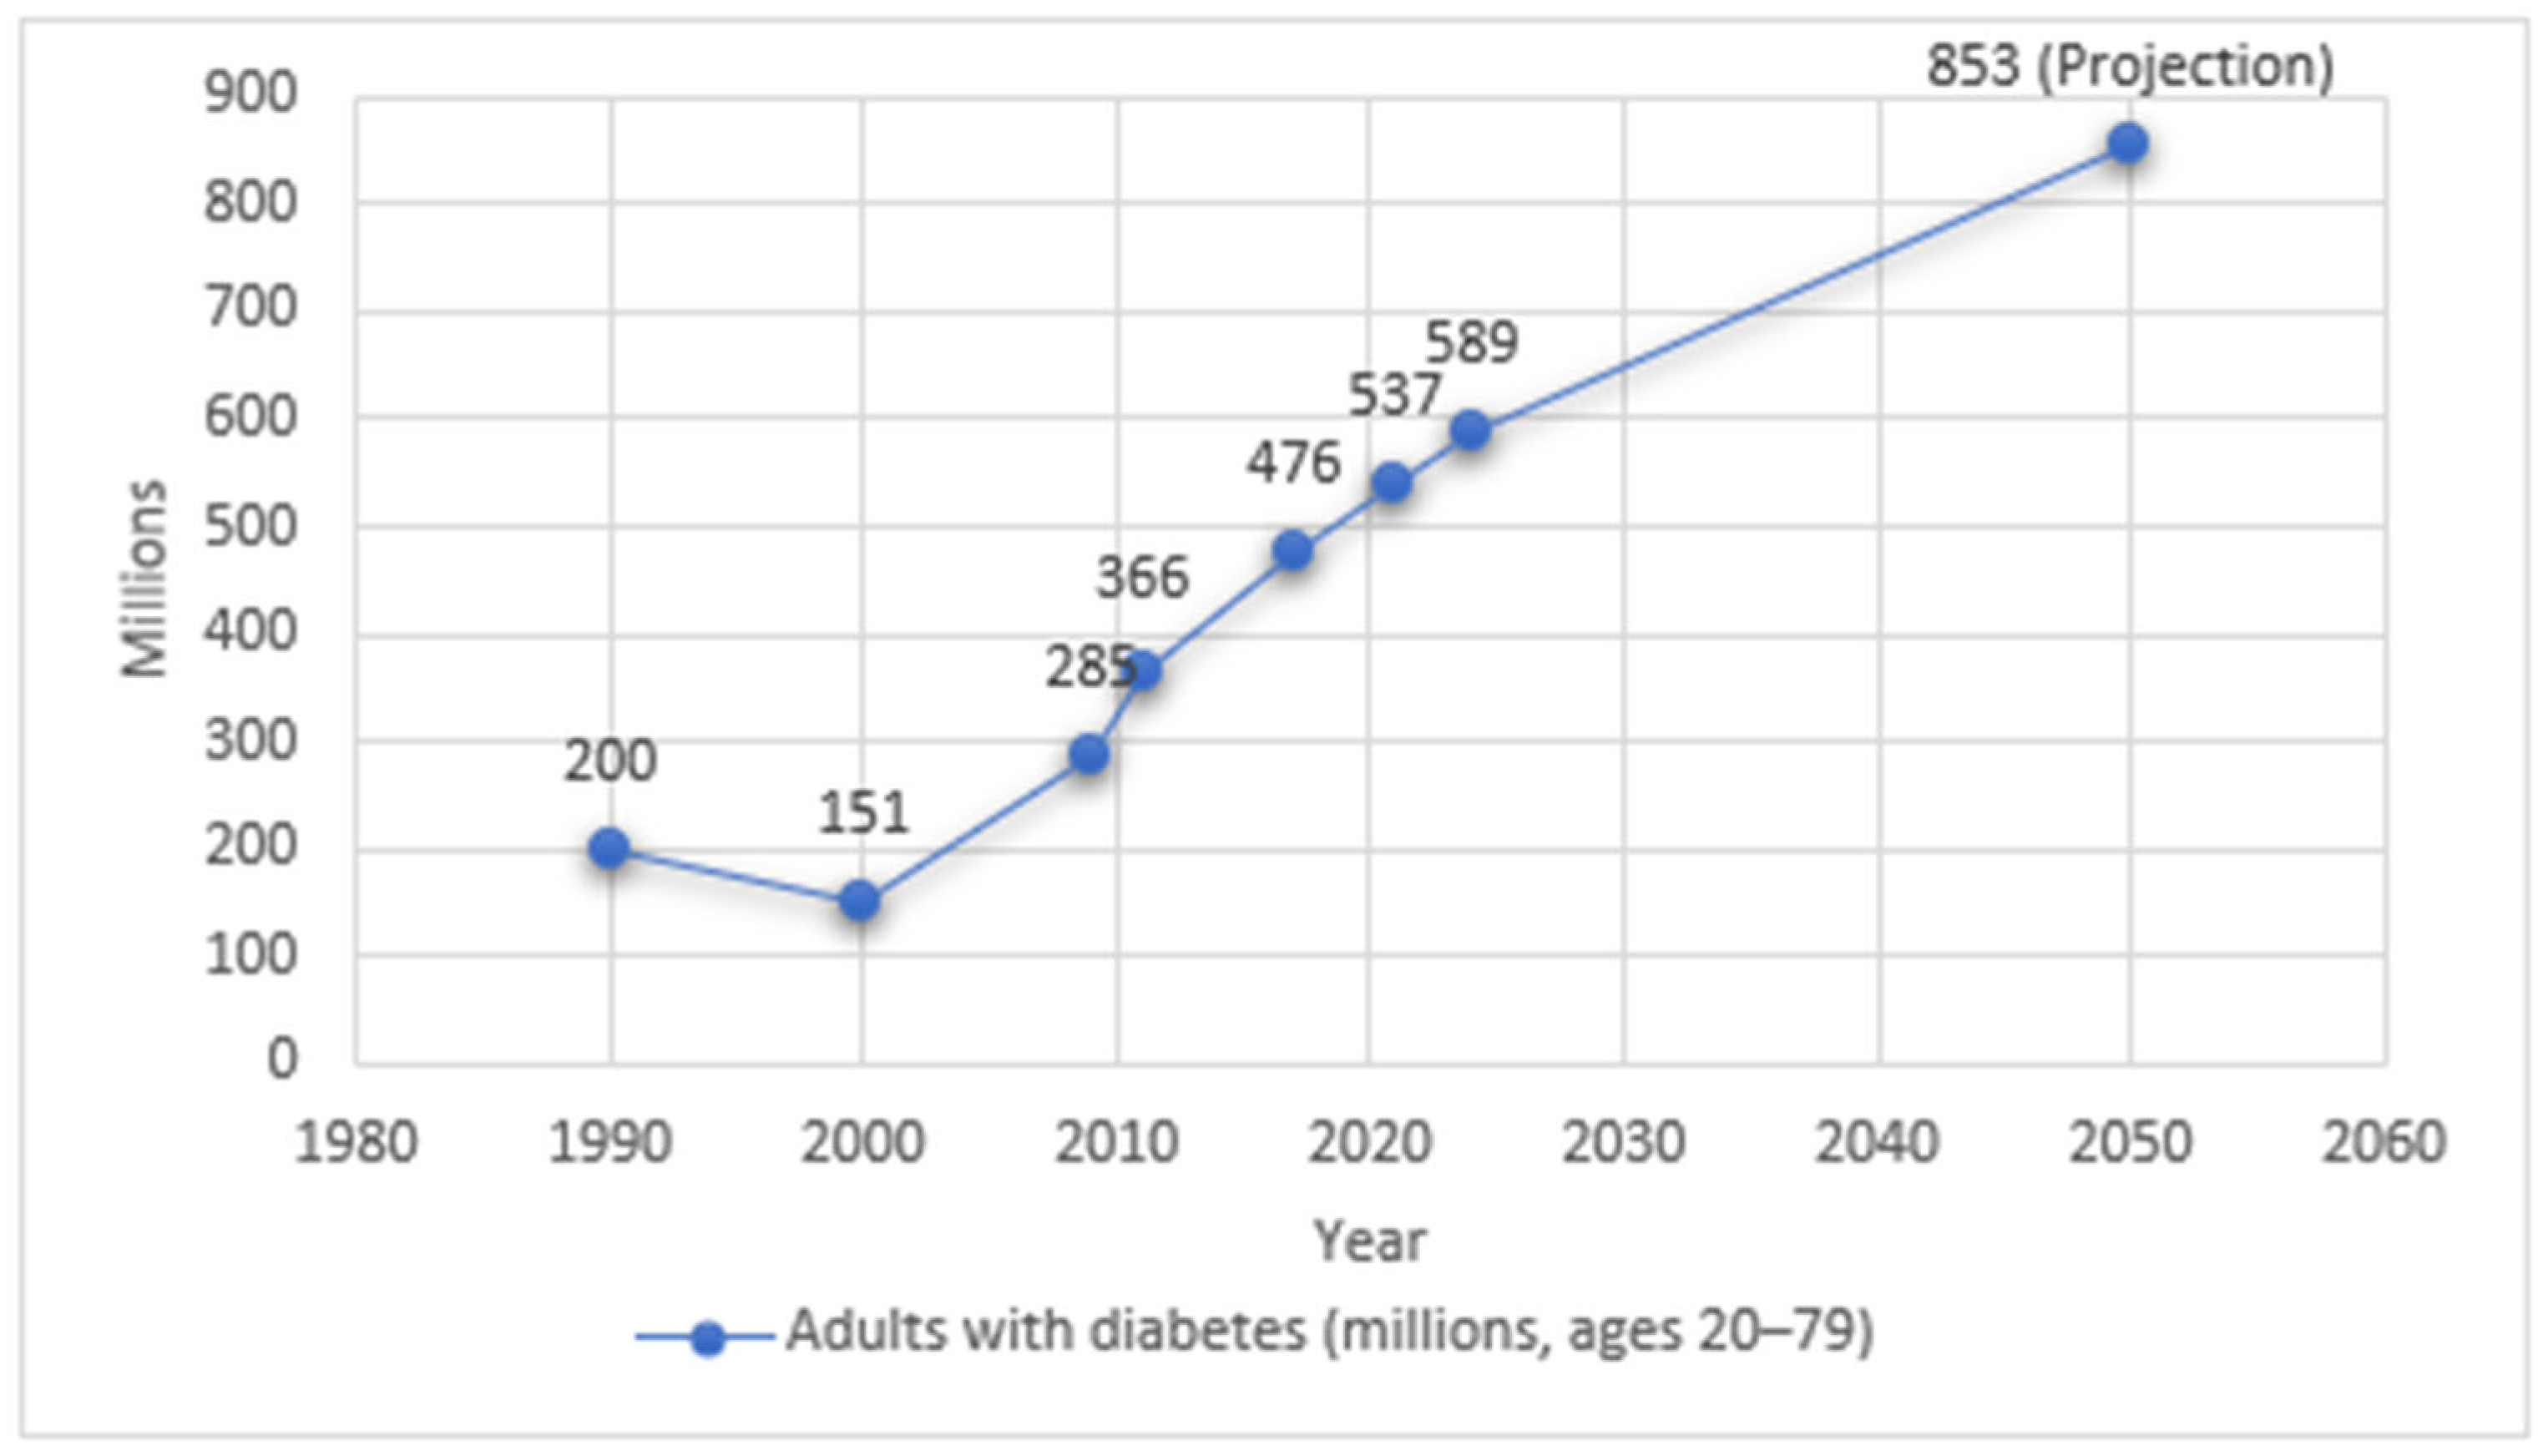
Diabetes mellitus (DM) is a long-term metabolic disorder that occurs when the pancreas does not produce enough insulin or when the body’s tissues cannot respond appropriately to this hormone [1]. Insulin is a polypeptide hormone that is crucial for controlling blood glucose levels. It binds to specific cellular receptors and activates signaling pathways that help with glucose uptake and storage while also reducing its production [2]. In recent years, the number of people living with DM has increased substantially worldwide (see Figure 1). This disease is now one of the leading causes of death and disability because of its microvascular (retinopathy, nephropathy, neuropathy) and macrovascular (cardiovascular disease, stroke) complications. According to the international epidemiological reports, the global prevalence of diabetes among adults has increased steadily over the past decades, representing a major and growing public health challenge worldwide [3].
There are two types of diabetes: (i) Type I (insulin-dependent) diabetes, initially diagnosed in children, adolescents, and young adults, in which the body does not produce enough insulin; and (ii) Type II (non-insulin-dependent) diabetes, which occurs more frequently in adults, in which the body becomes resistant to insulin. Insulin plays an essential role by transporting glucose from the bloodstream into muscles, fat, and other cells, where it is stored or used as an energy source. Disruption of this hormone’s function can lead to an imbalance in glucose levels, which, if left uncontrolled for a prolonged period, can result in serious complications [4]. Type II diabetes mellitus (DM) has the most significant impact on health, as well as the social and economic consequences that come with it. It is the most common form of diabetes, and its prevalence has increased mainly due to sedentary lifestyles and rising obesity rates.
Beyond its rising prevalence, Type II diabetes poses challenges in early detection. Symptoms usually appear gradually. As a result, many people do not realize they have the condition until complications arise. The most common complications include heart issues, diabetic neuropathy, kidney problems, eye damage, and diabetic foot syndrome [5]. Neuropathy, damage to blood vessels, and reduced blood flow significantly increase the risk of developing diabetic foot syndrome. This condition is marked by foot ulcers, infections, and, in severe cases, gangrene of the affected tissues [5]. Although there is currently no unified international surveillance system that systematically records hospitalisations for diabetic foot complications, available epidemiological studies provide global estimates of their prevalence. Meta-analyses suggest that around 6.3% of adults with diabetes develop a diabetic foot ulcer annually, while between 3.1% and 8.8% have conditions that put them at high risk of developing this complication [6].
Beyond its clinical impact, diabetic foot syndrome poses a significant global burden on health, social, and economic systems. Costs vary widely depending on disease severity, treatment strategies, and the organization of the healthcare system. In Europe, the direct and indirect costs associated with diabetic foot are estimated at approximately USD $13,500 per affected person per year. In the United Kingdom, managing this complication consumes approximately 0.6% of the National Health Service’s (NHS) total budget, reflecting its significant impact on public health systems. In the United States, direct healthcare expenditures attributable to diabetes reached USD $237 billion in 2017, nearly 30% of which corresponded to diabetic foot complications. This places the condition among those with the highest economic burdens of chronic diseases. Although evidence from low- and middle-income countries is limited, available data confirm a significant burden. For example, in Brazil, care for diabetic feet accounted for approximately 0.3% of total public health spending, with outpatient care predominating over hospital care (87%). In addition to direct medical costs, indirect costs related to transportation, lost productivity, reduced mobility, and psychological burden further amplify the overall impact [7].
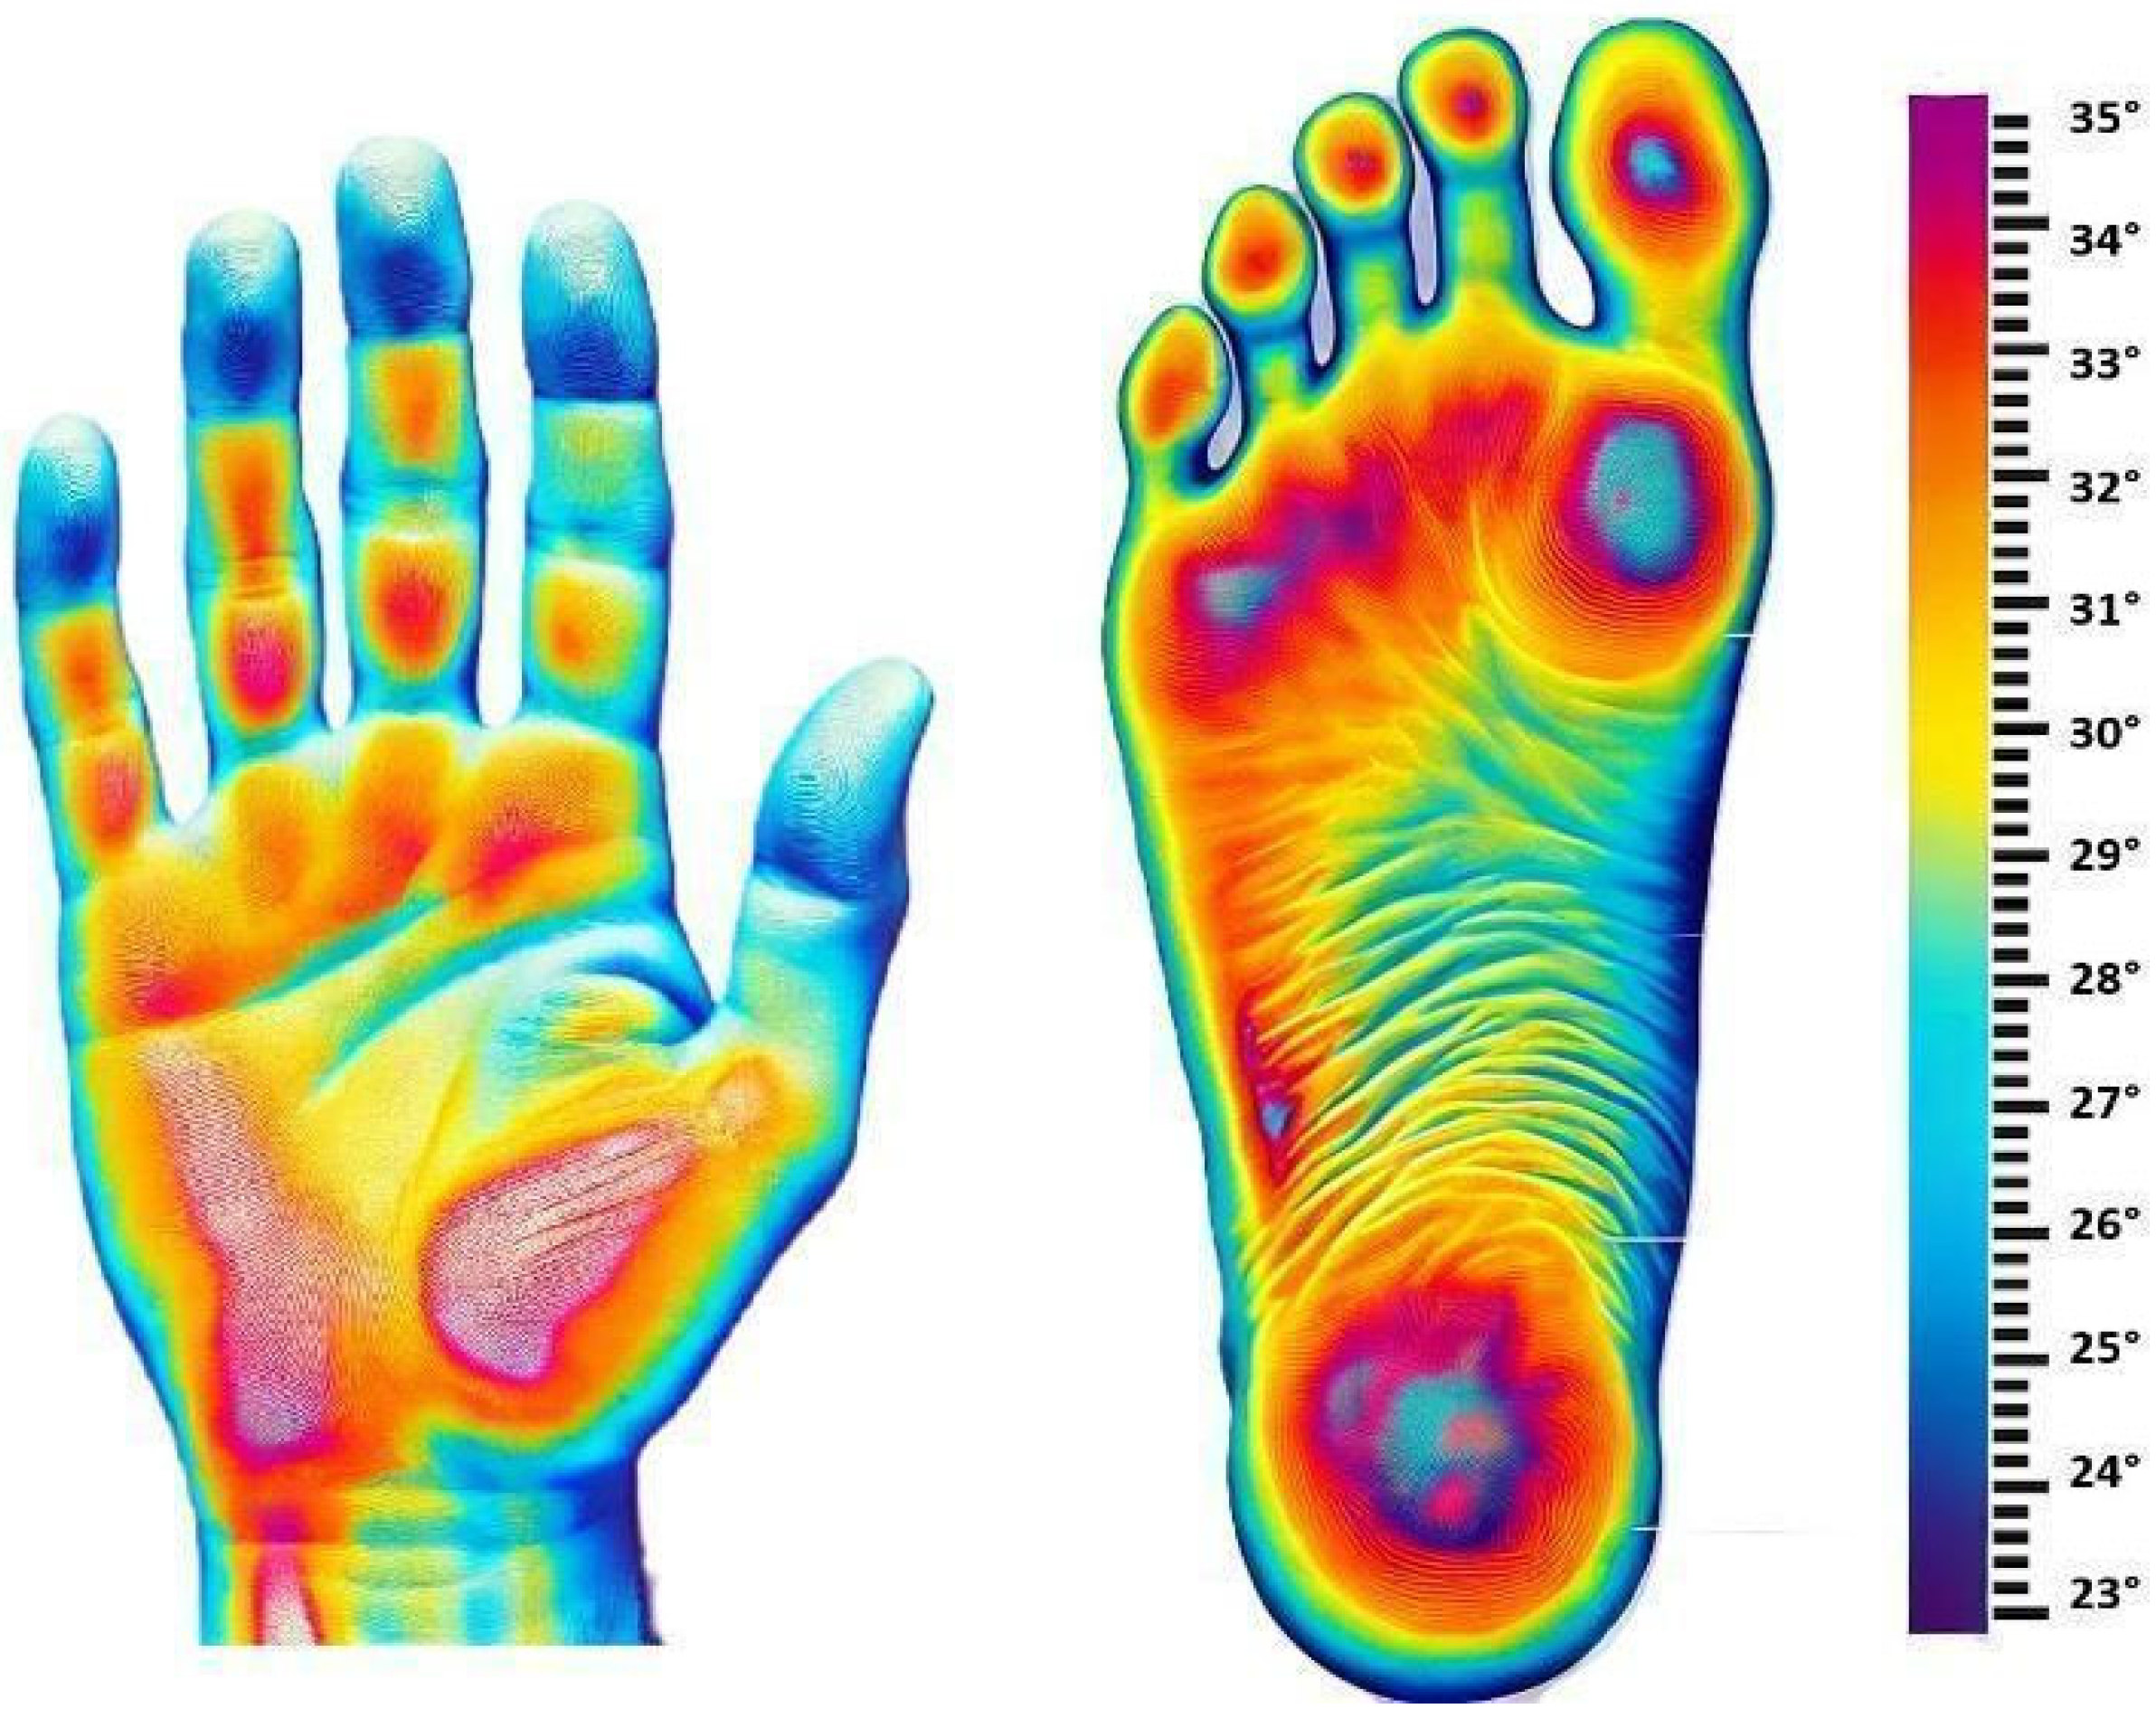
According to the Infectious Diseases Society of America (IDSA), a clinical diagnosis of a diabetic ulcer infection is made by identifying signs such as pain, redness, purulent discharge, swelling, cellulitis, abscesses, and fasciitis or osteomyelitis [8]. The traditional procedure relies entirely on the physician’s expertise, underscoring the need to integrate technological tools that enhance accuracy. For example, these tools can be used to monitor pressure loads, temperature, and glucose levels in sweat [9]. Thermal imaging cameras can be used to diagnose diabetic foot disease due to their ability to detect thermal changes early and efficiently, without invasiveness, thereby improving preventive care [10]. This is possible because the body temperature of an apparently healthy person remains within the range of 36.5–37.5 °C, which ensures proper metabolic function. Blood transfers heat from the center of the body to the extremities. However, in the feet, which are farther from the heart, temperature is influenced by factors such as blood circulation, vascular disease, physical activity, and the external environment [11]. People with diabetes and circulatory problems may have colder areas due to reduced blood flow. Similarly, when an infection or inflammation occurs in the foot, the immune system increases blood flow to the affected area, raising its temperature. This temperature increase occurs in subjects with inflammatory processes characteristic of Charcot arthropathy [12]. Physiological processes in the human body generate infrared radiation that can be detected remotely, without contact, using infrared thermography (IRT), allowing visualization of skin temperature patterns. In biomedical applications, IRT provides accurate skin-surface temperature measurements that can indicate potential pathological conditions (see Figure 2) [13].
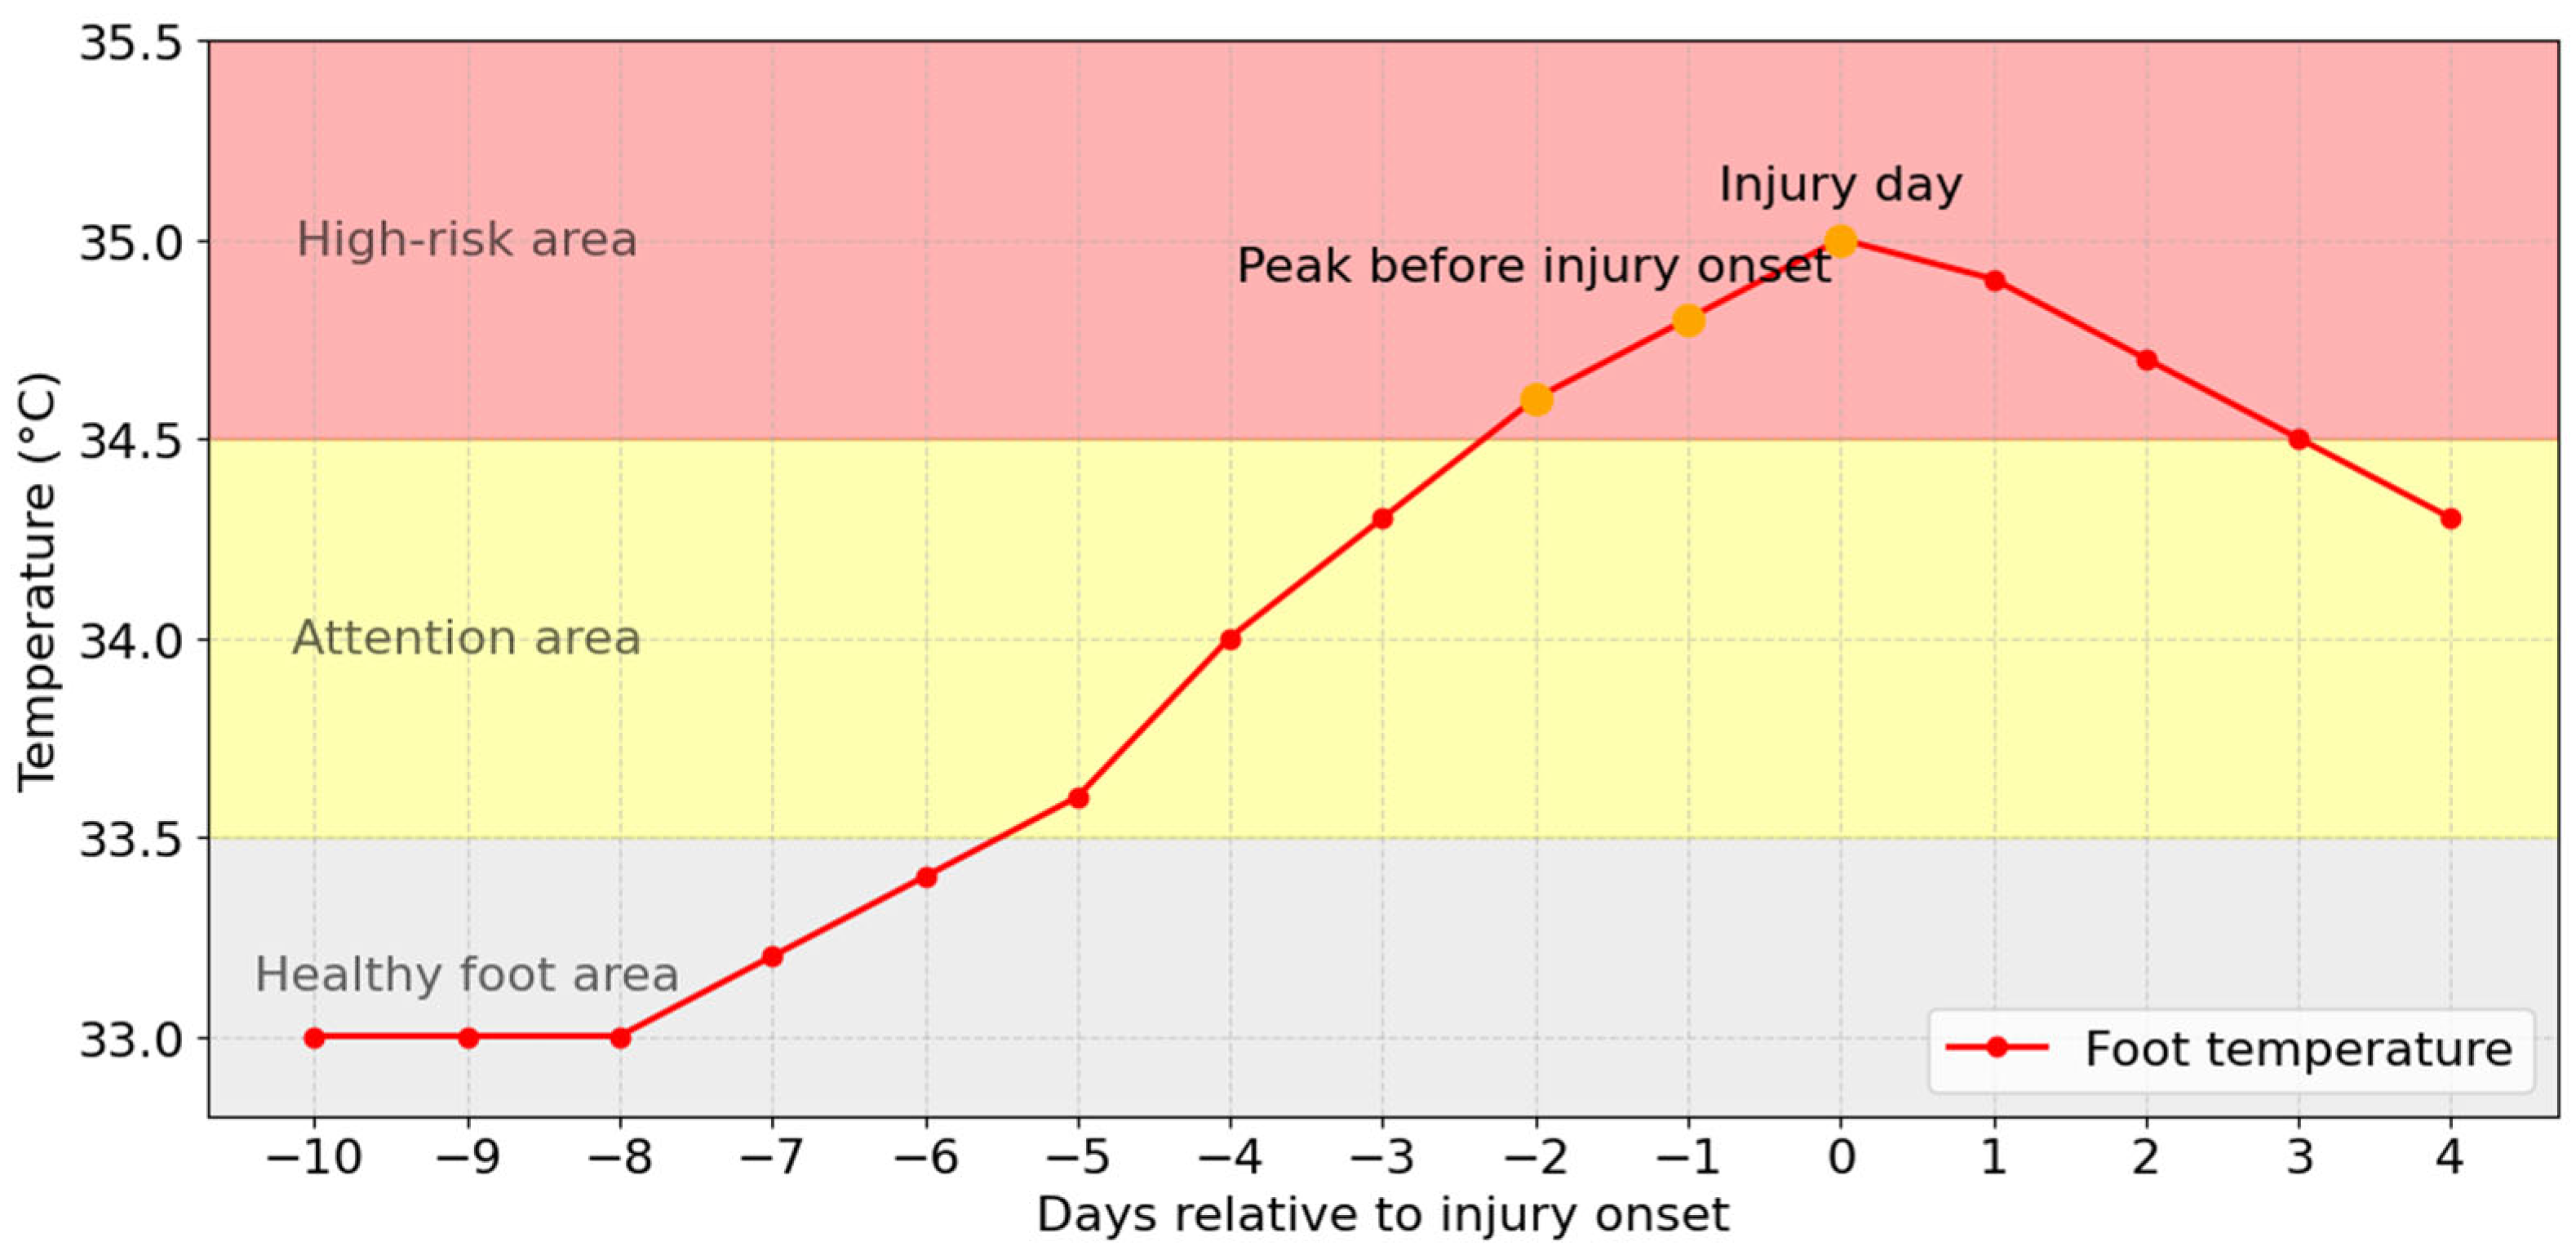
Foot temperature alone is not a clear indicator, as it can vary with age, gender, and arterial disease. However, differences in temperature at the same spots on both feet are essential. They may show issues in blood flow, nerve function, or tissue metabolism in a specific limb [14]. A temperature difference of approximately 2.2 °C between corresponding points on both feet has been reported in the literature as an indicator of increased risk of injury or inflammation. Such temperature asymmetries may be detectable up to one week before ulcer formation and are associated with early inflammatory processes related to the body’s primary immune response to microtrauma, excessive pressure, or initial tissue damage [15]. To illustrate this process, the values shown in Figure 3 are not derived from direct clinical measurements. Instead, they represent a simulated model of the inflammatory process. This model serves an illustrative purpose and contributes to the conceptual understanding of how the diabetic foot behaves when at risk. The model shows a temperature increase of approximately 1–2 °C, consistent with values reported in the literature [10,16,17]. These studies indicate that such temperature variations may occur prior to ulceration in patients with diabetic foot.
However, the utility of monitoring thermal patterns is not limited to this pathology. Thus, in recent years, increasing attention has been given to the potential clinical applications of infrared thermography beyond diabetic foot assessment. A review of the literature reveals its use across a range of medical conditions, including musculoskeletal disorders, peripheral vascular disease, neuropathies, and inflammatory or infectious processes, in which temperature asymmetries and localized thermal changes reflect alterations in perfusion, inflammation, and metabolic activity [18]. Despite this growing interest, the utilization of thermography in many medical fields remains at an early stage of development, with several challenges still to be addressed. Although infrared thermography is currently employed in various clinical scenarios, it has not yet been incorporated into diagnostic guidelines; however, it is already considered by many an alternative diagnostic tool.

1.1. Fundamentals of Infrared Thermography

Given the clinical relevance of temperature monitoring in diabetic foot disease, understanding the technical foundations of thermography is essential. Thermography is a non-invasive, non-contact method that captures heat emitted by a body as electromagnetic radiation. Modern optoelectronic systems detect and measure this radiation in the far-infrared region of the spectrum (8–14 μm), allowing us to determine the surface temperature of the object or subject being examined. Thermography can be classified as either passive or active, depending on how the thermal data is gathered. In passive thermography, temperature readings are obtained from the natural thermal contrast between the target and its surroundings without the use of an external heat source. In active thermography, a controlled thermal stimulus is added to the area of interest to detect temporary or ongoing irregularities. Under ideal conditions, the surface temperature should appear uniform. Any deviation from this pattern may suggest an anomaly [19].

1.2. Thermal Imaging Cameras

Thermal imaging cameras convert the infrared radiation emitted by an object’s surface into electrical signals that represent its temperature. These signals are processed to create thermal images, also known as thermograms. The cameras consist of four main parts: an optical system, an infrared detector, a processing unit, and a display [20]. Capturing and digitizing thermal data involves detecting infrared radiation with an infrared detector, which converts it into an electrical signal proportional to its intensity. Infrared sensors fall into two categories: cooled and uncooled. Cooled detectors use semiconductor materials like InSb, HgCdTe, and InGaAs, which are sensitive to infrared radiation. These detectors require cryogenic cooling systems to maintain low temperatures, thereby reducing thermal noise and improving measurement sensitivity, speed, and accuracy.
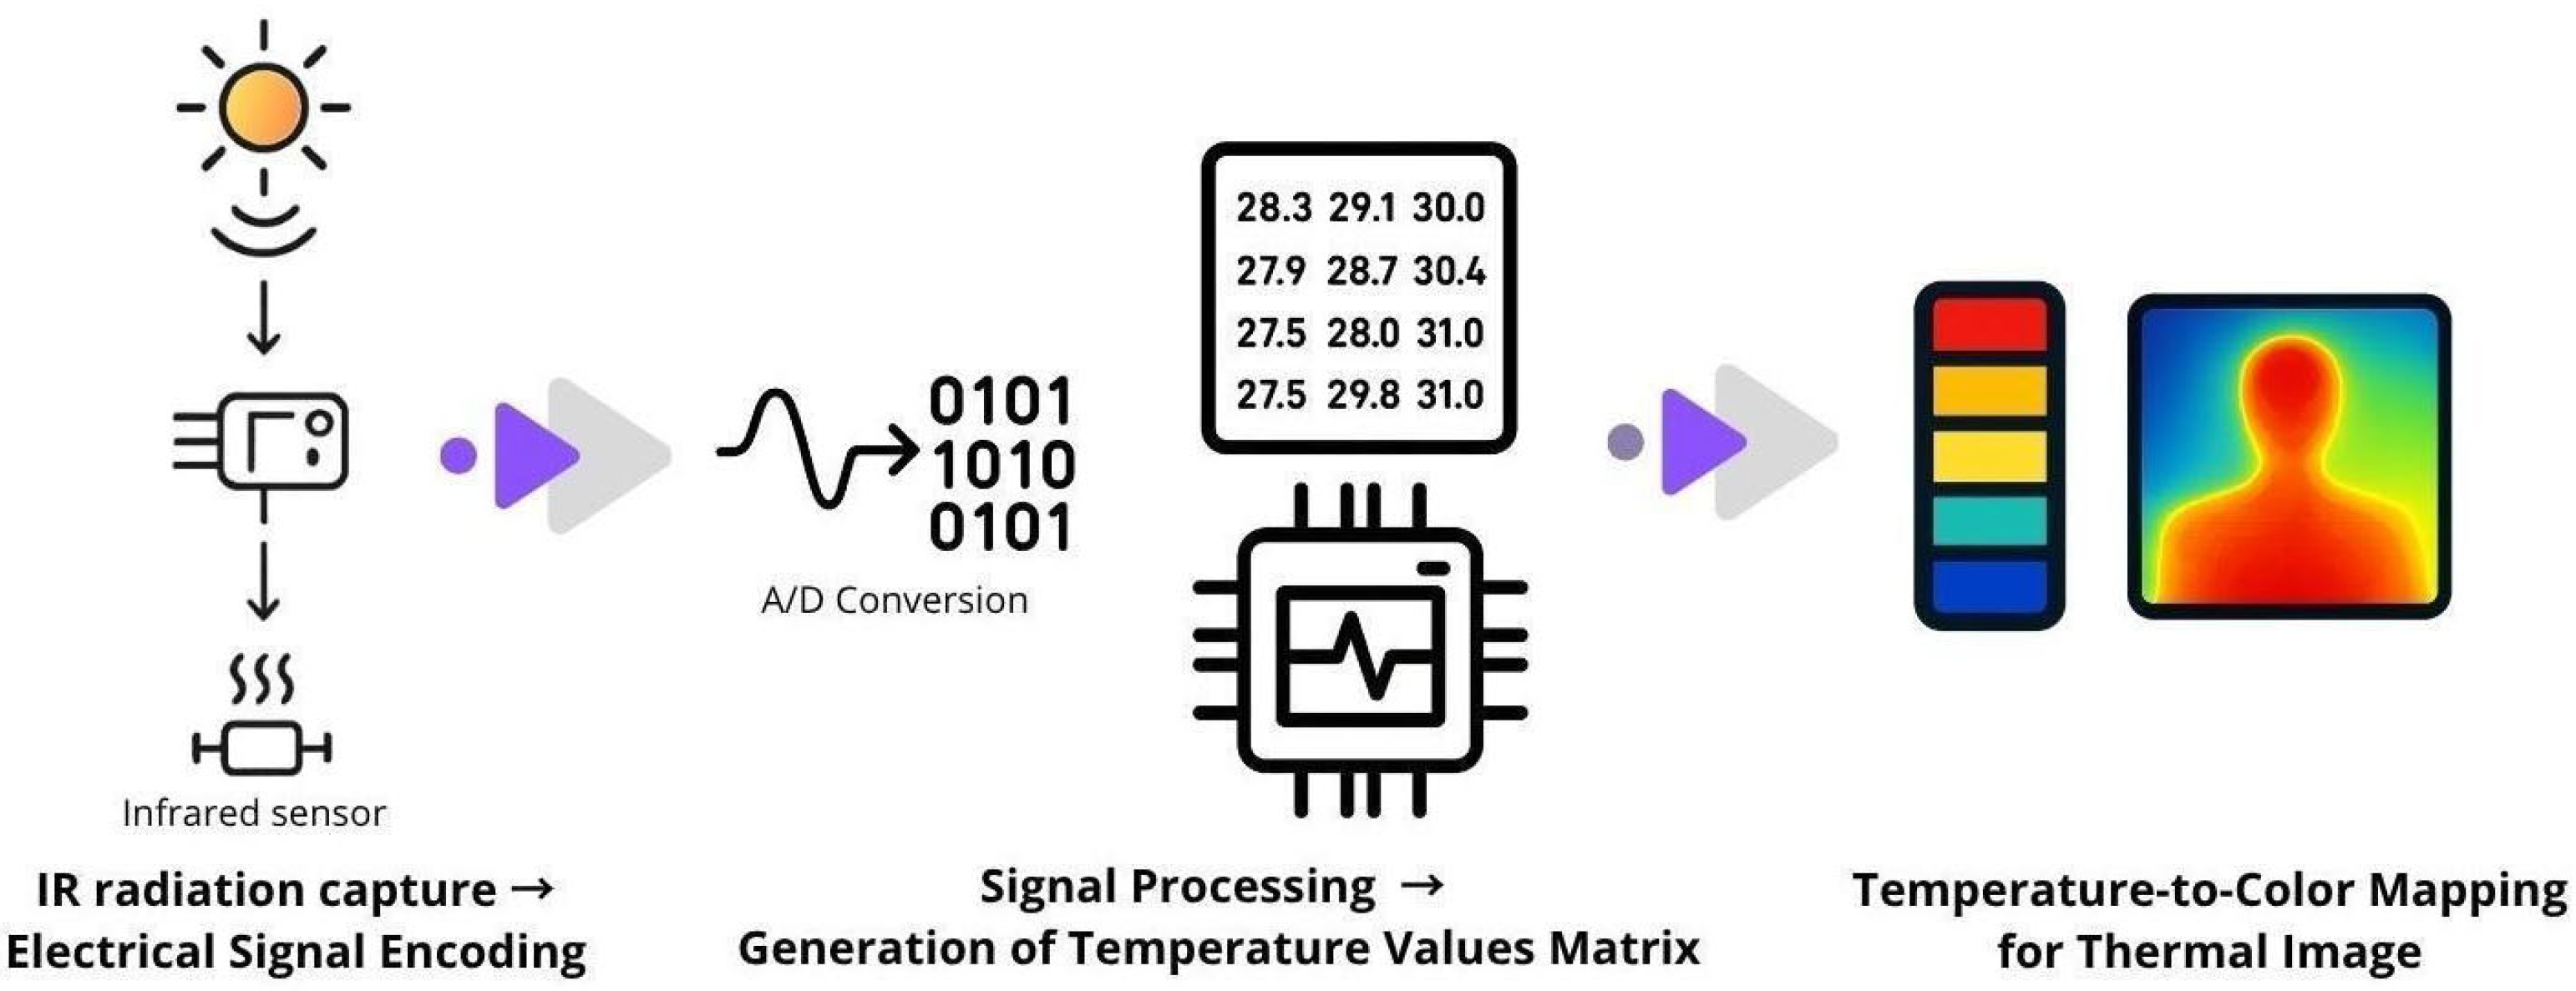
On the other hand, uncooled detectors, such as microbolometers, operate at room temperature. They detect radiation by measuring the temperature increase in an absorbent material whose electrical resistance changes in response to the radiation. Although they are less sensitive, they offer low energy consumption, lower cost, and greater portability—characteristics that make them ideal for compact cameras. The electronic system uses physical models based on Planck’s law, along with parameters such as emissivity, distance, and environmental conditions, to process and calibrate the acquired signal. The resulting values are then visually represented using a false-color scale, with each shade corresponding to a temperature range. This generates an image of the surface’s thermal distribution (see Figure 4). However, not all cameras can provide quantitative temperature information, and only radiometric cameras convert radiation into absolute temperature values per pixel, making them suitable for scientific, medical, or diagnostic applications [21].
In the medical field, selecting a thermal imaging camera depends on the detector’s ability to provide stable, accurate temperature measurements. The IEC 80601-2-59:2019 + AMD 1:2023 standard outlines the safety, performance, and radiometric accuracy requirements that thermographs used to assess human body temperature must meet (see Table 1 [22]).
The technical characteristics listed in Table 1 ensure the accuracy and reproducibility of thermal measurements. Every parameter contributes to the reliability of the capture process: emissivity, defined as the ability of a surface to emit radiation in comparison to a black body—an ideal surface that absorbs and emits all incident radiation (emissivity = 1)—allows for accurate estimation of surface temperature, considering that human skin has an average value close to 0.98 [23,24]. The ability to detect minimal temperature differences is determined by resolution and thermal sensitivity, while radiometric calibration and environmental control reduce the influence of external factors.
The objective of this narrative review is to analyze the potential of infrared thermography for the early detection of diabetic foot. It addresses the underlying technical principles, clinical applications, current limitations, and future research directions.

2. Materials and Methods

2.1. Review Design and Search Strategy

This narrative review examined the use of infrared thermography as a diagnostic or screening tool for diabetic foot complications. A comprehensive literature search was conducted in SciELO, PubMed, and Google Scholar using keywords such as “thermography,” “infrared thermography,” “diabetic foot,” “diagnosis,” and “thermal imaging,” combined with Boolean operators (AND, OR).
Google Scholar was included to capture recent publications, conference proceedings, technical reports, and studies on low-cost thermographic devices that may not be indexed in traditional databases. The search covered publications from 1956 to 2025, spanning the earliest documented uses of infrared thermography to the most recent applications in diabetic foot assessment.

2.2. Eligibility Criteria

An initial pool of 60 publications was reviewed as part of the broader research on infrared thermography and diabetic foot assessment. For this narrative review, studies were selected based on their relevance to diabetic foot detection or assessment (e.g., neuropathy, ischemia, ulceration, or Charcot foot), their methodological or technological contribution, and their relevance to early detection or low-cost applications.
Historical studies describing the early use of temperature as a diagnostic indicator were considered for contextual purposes but were not included in the core analysis. Following full-text evaluation, 10 studies were retained as representative of clinical, technological, and methodological advances in the field.
  • Inclusion criteria
  • Addressed the use of infrared thermography in the evaluation, screening, or diagnosis of diabetic foot conditions.
  • Reported original research, including experimental studies, observational studies, case series, clinical trials, or technical reports.
  • Provided measurable or descriptive outcomes related to temperature distribution, thermal patterns, ulcer risk detection, inflammation, or neuropathy-associated changes.
  • Published between 1956 and 2025.
  • Articles available in English or Spanish.
  • Exclusion criteria
Studies were excluded if thermography was applied to anatomical regions other than the foot, if the pathology was unrelated to diabetic foot complications, or if the study lacked sufficient methodological detail or relevance to early detection or clinical assessment.
Because this review is narrative in design, a formal risk-of-bias assessment using standardized tools was not performed. However, potential sources of bias were considered qualitatively during study selection. These sources of bias included selection bias from the non-systematic search, publication bias from the predominance of studies reporting positive findings, and methodological heterogeneity across imaging devices, acquisition protocols, environmental conditions, and clinical validation strategies. Studies were selected based on the clarity of their methodological descriptions, their use of validated or calibrated thermographic systems, and their relevance to clinical or technological applications in diabetic foot assessment to mitigate these risks.

2.3. Study Selection

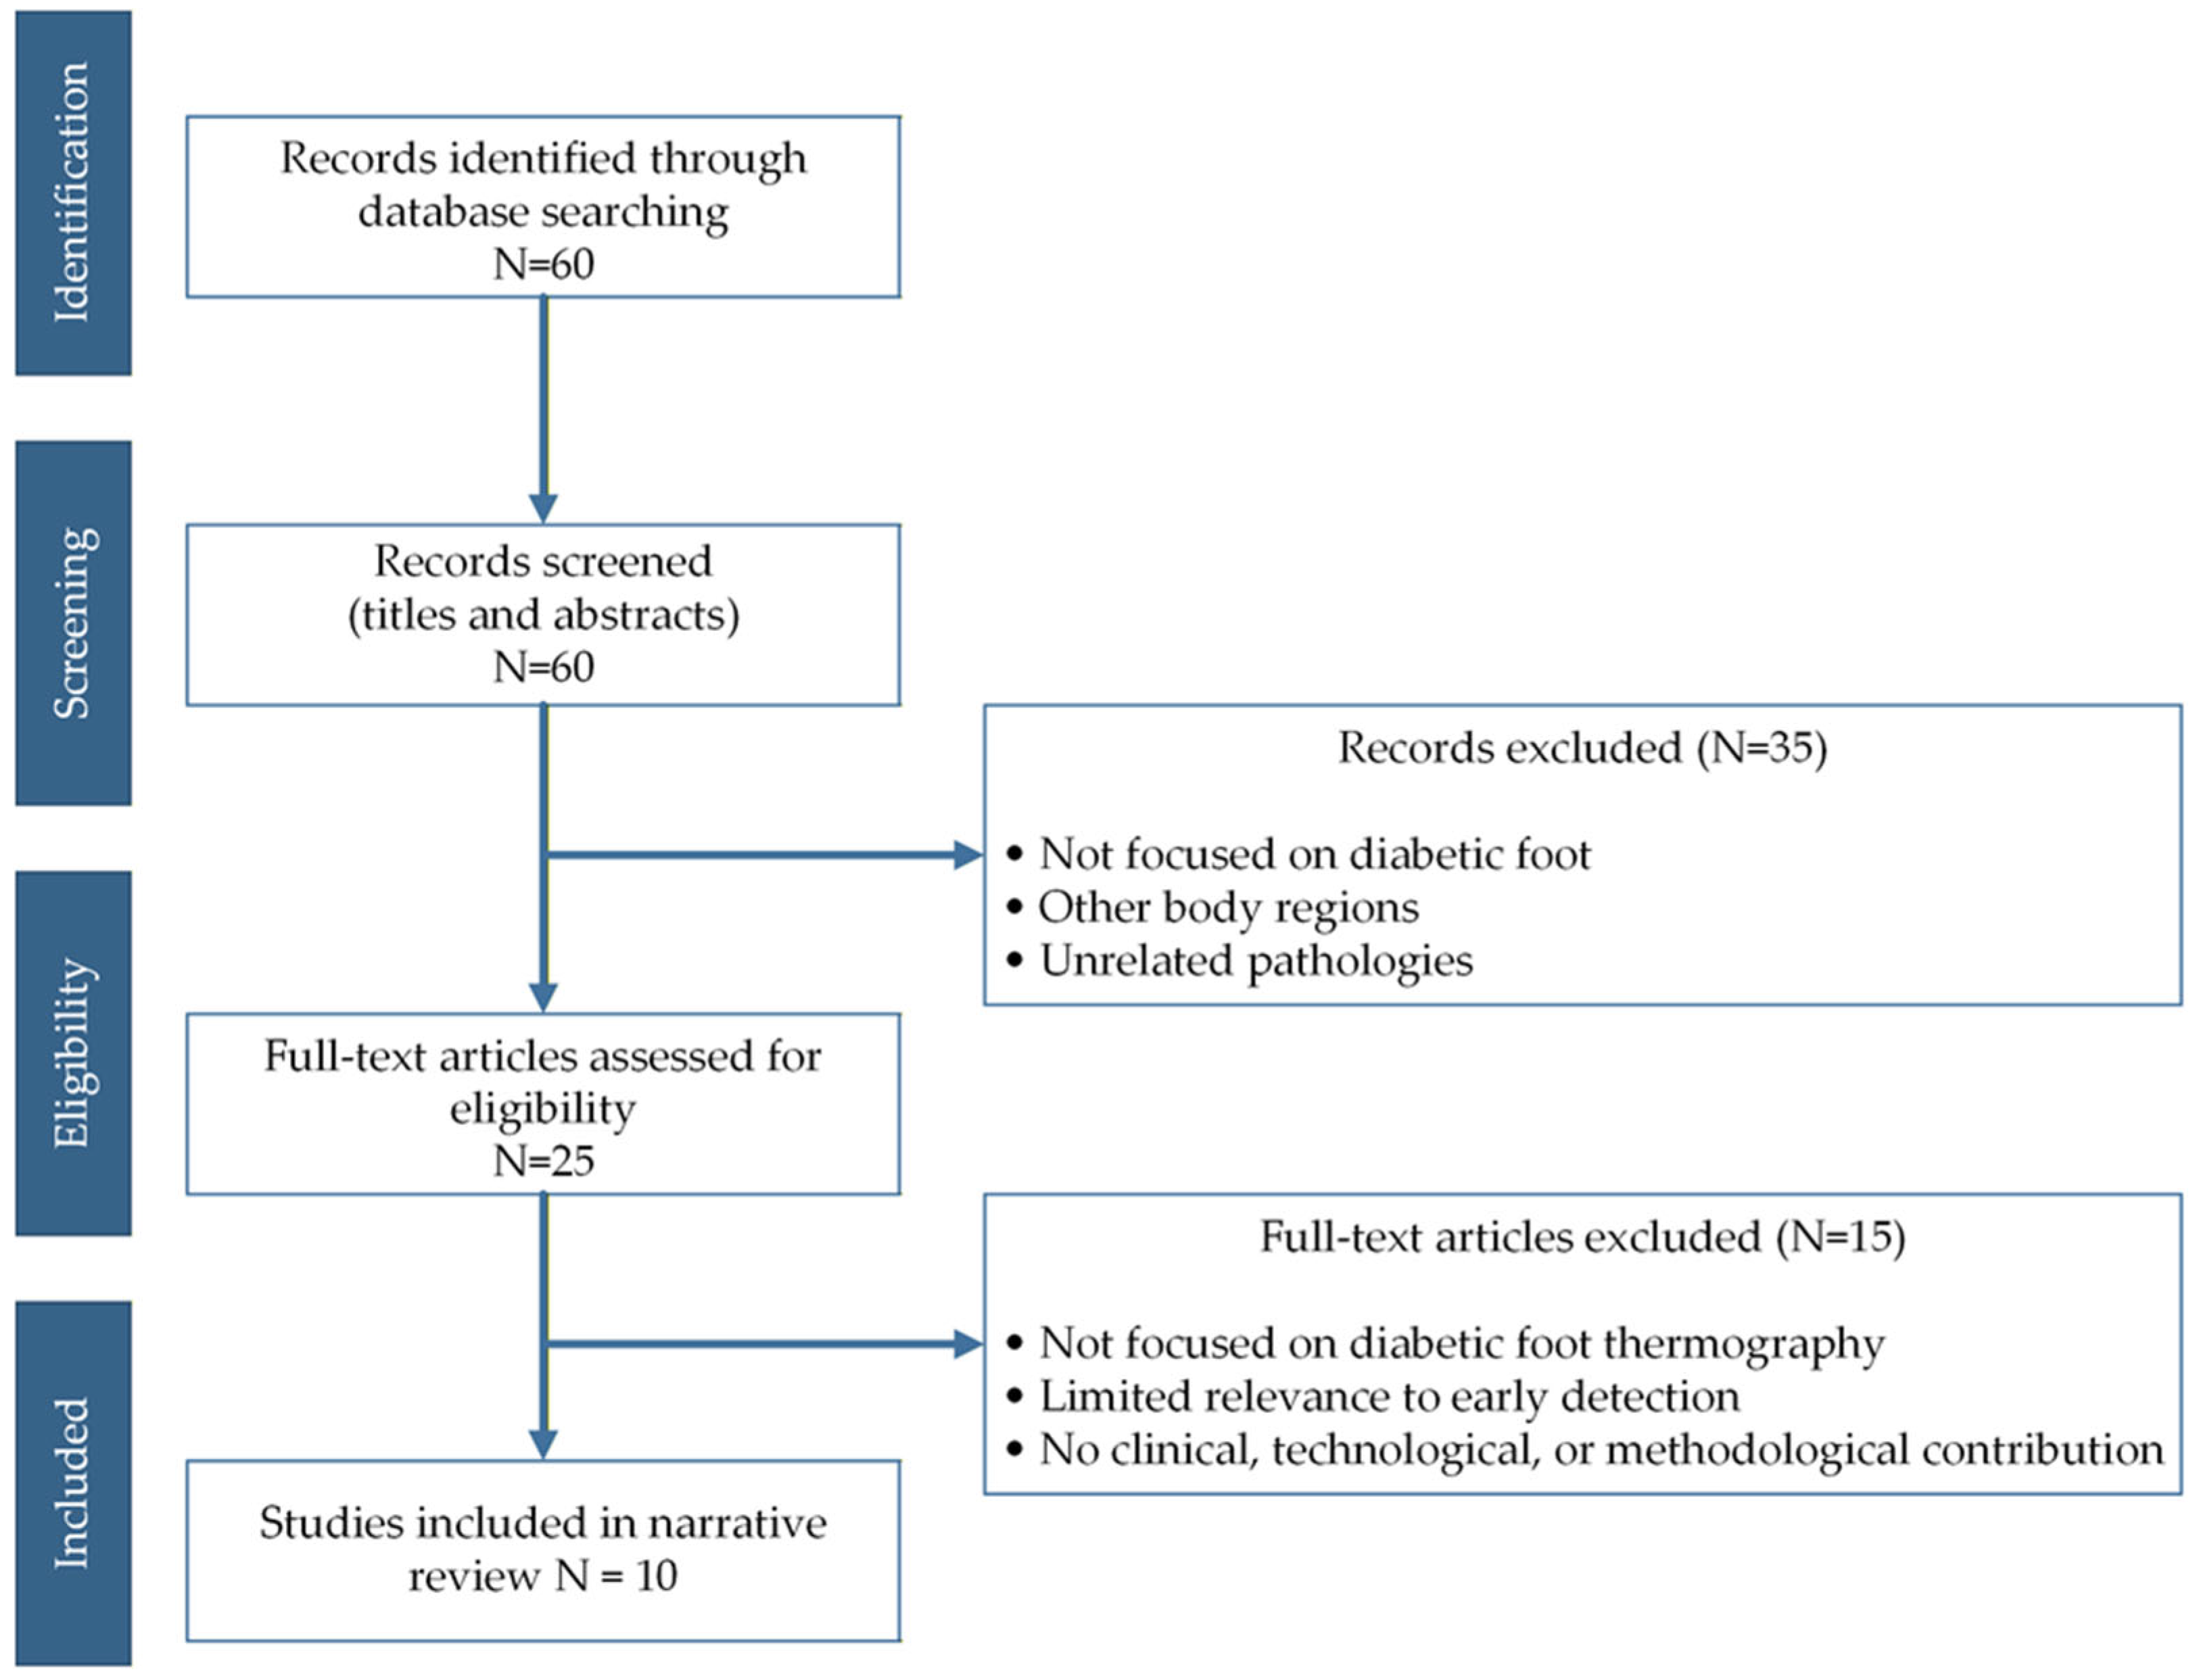
All retrieved records were screened in two stages. First, titles and abstracts were reviewed to identify studies on the use of infrared thermography to assess the diabetic foot. Then, the full texts of the articles were evaluated for relevance to the early detection, clinical evaluation, or technological approaches of diabetic foot complications (see Figure 5).
From an initial pool of 60 publications, 10 studies were selected based on relevance, clinical or technological contribution, and representation of different analytical approaches. Historical studies were included only for contextual purposes. The final set of included studies is summarized in Table 2.

3. Results and Discussion

3.1. Synthesis of Results from the Selected Studies

This section synthesizes the main findings reported in the selected studies included in this review. The results are presented descriptively, focusing on the reported applications of infrared thermography in diabetic foot assessment and on the general trends observed across the literature, as summarized in the corresponding tables.
Four key studies stand out among those reviewed for this article for the depth of their information, the methods they used, and the clinical relevance of their findings. These include the pioneering study by Benbow et al. (1994) [27], as well as more recent studies by Bayareh et al. (2018) [32], Arjela Ilo et al. (2020) [16], and Medrano-Jiménez et al. (2024) [17]. These studies provide detailed evidence on the application of thermography in the treatment of diabetic foot. A brief description of their main contributions is provided below to highlight the evolution and progress made in integrating this technique.
Benbow et al. (1994) were the first to use thermography to diagnose diabetic foot [27]. They applied contact thermography to track the average plantar temperature of diabetic patients with neuropathy over time. After an average of 3.6 years, six patients had developed neuropathic ulcers [27]. These patients had an initial average temperature of 30.5 ± 2.6 °C. This was higher than the temperature of patients who did not develop ulcers, which was 27.8 ± 2.3 °C (p < 0.01). This result shows that patients with higher temperatures are at greater risk of developing ulcers. Lavery et al. (1997) [28] used a portable infrared probe to measure temperatures over 22 months in patients with asymptomatic sensory neuropathy (n = 78), neuropathic ulcers (n = 44), or Charcot arthropathy (n = 21). The temperature difference between the affected foot and the apparently healthy foot was 4.6 °C in the Charcot group and 3.1 °C in the neuropathic ulcer group [28]. His work continued in 2004, when he conducted a second study with 85 patients with diabetes at high risk of developing diabetic foot. He assigned some patients to a standard therapy group and the others to an improved therapy group. This enhanced group included daily measurements of foot temperature and activity reduction if a difference of more than 2.2 °C was detected between the feet. The results showed that the monitored group had fewer diabetic foot complications, with a contrast of 2% versus 20% in the standard group over 6 months [29].
From the pioneering work of the late 20th century to recent studies, various investigations have explored the use of commercial thermal imaging cameras as tools for detecting and monitoring diabetic foot, validating temperature differences, and evaluating early-detection algorithms. However, many studies relied on expensive, inaccessible equipment, prompting researchers to adopt low-cost devices and portable platforms as a key strategy for early detection of complications. The studies mentioned below are distinguished precisely by this approach.
An example of this trend is the study by Bayareh et al. (2018), which developed a thermographic imaging system based on a Raspberry Pi with a FLIR Lepton sensor integrated for diabetic foot analysis [32]. This prototype captures thermal distribution and compares its performance with that of a commercial reference camera (FLIR E40). Validation was performed using reference patterns that simulated the warm and cold areas of the foot. The results showed an identification match of over 90% for the relative regions. However, the study focused on laboratory tests with simulated patterns and did not address verification in real clinical settings [32].
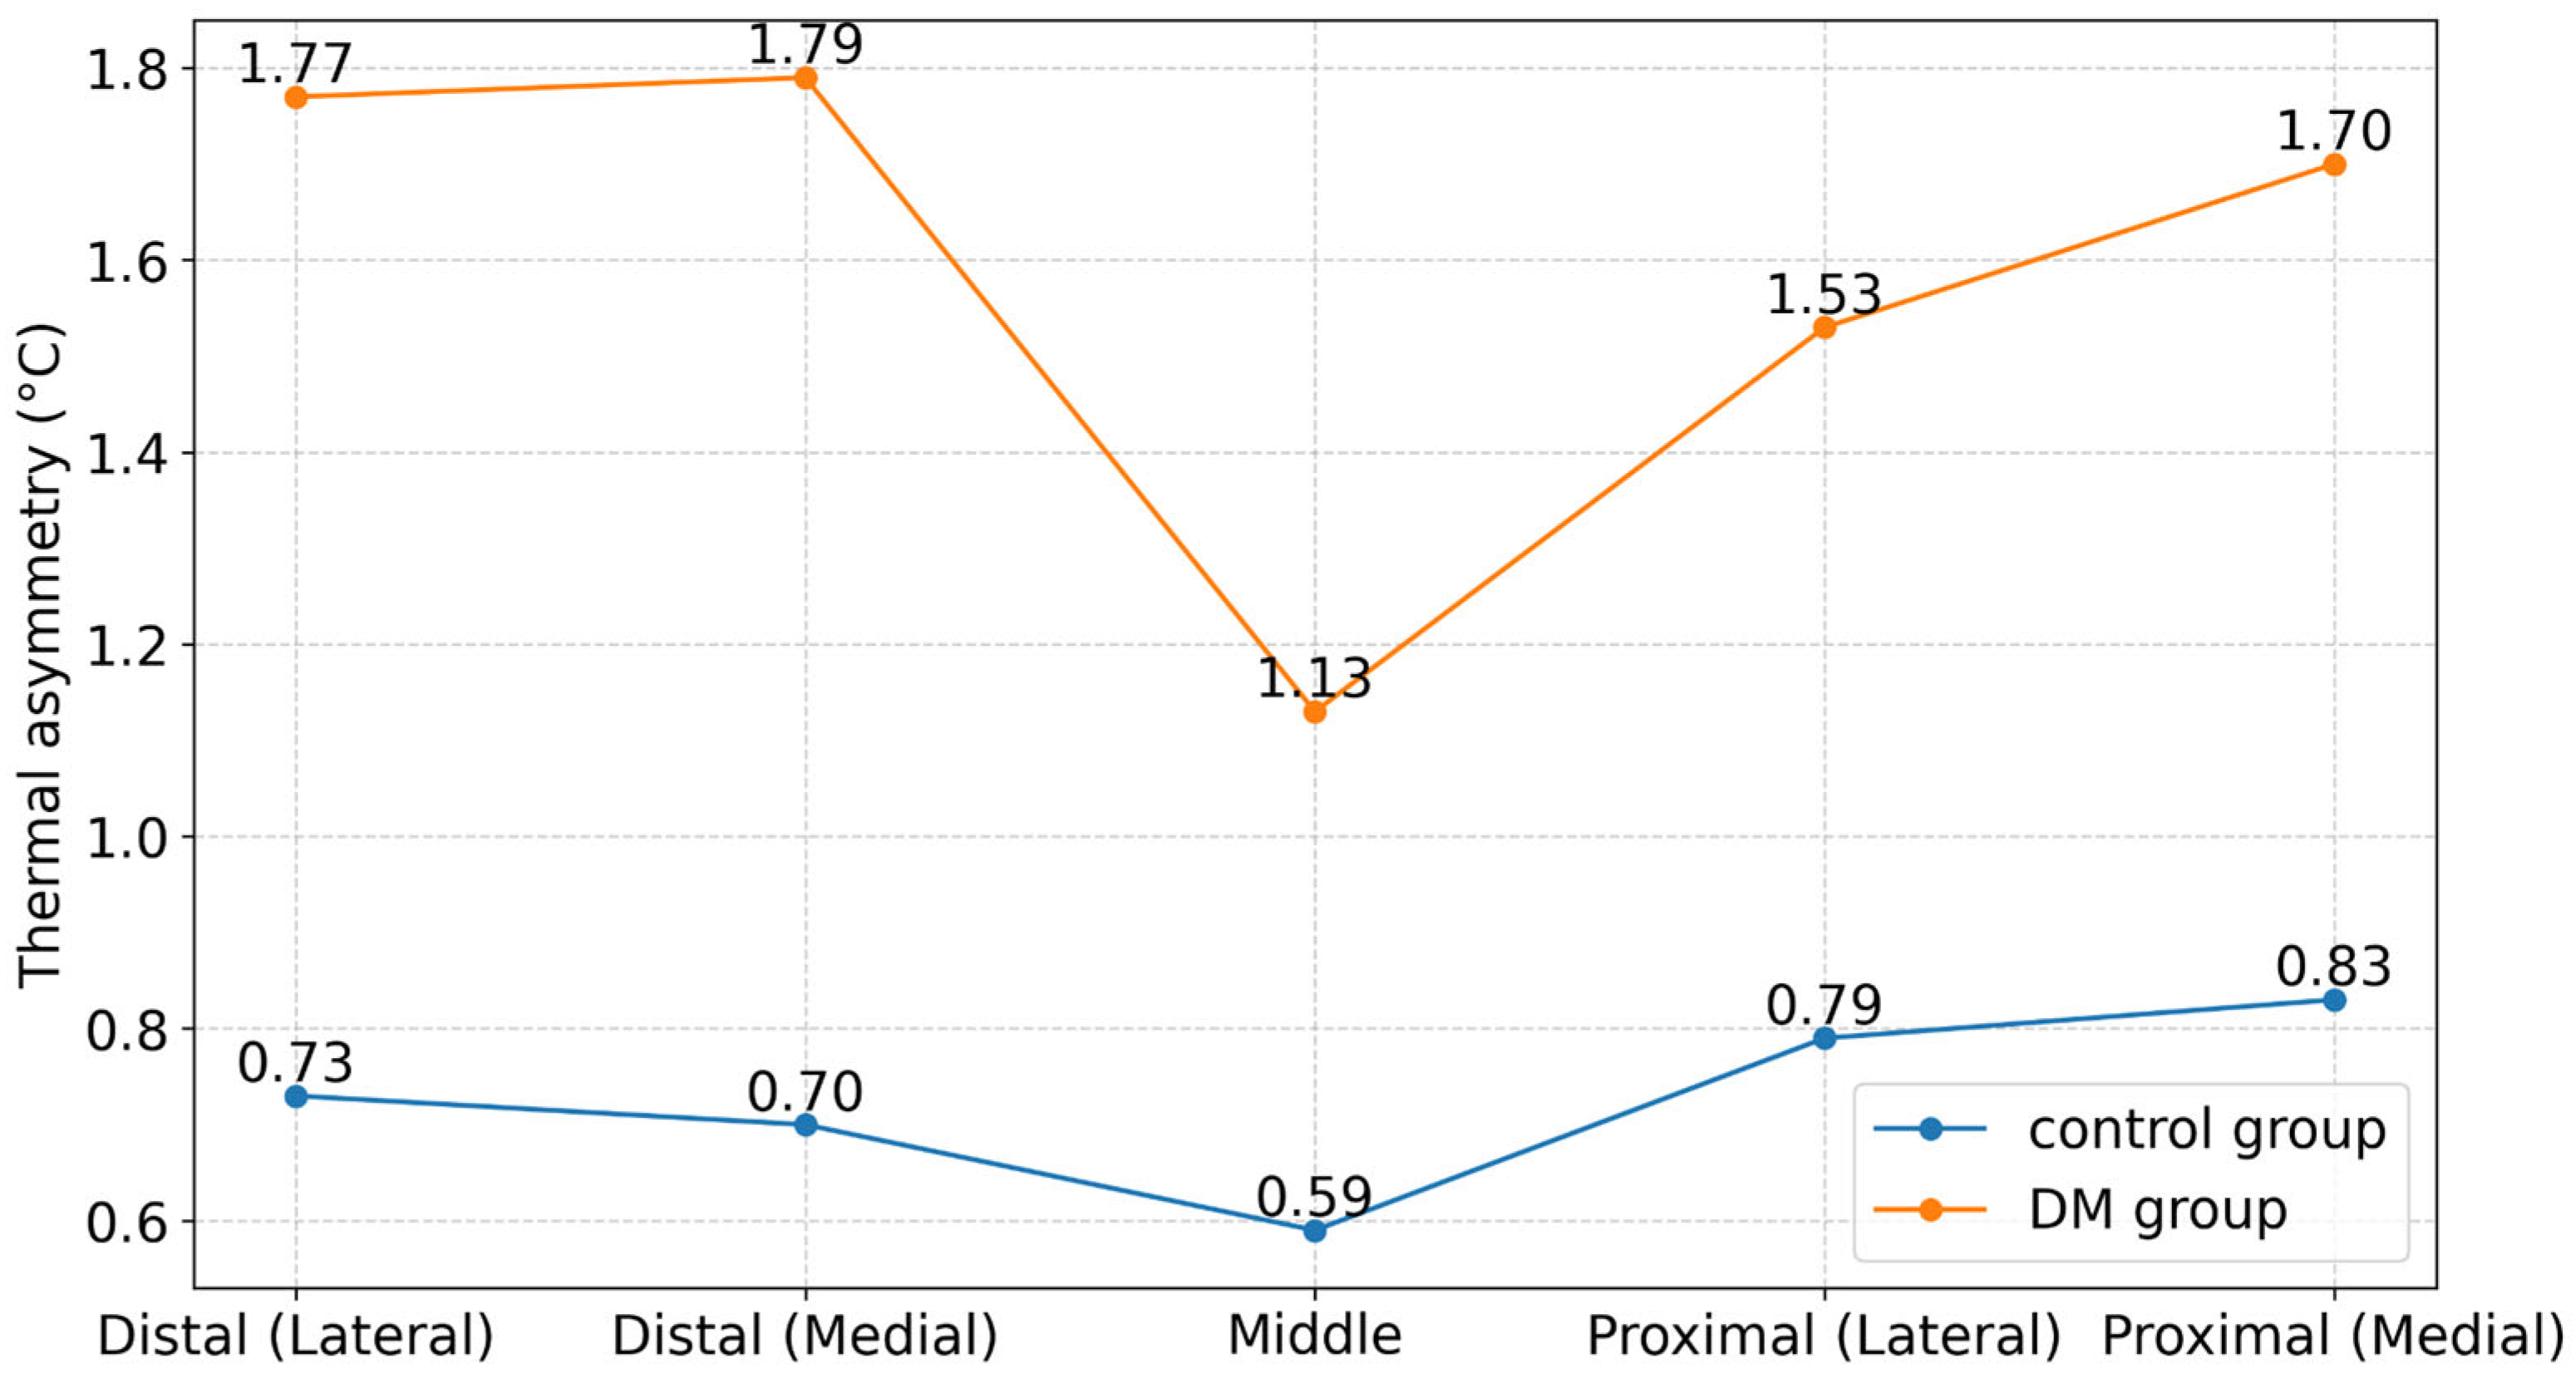
A recent study by Arjelena Ilo et al. (2020) in Finland highlighted the value of thermography [16]. Their research examined infrared thermography as a non-invasive method for detecting changes in blood vessels in the feet of diabetic patients. The researchers noted that, compared with healthy people, those with diabetes had higher overall foot temperatures and a significant difference in foot temperatures (see Figure 6). They also found clear temperature changes in areas with angiomas, early infections, and high-pressure spots on the feet [16].
Recently, Medrano-Jiménez (2024) used infrared thermography as a primary care tool for diabetic feet, evaluating its effectiveness in three scenarios: (1) suspected osteomyelitis, (2) assessment of ischemia and infection, and (3) diagnosis of symptomatic neuropathy [17]. They used an FLIR E6 camera for this study [17]. The results are shown in Table 3.
The study by Medrano-Jímenez demonstrates the efficacy of this non-invasive technique in facilitating the early identification of inflammatory, infectious, and neuropathic processes. In case 1, the system was able to differentiate between thermal asymmetry caused by plantar pressure and that caused by bone infection, as the difference when comparing the sectors was minimal. In cases 2 and 3, the temperatures obtained showed vascular and neuropathic complications, with moderate infection and risk of amputation (+2.2 °C), reduced arterial perfusion (−0.9 °C), and unilateral neuropathy with small but significant thermal differences [17].

3.2. Discussion of the Synthesized Results

3.2.1. Methodological Considerations of the Reviewed Studies

The findings of this narrative review should be interpreted in light of the several methodological limitations of the available literature. The literature search prioritized studies applying infrared thermography to diabetic foot assessment that were clinically relevant or validated, which may have limited the inclusion of works focused primarily on image processing without direct clinical correlation. Consequently, the synthesis emphasizes clinical applicability over algorithmic performance.
The reviewed studies demonstrate significant heterogeneity in terms of study design, sample size, imaging devices, acquisition protocols, and reported outcomes. This variability, together with the inconsistent reporting of diagnostic accuracy metrics (e.g., sensitivity, specificity, and predictive values), limits the comparability of the studies and prevents a quantitative synthesis or meta-analysis. Furthermore, most of the evidence originates from small-scale or exploratory studies, which restricts the generalizability of the results. Therefore, the synthesized findings should be interpreted as indicative of emerging trends rather than as definitive clinical evidence.
Finally, the simulation-based or illustrative analyses included in some studies provide methodological insights but have limited direct clinical applicability. These analyses should not be interpreted as validation of diagnostic performance.

3.2.2. Thermography Analysis for Detecting Diabetic Foot

Thermography is a non-invasive technique that captures the thermal radiation emitted by the skin, generating temperature maps of the foot surface. Among its advantages is the possibility of periodic monitoring and evaluating the progression of chronic diseases. The 2004 research by Lavery et al.showed that self-monitoring of temperature (assessing the same point on both feet) reduces the rate of ulcer occurrence. As a result of their research, the ulceration rate was 20% in subjects without self-monitoring and 2% in those with temperature monitoring [29].
There are various techniques for assessing diabetic feet, each with its own characteristics, advantages, and limitations (see Table 4). Among them is thermometry, which provides a visual analysis of the thermal distribution on the foot’s surface; however, its detection capacity is limited to specific areas.
Nevertheless, research has shown that thermography is a beneficial tool for this procedure. Thermography devices are generally less expensive to operate and non-invasive than conventional diagnostic tests, such as magnetic resonance imaging (MRI) or X-rays, used in more advanced stages, opening up the possibility of portable use and access in rural areas or clinics with limited resources. As mentioned, one of the most attractive features is the ability to transport this technology and make it easily accessible to patients; however, external environmental conditions (temperature, humidity, and/or airflow) in which the study is conducted can affect measurements. Similarly, the presence of body hair, sweat, or foot deformities can alter the results. This is why it is necessary to maintain controlled conditions in the capture environment (temperature: 21–25 °C and humidity: 60–70%) when performing a thermographic study. In addition, for accurate interpretation of thermal images, medical personnel must be trained in analyzing thermal patterns; otherwise, there is a risk of subjectively interpreting the results.

3.2.3. Why Has Thermography Not Been Validated as a Diagnostic Method?

Organizations such as the International Diabetes Federation (IDF), the Infectious Diseases Society of America (IDSA), and the American Diabetes Association (ADA) have not yet officially validated this technique. These organizations have published clinical guidelines and recommendations on diabetic foot care. In the case of the IDF, it focuses on prevention strategies, clinical evaluation, and management of diabetic foot through systematic examinations, patient education, risk classification, and timely care of ulcers or infections. However, these documents do not mention thermography as a diagnostic tool [35]. The 2023 IWGDF/IDSA Guidelines on Diabetic Foot clearly state that foot temperature—regardless of the method used, including thermography—is not recommended for diagnosing soft tissue infections in people with diabetes, due to a lack of robust evidence supporting its clinical effectiveness [8]. However, studies have shown that infrared thermography has physiological foundations and initial results that suggest its potential as an auxiliary tool for the early detection of complications in the diabetic foot [10,16].
Nevertheless, this evidence is insufficient to justify its adoption as a validated diagnostic test. A recent example is the study by Rodríguez-Alonso et al. (2023) [10], which evaluated the accuracy of thermographic imaging compared to the standard test proposed by the IDSA. Although an accuracy of over 90% was reported in diagnosing infections in diabetic ulcers, the authors emphasized that a single image is insufficient to establish a definitive diagnosis and that thermography should be used only as a complement to other clinical methods, not as the primary tool [10]. Similarly, the ADA, in its Standards of Care in Diabetes—2025, Section 12 (Foot Care), does not include thermography as a diagnostic tool; it recommends only visual inspection, sensitivity testing, peripheral pulse palpation, and ankle-brachial index measurement [36].
In the literature, the factors most frequently cited as calling into question the reliability of this technique include the influence of external factors such as ambient temperature, device calibration, and patient conditions, as well as the lack of consensus on measurement protocols [30,31]. Indeed, the lack of standardization in the processes for acquiring and analyzing thermographic images used in research is a significant factor in validating this technique. This is due to variability in the number of samples used, which, in many cases, are too small to yield solid conclusions. In addition, image interpretation is a significant limitation, as the identification of thermal patterns depends on the physician’s training and experience, resulting in subjective outcomes.

3.2.4. Required Elements for Clinical Validation

Clinical validation is a fundamental process for ensuring the reliability and usefulness of a medical device or method. It involves a rigorous evaluation of performance under real conditions to ensure accurate, reproducible, and clinically relevant results. Diagnosing diabetic foot using infrared thermography is far from achieving clinical validation. The main aspects requiring further development and research are:
(i) 
Standardization of protocols
To ensure reproducible measurements, it is necessary to define the conditions under which images will be captured. This includes parameters such as ambient temperature and humidity; the patient’s acclimatization or rest time; and the patient’s position and the camera’s location (distance and angle). Specific camera settings, such as emissivity, resolution, and capture frequency, should also be standardized. Additionally, the process of interpreting and comparing thermographic images should be standardized by creating training programs for healthcare professionals. A priority task is identifying and validating specific temperature ranges that indicate a risk of ulceration, infection, or ischemia, and correlating them with other clinical and metabolic factors.
(ii) 
Validation through large-scale clinical studies
Expanding the number of studies and including a larger patient population would yield more consistent results and demonstrate the technology’s effectiveness across broader groups. This research should compare thermography with standard diagnostic methods to evaluate its accuracy, sensitivity, and specificity. Clinical trials are necessary to confirm that the technology works reliably in real-world settings. Therefore, these evaluations should take place in hospitals or clinics under the supervision of healthcare professionals. Additionally, the thermography systems used must meet international medical device standards and regulations. Once these criteria are met, regulatory approval for clinical use is required, along with institutional acceptance and compliance with global regulations.

3.2.5. The Outlook for the Future and Advancements in Technology

Although thermography has not been formally validated, scientists are interested in developing systems that use this technique to detect and track diabetic foot conditions. Adding artificial intelligence (AI) offers a promising way to improve image interpretation and reduce variability in assessments. For instance, the Complutense University of Madrid, in collaboration with the technology-based initiative ClinicGram, is developing an application that combines patients’ clinical information with thermographic images of the feet to identify risks associated with diabetic neuropathy and peripheral arterial disease [37]. Similarly, a Brazilian technology-based research initiative supported by the FAPESP Innovative Research in Small Businesses Program (PIPE) has applied machine learning methods to predict foot-related complications, reporting that an initial prototype achieved over 85% accuracy in identifying high-risk cases [38].
Recent research has explored a wide range of machine learning and deep learning methods, including Support Vector Machines (SVMs), Random Forests, and pre-trained CNNs such as VGG-19 and DenseNet50, applied to diabetic foot thermograms. These techniques have laid the groundwork for efficient segmentation of the plantar region and image classification [39,40]. Building on these foundations, research between 2024 and 2026 has shifted toward more sophisticated deep learning architectures, including Swin Transformers, which have demonstrated improved spatial sensitivity and finer discrimination of thermal risk patterns. In parallel, portable AI-assisted systems for home-based monitoring have been explored and preliminarily validated in multicenter or multi-site studies, suggesting their feasibility for continuous risk surveillance. Recent specialized analyses report high diagnostic performance for detecting subtle thermal alterations associated with peripheral neuropathy, with accuracy values approaching 95% under controlled conditions. Collectively, these developments reflect a clear effort to enhance diagnostic reliability and support proactive care without replacing clinical judgment, while clearly underscoring that the international medical community has yet to converge on standardized clinical validation frameworks [41,42,43].
Looking ahead, the integration of AI with embedded and portable devices represents a promising pathway toward scalable and accessible tools for continuous monitoring and early risk detection. Deep learning algorithms have the potential to systematically analyze temperature asymmetries associated with inflammation, infection, and circulatory compromise, enabling region-of-interest identification and clinically informed thermal pattern classification. Crucially, these systems are intended to supplement—rather than replace—professional clinical assessment by supporting more informed and individualized disease monitoring. Their successful evolution will depend on the availability of large and diverse datasets, standardized acquisition procedures, rigorous data conditioning, and sustained clinical oversight to ensure reliability and reproducibility. In parallel, safeguarding sensitive patient information will remain essential, requiring robust anonymization strategies, controlled data access, and encryption mechanisms.

4. Conclusions

The reviewed evidence suggests that infrared thermography is a promising, non-invasive technique for supporting diabetic foot assessment by identifying thermal patterns associated with altered blood circulation and inflammatory processes. Current findings generally demonstrate its value as an auxiliary tool for early detection, screening, and longitudinal clinical monitoring in primary care rather than as a standalone diagnostic method. From a clinical perspective, infrared thermography is particularly well-suited for identifying patients who may require closer monitoring or referral to specialized care. In contrast, in specialized clinical settings, its role is supplementary and dependent on correlation with established diagnostic methods and clinical judgment.
Despite its potential, the clinical adoption of infrared thermography is limited by methodological heterogeneity, small sample sizes, and the absence of standardized acquisition and interpretation protocols. These limitations underscore the need for cautious interpretation of current results and demonstrate that existing evidence reflects an evolving field rather than definitive clinical validation.
Future research should prioritize the following: large-scale, multicenter clinical studies; the standardization of acquisition protocols and diagnostic criteria; and the systematic evaluation of performance metrics across diverse patient populations. To achieve these objectives, close multidisciplinary collaboration among engineers, data scientists, and clinical experts is required. This collaboration is necessary to ensure that technological developments address clinically meaningful questions and integrate seamlessly into existing clinical workflows. Promising research directions include integrating infrared thermography with machine learning approaches and extending its application to home or remote monitoring scenarios. However, clinical implementation should only be pursued after robust validation and regulatory acceptance.

Author Contributions

Conceptualization, T.I.M.-R., D.R.-R. and A.E.-V.; investigation, T.I.M.-R.; writing—original draft preparation, T.I.M.-R.; writing—review and editing, T.I.M.-R., D.R.-R. and A.E.-V.; visualization, T.I.M.-R., D.R.-R. and A.E.-V.; supervision, D.R.-R.; project administration, A.E.-V. All authors have read and agreed to the published version of the manuscript.

Funding

This research received no external funding.

Institutional Review Board Statement

Not applicable.

Informed Consent Statement

Not applicable.

Data Availability Statement

No new data were created or analyzed in this study.

Conflicts of Interest

The authors declare no conflicts of interest. They have no personal circumstances or interests that could be perceived as inappropriately influencing the presentation of the research results.

Abbreviations

The following abbreviations are used in this manuscript:
IDSAInternational Diabetes Federation
DMDiabetes Mellitus
IRTInfrared Thermography
ENSANUTNational Health and Nutrition Survey
SVEHDMT2Hospital Epidemiological Surveillance System for Type II Diabetes Mellitus
SVMsSupport Vector Machines
CNNsConvolutional Neural Networks
AIArtificial Intelligence
ADAAmerican Diabetes Association
IDFInternational Diabetes Federation

References

  1. Diabetes. Available online: https://www.who.int/news-room/fact-sheets/detail/diabetes (accessed on 9 September 2025).
  2. Wild, D.B.; Wilding, J.P.H. Glucose metabolism and the pathophysiology of diabetes mellitus. In Clinical Biochemistry: Metabolic and Clinical Aspects, 3rd ed.; Marshall, W.J., Lapsley, M., Day, A.P., Ayling, R.M., Eds.; Elsevier: Amsterdam, The Netherlands, 2014; pp. 529–549. [Google Scholar] [CrossRef] [Scilit]
  3. International Diabetes Federation. Age-Adjusted Comparative Prevalence of Diabetes (20–79 years). 2025. Available online: https://diabetesatlas.org/es/data-by-indicator/diabetes-estimates-20-79-y/age-adjusted-comparative-prevalence-of-diabetes/ (accessed on 9 September 2025).
  4. Hall, J.E. Guyton and Hall Textbook of Medical Physiology, 14th ed.; Elsevier: Philadelphia, PA, USA, 2021. [Google Scholar]
  5. IDF Diabetes Atlas. Available online: https://diabetesatlas.org/media/uploads/sites/3/2025/04/IDF_Atlas_11th_Edition_2025.pdf (accessed on 9 September 2025).
  6. Zhang, P.; Lu, J.; Jing, Y.; Tang, S.; Zhu, D.; Bi, Y. Global epidemiology of diabetic foot ulceration: A systematic review and meta-analysis. Ann. Med. 2017, 49, 106–116. [Google Scholar] [CrossRef] [Scilit] [PubMed]
  7. Waibel, F.W.A.; Uçkay, I.; Soldevila-Boixader, L.; Sydler, C.; Gariani, K. Current knowledge on morbidities and direct costs related to diabetic foot disorders: A literature review. Front. Endocrinol. 2023, 14, 1323315. [Google Scholar] [CrossRef] [Scilit]
  8. Senneville, É.; Albalawi, Z.; van Asten, S.A.; Abbas, Z.G.; Allison, G.; Aragón-Sánchez, J.; Embil, J.M.; Lavery, L.A.; Alhasan, M.; Oz, O.; et al. IWGDF/IDSA Guidelines on the Diagnosis and Treatment of Diabetes-related Foot Infections (IWGDF/IDSA 2023). Clin. Infect. Dis. 2023, 77, ciad527. [Google Scholar] [CrossRef] [Scilit]
  9. De Pascali, C.; Francioso, L.; Giampetruzzi, L.; Rescio, G.; Signore, M.A.; Leone, A.; Cicala, G.; Di Bari, V.; Bifulco, P.; Fortunato, G.; et al. Modeling, Fabrication and Integration of Wearable Smart Sensors in a Monitoring Platform for Diabetic Patients. Sensors 2021, 21, 1847. [Google Scholar] [CrossRef] [Scilit]
  10. Rodriguez-Alonso, D.; Benites Castillo, S.; Milly Otiniano, N.; Chian Garcia, A. Termografía infrarroja una herramienta exacta para detectar infecciones en úlceras diabéticas. Rev. Bionatura 2023, 8, 58–64. [Google Scholar] [CrossRef] [Scilit]
  11. Hall, J.E. Energetics and metabolic rate. In Guyton and Hall Textbook of Medical Physiology, 14th ed.; Elsevier: Philadelphia, PA, USA, 2021; pp. 893–900. [Google Scholar]
  12. León-Pedroza, J.I.; González-Tapia, L.A.; del Olmo-Gil, E.; Castellanos-Rodríguez, D.; Escobedo, G.; González-Chávez, A. Inflamación sistémica de grado bajo y su relación con el desarrollo de enfermedades metabólicas: De la evidencia molecular a la aplicación clínica. Cir. Cir. 2015, 83, 543–551. [Google Scholar] [CrossRef] [Scilit] [PubMed]
  13. Ramírez-Arbeláez, L.M.; Jiménez-Díaz, K.T.; Correa-Castañeda, A.C.; Giraldo-Restrepo, J.A.; Fandiño-Toro, H.A. Protocolo de adquisición de imágenes diagnósticas por termografía infrarroja. Med. Lab. 2015, 21, 161–178. [Google Scholar] [CrossRef] [Scilit]
  14. Bus, S.A. Innovations in plantar pressure and foot temperature measurements in diabetes. Diabetes Metab. Res. Rev. 2016, 32, 221–227. [Google Scholar] [CrossRef] [Scilit]
  15. Abbas, A.K.; Lichtman, A.H.; Pillai, S.; Henrickson, S. Overview of the immune system. In Cellular and Molecular Immunology, 11th ed.; Elsevier: Philadelphia, PA, USA, 2025; pp. 3–18. [Google Scholar]
  16. Ilo, A.; Romsi, P.; Mäkelä, J. Infrared thermography and vascular disorders in diabetic feet. J. Diabetes Sci. Technol. 2020, 14, 28–36. [Google Scholar] [CrossRef] [Scilit]
  17. Medrano-Jiménez, R.; del Mar Gili-Riu, M.; Millán-Abella, J.; Delcor-Pérez, C.; Bonet-Ivars, V.; Parralo-Paqué, R. Viabilidad de la termografía infrarroja en pacientes con diabetes. Serie de casos en atención primaria. Gerokomos 2024, 35, 136–140. [Google Scholar]
  18. Liu, Q.; Li, M.; Wang, W.; Jin, S.; Piao, H.; Jiang, Y.; Li, N.; Yao, H. Infrared thermography in clinical practice: A literature review. Eur. J. Med. Res. 2025, 30, 33. [Google Scholar] [CrossRef] [Scilit]
  19. Vollmer, M.; Möllmann, K.-P. Chapter 2: Physics of thermal radiation. In Infrared Thermal Imaging: Fundamentals, Research and Applications, 2nd ed.; Vollmer, M., Möllmann, K.-P., Eds.; Wiley-VCH: Weinheim, Germany, 2017; pp. 25–72. [Google Scholar]
  20. Hou, F.; Zhang, Y.; Zhou, Y.; Zhang, M.; Lv, B.; Wu, J. Review on infrared imaging technology. Sustainability 2022, 14, 11161. [Google Scholar] [CrossRef] [Scilit]
  21. Usamentiaga, R.; Venegas, P.; Guerediaga, J.; Vega, L.; Molleda, J.; Bulnes, F.G. Infrared Thermography for Temperature Measurement and Non-Destructive Testing. Sensors 2014, 14, 12305–12348. [Google Scholar] [CrossRef] [Scilit] [PubMed]
  22. IEC 80601-2-59:2017 + AMD1:2023; Medical Electrical Equipment—Part 2-59: Particular Requirements for the Basic Safety and Essential Performance of Screening Thermographs for Human Febrile Temperature Screening. IEC: Geneva, Switzerland, 2023.
  23. Ring, E.F.J.; Ammer, K. Infrared thermal imaging in medicine. Physiol. Meas. 2012, 33, R33–R46. [Google Scholar] [CrossRef] [Scilit]
  24. Steketee, J. Spectral emissivity of skin and pericardium. Phys. Med. Biol. 1973, 18, 686–694. [Google Scholar] [CrossRef] [Scilit]
  25. Lawson, R. Implications of surface temperatures in the diagnosis of breast cancer. Can. Med. Assoc. J. 1956, 75, 309–311. [Google Scholar]
  26. Lawson, R. Thermography; a new tool in the investigation of breast lesions. Can. Serv. Med. J. 1957, 8, 517–524. [Google Scholar] [PubMed]
  27. Benbow, S.J.; Chan, I.M.C.; Bowsher, A.A.; Williams, I.S.; MacFarlane, J.D.; Tesfaye, S.A. The Prediction of Diabetic Neuropathic Plantar Foot Ulceration by Liquid-Crystal Contact Thermography. Diabetes Care 1994, 17, 835–839. [Google Scholar] [CrossRef] [Scilit]
  28. Armstrong, D.G.; Lavery, L.A.; Liswood, P.J.; Todd, W.F.; Tredwell, J.A. Infrared Dermal Thermometry for the High-Risk Diabetic Foot. Phys. Ther. 1997, 77, 169–175. [Google Scholar] [CrossRef] [Scilit]
  29. Lavery, L.A.; Higgins, K.R.; Lanctot, D.R.; Constantinides, G.P.; Zamorano, R.G.; Armstrong, D.G.; Athanasiou, K.A.; Agrawal, C.M. Home Monitoring of Foot Skin Temperatures to Prevent Ulceration. Diabetes Care 2004, 27, 2642–2647. [Google Scholar] [CrossRef] [Scilit]
  30. Bagavathiappan, S.; Philip, J.; Jayakumar, T.; Raj, B.; Rao, P.N.S.; Varalakshmi, M.; Mohan, V. Correlation between Plantar Foot Temperature and Diabetic Neuropathy: A Case Study by Using an Infrared Thermal Imaging Technique. J. Diabetes Sci. Technol. 2010, 4, 1386–1392. [Google Scholar] [CrossRef] [Scilit] [PubMed]
  31. Hernández-Contreras, D.A. Determinación Temprana de Riesgo de Ulceración Mediante Imágenes Térmicas. Ph.D. Thesis, INAOE, Puebla, Mexico, 2019. [Google Scholar]
  32. Bayareh, R.; Vera, A.; Leija, L.; Gutiérrez-Martínez, J. Development of a thermographic image instrument using the Raspberry Pi embedded system for the study of the diabetic foot. In Proceedings of the IEEE International Instrumentation and Measurement Technology Conference (I2MTC), Houston, TX, USA, 21–24 May 2018; pp. 1–6. [Google Scholar] [CrossRef] [Scilit]
  33. Christe, B.L. Imaging. In Introduction to Biomedical Instrumentation: The Technology of Patient Care; Christe, B.L., Ed.; Cambridge University Press: Cambridge, UK, 2009; pp. 177–192. [Google Scholar]
  34. Krause, F. (Ed.) The Diabetic Foot: An Issue of Foot and Ankle Clinics of North America; Elsevier—Health Sciences Division: Philadelphia, PA, USA, 2022; 240p. [Google Scholar]
  35. IDF Clinical Practice Recommendations on the Diabetic Foot—2017. International Diabetes Federation. 2017. Available online: https://idf.org/media/uploads/sites/2/2023/06/IDF_DF_Foot_CPR_2017_Final.pdf (accessed on 9 January 2026).
  36. ADA Professional Practice Committee. Introduction and Methodology: Standards of Care in Diabetes—2025. Diabetes Care 2025, 48, S1–S178. [Google Scholar] [CrossRef] [Scilit] [PubMed]
  37. Serrano, V. Nueva aplicación que combina IA e imagen termográfica para prevenir patologías en el pie diabético. ConSalud.es, 10 June 2024. Available online: https://www.consalud.es/saludigital/tecnologia-sanitaria/aplicacion-ia-imagen-termografica-prevenir-patologias-pie-diabetico.html (accessed on 13 January 2026).
  38. De Castro, F. La inteligencia artificial ayuda a prever el riesgo de complicaciones causadas por el pie diabético. Agência FAPESP, 3 March 2022. Available online: https://agencia.fapesp.br/la-inteligencia-artificial-ayuda-a-prever-el-riesgo-de-complicaciones-causadas-por-el-pie-diabetico/38055 (accessed on 13 January 2026).
  39. Khandakar, A.; Chowdhury, M.E.H.; Reaz, M.B.I.; Ali, S.H.M.; Abbas, T.O.; Alam, T.; Islam, M.S.; Arshia, F. Thermal Change Index-Based Diabetic Foot Thermogram Image Classification Using Machine Learning Techniques. Sensors 2022, 22, 1793. [Google Scholar] [CrossRef] [Scilit]
  40. Cao, Z.; Zeng, Z.; Xie, J.; Zhai, H.; Yin, Y.; Ma, Y.; Tian, Y. Diabetic Plantar Foot Segmentation in Active Thermography Using a Two-Stage Adaptive Gamma Transform and a Deep Neural Network. Sensors 2023, 23, 8511. [Google Scholar] [CrossRef] [Scilit] [PubMed]
  41. Sumithra, M.G.; Venkatesan, C. SwinDFU-Net: Deep learning transformer network for infection identification in diabetic foot ulcer. Technol. Health Care 2025, 33, 601–618. [Google Scholar] [CrossRef] [Scilit]
  42. Siré Langa, A.; Lázaro-Martínez, J.L.; Tardáguila-García, A.; Sanz-Corbalán, I.; Grau-Carrión, S.; Uribe-Elorrieta, I.; Jaimejuan-Comes, A.; Reig-Bolaño, R. Advanced AI-Driven Thermographic Analysis for Diagnosing Diabetic Peripheral Neuropathy and Peripheral Arterial Disease. Appl. Sci. 2025, 15, 5886. [Google Scholar] [CrossRef] [Scilit]
  43. Alwashmi, M.F.; Alghali, M.; Abu-Ashour, W.; Arabe, A.M.; Al Soheimi, A.; Alharbi, N.A.; Badahdah, H.M. AI-powered thermography for diabetic foot risk stratification: Multicenter cross-sectional study. JMIR Form. Res. 2025, 9, e81289. [Google Scholar] [CrossRef] [Scilit]
Figure 1. Global age-adjusted comparative prevalence of diabetes among adults aged 20–79 years [3].
Diabetology 07 00047 g001
Figure 2. Illustrative AI-generated example of thermal distribution and anomaly detection (the image is simulated and not derived from clinical thermographic measurements or patient data).
Diabetology 07 00047 g002
Figure 3. Simulated model of diabetic foot skin temperature evolution before and after ulcer onset. The profiles are illustrative and not derived from direct clinical measurements, but are based on published trends and the inflammatory immune response [15]. The figure supports conceptual understanding rather than clinical thresholds. Orange markers indicate high-risk temperature levels: entry into the high-risk range (with inflammation already present), peak temperature prior to lesion appearance, and onset of the exposed lesion.
Diabetology 07 00047 g003
Figure 4. Conceptual diagram of the infrared thermal imaging system, showing thermal signal acquisition, encoding, and post-processing steps used to generate thermographic images (the black arrow indicates the analog-to-digital conversion process (ADC), transforming the analog sinusoidal signal into its digital representation).
Diabetology 07 00047 g004
Figure 5. PRISMA-style flow diagram adapted for a narrative review, illustrating the identification, screening, eligibility, and inclusion of studies on infrared thermography for diabetic foot assessment.
Diabetology 07 00047 g005
Figure 6. Average plantar temperature (°C) of both feet, reproduced from data reported by Arjeleena Ilo et al. (2020) [19], illustrating temperature distribution patterns described in the literature.
Diabetology 07 00047 g006
Table 1. Technical characteristics and acquisition parameters of thermal cameras used in medical procedures [22].
CharacteristicParameter/Value
Thermal Sensitivity (NETD)≤0.1 °C (100 mK)
Temperature Range20 °C a 50 °C (Accuracy ± 0.3 °C)
Resolution≥320 × 240 pixels
Field Of View (FOV)30° × 23° o 35° × 26°
Focal length and working distance0.5–2 m
Frame Rate9–30 Hz
Response Time≤1 s
Calibration and StabilityBlackbody; tolerance ± 1 °C within ±5 °C of environmental variation
Environmental stability15–30 °C; HR ≤ 85%
Analysis softwareSelection of regions of interest (ROI), adjustable temperature scales and automatic detection of critical points
Region Of Interest (ROI)Accuracy in Region of Interest (ROI) Localization and Tracking
Table 2. Summary of selected studies on the use of infrared thermography for the assessment and early detection of diabetic foot conditions.
Author/YearApproach/
Methodology
TeamMain FindingsObservations
Lawson, R.N., 1956 [25]Detection of breast tumors using infrared thermography in 100 women diagnosed with cancer and a control group.The Baird Evaporograph (Baird Associates, later Baird Corporation, Bedford, MA, USA), developed in the 1940s, was an early military infrared thermograph later adapted in the 1950s–1960s for medical diagnostic thermography.Areas affected by breast tumors showed a local temperature increase of 1 °C to 3 °C.In 1957, he published a complementary article [26], marking the formal beginning of radiometric medical thermography, describing a capture protocol and a quantitative relationship between temperature and pathological tissue.
Benbow et al., 1994 [27]Liquid crystal contact thermography measures plantar temperature distribution to assess the risk of ulceration in 50 patients with neuropathy. Among these patients, 30 did not have peripheral vascular disease.Liquid crystal contact thermography system.Patients with diabetic neuropathy showed local temperature increases of 2–3 °C compared with the contralateral foot.The resolution of the liquid crystals limits the technique.
Lavery et al., 1997 [28]Temperature differences between the left and right foot were assessed in patients with asymptomatic sensory neuropathy (n = 78), neuropathic foot ulcers (n = 44), and Charcot arthropathy (n = 21).Probe or portable infrared thermometer.Average temperature difference of 4.6 °C in patients with Charcot and 3.1 °C in patients with neuropathic ulcers compared to the contralateral foot.An increase in temperature was detected before the appearance of the lesion, suggesting that thermometry may indicate risks before a visible or exposed lesion appears.
Lavery et al., 2004 [29]They assessed how well home-based foot skin temperature monitoring could prevent ulcers in people with type II diabetes. The study compared a standard care group (n = 41) with an improved care group (n = 44). Participants in the improved group measured their feet’ temperature twice a day, once in the morning and once in the evening.TempTouch portable infrared thermometer (Xilas Medical).There is a risk of ulceration if the temperature at one point on the foot exceeds 2.2 °C more than the same point on the contralateral foot.
Six months after the study began, foot complications were observed in only 2% of participants receiving optimized therapy, compared with 20% of those receiving standard care.
They demonstrated that the temperature difference between the feet is a critical indicator for early ulcer detection in patients with diabetes.
Bagavathiappan et al., 2010 [30]The study looked at how foot temperature relates to diabetic neuropathy in patients with type II diabetes. It compared the findings with vibration perception thresholds in 112 patients: 79 without neuropathy and 33 with neuropathy.AGEMA Thermovision 550 with platinum silicon (PtSi) photodetectors cooled by a Stirling cycle, spatial resolution 320 × 240 pixels, and thermal resolution of 0.08 °C.Measuring the temperature of the sole of the foot, it was found that people with diabetic neuropathy had a higher temperature (32–35 °C) than those without it (27–30 °C). In addition, a relationship was identified between the mean foot temperature and the vibration perception threshold in both limbs.It was demonstrated that elevated plantar temperature correlates with the severity of neuropathy (r = 0.3, p < 0.01).
Hernandez-Contreras et al., 2019 [31]The study looked at how temperature is distributed across each foot sole. It used statistical and probabilistic methods to detect diabetic foot complications early, rather than relying solely on absolute temperature values. The research involved 122 participants with diabetes and a control group of 45 healthy subjects.FLIR E60 camera, spatial resolution 320 × 240 pixels, and thermal resolution of 0.05 °C.
A second FLIR E6 camera was included as a low-cost alternative, with a spatial resolution of 160 × 120 pixels and a thermal resolution of 0.06 °C.
The Thermal Change Index distinguishes diabetic subjects from non-diabetic subjects by significant thermal changes in the angiosomes.
The thermal distribution in a diabetic subject differs statistically from that of subjects without diabetes.
The temperature distribution within each foot allows risk assessment without relying on comparison with the opposite foot, which is helpful in patients with amputations or anatomical differences.
Arjelena Ilo et al., 2020 [16]The researchers examined the use of infrared thermography as a diagnostic tool. They compared it with traditional non-invasive methods, such as the ankle-brachial index and toe pressure. The study included 118 patients with diabetes and a control group of 93 apparently healthy individuals.FLIR a325sc camera, spatial resolution of 320 × 240 pixels, and thermal resolution of 0.05 °C.The average temperature was higher in DM patients with neuro-ischemia, followed by patients with neuropathy. Patients with DM and angiopathy had lower average temperatures.
Overall, thermal differences > 2.2 °C.
They highlight the importance of standardizing the technique and considering factors such as ambient temperature and acclimatization time.
Bayareh et al., 2020 [32]They developed a low-cost thermographic instrument to capture images of the diabetic foot, aiming to detect temperature differences indicative of a risk of ulceration or infection.
They did not validate the device in patients, but used reference patterns and experimental models.
FLIR Lepton 2.0 module, spatial resolution of 80 × 60 pixels, and thermal resolution of 0.05 °C.Simultaneous thermal images were taken with the developed prototype and with a commercial reference thermal imaging camera (FLIR E40).
Validation was based on comparing relative patterns between the two images, analyzing the coincidence of hot and cold areas of the foot. A correspondence of more than 90% was observed between the identified regions, proving that the prototype reliably reproduced the overall thermal distribution.
Rodriguez-Alonso et al., 2023 [10]They compare infrared thermography with standard clinical diagnosis using the Infectious Diseases Society of America (IDSA) criteria to detect infections in diabetic ulcers.
The study included 80 suspected infected diabetic ulcers in 72 patients with type II DM.
FLIR E8 camera with spatial resolution of 320 × 240 pixels and thermal resolution of 0.05 °C.Thermographic infection was defined as a difference between the lesion area and the surrounding tissue of ≥3 °C. According to this definition, 53.75% of the cases evaluated were classified as “infection.”
Based on cross-testing, a sensitivity of 82% and a specificity of 100% were calculated, yielding an overall accuracy of 91%.
The authors point out that although the results are promising, thermography should not completely replace clinical diagnosis; instead, it should be used as a complement.
Medrano-Jiménez et al., 2024 [17]Thermography was used to evaluate suspected osteomyelitis, ischemia, and infection, as well as symptomatic neuropathy, in patients with specific DM.FLIR E6 camera, spatial resolution of 120 × 160 pixels, and thermal resolution of 0.06 °C.Thermography detected inflammation in the left foot (1.5 °C) without osteomyelitis, moderate infection, and reduced perfusion in the right and left feet, respectively, and unilateral neuropathy with small but significant thermal differences, evidencing neurovascular alterations in patients with diabetes.They emphasize that there is no thermographic record that allows observation of the evolution of the lesion, inflammation, infection, or neuropathy, which limits the ability to evaluate progressive changes.
Table 3. Thermographic results and clinical diagnosis for diabetic foot assessment in primary care, derived from the investigation by Medrano-Jiménez [17].
ConditionThermography ResultsClinical Diagnosis
OsteomyelitisΔT = 0.1 °C (affected foot − contralateral).No osteomyelitis present.
Ischemia and infectionΔT = 1.8 °C (infected foot − contralateral).
ΔT = −0.9 °C (affected foot without infection).
The presence of infection in the affected foot is indicative of ischemia.
Symptomatic neuropathyAsymmetrical distribution of points with higher and lower temperatures between both feet.Unilateral sensory neuropathy.
Table 4. Comparison of infrared thermography with commonly used non-invasive techniques for diabetic foot assessment [33,34].
TechniqueInvasivenessRelative Cost and PortabilityType of InformationStage of Detection
Infrared thermography (IRT)Non-invasive, non-contactLow–moderate cost; high portability (handheld and portable systems available).Thermal patterns related to inflammation, perfusion changes, and asymmetries.Early/pre-ulcerative
Ankle–Brachial Index (ABI)Non-invasiveLow cost; moderate portability (portable cuffs and Doppler probes, patient positioning required).Vascular perfusion and arterial obstruction.Early to intermediate
Doppler ultrasoundNon-invasiveModerate cost; moderate–low portability (bulkier portable units, stable power supply required).Blood flow velocity and vascular anatomy.Early to advanced
Plantar pressure analysisNon-invasiveModerate cost; low–moderate portability (platform-based or in-shoe systems, controlled environment needed).Mechanical load distribution and pressure points.Early risk assessment
X-ray Minimally invasive (ionizing radiation)Low–moderate cost; low portability (fixed radiological infrastructure).Soft tissue integrity, deep infections, osteomyelitis.Advanced diagnosis
Magnetic Resonance Imaging (MRI)Non-invasive (non-ionizing magnetic fields; contrast agents may be required in some protocols)High cost; very low portability (large, fixed, hospital-based equipment).Bone structure, deformities, fractures.Advanced diagnosis
Disclaimer/Publisher’s Note: The statements, opinions and data contained in all publications are solely those of the individual author(s) and contributor(s) and not of MDPI and/or the editor(s). MDPI and/or the editor(s) disclaim responsibility for any injury to people or property resulting from any ideas, methods, instructions or products referred to in the content.