Abstract
Background/Objectives: Type 2 diabetes mellitus (T2DM) is frequently associated with depressive disorder (DD), which negatively impacts glycemic control and overall metabolic outcomes. Recent evidence suggests that glucagon-like peptide-1 receptor agonists (GLP-1 RAs) may exert neuroprotective effects and modulate mood. Likewise, it is unknown whether the presence of a DD, due to increased brain inflammation, could lead to a poorer response to GLP-1 RAs in terms of weight loss. This study evaluates the impact of DD on metabolic outcomes in individuals treated with GLP-1 RAs. Methods: We conducted a retrospective longitudinal study including 115 patients with T2DM treated with GLP-1 RAs for at least six months. DD was identified based on a documented clinical diagnosis, chronic antidepressant use, or a Beck Depression Inventory (BDI) score ≥16. Metabolic parameters, including glycated hemoglobin (HbA1c), fasting glucose, the body mass index (BMI), the waist circumference, and triglycerides, were compared between patients with and without DD. Results: Patients with DD had significantly higher baseline HbA1c (7.5% vs. 6.9%, p = 0.01), fasting glucose, and triglyceride levels. The waist circumference was also higher in the DD group (p = 0.001). However, no significant differences were observed in weight loss or BMI reductions following the GLP-1 RA treatment. Final HbA1c levels remained higher in the DD group (7.2% vs. 7.0%, p = 0.01). Conclusions: While DD is associated with a poorer baseline metabolic control in T2DM, it does not appear to impair the weight loss efficacy with GLP-1 RAs. However, patients with DD maintain higher post-treatment HbA1c levels, underscoring the need for integrated metabolic and psychiatric care in diabetes management.
1. Introduction
Type 2 diabetes (T2DM) is increasingly recognized as a condition with significant psychiatric comorbidities, particularly depression. Depression is highly prevalent in patients with T2DM, with studies showing that individuals with diabetes are approximately twice as likely to experience depressive disorders compared to the general population. This comorbidity presents a considerable burden, exacerbating diabetes-related complications, reducing the adherence to treatment, and impairing the overall quality of life [1,2,3,4,5].
The bidirectional relationship between T2DM and depression is multifactorial and involves both biological and behavioral mechanisms. Chronic low-grade inflammation, commonly observed in both T2DM and depressive disorders, is proposed as a key pathophysiological link. Increased levels of pro-inflammatory cytokines, including tumor necrosis factor-alpha (TNF-α) and interleukin-6 (IL-6), have been implicated in both insulin resistance and the development of depressive symptoms. These inflammatory mediators contribute to neuroinflammation, oxidative stress, and alterations in neurotransmitter systems, particularly serotonin and dopamine, which are crucial in mood regulation. Similarly, dysfunctions in the corticotropic axis in patients with depressive disorder (DD) are fundamental in its etiopathogenesis [6,7,8,9,10].
Additionally, depression is associated with lifestyle behaviors that negatively impact diabetes management, including poor dietary habits, reduced physical activity, and nonadherence to medication [8,11]. Patients with comorbid depression and diabetes often exhibit poorer glycemic control, an increased risk of complications, and higher mortality rates [12,13,14,15,16]. The presence of DD has also been linked to alterations in the central nervous system, including a reduction in the glucagon-like peptide-1 (GLP-1) receptor expression in key brain regions involved in mood regulation and appetite control, and, therefore, it could be hypothesized that the effect of GLP-1 receptor agonists on weight and/or metabolic control in patients with a DD may be lower compared to individuals without this mood disorder [17].
GLP-1 receptor agonists (GLP-1 RAs), initially developed for their glucose-lowering effects in T2DM, have recently been explored for their neuroprotective and potential antidepressant properties [18,19,20,21,22]. These agents exert multiple central effects, including the enhancement of synaptic plasticity, neurogenesis, and reductions in neuroinflammation. Preclinical and clinical studies suggest that GLP-1 RAs may modulate moods by influencing reward processing pathways and attenuating anhedonia. Furthermore, animal models have demonstrated that GLP-1 RAs such as dulaglutide and liraglutide can reverse depression-like behaviors and restore hippocampal metabolomic homeostasis in chronic stress models [23,24].
Given the growing body of evidence supporting the role of GLP-1 RAs in modulating mood and neuroinflammation, it is crucial to examine whether the presence of a DD in patients with T2DM is associated with a diminished response to GLP-1 RAs. This study aims to evaluate whether depression serves as a factor for poorer glycemic and metabolic responses to GLP-1 RAs, thereby informing clinical decisions regarding personalized diabetes management strategies. Understanding this interaction will not only refine therapeutic approaches but also highlight the importance of integrated psychiatric and metabolic care in diabetes management.
2. Material and Methods
2.1. Subjects
This retrospective study was conducted at Son Llàtzer University Hospital (Palma de Mallorca, Spain), following approval from the hospital’s Ethics Committee. We recruited 300 individuals with T2DM, using serial selection. Of these, 115 had been treated with GLP-1 RAs for at least 6 months. Excluded patients included those with type 1 or gestational diabetes, recent T2DM diagnoses, pregnant or lactating T2DM patients, those with substance dependence, or active neoplasia at the time of the study, as well as patients with severe psychiatric disorders (schizophrenia or bipolar disorder). All participants gave written informed consent.
2.2. Assessment of Depressive Syndrome or Clinically Significant Depressive Symptomatology
Subjects with a documented diagnosis of DD in their medical history, as well as those with a chronic prescription for antidepressants, were classified as patients with type 2 diabetes and concomitant DD. Similarly, as part of the routine evaluation of patients with diabetes, those who had a recorded Beck Depression Inventory (BDI) score of 16 or higher were also included in the depressive disorder group.
The Spanish version of the BDI is a 21-item questionnaire that evaluates mood over the previous month. Total scores range from 0 to 63, with higher scores indicating more severe depression symptoms. The BDI is commonly used as a screening tool for major depression in the general population. In this context, a cutoff score of thirteen or higher indicates significant depression. Among individuals with diabetes, a cutoff score of sixteen or higher for the entire 21-item measure showed the optimal balance between sensitivity and positive predictive value when prediction values were applied to a population with diabetes and a 20% prevalence rate of DD. This cutoff would detect over seventy percent of subjects diagnosed with major depression, while providing more than seventy percent certainty that a person screening positive indeed has this condition. Therefore, a BDI score of ≥16 was considered positive for significant symptoms of depression among subjects with diabetes [12,25].
2.3. Sociodemographic and Clinical Parameters
Demographic information, including age, gender, and ethnicity, was collected. Additional diabetes-related data were recorded, such as duration of diabetes, current T2DM treatment, presence of complications (e.g., coronary heart disease, and neuropathy), frequency of hypoglycemia, hospital admissions due to acute complications or other reasons in the past year, and cardiovascular risk factors (e.g., tobacco use, alcohol abuse, hypertension, and dyslipidemia).
Comprehensive sociodemographic data were collected, including age, sex, self-reported ethnicity, marital status, and educational level. Employment situation was also recorded when available.
Clinical data included detailed diabetes-related information, such as age at diagnosis, total duration of T2DM, type and duration of current antidiabetic treatments (including oral agents, insulin, and GLP-1 receptor agonists), and presence of diabetes-related microvascular (retinopathy, nephropathy, and neuropathy) and macrovascular complications (coronary artery disease, stroke, and peripheral artery disease). We also assessed the number of hospitalizations over the preceding 12 months, frequency of hypoglycemic episodes, and any history of emergency department visits related to glycemic acute complications.
Cardiovascular risk factors were comprehensively documented: history of hypertension (defined by a diagnosis or antihypertensive use), dyslipidemia (documented diagnosis or lipid-lowering therapy), active tobacco use (within the last 12 months), and excessive alcohol intake (>20 g/day). Adherence to healthy lifestyle recommendations, including regular physical activity (≥150 min/week of moderate intensity) and dietary adherence (based on Mediterranean Diet Score), was evaluated when recorded.
Biochemical and metabolic parameters were extracted from electronic health records and laboratory databases at baseline (i.e., prior to initiation of GLP-1 RA treatment) and after at least six months of follow-up. The following values were recorded:
Glycemic control: Fasting plasma glucose (FPG, mg/dL) and glycated hemoglobin (HbA1c, %), measured using high-performance liquid chromatography (HPLC).
Lipid profile: Total cholesterol, low-density lipoprotein cholesterol (LDL-c), high-density lipoprotein cholesterol (HDL-c), and triglycerides (mg/dL), obtained via enzymatic colorimetric assays.
Renal function: Serum creatinine (mg/dL), estimated glomerular filtration rate (eGFR, mL/min/1.73 m2), and albumin-to-creatinine ratio (ACR, mg/g), when available.
Baseline values were defined as the closest available measurements within three months prior to GLP-1 RA initiation. Follow-up values were obtained from measurements performed between 6 and 12 months after treatment started. In cases with multiple values within the follow-up window, the average was used.
2.4. Anthropometric Measures
BMI was recorded before the start of treatment with GLP-1 RAs and after a minimum follow-up of 6 months. Height and weight were measured while each participant was wearing indoor clothing without shoes. Body mass index (BMI) was calculated as weight divided by height squared. Waist circumference was measured at the midpoint between the lowest rib and the iliac crest.
2.5. Statistical Analysis
This was a retrospective longitudinal study aimed at evaluating whether patients with T2DM and comorbid DD exhibited poorer outcomes in terms of weight and glycemic control compared to T2DM patients without depression.
Initial analyses were descriptive and included the calculation of means and standard deviations (SDs) for continuous variables and frequencies and percentages for categorical variables. Normality of data distribution was assessed using the Kolmogorov–Smirnov test and visual inspection of histograms and Q–Q plots.
Between-group comparisons (T2DM + DD vs. T2DM without DD) were performed using the unpaired Student’s t-test for continuous variables with normal distribution and the Wilcoxon rank-sum test for non-normally distributed data. For categorical variables, comparisons were made using the Chi-square test or Fisher’s exact test when appropriate.
Effect size was calculated using Cohen’s d or odds ratios (ORs) to quantify the magnitude of differences and their potential clinical relevance. Cohen’s d was applied to continuous variables and is interpreted as small (0.2), medium (0.5), or large (0.8) effect sizes. For categorical variables, ORs were computed to estimate the strength of association between groups.
In addition, longitudinal changes in weight and HbA1c levels over time were evaluated within and between groups using repeated-measures ANOVA for normally distributed data or Friedman test for non-parametric variables. Post hoc pairwise comparisons were adjusted using the Bonferroni correction.
To account for potential confounders, such as age, sex, diabetes duration, and baseline BMI or HbA1c, a multivariate linear regression model was applied to assess the independent association between depressive disorder and the primary outcomes (weight change and HbA1c variation).
All tests were two-tailed, and a p-value < 0.05 was considered statistically significant. Statistical analyses were conducted using IBM SPSS Statistics for Windows, Version 22.0 (SPSS Inc., Chicago, IL, USA).
3. Results
Of the 300 patients, 115 were on GLP-1 RAs for a minimum of 6 months and met all inclusion criteria without any exclusion criteria. Regarding the different GLP-1 RA therapies, 80 patients were on once-weekly semaglutide, 20 subjects were on oral semaglutide, 10 patients were on liraglutide, and the remaining 5 individuals were on dulaglutide.
A total of 53 out of 115 patients (46.1%) met the criteria for DD and/or had a BDI score of 16 or higher, while 53.9% (62/115) did not present with this mood disorder.
Patients with DD had poorer baseline metabolic control, with significantly higher fasting glucose and HbA1c levels (154.4 ± 43.1 vs. 138.6 ± 40.7 mg/dL and 7.5 ± 1 vs. 6.9 ± 1.3%, p = 0.02 and p = 0.01, respectively), as well as higher triglyceride levels (192.4 ± 137.7 vs. 135.9 ± 67.5 mg/dL; p = 0.001).
Baseline Characteristics
Table 1 presents the baseline metabolic and anthropometric parameters for both groups. Patients in the DD group exhibited significantly worse glycemic and metabolic profiles at baseline. Specifically, the mean HbA1c was higher in patients with DD compared to those without (7.5 ± 1% vs. 6.9 ± 1.3%, p = 0.01), as was the fasting plasma glucose (154.4 ± 43.1 mg/dL vs. 138.6 ± 40.7 mg/dL, p = 0.02). Triglyceride levels were also notably elevated in the DD group (192.4 ± 137.7 mg/dL vs. 135.9 ± 67.5 mg/dL, p = 0.001), while total and LDL cholesterol levels did not differ significantly.

Table 1.
Comparison of biochemical and anthropometric parameters among subjects with DD and individuals without it.
Although there were no statistically significant differences in the initial body weight or BMI between groups, the waist circumference was significantly greater in patients with DD (114.8 ± 10.5 cm vs. 105.2 ± 8.6 cm, p = 0.001), suggesting a higher degree of central adiposity. The psychological assessment confirmed a greater depressive symptomatology in the DD group, as indicated by higher BDI scores (16 ± 3.9 vs. 9.5 ± 3.1, p < 0.0001).
Effect sizes (Cohen’s d) further supported the clinical relevance of these findings, indicating moderate differences for HbA1c (d = 0.51) and triglycerides (d = 0.53) and a large difference for the waist circumference (d = 1.01), underscoring the impact of DD on the baseline metabolic status.
Table 2 summarizes demographic variables and clinical comorbidities. No significant differences were observed between groups in terms of their age, marital status, employment situation, or educational level. Patients with DD were more likely to be female (50.9% vs. 27.4%, p = 0.01) and had a trend toward longer diabetes durations (12.5 ± 9.9 vs. 9.9 ± 8.9 years, p = 0.09). While the age, smoking status, and alcohol use were comparable between groups, the DD group showed a significantly higher prevalence of hypertension (98.1% vs. 79%, p = 0.001) and dyslipidemia (94.3% vs. 80.6%, p = 0.04).
Table 2.
A comparison of demographic features, the frequency of cardiovascular risk factors, complications related to T2DM, and admissions during the previous year among subjects with criteria for DD and individuals without it.
Notably, diabetic nephropathy was significantly more prevalent among patients with DD (26.4% vs. 6.5%, p = 0.004), suggesting an association between depressive symptoms and microvascular complications. No significant differences were observed regarding other diabetes complications (e.g., retinopathy and macrovascular disease), hypoglycemia-related admissions, or physical activity levels.
Effect size estimates further support these associations, with a notably increased likelihood of hypertension (OR = 7.44, 95% CI: 1.61–34.46), nephropathy (OR = 5.14, 95% CI: 1.62–16.35), and female sex (OR = 2.77, 95% CI: 1.26–6.06) in the DD group, demonstrating the clinical significance of these differences.
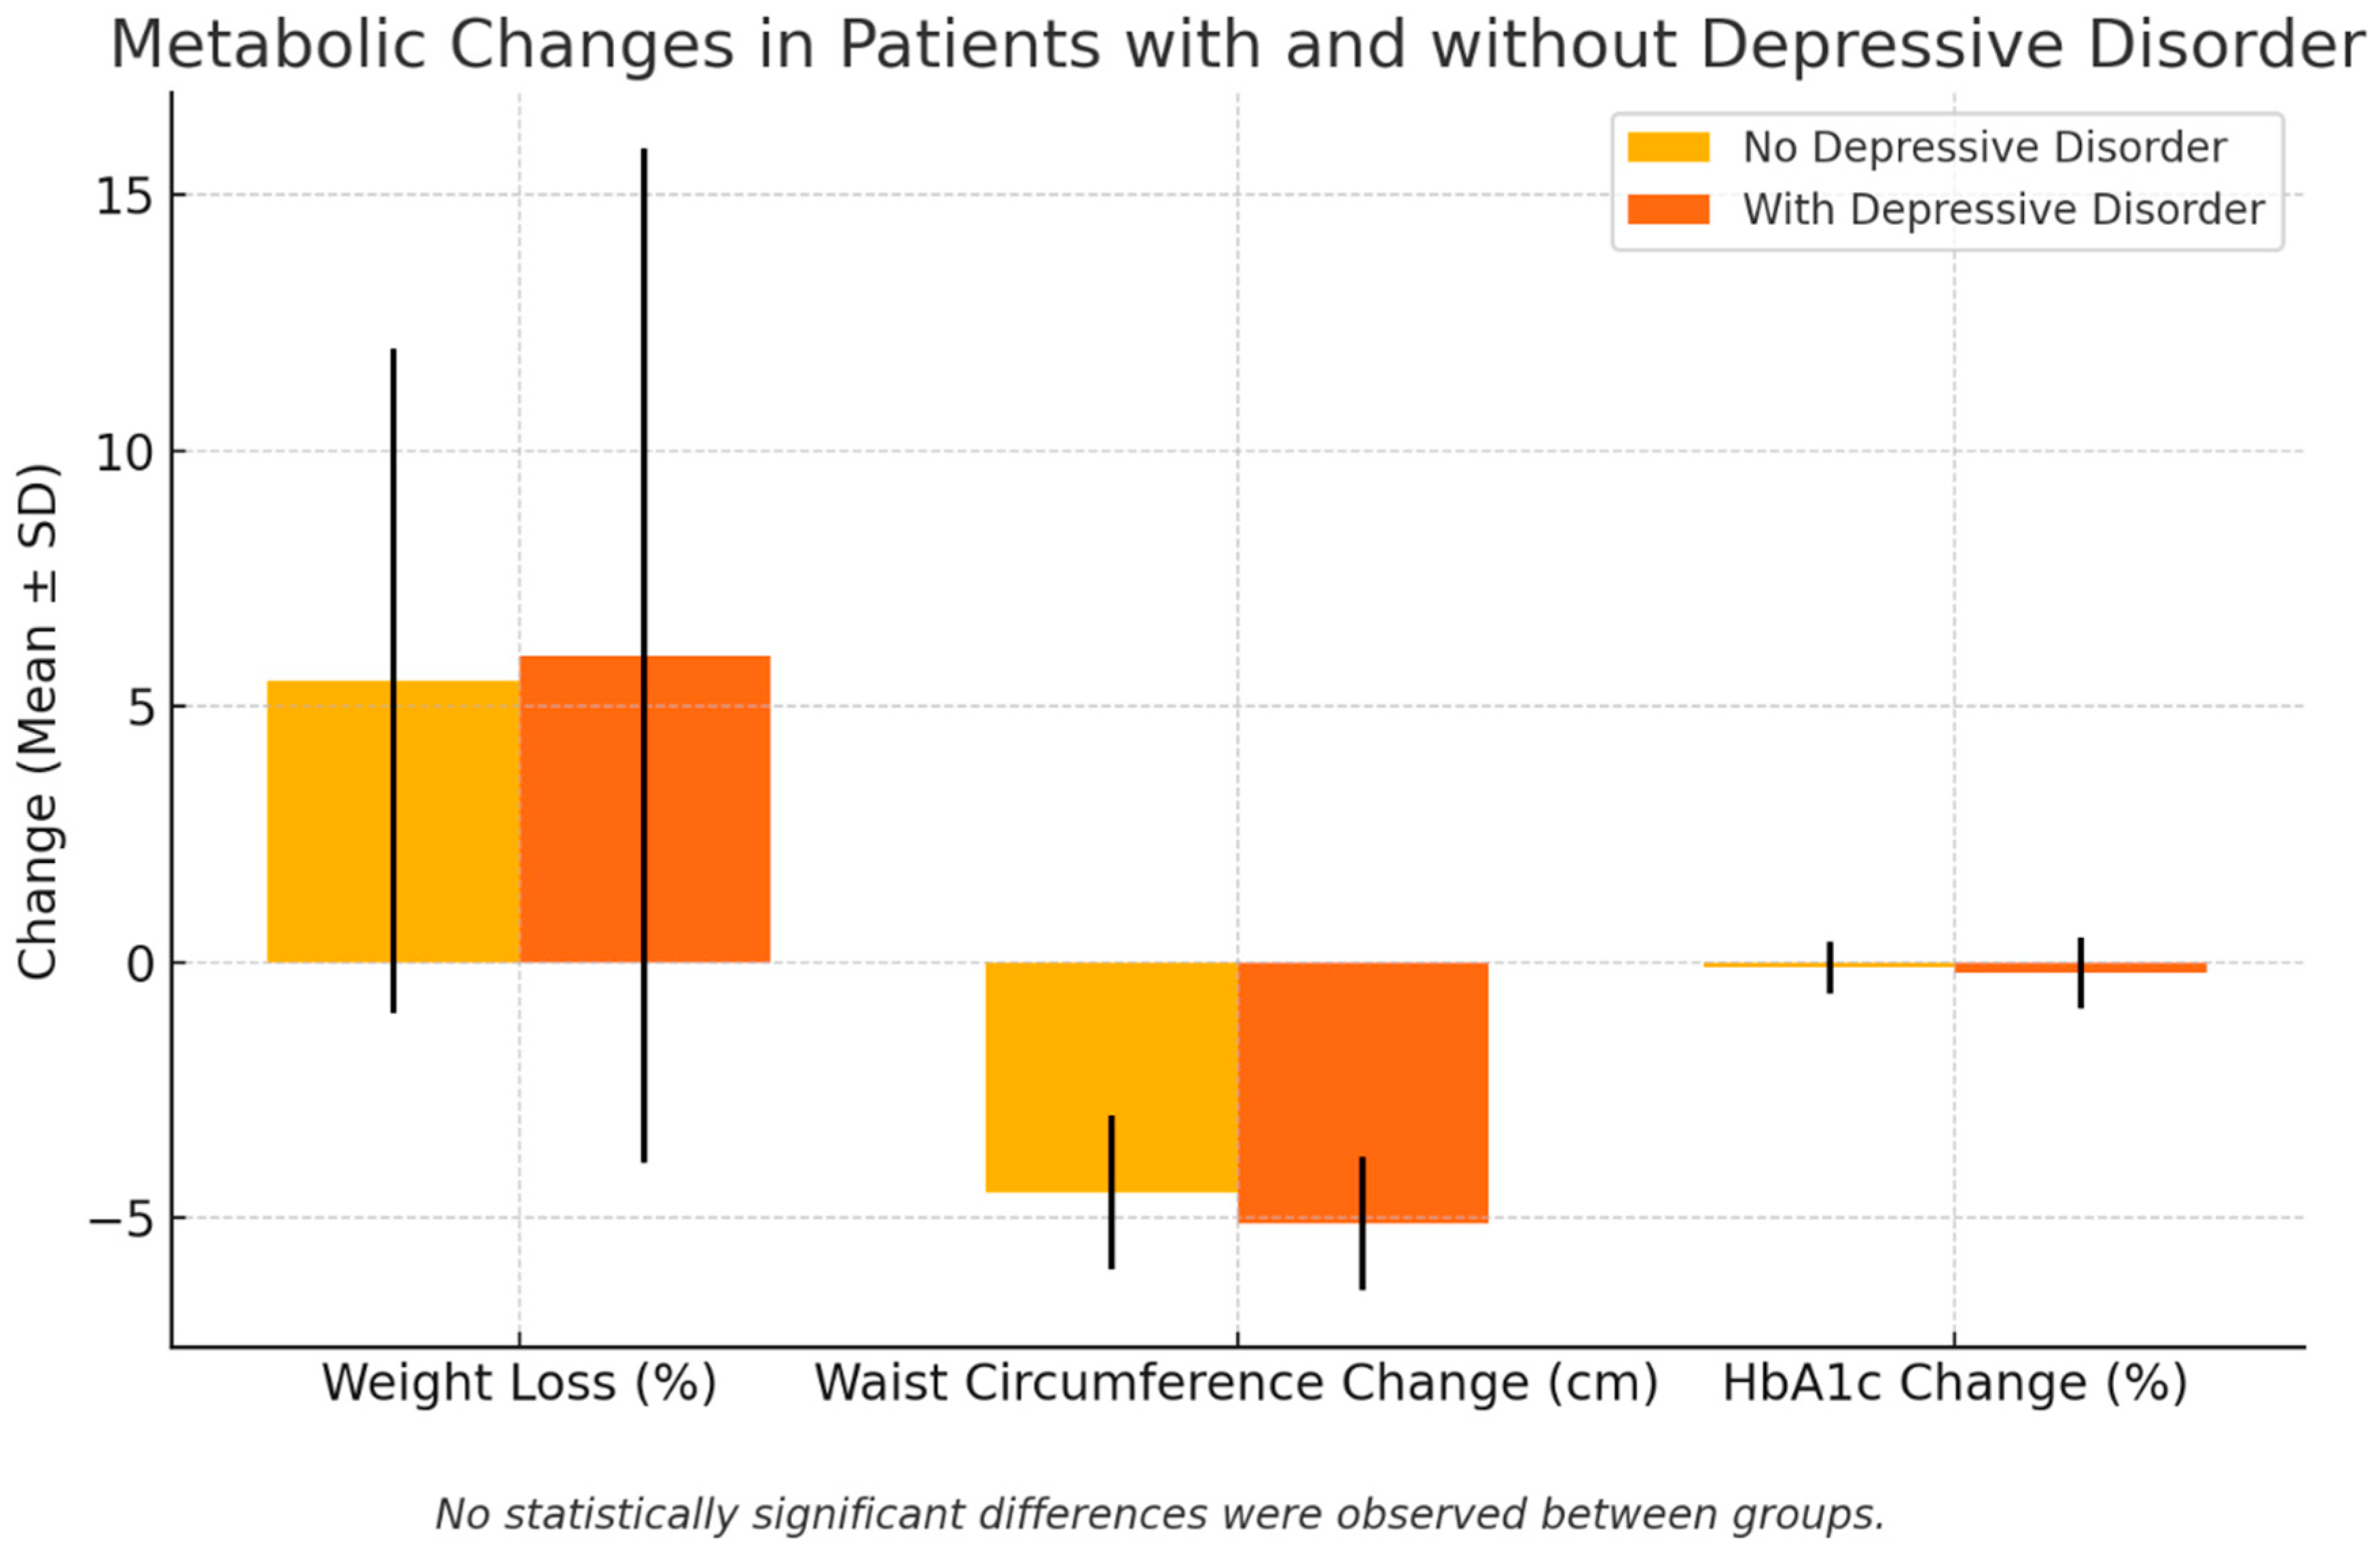
Table 3 and Figure 1 present changes in anthropometric and glycemic parameters following the GLP-1RA treatment in patients with and without depressive disorder (DD). As can be seen, after a minimum of six months of therapy, both groups showed reductions in their BMI, body weight, and waist circumference. However, no significant differences were observed between groups in the magnitude of the weight loss, BMI reduction, or percentage of excess weight loss (6 ± 9.9% in the DD group vs. 5.5 ± 6.5% in the non-DD group, p = 0.4). These findings suggest that the presence of DD did not diminish the weight-lowering efficacy of GLP-1 receptor agonists.
Table 3.
Changes in anthropometric and glycemic parameters after treatment with GLP-1RA among subjects with criteria for DD and individuals without it.

Figure 1.
Metabolic changes in patients with and without depressive disorder. Black lines are SD.
Nevertheless, the waist circumference remained significantly higher in the DD group at follow-up (109 ± 9.8 cm vs. 101 ± 9.1 cm, p = 0.001), despite a similar reduction in the waist perimeter (5.1 ± 1.3 cm vs. 4.5 ± 1.5 cm, p = 0.1), indicating a persistently greater visceral fat burden.
In contrast to the comparable anthropometric improvements, final HbA1c levels remained higher in the DD group (7.2 ± 1% vs. 7.0 ± 0.7%, p = 0.01), suggesting less effective glycemic control despite a similar weight loss. However, the absolute change in HbA1c over time did not differ significantly (0.2 ± 0.7% vs. 0.1 ± 0.5%, p = 0.8), pointing toward a persistently elevated baseline rather than an attenuated response.
Effect size estimates (Cohen’s d) for these comparisons further clarify their clinical relevance, demonstrating a large difference in the final waist circumference (d = 0.85) and moderate differences for the final BMI (d = 0.35) and final HbA1c (d = 0.43), even where the statistical significance was marginal. All these findings are represented in Table 3.
The further analysis revealed a negative correlation between the percent of weight loss and concomitant insulin use (r = −0.347, p < 0.001), as well as with a habitual alcohol intake exceeding 20 g/day (r = −0.229, p = 0.01). The female sex was modestly but significantly associated with greater weight loss (r = 0.2, p = 0.02), which is consistent with prior findings suggesting an enhanced GLP-1 RA responsiveness in women.
No significant correlations were found between the depressive status (as a binary variable) and weight loss or HbA1c reductions, although a trend toward less glycemic improvements in the DD group was noted.
4. Discussion
In this study, we investigated the impact of concomitant depressive disorder (DD) on the efficacy of glucagon-like peptide-1 receptor agonists (GLP-1 RAs) in patients with type 2 diabetes mellitus (T2DM). Our findings indicate that while patients with DD exhibited poorer baseline metabolic control, including higher fasting glucose, HbA1c, triglyceride levels, and waist circumferences, the presence of DD did not significantly influence weight loss outcomes associated with GLP-1 RA therapy. Both groups, with and without DD, experienced comparable reductions in their body mass index (BMI) and waist circumference after a minimum follow-up of six months. However, patients with DD maintained higher post-treatment HbA1c levels, suggesting a persistent disparity in glycemic control.
The relationship between GLP-1 RAs and depressive symptoms has been explored in various studies, particularly in animal models. In DD, the hyperactivation of the corticotropic axis may lead to maladaptive brain changes, particularly in the hippocampus and frontal cortex, involving pathways that modulate energy metabolism [17]. In this sense, the activation of the GLP-1 receptor has been shown to promote neurogenesis, enhance synaptic plasticity, and modulate the stress response, which may contribute to its antidepressant effects. Moreover, in vivo studies showed that GLP-1 RAs improve the synaptic function and neuronal signaling in the brain, suggesting potential benefits for cognitive function and mood disorders [18,19,20,21,23,24]. Actually, GLP-1 RAs may exert neuroprotective effects by reducing neuroinflammation, enhancing synaptic function, and restoring insulin signaling pathways in the brain, potentially improving memory formation and preventing and/or partially reversing neurodegenerative diseases such as Alzheimer’s and Parkinson’s. In fact, animal models have demonstrated that GLP-1 RAs such as dulaglutide and liraglutide can reverse depression-like behaviors and restore hippocampal metabolomic homeostasis in chronic stress models [23,24]. All these findings support the hypothesis that GLP-1 RAs may play a role in mood regulation beyond their metabolic effects [18,19,20,23,24].
On the other hand, GLP-1 receptors are expressed in brain regions involved in the reward system, such as the hypothalamus, amygdala, nucleus accumbens, paraventricular nucleus, and ventral tegmental area, among others. Animal studies suggest that GLP-1 RAs may play a role in reward processing by reducing cocaine-mediated behaviors and modulating substance abuse through the regulation of dopamine secretion [22,26,27,28]. Moreover, GLP-1 also exerts its effects on oxytocin and NPY neurons, which are implicated in the regulation of social rewards and the resilience to stress [29].
Our findings did not show a significant difference in weight loss outcomes between patients with and without DD. This contrasts with the literature suggesting that depressive symptoms may impair weight loss efforts due to factors such as a reduced motivation and adherence to treatment plans. However, it is possible that the pharmacological effects of GLP-1 RAs on appetite suppression and metabolic regulation counteract these behavioral barriers, leading to comparable weight loss outcomes regardless of the depressive status. In fact, Squire et al., in a retrospective cohort analysis, wanted to identify factors associated with the weight loss response to GLP-1 analogs. While being a woman was associated with a hyper-response, age, the diabetes status, the baseline BMI, and DD were not independently associated with weight loss in response to this treatment [30]. Moreover, patients experienced an important waist circumference reduction, which may be secondary to the modulating effects of GLP-1 Ras on the corticotrope axis.
A key strength of our study is the focus on a specific population—patients with T2DM undergoing GLP-1 RA therapy, allowing for targeted insights into the interplay between depression and diabetes management. However, several limitations should be considered. Retrospective designs may introduce a selection bias, and the reliance on medical records for the DD diagnosis may lead to misclassification. Although most antidepressants prescribed were not generally associated with adverse metabolic effects, the absence of detailed data on specific antidepressant types and dosages represents a potential limitation that may have influenced the results. Additionally, our study did not account for the severity or duration of the depression, nor did it assess the adherence to the GLP-1 RA therapy, both of which could impact outcomes. Although most women in the study were likely postmenopausal, given the mean age of 61 years, we did not collect specific data on the menopausal status or hormone replacement therapy (HRT) use. Consequently, we could not assess the potential influence of menopause, the menstrual cycle, or HRT on metabolic outcomes, which may represent a confounding factor, particularly regarding the body weight, body composition, and glycemic variability. The relatively small sample size and short follow-up period may also limit the generalizability of our findings.
Future studies should prospectively evaluate the impact of depressive disorders on GLP-1RA efficacy by incorporating standardized assessments of the depression severity and treatment adherence. Examining the relationship between GLP-1 RA therapy and mood disorders could provide insights into the potential neuropsychiatric effects of these agents. Additionally, analyzing the mechanisms through which GLP-1 RAs affect both metabolic and neuropsychiatric parameters might help develop personalized treatment strategies for patients with T2DM and comorbid depression.
In conclusion, our study suggests that the presence of a DD does not significantly affect the weight loss efficacy of GLP-1RAs among patients with T2DM. However, patients with concomitant depression may experience persistently higher HbA1c levels despite the GLP-1 RA therapy, indicating the need for integrated management approaches that address both metabolic and mental health aspects. Healthcare providers should actively monitor neuropsychiatric symptoms in patients undergoing treatment with GLP-1 receptor agonists. It is advisable to adopt comprehensive care models that integrate psychological support to enhance the effectiveness of the treatment outcomes.
Author Contributions
J.N. wrote the manuscript, researched data, and gave final approval of the version. J.N. and P.S. made the statistics and reviewed the manuscript. M.I.T. conducted the psychological evaluation of the manuscript. G.P.-B., G.S., M.G., and L.M. contributed to the discussion, reviewed the manuscript, and gave final approval of the version. All authors have read and agreed to the published version of the manuscript.
Funding
This research received no external funding.
Institutional Review Board Statement
The study was conducted in accordance with the Declaration of Helsinki, and approved by the Ethics Committee of Balearic Islands (protocol code IB 1406/10, approved in June 2010) for studies involving humans.
Informed Consent Statement
Informed consent was obtained from all subjects involved in this study.
Data Availability Statement
Data analyzed during the current study are available from the corresponding author on reasonable request.
Conflicts of Interest
All authors confirmed that there are no current or potential conflicts of interest in relation to this article.
References
- Nouwen, A.; Adriaanse, M.C.; van Dam, K.; Iversen, M.M.; Viechtbauer, W.; Peyrot, M.; Caramlau, I.; Kokoszka, A.; Kanc, K.; de Groot, M.; et al. Longitudinal associations between depression and diabetes complications: A systematic review and meta-analysis. Diabet. Med. 2019, 36, 1562–1572. [Google Scholar] [CrossRef] [PubMed]
- Roy, T.; Lloyd, C.E. Epidemiology of depression and diabetes: A systematic review. J. Affect. Disord. 2012, 142, S8–S21. [Google Scholar] [CrossRef]
- Fanelli, G.; Raschi, E.; Hafez, G.; Matura, S.; Schiweck, C.; Poluzzi, E.; Lunghi, C. The interface of depression and diabetes: Treatment considerations. Transl. Psychiatry 2025, 15, 22. [Google Scholar] [CrossRef] [PubMed]
- Holt, R.I.G.; de Groot, M.; Golden, S.H. Diabetes and depression. Curr. Diab. Rep. 2014, 14, 491. [Google Scholar] [CrossRef] [PubMed]
- Liu, K.; Zhou, D.; Chen, L.; Hao, S. Depression and type 2 diabetes risk: A Mendelian randomization study. Front. Endocrinol. 2024, 15, 1436411. [Google Scholar] [CrossRef]
- Moulton, C.D.; Pickup, J.C.; Ismail, K. The link between depression and diabetes: The search for shared mechanisms. Lancet Diabetes Endocrinol. 2015, 3, 461–471. [Google Scholar] [CrossRef]
- Joseph, J.J.; Golden, S.H. Cortisol dysregulation: The bidirectional link between stress, depression, and type 2 diabetes mellitus. Ann. N. Y. Acad. Sci. 2017, 1391, 20–34. [Google Scholar] [CrossRef]
- Basiri, R.; Seidu, B.; Rudich, M. Exploring the Interrelationships between Diabetes, Nutrition, Anxiety, and Depression: Implications for Treatment and Prevention Strategies. Nutrients 2023, 15, 4226. [Google Scholar] [CrossRef]
- Khawagi, W.Y.; Al-Kuraishy, H.M.; Hussein, N.R.; Al-Gareeb, A.I.; Atef, E.; Elhussieny, O.; Alexiou, A.; Papadakis, M.; Jabir, M.S.; Alshehri, A.A.; et al. Depression and type 2 diabetes: A causal relationship and mechanistic pathway. Diabetes Obes. Metab. 2024, 26, 3031–3044. [Google Scholar] [CrossRef]
- Tabák, A.G.; Akbaraly, T.N.; Batty, G.D.; Kivimäki, M. Depression and type 2 diabetes: A causal association? Lancet Diabetes Endocrinol. 2014, 2, 236–245. [Google Scholar] [CrossRef]
- Gonzalez, J.S.; Peyrot, M.; McCarl, L.A.; Collins, E.M.; Serpa, L.; Mimiaga, M.J.; Safren, S.A. Depression and diabetes treatment nonadherence: A meta-analysis. Diabetes Care 2008, 31, 2398–2403. [Google Scholar] [CrossRef] [PubMed]
- Lustman, P.J.; Anderson, R.J.; Freedland, K.E.; de Groot, M.; Carney, R.M.; Clouse, R.E. Depression and poor glycemic control: A meta-analytic review of the literature. Diabetes Care 2000, 23, 934–942. [Google Scholar] [CrossRef]
- Lin, E.H.B.; Rutter, C.M.; Katon, W.; Heckbert, S.R.; Ciechanowski, P.; Oliver, M.M.; Ludman, E.J.; Young, B.A.; Williams, L.H.; McCulloch, D.K.; et al. Depression and advanced complications of diabetes: A prospective cohort study. Diabetes Care 2010, 33, 264–269. [Google Scholar] [CrossRef] [PubMed]
- van Dooren, F.E.P.; Nefs, G.; Schram, M.T.; Verhey, F.R.J.; Denollet, J.; Pouwer, F. Depression and risk of mortality in people with diabetes mellitus: A systematic review and meta-analysis. PLoS ONE 2013, 8, e57058. [Google Scholar] [CrossRef] [PubMed]
- Fleetwood, K.J.; Wild, S.H.; Licence, K.A.M.; Mercer, S.W.; Smith, D.J.; Jackson, C.A.; Scottish Diabetes Research Network Epidemiology Group. Severe Mental Illness and Type 2 Diabetes Outcomes and Complications: A Nationwide Cohort Study. Diabetes Care 2023, 46, 1363–1371. [Google Scholar] [CrossRef]
- Schram, M.T.; Baan, C.A.; Pouwer, F. Depression and quality of life in patients with diabetes: A systematic review from the European depression in diabetes (EDID) research consortium. Curr. Diabetes Rev. 2009, 5, 112–119. [Google Scholar] [CrossRef]
- Detka, J.; Ślusarczyk, J.; Kurek, A.; Kucharczyk, M.; Adamus, T.; Konieczny, P.; Kubera, M.; Basta-Kaim, A.; Lasoń, W.; Budziszewska, B. Hypothalamic insulin and glucagon-like peptide-1 levels in an animal model of depression and their effect on corticotropin-releasing hormone promoter gene activity in a hypothalamic cell line. Pharmacol. Rep. 2019, 71, 338–346. [Google Scholar] [CrossRef]
- Cooper, D.H.; Ramachandra, R.; Ceban, F.; Di Vincenzo, J.D.; Rhee, T.G.; Mansur, R.B.; Teopiz, K.M.; Gill, H.; Ho, R.; Cao, B.; et al. Glucagon-like peptide 1 (GLP-1) receptor agonists as a protective factor for incident depression in patients with diabetes mellitus: A systematic review. J. Psychiatr. Res. 2023, 164, 80–89. [Google Scholar] [CrossRef]
- Anderberg, R.H.; Richard, J.E.; Hansson, C.; Nissbrandt, H.; Bergquist, F.; Skibicka, K.P. GLP-1 is both anxiogenic and antidepressant; divergent effects of acute and chronic GLP-1 on emotionality. Psychoneuroendocrinology 2016, 65, 54–66. [Google Scholar] [CrossRef]
- Guerrero-Hreins, E.; Goldstone, A.P.; Brown, R.M.; Sumithran, P. The therapeutic potential of GLP-1 analogues for stress-related eating and role of GLP-1 in stress, emotion and mood: A review. Prog. Neuropsychopharmacol. Biol. Psychiatry 2021, 110, 110303. [Google Scholar] [CrossRef]
- Kim, Y.-K.; Kim, O.Y.; Song, J. Alleviation of Depression by Glucagon-Like Peptide 1 Through the Regulation of Neuroinflammation, Neurotransmitters, Neurogenesis, and Synaptic Function. Front. Pharmacol. 2020, 11, 1270. [Google Scholar] [CrossRef]
- Yapici-Eser, H.; Appadurai, V.; Eren, C.Y.; Yazici, D.; Chen, C.-Y.; Öngür, D.; Pizzagalli, D.A.; Werge, T.; Hall, M.-H. Association between GLP-1 receptor gene polymorphisms with reward learning, anhedonia and depression diagnosis. Acta Neuropsychiatr. 2020, 32, 218–225. [Google Scholar] [CrossRef] [PubMed]
- Jin, M.; Zhang, S.; Huang, B.; Li, L.; Liang, H.; Ni, A.; Han, L.; Liang, P.; Liu, J.; Shi, H.; et al. Dulaglutide treatment reverses depression-like behavior and hippocampal metabolomic homeostasis in mice exposed to chronic mild stress. Brain Behav. 2024, 14, e3448. [Google Scholar] [CrossRef] [PubMed]
- Seo, M.K.; Jeong, S.; Seog, D.-H.; Lee, J.A.; Lee, J.-H.; Lee, Y.; McIntyre, R.S.; Park, S.W.; Lee, J.G. Effects of liraglutide on depressive behavior in a mouse depression model and cognition in the probe trial of Morris water maze test. J. Affect. Disord. 2023, 324, 8–15. [Google Scholar] [CrossRef]
- Beck, A.T.; Ward, C.H.; Mendelson, M.; Mock, J.; Erbaugh, J. An inventory for measuring depression. Arch. Gen. Psychiatry 1961, 4, 561–571. [Google Scholar] [CrossRef] [PubMed]
- Hernandez, N.S.; O’Donovan, B.; Ortinski, P.I.; Schmidt, H.D. Activation of glucagon-like peptide-1 receptors in the nucleus accumbens attenuates cocaine seeking in rats. Addict. Biol. 2019, 24, 170–181. [Google Scholar] [CrossRef]
- Erbil, D.; Eren, C.Y.; Demirel, C.; Küçüker, M.U.; Solaroğlu, I.; Eser, H.Y. GLP-1’s role in neuroprotection: A systematic review. Brain Inj. 2019, 33, 734–819. [Google Scholar] [CrossRef]
- Zheng, H.; Reiner, D.J.; Hayes, M.R.; Rinaman, L. Chronic Suppression of Glucagon-Like Peptide-1 Receptor (GLP1R) mRNA Translation in the Rat Bed Nucleus of the Stria Terminalis Reduces Anxiety-Like Behavior and Stress-Induced Hypophagia, But Prolongs Stress-Induced Elevation of Plasma Corticosterone. J. Neurosci. Off. J. Soc. Neurosci. 2019, 39, 2649–2663. [Google Scholar] [CrossRef]
- Clark-Elford, R.; Nathan, P.J.; Auyeung, B.; Voon, V.; Sule, A.; Müller, U.; Dudas, R.; Sahakian, B.J.; Phan, K.L.; Baron-Cohen, S. The effects of oxytocin on social reward learning in humans. Int. J. Neuropsychopharmacol. 2014, 17, 199–209. [Google Scholar] [CrossRef]
- Squire, P.; Naude, J.; Zentner, A.; Bittman, J.; Khan, N. Factors associated with weight loss response to GLP-1 analogues for obesity treatment: A retrospective cohort analysis. BMJ Open 2025, 15, e089477. [Google Scholar] [CrossRef]
Disclaimer/Publisher’s Note: The statements, opinions and data contained in all publications are solely those of the individual author(s) and contributor(s) and not of MDPI and/or the editor(s). MDPI and/or the editor(s) disclaim responsibility for any injury to people or property resulting from any ideas, methods, instructions or products referred to in the content. |
© 2025 by the authors. Licensee MDPI, Basel, Switzerland. This article is an open access article distributed under the terms and conditions of the Creative Commons Attribution (CC BY) license (https://creativecommons.org/licenses/by/4.0/).