
Article

Green Analytical Strategies for Accurate Density Calibration and Measurement in Biotechnology: Propylene Carbonate, Guanidine Hydrochloride and Aqueous Salt Systems as Safe Candidate Standards

Analytical Development, R&D Pharmaceutical Sciences, Baxalta Innovations GmbH (Part of Takeda), Industriestraße 67, 1220 Vienna, Austria
*
Author to whom correspondence should be addressed.
Analytica 2026, 7(3), 60; https://doi.org/10.3390/analytica7030060 (registering DOI)
Submission received: 27 July 2026 / Revised: 24 August 2026 / Accepted: 28 August 2026 / Published: 30 August 2026
(This article belongs to the Special Issue Green Analytical Techniques and Their Applications)

Abstract

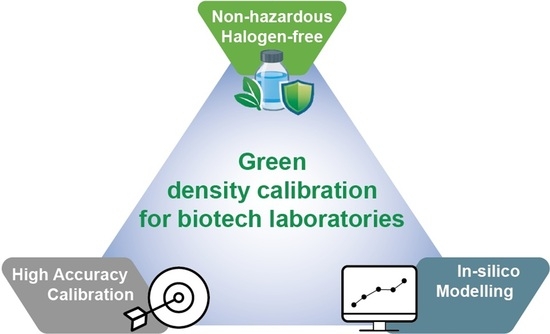
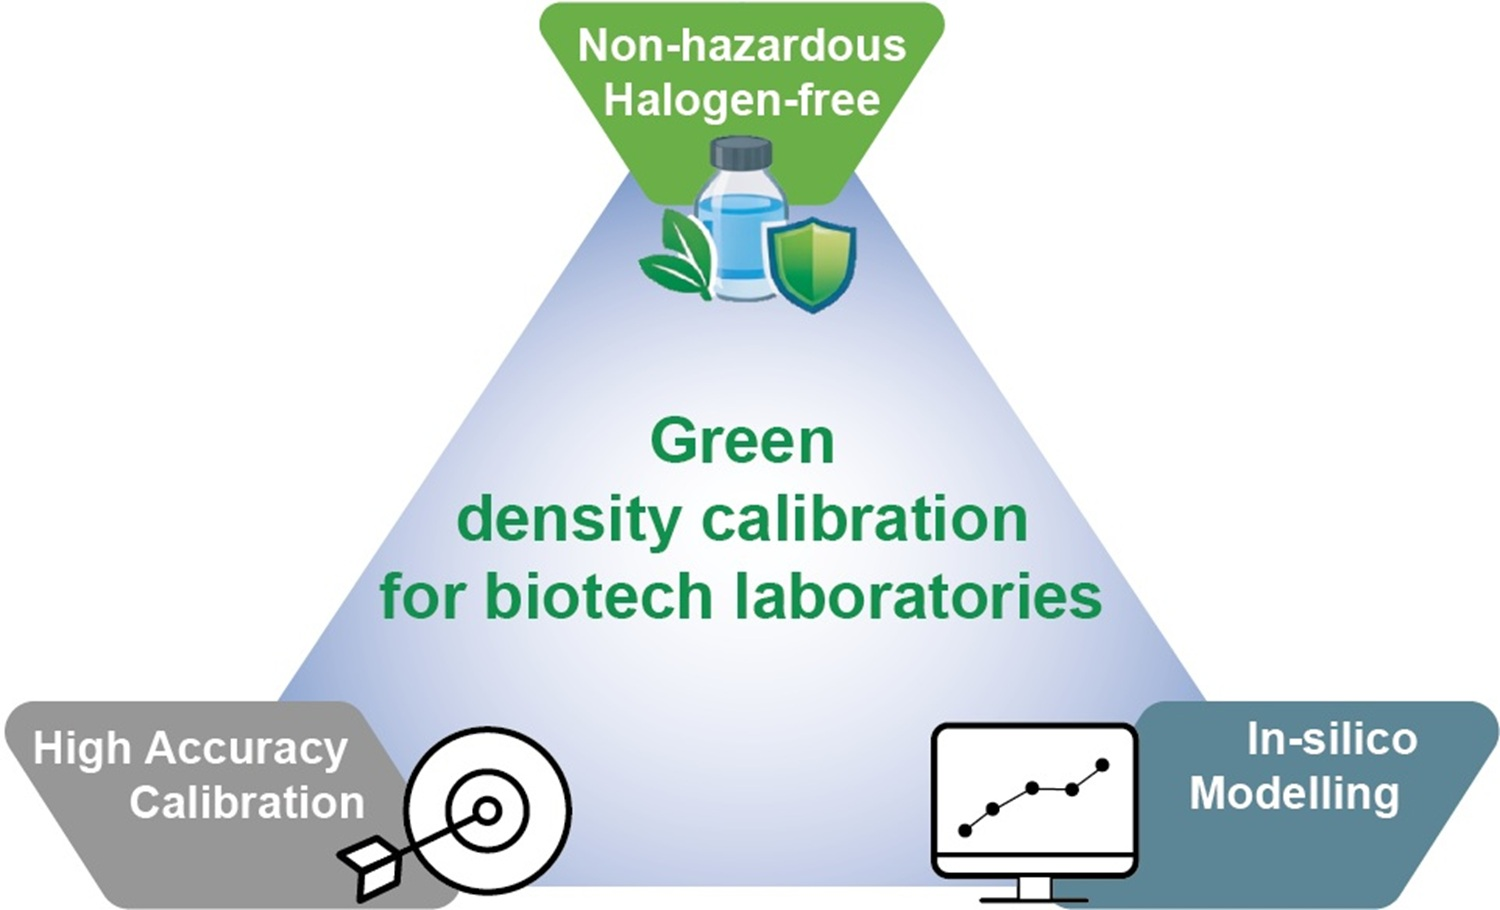
Density measurement with vibrating tube density meters is a fundamental technique in biotechnology, for example, as the metrological base for spectroscopy calibrations. However, conventional multi-point adjustments frequently rely on hazardous halogenated solvents. In this work, green alternatives for density calibration are evaluated with a focus on replacing hazardous substances while maintaining analytical performance. Propylene carbonate is identified as an intrinsic candidate standard for densities up to 1.20 g/mL, eliminating reliance on conventional halogenated liquids. For routine verification and system suitability testing, binary aqueous solutions of sodium chloride and guanidine hydrochloride are proposed as secondary standards. Guanidine hydrochloride solutions provide particular advantages due to their moderate viscosity and high refractometric sensitivity, allowing independent verification of composition and extended usability. In addition, historical density data for NaCl and CsCl solutions were re-evaluated to showcase that in silico modeling can derive density–temperature–composition relations with reasonable overall accuracy. Overall, the proposed approach demonstrates that accurate density calibration in bioanalytical laboratories can be achieved using low-toxicity, non-halogenated substances thereby reducing environmental impact while supporting fit-for-purpose analytical performance.

Graphical Abstract

1. Introduction

The introduction of oscillating tube density meters more than half a century ago has revolutionized the density measurement of fluids, i.e., gases and liquids, and facilitated an accurate determination of partial volumes of mixed liquids and of dissolved solids [1,2,3]. Density measurement is thus a key technique for accurate calibration with minimum uncertainty, as calibration solutions, e.g., for main component measurements in multi-component mixtures by near-infrared, mid-infrared, or Raman spectroscopy, could be prepared by weighing independent of the ambient temperature.
Accurate density calibration is not only a metrological requirement but also impacts analytical efficiency and sustainability. Density errors propagate into concentration uncertainties and may bias spectroscopic calibration models, potentially giving rise to repeat analyses or recalibration. In routine bioanalytical practice, such avoidable analytical uncertainty can translate into increased material consumption and waste. Addressing these issues directly aligns with green analytical chemistry (GAC) principles, including the substitution of hazardous substances, minimization of waste, extension of reagent lifetime through verification rather than replacement, and avoidance of additional experimental campaigns by in silico re-use of legacy data [4,5,6]. Together, these measures demonstrate how routine density metrology in bioanalytical laboratories can be aligned with green analytical chemistry principles without compromising analytical accuracy or robustness. Green analytical chemistry extends the broader concepts of green chemistry to analytical processes, translating the design principles of safer chemicals, waste prevention, and energy efficiency into practical laboratory strategies [7].
In recent decades, the density measurement by the resonance frequency of a fluid-filled oscillating U-shaped tube has become standard practice in food, beverage, and bioprocess laboratory work. In state-of-the-art instrumentation, the highly accurate and precise Peltier thermostatization to approx. 0.01 °C enables a theoretical density accuracy of 0.00001 g/mL. The maximum measurable density of 3 g/mL exceeds by far the relevant range in biotechnology and bioanalytics (up to approx. 1.20 g/mL). Top-of-the-line instruments measure the resonance frequency f of the sample-filled U-shaped glass tube as the oscillation period τ = 1/f with an internal resolution of up to 0.0000001 ms at a temperature resolution of 0.001 °C with a density resolution of 0.000001 g/mL. The actual achievable accuracy (for the standard two-point air/water calibration) may however depend on the internal calibration algorithm and the temperature bias as well as on the temperature, pressure, and relative humidity accuracy for the calculation of air density.
Surprisingly, topics of user instrument qualification, verification, and system suitability tests (SSTs) have apparently received little attention [8,9,10]. As raw data, the density-dependent oscillation period τ of the liquid-filled glass or metal tube is measured. In routine use, the instruments come factory-calibrated for an optional user adjustment on the densities of air (depending on the atmospheric pressure and the relative humidity) and of (air-saturated) water, or water may be at least measured as the SST. The accuracy of the usual two-point calibration may however be insufficient, not only because of the damping effect of viscous samples. The first publication on alcoholometry gave the recommendation to calibrate with a water–ethanol mixture within ±15% (by vol.) for the expected ethanol content for samples containing more than 19% (by vol.) [11]. Follow-up investigations found that the two-point air–water calibration appeared as sufficiently accurate [12,13], as the densities measured always remained in the calibration range.
The question of density calibration and viscosity correction by air and water measurement has been recently discussed and investigated experimentally [14] over the practically relevant density range, demonstrating that even with a top-of-the-line instrument, the basic two-point air–water calibration leads to a bias up to +0.00010 g/mL for tetrachloroethylene with its density well above water. Only a three-point liquid calibration with dodecane, water and tetrachloroethylene gave a good overall agreement of at most ±0.00002 g/mL. For the highest accuracy, a calibration based on 10 organic calibration liquids and water and the respective oscillation periods was described soon after the introduction of this technique [15].
The multi-point calibration of an oscillating tube density meter requires calibration liquids of consistent high purity, which are readily available, e.g., in spectroscopy grade or as anhydrous solvent. If stored properly, i.e., at the recommended temperature range protected from light in a tightly closed container, usually an amber glass bottle, the specified properties are guaranteed by the manufacturer or supplier until the given expiry date. While such liquids may also be available as certified density standards, the consistent purity of the laboratory reagents makes the assumption of a consistent density valid, i.e., the suitability as intrinsic standards without any further recalibration or certification [16]. This also reduces the considerable expenses for certified standards [17] and enable a simple verification of the instrument. Halogenated solvents such as 2,4-dichlorotoluene or bromobenzene [18] with a density above water should however be avoided as much as possible for their possible health hazards and ecotoxicity. Toluene and cyclohexane [19] are low-density calibration liquids. The following subchapters discuss calibration standards for different density ranges as well as chemical characteristics.

1.1. Low-Density Calibration Standards

For densities below water, pentane, isooctane, cyclohexane, and toluene may altogether provide very convenient intrinsic calibration standards covering a range from about 0.62 to 0.87 g/mL. (Benzene has been phased out for its toxicity and substituted by toluene [20].) All these hydrocarbons are available as ultrapure reagents, e.g., for spectroscopy or trace analysis with a specified water content. Other than alcohols, they are practically immiscible with water, of tolerably low health hazard (except for toluene, which is classified as a CMR substance), but they require adequate safety precautions as highly flammable liquids. Advantageously the volumes consumed are small (~2 mL) and can be recovered. The aforementioned volatile hydrocarbons evaporate directly and quickly with the stream of air drying the U-tube; dodecane (d20 = 0.74875 g/mL) with a boiling point of 216.3 °C or lubricating oils available as certified reference materials (Anton Paar, Graz, Austria; H & D Fitzgerald, Tremeirchion, UK) require additional flushing with an organic solvent with a special disposal of the waste. The same applies also for toluene, for which working in a fume hood reduces the exposure hazard.

1.2. High-Density Calibration Standards: Sugar and Salt Solutions

Aqueous protein and buffer solutions exceed the density of water [21]. For the daily work with densities up to 1.28 g/mL, aqueous sucrose solutions may offer a simple and quite convenient intrinsic reference material set, as sucrose is not hygroscopic below at least ~75% relative humidity [22,23], and as the respective densities d20 can be calculated from the mass fraction in vacuo wsucr (0 ≤ w ≤ 1) up to 60% by weight from a fourth degree polynomial regression with an accuracy better than 0.00001 g/mL [24] or from the sixth degree polynomial ICUMSA formula [25] even to the solubility limit at 66% (at 20 °C).
d20 (kg/m3) = 998.203 + 385.1761 × wsucr + 135.3705 × wsucr2 + 40.9299 × wsucr3 − 3.9643 × wsucr4
+ 13.4853 × wsucr5 − 17.289 × wsucr6
Above approx. 40% sucrose by wt., however, the viscosity of the solutions may bias the oscillation period and require an instrument-specific correction algorithm.

1.3. Halogen-Free Medium Density Liquids

As oxygen-rich short-chain hydrocarbon compounds, carbonic acid esters (dimethyl carbonate, propylene carbonate), short-chain lipids (glycerol triacetate = triacetin, glycerol tributyrate = tributyrin), and oxalic and citric acid ethyl esters (e.g., dimethyl oxalate, triethyl citrate and acetyl triethyl citrate) have densities of about 1.03–1.20 g/mL [26,27,28,29] and are considered as safe ingredients in foods and cosmetics. They are at least moderately miscible with water (e.g., 61 g triacetin/L; 58.1 g triethyl citrate/L; 7.2 g acetyl triethyl citrate/L) and may thus contain residual water; for this specific reason they may not all be suitable as primary intrinsic density standards, but they may be calibrated batch-to-batch for use as system suitability standards in the daily laboratory routine. Propylene carbonate, which may absorb water only in humid ambient conditions [30], is a low-viscosity (2.5 cp at 25 °C) cosmetics ingredient [31] used also as an anhydrous and acid-free solvent in electrochemistry, e.g., for lithium batteries. Density data for propylene carbonate–water mixtures exist only for water as an impurity [32], as both liquids are not fully miscible at ambient temperature [33]. Glycerol carbonate is a candidate green solvent also for salts [34], however with a high viscosity of 85.4 cp at 25 °C [35]. Triacetin has been stated as hygroscopic, however any detailed investigations on this property could not be retrieved. Triacetin has a medium-low viscosity (23 cp at 20 °C); triethyl citrate and, in particular, acetyl triethyl citrate differ significantly (32.17 cp at 20 °C and 53.7 cp at 25 °C, resp.), so that the latter may readily cause a viscosity bias in the density measurements [36]. Densities of halogen-free heavy liquids at different temperatures are summarized in Table S1.

1.4. Halogenated Compounds as High Density Liquids

For higher densities exceeding ~1.2 g/mL however, the halogenated hydrocarbons remaining pose certain limitations for a routine application due to their inherent hazards towards health and environment. Chlorofluorocarbons such as trichlorotrifluoroethane = “Freon 113” [37] have been restricted and meanwhile phased out as ozone-depleting. Tetrachloroethene, the solvent common in the dry cleaning of textiles with its relatively moderate health hazard, is currently the liquid reference standard with the highest density (d20 = 1.622685 ± 0.000035 g/mL) calibrated by hydrostatic weighing [38]. It should however be gradually phased out for commercial and consumer use as proposed by the US EPA [39]. Other, heavier halocarbons with bromine and iodide such as, e.g., bromobenzene or methylene iodide may be hazardous to health and photodegrade readily upon illumination with UV or sunlight (as observed for tetrachloroethylene as well).
Fluorinated compounds such as, e.g., hexafluoroisopropanol [40] or sevoflurane (=1,1,1,3,3,3-hexafluoro-2-(fluoromethoxy)propane) [41] combine a high density with a low refractive index. Interestingly neither the well-characterized anesthetic sevoflurane nor the perfluorocarbon perfluorooctane [42], which is available in pharmaceutical-grade high purity [43,44,45] as a “medical device” for the short-term (surgical) intraocular endotamponade against retinal detachment, have found attention as potential reference liquids. The density of perfluorooctane has been given as 1.7672 g/mL [46], 1.7677 g/mL [47], 1.77749 g/mL [48] and later as 1.768496 g/mL for the 98% pure Aldrich reagent [49], as measured with an air–water-calibrated density meter. To analyze the purity of and possible contaminants in ophthalmic perfluorooctane, a toolbox of analytical techniques has been established, such as gas chromatography with mass spectrometric detection, far UV absorbance spectroscopy (220 nm), and FTIR spectroscopy [45]. The impurities have been characterized [43,44,50] and lead to the revision of the medical device-related standard ISO 16672.2020 “Ocular Endotamponades” to incorporate a direct cytotoxicity test [51]. Perfluorooctane can thus be qualified and made available in an “ultra-purity” grade well suitable as a reference material. For their environmental or health hazards, neither perfluorooctane nor sevoflurane would be suitable as day-to-day system suitability standards. As a perfluorinated hydrocarbon analog, perfluorooctane is virtually immiscible with water (29.9 mg/L, calculated) and partially miscible with organic solvents such as toluene, ethanol, acetone, and chloroform. Highly purified to be essentially free from contaminants, it is regarded as biologically non-toxic, but detrimental to the environment due to its chemical and photochemical inertia and environmental persistence. By its infrared absorbance, it exerts an about 8000-fold global warming potential (GWP) in relation to CO2 [52,53] and must thus be handled as carefully, cautiously, and conscientiously as possible. If any evaporation must be avoided as far as possible, the residual droplets in the densimeter tube may be flushed with a short-chain hydrocarbon such as pentane [54]. In comparison, sevoflurane with a short atmospheric lifetime of 1.1 years gives an only about 130-fold GWP over CO2 [55,56], which would make it much easier to justify implementation as a density calibration or verification standard; as an anesthetic it is however a regulated substance.

1.5. Density Calibration Techniques: Relative or Absolute?

The internal calibration routines of the common density meters offer either the two-point air–water calibration or a three-point calibration with an additional heavy liquid. In general, the actual oscillation period can be displayed in the graphical software interface. In practice, a density resolution of 0.00001 g/mL and an accuracy of ±0.00002 g/mL suffice in virtually all applications. A measurement resolution of 10−6 or even 10−7 ms may improve an “external” calibration of the oscillation period vs. the density, but for most liquids, density data have been gauged only to the fifth decimal, with pycnometry and, in particular, hydrostatic weighing preferable over air–water-calibrated density meters (see above). With the fixed position of the U-tube and its connections, its oscillation period can be regarded as absolute, as it is only sample- and instrument-dependent. At least for low-viscosity samples, such an absolute calibration may thus become possible for each individual instrument independently of the internal calibration algorithm. As a great advantage, the aqueous solutions of NaCl, CsCl, and guanidine hydrochloride does not reach viscosities critical in oscillating tube-density measurements.

1.6. Green Alternatives for High-Density Calibration Standards

For user verification above the density range accessible with sucrose and, in particular, for a multi-point calibration of a digital density meter, however, the choice of suitable materials appears to be very limited. High-density liquids may either be pure or mixed halo-organic compounds with hazards towards health and the environment, or aqueous solutions of heavy cation or anion salts, the latter termed “brines” for the flotation of minerals and ores in mining. Other than for sucrose, current and, above all, metrologically traceable density data does not exist for NaCl, CsCl, or guanidine hydrochloride solutions. Historical data may require correction from the relative (to water at 4 °C) to the absolute density [57]. If a temperature conformance at least to the International Temperature Scale of 1927 (ITS-27) is supposed for the historical “International Critical Tables” (ICT) data, one must be aware of the differences between the older scale of up to +23 mK at 323.15 K (50 °C) and the current ITS-90 [58]. The viscosities of such near-saturated salt solutions remain outside the range of the instrumental viscosity bias [59,60,61,62].
An option for a green high-density calibration standard is guanidine hydrochloride. It is available as a high purity-reagent specified for protein fluorescence spectroscopy and is hygroscopic slightly above 50% relative humidity [63,64]. Binary aqueous solutions of guanidine hydrochloride cover a density range of approx. 1.00–1.20 g/mL [61]. A key advantage of aqueous guanidine hydrochloride solutions is their high refractometric sensitivity to concentration changes [65]. Consequently, their actual concentration can be confirmed by refractometry. In this work, the experimental groundwork for employing binary aqueous solutions of guanidine hydrochloride as a high-density calibration standard is demonstrated.
An alternative, resource-efficient and “green” approach for obtaining density data covering a wide density and temperature range could be reassessing available historical data sets using in silico modeling, thus avoiding extensive manual preparation work and handling of significant quantities of chemical materials. Suitable historic data sets are available for NaCl and CsCl aqueous solutions, which are both viable candidates for use as high-density calibration standards. NaCl shows saturation slightly above 26 m-%, limiting the maximum density to approx. 1.19 g/mL, while CsCl as specified for preparative density-gradient ultracentrifugation can achieve densities of up to 1.90 g/mL. The latter is sufficiently stable in air-conditioned environments (40–50% relative humidity) with its hygroscopic point of 65.7% r. h. at 25 °C [66].
This study aims to evaluate a green, non-hazardous calibration and verification framework for vibrating tube density meters in the biotechnology-relevant density range (1.00–1.20 mg/mL). Specifically, it assesses anhydrous propylene carbonate as a non-halogenated primary calibration candidate to replace toxic organic solvents. Additionally, binary aqueous guanidine hydrochloride solutions are investigated as proposed secondary standards for routine verification using refractometry. Finally, as a resource-efficient proof of principle, in silico modeling of legacy NaCl and CsCl data is applied to derive empirical interpolation models.

2. Materials and Methods

The present study, performed in an industrial research laboratory, does not and cannot claim metrological scrutiny such as is standard for a dedicated metrology institute. The instrumentation used was calibrated, maintained and verified to an extent as necessary in a regulated environment, however without any deeper metrological examination and characterization of measurement uncertainty, which are well beyond the capacities and capabilities of the applied research. Reagents were chosen according to the purity grade and profile as specified by the manufacturer or supplier, with tabulated reference data such as liquid density from literature sources presumed reliable and accurate. Sample preparation and measurements were done usually in a single series, as weighing for gravimetric dilution, oscillation time for density, and refractive index constitute the primary and only instrument-dependent measurement values.
In general, anhydrous solvents with a specified purity and residual water content (Table 1) were selected for the oscillation period calibration [15]. The densities of pentane, cyclohexane, and water were taken from the literature [20,67], the densities of isooctane and of toluene from the NIST SRM certificates. The densities of propylene carbonate and of perfluorooctane pooled from ophthalmic medical device samples (with the purity and water content not specified = n. s.) were internally determined using a Reischauer borosilicate glass pycnometer (50.002 mL at 20 °C). The actual temperature of the thermostating water bath (Lauda Ecolab 306 cryostat) was checked with a digital thermometer (Testo 735 with PT100 sensor and 0.05 °C resolution, verified with melting ice from Milli Q-water). For pycnometry, a semi-micro balance (Sartorius MC210P) enabled a weighing resolution of 0.00002 g up to 110 g and 0.00005 g up to 210 g.
The density meter (Rudolph Research DDM2911 in “User Selectable Resolution” mode) was initially calibrated with air and water at 20 °C; water was then measured to obtain the oscillation periods at 20 °C and at 25 °C. The hydrocarbons and propylene carbonate were injected with a glass syringe, water and perfluorooctane with a plastic syringe with a rubber piston. Oscillation period values were rounded to 0.00001 ms. After measurement, the hydrocarbons and perfluorooctane were recovered and recollected into waste bottles or for re-use; only the residual droplets in the tube (<0.1 mL) were allowed to evaporate with the drying air stream. A 4th degree polynomial regression which still allowed a solution by radicals was calculated from 6 density points (n-pentane to propylene carbonate at 20 °C, isooctane to perfluorooctane at 25 °C) with a correlation term R2 = 1.0000000 required to obtain a minimum residual error.
The refractometer (Rudolph Research J357, Rudolph Research Analytical, Hackettstown, NJ, USA, 0.00001 nD resolution) was verified with sucrose solutions at 20 °C according to the ICUMSA refractive index table in OIML R142.
Guanidine hydrochloride (molecular biology grade with UV absorbance specified at 280 and 260 nm) was vacuum-dried (Thermo-Fisher Vacutherm 6025, Thermo-Fisher Scientific, Waltham, MA, USA) and either weighed directly for refractometry or diluted gravimetrically from a weighed stock solution for density measurement on a precision balance with 1 mg resolution. The refractive index was measured at 20 °C. Densities were measured based on the oscillation periods at 20 and 25 °C.
In order to enable the comparison of the environmental hazards and operator safety considerations of the substances discussed in this manuscript, relevant information was summarized in Table S2.

3. Results and Discussion

Density standards serve distinct purposes in routine bioanalytical workflows and should be applied accordingly. Pure, chemically stable liquids such as propylene carbonate act as absolute (intrinsic) standards and are appropriate for multi-point calibration and traceability. Binary aqueous systems (e.g., guanidine hydrochloride or NaCl solutions) are best suited as secondary standards for routine verification within the relevant sample density range. SSTs are used for frequent day-to-day checks close to the expected sample density and are not intended to establish primary traceability. Accordingly, this work introduces propylene carbonate as an absolute density standard and aqueous guanidine hydrochloride solutions as secondary standards for routine verification in bioanalytical laboratories.

3.1. Propylene Carbonate as a Non-Hazardous Halogen-Free Absolute Density Standard

The selection of propylene carbonate was motivated by the need for an environmentally non-hazardous and halogen-free density standard that can replace commonly used medium-to-high-density halogenated reference liquids for daily laboratory work. In the density range relevant to biotechnology and bioanalysis (approx. 1.00–1.20 g/mL), the availability of reference liquids combining high chemical purity, low viscosity, environmental safety, and long-term compositional stability is very limited. Propylene carbonate uniquely meets these criteria while remaining compatible with existing laboratory workflows.
In this study, its density at 20 °C and 25 °C was determined by pycnometry as 1.20477 g/mL and 1.19975 g/mL, respectively. (The density at 15 °C as given in the Supplemental Table S1 was measured separately with an oscillating tube density meter, but not considered as relevant for ambient temperature bioprocessing.) Such results from pycnometry as a laboratory procedure are likely inherently flawed with all related sources of uncertainty, so that only the metrological reference technique of hydrostatic weighing minimizes the measurement uncertainty to the degree required for a reference material, of which the low viscosity enables its use without any viscosity correction. As the battery-grade purity must be essentially anhydrous and free from acid, this should qualify propylene carbonate from a metrological perspective as a promising candidate for an absolute density reference liquid. The regular commercial availability of such a purity grade would justify an evaluation of the respective products from leading manufacturers for their suitability as an intrinsic density calibrant, as well as the calibration and issue as a certified reference material.
In contrast to traditional high-density calibration liquids such as tetrachloroethylene or brominated hydrocarbons, propylene carbonate is non-halogenated, non-volatile, and classified as bio-degradable without any hazards to aquatic organisms, having low acute toxicity, which enables its use in cosmetics. Its implementation therefore aligns directly with key principles of green analytical chemistry, notably the replacement of hazardous substances, waste minimization, and operator safety.

3.2. Multi-Point Calibration of the Digital Density Meter

Improved calibration accuracy directly reduces repeat measurements as well as the propagation of imprecision and bias into derived data. By an oscillation period-based multi-standard calibration technique based on pure substances (six points with a fourth-order polynomial regression) such densities of aqueous salt and buffer solutions as are relevant in biotechnology may be measured with a very high nominal accuracy, as seen from the residual errors (Table 2) and likely from the second derivatives demonstrating the absence of inflection points, which might indicate an “overfitting”. Furthermore, it could be demonstrated that the coefficients A and B in the equation as derived from the two-point (air and water) calibration, assumed as instrument-specific constants in the original publications [1,2], may actually depend on the reference densities. Density data obtained for aqueous sucrose solutions indicates a good agreement (<±0.00005 g/mL) between the measured and the calculated values up to 45 m-% sucrose.
Advantageously, the low volume of propylene carbonate consumed (~3–5 mL) can be simply discarded together with all the other water-miscible samples in a bioanalytical laboratory as non-hazardous waste. The density of propylene carbonate encompasses the densities of aqueous NaCl and guanidine hydrochloride solutions up to the respective saturation limits of ~26 m-% and ~68 m-%, so that such solutions may then be utilized as secondary standards in the actual sample density range.

3.3. Guanidine Hydrochloride Solutions as Binary Aqueous Density Standards

Binary aqueous reference solutions offer a practical way to cover the density range of typical biotechnological samples while avoiding hazardous pure-liquid standards. Their composition can be prepared and independently verified gravimetrically, enabling routine control without certified reference materials. Among common salts, guanidine hydrochloride is particularly well suited, as its aqueous solutions combine moderate viscosity with high refractive index sensitivity, allowing small concentration changes, and thus density deviations, to be reliably detected in routine use. The ability to independently verify composition by refractometry enables prolonged re-use of a single preparation, directly reducing chemical consumption and waste generation. As vibrating tube density meters respond to physical fluid characteristics (density and viscosity) rather than biological identity, aqueous guanidine hydrochloride solutions serve as an ideal surrogate for high-density bioprocess solutions. They span the 1.00–1.20 g/mL density interval characteristic of chromatography elution buffers, cell culture media, and protein formulations, while maintaining a low-viscosity regime that avoids shearing artifacts.
The density determination of the guanidine hydrochloride solutions was based on a near-saturated stock solution of 8.45 mol/L, i.e., 67.40 m-% guanidine hydrochloride in air (UV spectroscopy-grade Pierce 24110, batch AD 405988, vacuum-dried for 72 h at 70 °C to a residual pressure of 4 mbar). The gravimetric dilutions were weighed into conical 50 mL screw-cap polypropylene tubes, requiring to be degassed by ultrasonication before density measurement. Results based on the oscillation periods at 20 and 25 °C are tabulated in Table 3.
Owing to material availability, for the refractive index determination, a different UV spectroscopy-grade material (Sigma-Aldrich 50933, batch BCBD6210V, dry mass determined by vacuum drying as 99.92%) was used, potentially introducing batch-to-batch variability. It was weighed as the dry salt together with water into conical 50 mL screw-cap polypropylene tubes to a concentration of about 8.5 mol/L (Table 4).
Regressions were approximated by a fourth-order polynomic function both for the refractive index and the densities. The maximum residual error did not exceed ±0.00011 g/mL for densities and ±0.00004 nD20 for the refractive index.
The correlation of the calculated density with the calculated refractive index at 20 °C can also be expressed by a fourth-order polynomial function as
d20 = –28.24396310 nD20 4 + 159.82002349 nD20 3 − 339.74964666 nD20 2 + 322.99060497 nD20 − 115.22379765
R2 = 0.99999999
A refractive index variation of 0.00001 nD20 corresponds to a density variation of 0.00001–0.00002 g/mL.
Guanidine hydrochloride constitutes a particularly convenient and economic substance for user-prepared secondary density standard solutions, with the advantages of stability against microbiological spoilage (as a chaotrope) and high refractometric sensitivity, by far better than sodium chloride or cesium chloride. A near-saturated 26 m-% NaCl solution has a refractive index nD20 of just 1.3795 [68], while for a saturated CsCl solution (65.779 m-%), the high density d25 of 1.92536 g/mL corresponds to a comparably modest refractive index nD25 of 1.41937 [69]. If such an alkali chloride solution loses water by evaporation as detectable from the refractive index, the change in density could be calculated only with considerable uncertainty.
High-purity reagents such as UV spectroscopy-grade guanidine hydrochloride as required for such intrinsic standard solutions are expensive, so that such user-prepared standards may be in use for a prolonged time, with repeated opening and closing of the container, e.g., a screw-cap bottle. For a single density check, a volume of just about 2 mL would be consumed, what means that a batch of 100 g may be used up through several weeks. A refractometric check of the actual concentration extends the shelf-life of such a solution, thereby reducing the costs significantly. Furthermore, such high-purity reagents may require power-consuming purification steps to remove impurities, such as melamine in guanidine hydrochloride. The cautious use and sparing consumption of high-purity reagents thus also contribute to sustainability.

3.4. In Silico Modeling of Historical Data

The wide concentration and temperature ranges covered in historical ICT data sets make modeling a practical and resource-efficient alternative approach to experimentally remeasuring these uniquely comprehensive data sets. Reproducing such data experimentally would require extensive manual labor, prolonged instrument time, and the preparation and disposal of substantial quantities of concentrated salt solutions. By attempting to reconstruct and harmonize legacy data, these experimental efforts and associated chemical consumption can be avoided, while still enabling the derivation of practically useful calibration functions.
For in silico modeling, the relative densities of NaCl and CsCl from 10 to 50 °C, as tabulated in the “International Critical Tables” (CsCl: Table S3, NaCl: Table S8), were corrected for the absolute density of water (dT = dT4 × 0.999972) (CsCl: Table S4, NaCl: Table S9). Each data set was modeled using a polynomial surface fit employing a fifth-degree polynomial for m-% and a fourth-degree polynomial for temperature for CsCl (Equation (S1), R2 = 0.99999998, RMSE = 2.971 × 10⁻⁵, coefficients in Table S5), and a fourth-degree polynomial for m-% and a third-degree polynomial for temperature for NaCl (Equation (S2), R2 = 0.99999994, RMSE = 1.666 × 10⁻⁵, coefficients in Table S10). These polynomial relations were then used to calculate modeled density values for CsCl (Table S6) and NaCl (Table S11) across the full concentration and temperature ranges covered by the ICT data set. The resulting residuals are below ±0.00008 g/mL for CsCl (Table S7) and below ±0.00005 g/mL for NaCl (Table S12). Although the high density of data points with concentration increments of at most 5% supports polynomial surface fits with high internal precision, these statistics reflect only goodness-of-fit to the legacy data and must not be confused with true metrological accuracy. The absolute accuracy of these early measurements remains limited by the metrological constraints of the period. To ensure appropriate application, each fitted equation is bounded by its specific calibration envelope. For calculation of the density of CsCl solutions, Equation (S1) is valid in the ranges of 10–50 °C and 1–60 m-%, whereas uncertainties increase at higher concentration ranges (see Table S7). Equation (S2) is valid for calculation of the density of NaCl solutions in the ranges of 10–50 °C and 1–26 m-%. High-order polynomials are prone to severe edge artifacts and rapid divergence outside their parameterized boundaries. Consequently, these equations should not be used for extrapolation beyond the stated concentration and temperature ranges.
More recent density data sets for these salts are available from 15 to 55 °C, traceable to pycnometric measurements [62], see Table S13 for CsCl and Table S18 for NaCl. After conversion from mol-% to m-% (Table S14), the CsCl data were modeled by a polynomial surface fit employing a fifth-degree polynomial for m-% and a second-degree polynomial for temperature (Equation (S3), R2 = 0.99999987, RMSE = 9.671 × 10⁻⁵, coefficients in Table S15). The modeled density data for CsCl are shown in Table S16, residuals (Table S17) are below ±0.00021 g/mL. The converted density data for NaCl (Table S19) were modeled by a polynomial surface fit employing a fifth-degree polynomial for m-% and a second-degree polynomial for temperature (Equation (S4), R2 = 0.9999995, RMSE = 4.892 × 10⁻⁵, coefficients in Table S20). The fitted density values for NaCl are summarized in Table S21, residuals (Table S22) are below ±0.00008 g/mL, when disregarding the residual of ~0.00022 g/mL of the data point at 30 °C and 10.46 m-%. This data point was flagged as a potential typo during data integrity testing identified through a clear deviation from the empirical trend of the concentration-temperature series. As reflected by the larger residuals, particularly for CsCl, these more recent but also less dense data traceable to pycnometry did not support a fit with comparably low residuals and RMSE values for the overall fit. Also, here, it should be noted that Equations (S3) and (S4) should only be used for interpolating density values, which are covered by the specific data set ranges, i.e., 15–55 °C, 0–57.39 m-% for CsCl and 15–55 °C, 0–22.26 m-% for NaCl.
By reconstructing and harmonizing these legacy data sets, practical density–temperature–composition interpolation models can be established as a proof-of-principle for routine verification in bioanalytical workflows. Tables S23 and S24 show the differences between calculated NaCl and CsCl densities derived from historical CsCl values from “International Critical Tables” or from the more recent pycnometric measurements [62]. The differences are generally below 0.0001 g/mL at low concentrations; however, these discrepancies increase substantially at higher concentrations, reaching up to 0.001 g/mL for concentrated CsCl. This discrepancy is an order of magnitude larger than the internal fit residuals and highlights the impact of historical uncertainties in mass-fraction determination and viscosity effects at high solute concentrations. In this region, uncertainties in mass-fraction determination and viscosity effects are substantially amplified, causing small experimental inaccuracies to propagate non-linearly into density values. In this context, the critical question about the actual accuracy of such historical data must remain open, however, as the mechanical beam balance weighing technology was limited by the overall accuracy of the weight sets used. The models can thus be regarded with all due caution only as a proof-of-principle, but not as a valid definition.

4. Conclusions

In conclusion, this study demonstrates that an oscillation period-based multi-point calibration using green, low-toxicity reference materials provides an effective alternative to conventional halogenated standards for vibrating tube density meters in the biotechnology-relevant range (1.00 to 1.20 g/mL). Propylene carbonate was successfully evaluated as a non-hazardous primary calibration candidate, effectively minimizing residual measurement bias across the target density range. For routine verification, binary aqueous guanidine hydrochloride solutions proved highly suitable as proposed secondary standards for routine system suitability testing, offering high refractometric sensitivity that allows rapid compositional verification and extended solution re-use.
The proposed calibration and verification strategy is readily transferable to routine analytical laboratories. All reference substances discussed are commercially available in high-purity reagent grades from established suppliers. No specialized waste handling or disposal procedures are required, as halogenated and otherwise hazardous reference liquids are deliberately avoided. The use of gravimetrically prepared aqueous standards, traceable temperature control, and documented verification steps is fully compatible with regulated (GxP) laboratory environments, making the approach suitable for routine deployment beyond the present study.
Finally, in silico modeling of historical NaCl and CsCl data set established practical empirical interpolation models as a proof-of-principle for data re-use. In view of the multi-source ICT data compiled about a century ago from a multitude of earlier works, a state-of-the-art recalibration traceable to fundamental metrics as feasible only by or through metrology institutes would nevertheless be desirable, but may require considerable efforts (and thus expenses) as reported by the work on sucrose and other sugar solutions in the past. The criticality of accuracy in pharmaceutical biotechnology may however justify such a joint effort by industry, academia, and metrology institutes with the benefit of green, non-hazardous, and user-accessible candidate standard materials.

Supplementary Materials

The following supporting information can be downloaded at: https://www.mdpi.com/article/10.3390/analytica7030060/s1, Table S1: Densities of halogen-free heavy liquids at different temperatures. Table S2: Environmental hazards and operator safety considerations of density calibration substances. Table S3: Relative densities of CsCl from 10 to 50 °C as tabulated in the “International Critical Tables”. Table S4: Densities of CsCl from 10 to 50 °C as tabulated in the “International Critical Tables”, corrected for the absolute density of water. Equation S1: Equation for calculation of the density of CsCl solutions (dTm%) as a function of temperature T and m-% CsCl, based on a fit to literature data tabulated in the “International Critical Tables”, corrected for the absolute density of water. Table S5: Coefficients and their values for Equation S1. Table S6: Relative densities of CsCl from 10 to 50 °C as calculated by Equation S1. Table S7: Residuals between densities of CsCl from 10 to 50 °C as tabulated in the “International Critical Tables”, corrected for the absolute density of water (Table S3) and calculated by Equation S1 (Table S5). Table S8: Relative densities of NaCl from 10 to 50 °C as tabulated in the “International Critical Tables”. Table S9: Relative densities of NaCl from 10 to 50 °C as tabulated in the “International Critical Tables”, corrected for the absolute density of water. Equation S2: Equation for calculation of the density of NaCl solutions (dTm%) as a function of temperature T and m-% NaCl, based on a fit to literature data tabulated in the “International Critical Tables”, corrected for the absolute density of water. Table S10: Coefficients and their values for Equation S2. Table S11: Relative densities of NaCl from 10 to 50 °C, as calculated by Equation S2. Table S12: Residuals between densities of NaCl from 10 to 50 °C as tabulated in the “International Critical Tables”, corrected for the absolute density of water (Table S9) and calculated by Equation S2 (Table S11). Table S13: Densities of CsCl from 15 to 55 °C obtained from pycnometric measurements. Table S14: Densities of CsCl from 15 to 55 °C obtained from pycnometric measurements, converted to m-%. Equation S3: Equation for calculation of the density of CsCl solutions (dTm%) as a function of temperature T and m-% CsCl, based on a fit to literature data obtained from pycnometric measurements. Table S15: Coefficients and their values for Equation S3. Table S16: Densities of CsCl from 15 to 55 °C as calculated by Equation S3. Table S17: Residuals between densities of CsCl from 15 to 55 °C, obtained from pycnometric measurements (Table S14) and calculated by Equation S3 (Table S16). Table S18: Densities of NaCl from 15 to 55 °C obtained from pycnometric measurements. Table S19: Densities of NaCl from 15 to 55 °C obtained from pycnometric measurements, converted to m-%. Equation S4: Equation for calculation of the density of NaCl solutions (dTm%) as a function of temperature T and m-% NaCl, based on a fit to literature data obtained from pycnometric measurements. Table S20: Coefficients and their values for Equation S4. Table S21: Densities of NaCl from 15 to 55 °C as calculated by Equation S4. Table S22: Residuals between densities of NaCl from 15 to 55 °C, obtained from pycnometric measurements (Table S19) and calculated by Equation S4 (Table S21). Table S23: Difference between calculated NaCl densities derived from historical NaCl values from “International Critical Tables” and pycnometric measurements. Table S24: Difference between calculated CsCl densities derived from historical CsCl values from “International Critical Tables” and pycnometric measurements.

Author Contributions

Conceptualization, H.A. and R.P.; methodology, H.A.; software, A.S.; formal analysis, H.A. and A.S.; investigation, H.A.; resources, M.L.; data curation, H.A. and A.S.; writing—original draft preparation, H.A. and A.S.; writing—review and editing, H.A., A.S., R.P. and M.L.; project administration, R.P. and M.L.; funding acquisition, R.P. and M.L. All authors have read and agreed to the published version of the manuscript.

Funding

This study was funded by Baxalta Innovations GmbH, a Takeda company.

Data Availability Statement

The original contributions presented in this study are included in the article/Supplementary Materials.

Conflicts of Interest

All authors were employees of Baxalta Innovations GmbH (part of Takeda) at the time of the study and may be owners of stock options.

References

  1. Stabinger, H.; Leopold, H.; Kratky, O. Eine neue Methode zur Präzisionsmessung der Dichte von Flüssigkeiten [a new method for the precision measurement of liquids]. Monatshefte Chem. 1967, 98, 436–438. [Google Scholar] [CrossRef] [Scilit]
  2. Kratky, O.; Leopold, H.; Stabinger, H. Dichtemessungen an Flüssigkeiten und Gasen auf 10-6 g/cm3 bei 0.6 cm3 Präparatvolumen [density measurements on liquids and gases to 10-6 g/cm3 with 0.6 cm3 sample volume]. Z. Angew. Phys. 1969, 27, 273–277. [Google Scholar]
  3. Kratky, O.; Leopold, H.; Stabinger, H. The determination of the partial specific volume of proteins by the mechanical oscillator technique. In Methods in Enzymology; Academic Press: New York, NY, USA, 1973; Volume 27, pp. 98–110. [Google Scholar]
  4. Gałuszka, A.; Migaszewski, Z.; Namieśnik, J. The 12 principles of green analytical chemistry and the SIGNIFICANCE mnemonic of green analytical practices. TrAC Trends Anal. Chem. 2013, 50, 78–84. [Google Scholar] [CrossRef] [Scilit]
  5. Meher, A.K.; Zarouri, A. Green Analytical Chemistry—Recent Innovations. Analytica 2025, 6, 10. [Google Scholar] [CrossRef] [Scilit]
  6. Handlovic, T.T.; Roy, D.; Farooq, M.Q.; Leme, G.M.; Crossley, K.; Haidar Ahmad, I.A. In silico modeling enables greener analytical and preparative chromatographic methods. Green. Chem. 2025, 27, 109–119. [Google Scholar] [CrossRef] [Scilit]
  7. Anastas, P.T.; Warner, J.C. Green Chemistry: Theory and Practice; Oxford University Press: New York, NY, USA, 1998. [Google Scholar]
  8. Furtado, A.; Moutinho, J.; Moura, S.; Oliveira, F.; Filipe, E. The role of adequate reference materials in density measurements in hemodialysis. J. Phys. Conf. Ser. 2015, 588, 012051. [Google Scholar] [CrossRef] [Scilit]
  9. Furtado, A.; Pellegrino, O.; Peireira, J.; Filipe, E. Oscillation-type density meter calibration in viscosity by ICUMSA sucrose solutions. In Proceedings of the XXI IMEKO World Congress “Measurement in Research and Industry”, Prague, Czech Republic, 30 August–4 September 2015. [Google Scholar]
  10. Furtado, A.; Moura, S.; Pereira, J.; Moutinho, J.; Oliveira, F.; Godinho, I. The importance of the use of adequate reference materials in density measurements performed in hemodialysis treatments. Measurement 2016, 79, 349–353. [Google Scholar] [CrossRef] [Scilit]
  11. Strunk, D.H.; Hamman, J.W.; Timmel, B.M. Determination of proof of distilled alcoholic beverages, using an oscillating U-tube density meter. J. Assoc. Off. Anal. Chem. 1979, 62, 653–658. [Google Scholar] [CrossRef] [Scilit]
  12. Mark, F.G.; Vaughn, T.E. Determination of proof of alcoholic beverages using oscillating U-tube density meter. J. Assoc. Off. Anal. Chem. 1980, 63, 970–972. [Google Scholar] [CrossRef] [Scilit]
  13. Kovar, J. Oscillating U-tube density meter determination of alcoholic strength—Analysis of parameter errors. J. Assoc. Off. Anal. Chem. 1981, 64, 1424–1430. [Google Scholar] [CrossRef] [Scilit]
  14. Wagner, Z.; Bendová, M.; Rotrekl, J.; Sykorová, A.; Canji, M.; Parmar, N. Density and sound velocity measurement by an Anton Paar DSA 5000 density meter: Precision and long-time stability. J. Mol. Liq. 2021, 329, 115547. [Google Scholar] [CrossRef] [Scilit]
  15. Kiyohara, O.; Benson, G.C. Determination of excess volumes of cyclohexane + benzene mixtures with a mechanical oscillator densimeter. Can. J. Chem.-Rev. Can. Chim. 1973, 51, 2489–2491. [Google Scholar] [CrossRef] [Scilit]
  16. McLinden, M. CHAPTER 2: Experimental Techniques 1: Direct Methods; Royal Society of Chemistry: Cambridge, UK; RSC Publishing: Cambridge, UK, 2014. [Google Scholar]
  17. McLinden, M. CHAPTER 4: Density Standards and Traceability; Royal Society of Chemistry: Cambridge, UK; RSC Publishing: Cambridge, UK, 2014. [Google Scholar]
  18. Schilling, G.; Kleinrahm, R.; Wagner, W. Measurement and correlation of the (p,ρ,T) relation of liquid n-heptane, n-nonane, 2,4-dichlorotoluene, and bromobenzene in the temperature range from (233.15 to 473.15) K at pressures up to 30 MPa for use as density reference liquids. J. Chem. Thermodyn. 2008, 40, 1095–1105. [Google Scholar] [CrossRef] [Scilit]
  19. Sommer, D.; Kleinrahm, R.; Span, R.; Wagner, W. Measurement and correlation of the (p,ρ,T) relation of liquid cyclohexane, toluene, and ethanol in the temperature range from 233.15 K to 473.15 K at pressures up to 30 MPa for use as density reference liquids. J. Chem. Thermodyn. 2011, 43, 117–132. [Google Scholar] [CrossRef] [Scilit]
  20. Riddick, J.A.; Bunger, W.B.; Sakano, T.K. Organic Solvents: Physical Properties and Methods of Purification, 4th ed.; John Wiley and Sons: New York, NY, USA, 1986. [Google Scholar]
  21. Gardi, A.; Degen, P. Determination of the concentration of plasma proteins by density measurement. Dev. Biol. Stand. 1979, 44, 11–17. [Google Scholar]
  22. Donelly, B.; Fruin, J.; Scallet, B. Reactions of oligosaccharides. III. Hygroscopic Properties. Cereal Chem. 1973, 50, 512–519. [Google Scholar]
  23. Yao, W.; Yu, X.; Lee, J.W.; Yuan, X.D.; Schmidt, S.J. Measuring the deliquescence point of crystalline sucrose as a function of temperature using a new automatic isotherm generator. Int. J. Food Prop. 2011, 14, 882–893. [Google Scholar] [CrossRef] [Scilit]
  24. Wagenbreth, H.; Toth, H.; Koždón, A.; Emmerich, A. Neue Messungen der Dichte wäßriger Saccharoselösungen [new measurements of the density of aqueous sucrose solutions]. PTB Mitteilungen 1988, 98, 198–204. [Google Scholar]
  25. Mettler-Toledo, A.G. Selected Analytical Methods for the Sugar Industry (Application Brochure 41); Mettler-Toledo AG: Greifensee, Switzerland, 2018. [Google Scholar]
  26. Finkelstein, M.; Gold, H. Toxicology of the citric acid esters—Tributyl citrate, acetyl tributyl citrate, triethyl citrate, and acetyl triethyl citrate. Toxicol. Appl. Pharmacol. 1959, 1, 283–298. [Google Scholar] [CrossRef] [Scilit]
  27. Gouw, T.; Vlugter, J. Physical properties of triglycerides. I. Density and refractive index. Fette Seifen Anstrichm. 1979, 68, 999–1002. [Google Scholar] [CrossRef] [Scilit]
  28. Fiume, M.Z.; Panel, C.R.E. Final report on the safety assessment of triacetin. Int. J. Toxicol. 2003, 22, 1–10. [Google Scholar] [CrossRef] [Scilit]
  29. Wankhede, D.; Wankhede, N.; Lande, M.; Arbad, B. Densities and viscosities of propylene carbonate with aromatic hydrocarbons (benzene, 1,4-dimethylbenzene and ethylbenzene) at 288.15, 298.15 and 308.15K. Phys. Chem. Liq. 2008, 46, 319–327. [Google Scholar] [CrossRef] [Scilit]
  30. Fujinaga, T.; Izutsu, K. Propylene carbonate: Purification and tests for purity. Pure Appl. Chem. 1971, 27, 273–280. [Google Scholar] [CrossRef] [Scilit]
  31. Busch, J. Final report on the safety assessment of propylene carbonate. J. Am. Coll. Toxicol. 1987, 6, 23–51. [Google Scholar] [CrossRef] [Scilit]
  32. Kushare, S.K.; Dagade, D.H.; Patil, K.J. Volumetric and compressibility properties of liquid water as a solute in glycolic, propylene carbonate, and tetramethylurea solutions at T = 298.15 K. J. Chem. Thermodyn. 2008, 40, 78–83. [Google Scholar] [CrossRef] [Scilit]
  33. Catherall, N.F.; Williamson, A.G. Mutual solubilities of propylene carbonate and water. J. Chem. Eng. Data 1971, 16, 335–336. [Google Scholar] [CrossRef] [Scilit]
  34. Sarri, F.; Tatini, D.; Tanini, D.; Simonelli, M.; Ambrosi, M.; Ninham, B.W.; Capperucci, A.; Dei, L.; Lo Nostro, P. Specific ion effects in non-aqueous solvents: The case of glycerol carbonate. J. Mol. Liq. 2018, 266, 711–717. [Google Scholar] [CrossRef] [Scilit]
  35. Ochoa-Gómez, J.R.; Gómez-Jiménez-Aberasturi, O.; Ramírez-López, C.; Belsué, M. A brief review on industrial alternatives for the manufacturing of glycerol carbonate, a green chemical. Org. Process Res. Dev. 2012, 16, 389–399. [Google Scholar] [CrossRef] [Scilit]
  36. Bernhardt, J.; Pauly, H. Pycnometric vs. densimetric measurements of highly viscous protein solutions. J. Phys. Chem. 1980, 84, 158–162. [Google Scholar] [CrossRef] [Scilit]
  37. Fitzgerald, D.; Fitzgerald, H. Hydrostatic weighing and sources of uncertainty in the calibration of density meters. In Proceedings of the 3rd Conference on Weighing, Calibration & Quality Standards in the 1990’s, Sheffield, UK, 17–18 May 1994; pp. 25–35. [Google Scholar]
  38. Buchner, C.; Zelenka, Z.; Kajastie, H.; Madec, T.; Wolf, H.; Vámossy, C.; Lorefice, S.; Garberg, T.; Lenard, E.; Spohr, I.; et al. Key comparison of liquid density standards. Metrologia 2015, 52, 07015. [Google Scholar] [CrossRef] [Scilit]
  39. US Federal Register. 16 June 2023. Available online: https://www.govinfo.gov/content/pkg/FR-2023-06-16/pdf/FR-2023-06-16.pdf (accessed on 19 March 2026).
  40. Mainar, A.M.; Pardo, J.; García, J.I.; Royo, F.R.; Urieta, J.S. Solubility of gases in fluoroorganic alcohols—Part I. Solubilities of several non-polar gases in 1,1,1,3,3,3-hexafluoropropan-2-ol at 298.15 K and 101.33 kPa. J. Chem. Soc.-Faraday Trans. 1998, 94, 3595–3599. [Google Scholar] [CrossRef] [Scilit]
  41. Laster, M.J.; Fang, Z.X.; Eger, E.I. Specific gravities of desflurane, enflurane, halothane, isoflurane, and sevoflurane. Anesth. Analg. 1994, 78, 1152–1153. [Google Scholar] [CrossRef] [Scilit]
  42. Haszeldine, R.N.; Smith, F. Organic fluorides. 4. The chemical and physical properties of certain fluorocarbons. J. Chem. Soc. 1951, 154, 603–608. [Google Scholar] [CrossRef] [Scilit]
  43. Menz, D.H.; Feltgen, N.; Menz, H.; Müller, B.K.; Lechner, T.; Dresp, J.; Hoerauf, H. How to ward off retinal toxicity of perfluorooctane and other perfluorocarbon liquids? Investig. Ophthalmol. Vis. Sci. 2018, 59, 4841–4846. [Google Scholar] [CrossRef] [Scilit]
  44. Menz, D.H.; Feltgen, N.; Lechner, T.; Menz, H.; Müller, B.K.; Dresp, J.; Hoerauf, H. Hydrofluoric acid and other impurities in toxic perfluorooctane batches. Transl. Vis. Sci. Technol. 2019, 8, 24. [Google Scholar] [CrossRef] [Scilit]
  45. Dresp, J.H. Benchmarking different brands of perfluorocarbon liquids. Graefe’s Arch. Clin. Exp. Ophthalmol. 2021, 259, 21–27. [Google Scholar] [CrossRef] [Scilit]
  46. Brice, T.J.; Coon, R.I. The effects of structure on the viscosities of perfluoroalkyl ethers and amines. J. Am. Chem. Soc. 1953, 75, 2921–2925. [Google Scholar] [CrossRef] [Scilit]
  47. Mustafaev, M.; Naziev, Y.; Kagramanov, M. The density of some perfluorocarbons in a wide range of state parameters. Teplofiz. Vysok. Temp. 1995, 33, 359–366. [Google Scholar]
  48. Dias, A.M.A.; Caço, A.I.; Coutinho, J.A.P.; Santos, L.M.N.B.F.; Piñeiro, M.M.; Vega, L.F.; Gomes, M.F.C.; Marrucho, I.M. Thermodynamic properties of perfluoro-octane. Fluid Phase Equilibria 2004, 225, 39–47. [Google Scholar] [CrossRef] [Scilit]
  49. Morgado, P.; Ben Lewis, J.; Laginhas, C.M.C.; Martins, L.F.G.; McCabe, C.; Blas, F.J.; Filipe, E.J.M. Systems involving hydrogenated and fluorinated chains: Volumetric properties of perfluoroalkanes and perfluoroalkylalkane surfactants. J. Phys. Chem. B 2011, 115, 15013–15023. [Google Scholar] [CrossRef] [Scilit]
  50. Srivastava, G.K.; Andrés-Iglesias, C.; Coco, R.M.; Fernandez-Bueno, I.; Medina, J.; García-Serna, J.; Dueñas, A.; Rull, F.; Pastor, J.C. Chemical compounds causing severe acute toxicity in heavy liquids used for intraocular surgery. Regul. Toxicol. Pharm. 2020, 110, 104527. [Google Scholar] [CrossRef] [Scilit]
  51. International Standard ISO 16672.2020; “Ocular Endotamponades”. International Standard Organization: Vernier, Switzerland, 2020.
  52. Bravo, I.; Aranda, A.; Hurley, M.D.; Marston, G.; Nutt, D.R.; Shine, K.P.; Smith, K.; Wallington, T.J. Infrared absorption spectra, radiative efficiencies, and global warming potentials of perfluorocarbons: Comparison between experiment and theory. J. Geophys. Res. Atmos. 2010, 115, D24317. [Google Scholar] [CrossRef] [Scilit]
  53. Ivy, D.J.; Rigby, M.; Baasandorj, M.; Burkholder, J.B.; Prinn, R.G. Global emission estimates and radiative impact of C4F10, C5F12, C6F14, C7F16 and C8F18. Atmos. Chem. Phys. 2012, 12, 7635–7645. [Google Scholar] [CrossRef] [Scilit]
  54. Deepika; Pandey, S. Density and dynamic viscosity of perfluorodecalin-added n-hexane mixtures: Deciphering the role of fluorous liquids. Liquids 2023, 3, 48–56. [Google Scholar] [CrossRef] [Scilit]
  55. Vollmer, M.K.; Rhee, T.S.; Rigby, M.; Hofstetter, D.; Hill, M.; Schoenenberger, F.; Reimann, S. Modern inhalation anesthetics: Potent greenhouse gases in the global atmosphere. Geophys. Res. Lett. 2015, 42, 1606–1611. [Google Scholar] [CrossRef] [Scilit]
  56. Andersen, M.P.S.; Nielsen, O.J.; Karpichev, B.; Wallington, T.J.; Sander, S.P. Atmospheric chemistry of isoflurane, desflurane, and sevoflurane: Kinetics and mechanisms of reactions with chlorine atoms and OH radicals and global warming potentials. J. Phys. Chem. A 2012, 116, 5806–5820. [Google Scholar] [CrossRef] [Scilit]
  57. National Research Council. International Critical Tables of Numerical Data, Physics, Chemistry and Technology; National Research Council: Washington, DC, USA, 1928; Volume III.
  58. Goldberg, R.N. Conversion of temperatures and thermodynamic properties to the basis of the international temperature scale of 1990. Pure Appl. Chem. 1992, 64, 1545–1562. [Google Scholar] [CrossRef] [Scilit]
  59. Rabinowitsch, A. Über die anomale Dissoziation in wässerigen Lösungen. I. Abhandlung [On the anomalous dissociation in aqueous solutions. 1st treatise]. Z. Phys. Chem. 1921, 99, 338–360. [Google Scholar]
  60. Satoh, T.; Hayashi, K. The viscosity of concentrated aqueous solutions of strong electrolytes. Bull. Chem. Soc. Jpn. 1961, 34, 1260–1264. [Google Scholar] [CrossRef] [Scilit]
  61. Kawahara, K.; Tanford, C. Viscosity and density of aqueous solutions of urea and guanidine hydrochloride. J. Biol. Chem. 1966, 241, 3228–3232. [Google Scholar] [CrossRef] [Scilit]
  62. Isono, T. Measurements of density, viscosity and electrolytic conductivity of concentrated aqueous electrolyte solutions. I. Lithium chloride, sodium chloride, potassium chloride, rubidium chloride, cesium chloride, magnesium sulfate, zinc sulfate and nickel sulfate. Rikagaku Kenkyusho Hokoku 1980, 56, 103–114. [Google Scholar]
  63. Teraoka, R.; Matsuda, Y.; Sugimoto, I. Effects of diluents and packing materials on the hygroscopic properties of guanidine hydrochloride. Jpn. J. Pharm. Health Care Sci. 2002, 28, 521–529. [Google Scholar] [CrossRef] [Scilit]
  64. Chaves, M.K.; Kelly, R.C.; Milne, J.E.; Burke, S.E. Data-driven approach to mitigate quality impact of hygroscopic pharmaceutical raw materials throughout the supply chain. Pharm. Dev. Technol. 2022, 27, 511–524. [Google Scholar] [CrossRef] [Scilit]
  65. Nozaki, Y. The preparation of guanidine hydrochloride. In Methods in Enzymology; Academic Press: New York, NY, USA, 1972; Volume 26, pp. 43–50. [Google Scholar]
  66. Tereshchenko, A.G. Structuring of reference data on the hygroscopic points of soluble substances in the range 41–69% RH. J. Chem. Thermodyn. 2022, 171, 106790. [Google Scholar] [CrossRef] [Scilit]
  67. Bettin, H.; Spieweck, F. Die Dichte des Wassers als Funktion der Temperatur nach Einführung der Internationalen Temperaturskala von 1990 [water density as a function of temperature after the introduction of the International Temperature Scale of 1990]. PTB-Mitteilungen 1990, 100, 195–196. [Google Scholar]
  68. Wolf, A. Aqueous Solutions and Body Fluids. Their Concentrative Properties and Conversion Tables; Harper & Row, Publishers: New York, NY, USA, 1966. [Google Scholar]
  69. Zhao, W.X.; Hu, M.C.; Jiang, Y.C.; Li, S.N. Solubilities, densities and refractive indices of rubidium chloride or cesium chloride in ethanol aqueous solutions at different temperatures. Chin. J. Chem. 2007, 25, 478–483. [Google Scholar] [CrossRef] [Scilit]

Table 1. Specifications of calibration liquids.
Calibration LiquidGradeSupplierCatalog No.Batch% Purity% Water
pentaneanhydrousSigma-Aldrich236705-250 mL102603154 SHBP3104≥99≤0.001
isooctanespectroscopy grade (Uvasol)Supelco1.04718.0500I1290818 329≥99.8≤0.005
cyclohexanespectroscopy grade (Uvasol)Supelco1.02822.0500I1224622 230≥99.9≤0.005
tolueneanalytical gradeSupelco1.08325.1000K53971725 202≥99.9≤0.03
water, air-saturatedreverse osmosis-purified freshwaterMillipore
Milli-Q
------------
propylene carbonateanhydrousSigma-Aldrich310325-500 mL102628696 SHBQ3977≥99.7≤0.002
perfluorooctaneophthalmic medical devicenot disclosed------n. s. n. s.
Note: Sigma-Aldrich, Supelco, Millipore, and Milli-Q are affiliate brands of Merck KGaA, Darmstadt, Germany.
Table 2. Results of density calibration.
Calibration Liquidd20 (g/mL)τ/ms (20 °C)d20 Calc.Residued25 (g/mL)τ/ms (25 °C)d25 Calc.Residue
pentane0.626242.717090.626240.000000.621392.71264------
isooctane0.691872.770590.69186−0.000010.687752.767080.687750.00000
cyclohexane0.778552.839640.778560.000010.773892.835560.773890.00000
toluene0.866862.908280.86685−0.000010.862222.904310.86221−0.00001
water0.998203.007540.998200.000000.997043.006270.997040.00000
propylene carbonate1.204773.157151.204770.000001.199753.152961.199750.00000
perfluorooctane1.766573.53254------1.754113.523971.754110.00000
Table 3. Density measurement of aqueous guanidine hydrochloride solutions (mass content in air) at 20 °C and 25 °C.
g GuHCl/kgτ/ms (20 °C)d20 g/mLg/L 20 °Cmol/L 20 °Cτ/ms (25 °C)d25 g/mLg/L 25 °Cmol/L 25 °C
0.000003.007540.998200.000000.000003.006270.997040.000000.00000
39.956603.016201.0098740.350970.422393.014811.0085640.298620.42184
79.716493.024631.0212681.411260.852213.023131.0198181.295680.85100
119.151233.032931.03250123.023641.287803.031321.03092122.835381.28583
158.998903.041261.04382165.966231.737323.039561.04213165.697521.73451
198.144073.049431.05496209.034062.188153.047641.05315208.675422.18440
237.861923.057741.06631253.634552.655033.055881.06443253.187372.65034
277.606213.066191.07789299.228953.132303.064271.07594298.687623.12664
316.995803.074421.08920345.271833.614283.072431.08717344.628333.60754
356.538583.082761.10070392.442024.108053.080711.09860391.693294.10021
396.681443.091331.11255441.327934.619783.089301.11049440.510774.61123
436.117103.099851.12436490.352625.132973.097691.12214489.384445.12284
475.716843.108361.13620540.509485.658013.106201.13400539.462905.64705
515.372533.116991.14824591.771356.194613.114721.14590590.565386.18199
554.980813.125701.16043644.016386.741513.123491.15818642.767676.72844
594.374403.134421.17267697.005037.296193.132031.17019695.530987.28076
633.990103.143261.18512751.354347.865113.140861.18263749.775717.84859
674.001553.152011.19749807.110128.448763.149581.19496805.404898.43091
Table 4. Refractive index measurement of aqueous guanidine hydrochloride solutions (mass content in air).
g GuHCl/kgnD20g GuHCl/kgnD20g GuHCl/kgnD20
0.000001.33299266.963251.38389500.946251.43267
47.181561.34184307.969771.39206535.397741.44032
93.302251.35042346.386921.39995574.939651.44923
137.535671.35879383.753051.40767606.789001.45657
182.342881.36736428.931541.41717642.746471.46495
224.757661.37557455.877631.42289677.639701.47317
Disclaimer/Publisher’s Note: The statements, opinions and data contained in all publications are solely those of the individual author(s) and contributor(s) and not of MDPI and/or the editor(s). MDPI and/or the editor(s) disclaim responsibility for any injury to people or property resulting from any ideas, methods, instructions or products referred to in the content.