Article

Analysis of Iodide Ions Using Silver Cinnamate-Based Nanocomposites

by
Tatiana S. Kolesnikova
1,
Marina O. Gorbunova
2,
Igor E. Uflyand
1,*,
Vladimir A. Zhinzhilo
1,
Anastasiya O. Zarubina
1 and
Vadim A. Volochaev
3
1
Department of Chemistry, Southern Federal University, 344090 Rostov-on-Don, Russia
2
Pharmaceutical Faculty, Rostov State Medical University, Ministry of Healthcare of Russian Federation, 344022 Rostov-on-Don, Russia
3
Institute of Physical and Organic Chemistry, Southern Federal University, 344090 Rostov-on-Don, Russia
*
Author to whom correspondence should be addressed.
Analytica 2026, 7(2), 37; https://doi.org/10.3390/analytica7020037
Submission received: 12 March 2026 / Revised: 20 April 2026 / Accepted: 4 May 2026 / Published: 10 May 2026
(This article belongs to the Section Sample Pretreatment and Extraction)

Abstract

The paper describes the preparation of silver-containing nanocomposites by thermolysis of silver cinnamate and their application for the manufacture of reactive indicator paper (RIP) sensitive to iodine. The composition, structure, and properties of the obtained materials were studied using IR spectroscopy, X-ray diffraction, the gravimetric analysis method, scanning electron microscopy, transmission electron microscopy, and energy-dispersive X-ray spectroscopy. Optimal conditions for modifying a cellulose carrier with nanocomposites in laboratory conditions were selected, ensuring high sensitivity of RIP to iodine and uniform and reproducible distribution of the reagent. A new gas extraction colorimetric technique for determining iodide ions in the range of 0.03–1.6 mg L−1 (limit of detection 0.01 mg L−1) was developed, allowing iodides to be determined in multicomponent objects such as food products, pharmaceuticals, and various water bodies with minimized sample preparation. The use of iron(III) as an oxidizing agent and the use of dynamic gas extraction ensure high selectivity and good analytical performance.

1. Introduction

Iodine is an essential element for humans because it is a key component of healthy metabolism. In particular, it promotes the normal functioning of the thyroid gland, an endocrine organ that produces and accumulates iodine-containing hormones (T3 and T4). T3 and T4 are the main regulators of energy consumption in the body; maintaining their concentration at a certain constant level is necessary for the normal functioning of almost all organs and systems. Excess synthesis of thyroid hormones is the cause of hyperthyroidism (thyrotoxicosis), the symptoms of which are heat intolerance, weight loss, diarrhea, and an enlarged thyroid gland. Conversely, a deficiency in these hormones can lead to sluggishness, depression, and weight gain [1]. Iodide ions are taken up by thyroid cells (thyrocytes) and, reacting with L-thyronine, form the aforementioned hormones T3 and T4 [2,3]. The World Health Organization (WHO) recommends consuming about 150 mg of iodide per day. Optimal daily iodine intake with food and water helps to avoid iodine deficiency. However, in iodine-deficient regions, iodine-containing food supplements are additionally needed [4,5]. Based on this, it is clear that the need to control the content of iodides in various objects will always justify the search for new methods for their determination. It is worth noting that the quantitative analysis of iodides is often difficult due to the presence of chlorides and bromides in the sample analyzed. Many existing analytical methods allow us to determine their total concentration, but not each ion separately [6,7,8,9]. Accordingly, the task of determining halides in the case of their joint presence in the analyzed object is also quite relevant. Currently, many different analytical methods for determining iodides have been developed, among which the following are of the greatest importance: a group of voltametric methods [10,11], neutron activation analysis and radiochemical analysis [12,13,14], ion chromatographic analysis with various forms of detection [15,16,17], emission optical spectrometry with inductively coupled plasma (with radial or axial view) [18,19], and also mass spectroscopy with inductively coupled plasma [20,21,22,23]. Comparative characteristics of some methods for determining iodides are given in Table 1.
Air is used as the carrier of the analyte in the reactive zone. Thus, the proposed analytical method utilizes a well-known method of chemical vapor generation, which involves generating the analyte in the gas phase from a non-volatile precursor. This allows for the efficient transport of the analyte from the condensed phase to the gas phase, increasing the sensitivity and selectivity of the method. This method allows for the most efficient separation of matrices, even complex ones, reduces the interfering effects of other compounds, and allows for additional stimulation of the ongoing gas extraction using ultraviolet irradiation or other physical methods [26].
Methods of synthesis and possible applications of metal-containing nanocomposite materials are currently being intensively studied. Particular attention is paid to silver-containing nanocomposites (AgNCs), due to their wide range of properties: plasmonic, catalytic, and antibacterial activity, chemical stability, and good thermal and electrical conductivity [27,28,29,30,31].
In accordance with modern requirements for analysis, simple methods of identification and determination of substances at the sampling site (test methods) are becoming increasingly widespread [32]. As a rule, they require virtually no sample preparation, bulky or complex laboratory equipment, or, as a result, the involvement of highly qualified personnel. The use of test methods allows for visual semi-quantitative and quantitative determination of substances with registration of the analytical signal by molecular spectroscopy, as well as significantly reducing the analysis time. Most often, test methods involve the use of a solid-phase analytical reagent consisting of a carrier and a component applied to it that is sensitive to the substance being determined. The authors [33,34,35,36] described the production and use of various indicator forms. The preparation of reactive indicator papers (RIPs) is preceded by a detailed study of the processes of sorption and desorption, which are widely used not only in chemical analysis but also in solving various technological and environmental problems [37,38,39]. In addition, the method of manufacturing RIP (impregnation method, drying mode, sequence of reagent application, their concentration, etc.) is carefully developed in order to obtain RIP with maximum sensitivity to the analyte [40,41,42,43].
Previously, we described the use of AgNCs in the analysis of some halides [42,44,45,46,47,48,49,50]. This article proposes a method for determining iodides using RIP modified with silver cinnamate-based nanocomposites. The proposed approach to determining iodides involves their soft oxidation to iodine by Fe(III), followed by its dynamic extraction from the solution by an air flow with simultaneous detection of RIPs.

2. Materials and Methods

2.1. Chemicals

Potassium iodide (KI), sulfuric acid (H2SO4), nitric acid (HNO3), hydrochloric acid (HCl), ferric(III) chloride (FeCl3), silver nitrate (AgNO3, Sigma-Aldrich, Burlington, MA, USA), (E)-3-phenylpropenoic acid (HC9H7O2, Sigma-Aldrich, Burlington, MA, USA) and sodium hydroxide (NaOH, Sigma-Aldrich, Burlington, MA, USA) were at least of analytical grade. Working solutions of the substances were prepared by dissolving their weighed portions or aliquots and diluting them in deionized water. Working standard iodide solutions were prepared by dilution of the stock solution immediately before use. The potassium iodide solution was standardized by argentometric titration. AgNCs were synthesized according to the procedure described below. All glassware was thoroughly washed with aqua regia (3:1 ratio of HCl/HNO3) and was then rinsed with deionized water.

2.2. Characterization

The portions of substances were weighed on an analytical balance of the 2nd class VLR-20 (Gosmeter, Moscow, Russia) with an error of ±0.0001 g. Elemental analysis was carried out on a CHNOS vario EL cube analyzer (Elementar Analysensysteme GmbH, Langenselbold, Germany). Silver was determined on an energy-dispersive X-ray fluorescence spectrometer “X-Art M” (Comita, St. Petersburg, Russia) or atomic absorption spectrometer “MGA-915” (Lumex, St. Petersburg, Russia). The Fourier transform IR (FTIR) spectra were taken with a Perkin Elmer Spectrum 100 FTIR spectrometer (Perkin Elmer, Waltham, MA, USA) from KBr pellets, using SpectrumTM 10 software for data analysis (Perkin Elmer, Shelton, CT, USA). Thermal (TA) and differential scanning calorimetry (DSC) analyses were carried out on a synchronous thermal analyzer STA 409CLuxx coupled to a quadrupole mass spectrometer QMS 403CAeolos (NETZSCH, Selb, Germany) and on a Perkin-Elmer Diamond TG/DTA derivatograph (Perkin Elmer, Waltham, MA, USA) in a helium stream (powders, m = 0.3–0.4 g) with the standard α-Al2O3 at a rate of 2°/min in the range of 20–500 °C. X-ray diffraction (XRD) analysis was carried out on the diffractometers DRON-UM-2 (JSC Burevestnik, St. Petersburg, Russia), “Philips PW 1050” (Philips Analytical X-Ray B.V., Almelo, The Netherlands), and ARL™ X’TRA Powder (Thermo Fisher Scientific, Waltham, MA, USA) with CuKα radiation (λCu = 1.54184 Å) in the range of 2θ = 5–80° angles 2θ with a scan rate of 5°/min and a temperature of 25 °C to determine the phase composition and the size of the crystallites. The sizes of crystallites of nanomaterials (D, nm) were determined by the Debye–Scherrer Equation [51]:
D   =   K   λ β   c o s Θ
where K is a constant (ca. 0.9), λ is the X-ray wavelength used in XRD (1.54184 Å), θ is the Bragg angle, and β is the pure diffraction broadening of the peak at half-height, that is, broadening due to the crystallite size.
Scanning electron microscopic (SEM) images were taken with a ZEISS Crossbeam 340 device (Carl Zeiss, Jena, Germany) at an accelerating voltage of 3 kV. Secondary electrons were detected with an Everhart-Thornley detector (SE2). The distribution of chemical elements on the surface of the samples was determined by X-ray energy-dispersive microanalysis (EDX) on an Oxford X-max 80 microanalyzer (Oxford Instruments, Abingdon, Oxfordshire, UK) with an electron probe energy of ≤10 keV. Transmission electron microscopy (TEM) was performed using a Tecnai G2 Spirit BioTWIN FEI high-resolution transmission microscope (Tecnai Osiris FEI, Hillsboro, OR, USA). Sample preparation was conducted as follows: a powder suspension in hexane was prepared and applied to a carbon-coated copper grid, and the solvent was dried in air. The deionized water was obtained using the Millipore Simplicity water purification system (Merk Millipore, Burlington, MA, USA).
Dynamic gas extraction was processed using a setup proposed earlier [43,44] and represented in Figure 1. It included a glass vessel for the analyzed solution (1) closed with a rubber stopper (2), a test strip holder (3), an RIP strip (4), a reaction mixture (5), a polymer hose (6), an air microcompressor (7), and a glass bubbler (8) sealed in the vessel.

2.3. Synthesis of Silver Cinnamate

Silver cinnamate was synthesized in a room with diffused light; 0.4 g NaOH (0.01 mol) was dissolved in 50 mL deionized water, and 1.4817 g HC9H7O2 (0.01 mol) was added with heating (50 °C) and constant stirring until complete dissolution. In a separate beaker, 1.6987 g AgNO3 (0.01 mol) was dissolved in 20 mL of deionized water. The resulting silver nitrate solution was quantitatively transferred to a dropping funnel and slowly added to the sodium cinnamate solution with constant stirring on a magnetic stirrer. The resulting product (yellowish voluminous precipitate) was left for 12 h without access to light. After the specified time, the precipitate was filtered through a porous glass plate, dried first in air at room temperature, and then at 70 °C for 12 h, protecting it from direct light. A total of 2.4627 g of yellow crystalline powder was obtained, which, when recalculated for anhydrous silver cinnamate, is 96.56% of the theoretical yield. Elemental analysis found, %: C—42.35; H—2.74; Ag—42.35. Calculated for C9H7O2Ag, %: C—43.11; H—2.69; Ag—42.31.

2.4. Thermolysis of Silver Cinnamate

Thermolysis of silver cinnamate was carried out in a quartz test tube with an external diameter of 2.0 cm and a length of 10.5 cm, which was placed in a quartz tube with an internal diameter of 4.0 cm and a length of 35.0 cm, sealed at one end. The quartz tube was closed with a rubber stopper with a glass tube inserted into it and installed in a heating device so that heating was carried out in the lower part, completely covering the test tube with the substance being thermolyzed: gaseous products had to freely leave the thermolysis zone; it was important to completely exclude the possibility of their condensation on the target product and, associated with this, its contamination. Before thermolysis, the quartz tube was connected through a stopper to a U-shaped tube filled with silicone oil. In this case, it served as a kind of water seal. The device assembled in this way was evacuated for 15–20 min to a residual pressure of 5–6 mm Hg. After this, the tube was filled with argon through a water seal, and the contents of the test tube were heated at a rate of 5 °C/min to 400 °C. The device was kept at this temperature for one hour, and the system was evacuated again. As a result, liquid and gaseous thermolysis products were removed from the reaction zone. Then the heating was turned off, and the device was left in a dynamic vacuum until room temperature was reached. The cooled device was disassembled, and the test tube with the thermolysis product was removed.

2.5. Preparation of Reactive Indicator Paper (RIP)

The product of silver cinnamate thermolysis was treated with ultrasound at a power of 800 W and an oscillation frequency of 16 kHz in the aqueous phase at a temperature of 65 °C. A 1.5% solution of polyvinylpyrrolidone was used as a stabilizer for dispersed silver nanoparticles. The resulting dispersed system was stable for several weeks. It should be noted that during the processing, sedimentation (within 3 h) of an insignificant part of the product was observed, which was not dispersed by ultrasound.
To prepare the RIP, adsorption fixation of AgNCs on papers of various types was used. Modification was carried out in two ways: by dropping and immersion. The operation was repeated until the required content of AgNCs was achieved. Drying of the samples was carried out in air and in a drying cabinet at a temperature of 80 °C in a horizontal and vertical position. The resulting RIPs were dark gray with a silvery tint, which changed to beige after interaction with iodine. When stored in a dark, closed bottle, the RIP is stable for at least three months. We attribute the stability of the prepared reactive papers to the use of a nanocomposite material in which silver nanoparticles are embedded in a polymer matrix, preventing oxidation of the silver nanoparticles by atmospheric oxygen. The colorimetric properties of the indicator paper remained unchanged during storage under normal conditions, at least for several months. However, exposure to halogen vapors should be avoided during storage. Before use, the paper was cut into strips for a single determination.

2.6. Calibration Curve Construction

To construct the calibration curve, series of iodine solutions prepared from the iodine 0.01 g L−1 stock solution were used. Standard solutions with iodide ion concentrations of 0.00; 0.03; 0.05; 0.1; 0.2; 0.4; 0.8; and 1.6 mg L−1 were placed in a reaction glass vessel (see Figure 1), then concentrated sulfuric acid (2 mL) and a solution of iron(III) chloride (0.2 mol L−1, 10.00 mL) were added. The neck of the vessel was tightly closed with a rubber stopper, into which a test strip holder with an RIP strip was inserted; the microcompressor was turned on, and gas extraction of the formed iodine was carried out with an air flow for 20 min. Then the test strip was withdrawn and scanned by the Canon CanonScan LiDE 210 (Canon, Tokyo, Japan). The saved image file was analyzed in terms of R,G,B-color coordinates.

2.7. Determination of Iodides in Real Objects

The analyzed objects of liquid consistency were analyzed without preliminary sample preparation. Objects of solid consistency were crushed and ground in a mortar, an exact weighed portion was placed in a reaction vessel, 100.0 mL of distilled water and reagents was added, and the determination was carried out as when constructing calibration graphs.

3. Results and Discussion

3.1. The Synthesis and Characterization of Silver Cinnamate

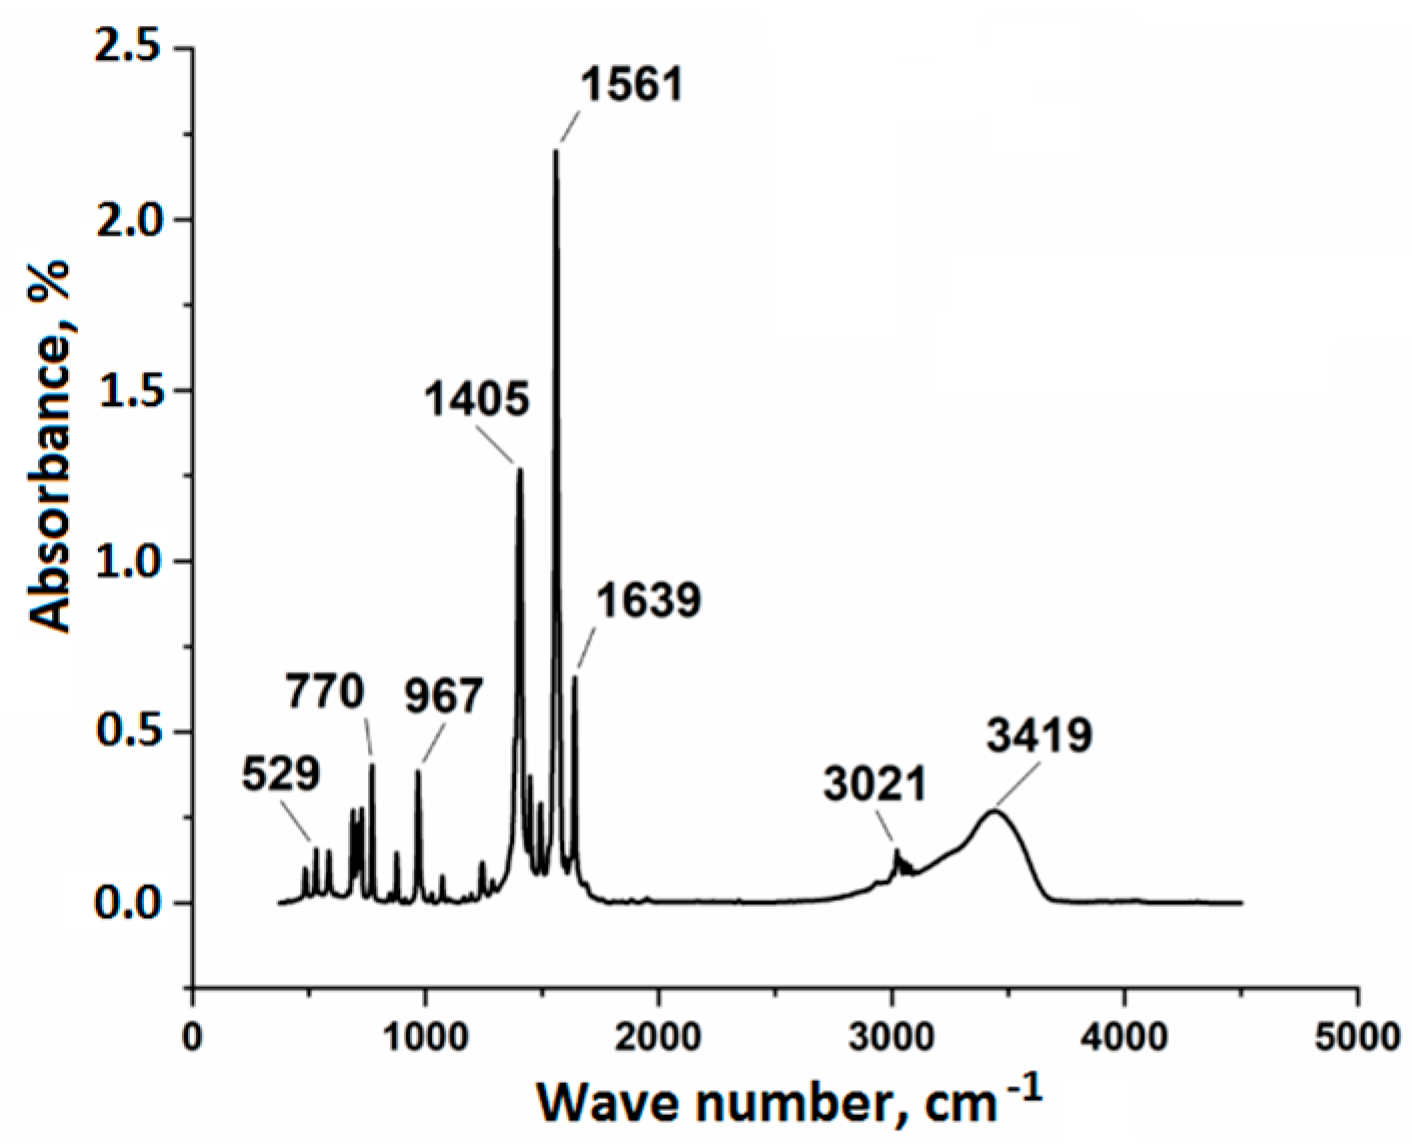
Silver cinnamate was synthesized by the interaction of silver nitrate and sodium cinnamate in water. Silver cinnamate was characterized by IR spectroscopy (Figure 2) and XRD analysis. The low-intensity band at 3419 cm−1 indicates vibrations of the hydroxyl group. Since it can be assumed with a fairly high degree of certainty that this compound does not have crystallization water, the corresponding peak in the IR spectrum most likely refers to water physically sorbed on the surface of the substance. The medium-intensity band at 1639 cm−1 can be attributed to vibrations of –C = C– bonds in aromatic systems (benzene ring). The high- and medium-intensity bands at 1561 and 1405 cm−1 refer, respectively, to symmetrical and asymmetrical vibrations of carboxyl groups. All these conclusions are in good agreement with the expected structure of the synthesized salt.
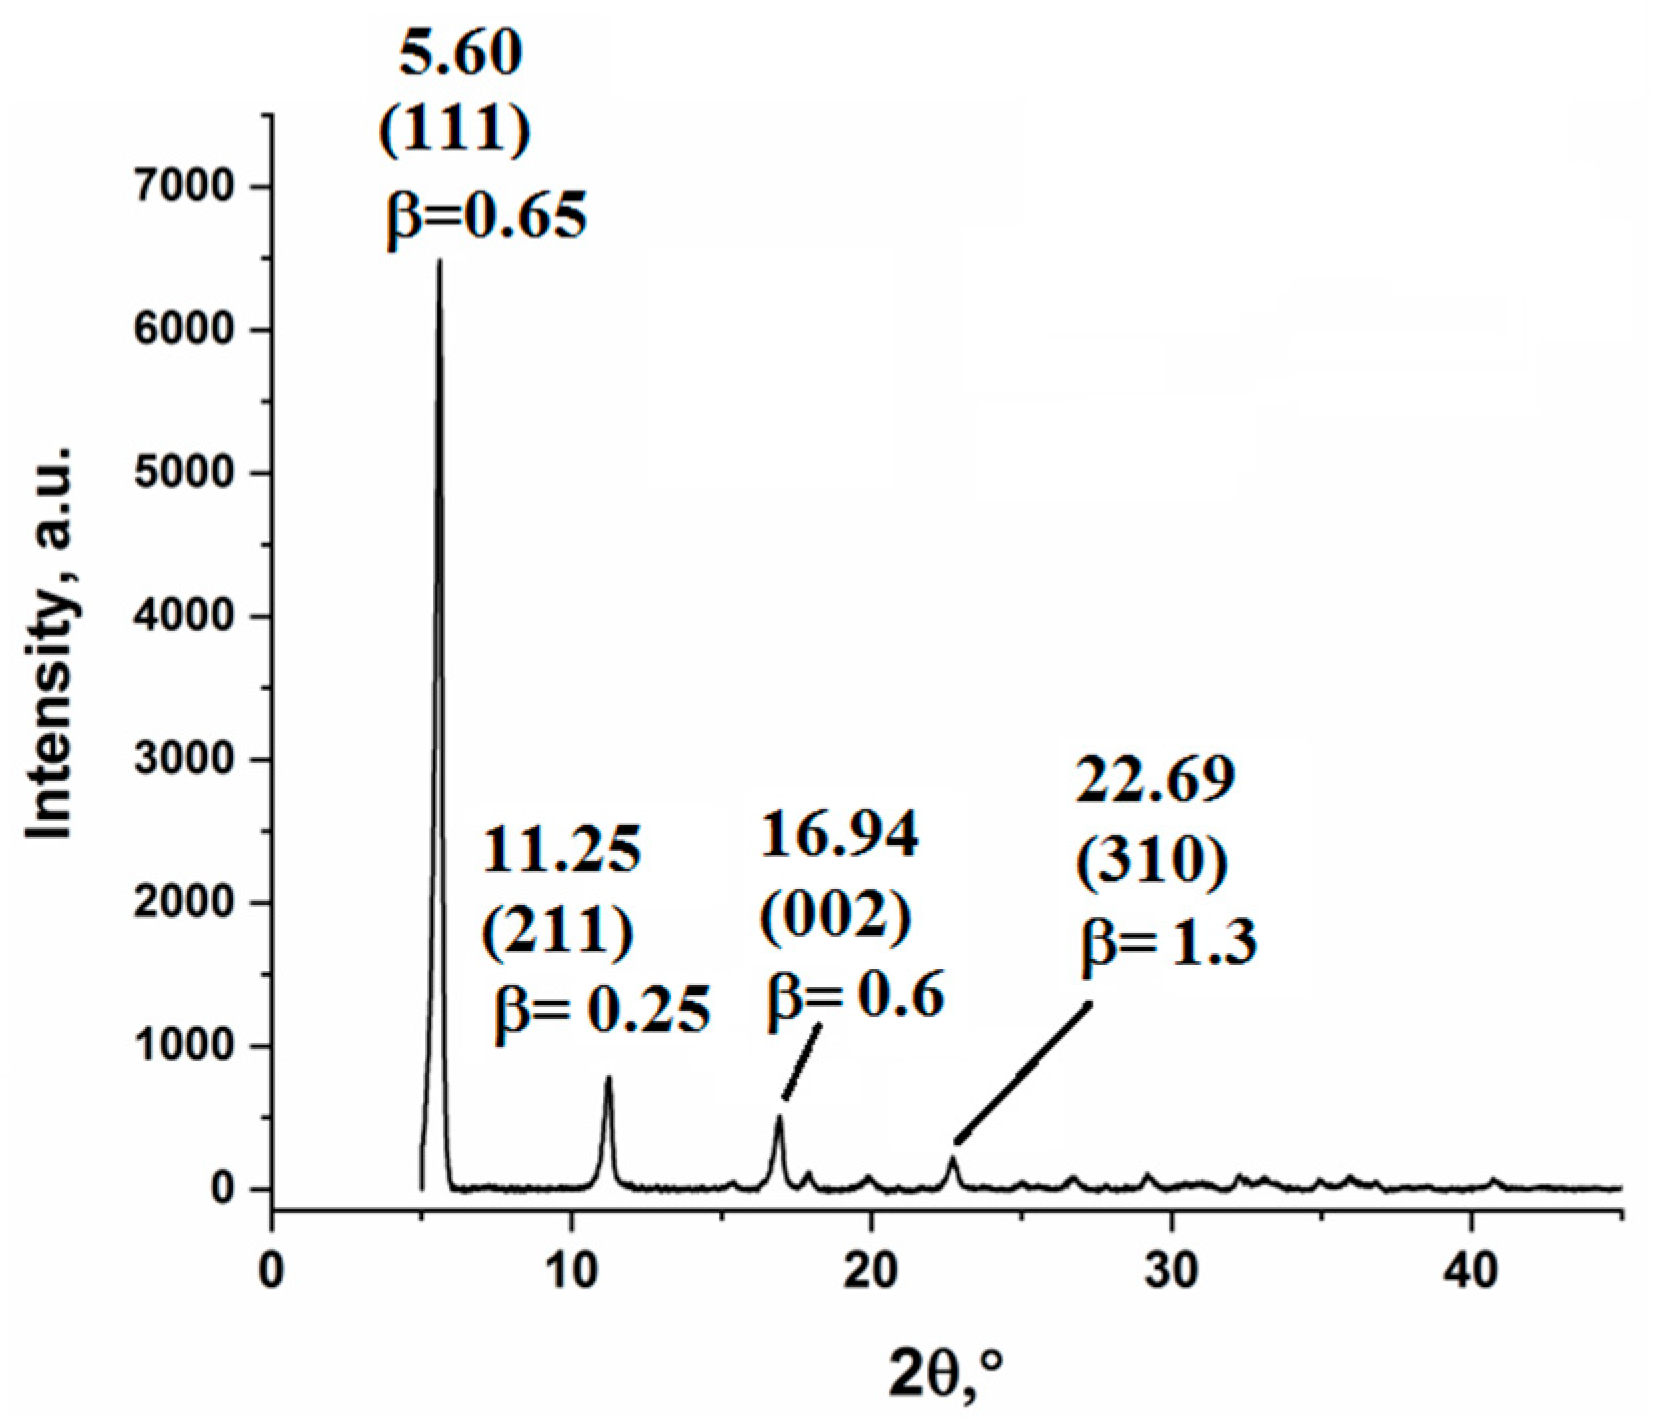
Figure 3 shows the spectrum obtained by XRD. The presented diffraction pattern shows several clearly defined peaks at 2θ° = 5.6, 11.25, 16.94, 22.69, from which it can be concluded that the product has high phase purity.

3.2. Study of Thermal Behavior of Silver Cinnamate

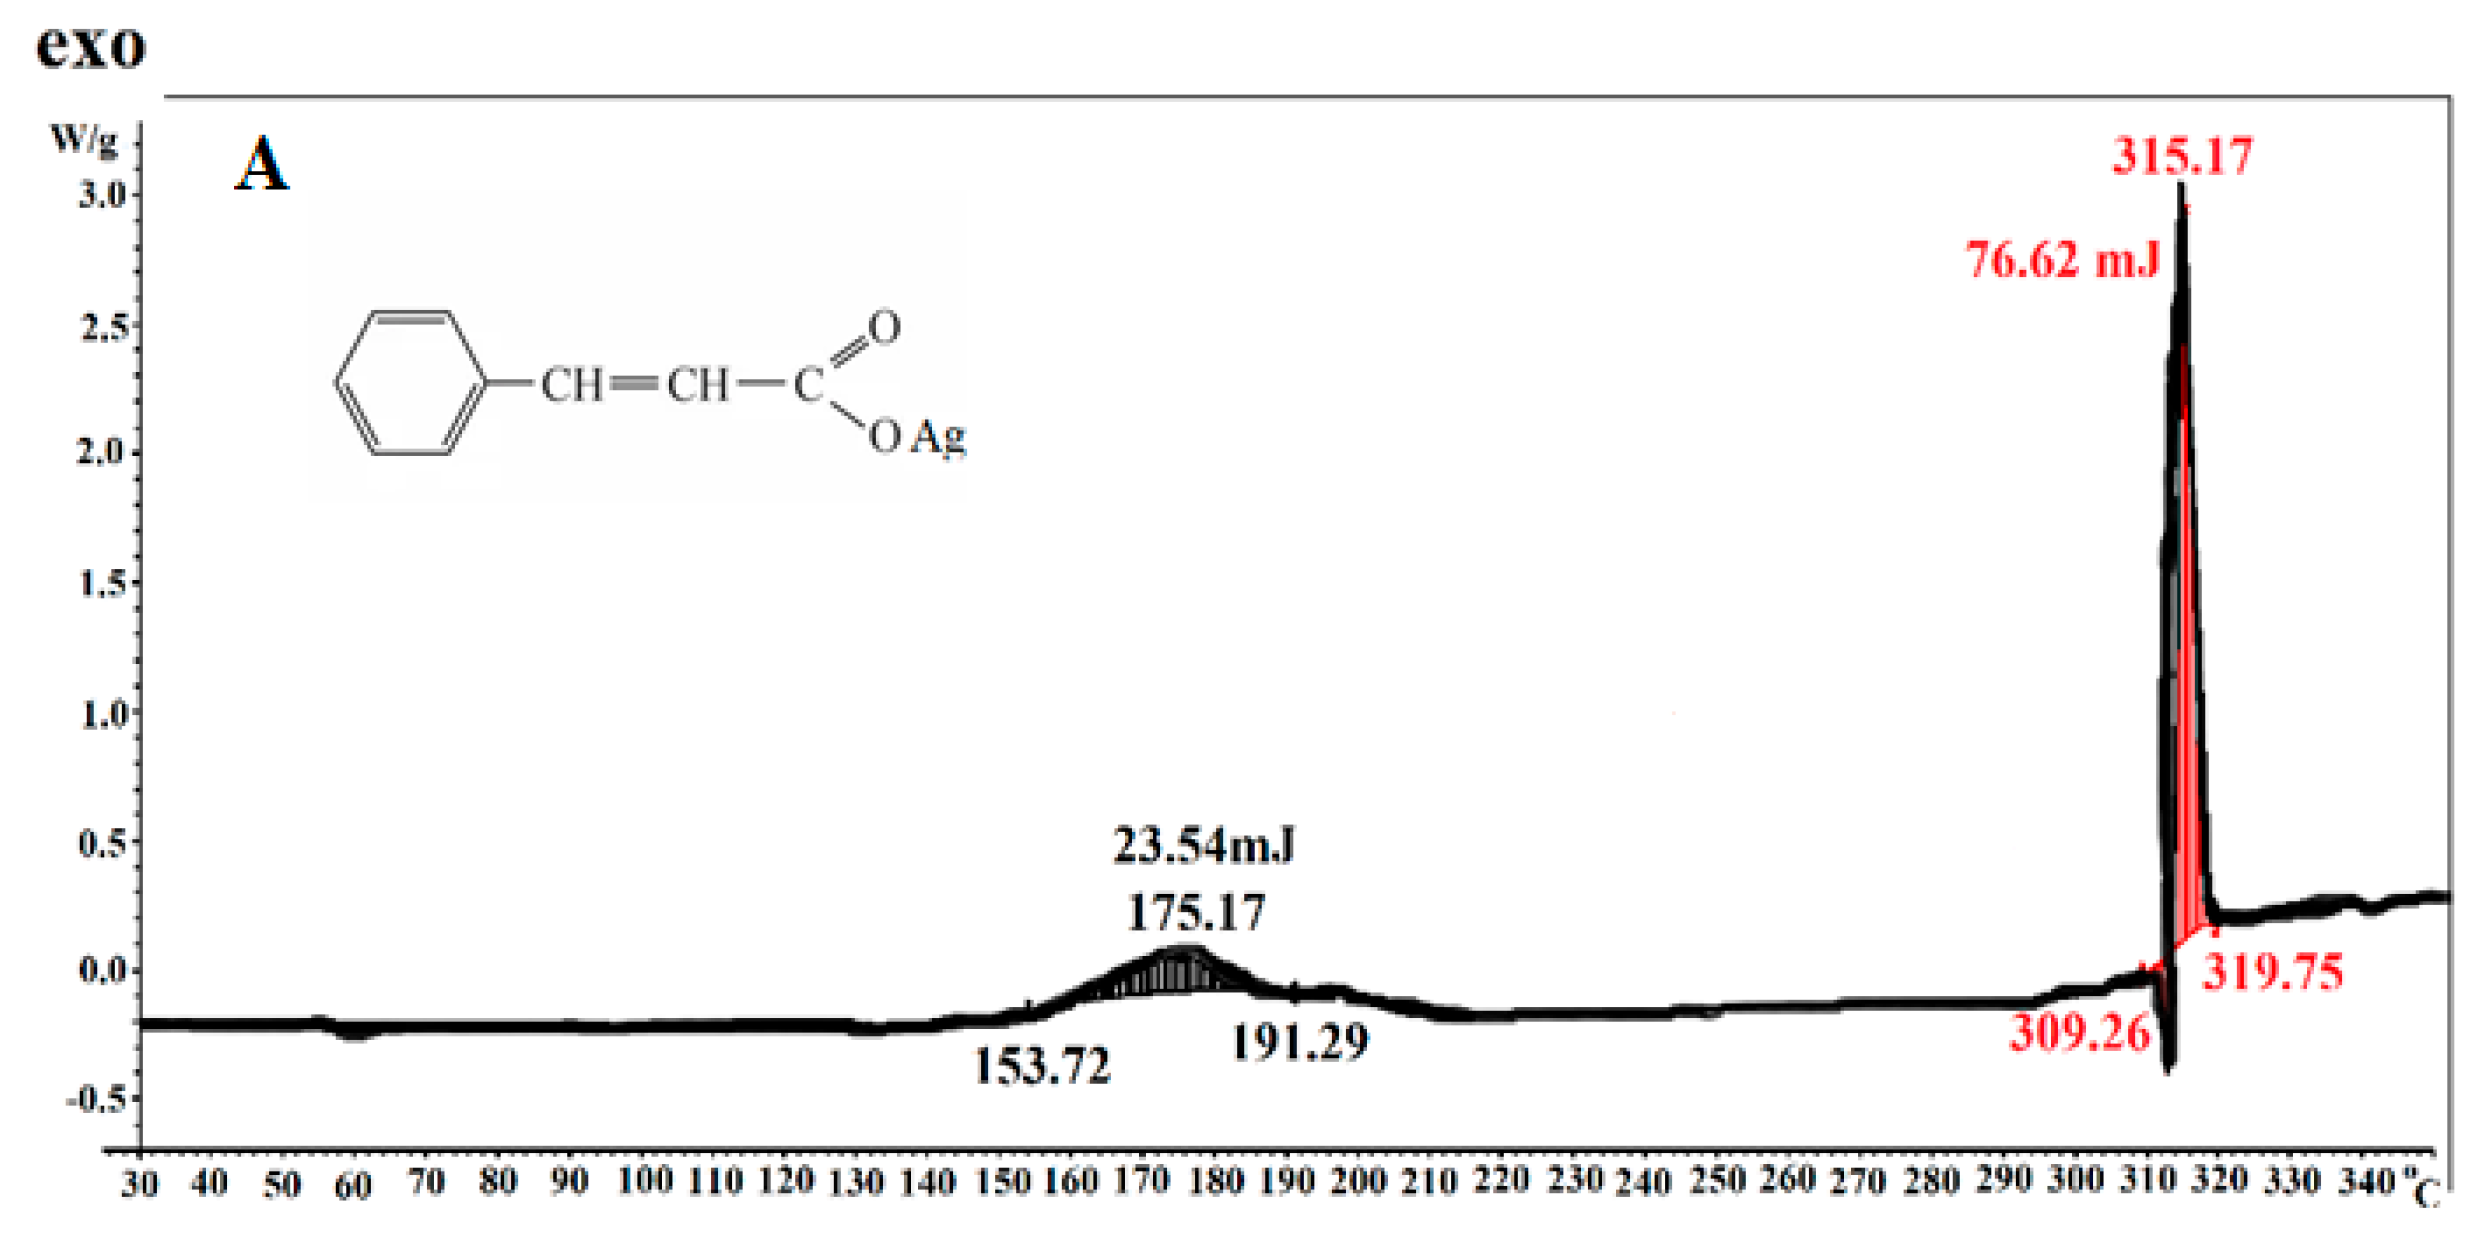
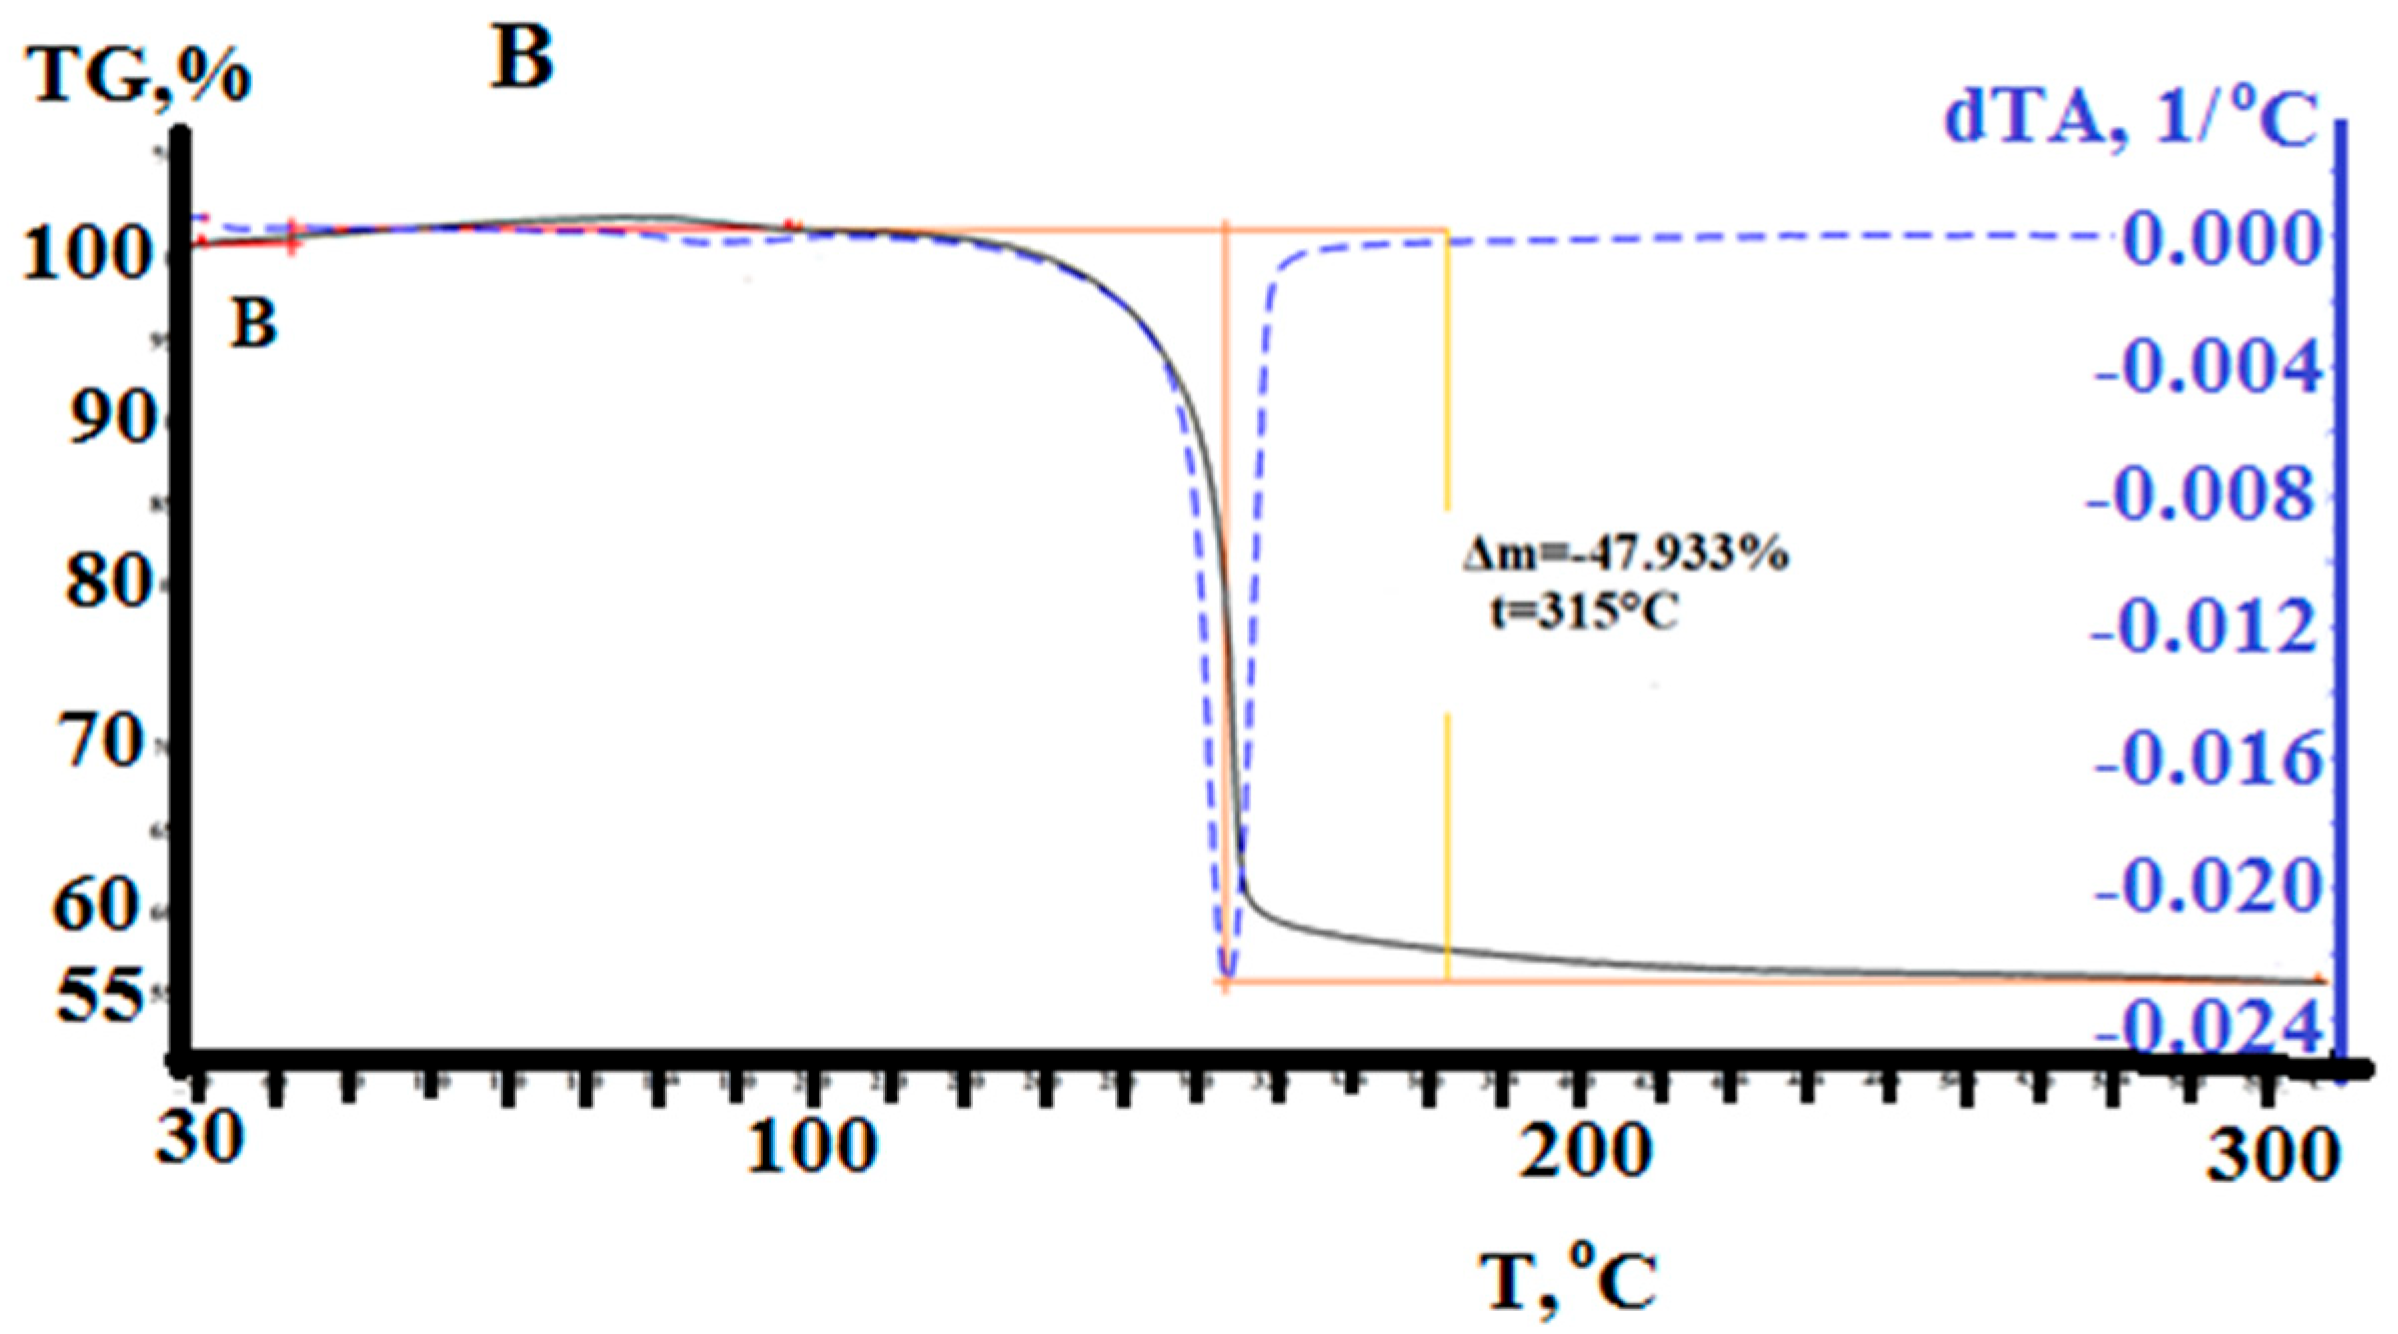
In the process of studying the thermal behavior of silver cinnamate, a conclusion was made about its relative thermal stability. The fact that there are no endothermic peaks corresponding to dehydration on the DSC curve (Figure 4A) allows us to note a characteristic feature associated with the absence of crystallization water. For the first time, the studied substance demonstrates thermal activity in the form of an insignificant exothermic peak in the temperature range from 153 to 191 °C with a maximum (23.54 mJ) at 175 °C. Most likely, this is due to insignificant polymerization of the product, since no gas evolution is observed in this temperature range, and the double bond in the conjugated position with the phenyl radical and the carboxyl group demonstrates good stability. Then, up to 309 °C, the substance is thermally stable, and after reaching temperatures above 310 °C, a significant exothermic effect is observed (76.62 mJ with a maximum at 315 °C). The resulting exothermic effect coincides with significant gas evolution occurring at 317.5 °C. After 319 °C, no signs of thermal activity are observed up to a temperature of 500 °C. The thermogravimetric analysis curve coupled with differential thermal analysis demonstrates a minor weight loss in the region of 175 °C and a significant one, 47% of the initial weight upon reaching a temperature of 315 °C, which corresponds to significant destruction of the substance (Figure 4B).

3.3. The Characterization of the Silver Cinnamate Thermolysis Product

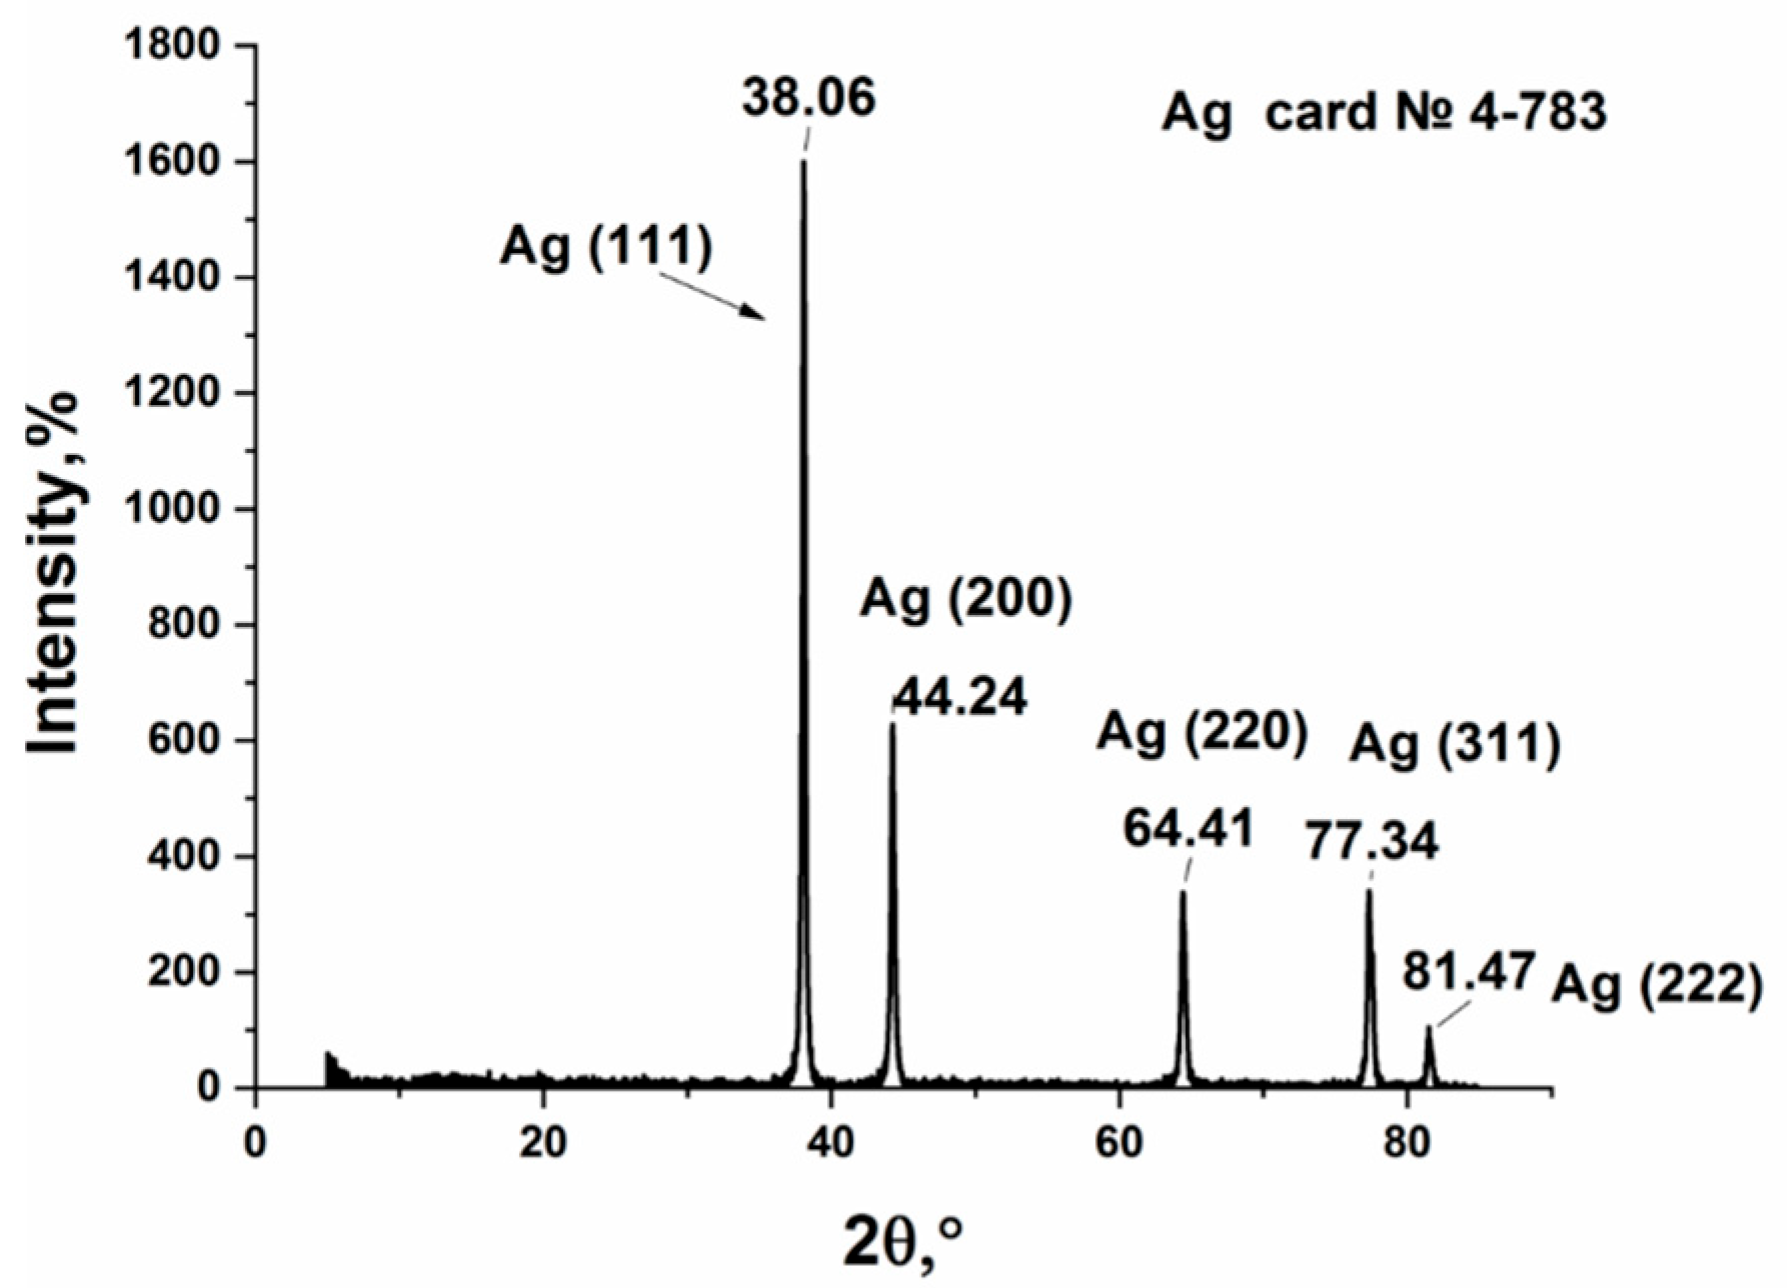
The product of silver cinnamate thermolysis was analyzed by XRD (Figure 5). According to the powder diffraction pattern, the thermolysis products contain silver identified by characteristic features—the 2θ° angle value = 38.06 (111), 44.24 (200), 64.41 (220), 77.34 (311), and 81.47 (222), which is consistent with map No.4-783 and coincides with ICSD standard No.98-018-0878 [52]. In addition, the thermolysis product contains an insignificant amount of carbon-containing material, which is mainly in amorphous form. Calculation of the crystallite size using the Debye–Scherrer formula, considering the broadening of the Bragg peaks, allows us to state that it is in the range from 13 to 50 nm.
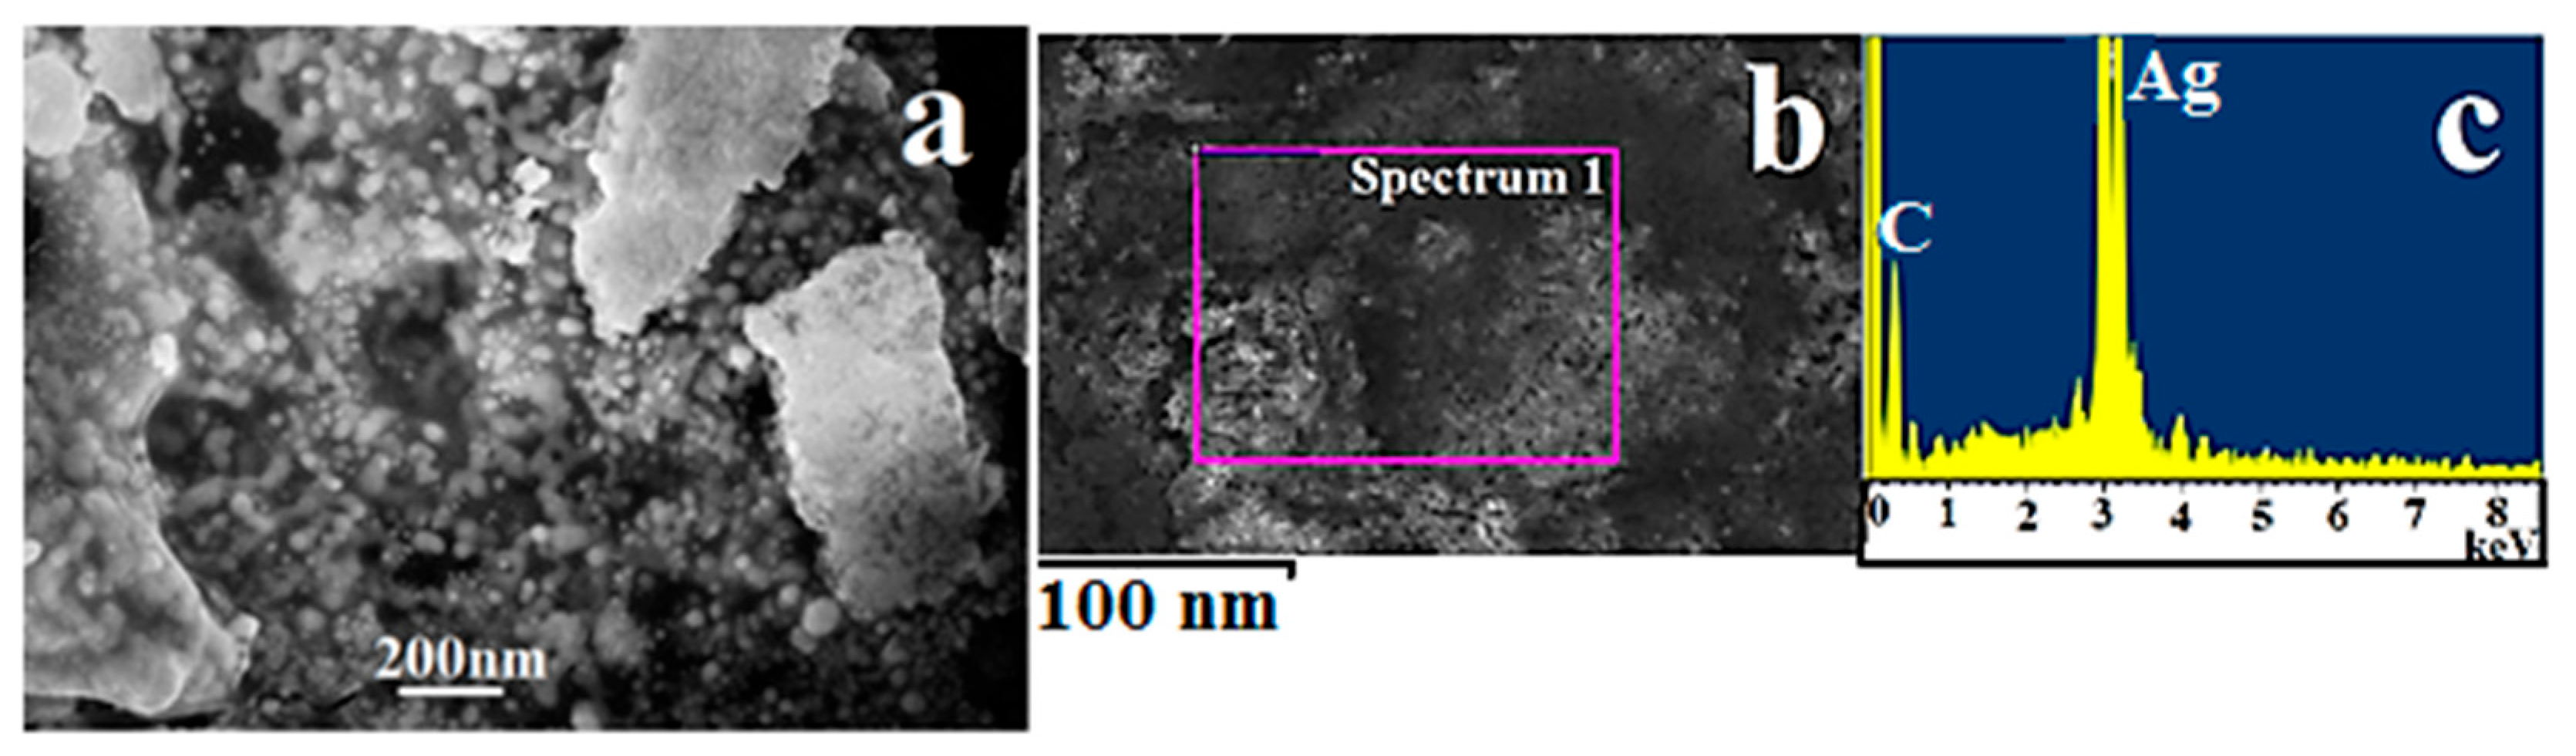
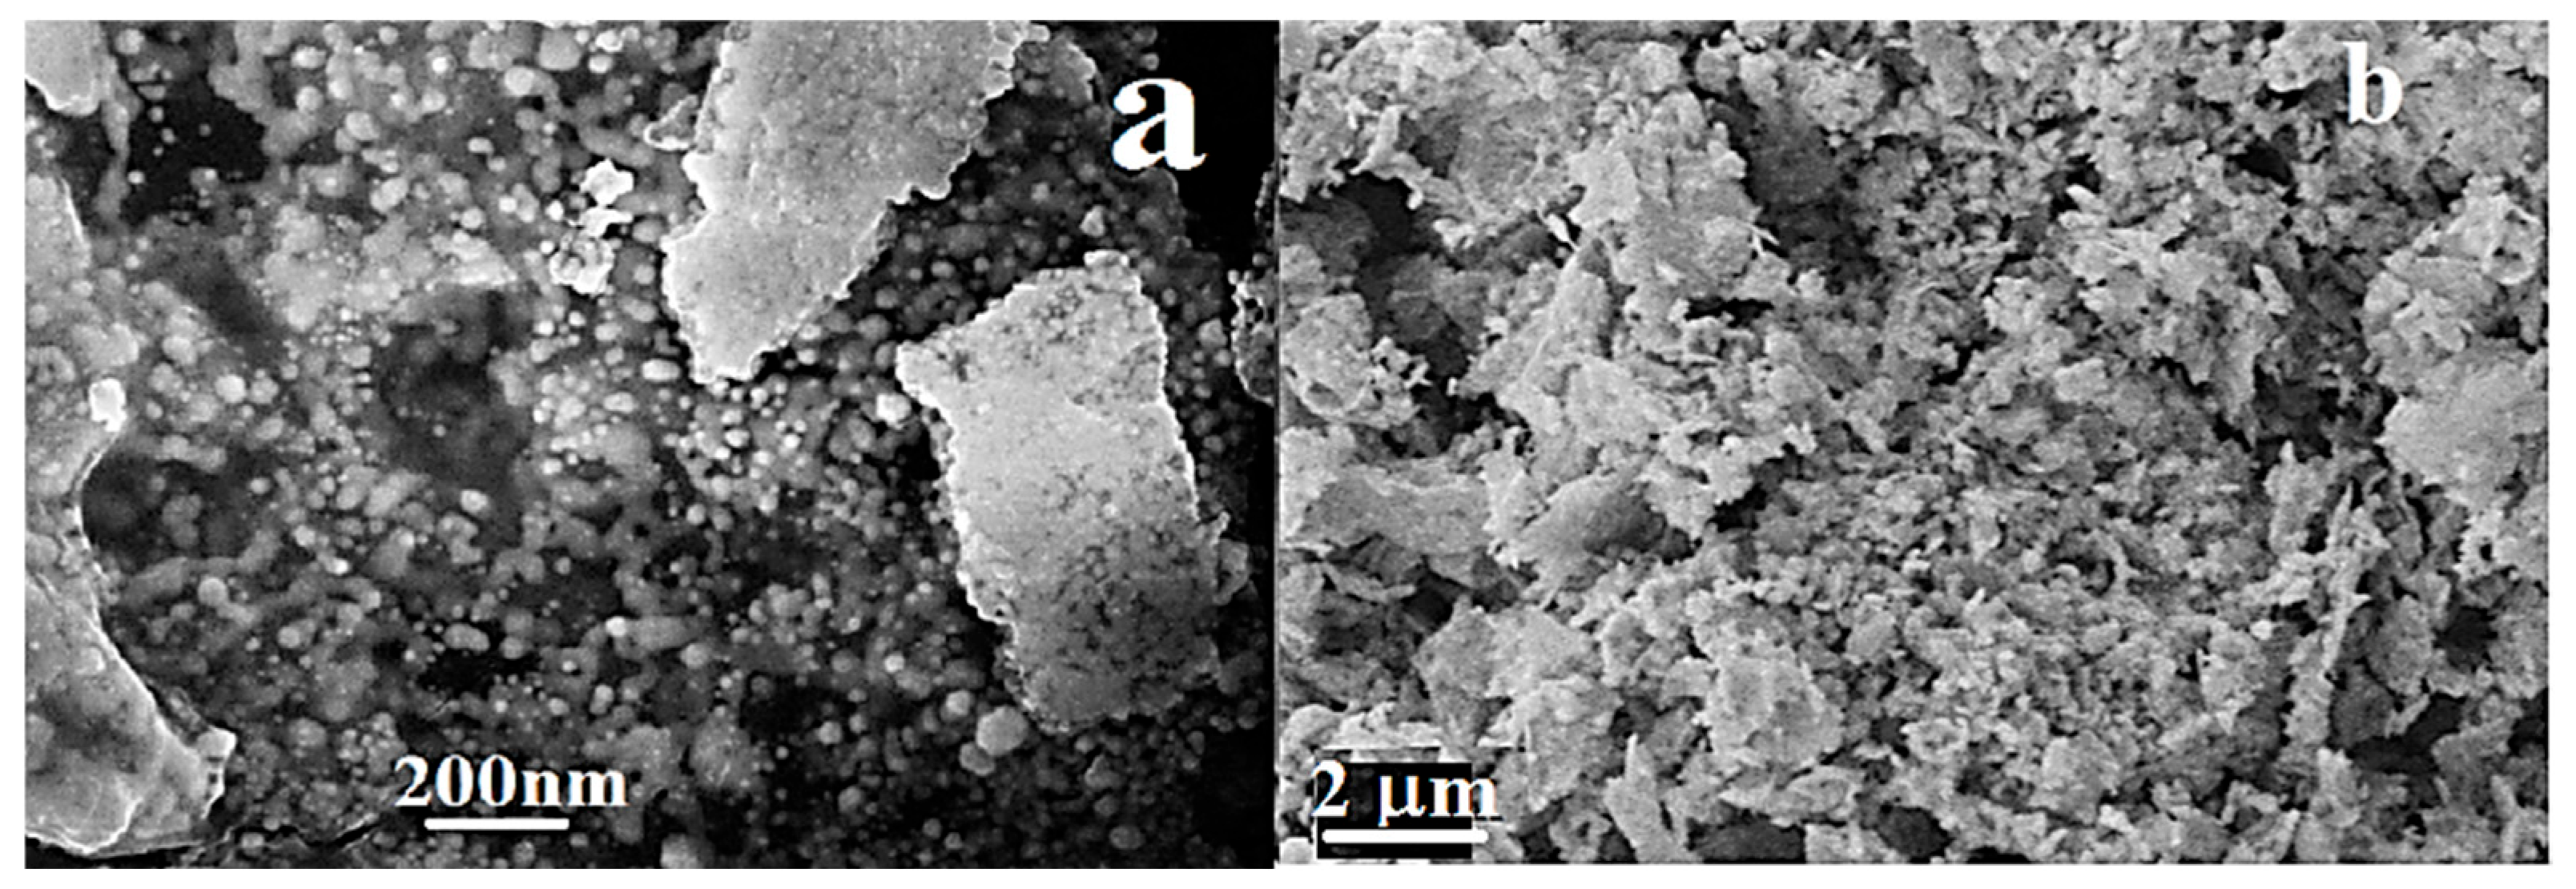
The morphology of the thermolysis product of silver cinnamate was studied using SEM (Figure 6a). The image shows particles of spherical or nearly spherical shape with sizes ranging from 19 to 57 nm. It is worth noting that some of the particles are agglomerated, which creates some difficulties in calculating their sizes.
EDX data allow us to state that the product is fairly homogeneous and contains mainly silver particles with a small amount of carbon material (Figure 6b,c, Table 2).
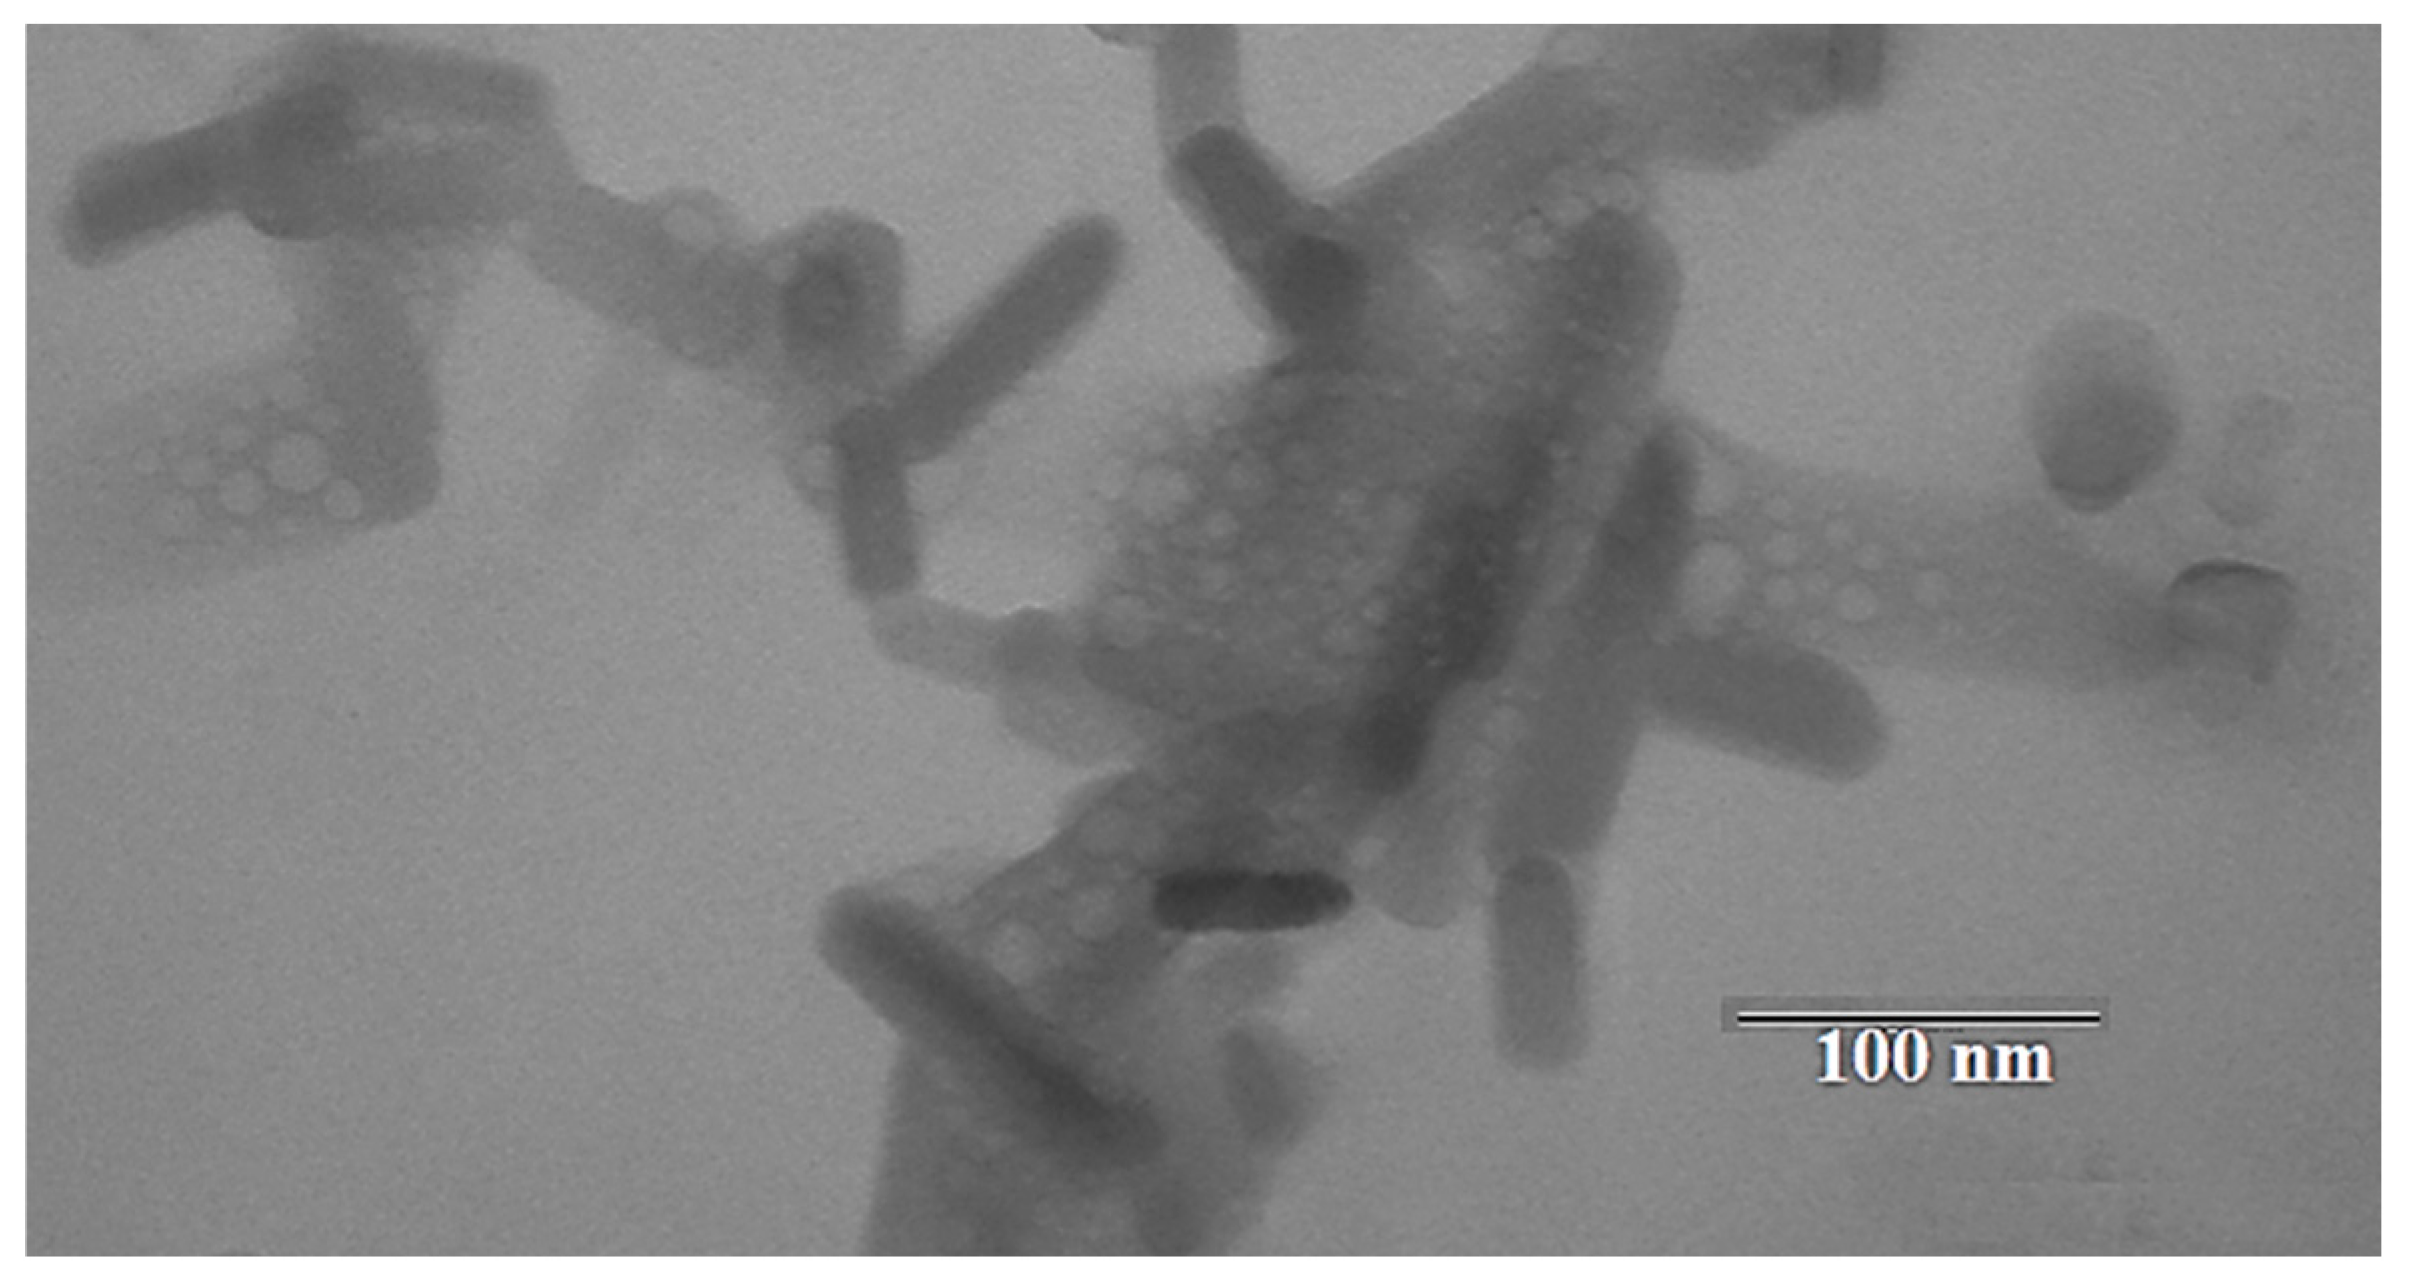
The size of silver nanoparticles and their morphology were studied using TEM (Figure 7). The image shows two types of silver particles: large and cylindrical, and spherical and much smaller. Cylindrical particles are represented by a size range from 50 × 10 nm to 120 × 30 nm. Spherical particles have a diameter of 4 to 30 nm.

3.4. Preparation of Reactive Indicator Paper

In order to study the possibility of using a silver-containing product as a reagent for the quantitative determination of iodine in the vapor–air phase, at the first stage, we studied the possibility of interaction between silver nanoparticles and an iodine solution in an aqueous medium. For this purpose, the silver cinnamate thermolysis product (0.0238 g) was mechanically ground and was placed in a vessel. An aqueous iodine solution containing 0.0250 g of iodine was added to the same vessel. The mixture was shaken for several minutes and then separated from the aqueous phase by centrifugation. The precipitate was washed with water until the washings were free of iodine, dried at room temperature in a place protected from sunlight, and examined. The product morphology was studied by SEM (Figure 8a,b).
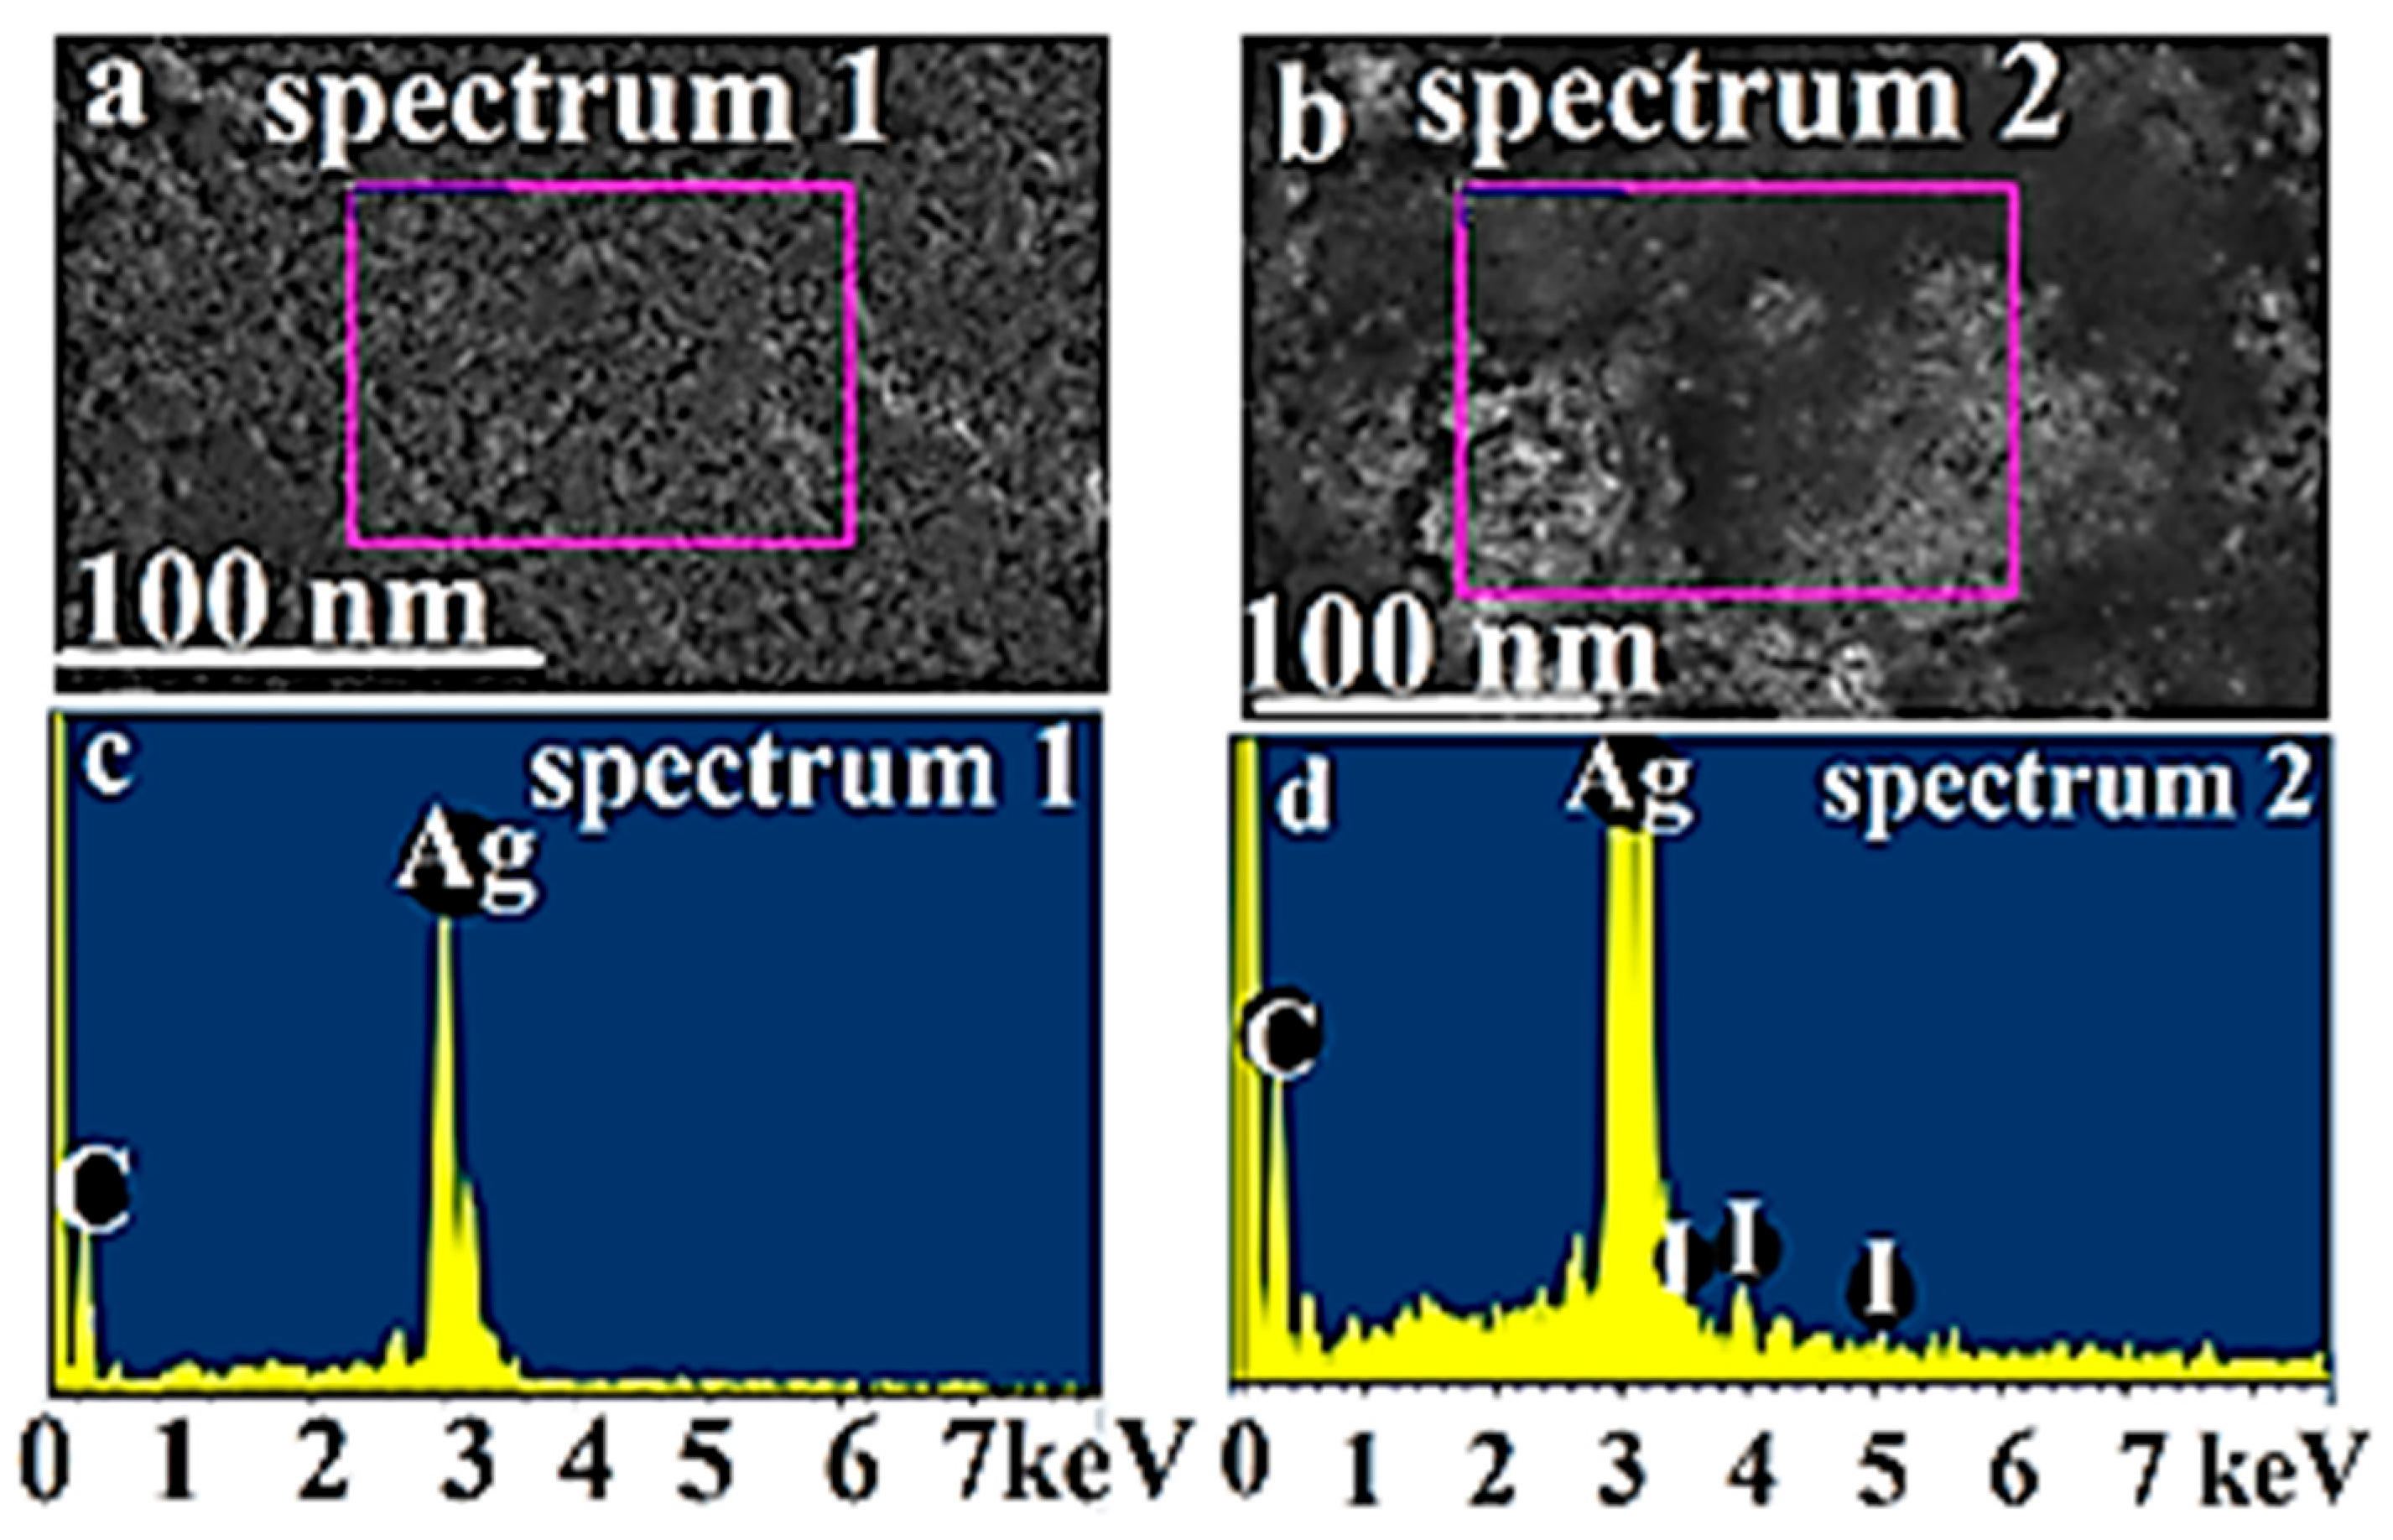
The presented image shows a significant change in the morphological picture. Before iodine treatment, silver particles are visualized as objects of spherical or nearly spherical shape (Figure 8a), while after the reaction, the surface is represented by loosely located structures of an elongated shape, the longitudinal size of which significantly exceeds the transverse size and resembles prismatic crystals. Changes in morphology are accompanied by a significant change in the chemical composition on the surface of the object under study. Before iodine treatment (Figure 9a,c), according to EDX data, only silver particles are registered in the carbon material, while after iodine treatment, silver iodide is present in the sample (Figure 9b,d).
The ratios of the weight fractions of silver and iodine are far from the corresponding ratios in silver iodide (Table 3), which means that the reaction in the heterogeneous phase occurred predominantly on the surface of the silver particles. In addition, presumably, some silver nanoparticles were protected from interaction with iodine by a carbon shell.
The second stage of RIP preparation was obtaining finely dispersed silver particles distributed in the aqueous phase and freed from the shielding effect of the carbon matrix. For this purpose, the thermolysis product of silver cinnamate was treated with ultrasound in the aqueous phase upon heating in the presence of a stabilizer.
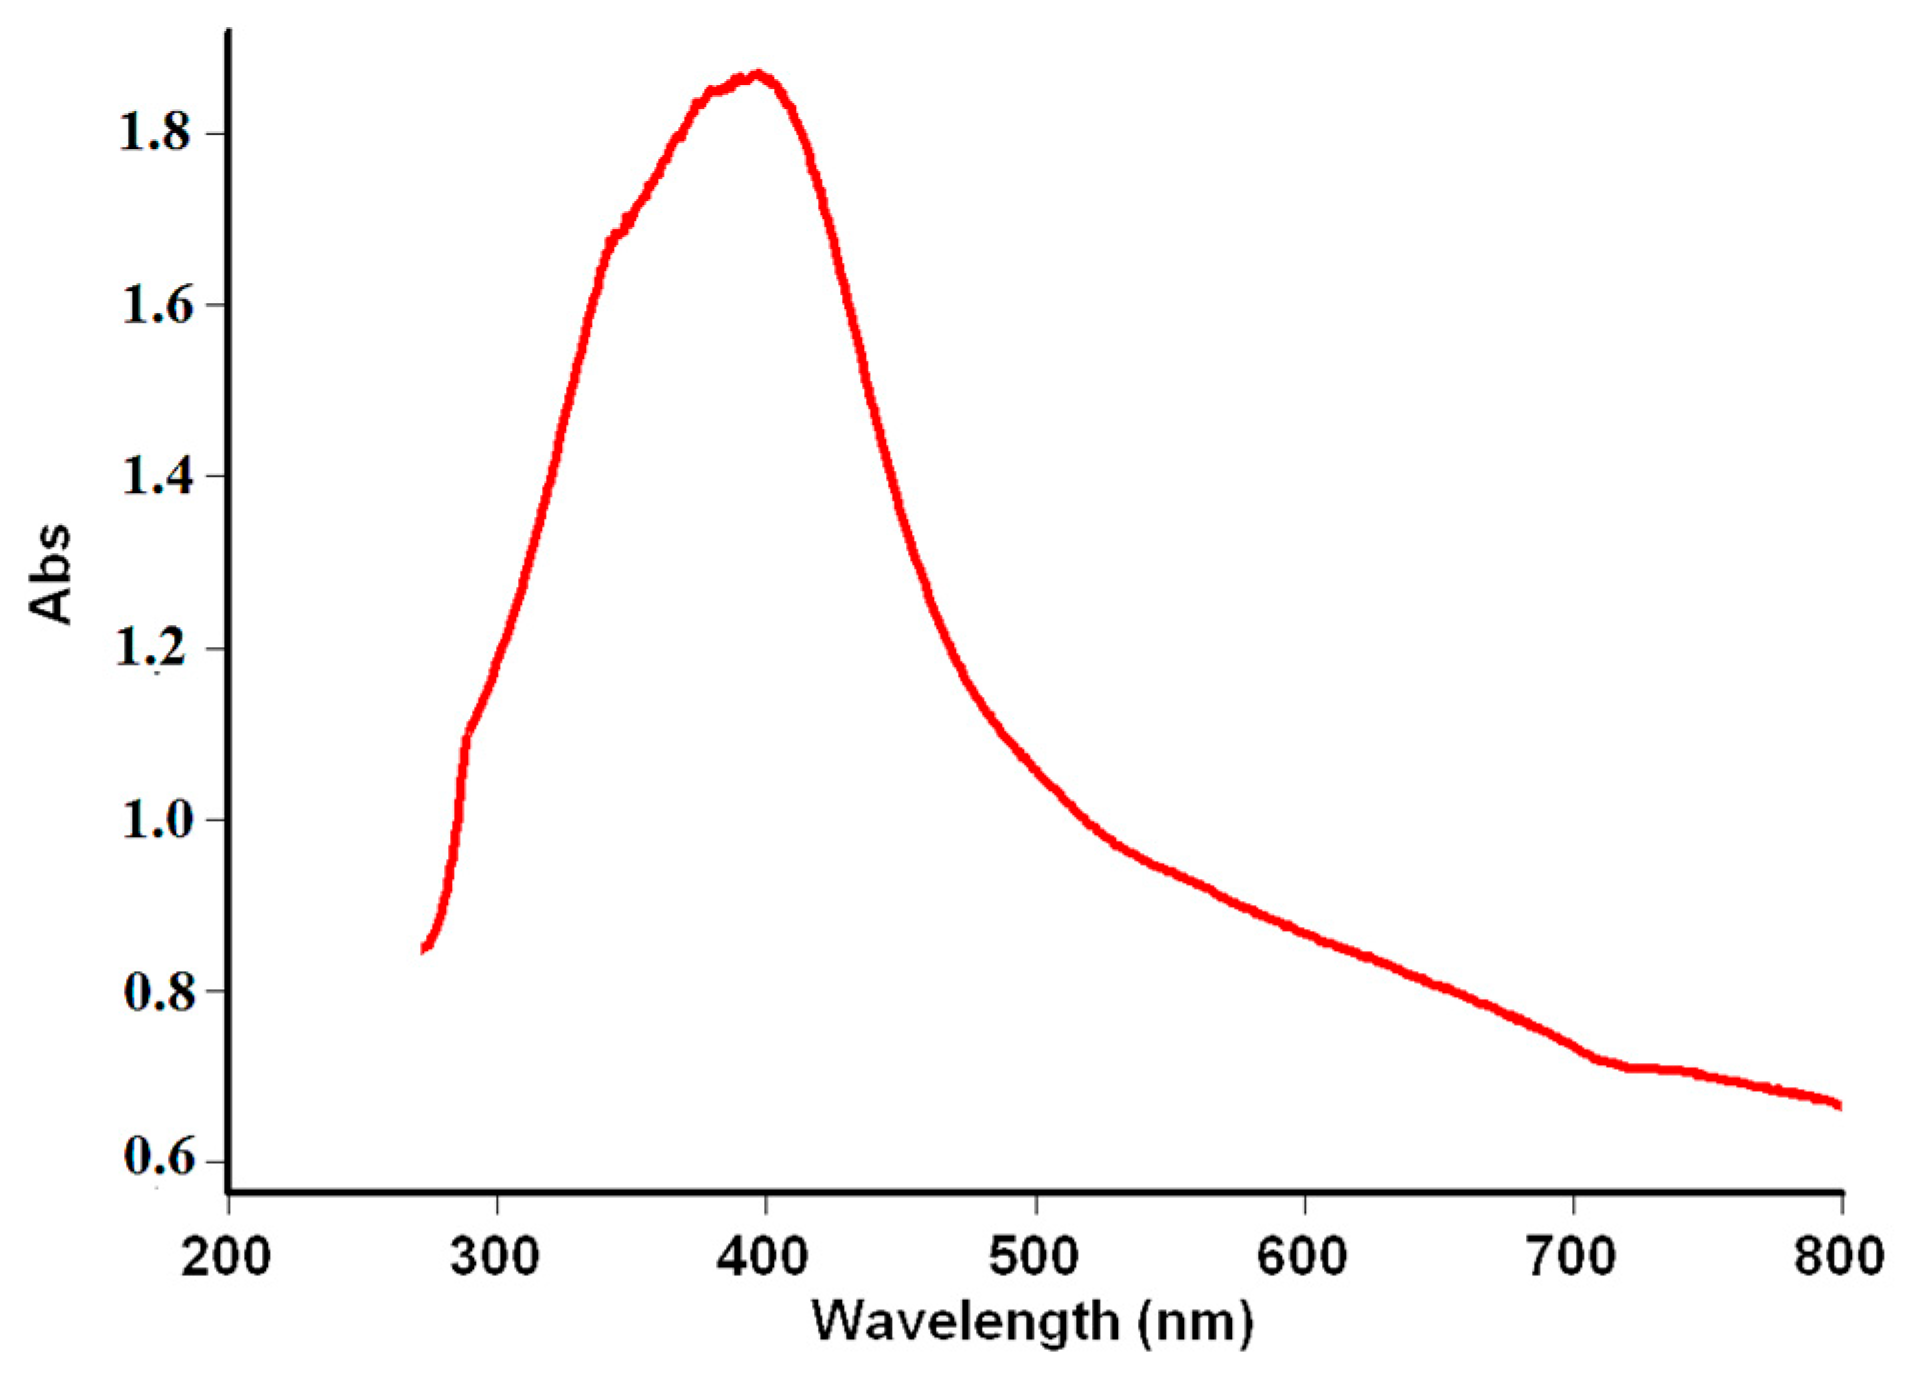
The optical properties of the resulting dispersed system are determined by the size and shape of the particles formed, and, as a consequence of their reduced size, the predominance of coherent collective oscillations of their conduction band electrons is observed. Such collective oscillations are known as surface plasmon resonance (SPR). The UV–visible absorption spectrum in the wavelength range of 300–800 nm is shown in Figure 10. The SPR peak is observed at 397 nm and has the form of a broad band, which is probably due to the particle size.
The final stage of the RIP preparation was the modification of various types of paper by the obtained suspension with a known concentration of AgNCs.

3.5. Optimization of the RIP Preparation Process

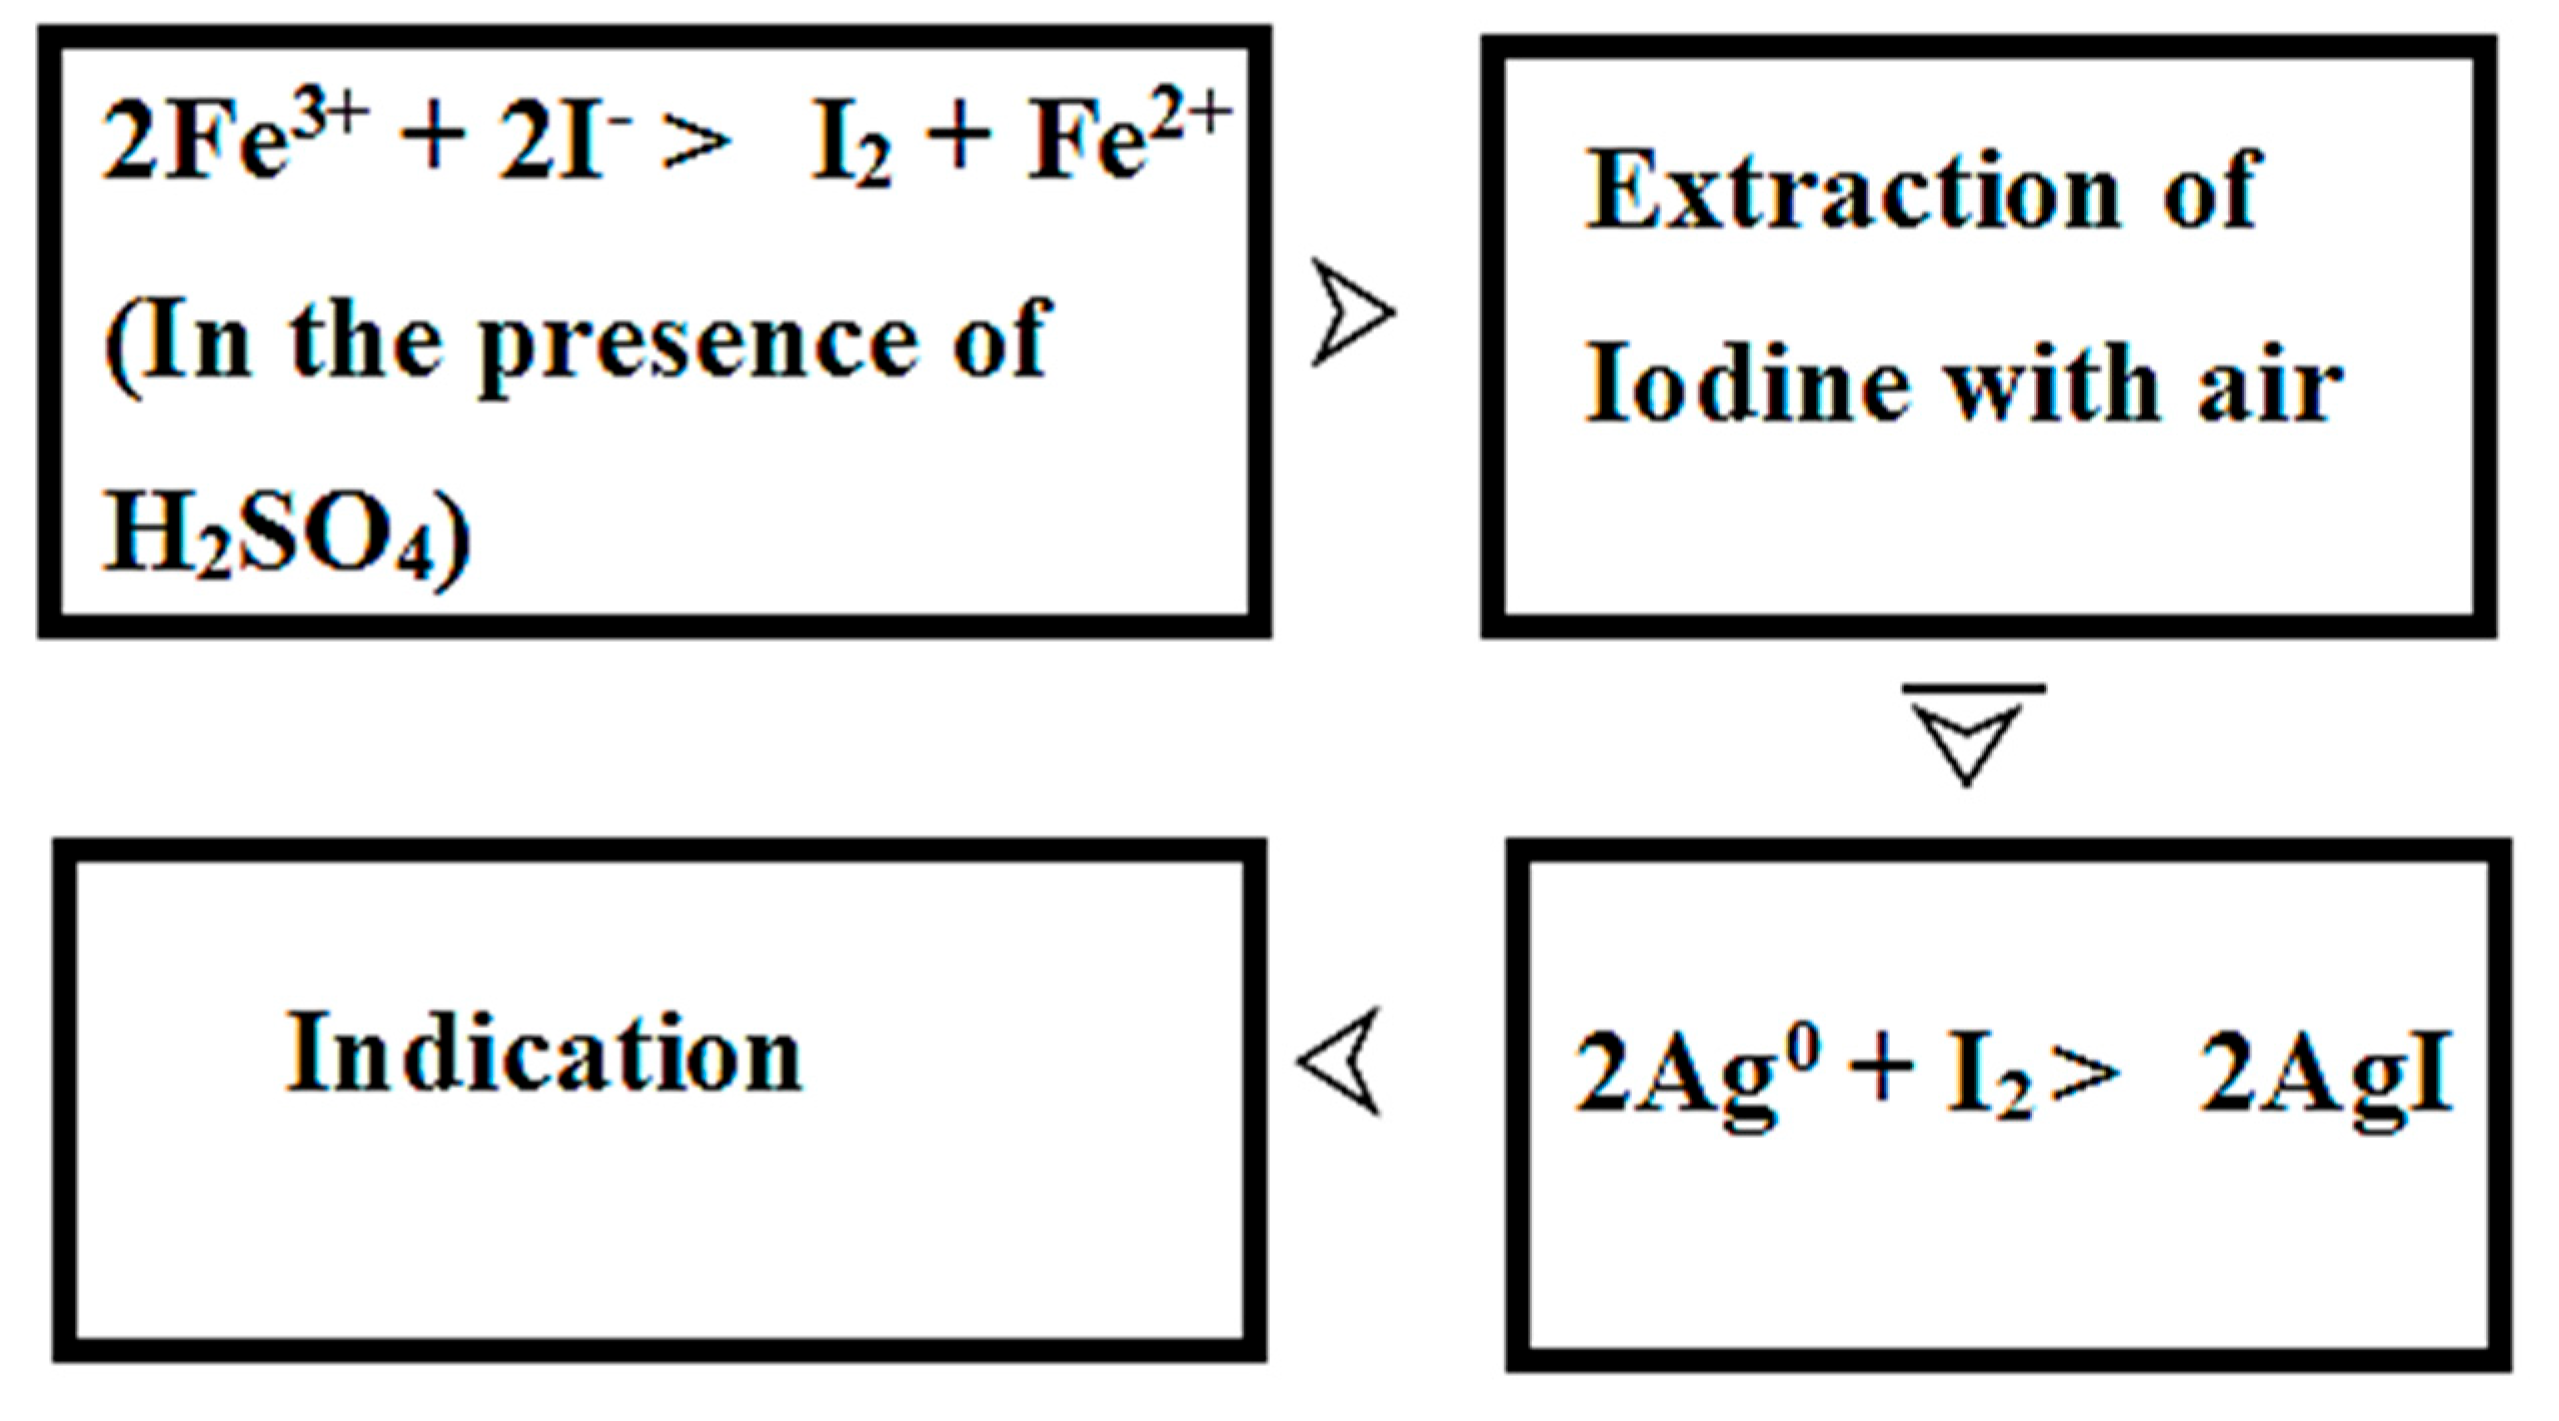
The principle of the developed method for the quantitative determination of iodides is their oxidation to molecular iodine with iron(III) chloride and subsequent dynamic extraction of iodine from the solution by air flow with simultaneous detection on the surface of the RIP. This approach is schematically presented in Figure 11.
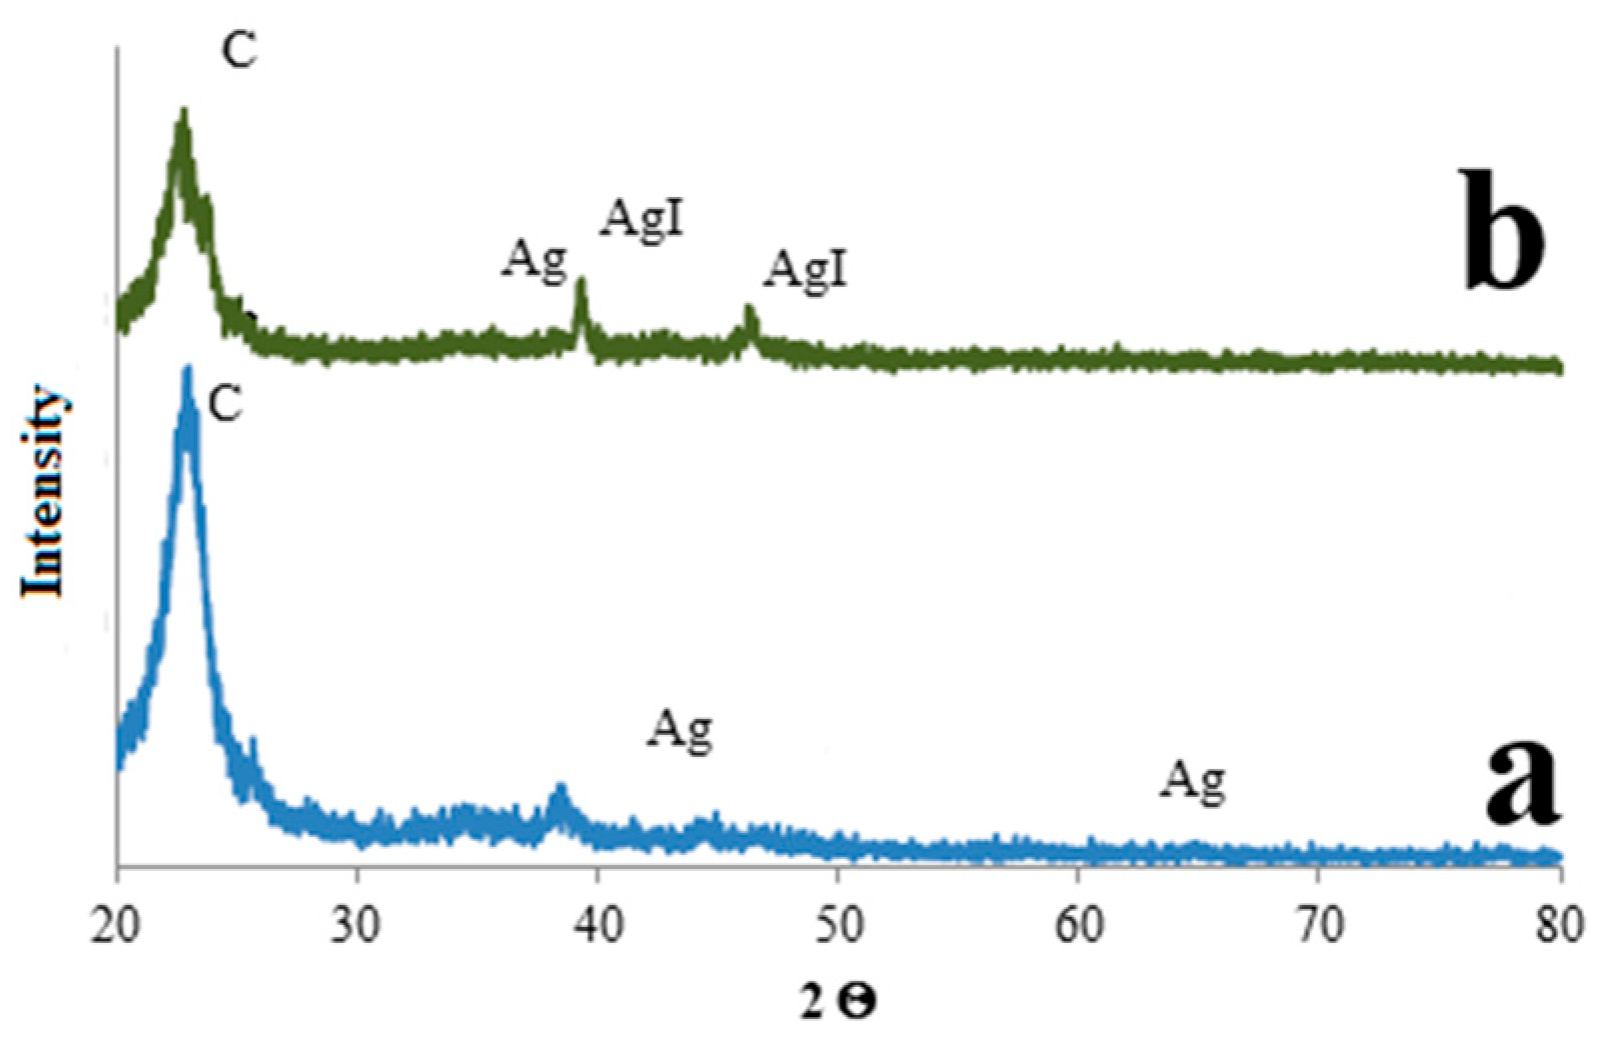
Since the analyzed objects quite often contain chlorides and bromides along with iodides, we used a mild oxidizer and dynamic gas extraction to increase selectivity. Dynamic gas extraction allows spatial separation of iodine from interfering ions and other non-volatile compounds in the solution, and paper modified with AgNCs ensures its detection. The reaction of iodine with AgNCs leads to their oxidation and a change in the color of the reaction zone on the test strip. The formation of silver iodide on the RIP surface was confirmed by XRD (Figure 12).
Figure 12a shows that the initial composite is characterized by a distinct diffraction peak at a 2θ degree angle of 26.2, which corresponds to carbon material in the form of graphite, while the amorphous halo corresponds to amorphous carbon. In addition, diffraction peaks at 44.2 and 64.4 2θ degrees, characteristic of silver, are visible. The smoothing of the peaks characteristic of silver deposited on the paper carrier compared to the powder composite is explained by the interfering effect of the paper matrix. Figure 12b shows the XRD results of the same sample of reactive paper after the reaction. The peak characteristic of the carbon material is retained, while the peaks characteristic of silver disappear, and peaks characteristic of silver iodide appear. Thus, it can be indirectly stated that the treatment of the silver-containing composite with iodine from the gas phase leads to the formation of silver iodide. No changes in the composite matrix (carbon-containing polymer material) are detected in the diffraction pattern shown. Most likely, the matrix’s role in this process is limited to an important mechanism—the sorption of iodine on its surface, followed by diffusion to the active silver nanoparticles, which ultimately contributes to the high efficiency of the proposed method.
Optimal conditions for determination, ensuring quantitative conversion of iodide ions to molecular iodine and its complete extraction from the analyzed solution, were previously experimentally confirmed [43]. Iron(III) chloride selectively oxidizes iodides and therefore is the most suitable reagent for this method. The air flow rate was 2.8–3.0 L min−1. The analysis time was 20 min. Working acidity (pH 0–1) was achieved by adding concentrated sulfuric acid to optimize the RIP preparation process. The sensitivity to iodine and the reproducibility of the modified paper characteristics for one sample and for different samples from one batch of manufactured papers were chosen as the main criteria. The sensitivity was estimated based on the diffuse reflectance spectra and the difference in color coordinates (Δy) of the reaction zone of the test strips before (y0) and after (y(I)) interaction with iodine obtained in the reaction system from a potassium iodide solution with a concentration of 0.1 mg L−1: (Δy = y(I) − y0). We experimentally studied the effect of the paper type (Table 4), the method of applying nanoparticles, and the drying conditions of the modified papers. In addition, the dependence of the sensitivity of the technique on the amount of AgNCs sorbed on the strip was studied (Table 5).
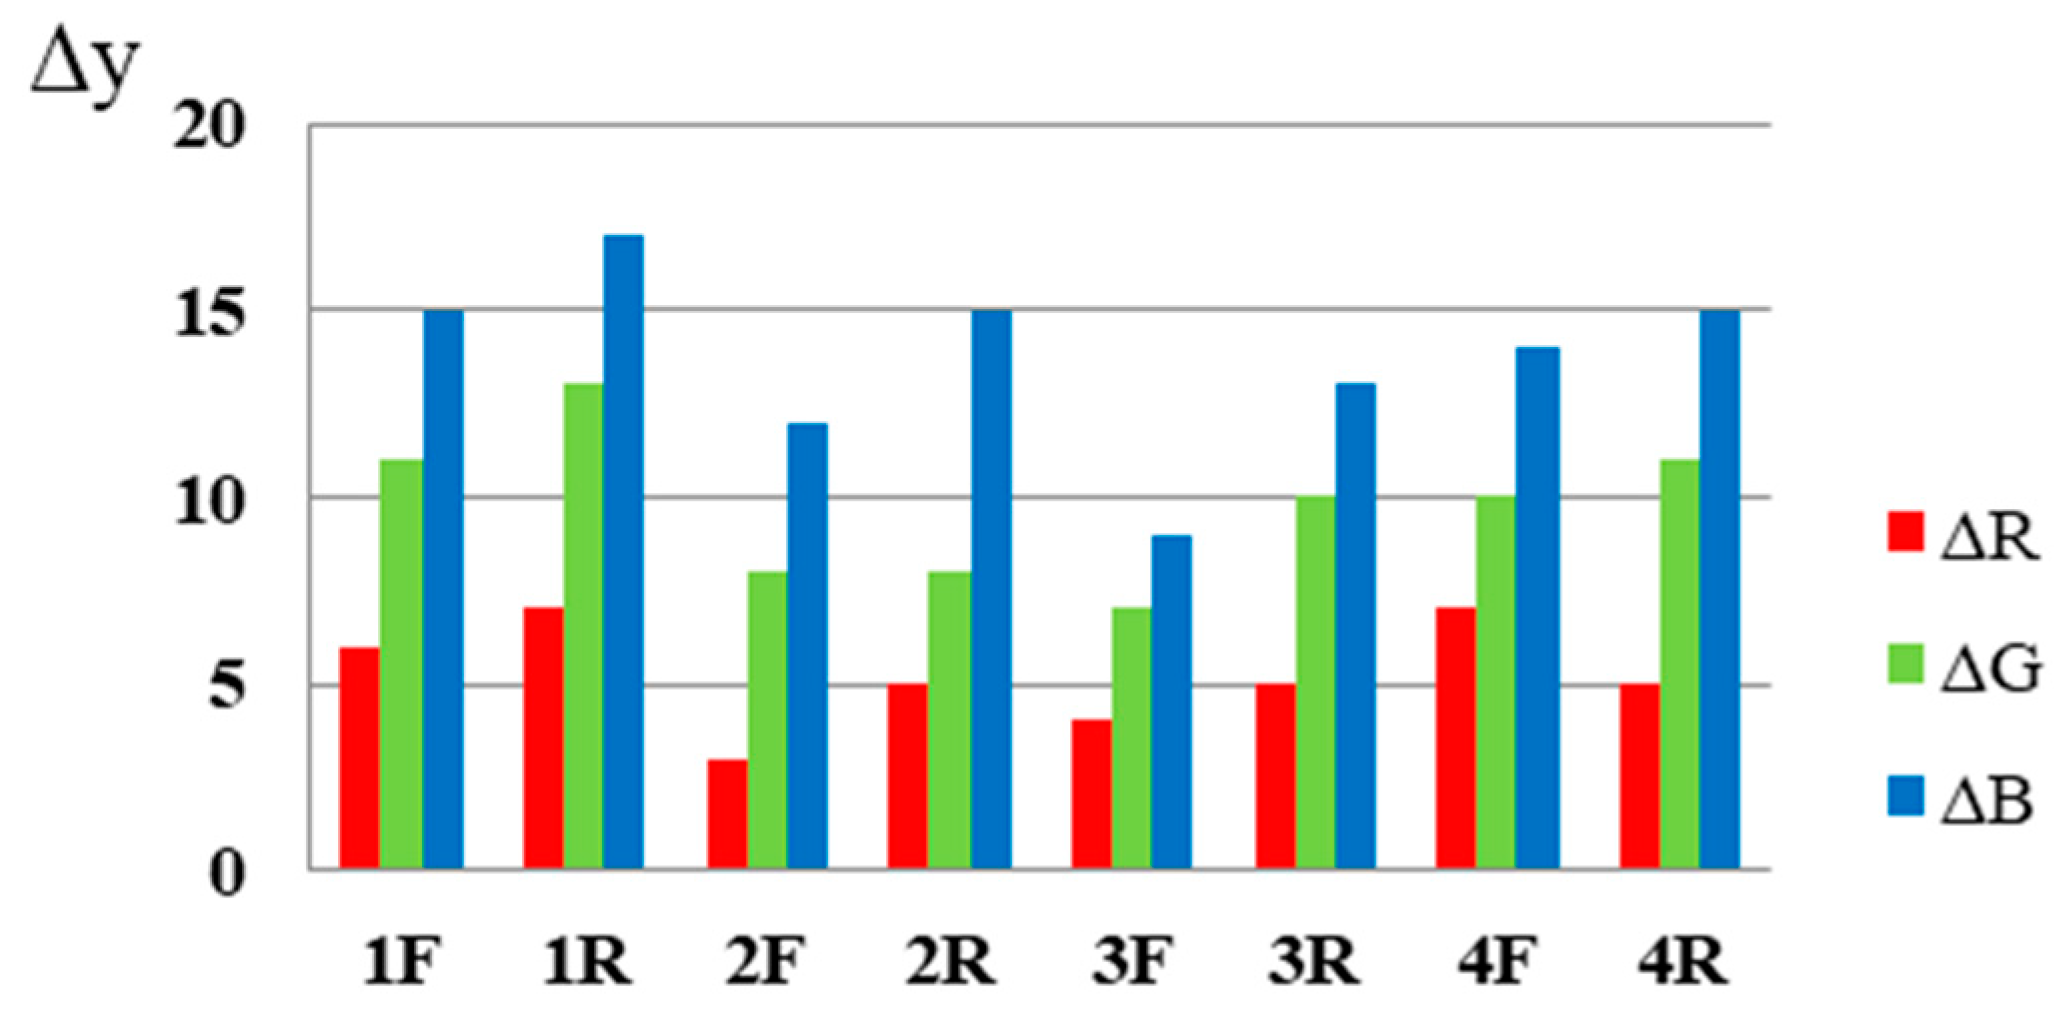
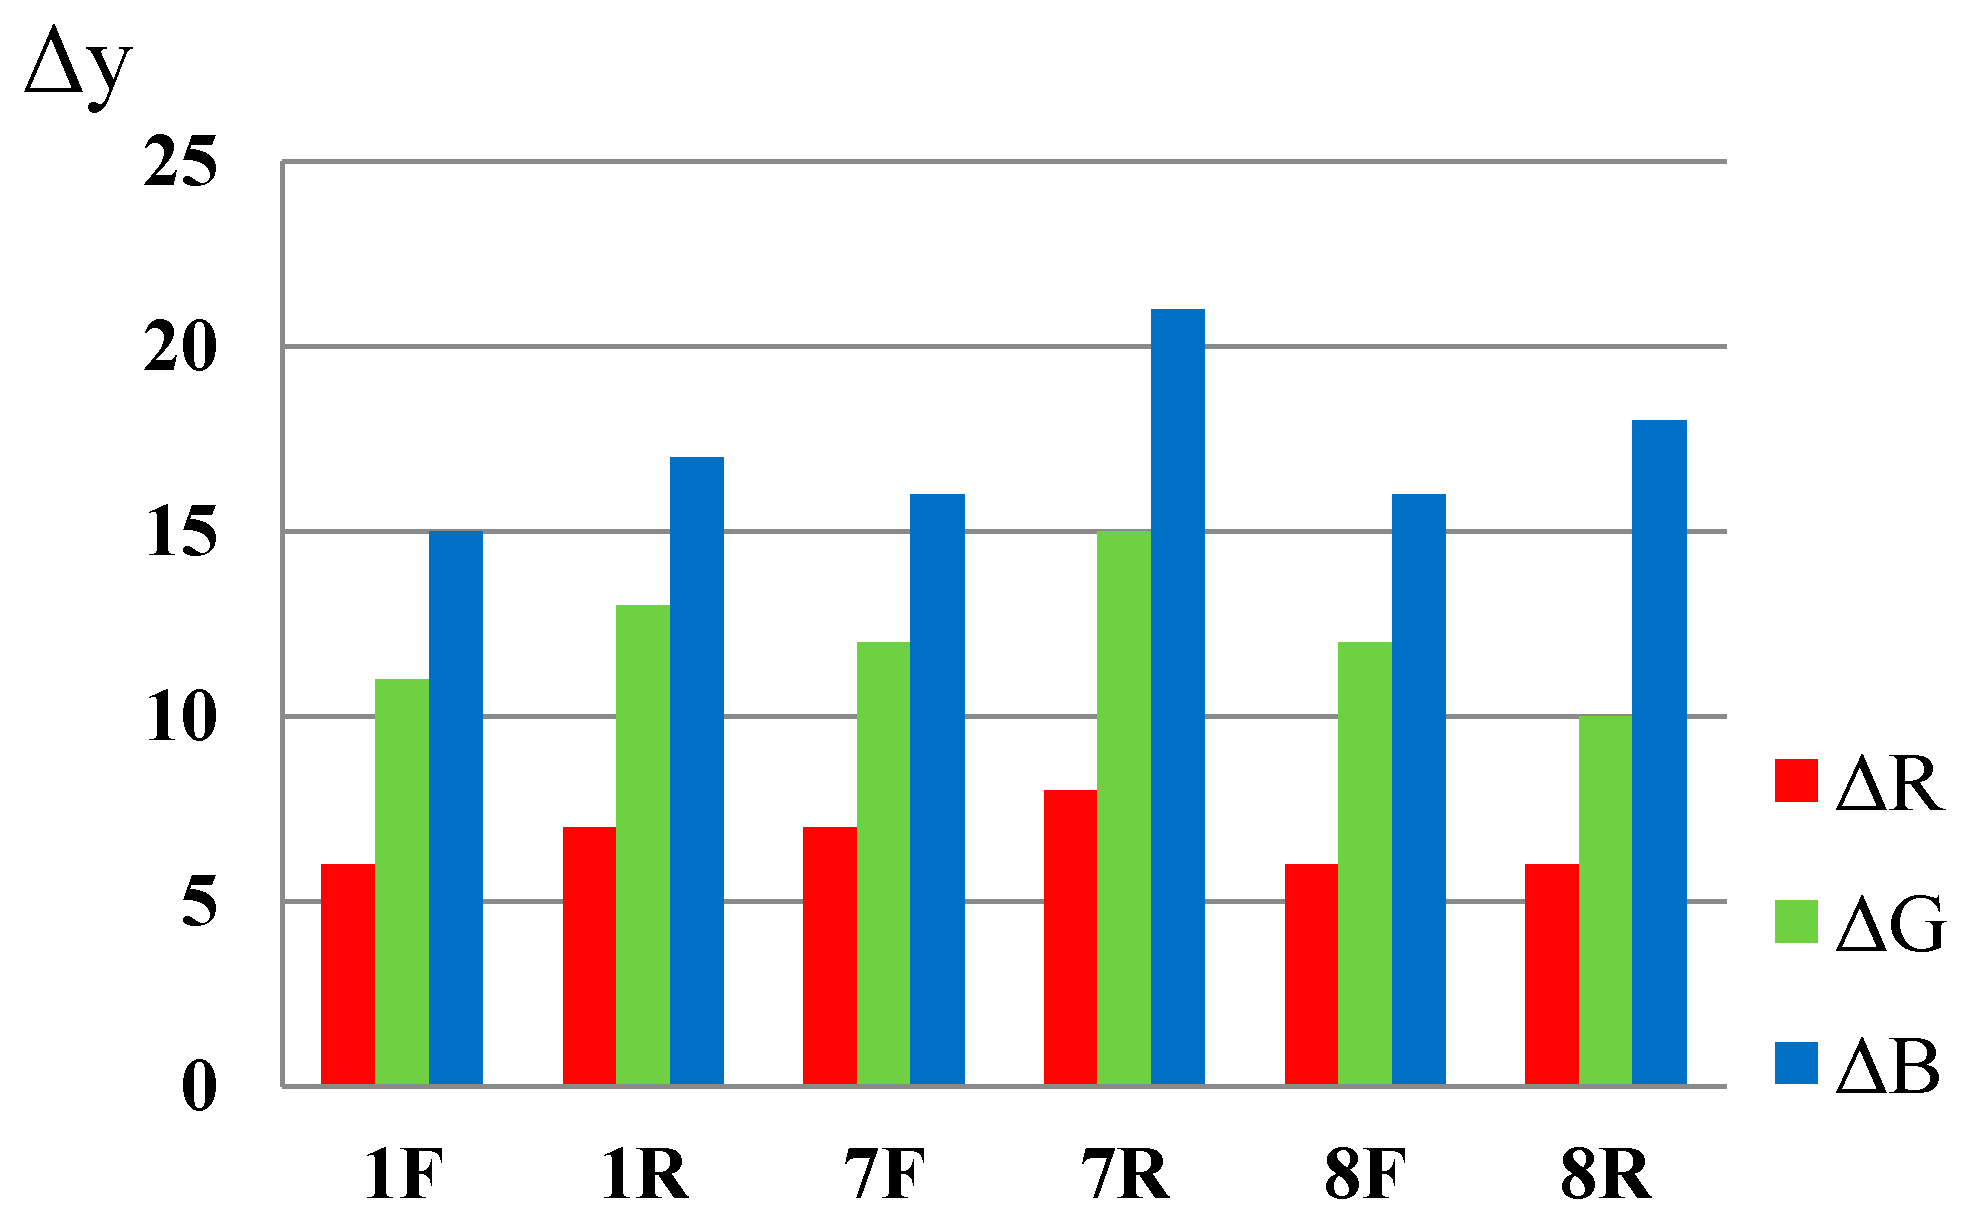
Figure 13 shows a diagram for different RIP samples obtained by single dripping (samples 14), from which it follows that the maximum values of Δy are observed for type A paper. The samples were examined from two sides: from the side where the AgNCs were applied (F) and the reverse side (R).
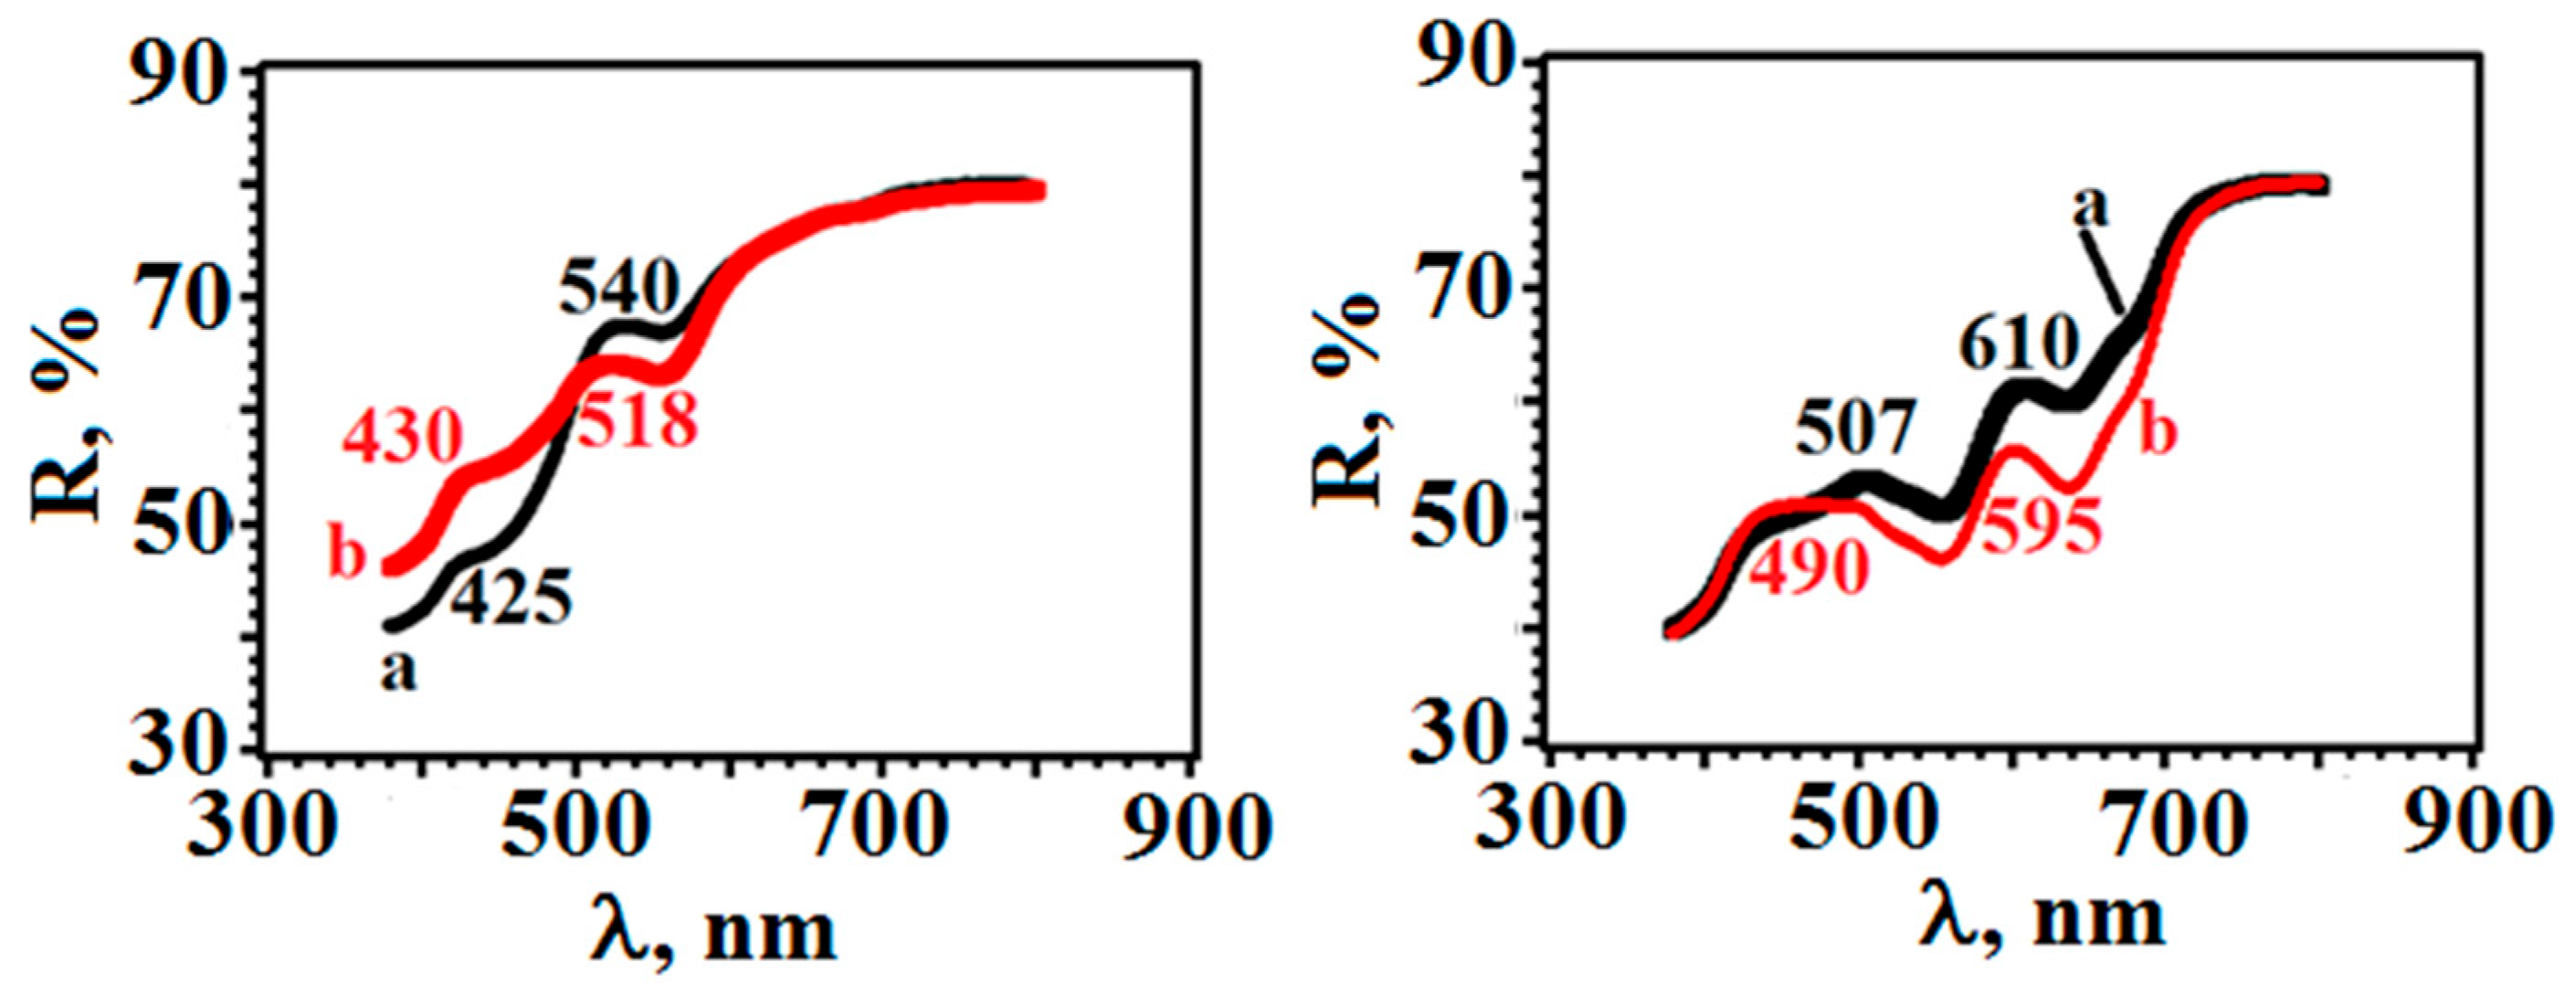
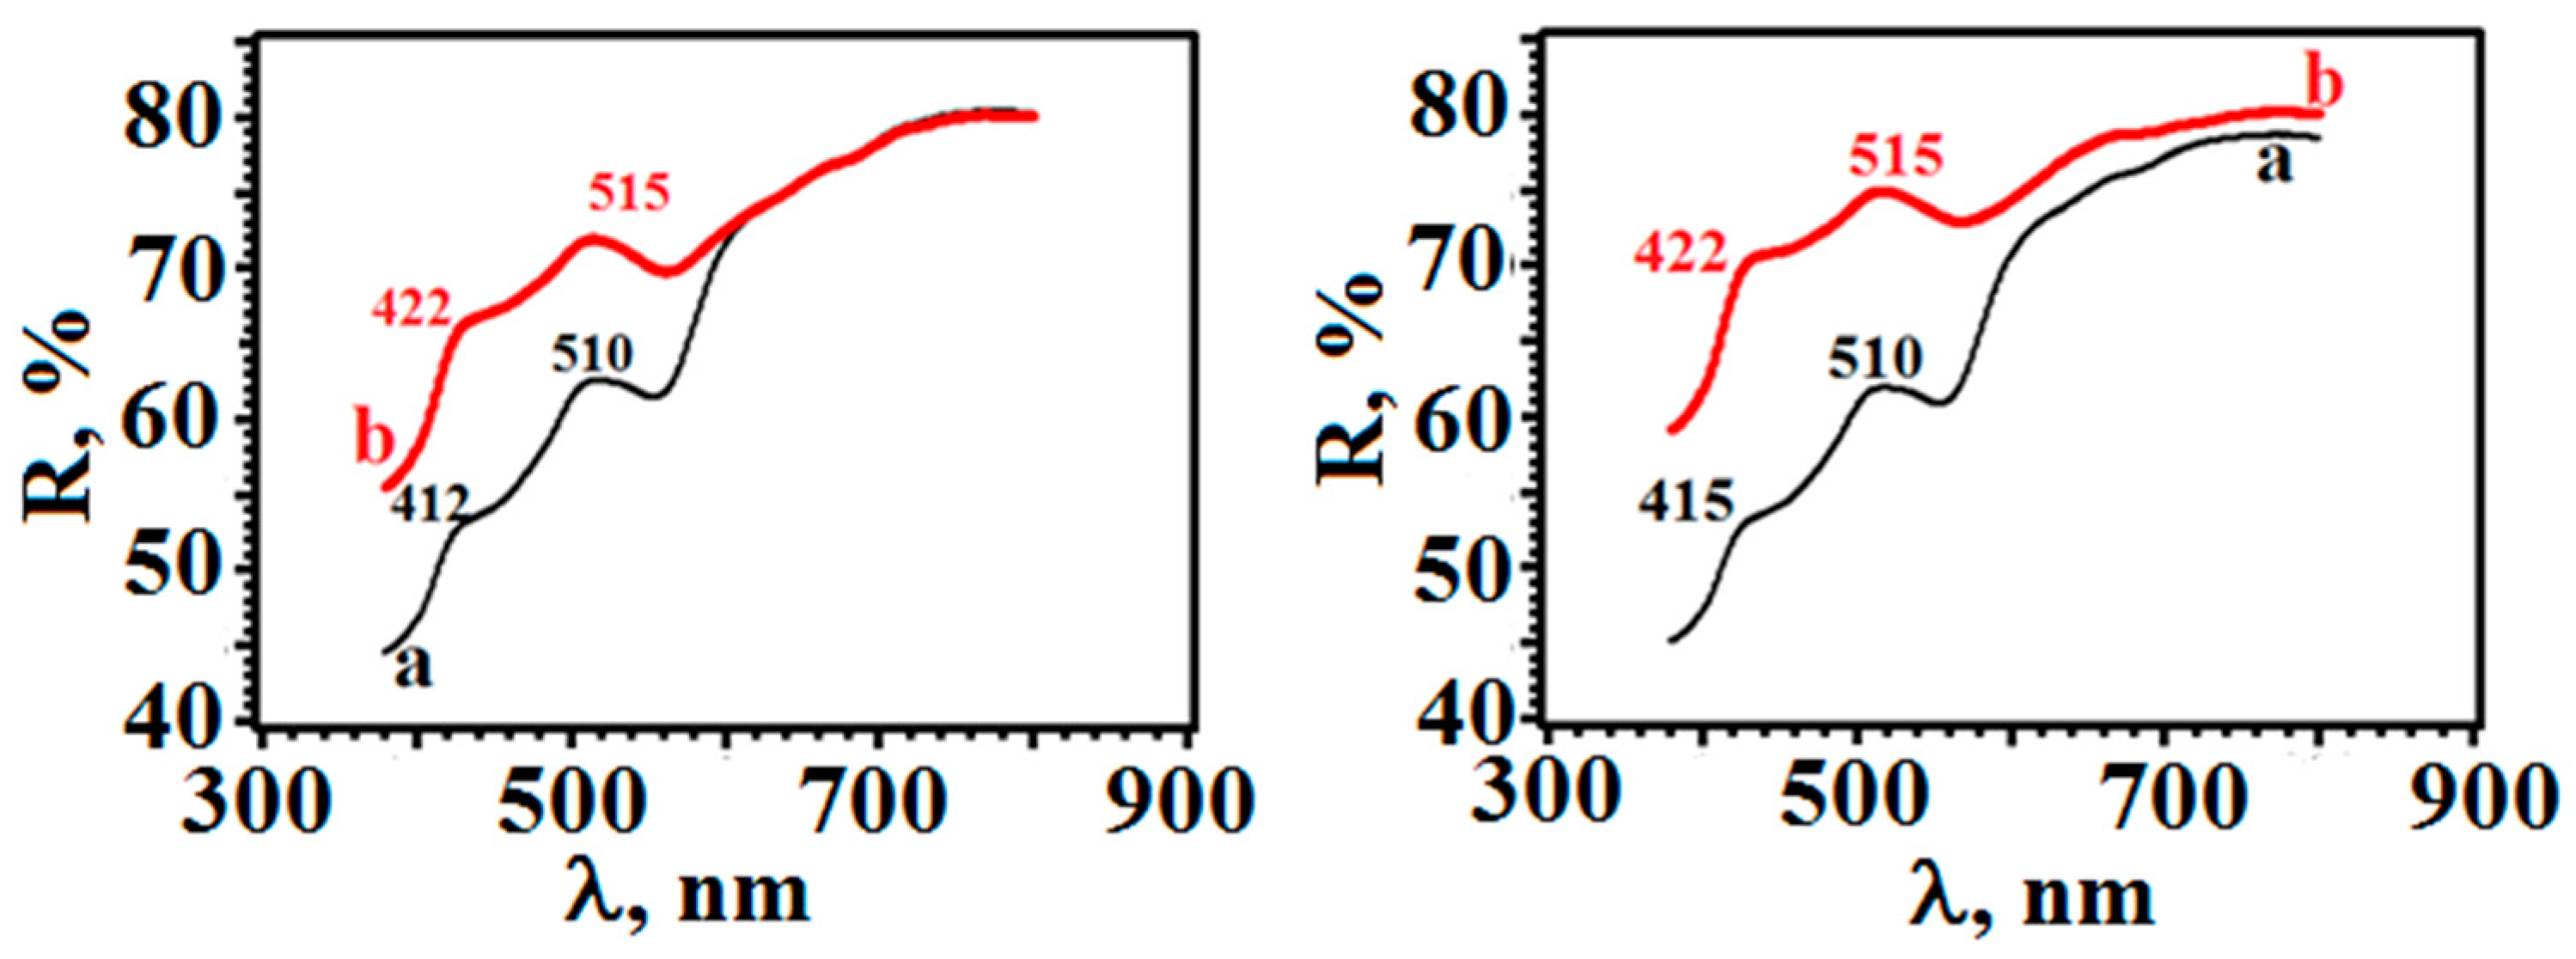
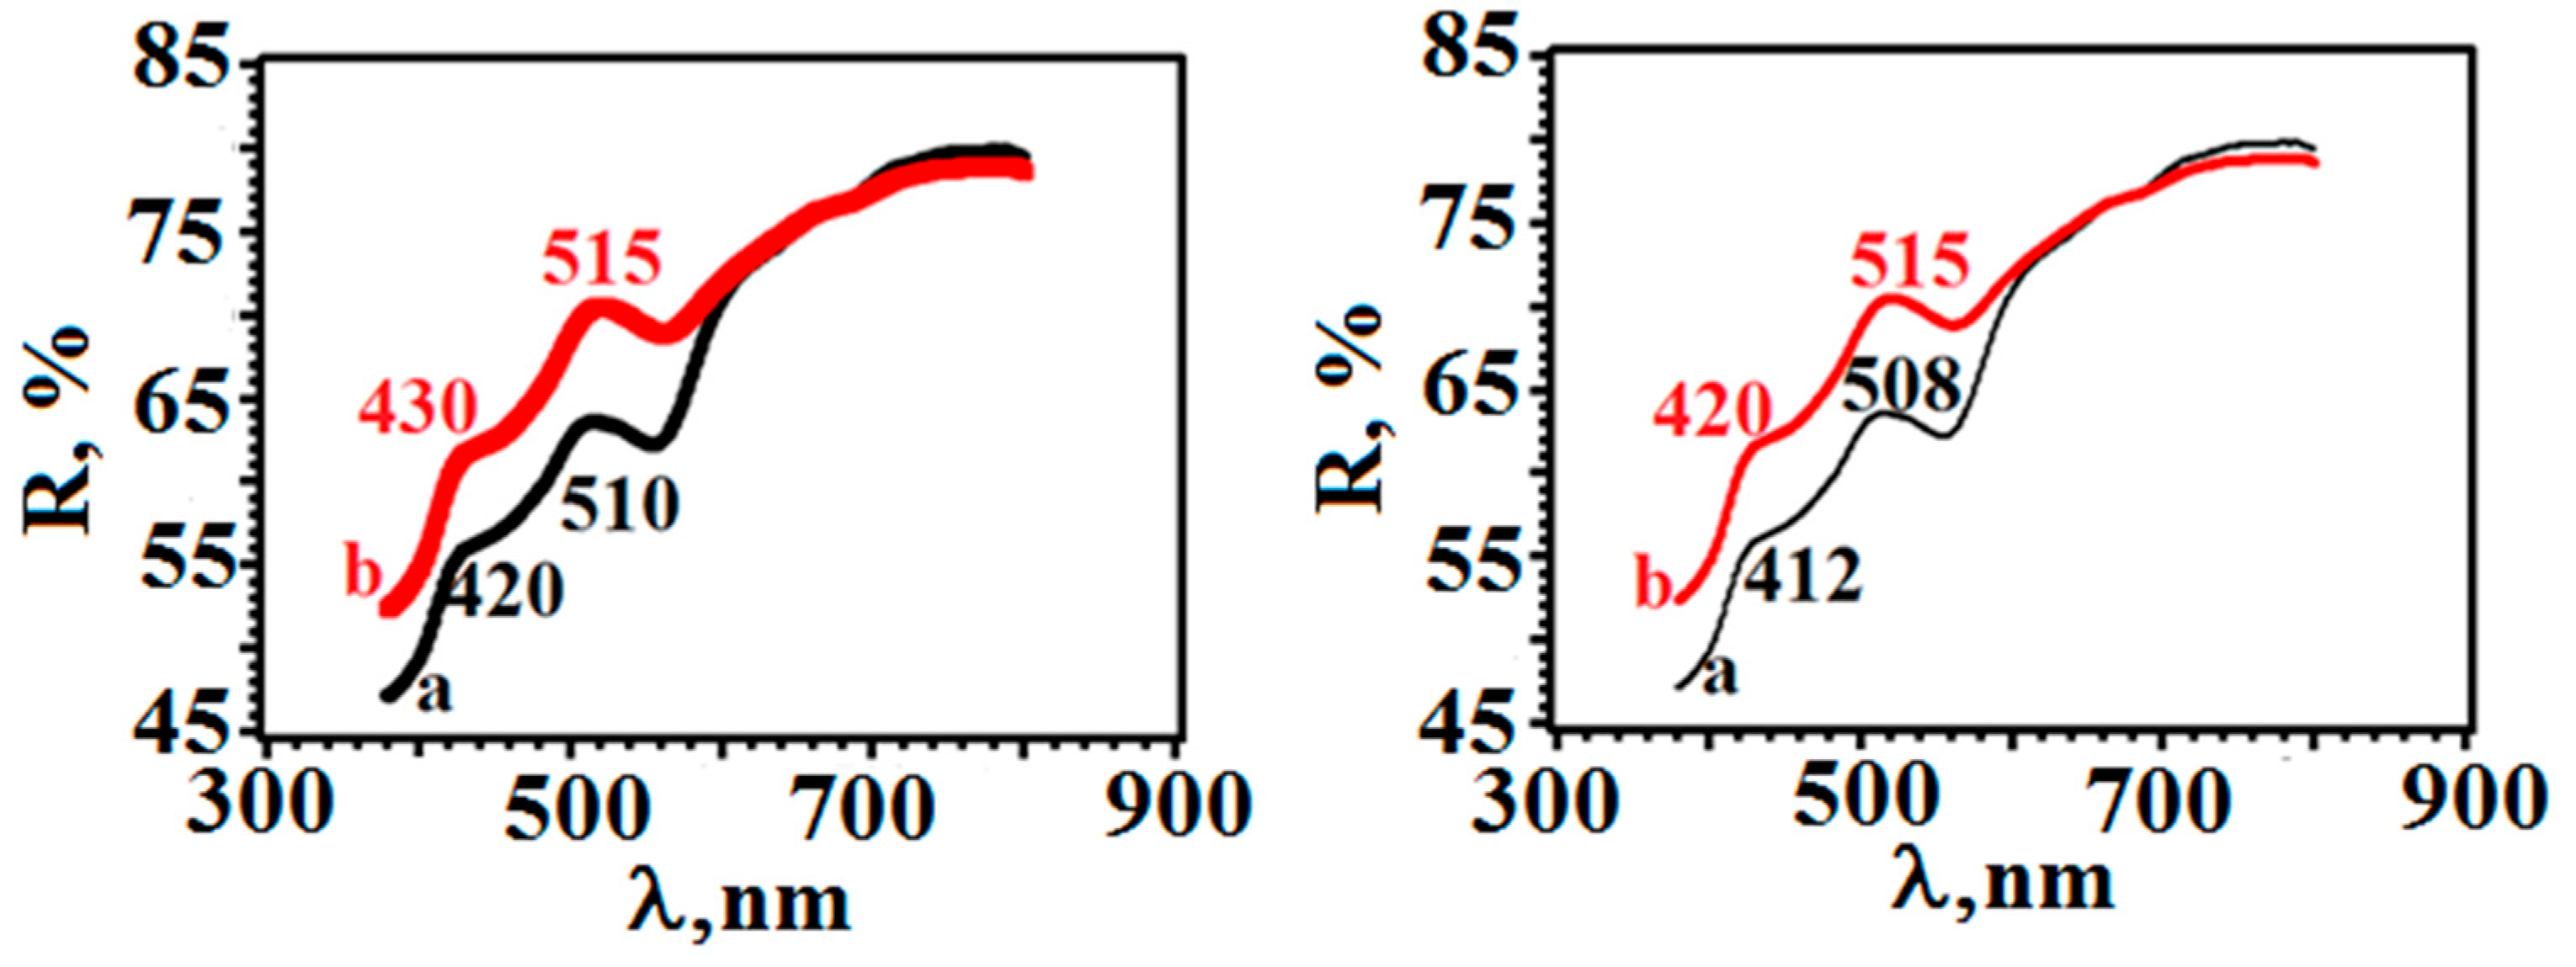
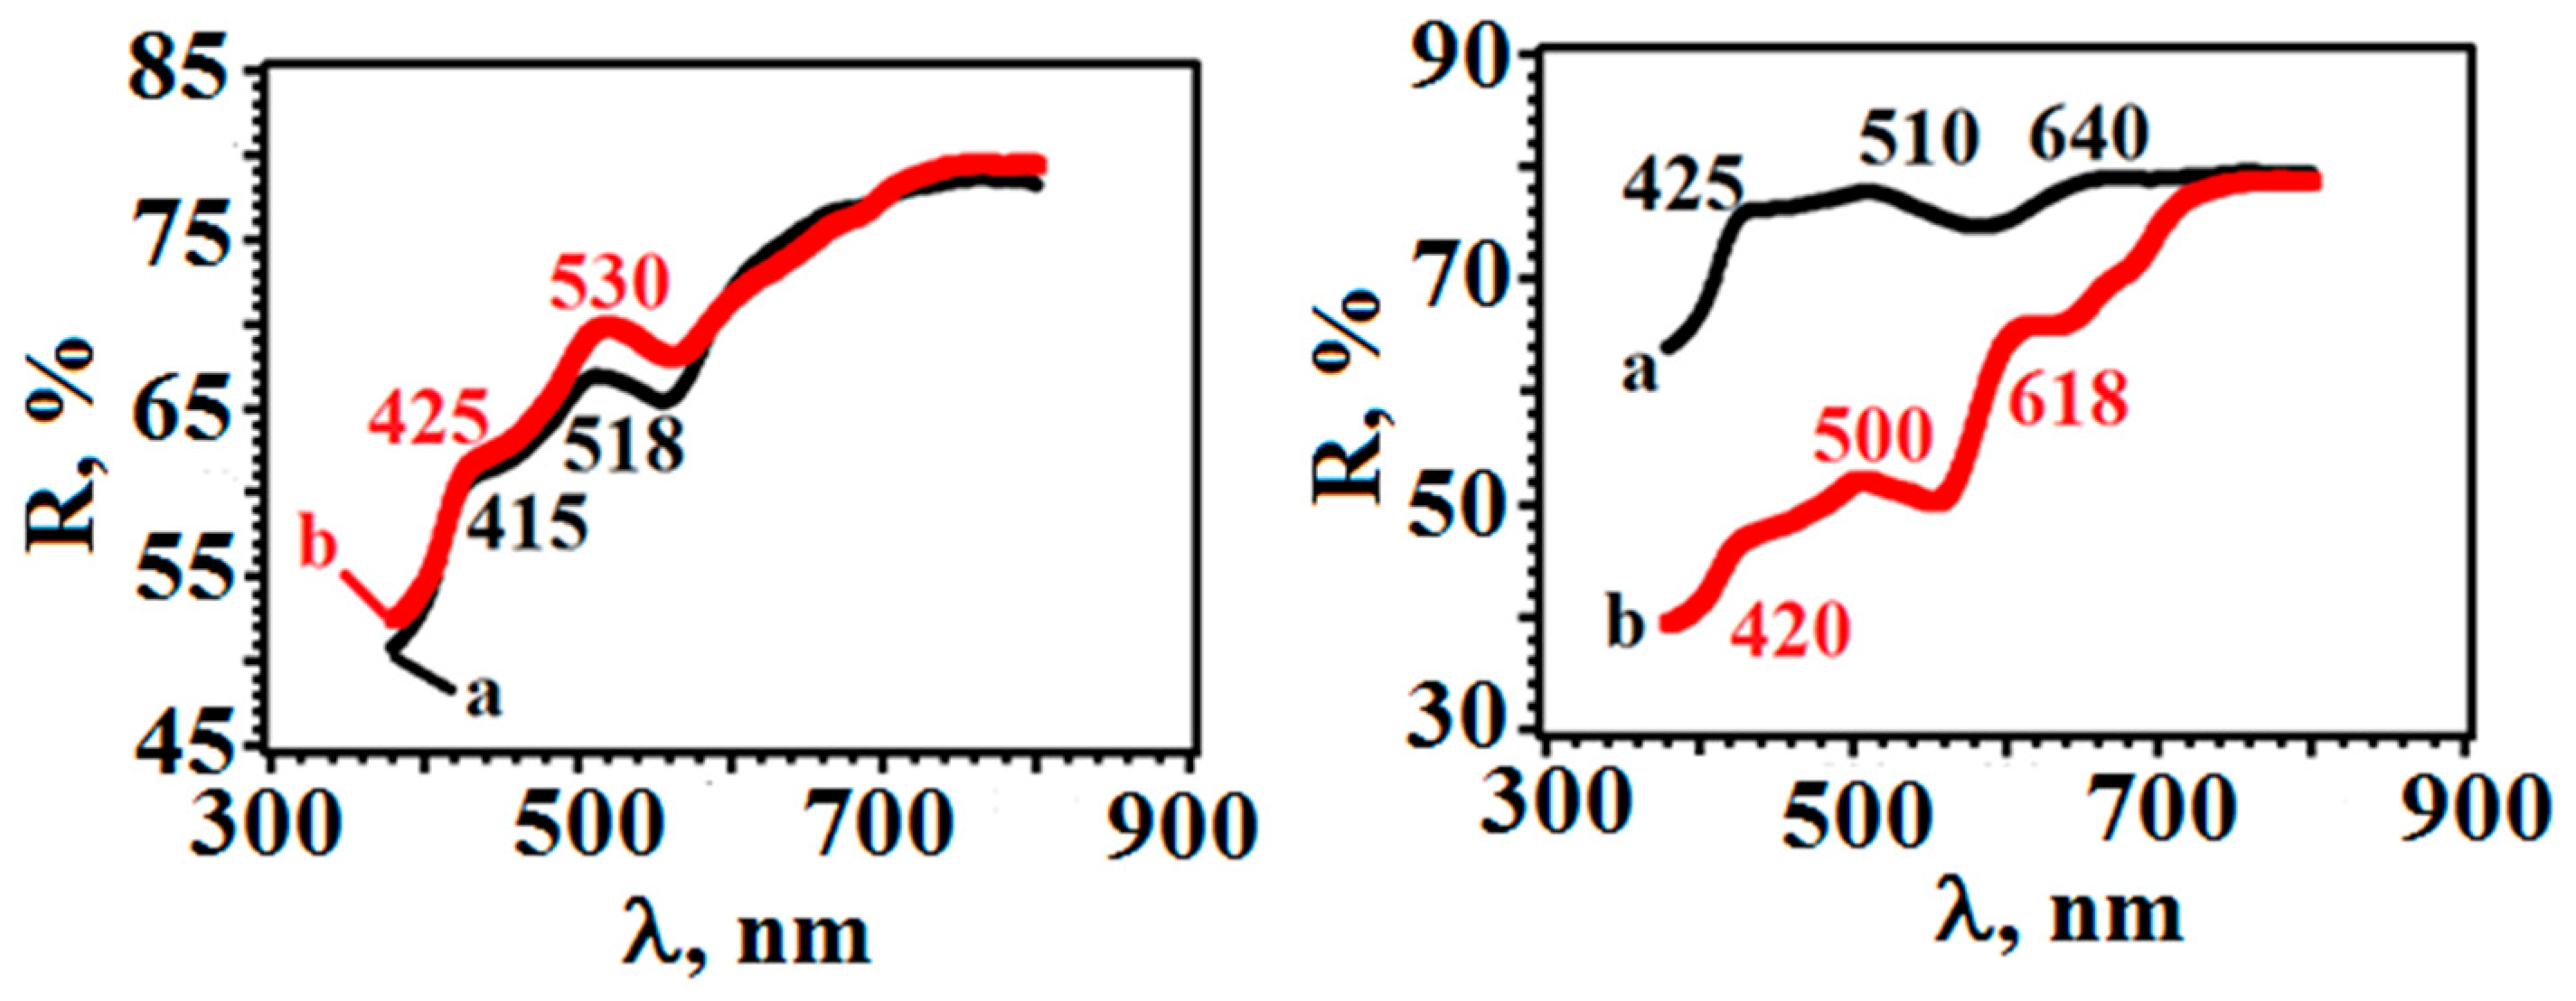
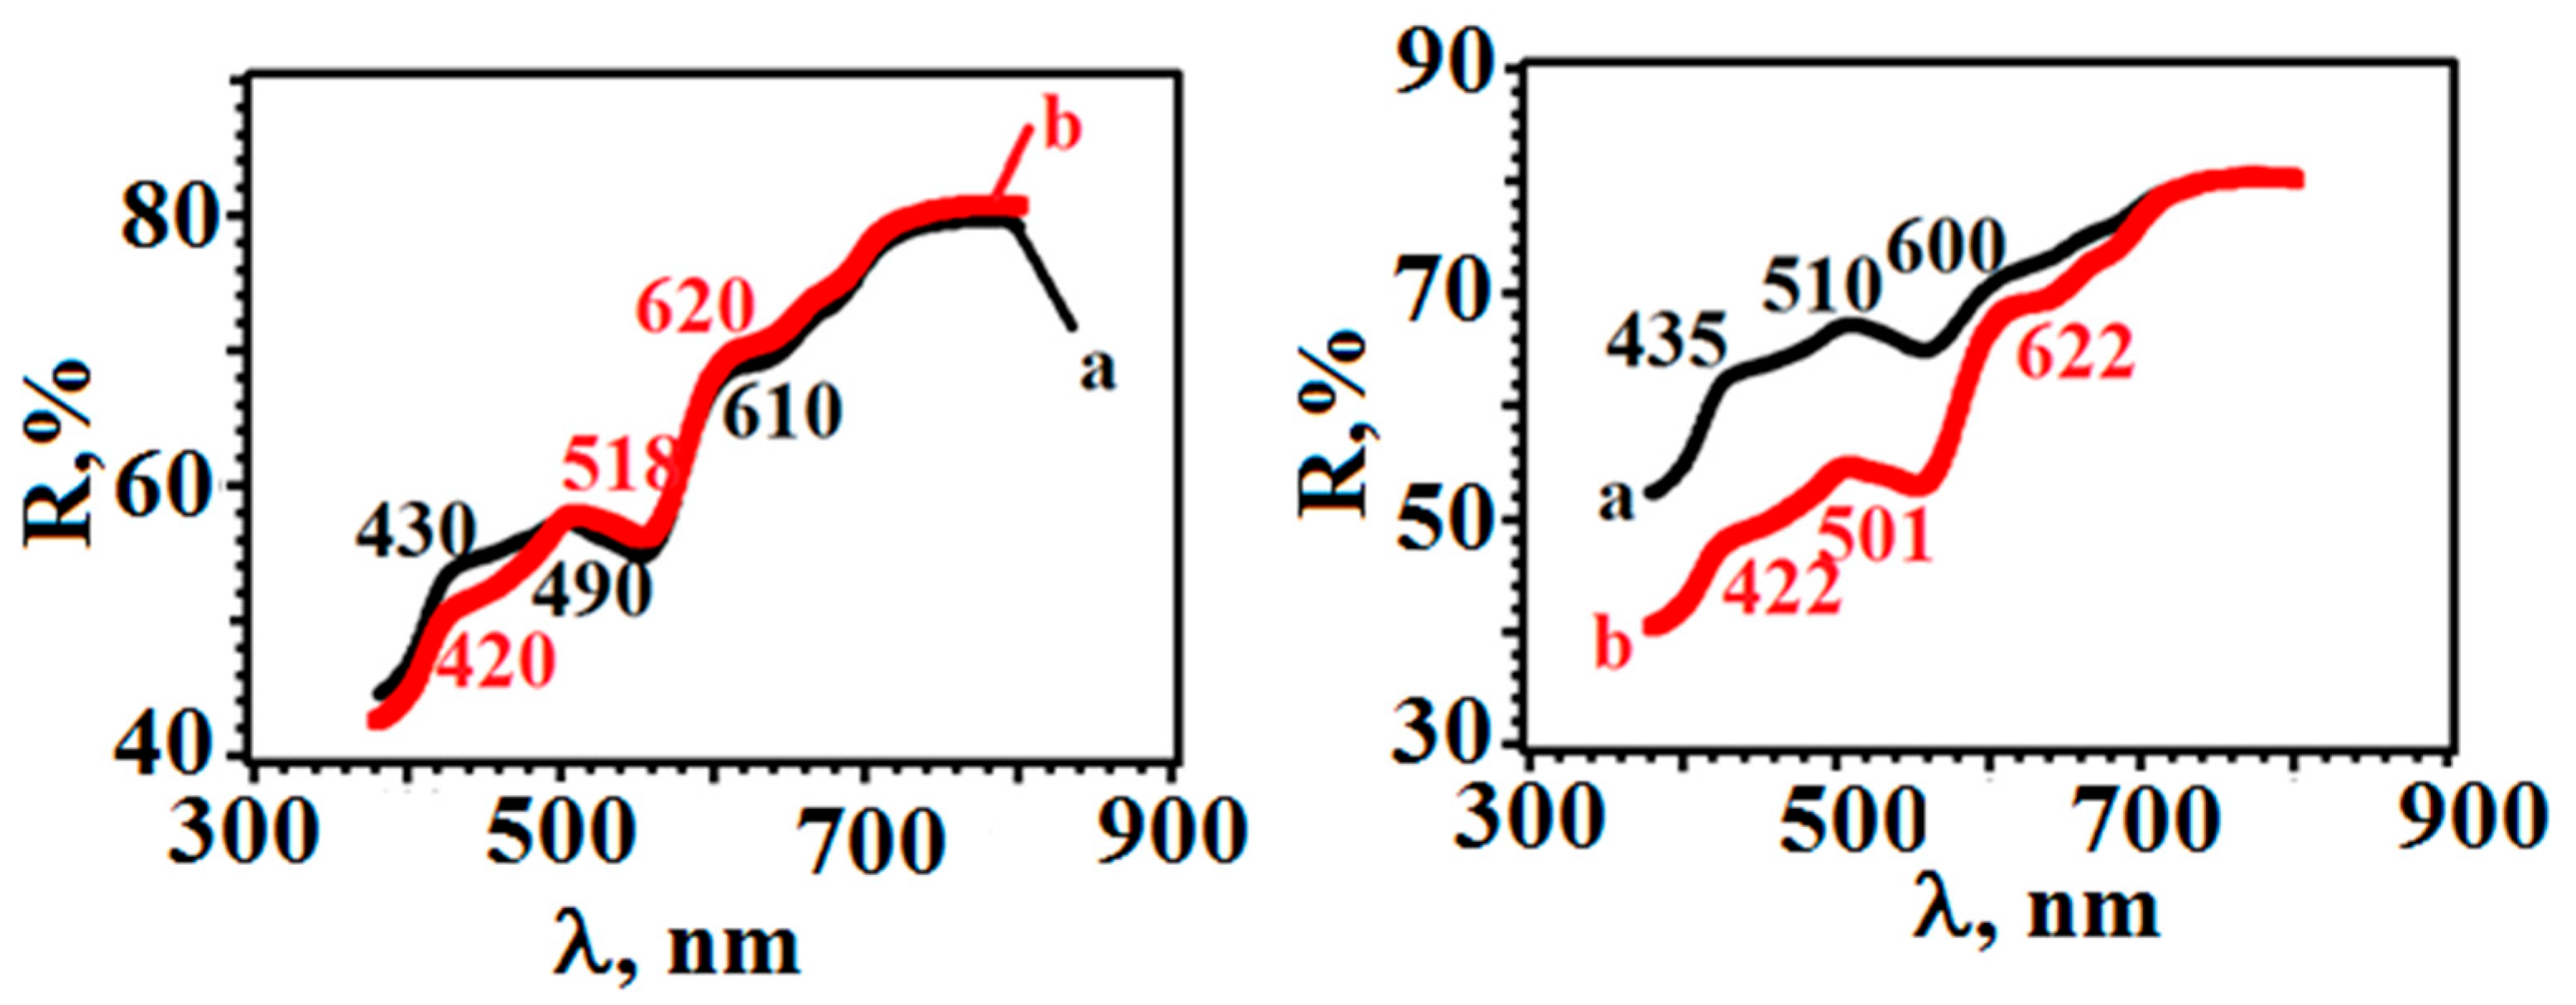
Comparison of the Δy values for both sides of this type of paper allows us to conclude that their sensitivity is commensurate. This conclusion is clearly confirmed by the diffuse reflection spectra (Figure 14, Figure 15, Figure 16 and Figure 17). It can be assumed that the density of type A paper allows AgNCs to penetrate deeply into it and be adsorbed almost equally by each side.
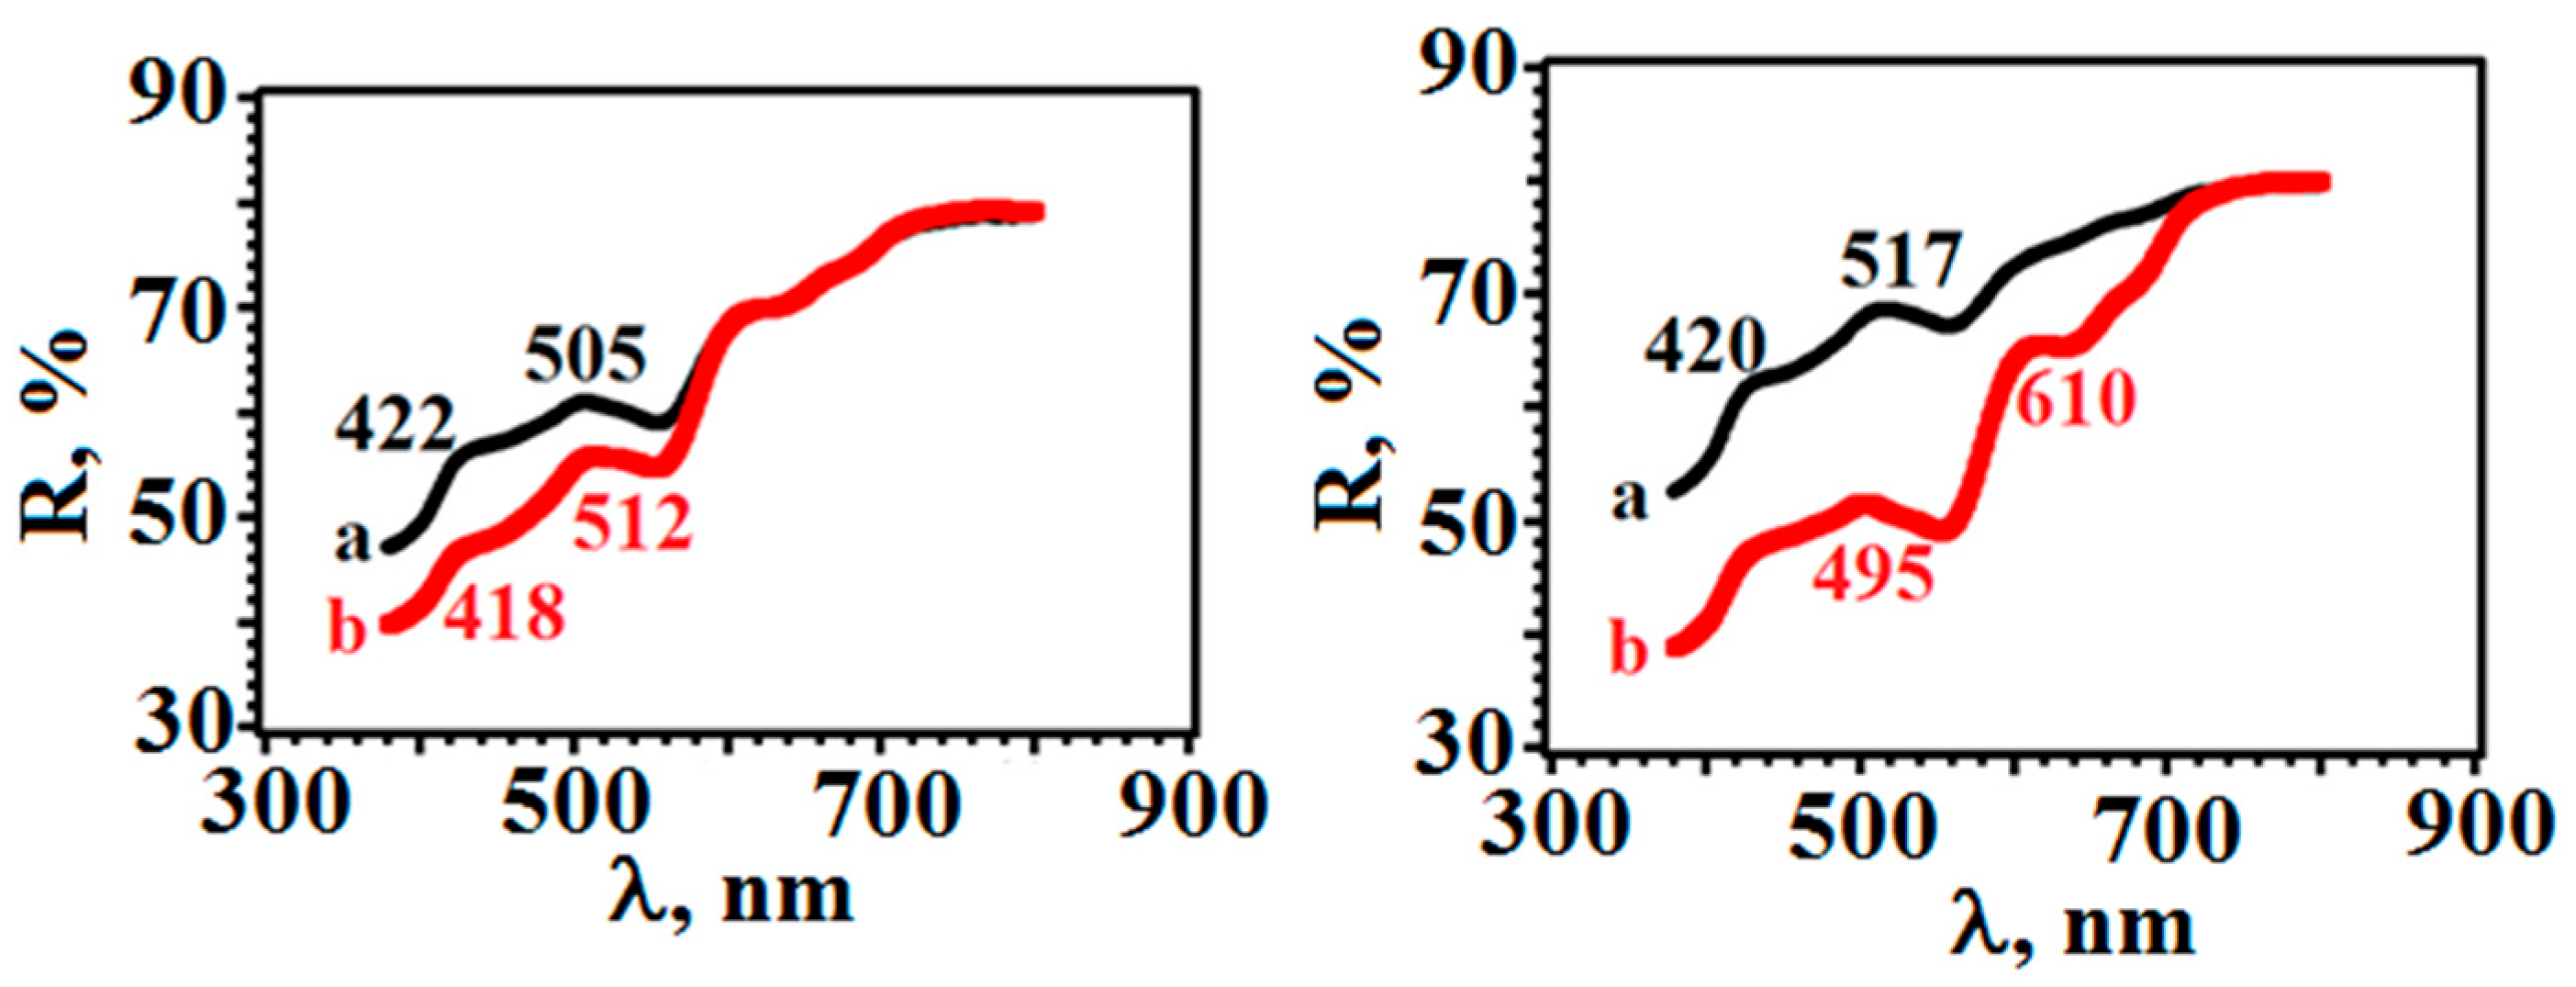
Similar results were obtained for type A paper, from which RIPs were prepared by the impregnation method (Figure 18 and Figure 19).
Next, paper samples made by single dripping and single impregnation methods were compared. Since Δy has a maximum value for sample 7 (Figure 20), it is clear that the most sensitive RIP can be obtained by modifying type A paper by the impregnation method. In this case, the reverse side remains more sensitive.
In this work, drying of paper samples treated with a solution of AgNCs was carried out at ~80 °C, which allowed us to obtain many samples at a time. In the process of preparing RIP by impregnation, two drying options were used: horizontal and vertical (Table 5). Visual analysis of the surface of paper samples showed that horizontal drying led to a more uniform distribution of nanoparticles on the surface of the paper.
Thus, at this stage, it can be concluded that maximum sensitivity is achieved in the case of using type A paper, which allows us to recommend it as a cellulose carrier of AgNCs in the manufacture of iodine-sensitive RIPs. In this case, the paper should be modified by impregnation followed by horizontal drying. It is recommended to scan the manufactured test strips from the backside.
It has been proven that the intensity of color and spectral characteristics of RIP samples are significantly affected by the number of applied nanoparticles [33]. In other words, from the point of view of chemical analysis, it is obvious that LOD and the range of determined concentrations of the method depend greatly on the reagent content in any test strip. Therefore, the next stage of this study was to study the effect of the concentration of AgNCs on the sensitivity of RIP to iodine.
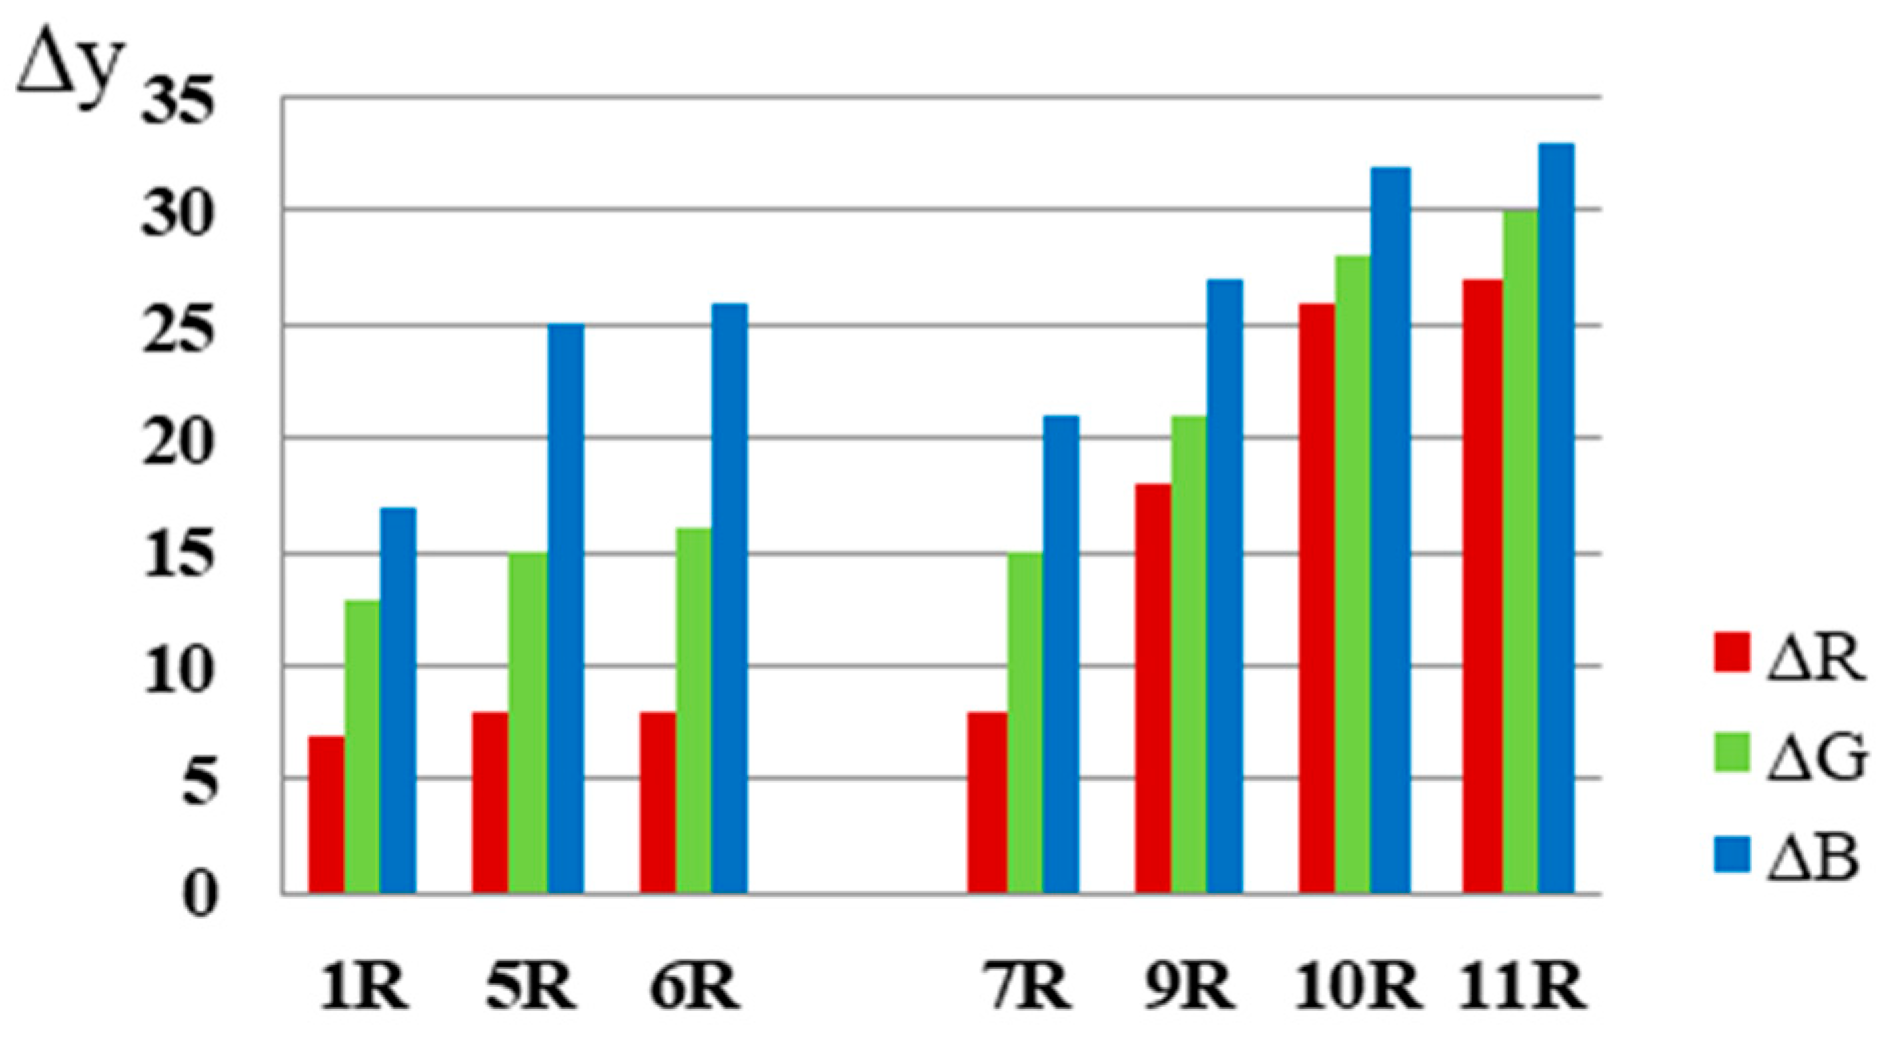
The content of AgNCs on the RIP samples was increased by multiple repetitions of the dripping (samples 5 and 6) and impregnation (samples 911) procedures.
With an increase in the content of AgNCs, an increase in the intensity of the gray-silver color of the RIP is observed. The transition to a beige color after contact with iodine becomes more contrasting. At the same time, the reverse side of the RIP is still slightly more sensitive for both the samples obtained by dripping and for the samples obtained by impregnation. Therefore, only the R side was considered further (Figure 21). It is worth noting that a change in the content of AgNCs did not affect the choice of the modification method. RIPs obtained by immersion still exhibit the greatest sensitivity to iodine.
Thus, as a result of the analysis of the obtained experimental data for the preparation of iodine-sensitive RIP, the optimal content of AgNCs should be considered to be 0.62 mg g−1, and a further increase in the content does not lead to an increase in sensitivity.
Based on the obtained diagrams, in addition, we assumed that when using these RIP samples to determine iodide ions, the most effective analytical signal will be a change in the B-coordinate of the R, G, B system.
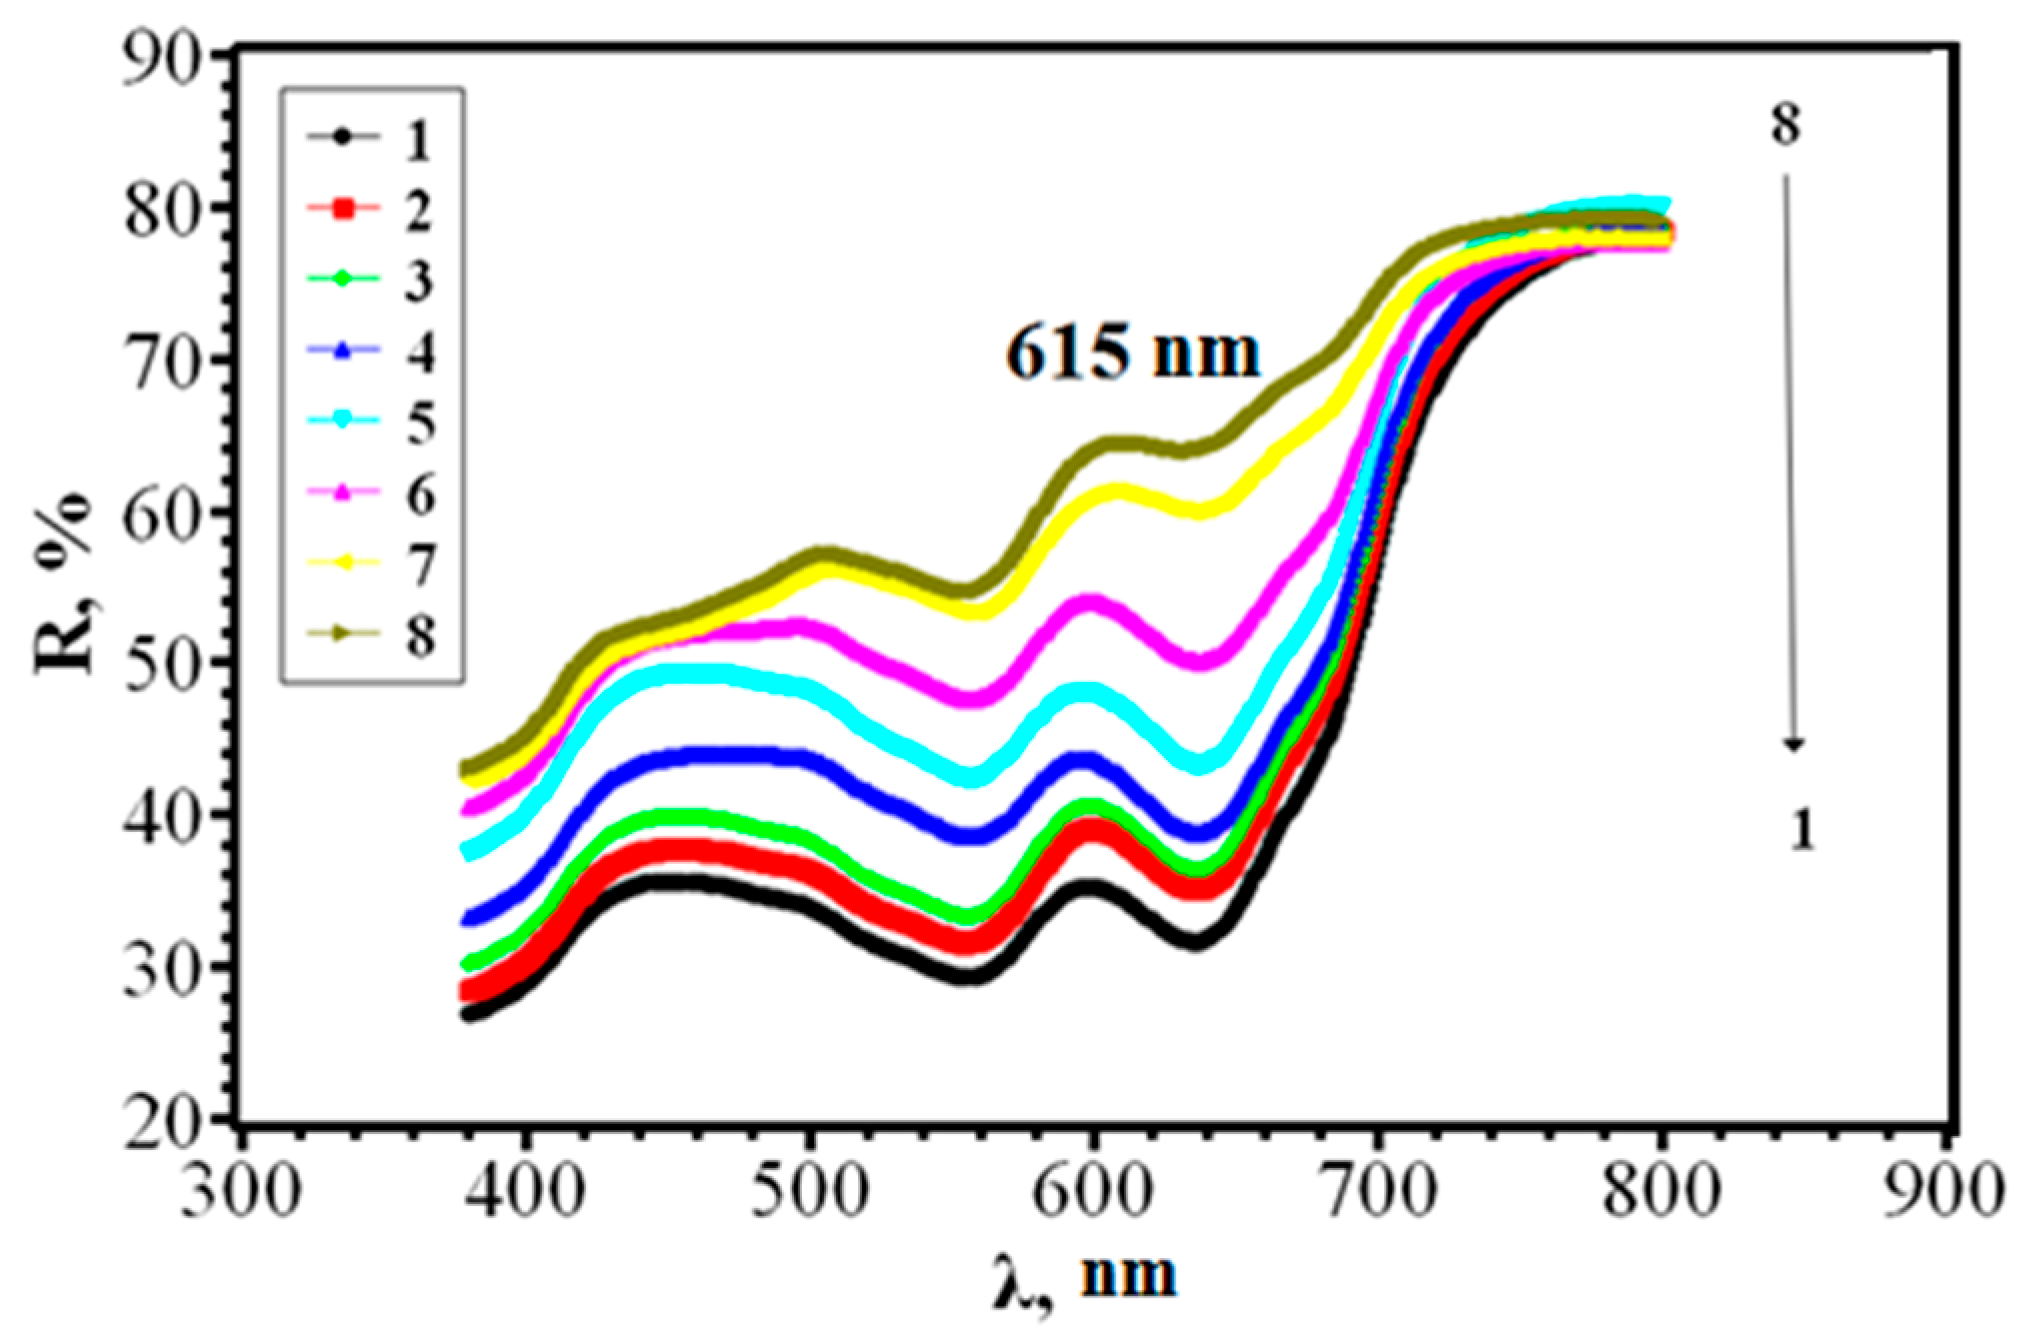
For sample 10, obtained by the optimized method, a quantitative assessment of the uniformity of the AgNC distribution over the RIP surface and the reproducibility of the reagent application was carried out. For this purpose, the relative standard deviation of the diffuse reflectance coefficient measurement at 615 nm, R615, was calculated for different surface areas within one sample and for different samples within one batch (Figure 22). It was found that the relative standard deviation R615 is 0.025–0.043, which indicates the possibility of using the obtained RIP for the manufacture of test strips. Further studies were carried out with sample 10.

3.6. Determination of Iodides and Iodine

The range of detectable concentrations was established experimentally using a series of standard potassium iodide solutions. The change in the color of the reaction zone of the test strips after the analysis under the selected conditions was observed in the range from 0.03 to 1.6 mg L−1 (Table 6). A simple and accessible colorimetric method was used to describe the color. Using scanning technologies and image processing software, color coordinates were obtained in the RGB system. Table 5 presents the average coordinates of five parallel measurements.
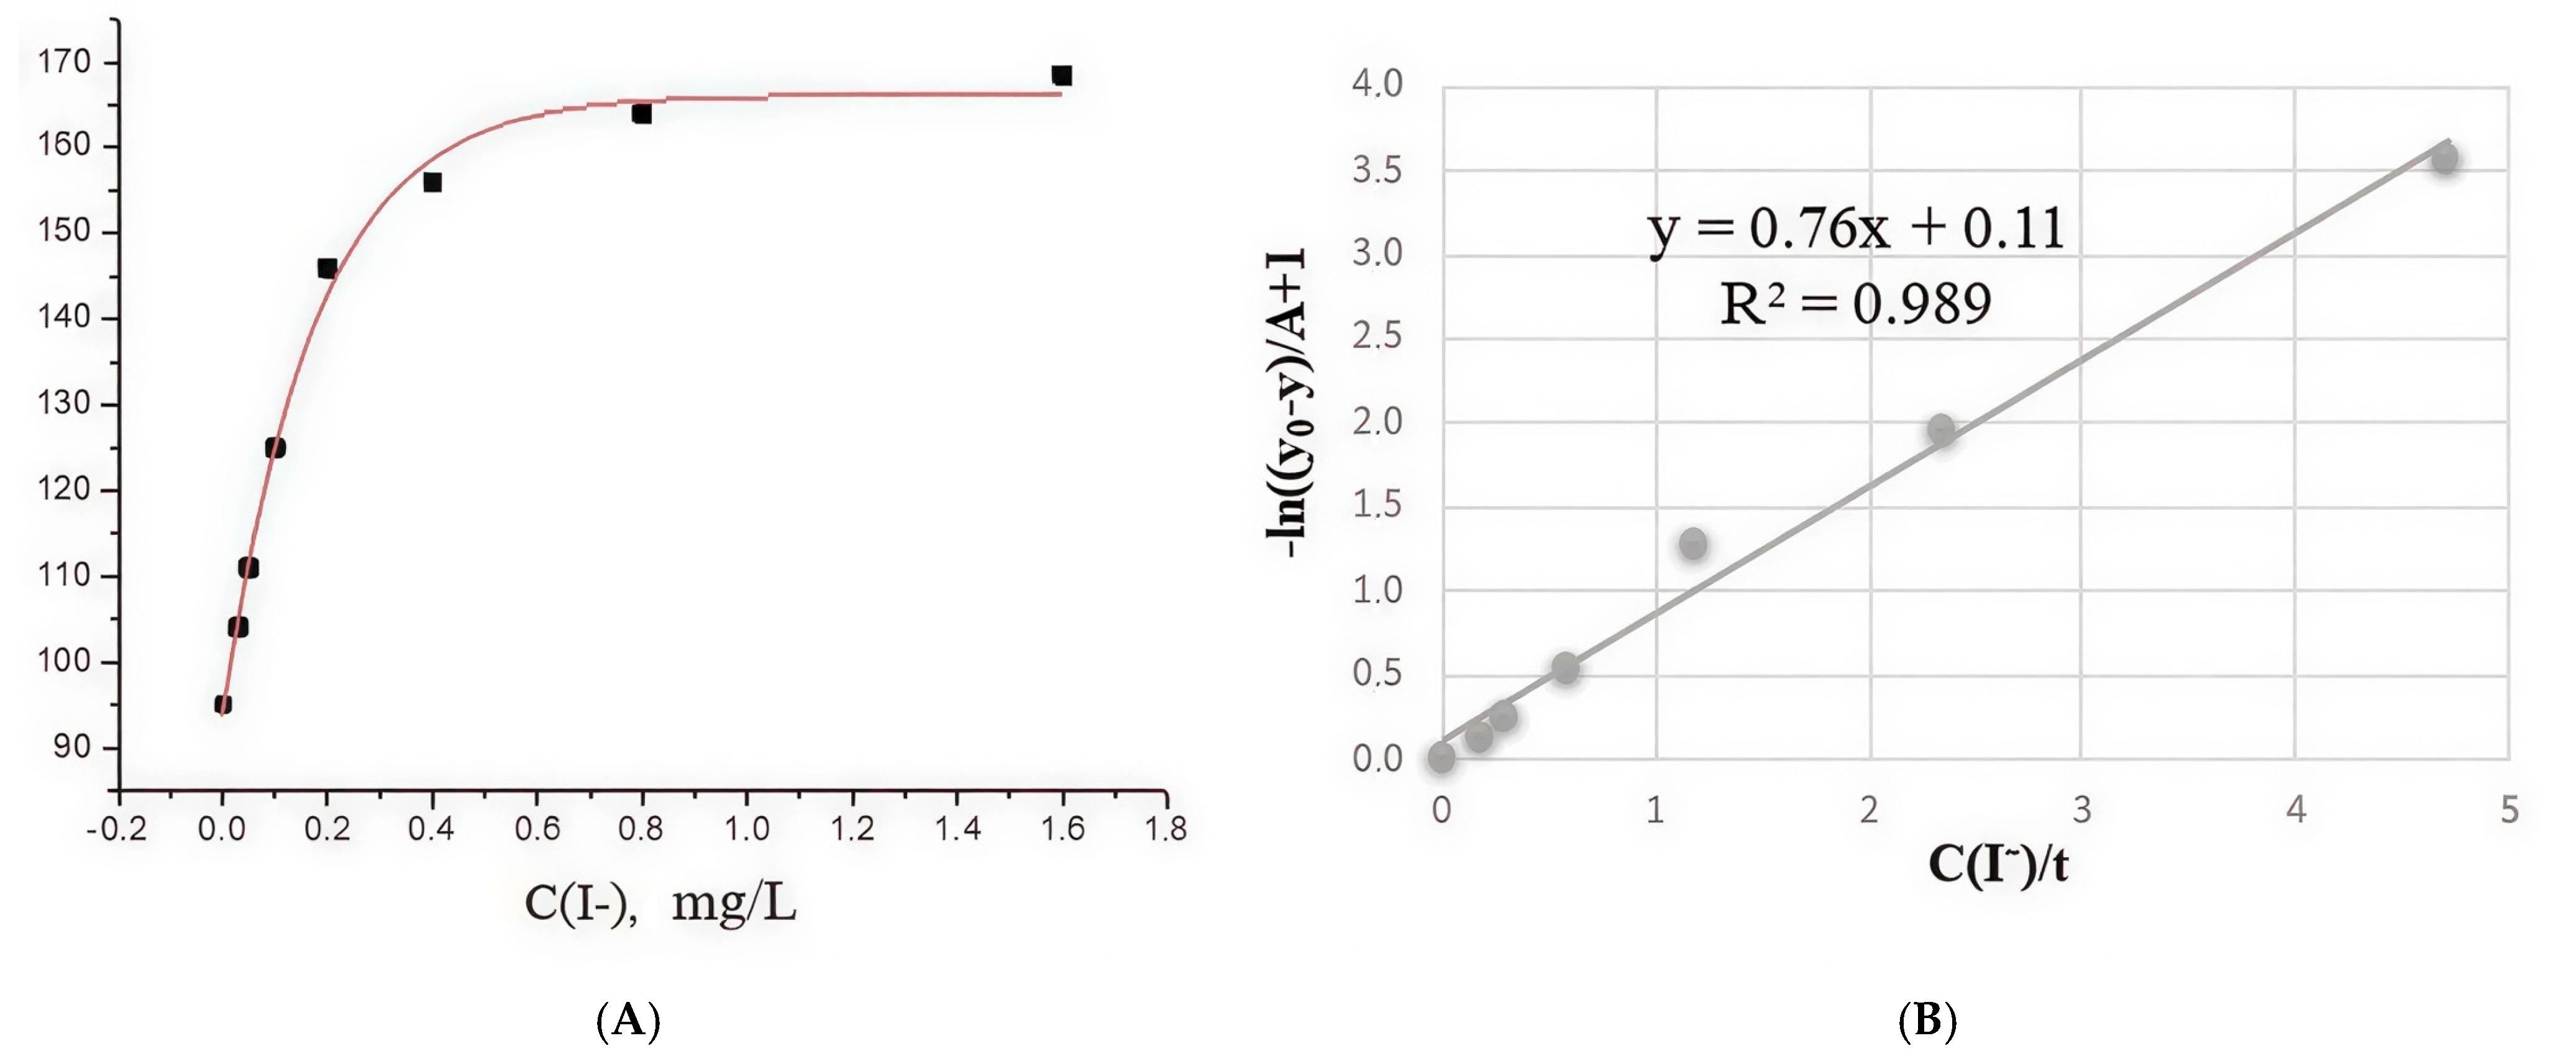
To select the most sensitive analytical signal, the dependences of R-, G-, B-coordinates on the concentration of iodide ions were studied. They are exponential equations of the form y = y0 + A(1 − exp(–c(X)/t)). Table 7 presents their regression parameters (y0, A, and t).
Considering that the value of A/t is a criterion for selecting the optimal color coordinate [47], it was found that for the colorimetric determination of iodides using the proposed method, the blue coordinate B should be selected as the analytical signal. The type of calibration graph is shown in Figure 23. For convenience, the exponential dependence is converted to a linear form:
−ln((y0 − y)/(A + 1)) = c(I)/t,
which is described by the equation
y = 0.76x + 0.11 (R2 = 0.989),
where y = −ln((y0 − y)/(A + 1)), x = c(I)/t.
Mathematical analysis of the obtained regression equation shows that, in accordance with the law of error propagation and assuming the constancy of the parameters y0, A, and t, the standard deviation of the analytical signal (brightness) Sr and the standard deviation of the determined concentration values Sc are related as follows:
S r   =   | d y d c | S c   =   A t e c t S c
or
S c = e c t A t S c
from where the limit of detection (LOD) calculated using the 3S criterion can be found as
C m i n = 3 S ( 0 ) = 3 S r A / t
To estimate the LOD of the presented method, iodide solutions with a concentration of 0.1 mg/L were prepared and analyzed (according to the scheme presented above). Using the values of the previously selected coordinate B (125, 126, 124, 125, 128, 124) obtained in six replicates (n = 6), the Sr, Sc, and LOD values were calculated. They were 1.4, 0.006 mg/L, and 0.01 mg/L, respectively.

3.7. Analysis of Interfering Influence

Based on the experimental results of determining iodides of known concentration (0.100 mg L−1) in the presence of 1 M solutions of known inorganic ion salts, it was concluded that there is no significant effect of inorganic compounds on AgNCs that do not form volatile substances in an acidic medium. The results are presented in Table 8.
It is necessary to pay special attention to the fact that the presence of volatile compounds (chlorine, bromine, iodine, hydrogen sulfide, and acetic acid) in an acidic medium in a ratio of 1:1 can have a noticeable effect on the results of determination. However, we experimentally studied the effects of hydrogen sulfide and acetic acid. According to the results obtained, RIB is insensitive to these reagents down to a concentration corresponding to saturation with H2S (0.1 M) and 0.5 M for acetic acid. The interfering effects of other volatile substances, if necessary, can be eliminated by pre-degassing the sample using the presented setup (before adding the oxidizer). It should be noted that the choice of a mild oxidizing agent allows the determination of iodides in the presence of chlorides and bromides, which is an undoubted advantage of the proposed method.

3.8. Analysis of Samples

3.8.1. Determination of Iodides in Natural Waters

As part of the hydrochemical analysis, water samples collected in the Black Sea near the cities of Adler (1), Sochi (2), and Tuapse (3) (Russia) were tested (Table 9). It should be noted that the analyzed object is a fairly complex and multicomponent system. It is known that the salinity of the Black Sea water is 86% sodium chloride, and the concentration of iodides is on average 50 ng g−1. In addition, it contains fluorides, bromides, sulfates, hydrocarbonates, cations of potassium, calcium, magnesium, etc. Iodide ions in each analyzed water sample were determined without any additional preparation. Based on the average concentration of I in the analyzed object and considering the working range of the developed method, the aliquot volume was 100.0 mL. The solution was placed in a glass vessel (1) (see Figure 1) and analyzed according to the scheme described above. To verify the reliability of the analysis results, potentiometric titration with silver nitrate was used as a control method, using a silver electrode as an indicator [53]. The addition of an analytical standard of a pure substance with a known value (“introduced”) to the test sample showed that the increase in the analytical signal corresponded to the introduced additive (“found”).

3.8.2. Determination of Iodides in Pharmaceutical Preparations

The developed method is a suitable alternative to quality control methods for pharmaceutical preparations containing ionically bound iodide ions. The results presented in Table 10 demonstrate the capabilities of the method and show the convergence with the control method and the absence of interfering influence of concomitant substances. The control method in this case was also the potentiometric titration method by silver nitrate.
The analysis of the experimental data presented in the table indicates a number of advantages of the developed determination method. In addition to high sensitivity (4 × 10⁻⁷ mol), the proposed approach allows us to determine iodides in the presence of chlorides in suspensions and colored solutions. This opens up wide possibilities for using the method for the purposes of toxicological chemistry and pharmaceutical analysis.

3.8.3. Determination of Iodides in Foods

Since food products account for up to 90% of the total amount of iodine entering the body, the content of iodides is one of the mandatory standardized indicators in food chemistry. The methods currently used to determine iodides often involve the use of argentometric titration by the Mohr method, and, less often, spectrophotometric methods. In each case, the analysis is preceded by lengthy sample preparation, which consists of grinding the product, preparing an aqueous extract or mineralizate, filtration, and neutralization. Sometimes, the determination is carried out with preliminary ashing of the sample. When using the developed extraction colorimetric method, it is necessary to grind the sample and, in the case of analyzing canned food in a marinade, to eliminate the interfering effect of acetic acid by preliminary gas extraction without adding an oxidizer. As a result, the analysis time is reduced several times. In addition, the cost of reagents is reduced due to the exclusion of expensive silver nitrate. The results obtained by the developed and control (Russian GOST 13685-84) [54] methods are presented in Table 11. Comparison by the Fisher criterion shows that there is good convergence between the results obtained by the two methods. Precision is shown as the RSD of the results of a single analysis obtained by the method under repeatability conditions.

4. Conclusions

A method for obtaining RIP by sorption modification of paper with AgNCs obtained by thermolysis of silver cinnamate has been developed. A method for determining iodides using the manufactured RIP in complex multicomponent objects has been proposed, demonstrating good analytical characteristics and convergence with the control method. High sensitivity and selectivity are ensured by combining RIP and dynamic gas extraction. The method allows microquantities of iodides against the background of high chloride and bromide content, including in colored and turbid solutions. Unlike others, the developed method is more economical and fast and allows analysis with minimal preliminary sample preparation, which significantly simplifies determination.

Author Contributions

T.S.K. contributed the conceptualization, project administration, data curation, and writing. M.O.G. and I.E.U. contributed methodology, software validation, and writing—review and editing. V.A.Z. and A.O.Z. contributed conceptualization, methodology, data curation, formal analysis, software development, and writing. V.A.V. contributed the data curation, software development, and writing. All authors have read and agreed to the published version of the manuscript.

Funding

This research was funded by Russian Science Foundation, grant number 22-13-00260-P.

Data Availability Statement

The data presented in this study are available in the article.

Conflicts of Interest

The authors declare no conflicts of interest.

References

  1. Serdar, M.A.; Ispir, E.; Ozgurtas, T.; Gulbahar, O.; Ciraci, Z.; Pasaoglu, H.; Kurt, I. Comparison of four immunoassay analyzers for relationship between thyroid stimulating hormone (TSH) and free thyroxine (FT4). Turk. J. Biochem. 2015, 40, 88–91. [Google Scholar] [CrossRef] [Scilit]
  2. Knobel, M. Etiopathology, clinical features, and treatment of diffuse and multinodular nontoxic goiters. J. Endocrinol. Investig. 2016, 39, 357–373. [Google Scholar] [CrossRef] [Scilit]
  3. Maruthupandi, M.; Chandhru, M.; Rani, S.K.; Vasimalai, N. Highly Selective Detection of Iodide in Biological, Food, and Environmental Samples Using Polymer-Capped Silver Nanoparticles: Preparation of a Paper-Based Testing Kit for On-Site Monitoring. ACS Omega 2019, 4, 11372–11379. [Google Scholar] [CrossRef] [Scilit] [PubMed]
  4. WHO; UNICEF; ICCIDD. Progress Towards the Elimination of Iodine Deficiency Disorders (IDD); WHO Publications: Geneva, Switzerland, 1999; pp. 1–33. [Google Scholar]
  5. Bothra, S.; Kumar, R.; Pati, R.K.; Kuwar, A.; Choi, H.-J.; Sahoo, S.K. Virgin silver nanoparticles as colorimetric nanoprobe for simultaneous detection of iodide and bromide ion in aqueous medium. Spectrochim. Acta Part A 2015, 149, 122–126. [Google Scholar] [CrossRef] [Scilit] [PubMed]
  6. Ellsworth, L.; McCaffery, H.; Harman, E.; Abbott, J.; Gregg, B. Breast milk iodine concentration is associated with infant growth, independent of maternal weight. Nutrients 2020, 12, 358. [Google Scholar] [CrossRef] [Scilit]
  7. Bilal, M.Y.; Dambaeva, S.; Kwak-Kim, J.; Gilman-Sachs, A.; Beaman, K.D. A role for iodide and thyroglobulin in modulating the function of human immune cells. Front. Immunol. 2017, 8, 1573. [Google Scholar] [CrossRef] [Scilit]
  8. García-Figueroa, A.; Pena-Pereira, F.; Lavilla, I.; Bendicho, C. Headspace single-drop microextraction coupled with microvolume fluorospectrometry for highly sensitive determination of bromide. Talanta 2017, 170, 9–14. [Google Scholar] [CrossRef] [Scilit]
  9. Loh, L.J.; Bandara, G.C.; Weber, G.L.; Remcho, V.T. Detection of water contamination from hydraulic fracturing wastewater: A μPAD for bromide analysis in natural waters. Analyst 2015, 140, 5501–5507. [Google Scholar] [CrossRef] [Scilit]
  10. Mutic, J.J.; Nikolic-Mandic, S.D.; Lolic, A.D.; Manojlovic, D.D. Determination of iodide and bromide by flow methods with amperometric detection. J. Anal. Chem. 2008, 63, 907–913. [Google Scholar] [CrossRef] [Scilit]
  11. Malongo, T.K.; Patris, S.; Macours, P.; Cotton, F.; Nsangu, J.; Kauffmann, J.-M. Highly sensitive determination of iodide by ion chromatography with amperometric detection at a silver-based carbon paste electrode. Talanta 2008, 76, 540–547. [Google Scholar] [CrossRef] [Scilit]
  12. Ozaki, H.; Ebihara, M. Determination of trace halogens in rock samples by radiochemical neutron activation analysis coupled with the k0-standardization method. Anal. Chim. Acta 2007, 583, 384–391. [Google Scholar] [CrossRef] [Scilit]
  13. Nakamoto, T.; Oura, Y.; Ebihara, M. Comparative Study of Activation Analyses for the Determination of Trace Halogens in Geological and Cosmochemical Samples. Anal. Sci. 2007, 23, 1113–1119. [Google Scholar] [CrossRef] [Scilit] [PubMed]
  14. Rao, R.R.; Chatt, A. Determination of nanogram amounts of iodine in foods by radiochemical neutron activation analysis. Analyst 1993, 118, 1247–1251. [Google Scholar] [CrossRef] [Scilit] [PubMed]
  15. Yoshida, S.; Muramatsu, Y.; Katou, S.; Sekimoto, H. Determination of the chemical forms of iodine with IC-ICP-MS and its application to environmental samples. J. Radioanal. Nucl. Chem. 2007, 273, 211–214. [Google Scholar] [CrossRef] [Scilit]
  16. Blount, B.C.; Valentin-Blasini, L. Analysis of perchlorate, thiocyanate, nitrate and iodide in human amniotic fluid using ion chromatography and electrospray tandem mass spectrometry. Anal. Chim. Acta 2006, 567, 87–93. [Google Scholar] [CrossRef] [Scilit] [PubMed]
  17. Cataldi, T.R.I.; Rubino, A.; Laviola, M.C.; Ciriello, R. Comparison of silver, gold and modified platinum electrodes for the electrochemical detection of iodide in urine samples following ion chromatography. J. Chromatogr. B 2005, 827, 224–231. [Google Scholar] [CrossRef] [Scilit]
  18. Vtorushina, E.A.; Saprykin, A.I.; Knapp, G. Optimization of the conditions of oxidation vapor generation for determining chlorine, bromine, and iodine in aqueous solutions by inductively coupled plasma atomic-emission spectrometry. J. Anal. Chem. 2008, 63, 643–648. [Google Scholar] [CrossRef] [Scilit]
  19. Shchukin, V.M.; Severinova, E.Y.; Kuz’mina, N.E.; Yashkir, V.A.; Merkulov, V.A. Problems of Iodide Ions Determination in Multivitamins by Inductively Coupled Plasma Atomic-Emission Spectrometry. Vedom. Naučn. Cent. Èkspert. Sreds. Med. Primen. 2018, 8, 128–132. [Google Scholar] [CrossRef] [Scilit]
  20. Takaku, Y.; Shimamura, T.; Masuda, K.; Igarashi, Y. Iodine Determination in Natural and Tap Water Using Inductively Coupled Plasma Mass Spectrometry. Anal. Sci. 1994, 11, 823–827. [Google Scholar] [CrossRef] [Scilit]
  21. Satoh, Y.; Ohtsuka, Y. Comparison of dissolved iodine measurements in seawater between inductively coupled plasma mass spectrometry and voltammetry. Anal. Sci. 2024, 40, 1653–1662. [Google Scholar] [CrossRef] [Scilit]
  22. Devouge-Boyer, C.; Mouda, S.; Gueguen, O.; Marcotte, S. Determination of iodine in polyamide by inductively-coupled plasma/mass spectrometry. Talanta 2018, 189, 568–572. [Google Scholar] [CrossRef] [Scilit]
  23. Oliveira, A.A.; Trevizan, L.C.; Nóbrega, J.A. REVIEW: Iodine Determination by Inductively Coupled Plasma Spectrometry. Appl. Spectrosc. Rev. 2010, 45, 447–473. [Google Scholar] [CrossRef] [Scilit]
  24. Fischer, P.W.; L’Abbe, M.R. Acid Digestion Determination of Iodine in Foods. J. Assoc. Anal. Chem. 1981, 64, 71–74. [Google Scholar] [CrossRef] [Scilit]
  25. Zhou, G.; Zhao, C.; Panb, C.; Li, F. Highly sensitive and selective colorimetric detection of iodide based on anti-aggregation of gold nanoparticles. Anal. Methods 2013, 5, 2188–2192. [Google Scholar] [CrossRef] [Scilit]
  26. Guo, X.; Sturgeon, R.E.; Mester, Z.; Gardner, G.J. Vapor Generation by UV Irradiation for Sample Introduction with Atomic Spectrometry. Anal. Chem. 2004, 76, 2401–2405. [Google Scholar] [CrossRef] [Scilit] [PubMed]
  27. Priyadarshini, E.; Pradhan, N. Gold nanoparticles as efficient sensors in colorimetric detection of toxic metal ions: A review. Sens. Actuators B 2017, 238, 888–902. [Google Scholar] [CrossRef] [Scilit]
  28. Fang, C.; Dharmarajan, R.; Megharaj, M.; Naidu, R. Gold nanoparticle-based optical sensors for selected anionic contaminants. Trends Anal. Chem. 2017, 86, 143–154. [Google Scholar] [CrossRef] [Scilit]
  29. Lim, M.-C.; Kim, Y.-R. Analytical Applications of Nanomaterials in Monitoring Biological and Chemical Contaminants in Food. J. Microbiol. Biotechnol. 2016, 26, 1505–1516. [Google Scholar] [CrossRef] [Scilit]
  30. Nie, G.; Li, G.; Wang, L.; Zhang, X. Nanocomposites of polymer brush and inorganic nanoparticles: Preparation, characterization and application. Polym. Chem. 2016, 7, 753–769. [Google Scholar] [CrossRef] [Scilit]
  31. Abalde-Cela, S.; Carregal-Romero, S.; Paulo Coelho, J.; Guerrero-Martínez, A. Recent progress on colloidal metal nanoparticles as signal enhancers in nanosensing. Adv. Colloid Interface Sci. 2016, 233, 255–270. [Google Scholar] [CrossRef] [Scilit]
  32. Zolotov, Y.A.; Ivanov, V.M.; Amelin, V.G. Chemical Test Methods of Analysis; Editorial URSS: Moscow, Russia, 2006; p. 304. [Google Scholar]
  33. Anisimovich, P.V.; Temerdashev, Z.A.; Pochinok, T.B.; Reshetnyak, E.A.; Smolenskaya, T.S.; Lomakina, O.Y. Visual test determination of Pb(II) using an indicator gelatin film. Anal. Control 2014, 18, 328–337. [Google Scholar]
  34. Anisimovich, P.V.; Temerdashev, Z.A.; Pochinok, T.B.; Reshetnyak, E.A. Immobilization of pyrogallol red gelatin gel and the use of a composite for the determination of total protein. Sorpt. Chromatogr. Process. 2015, 15, 223–233. [Google Scholar]
  35. Gorbunova, M.O.; Bayan, E.M.; Voitsikhovskaya, E.V. A Glucotest for the quality control of food raw materials and products. J. Anal. Chem. 2010, 65, 1198–1202. [Google Scholar] [CrossRef] [Scilit]
  36. Ostrovskaya, V.M.; Sereda, V.V.; Prokopenko, O.A.; Buryak, A.K.; Sergeev, S.M.; Stolyarov, I.P. Indicator tubes for the determination of antiknock additives in motor gasoline. Chem. Technol. Fuels Oils 2013, 5, 49–52. [Google Scholar]
  37. Lupeiko, T.G.; Gorbunova, M.O.; Bayan, E.M. Deep purification of aqueous solutions to remove iron(III) with carbonate-containing industrial waste. Russ. J. Appl. Chem. 2004, 77, 79–82. [Google Scholar] [CrossRef] [Scilit]
  38. Lupeiko, T.G.; Bayan, E.M.; Gorbunova, M.O. Use of carbonate-containing industrial waste for treatment of aqueous solutions to remove nickel(II) ions. Russ. J. Appl. Chem. 2004, 77, 83–87. [Google Scholar] [CrossRef] [Scilit]
  39. Lupeiko, T.G.; Gorbunova, M.O.; Bayan, E.M. Deep purification of aqueous solutions to remove chromium(III) with industrial carbonate-containing wastes. Russ. J. Appl. Chem. 2001, 74, 1698–1701. [Google Scholar] [CrossRef] [Scilit]
  40. Apyari, V.V.; Furletov, A.A.; Garshev, A.V.; Volkov, P.A.; Gorbunova, M.O.; Shevchenko, A.V. Preparation of reagent indicator papers with silver triangular nanoplates for chemical analysis. Mosc. Univ. Chem. Bull. 2017, 72, 167–173. [Google Scholar] [CrossRef] [Scilit]
  41. Gorbunova, M.O.; Bayan, E.M. A rapid field test method for the determination of hydrogen sulfide and sulfides in waters with gas preextraction. J. Anal. Chem. 2017, 72, 1263–1269. [Google Scholar] [CrossRef] [Scilit]
  42. Gorbunova, M.O.; Bayan, E.M.; Shevchenko, A.V.; Kulyaginova, M.S. Digital colorimetric determination of chlorides in water using gas extraction and methyl orange. Anal. I Kontrol. 2017, 21, 274–280. [Google Scholar] [CrossRef] [Scilit]
  43. Gorbunova, M.O.; Baulina, A.A.; Kulyaginova, M.S.; Apyari, V.V.; Furletov, A.A.; Volkov, P.A.; Bochenkov, V.E.; Starukhin, A.S.; Dmitrienko, S.G. Dynamic gas extraction of iodine in combination with a silver triangular nanoplate-modified paper strip for colorimetric determination of iodine and of iodine-interacting compounds. Microchim. Acta 2019, 186, 188. [Google Scholar] [CrossRef] [Scilit]
  44. Gorbunova, M.O.; Apyari, V.V.; Baulina, A.A.; Garshina, M.S.; Kulyaginova, M.S.; Shevchenko, A.V.; Furletov, A.A.; Dmitrienko, S.G.; Zolotov, Y.A. An improved step-by-step airflow/paper-based colorimetric method for highly selective determination of halides in complex matrices. Talanta 2020, 219, 121254. [Google Scholar] [CrossRef] [Scilit]
  45. Gorbunova, M.O.; Garshina, M.S.; Kulyaginova, M.S.; Apyari, V.V.; Furletov, A.A.; Garshev, A.V.; Dmitrienko, S.G.; Zolotov, Y.A. A dynamic gas extraction-assisted paper-based method for colorimetric determination of bromides. Anal. Methods 2020, 12, 587–594. [Google Scholar] [CrossRef] [Scilit]
  46. Gorbunova, M.O.; Bayan, E.M. A novel paper-based sensor for determination of halogens and halides by dynamic gas extraction. Talanta 2019, 199, 513–521. [Google Scholar] [CrossRef] [Scilit]
  47. Apyari, V.V.; Gorbunova, M.O.; Shevchenko, A.V.; Furletov, A.A.; Volkov, P.A.; Garshev, A.V.; Dmitrienko, S.G.; Zolotov, Y.A. Towards highly selective detection using metal nanoparticles: A case of silver triangular nanoplates and chlorine. Talanta 2018, 176, 406–411. [Google Scholar] [CrossRef] [Scilit] [PubMed]
  48. Gorbunova, M.O.; Shevchenko, A.V.; Apyari, V.V.; Furletov, A.A.; Volkov, P.A.; Garshev, A.V.; Dmitrienko, S.G. Selective determination of chloride ions using silver triangular nanoplates and dynamic gas extraction. Sens. Actuators B 2018, 256, 699–705. [Google Scholar] [CrossRef] [Scilit]
  49. Kolesnikova, T.S.; Zarubina, A.O.; Gorbunova, M.O.; Zhinzhilo, V.A.; Dzhardimalieva, G.I.; Uflyand, I.E. Silver Itaconate as Single-Source Precursor of Nanocomposites for the Analysis of Chloride Ions. Materials 2022, 15, 8376. [Google Scholar] [CrossRef] [Scilit] [PubMed]
  50. Uflyand, I.E.; Gorbunova, M.O.; Zhinzhilo, V.A.; Kolesnikova, T.S.; Zarubina, A.O.; Baimuratova, R.K.; Dzhardimalieva, G.I. Preparation of Ag/C Nanocomposites Based on Silver Maleate and Their Use for the Analysis of Iodine Ions. J. Compos. Sci. 2022, 6, 384. [Google Scholar] [CrossRef] [Scilit]
  51. Jenkins, R.; Snyder, R.L. Chemical Analysis: Introduction to X-Ray Powder Diffractometry; Wiley: Weinheim, Germany, 1996. [Google Scholar]
  52. Martínez-Castañón, G.; Niño-Martínez, N.; Loyola-Rodríguez, J.; Patiño-Marín, N.; Martínez-Mendoza, J.; Ruiz, F. Synthesis of silver particles with different sizes and morphologies. Mater. Lett. 2009, 63, 1266–1268. [Google Scholar] [CrossRef] [Scilit]
  53. Kremling, K. Determinations of the major constituents. In Methods of Seawater Analysis; Grasshoff, K., Kremling, K., Ehrhardt, M., Eds.; Wiley: Weinheim, NY, USA, 1999. [Google Scholar]
  54. GOST 13685-84; Common Salt. Test methods. Standartinform: Moscow, Russia, 2010.
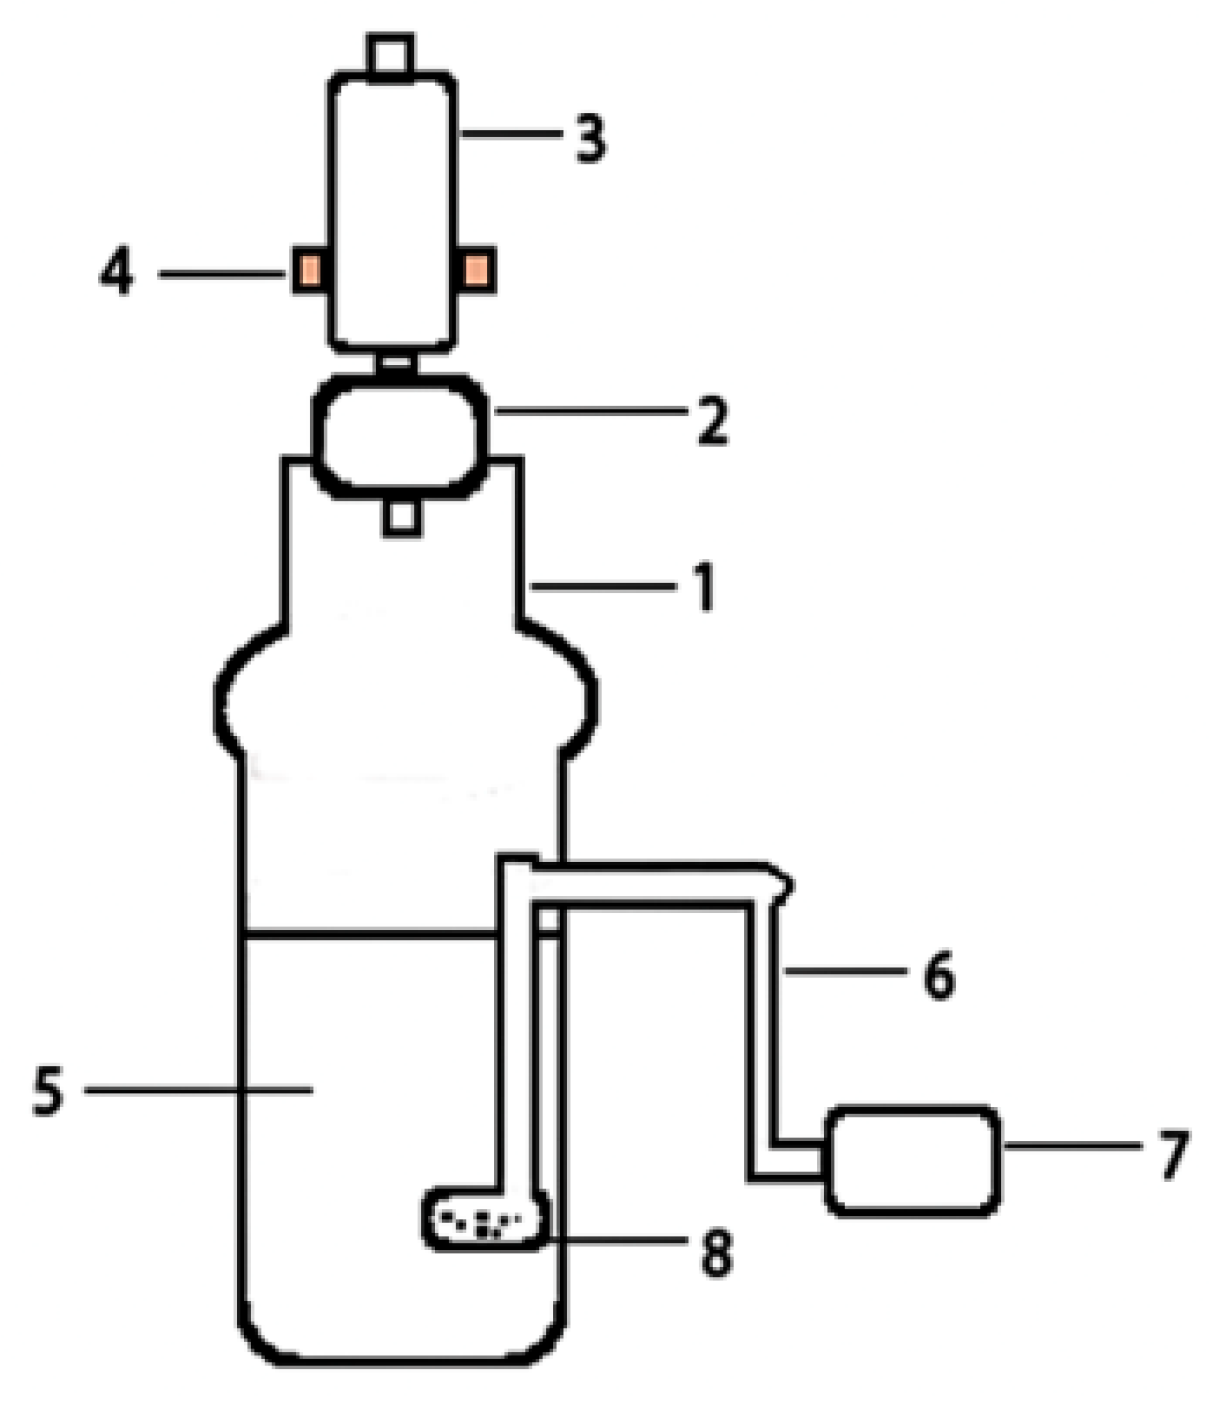
Figure 1. The setup for processing dynamic gas extraction: 1—reaction glass vessel; 2—rubber stopper; 3—test strip holder; 4—RIP strip; 5—reaction mixture; 6—polymer hose; 7—air microcompressor; 8—glass bubbler.
Analytica 07 00037 g001
Figure 2. IR spectrum of silver cinnamate.
Analytica 07 00037 g002
Figure 3. XRD spectrum of silver cinnamate.
Analytica 07 00037 g003
Figure 4. Thermal behavior of silver cinnamate: (A) DSC curve, (B) differential thermal and thermogravimetric analysis curve.
Analytica 07 00037 g004aAnalytica 07 00037 g004b
Figure 5. Diffraction pattern of the thermolysis product (400 °C, self-generated atmosphere) of silver cinnamate with map No.4-783.
Analytica 07 00037 g005
Figure 6. SEM image of the thermolysis product of silver cinnamate in a self-generated atmosphere (a) and EDX data (b,c).
Analytica 07 00037 g006
Figure 7. TEM image of the thermolysis product of silver cinnamate.
Analytica 07 00037 g007
Figure 8. SEM images of the thermolysis product of silver cinnamate before (a) and after (b) iodine treatment.
Analytica 07 00037 g008
Figure 9. EDX spectra and EDX data of the thermolysis product of silver cinnamate before (a,c) and after (b,d) treatment with iodine.
Analytica 07 00037 g009
Figure 10. Absorption spectrum of a dispersed system formed by AgNCs.
Analytica 07 00037 g010
Figure 11. Scheme of iodide determination by dynamic gas extraction method.
Analytica 07 00037 g011
Figure 12. XRD pattern of the test strip reaction zone before (b) and after (a) interaction with iodine.
Analytica 07 00037 g012
Figure 13. Comparison of paper types for RIP samples prepared by single dripping.
Analytica 07 00037 g013
Figure 14. Diffuse reflectance spectra of samples 1F and 1R before (a) and after (b) interaction with iodine.
Analytica 07 00037 g014
Figure 15. Diffuse reflectance spectra of samples 2F and 2R before (a) and after (b) interaction with iodine.
Analytica 07 00037 g015
Figure 16. Diffuse reflectance spectra of samples 3F and 3R before (a) and after (b) interaction with iodine.
Analytica 07 00037 g016
Figure 17. Diffuse reflectance spectra of samples 4F and 4R before (a) and after (b) interaction with iodine.
Analytica 07 00037 g017
Figure 18. Diffuse reflectance spectra of samples 7F and 7R before (a) and after (b) interaction with iodine.
Analytica 07 00037 g018
Figure 19. Diffuse reflectance spectra of samples 8F and 8R before (a) and after (b) interaction with iodine.
Analytica 07 00037 g019
Figure 20. Comparison of RIP manufacturing methods using type A paper as an example.
Analytica 07 00037 g020
Figure 21. Effect of AgNCs on the sensitivity of test strips to iodine.
Analytica 07 00037 g021
Figure 22. Diffuse reflectance spectra of the reaction zone of test strips after interaction with iodine extracted by gas extraction from iodide solutions (1—0.00; 2—0.03; 3—0.05; 4—0.10; 5—0.20; 6—0.40; 7—0.80; 8—1.60 mg L−1).
Analytica 07 00037 g022
Figure 23. Calibration graph: exponential (A) and linear (B) dependences.
Analytica 07 00037 g023
Table 1. Comparative characteristics of methods for determining iodides.
Method of AnalysisLowest Limit of Detection (LOD)Range of Determined ConcentrationsRef.
Neutron activation5 ng/sample (at a concentration of 10 μg/100 g)[14]
Voltammetry0.127 μg/L1–500 μg/L[10]
Ion chromatography0.120 μg/kg0.21–172 μg/kg[15]
Fluorimetry0.3 μg/L1–50 μg/L
Inductively coupled plasma mass spectroscopy ISP-MS0.1 μg/kg0.1–1000 μg/kg[20,21,22,23]
Inductively coupled plasma emission optical spectrometry1.6 mg/L1.6–80 mg/L[18]
Photometric (modification of the Kolthoff–Sandell method)0.14 μg/L30–300 μg/L[24]
Visual colorimetric determination using a polyacrylate matrix0.4 mg/L0.4–3.6 mg/L
Nanoparticle-based colorimetric
Gold nanoparticles0.16 μg0.4–400 μg[24]
Silver nanoparticles0.76 μg/L1.27–31.7 μg/L[25]
Table 2. Elemental composition of the thermolysis product according to EDX data.
ElementWeight, %Weight, % Sigma
C12.430.93
Ag87.571.67
Total100
Table 3. Elemental analysis of the thermolysis product of silver cinnamate before and after treatment with iodine according to EDX data.
ElementBefore Treatment with IodineAfter Treatment with Iodine
Weight, %Weight, % SigmaWeight, %Weight, % Sigma
C9.360.77.850.86
Ag90.640.3359.981.53
I9.161.38
Totals100 99.99
Table 4. Types of papers and their characteristics.
DesignationPaper TypeManufacturerCharacteristics
A595Whatman (Cytiva, Little Chalfont, Buckinghamshire, UK)Density 68 g m−2, thickness 0.15 mm, pore diameter 4–7 µm.
B597Density 85 g m−2, thickness 0.18 mm, pore diameter 4–7 µm
C598-ADensity 75 g m−2, thickness 0.19 mm, pore diameter 5–7 µm
DFN 18Filtrak (Spezialpapierfabrik Niederschlag, Germany)Density 280 g m−2, thickness 0.40 mm, pore diameter 7–11 µm
Table 5. RIP samples.
SamplePaper TypeModification MethodDrying MethodConcentration (μg mL−1)/Aliquot (mL) of AgNC SolutionProcessing FrequencyNanoparticle Content, mg g−1
1Adrippingh45.95/0.1310.012
2Bdrippingh10.012
3Cdrippingh10.012
4Ddrippingh10.012
5Adrippingh20.024
6Adrippingh30.024
7Aimpregnationh45.95/1.510.207
8Aimpregnationv10.207
9Aimpregnationh20.414
10Aimpregnationh30.621
11Aimpregnationh40.828
Table 6. Color coordinates of the reaction zone for the standard series.
C(I), mg L−10.00.030.050.10.20.40.81.6
Analytica 07 00037 i001Analytica 07 00037 i002Analytica 07 00037 i003Analytica 07 00037 i004Analytica 07 00037 i005Analytica 07 00037 i006Analytica 07 00037 i007Analytica 07 00037 i008
R111124130141156174196206
G102110116130144161179185
B95104111125146156164169
Table 7. Coefficients of exponential equations of color coordinates.
Red Coordinate (R)Green Coordinate (G)Blue Coordinate (B)
y0115 ± 2103 ± 294 ± 2
A90 ± 481 ± 272 ± 3
t0.34 ± 0.030.29 ± 0.020.17 ± 0.02
A/t265279424
R20.99000.99470.9917
Table 8. Determination of iodide ions in the presence of some common inorganic ions.
Added I,
mg L−1
IonFound I,
mg L−1
Relative Error, %Lower Limit of Tolerance (mol/mol)Lower Limit of Tolerance (w/w)
0Each ion<LOD--
0.100Na+0.101+12.6 × 1064.6 × 105
K+0.102+21.3 × 1063.9 × 105
Mg+20.099−11.3 × 1062.4 × 105
Ca+20.095−51.3 × 1064.0 × 105
Sr+20.102+21.3 × 1068.8 × 105
Ba+20.101+11.3 × 1061.4 × 106
Mn+20.098−21.3 × 1062.4 × 105
Zn+20.099−11.3 × 1066.5 × 105
NH4+0.102+21.3 × 1061.8 × 105
Fe+30.101+11.3 × 1065.6 × 105
NO30.095−52.6 × 1061.2 × 106
HPO4−20.102+21.3 × 1069.7 × 105
H2PO40.102+21.3 × 1069.6 × 105
SO4−20.099−12.6 × 1061.9 × 106
C2O4−20.098−21.3 × 1068.8 × 105
Table 9. Determination of iodides in a sea water sample (n = 3; p = 0.95; Ftheor = 19.2; t = 4.3).
SampleAdded I,
mg L−1
Found (mg L−1) byFexpRecovery (%)
Proposed MethodControl Method
Xav ± δRSD (%)Xav ± δRSD (%)
1-0.045 ± 0.0043.60.043 ± 0.0032.81.8104.7
0.030.071 ± 0.0052.80.073 ± 0.0073.82.097.2
2-0.049 ± 0.0043.30.051 ± 0.0053.91.696.1
0.050.101 ± 0.0083.20.098 ± 0.0072.91.3103.1
3-0.050 ± 0.0054.00.048 ± 0.0065.01.4104.2
0.100.153 ± 0.0123.10.157 ± 0.0092.31.897.5
Table 10. Determination of iodides in pharmaceutical preparations (n = 3; p = 0.95; Ftheor = 19.2; t = 4.3).
A Drug/
Substance/
Manufacturer
Concomitant SubstancesFound (mg) byFexpRecovery (%)
Proposed MethodControl Method *
Xav ± δRSD (%)Xav ± δRSD (%)
“Suxamethonium iodide”/
Suxamethonium iodide, 20 mg L−1 C14H30I2N2O4/
JSC “Novosibkhim-pharm”, Russia
sodium chloride, disodium edetate, ascorbic acid, hydrochloric acid 0.1 M solution, water for injection20.1 ± 1.32.619.6 ± 1.73.51.7102.6
“Metacin”/Metocinium iodide, 2 mg
C19H24INO3/Pharmacor Production LLC, Russia
lactose mono-hydrate, pregela-tinized starch, magnesium stearate1.96 ± 0.051.02.01 ± 0.081.62.697.5
“Microiodide 200”/
Potassium iodide, 0.262 mg, KI/
JSC Tatkhim-pharmpreparaty, Russia
lactose mono-hydrate, sucrose, colloidal silicon dioxide, calcium stearate0.259 ± 0.0192.90.268 ± 0.0162.41.596.6
Complivit Active chewing/Potassium iodide, 0.05 mg, KI/
JSC Pharmstandard-UfaVITA, Russia
α-tocopherol acetate,
ascorbic acid, calcium (as phosphate dihydrate),
calcium pantothenate,
cholecalciferol,
magnesium (as oxide), nicotinamide
pyridoxine hydrochloride, retinol acetate, riboflavin, thiamine hydrochloride, folic acid, cyanocobalamin, binders, flavors, colors
0.051 ± 0.0053.90.049 ± 0.0043.31.6104.1
* potentiometric titration.
Table 11. Determination of iodides in foods (n = 3; p = 0.95; Ftheor = 19.2; t = 4.3).
ProductFound (mg kg−1) byFexpRecovery (%)
Proposed MethodControl Method
Xav ± δRSD (%)Xav ± δRSD (%)
Sea bass1.60 ± 0.112.81.51 ± 0.123.21.31105.9
Cod1.53 ± 0.133.41.46 ± 0.113.01.4104.8
Squid2.74 ± 0.172.52.88 ± 0.192.61.395.1
Beans **0.28 ± 0.034.30.26 ± 0.046.21.8107.7
Champignon mushrooms **0.24 ± 0.034.90.25 ± 0.046.41.7897.6
** Determined with the additive (results are given after subtracting the additive).
Disclaimer/Publisher’s Note: The statements, opinions and data contained in all publications are solely those of the individual author(s) and contributor(s) and not of MDPI and/or the editor(s). MDPI and/or the editor(s) disclaim responsibility for any injury to people or property resulting from any ideas, methods, instructions or products referred to in the content.