Review

Secondary Electrospray Ionization Mass Spectrometry for Volatile Analysis: Current Challenges and Emerging Solutions


by
Diego García-Gómez
,
Ana Ballester-Caudet
and
María Esther Fernández Laespada
*
Departamento de Química Analítica, Nutrición y Bromatología, Facultad de Ciencias Químicas, Universidad de Salamanca, 37008 Salamanca, Spain
*
Author to whom correspondence should be addressed.
Analytica 2026, 7(2), 27; https://doi.org/10.3390/analytica7020027
Submission received: 24 February 2026 / Revised: 26 March 2026 / Accepted: 30 March 2026 / Published: 1 April 2026

Abstract

Secondary electrospray ionization mass spectrometry (SESI-MS) has emerged as a powerful technique for the real-time, non-invasive analysis of volatile organic compounds (VOCs) in complex matrices, such as exhaled breath and microbial volatilomes. However, its transition to routine application is hindered by significant challenges in absolute quantification, unambiguous identification, and standardization. This review provides a comprehensive overview of these limitations and the emerging solutions proposed to overcome them. Matrix effects, including gas-phase ion suppression and C-trap competition, are examined alongside mitigation strategies such as spectral stitching and standard addition. To enhance quantification stability, advanced standard delivery systems and dynamic quality control protocols are evaluated. The identification bottleneck—stemming from the absence of chromatographic separation—is addressed through the use of curated databases and advanced fragmentation techniques, such as incremental quadrupole acquisition to resolve overlapping spectra (IQAROS), to resolve isobaric interferences. Furthermore, the role of chemometrics in extracting biological fingerprints is discussed. Finally, the need for harmonized reporting standards and multicenter validation is emphasized to ensure cross-study reproducibility. Resolving these methodological gaps is essential for the clinical and industrial translation of SESI-MS.

1. Introduction

Ambient ionization mass spectrometry (AIMS) comprises a group of techniques designed for the direct analysis of samples under ambient conditions, that is, outside the vacuum system of the mass spectrometer [1,2]. In this context, “ambient ionization” refers to a process in which sample preparation takes place in real time, in close proximity to the ionization step and during the analytical measurement itself. This configuration enables ion generation without the need for prior sample pretreatment, representing a significant advancement over conventional analytical methods.
The immediacy and simplicity of the analytical process represent the principal distinguishing advantages of AIMS compared with other direct mass spectrometry approaches, which commonly require preliminary steps involving sample conditioning and manipulation prior to analysis [3]. The ionization techniques most commonly employed in AIMS are those based on atmospheric ionization, with atmospheric pressure chemical ionization (APCI) and electrospray ionization (ESI) being the most widely used. The latter, developed by Fenn’s research group, demonstrated in the late 1980s its capability to ionize large molecules and generate gas-phase ions, while also achieving high sensitivity for analytical applications [4,5].
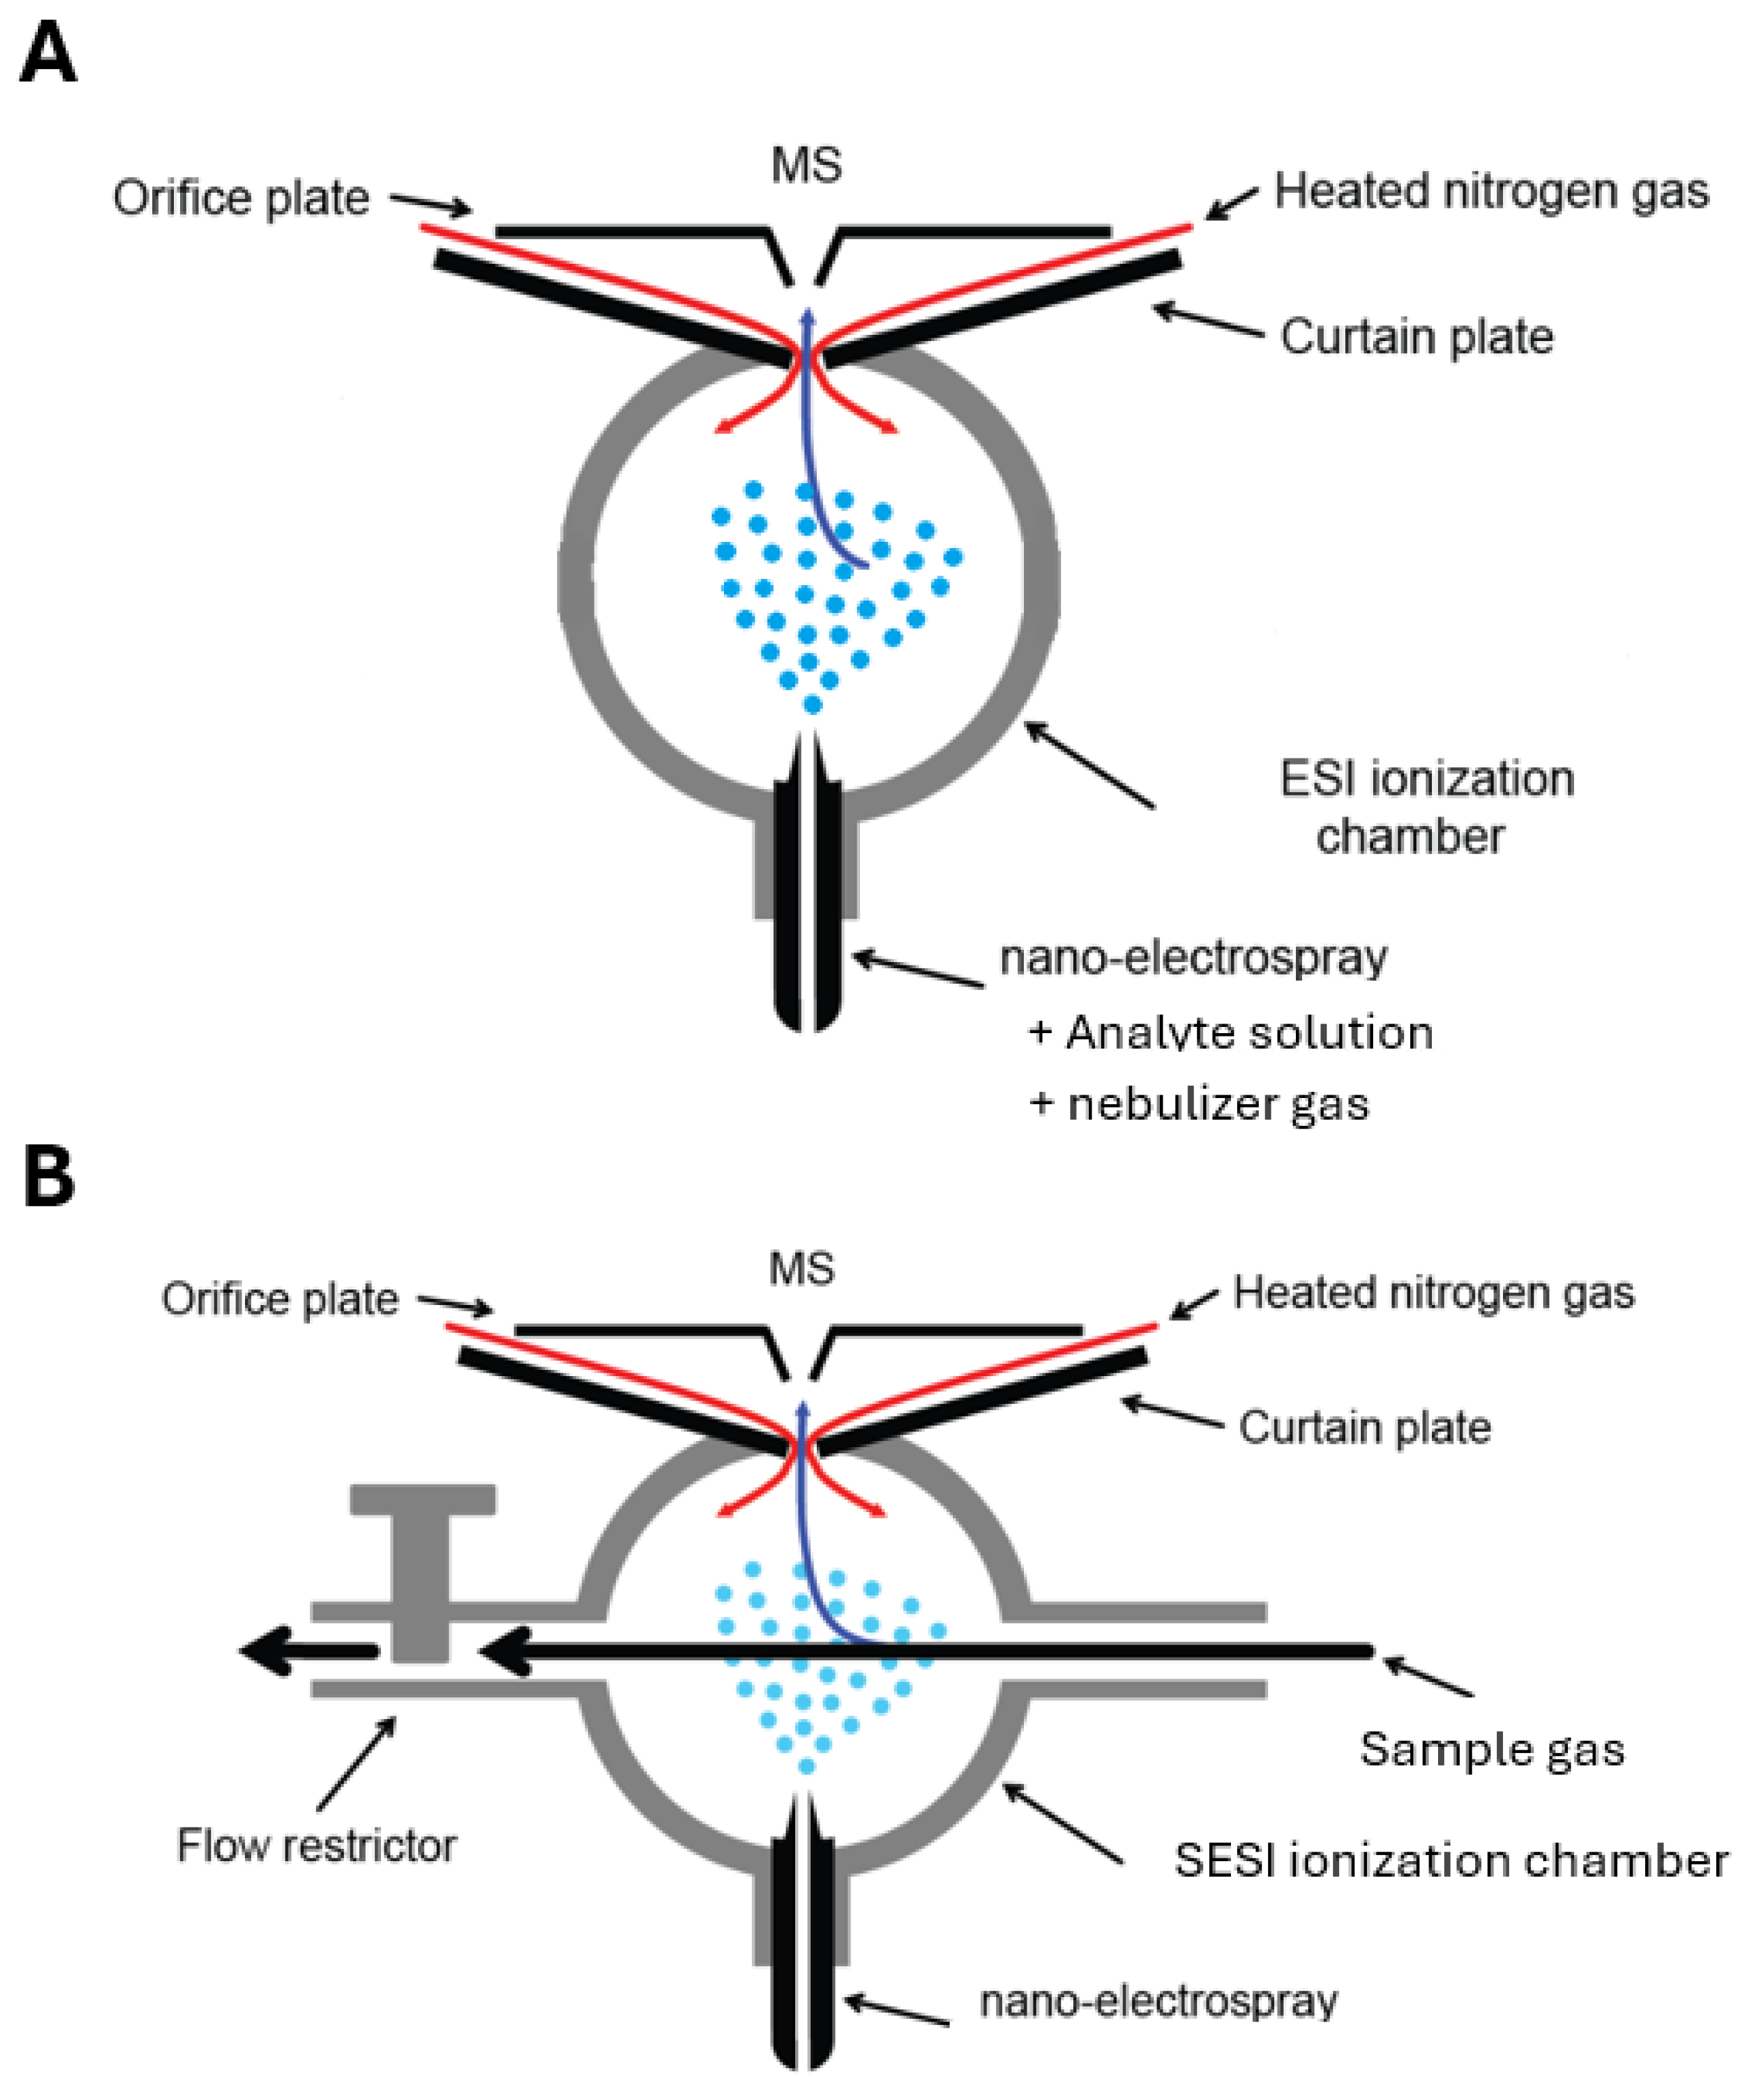
Electrospray ionization (ESI) is based on the formation of a charged microdroplet aerosol from a solution subjected to a strong electric field, in which progressive desolvation and successive droplet fissions ultimately lead to the generation of gas-phase ions [4,5]. In classical ESI, the analyte of interest is dissolved in the liquid solvent prior to ionization; thus, the analyte is present in the liquid phase and becomes ionized during the electrospray process. In contrast, in secondary electrospray ionization (SESI)—a concept first introduced by Hill et al. in 1999 [6]—the electrospray serves primarily to generate reagent ions from the solvent, and the analyte itself is not present in the spray liquid. Instead, neutral analyte molecules in the gas phase are introduced into the electrospray plume, where they undergo ion–molecule reactions with the reagent ions produced by the spray to achieve ionization. While SESI shares fundamental ionization principles with other atmospheric pressure ionization (API) sources, its operational niche is distinct. To facilitate a better understanding for the reader, Table 1 summarizes the key differences between SESI, ESI, and APCI, highlighting their respective advantages, molecular weight (MW) ranges, and polarity preferences. Figure 1 provides a simplified illustration of ESI and SESI ionization techniques.
In the vast majority of cases, SESI has been coupled with a mass detector for the separation and detection of the generated ions [7]. Depending on the intended application and the specific needs of the end user, SESI can be coupled with either low-resolution instruments such as in quadrupole mass spectrometry (QMS) [8,9] or high-resolution instruments. However, high-resolution mass spectrometry (HRMS) provides greater mass precision and resolving power than QMS and has been used in a much larger number of applications. When using HRMS analyzers, such as Orbitrap or quadrupole time of flight (QTOF), the instrument first performs a full scan (MS1) to detect all the ions present and then fragments the most abundant ones or those previously selected in order to record their MS/MS spectra. This enables more accurate identification of molecular ions and their isotopic patterns—an advantage that is especially valuable in non-targeted research.
The speed, simplicity, and ability to detect analytes in complex matrices position SESI as a valuable tool across a wide range of analytical applications, including the analysis of volatile compounds related to security [10,11], the study of exhaled breath in clinical settings [12,13], quality control in the food industry [14,15], or studies on volatile organic compounds (VOCs) emitted by microorganisms [16]. SESI-MS allows for the analysis of samples in real time and non-invasively and has been shown to detect compounds of low volatility with molecular masses as high as 900 Da present in the samples at very low concentrations, as well as very polar compounds [17]. However, the examples documented in the literature predominantly involve lower-mass metabolites and volatile species. Therefore, the upper mass limit often quoted for SESI reflects the technical capabilities of the source–analyzer combination rather than a large body of routinely demonstrated applications at or above 200 Da.
Valuable review articles have been published on these SESI-MS analytical applications across various fields [7] and particularly on breath analysis [18,19]. SESI-MS has also been incorporated into broader literature surveys on mass spectrometric analysis of exhaled breath, as a prominent direct-ionization technique [20].
Furthermore, a landmark review by Liao et al. [21] has recently consolidated the mechanistic understanding of SESI, bridging the gap between its historical evolution and current instrumental advances. This work is pivotal for the field as it provides a comprehensive theoretical framework for the ionization process in both SESI and EESI (extractive electrospray ionization). It identifies critical factors governing ionization efficiency—such as analyte proton affinity, dipole moment, and source parameters like temperature and flow rate—offering a roadmap to overcome current limitations in sensitivity and background noise for trace gas analysis.
However, a critical assessment of the existing literature reveals a significant gap: most reviews prioritize either broad application surveys or the physical principles of the ion source, often overlooking the practical methodological hurdles that hinder the transition of SESI-MS to routine clinical or industrial use. Specifically, there is a lack of a focused synthesis addressing the triad of challenges related to absolute quantification, unambiguous compound identification in the absence of chromatography, and the development of harmonized standardization protocols.
The present work aims to address these limitations by providing a comprehensive overview of the current challenges and, more importantly, the emerging solutions proposed to overcome them. By evaluating strategies such as spectral stitching to mitigate ion competition, advanced fragmentation techniques like incremental quadrupole acquisition to resolve overlapping spectra (IQAROS) for resolving isobaric interferences, and the implementation of multicenter quality control protocols, this review provides a roadmap for ensuring the reproducibility and reliability required for the successful translation of SESI-MS.
Prior to this, a brief overview is provided of the possible ionization mechanisms in SESI, the evolution of the instrumentation, and the types of signals obtained with the technique.

2. Ionization Mechanism, Instrument Evolution and Characteristic SESI-MS Signals

2.1. Ionization Mechanism

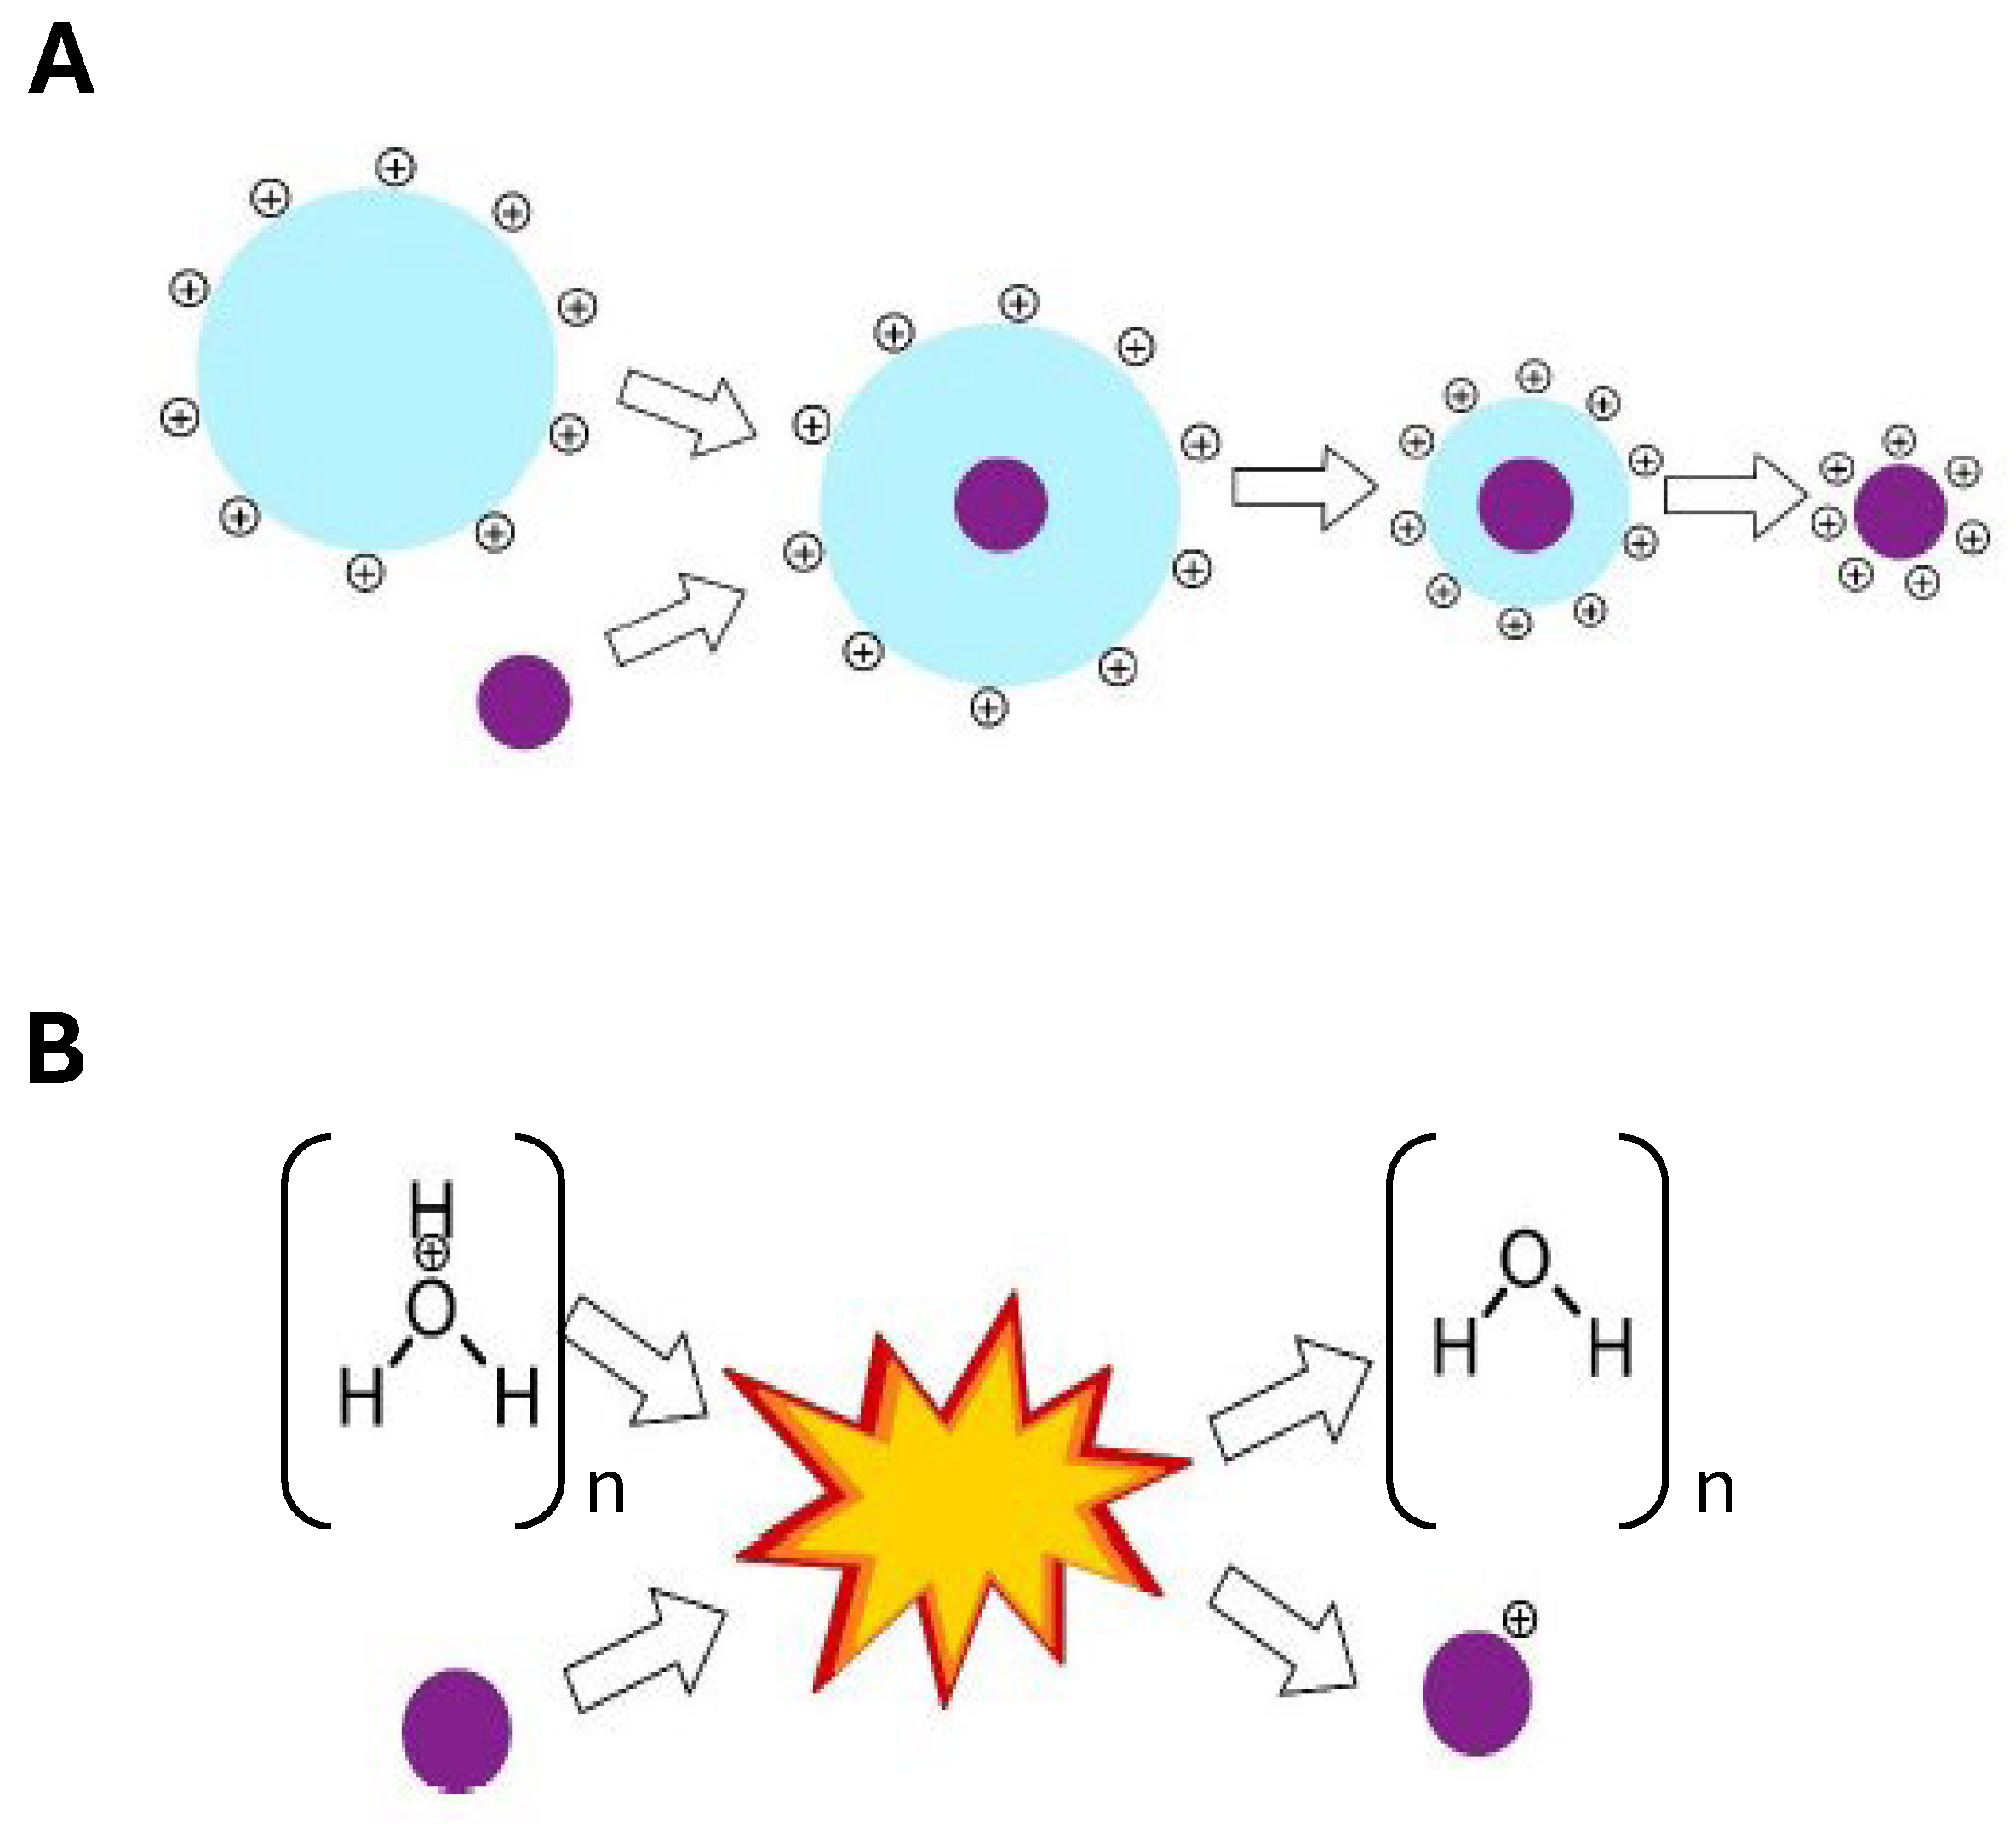
The mechanism by which electrosprays of pure solvents, such as water, induce the ionization of gas-phase molecules remains largely unknown. The main debate concerns the nature of the charging agent, that is, how the vapor becomes charged. As displayed in Figure 2, two mechanisms have been proposed [22].
  • A vapor–droplet interaction occurs, in which analytes dissolve into charged droplets and are subsequently released as ions as the droplet evaporates. In this case, the mechanism is analogous to ESI.
  • A gas-phase ion–molecule reaction takes place, in which ionized water clusters collide with analyte molecules and transfer their charge in an almost instantaneous process, similar to APCI.
Under typical source conditions employed in modern SESI sources, with temperatures close to the boiling point of the electrospray solvent, ionization has been demonstrated to proceed predominantly via the second mechanism [22].
Table 2 provides common values for the different parameters involved in the SESI process.

2.2. Evolution of the Instrumentation

SESI instrumentation in the late 1990s was largely laboratory-built: Hill’s group at Washington State University devised a SESI source for ion-mobility spectrometry/mass spectrometry (IMS-MS), demonstrating high ionization efficiency for small volatiles and outlining performance figures for illicit drug detection [6]. In the 2000s, the Yale University laboratory led by Fernández de la Mora engineered SESI interfaces for commercial MS platforms and quantified limits of detection and charging efficiencies for explosive vapors at sub-parts-per-trillion levels, thereby defining practical sensitivity and transmission constraints [11]. Contemporaneously, ETH Zurich (Zenobi’s group in close collaboration with Sinues’s group) developed low-flow SESI sources and applied them to real-time breath analysis, establishing volatilomics as a viable analytical domain and catalyzing clinical applications [29].
Commercialization followed these academic prototypes. SEADM (Valladolid, Spain) released low-flow SESI modules (LFSESI/D-LFSESI) and Differential Mobility Analyzer (DMA)-coupled variants, reporting improved sensitivity and explicitly targeting low-volatility analytes and explosive trace detection [30]. Fossil Ion Tech (FIT) (Madrid, Spain) introduced the Super SESI family for Orbitrap systems, emphasizing high-temperature vapor handling, automated cleaning, and stable nanoelectrospray for real-time metabolomics; product rollout was started in 2016 with deployments across clinical and research laboratories [31]. More recently, supply has also emerged from China: the Helius-3000, a SESI source commercialized through local distributors, with A-HealthX (Dongguan, China) among the developers. Beyond sources, integrators such as Deep Breath Intelligence (Rotkreuz, Switzerland) now package SESI-HRMS platforms for decentralized clinical use, reflecting the maturation of the SESI ecosystem [32].

2.3. Characteristic SESI-MS Signals

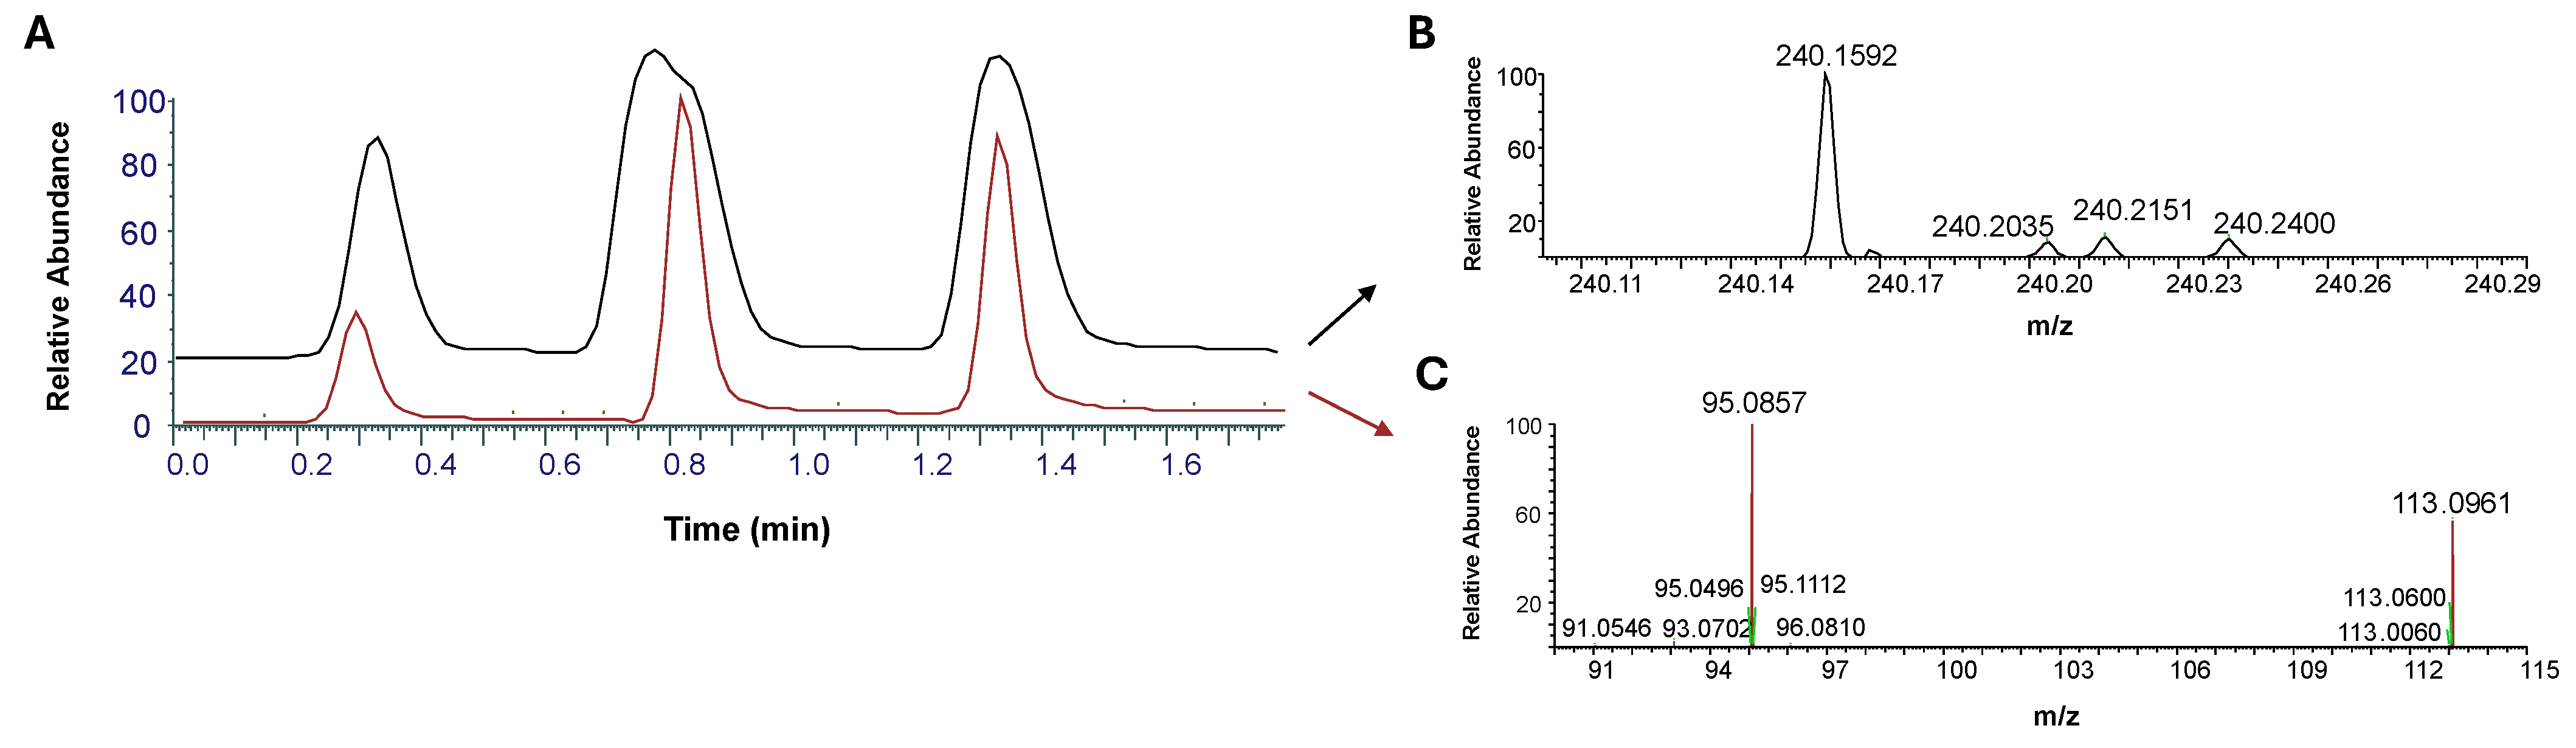
The principal analytical output in SESI MS is the full-scan mass spectrum, representing a comprehensive snapshot of ions detected across a range of m/z values. These spectra typically contain hundreds of peaks, representing various sample-derived analytes or ambient background signals. Ionization occurs via proton transfer or adduct formation, typically yielding [M + H]+ or [M + NH4]+ species in positive mode, and [M − H] or adducts such as [M + HCOO] in negative mode. While many applications focus on positive ionization for detecting basic compounds, negative SESI is equally robust and widely employed for the analysis of organic acids, fatty acids, and other electronegative species. The absence of chromatographic separation means that all ion signals appear simultaneously, producing characteristic mass spectral patterns that serve as chemical fingerprints for the sample. Additionally, online MS/MS experiments on selected features corresponding to specific compounds are typically performed for further confirmation. As an example, Figure 3 illustrates real-time SESI time traces for salbutamol, along with an MS1 spectrum excerpt, and with the MS/MS spectrum for molecular ions of salbutamol at m/z 240.

3. SESI Challenges

3.1. Quantification

SESI-MS analysis requires relative quantification because its ionization mechanism is not yet fully understood. Quantifying analytes is still challenging, yet feasible with calibration curves prepared for specific MS analytes; in this regard, two main methods have been used to generate gas standards of known concentrations. The former [33,34] involves the use of certified gas mixtures from commercial cylinders, which are subsequently diluted using high-precision mass flow controllers and high-purity carrier gases (e.g., nitrogen or synthetic air). The latter [35,36] relies on evaporation-based systems, where liquid standards are vaporized into a continuous carrier gas stream. This approach offers greater flexibility for generating custom multicomponent mixtures, particularly for semi-volatile or polar compounds not commercially available as compressed gases. Furthermore, sensitivities in SESI-MS vary significantly across different classes of VOCs, which represents a major hurdle for universal quantification. This variation is fundamentally driven by the analyte’s physicochemical properties; specifically, molecules with higher proton affinities and larger dipole moments exhibit much higher ionization efficiencies and, consequently, higher sensitivities when interacting with the reagent ions in the electrospray plume [23]. This class-dependent response implies that signal intensities cannot be directly compared across different chemical families without specific calibration, necessitating the use of internal standards or detailed calibration curves for each target compound to achieve accurate results.

3.1.1. Matrix Effect/Ion Suppression

Accurate quantification in SESI-MS faces significant challenges arising from matrix effects, generally found in classical ESI methods [37], which are further exacerbated by the nature of the technique (direct gas-phase ionization without chromatographic separation). Several recent studies have confirmed that ion suppression—i.e., the reduction in ionization efficiency of certain compounds due to the presence of others in the gas phase—can significantly impact sensitivity, reproducibility, and the reliability of the results. In this sense, Wüthrich et al. [38] evaluated the suppression capability of acetone, deuterated acetone, deuterated acetic acid, and pyridine, performing different experiments in which the level of one compound was increased against the others. The results indicated that ion suppression was predominantly governed by gas-phase processes, with pyridine showing the strongest suppressive influence, likely associated with its high gas-phase basicity. Additionally, the ion suppression effect of acetone on exhaled breath was assessed using deuterated acetone and exhaled breath condensate. When the gas-phase levels of D6-acetone increased to 10 ppm, the intensity of volatile components in the condensate decreased by approximately 50%. To mitigate this, Wüthrich et al. implemented strategies such as operating under humid conditions by humidifying the carrier gas flow, which achieved an approximately 30% reduction in ion suppression, albeit with a potential compromise in sensitivity depending on the compounds. An alternative strategy involved diluting the sample with an additional gas flow; however, this also entails a trade-off with sensitivity, as a 100-fold dilution was required for breath samples containing more than 1 ppm of acetone to limit the signal reduction to 20%.
The application of the standard addition method, routinely employed in quantitative analyses to address matrix effects, has also been assessed in SESI-HRMS for online breath analysis [39]. For this purpose, the authors employed a system previously reported for analysis of volatile short-chain fatty acids, from C2 to C6 [35]. Gas standards were produced in six temperature-controlled evaporation chambers, where aqueous stock solutions of the analytes establish a liquid–gas equilibrium described by Henry’s law. To evaluate this methodology, a controlled addition of pyridine and butyric acid (from 7 to 300 ppb) into the exhaled breath of three volunteers was performed. Although variability in slopes was observed both within and across individuals, the resulting concentrations remained within the same order of magnitude. Interestingly, the study noted that normalizing the signals with internal standards (D5-pyridine and D7-butyric acid) added at a constant concentration actually worsened the linearity of the calibration curves. Furthermore, in relation to ion suppression, the same authors assayed a breath dilution approach to examine intensity changes. They found that certain feature intensities peaked upon dilution, a phenomenon attributed to signal enhancement for less basic compounds as the concentration of more basic, suppressive compounds was reduced.

3.1.2. Matrix Effect/Ion Competition

In addition to ion suppression, Zenobi et al. [40] found that when the mass spectrometer coupled to SESI is an Orbitrap, real-time monitoring of matrix-heavy samples (specifically human breath and bacterial culture headspace) also produced an ion competition phenomenon within the ion trapping region (C-trap) of the analyzer.
Accordingly, instead of using the classical procedure in SESI-HRMS, which consists of acquiring the entire m/z range in a single scan, a strategy known as spectral stitching was applied, whereby narrower, overlapping m/z windows were individually acquired and subsequently combined. The m/z window settings were optimized (splitting the m/z = 50–500 range into 4 windows) to minimize ion competition in the SESI–Orbitrap MS system, without compromising scanning speed, and resulted in the detection of three times more features. This strategy was inspired by metabolomics and lipidomics workflows used in nanoelectrospray ionization (nESI) direct-infusion mass spectrometry, aiming to minimize ionization suppression or enhancement effects [41].
Spectral stitching techniques were also employed by Zhu et al. [42] in a study on bacterial headspace volatilomics. In this case, besides reducing ion competition from dense analyte matrices, they exploited the rich repository of bacterial volatiles documented in the microbial volatile organic compound (mVOC) database [43], in an approach called database-assisted globally optimized targeted (dGOT)-SESI-HRMS. This offers an alternative of validation for m/z features detected to confirm their chemical identities.

3.1.3. Lack of Standardization

Although widely used today, SESI-HRMS methodology still misses standardized benchmarks for quantification and quality control.
To address this, a gas-phase standard delivery system that delivers multiple VOC standards simultaneously was developed and evaluated across different SESI-HRMS setups, enabling routine quality control, monitoring of instrumental drift, and detection of technical outliers [33]. For this purpose, three different units of the standard delivery system were evaluated with acetone on the same setup, a SESI–Quadrupole Time of Flight (SESI-QTOF), obtaining between-run variations < 10% CV and even lower within-run variability, confirming highly stable and repeatable performance across units.
In addition, each standard delivery system was used with the same commercial SESI ion source, coupled to an Orbitrap analyzer at the University Hospital Zurich (USZ) and to two QTOF analyzers, one at USZ and the other at the University Children’s Hospital Zurich. A seven-component standard was introduced over a test period of 1 h, every 10 min. Overall, between-run variations (apart from some exceptions) were considered consistent with bioanalytical validation guidelines recommending <15% CV.
Within-run variability was <20% CV for most standards, with the best performance (<5% CV) observed for the highest-intensity signals (m/z 137 and m/z 155 of 1,8-cineole) across all laboratories; the worst within-run behavior corresponded to low-intensity peaks (dimethyl sulfide and β-caryophyllene).
The standard delivery system was also applied in parallel to breath samples over several weeks, confirming its suitability to monitor instrument fluctuations and to define technical outliers in exhaled breath. The authors proposed its routine inclusion of the reported quality control in standard operating SESI-HRMS procedures.
The standardization of data collection and data processing as main priorities are also described [44] in another multicentric study (Basel, Zurich, and Guangzhou) in which a quality control procedure was performed every day before the acquisition of breath samples, involving the acquisition of an eight-compound gas mixture of known concentration and a subsequent comparison of the gas-mix signal intensities over time using an inhouse MATLAB app (MATLAB version 2021a. MathWorks, Natick, MA, USA). Comparison of multicenter data revealed a technical variability of ≈20%, in line with the variability often reported for mass spectrometry-based metabolomics.

3.2. The Identification and Annotation Challenge

One of the most daunting barriers to the routine application of SESI-MS is the difficulty in achieving unambiguous compound identification. Because SESI-MS typically operates without the retention time information provided by chromatography, the resulting mass spectra are often immensely complex, containing hundreds or thousands of overlapping features [7].
Targeted and non-targeted SESI-HRMS methods differ in their scope and workflow. Targeted protocols focus on a predefined list of analytes and often employ parallel reaction monitoring (PRM) or selected ion monitoring (SIM) for quantification and fragmentation. In contrast, non-targeted SESI-MS acquires full-scan spectra across wide m/z ranges with data-dependent MS/MS, capturing hundreds of features that represent unknown metabolites or volatile organic compounds (VOCs). Reliable feature annotation is especially critical in non-targeted workflows to enable biological or environmental interpretation, since they lack the advantage of prior knowledge provided by standards in targeted methods.
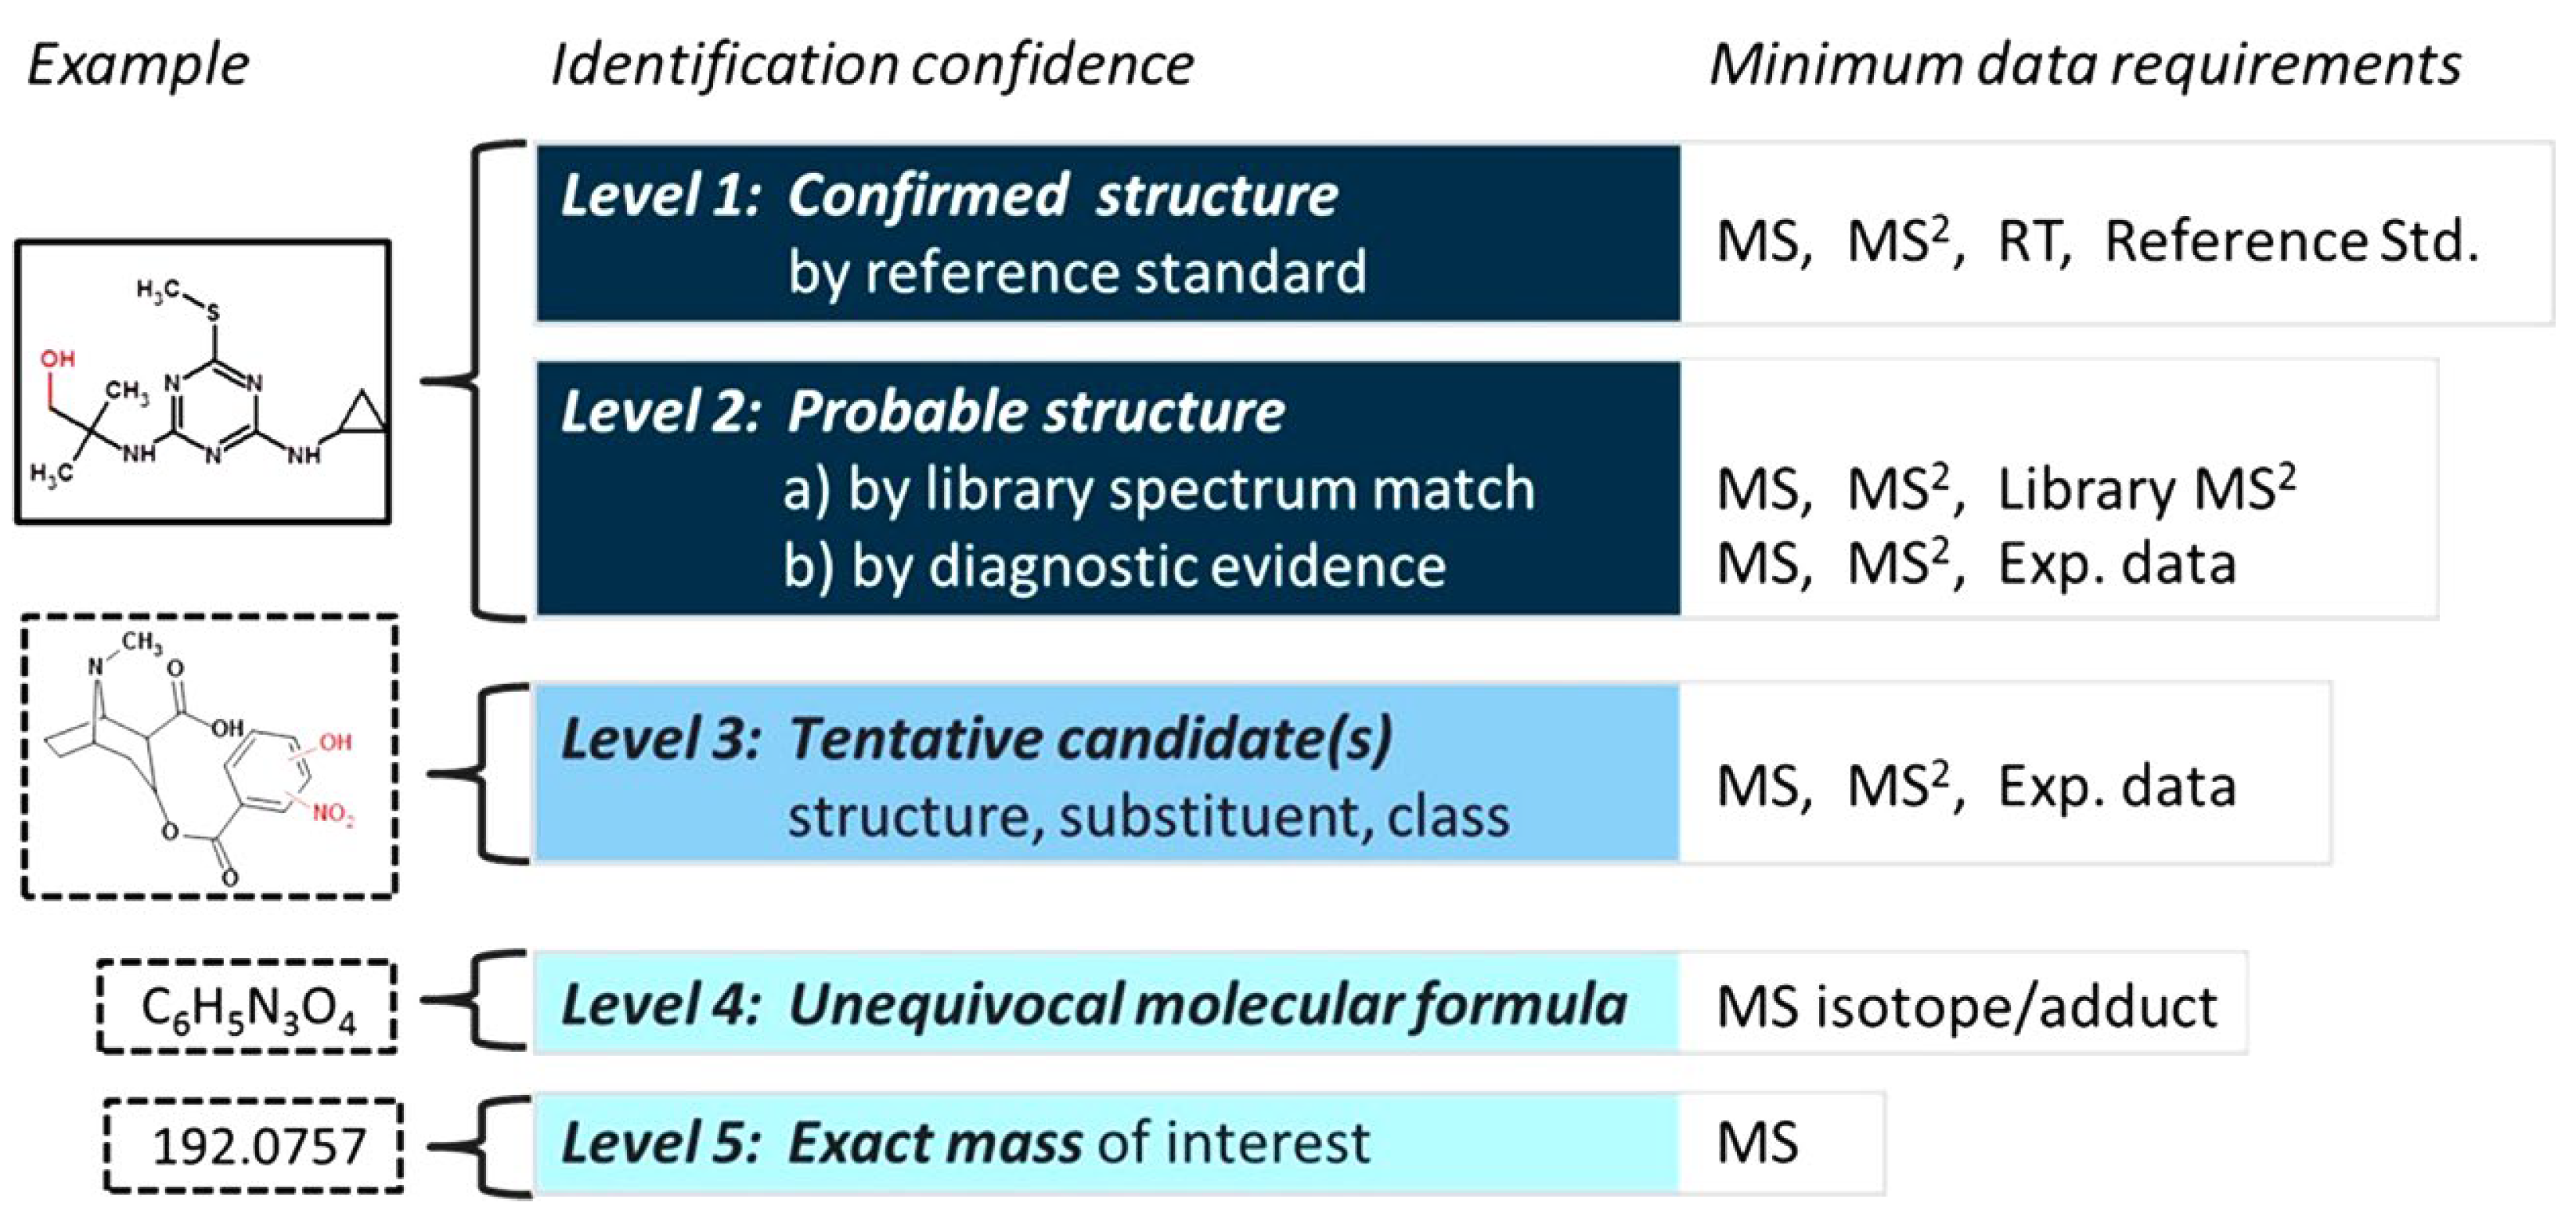
Compound identification confidence using HR-MS can be systematically classified using the framework proposed by Schymanski et al. [45], which assigns the following levels (summarized in Figure 4): level 1: confirmed structure, with measurement of a reference standard with MS1, MS/MS and retention time matching; level 2: probable structure, by MS1, MS/MS unambiguous library spectrum match or diagnostic evidence; level 3: tentative candidate(s), where there is supporting evidence for one or more possible structures, but the MS1, MS/MS information is insufficient to assign a single, unambiguous structure; level 4: unequivocal molecular formula, with or without MS/MS spectral information and insufficient evidence to propose possible structures, and level 5: exact mass, provided by MS, but lacking information to assign formulas. Many SESI-HRMS identifications achieve levels 2–4, but for small molecules, even a level 2 may be prone to errors with lacking supporting orthogonal information [46]. The following subsections outline several challenges identified in the literature in this context, along with proposed strategies to address them.

3.2.1. Resolving Isobaric Interferences

As previously stated, in a typical DI-HRMS metabolomics workflow, samples are analyzed on an MS1 level, followed by statistical analysis which yields MS1 signals of interest, which in turn have to be annotated to chemical structures in the next step. For sufficient confidence, this identification step requires characterization by tandem mass spectrometry (MS/MS).
Although high-resolution MS can distinguish isobaric compounds differing by only a few millidaltons at the MS1 stage, obtaining distinct MS/MS spectra is considerably more difficult. This is because isobaric precursor ions are frequently co-fragmented, causing mutual interference in their MS/MS spectra. In the literature, such complex spectra are commonly known as chimeric MS2 spectra or chimeras.
This issue is well known in liquid chromatography-based proteomics and metabolomics [47]. With SESI-HRMS, the lack of prior separation makes the situation even more complex, since it is not possible to adopt solutions, such as changing chromatographic conditions or establishing correlations with retention times.
One proposed solution involves employing a methodology termed IQAROS [48] (incremental quadrupole acquisition to resolve overlapping spectra) that was applied using an MS setup consisting of an isolation quadrupole in tandem with an Orbitrap. IQAROS modulates the intensities of precursors and fragments by stepwise movement of the quadrupole isolation window over the mass-to-charge (m/z) range of the precursors. The modulated signals are then deconvoluted by a linear regression model to reconstruct the fragment spectra with less interference.
In this work, the performance of the method was assessed with six model isobaric compounds (within a range of m/z 0.09) which are separable in MS1 but co-fragment in MS2: benzothiazole, pyridine-2,6-dicarbaldehyde, 3H-pyrrolo[2,3-d]pyrimidin-4(7H)-one, adenine, acetanilide and N,Ndimethylbenzylamine. It was demonstrated that IQAROS leads to fragment spectra comparable with spectra of the pure standards and performs better or comparable to direct MS2 analysis for structure assignment of the mixed isobars. Additionally, IQAROS was also employed in the identification of compounds in human breath, where two isobaric biomarkers (nonanedioic acid and 10-hydroxydecanoic acid) were detected, in accordance with a previous study in which their identity had been confirmed by liquid chromatography coupled to high-resolution mass spectrometry (LC-HRMS) [49].
The authors acknowledge that limitations occur due to multicollinearity when many precursors are deconvoluted, although the issue could possibly be addressed using more advanced statistical methods.

3.2.2. Use of Spectral Databases

Early work identifying volatile and semi-volatile molecules detected by SESI-HRMS relied heavily on large, generalist chemical and metabolite resources—PubChem (online since 2004) for structure and synonym lookup [50], the Human Metabolome Database (HMDB, officially launched on 2007) for human-relevant endogenous metabolites [51], KEGG (initiated in 1995) for biochemical context [52], and METLIN (established around 2005) for experimental MS/MS reference spectra [53]—because these repositories provided broad coverage and interoperable identifiers that supported tentative annotation of m/z features.
In adapting SESI-HRMS for direct breath analysis—one of its key applications—it became clear that breathomics required dedicated resources: curated compilations of breath-reported VOCs, quantitative ranges and disease associations to reduce false positives from ubiquitous environmental contaminants. In response, community and commercial efforts have produced breath-centric libraries—most notably the Human Breathomics Database (HBDB; assembled and published in 2020) [54] and Owlstone Medical’s Breath Biopsy VOC Atlas (publicized in 2023) [55]—which aggregate compounds actually observed in exhaled breath and link them to literature evidence, sampling context and prevalence, thus improving confidence in SESI-HRMS annotations.
Finally, open spectral repositories and spectral-matching platforms (e.g., MassBank/MoNA and traditional NIST libraries) remain important for putative structural assignments by providing reference spectra, but the field’s consensus since the late 2010s is that breath-specific, well-curated libraries combined with orthogonal evidence (biological plausibility, co-elution or parallel chromatographic confirmation, and controlled background sampling) are essential for translating SESI-HRMS features into reliable compound identifications for breath biomarker research.
Beyond human-centric resources, other fields can take advantage of database-assisted approaches. For instance, the already mentioned microbial-VOC (mVOC) database [43] offers a specialized repository for bacterial chemical signatures. This enables a pseudo-targeted approach that significantly expands detection and identification coverage for low-abundance metabolites in real-time microbial volatilomics.

3.2.3. Liquid Chromatography (LC) and Gas Chromatography (GC) Confirmation

An alternative method to enhance the level of annotation and confirm compound identification achieved with SESI-HRMS consists of performing additional LC or GC analyses. Such is the case of a comparative analysis in human breath [56] where the exhaled breath of sixteen participants was condensed and examined through dynamic headspace generation combined with GC–HRMS, as well as through LC–HRMS, under both polar and reverse-phase conditions. Approximately 25% and 5% of SESI features had a corresponding match with LC-MS and GC–MS, with most of the overlapping features in the mass range from 250 m/z to 400 m/z. GC–MS enabled robust compound identification, although it yielded only a few compounds with a NIST match factor higher than 80. While both GC–MS and LC-MS methods partially overlapped with the SESI features, there was limited overlap of both in the mass-to-charge range from 150 to 200. In conclusion, both GC–MS and LC-MS analyses of breath condensate can serve as supplementary tools for annotating features obtained from SESI-MS. However, to increase confidence in the annotation results, combining these methods with additional online fragmentation techniques is recommended.
The use of ultra-high-performance LC-MS (UHPLC-MS) of exhaled breath condensate has also been reported [12] as a complementary technique for real-time analysis, for unambiguous compound identification by comparison of retention times and MS2 spectra with commercial standards.

3.3. Cross-Study Variability

Despite increasingly reliable spectral annotations and the emergence of breath-centric libraries, a persistent obstacle for translating SESI-HRMS (and other untargeted) results into clinically useful biomarkers is the poor concordance of compound lists reported across independent studies. This issue is not specific to SESI-HRMS; meta-analyses and recent reviews have shown that a large fraction of metabolites or VOCs reported as “significant” are study-specific rather than reproducible: for example, a 2024 meta-analysis of clinical metabolomics [57] reported that ≈72% of metabolites designated as significant were found in only a single study, highlighting a broader reproducibility crisis in the field. This heterogeneity arises from multiple, often interacting sources: biological variability (population heterogeneity, diet, medication, circadian effects), pre-analytical differences (fasting state, breath fraction sampled, ambient air control, collection devices), analytical platform effects (SESI-HRMS vs. GC-MS or LC-MS, ionization conditions, mass resolution and mass calibration), and divergent data processing/statistical workflows (feature filtering, normalization, multiple-testing handling and model selection) [58]. Together these factors amplify small cohort-level signals into apparently different “biomarker” lists when studies are not harmonized.
These problems are especially acute in breathomics because exhaled VOC profiles are highly dynamic and sensitive to the sampling technique and environmental contamination, but the lack of cross-study agreement is not unique to breath: systematic reviews and field summaries of breath research, and of metabolomics more broadly, repeatedly call for standardized protocols, larger multicenter cohorts, and orthogonal validation (e.g., parallel GC–HRMS or LC-HRMS confirmation, targeted quantification) before putative markers can be considered robust.
To address limited reproducibility and cross-study comparability, several reporting checklists and minimum-information frameworks have been proposed and are increasingly recommended for breathomics and SESI-HRMS studies. At the metabolomics level, the Metabolomics Standards Initiative (MSI), first articulated in 2007, defined minimum reporting requirements for experimental design, sample handling, analytical methods and metabolite identification confidence, providing a common vocabulary to distinguish confirmed identifications from putative annotations [59]. These principles have since been reiterated and refined in later consensus papers and reviews, which stress transparent reporting of pre-analytical variables, instrument settings, data processing pipelines and statistical methods as prerequisites for meaningful comparison across cohorts and platforms. For clinically oriented breath studies, broader diagnostic reporting guidelines such as STARD (Standards for Reporting Diagnostic Accuracy Studies) [60] are also increasingly cited as complementary frameworks, as they enforce clear descriptions of study population, reference standards and sources of bias. For breath in particular, recent reviews [61,62] emphasize that breath-specific confounders—such as transient exposures, breathing pattern, and ambient background correction—together with differences in online vs. off-line sampling explain much inter-study discordance, and they recommend explicit reporting of pre-analytical and instrument parameters to improve comparability. This is exemplified in the work by Singh et al. [63] on standardization procedures for breath analysis by SESI-HRMS, where the authors recommend explicit reporting of pre-analytical (e.g., maneuver details, fasting), instrumental (e.g., SESI pressures, temperatures), and QC parameters (e.g., gas standards) to improve comparability across studies.
The authors characterized a new interface (Exhalion), which measured CO2 and different parameters to guide the exhalation maneuver, and achieved 6.7% median CV for the intra-subject variability of the 27 aldehydes studied, far below inter-subject variability (48.2%), concluding that the breath analysis platform and procedures described met the required standards to conduct breath metabolomics studies in multicenter clinical studies.

3.4. Chemometric Tools for Profile Signals

SESI-HRMS has been widely demonstrated as a powerful technique for the rapid, real-time analysis of complex volatile mixtures, particularly in biological and clinical contexts, without requiring chromatographic separation. Rather than relying on the unambiguous identification of individual compounds or resolution of isomeric species, many SESI-HRMS studies exploit the generation of global volatile fingerprints, reproducible mass spectral patterns arising from the collective contribution of multiple volatile organic compounds (VOCs).
In order to do so, advanced data processing (chemometrics) is required, due to large datasets involved. Robust classification and discrimination between sample groups using multivariate statistical approaches have been published, in many cases with minimal compound-level annotation. Table 3 displays several representative examples, highlighting the target analytes, chemometric tools, and the results achieved. These approaches have enabled the successful discrimination of bacterial species, bacterial lung infections, or cancerous versus normal cells, as well as the differentiation of Ligurian from non-Ligurian virgin olive oils and the ripening stages in food products.
In addition to classical strategies—such as Principal Component Analysis (PCA) and Partial Least Squares Discriminant Analysis (PLS-DA), other methodologies in SESI-HRMS have also been employed, including the use of the NIST-MS search program [73] as a classification tool.

4. Conclusions

Although SESI-HRMS is a relatively young technique, the extensive body of research and applications over the last two decades—coupled with the availability of commercial instruments from various manufacturers—reflects its increasing maturity. Nevertheless, it still faces ongoing challenges regarding both feature annotation and quantification. Throughout this review, several approaches developed to address these objectives have been discussed.
Further work should be conducted to develop standard delivery systems that can generate robust gas-phase concentrations under controlled flow and humidity conditions, capable of reaching the ppb range, even for low-volatility compounds to enable reliable quantification.
This would allow for the evaluation of linearity, limits of detection and quantification (LOD/LOQ), and signal stability under various conditions, such as variations in humidity or the presence of competing compounds.
In that sense, it would be advisable to conduct ion suppression studies using gas-phase standards for each class of compounds of interest—various volatiles with different volatility or basicity ranges—while systematically varying the concentration of suppressors. This would allow for the definition of safe quantification ranges and provide warnings regarding problematic compounds.
The SESI-HRMS user community should collaborate on defining gaseous reference materials, common analytical procedures with rigorous control of sampling conditions (gas flow, humidity, and carrier gas composition, as these variables are critical for reproducibility), and minimum reporting standards (analogous to other metabolomics fields) as well as establishing databases for SESI-HRMS-detected compounds. Such efforts would enhance inter-laboratory comparability and reproducibility, ultimately supporting the integration of SESI into clinical and regulatory frameworks.
The pathway from an observed differentiating feature to a validated biomarker remains long: early discovery should be followed by independent replication, targeted quantification, and biological plausibility assessment—steps that have been outlined for metabolomics at large and reiterated for breathomics to help the field move from promising signatures to reproducible, clinically actionable biomarkers.

Author Contributions

Conceptualization, M.E.F.L. and D.G.-G.; methodology, M.E.F.L. and D.G.-G.; literature search and data curation, D.G.-G., M.E.F.L. and A.B.-C.; selection and analysis of relevant publications, M.E.F.L.; writing—original draft preparation, M.E.F.L.; writing—review and editing, D.G.-G., M.E.F.L. and A.B.-C.; supervision, M.E.F.L. All authors have read and agreed to the published version of the manuscript.

Funding

This research was funded by the Universidad de Salamanca (Spain) under the Research Groups Funding Program I B (2025), Research Projects.

Data Availability Statement

Data sharing is not applicable to this article as no new data were created or analyzed during this study. All sources analyzed are included in the reference list.

Conflicts of Interest

The authors declare no conflicts of interest. The funders had no role in the design of the study; in the collection, analyses, or interpretation of data; in the writing of the manuscript; or in the decision to publish the results.

Abbreviations

The following abbreviations are used in this manuscript:
AIMSAmbient ionization mass spectrometry
APCIAtmospheric pressure chemical ionization
CFCystic fibrosis
CP-ANNCounter-propagation artificial neural network
DIDirect injection
DLFSESIDifferential low-flow secondary electrospray ionization
DMADifferential mobility analyzer
dGOTDatabase-assisted globally optimized targeted
EESIExtractive electrospray ionization
ESIElectrospray ionization
ETHEidgenössische Technische Hochschule
HMDBHuman Metabolome Database
HRMSHigh-resolution mass spectrometry
IMSMSIon-mobility spectrometry/mass spectrometry
IQAROSIn-source collision-induced dissociation
KEGGKyoto Encyclopedia of Genes and Genomes
kNNk-nearest neighbors
LFSESILow-flow secondary electrospray ionization
METLINMetabolite Link
MSIMetabolomics Standards Initiative
mVOCMicrobial volatile organic compound
OSAObstructive sleep apnea
PCAPrincipal component analysis
PLS-DAPartial least squares discriminant analysis
PRMParallel reaction monitoring
PTR-MSProton transfer reaction mass spectrometry
QMSQuadrupole mass spectrometry
QTOFQuadrupole time-of-flight
SEADMSociedad Europea de Análisis Diferencial de Movilidad
SESI-MSSecondary electrospray ionization mass spectrometry
SIFT-MSSelected ion flow tube mass spectrometry
SIMSelected ion monitoring
STARDStandards for Reporting Diagnostic Accuracy Studies
SVMSupport vector machine
USZUniversity Hospital Zurich
VOCVolatile organic compound

References

  1. Takáts, Z.; Wiseman, J.M.; Gologan, B.; Cooks, R.G. Mass spectrometry sampling under ambient conditions with desorption electrospray ionization. Science 2004, 306, 471–473. [Google Scholar] [CrossRef] [PubMed]
  2. Huang, M.Z.; Cheng, S.C.; Cho, Y.T.; Shiea, J. Ambient ionization mass spectrometry: A tutorial. Anal. Chim. Acta 2011, 702, 1–15. [Google Scholar] [CrossRef] [PubMed]
  3. Javanshad, R.; Venter, A.R. Ambient ionization mass spectrometry: Real-time, proximal sample processing and ionization. Anal. Methods 2017, 9, 4896–4907. [Google Scholar] [CrossRef]
  4. Yamashita, M.; Fenn, J.B. Electrospray ion source: Another variation on the free-jet theme. J. Phys. Chem. 1984, 88, 4451–4459. [Google Scholar] [CrossRef]
  5. Fenn, J.B.; Mann, M.; Meng, C.K.; Wong, S.F.; Whitehouse, C.M. Electrospray ionization for mass spectrometry of large biomolecules. Science 1989, 246, 64–71. [Google Scholar] [CrossRef]
  6. Wu, C.; Siems, W.F.; Hill, H.H. Secondary electrospray ionization ion mobility spectrometry/mass spectrometry of illicit drugs. Anal. Chem. 1999, 72, 396–403. [Google Scholar] [CrossRef] [PubMed]
  7. Luo, X.; Wang, H.; Hu, X.; Gligorovski, S.; Li, X.; Sinues, P. Practical Applications of Secondary/Extractive Electrospray Ionization (SESI): A Versatile Tool for Real-Time Chemical Analysis. Mass Spectrom. Rev. 2025, 44, 142–176. [Google Scholar]
  8. Mathias, S.; Amerio-Cox, M.; Jackson, T.; Douce, D.; Sage, A.; Luke, P.; Sleeman, R.; Crean, C.; Sears, P. Selectivity of Explosives Analysis with Ambient Ionization Single Quadrupole Mass Spectrometry: Implications for Trace Detection. J. Am. Soc. Mass Spectrom. 2024, 35, 50–61. [Google Scholar] [CrossRef]
  9. Burns, D.; Mathias, S.; McCullough, B.J.; Hopley, C.J.; Douce, D.; Lumley, N.; Bajic, S.; Sears, P. Ambient ionisation mass spectrometry for the trace detection of explosives using a portable mass spectrometer. Int. J. Mass Spectrom. 2022, 471, 116735. [Google Scholar] [CrossRef]
  10. Wolf, J.C.; Schaer, M.; Siegenthaler, P.; Zenobi, R. Direct quantification of chemical warfare agents and related compounds at low ppt levels: Comparing active capillary dielectric barrier discharge plasma ionization and secondary electrospray ionization mass spectrometry. Anal. Chem. 2015, 87, 723–729. [Google Scholar] [CrossRef]
  11. Martínez-Lozano, P.; Rus, J.; Fernández de la Mora, G.; Hernández, M.; Fernández de la Mora, J. Secondary electrospray ionization (SESI) of ambient vapors for explosive detection at concentrations below parts per trillion. J. Am. Soc. Mass Spectrom. 2009, 20, 287–294. [Google Scholar] [CrossRef]
  12. Gaugg, M.T. On-line breath metabolomics in respiratory diseases using secondary electrospray ionization-mass spectrometry. Chimia 2018, 72, 184–188. [Google Scholar] [CrossRef]
  13. Weber, R.; Streckenbach, B.; Welti, L.; Inci, D.; Kohler, M.; Perkins, N.; Zenobi, R.; Micic, S.; Moeller, A. Online breath analysis with SESI/HRMS for metabolic signatures in children with allergic asthma. Front. Mol. Biosci. 2023, 10, 1154536. [Google Scholar] [CrossRef] [PubMed]
  14. Bean, H.D.; Mellors, T.R.; Zhu, J.; Hill, J.E. Profiling aged artisanal cheddar cheese using secondary electrospray ionization mass spectrometry. J. Agric. Food Chem. 2015, 63, 4386–4392. [Google Scholar] [CrossRef] [PubMed]
  15. Zeng, J.; Yu, Z.; Mekic, M.; Liu, J.; Li, S.; Loisel, G.; Gao, W.; Gandolfo, A.; Zhou, Z.; Wang, X.; et al. Evolution of indoor cooking emissions captured by using secondary electrospray ionization high-resolution mass spectrometry. Environ. Sci. Technol. Lett. 2020, 7, 76–81. [Google Scholar] [CrossRef]
  16. Zhu, J.; Bean, H.D.; Kuo, Y.M.; Hill, J.E. Fast detection of volatile organic compounds from bacterial cultures by secondary electrospray ionization-mass spectrometry. J. Clin. Microbiol. 2010, 48, 4426–4431. [Google Scholar] [CrossRef] [PubMed]
  17. Gaugg, M.T.; Garcia Gomez, D.; Barrios-Collado, C.; Vidal-de-Miguel, G.; Kohler, M.; Zenobi, R.; Sinues, P.M. Expanding metabolite coverage of real-time breath analysis by coupling a universal secondary electrospray ionization source and high resolution mass spectrometry—A pilot study on tobacco smokers. J. Breath Res. 2016, 10, 016010. [Google Scholar] [CrossRef] [PubMed]
  18. Wüthrich, C.; Giannoukos, S. Advances in secondary electrospray ionization for breath analysis and volatilomics. Int. J. Mass Spectrom. 2024, 498, 117213. [Google Scholar] [CrossRef]
  19. Blanco, F.G.; Vidal-de-Miguel, G. Breath analysis by secondary electro-spray ionization-mass spectrometry to interrogate biologically significant metabolites non-invasively. Crit. Rev. Anal. Chem. 2023, 53, 825–837. [Google Scholar] [CrossRef]
  20. Hu, B. Mass spectrometric analysis of exhaled breath: Recent advances and future perspectives. TrAC Trends Anal. Chem. 2023, 168, 117320. [Google Scholar] [CrossRef]
  21. Liao, G.; Yang, B.; Li, L.; Hu, X.; George, C.; Mellouki, A.; Wexler, A.; Sinues, P.; Li, X. The evolution of secondary/extractive electrospray ionization: From ionization mechanism to instrumental advances. Mass Spectrom. Rev. 2025, 44, 334–360. [Google Scholar] [CrossRef] [PubMed]
  22. Rioseras, A.T.; Gaugg, M.T.; Martinez-Lozano Sinues, P. Secondary electrospray ionization proceeds via gas-phase chemical ionization. Anal. Methods 2017, 9, 5052–5057. [Google Scholar] [CrossRef]
  23. Dryahina, K.; Polášek, M.; Smith, D.; Španěl, P. Sensitivity of secondary electrospray ionization mass spectrometry to a range of volatile organic compounds: Ligand-switching ion chemistry and the influence of Zspray guiding electric fields. Rapid Commun. Mass Spectrom. 2021, 35, e9187. [Google Scholar] [CrossRef]
  24. Lee, J.H.J.; Zhu, J. Optimizing secondary electrospray ionization high-resolution mass spectrometry (SESI-HRMS) for the analysis of volatile fatty acids from gut microbiome. Metabolites 2020, 10, 351. [Google Scholar] [CrossRef]
  25. Španěl, P.; Dryahina, K.; Omezzine Gnioua, M.; Smith, D. Different reactivities of H3O+(H2O)n with unsaturated and saturated aldehydes: Ligand-switching reactions govern the quantitative analytical sensitivity of SESI-MS. Rapid Commun. Mass Spectrom. 2023, 37, e9496. [Google Scholar] [CrossRef]
  26. Devenport, N.A.; Sealey, L.C.; Alruways, F.H.; Weston, D.J.; Reynolds, J.C.; Creaser, C.S. Direct detection of a sulfonate ester genotoxic impurity by atmospheric-pressure thermal desorption–extractive electrospray–mass spectrometry. Anal. Chem. 2013, 85, 6224–6227. [Google Scholar] [CrossRef] [PubMed]
  27. Han, Z.; Chen, L.C. Generation of ions from aqueous Taylor cones near the minimum flow rate: “True nanoelectrospray” without narrow capillary. J. Am. Soc. Mass Spectrom. 2022, 33, 491–498. [Google Scholar] [CrossRef] [PubMed]
  28. Kaeslin, J.; Wüthrich, C.; Giannoukos, S.; Zenobi, R. How soft is secondary electrospray ionization? J. Am. Soc. Mass Spectrom. 2022, 33, 1967–1974. [Google Scholar] [CrossRef]
  29. Chen, H.; Wortmann, A.; Zhang, W.; Zenobi, R. Rapid in vivo fingerprinting of nonvolatile compounds in breath by extractive electrospray ionization quadrupole time-of-flight mass spectrometry. Angew. Chem. Int. Ed. 2007, 46, 580–583. [Google Scholar] [CrossRef]
  30. SEADM. Low Flow Secondary Electrospray Ionizer. Available online: https://web.archive.org/web/20221006113317/https://www.seadm.com/products/vapour-analysisdetection/low-flow-secondary-electrospray-ionizer/ (accessed on 13 February 2026).
  31. Fossil Ion Tech (FIT). SUPER SESI—High Efficiency SESI Source for Thermo Orbitrap Systems. Available online: https://www.fossiliontech.com/super-sesi-for-thermo (accessed on 13 February 2026).
  32. Deep Breath Intelligence. SESI HRMS Platform. Available online: https://dbi.ch/sesi-hrms-platform/ (accessed on 13 February 2026).
  33. Streckenbach, B.; Sakas, J.; Perkins, N.; Kohler, M.; Moeller, A.; Zenobi, R. A gas-phase standard delivery system for direct breath analysis. J. Breath Res. 2022, 17, 016009. [Google Scholar] [CrossRef]
  34. Liu, C.; Zeng, J.; Sinues, P.; Fang, M.; Zhou, Z.; Li, X. Quantification of volatile organic compounds by secondary electrospray ionization-high resolution mass spectrometry. Anal. Chim. Acta 2021, 1180, 338876. [Google Scholar] [CrossRef]
  35. Wüthrich, C.; Fan, Z.; Vergères, G.; Wahl, F.; Zenobi, R.; Giannoukos, S. Analysis of volatile short-chain fatty acids in the gas phase using secondary electrospray ionization coupled to mass spectrometry. Anal. Methods 2023, 15, 553–561. [Google Scholar] [PubMed]
  36. Wüthrich, C.; Zenobi, R.; Giannoukos, S. Alternative electrolyte solutions for untargeted breath metabolomics using secondary-electrospray ionization high-resolution mass spectrometry. Rapid Commun. Mass Spectrom. 2024, 38, e9714. [Google Scholar] [CrossRef]
  37. Annesley, T.M. Ion suppression in mass spectrometry. Clin. Chem. 2003, 49, 1041–1044. [Google Scholar] [CrossRef]
  38. Wüthrich, C.; Giannoukos, S.; Zenobi, R. Elucidating the role of ion suppression in secondary electrospray ionization. J. Am. Soc. Mass Spectrom. 2023, 34, 2498–2507. [Google Scholar] [CrossRef]
  39. Wüthrich, C.; Käser, T.; Zenobi, R.; Giannoukos, S. Internal standard addition system for online breath analysis. Anal. Chem. 2024, 96, 10871–10876. [Google Scholar] [CrossRef]
  40. Lan, J.; Kaeslin, J.; Greter, G.; Zenobi, R. Minimizing ion competition boosts volatile metabolome coverage by secondary electrospray ionization orbitrap mass spectrometry. Anal. Chim. Acta 2021, 1150, 338209. [Google Scholar] [CrossRef] [PubMed]
  41. Southam, A.D.; Weber, R.J.M.; Engel, J.; Jones, M.R.; Viant, M.R. A complete workflow for high-resolution spectral-stitching nanoelectrospray direct-infusion mass-spectrometry-based metabolomics and lipidomics. Nat. Protoc. 2017, 12, 310–328. [Google Scholar] [CrossRef] [PubMed]
  42. Choueiry, F.; Xu, R.; Meyrath, K.; Zhu, J. Database-assisted, globally optimized targeted secondary electrospray ionization high resolution mass spectrometry (dGOT-SESI-HRMS) and spectral stitching enhanced volatilomics analysis of bacterial metabolites. Analyst 2023, 148, 5673–5683. [Google Scholar] [CrossRef] [PubMed]
  43. Lemfack, M.C.; Gohlke, B.O.; Toguem, S.M.T.; Preissner, S.; Piechulla, B.; Preissner, R. mVOC 2.0: A database of microbial volatiles. Nucleic Acids Res. 2018, 46, D1261–D1265. [Google Scholar] [CrossRef]
  44. Gisler, A.; Singh, K.D.; Zeng, J.; Osswald, M.; Awchi, M.; Decrue, F.; Schmidt, F.; Sieve, N.A.; Chen, X.; Usemann, J.; et al. An interoperability framework for multicentric breath metabolomic studies. iScience 2022, 25, 105557. [Google Scholar] [CrossRef]
  45. Schymanski, E.L.; Jeon, J.; Gulde, R.; Fenner, K.; Ruff, M.; Singer, H.P.; Hollender, J. Identifying small molecules via high resolution mass spectrometry: Communicating confidence. Environ. Sci. Technol. 2014, 48, 2097–2098. [Google Scholar] [CrossRef]
  46. Käser, T.; Giannoukos, S.; Zenobi, R. Challenges in the identification and quantitation in on-line breath analysis. J. Breath Res. 2025, 19, 036002. [Google Scholar] [CrossRef]
  47. Houel, S.; Abernathy, R.; Renganathan, K.; Meyer-Arendt, K.; Ahn, N.G.; Old, W.M. Quantifying the impact of chimera MS/MS spectra on peptide identification in large-scale proteomics studies. J. Proteome Res. 2010, 9, 4152–4160. [Google Scholar] [CrossRef]
  48. Kaeslin, J.; Zenobi, R. Resolving isobaric interferences in direct infusion tandem mass spectrometry. Rapid Commun. Mass Spectrom. 2022, 36, e9266. [Google Scholar] [CrossRef]
  49. Gaugg, M.T.; Bruderer, T.; Nowak, N.; Eiffert, L.; Martinez-Lozano Sinues, P.; Kohler, M.; Zenobi, R. Mass-spectrometric detection of omega-oxidation products of aliphatic fatty acids in exhaled breath. Anal. Chem. 2017, 89, 10329–10334. [Google Scholar] [CrossRef]
  50. Kim, S.; Chen, J.; Cheng, T.; Gindulyte, A.; He, J.; He, S.; Li, Q.; Shoemaker, B.A.; Thiessen, P.A.; Yu, B.; et al. PubChem 2025 update. Nucleic Acids Res. 2025, 53, D1516–D1525. [Google Scholar] [CrossRef] [PubMed]
  51. Wishart, D.S.; Guo, A.; Oler, E.; Wang, F.; Anjum, A.; Peters, H.; Dizon, R.; Sayeeda, Z.; Tian, S.; Lee, B.L.; et al. HMDB 5.0: The Human Metabolome Database for 2022. Nucleic Acids Res. 2022, 50, D622–D631. [Google Scholar] [CrossRef] [PubMed]
  52. Kanehisa, M.; Goto, S. KEGG: Kyoto encyclopedia of genes and genomes. Nucleic Acids Res. 2000, 28, 27–30. [Google Scholar] [CrossRef] [PubMed]
  53. Smith, C.A.; O’Maille, G.; Want, E.J.; Qin, C.; Trauger, S.A.; Brandon, T.R.; Custodio, D.E.; Abagyan, R.; Siuzdak, G. METLIN: A metabolite mass spectral database. Ther. Drug Monit. 2005, 27, 747–751. [Google Scholar] [CrossRef] [PubMed]
  54. Kuo, T.C.; Tan, C.E.; Wang, S.; Lin, O.A.; Su, B.; Hsu, M.; Lin, J.; Cheng, Y.; Chen, C.; Yang, Y.; et al. Human Breathomics Database. Database 2020, 2020, baz139. [Google Scholar]
  55. Hatch, A.; Arulvasan, W.; Birch, O.; Swann, S.; Coplowe, S.; Ratiu, A.; Charlton-Peel, C.; Szkatulska, M.; Mead, E.; Lam, E.; et al. Introducing Breath Biopsy VOC Atlas: A list of known breath VOCs for breath-based biomarker discovery. Am. J. Respir. Crit. Care Med. 2023, 207, A4050. [Google Scholar]
  56. Wüthrich, C.; Vadakkechira, A.; Fuchsmann, P.; Wacker, S.; Zenobi, R.; Giannoukos, S. Comparative analysis of feature annotation methods for SESI-HRMS in exhaled breath analysis. J. Chromatogr. A 2024, 1734, 465296. [Google Scholar] [CrossRef]
  57. Cochran, D.; Noureldein, M.; Bezdeková, D.; Schram, A.; Howard, R.; Powers, R. A reproducibility crisis for clinical metabolomics studies. TrAC Trends Anal. Chem. 2024, 180, 117918. [Google Scholar] [CrossRef]
  58. Di Minno, A.; Gelzo, M.; Caterino, M.; Costanzo, M.; Ruoppolo, M.; Castaldo, G. Challenges in metabolomics-based tests, biomarkers revealed by metabolomic analysis, and the promise of the application of metabolomics in precision medicine. Int. J. Mol. Sci. 2022, 23, 5213. [Google Scholar] [CrossRef] [PubMed]
  59. Sumner, L.W.; Amberg, A.; Barrett, D.; Beale, M.H.; Beger, R.; Daykin, C.A.; Fan, T.W.M.; Fiehn, O.; Goodacre, R.; Griffin, J.L.; et al. Proposed minimum reporting standards for chemical analysis: Chemical Analysis Working Group (CAWG) Metabolomics Standards Initiative (MSI). Metabolomics 2007, 3, 211–221. [Google Scholar] [CrossRef]
  60. Cohen, J.F.; Korevaar, D.A.; Altman, D.G.; Bruns, D.E.; Gatsonis, C.A.; Hooft, L.; Irwig, L.; Levine, D.; Reitsma, J.B.; de Vet, H.C.W.; et al. STARD 2015 guidelines for reporting diagnostic accuracy studies: Explanation and elaboration. BMJ Open 2016, 6, e012799. [Google Scholar] [CrossRef]
  61. Brinkman, P.; Wilde, M.; Ahmed, W.; Wang, R.; van der Schee, M.; Abuhelal, S.; Schaber, C.; Cunoosamy, D.; Clarke, G.W.; Maitland-van der Zee, A.H.; et al. Fulfilling the Promise of Breathomics: Considerations for the Discovery and Validation of Exhaled Volatile Biomarkers. Am. J. Respir. Crit. Care Med. 2024, 210, 1079–1090. [Google Scholar] [CrossRef]
  62. Ibrahim, W.; Natarajan, S.; Wilde, M.; Cordell, R.; Monks, P.S.; Greening, N.; Brightling, C.E.; Evans, R.; Siddiqui, S. A systematic review of the diagnostic accuracy of volatile organic compounds in airway diseases and their relation to markers of type-2 inflammation. ERJ Open Res. 2021, 7, 00030-2021. [Google Scholar] [CrossRef] [PubMed]
  63. Singh, K.D.; Tancev, G.; Decrue, F.; Usemann, J.; Appenzeller, R.; Barreiro, P.; Jaumà, G.; Macia Santiago, M.; Vidal de Miguel, G.; Frey, U.; et al. Standardization procedures for real-time breath analysis by secondary electrospray ionization high-resolution mass spectrometry. Anal. Bioanal. Chem. 2019, 411, 4883–4898. [Google Scholar] [PubMed]
  64. Zhu, J.; Bean, H.D.; Jiménez-Díaz, J.; Hill, J.E. Secondary electrospray ionization-mass spectrometry (SESI-MS) breathprinting of multiple bacterial lung pathogens, a mouse model study. J. Appl. Physiol. 2013, 114, 1544–1549. [Google Scholar]
  65. Nowak, N.; Engler, A.; Thiel, S.; Stöberl, A.S.; Sinues, P.; Zenobi, R.; Kohler, M. Validation of breath biomarkers for obstructive sleep apnea. Sleep Med. 2021, 85, 75–86. [Google Scholar] [CrossRef]
  66. Choueiry, F.; Zhu, J. Secondary electrospray ionization-high resolution mass spectrometry (SESI-HRMS) fingerprinting enabled treatment monitoring of pulmonary carcinoma cells in real time. Anal. Chim. Acta 2022, 1189, 339230. [Google Scholar] [CrossRef]
  67. He, J.; Sinues, P.M.L.; Hollmén, M.; Li, X.; Detmar, M.; Zenobi, R. Fingerprinting breast cancer vs. normal mammary cells by mass spectrometric analysis of volatiles. Sci. Rep. 2014, 4, 5196. [Google Scholar] [CrossRef]
  68. Zhu, J.; Bean, H.D.; Wargo, M.J.; Leclair, L.W.; Hill, J.E. Detecting bacterial lung infections: In vivo evaluation of in vitro volatile fingerprints. J. Breath Res. 2013, 7, 016003. [Google Scholar] [CrossRef]
  69. Kaeslin, J.; Micic, S.; Weber, R.; Müller, S.; Perkins, N.; Berger, C.; Zenobi, R.; Bruderer, T.; Moeller, A. Differentiation of cystic fibrosis-related pathogens by volatile organic compound analysis with secondary electrospray ionization mass spectrometry. Metabolites 2021, 11, 773. [Google Scholar] [CrossRef]
  70. Farrell, R.R.; Fahrentrapp, J.; García-Gómez, D.; Martinez-Lozano Sinues, P.; Zenobi, R. Rapid fingerprinting of grape volatile composition using secondary electrospray ionization orbitrap mass spectrometry: A preliminary study of grape ripening. Food Control 2017, 81, 107–112. [Google Scholar] [CrossRef]
  71. Li, H.; Zhu, J. Differentiating antibiotic-resistant Staphylococcus aureus using secondary electrospray ionization tandem mass spectrometry. Anal. Chem. 2018, 90, 12108–12115. [Google Scholar] [CrossRef]
  72. Gómez-Mejia, A.; Arnold, K.; Bär, J.; Singh, K.D.; Scheier, T.C.; Brugger, S.D.; Zinkernagel, A.S.; Sinues, P. Rapid detection of Staphylococcus aureus and Streptococcus pneumoniae by real-time analysis of volatile metabolites. iScience 2022, 25, 105080. [Google Scholar] [CrossRef] [PubMed]
  73. Martínez-Lozano Sinues, P.; Alonso-Alces, R.M.; Zingaro, L.; Finiguerra, A.; Holland, M.V.; Guillou, C.; Cristoni, S. Mass spectrometry fingerprinting coupled to National Institute of Standards and Technology mass spectral search algorithm for pattern recognition. Anal. Chim. Acta 2012, 755, 28–36. [Google Scholar] [CrossRef]
Figure 1. Schematic representation of classical electrospray ionization (ESI) (A) and secondary electrospray ionization (SESI) (B). In ESI, analytes in solution are directly sprayed and ionized within the electrospray plume. In SESI, gaseous analytes are introduced through a heated capillary and ionized upon mixing with the pre-formed electrospray plume prior to entering the mass spectrometer.
Analytica 07 00027 g001
Figure 2. Proposed ionization pathways for gas-phase molecules in pure solvent electrosprays: (A) vapor–droplet interaction, where analytes dissolve in charged droplets and are released as ions upon evaporation; (B) gas-phase ion–molecule reactions, involving charge transfer from ionized solvent clusters to analytes.
Analytica 07 00027 g002
Figure 3. Real-time SESI time traces detected online over the course of three determinations. (A) In black, total ion trace; in red, extracted ion trace for salbutamol with m/z 240.1592 (±5 ppm). (B) Full HRMS spectrum. (C) MS/MS spectrum of m/z 240 ± 0.4 acquired with a collision energy of 30 V.
Analytica 07 00027 g003
Figure 4. Proposed identification confidence levels in high-resolution mass spectrometric analysis. Note: MS2 is intended to also represent any form of MS fragmentation (e.g., MSe, MSn). Reproduced with permission from [45].
Analytica 07 00027 g004
Table 1. Comparison of ESI, APCI and SESI techniques.
ESIAPCISESI
Sample PhaseLiquid (solution)Liquid (vaporized, heated nebulizer)Gas/Vapor (ambient)
Analyte PolarityPolar to highly polarLow to mediumBroad (mainly volatile/semi-volatile)
MW RangeWide (up to MDa)Low to Medium (<1500 Da)Low (<900 Da)
AdvantagesSoft ionization; ideal for biomoleculesRobust; less sensitive to salts and matrix effects than ESIReal-time analysis; ultra-high sensitivity for trace vapors; no sample preparation
DisadvantagesIon suppressionRisk of thermal degradation due to high temperaturesStrong dependence on vapor composition; less standardized
Table 2. Recommended values for the main parameters involved in the SESI process. Reproduced with permission from [21].
ParameterCommon ValuesReference
Analyte proton affinity>691 kJ/mol (when water is used as ESI solvent)Dryahina et al. [23]
TemperatureSample line: 130 °C
Ionization region: 90 °C
Lee and Zhu [24]
Chamber humidity1%Španěl et al. [25]
Spray composition0.1% formic acid in waterDevenport et al. [26]
Flow rate of primary ESI solvent0.5–7.5 μL/minHan and Chen [27]
Electrospray voltage2.5–3.5 kVKaeslin et al. [28]
Table 3. Representative applications of SESI-HRMS studies utilizing chemometric tools for multivariate analysis and group discrimination of complex volatile mixtures.
Target AnalytesChemometrics ToolsResultsReference
13 VOCs of five bacterial groupsPrincipal component analysis (PCA)The first three principal components exhibit a clear separation between the metabolic volatile profiles of the five bacterial groups independently of the growth medium.Hill et al. [16]
Multiple mouse breath volatile biomarkers from lung infectionsPCASeven different infections in mice were separable with the first three principal components (PC), via their SESI-MS breathprints. All of the infection breathprints were also separated from uninfected controls.Zhu et al. [64]
Breath biomarkers in patients with possible obstructive sleep apnea (OSA)Two-sided Mann–Whitney-U testsPrevious findings of an OSA-specific metabolic breath pattern were confirmed and a panel of 33 biomarkers in an N = 149 cohort of patients with possible OSA was validated. Kohler et al. [65]
60 significant volatile organic compounds (VOC) deemed of cancer cell originPartial least squares discriminant analysis (PLS-DA)Rapid online analysis of in vitro cell headspace allowed authors to uncover the volatile differences between non-small-cell lung cancer (NSCLC) and small-cell lung cancer (SCLC) and monitor their responses to drug treatment in real time.Zhu et al. [66]
Volatile metabolic compounds of human breast cancer cell lines and normal human mammary cellsMann–Whitney U test
PCA
Volatile compounds in the headspace of conditioned culture medium showed different concentrations between cancer cells and normal cells. HR-MS allowed authors to propose the chemical structures for some of the most discriminating molecules.Zenobi et al. [67]
Breath volatilome of mice infected with bacterial lung infectionsPCADifferentiation was achieved between bacteria-infected and uninfected mice, as well as between in vitro and in vivo volatiles.Hill et al. [68]
VOC biomarkers for cystic fibrosis (CF)-related pathogensPCA
Support vector machine algorithm (SVM)
Six pathogens were distinguishable with the first three principal components. Predictive analysis with a support vector machine algorithm using leave-one-out cross-validation exhibited perfect accuracy scores for the differentiation between the groups.Moeller et al. [69]
Volatile emissions from the intact grapes during ripeningPCAVOCs were detected directly from the headspace of intact grape berries and the detected peaks were tentatively assigned to compounds based on accurate mass. PCA separated each stage of grape ripeness.Zenobi et al. [70]
12 organic acids and 8 amino acids emitted from bacterial culturesPLS-DAThe headspace volatile profiles of Methicillin-Susceptible Staphylococcus aureus and Methicillin-Resistant Staphylococcus aureus could be clearly differentiated from each other, and differences between them could also be found before and after antibiotic treatment.Zhu et al. [71]
Volatile metabolites produced by two bacterial strainsPCAThe analysis of volatile profiles allowed for the establishment of differences between the human pathogenic bacteria Staphylococcus aureus and Streptococcus pneumoniae.Sinues et al. [72]
Volatile fraction of virgin olive oils from six countries in the Mediterranean basinThe NIST-MS search program for pattern recognition
PCA, PLS-DA, k-Nearest Neighbors (kNN) and counter-propagation artificial neural networks (CP-ANN)
The NIST-MS search algorithm outperformed all the supervised multivariate techniques tested in the study for differentiating the geographical origin of virgin olive oils (VOOs). It predicted correctly 96% of the Ligurian VOOs and 92% of the non-Ligurian ones.Sinues et al. [73]
Disclaimer/Publisher’s Note: The statements, opinions and data contained in all publications are solely those of the individual author(s) and contributor(s) and not of MDPI and/or the editor(s). MDPI and/or the editor(s) disclaim responsibility for any injury to people or property resulting from any ideas, methods, instructions or products referred to in the content.