Article

Development and Validation of an UHPLC-ESI-QTOF-MS Method According to the ICH M10 Guideline for Quantification of the Clinical Drug Candidate RD2 in the Mouse Brain


1
Institute of Biological Information Processing, Structural Biochemistry (IBI-7), Forschungszentrum Jülich, 52428 Jülich, Germany
2
Institut Für Physikalische Biologie, Heinrich-Heine-Universität Düsseldorf, 40225 Düsseldorf, Germany
*
Author to whom correspondence should be addressed.
These authors contributed equally to this work.
Analytica 2026, 7(1), 15; https://doi.org/10.3390/analytica7010015
Submission received: 9 January 2026 / Revised: 30 January 2026 / Accepted: 4 February 2026 / Published: 7 February 2026

Abstract

The all-d-enantiomeric-peptide RD2 was developed for the treatment of Alzheimer’s disease. This study aimed to develop a specific and highly sensitive liquid chromatography-mass-spectrometric (UHPLC-ESI-QTOF) method for quantifying RD2 in the mouse brain and to validate it according to the ICH M10 guideline to investigate the pharmacokinetic profile of RD2 in its target organ. Sample preparation, chromatographic separation and quantification were very challenging due to RD2’s highly hydrophilic properties, the complex matrix and the required lower limit of quantification (LLOQ). Chromatographic separation was performed on an Acquity UPLC BEH C18 column (2.1 × 100 mm, 1.7 μm particle size) within 5 min at 50 °C with a flow rate of 0.5 mL·min−1. Mobile phases consisted of water and acetonitrile with 0.2% formic acid and 0.015% heptafluorobutyric acid. Ions were generated by electrospray ionization in the positive mode, and RD2 was quantified by QTOF-MS. The developed extraction method revealed complete recovery. The linearity of the calibration curve was in the range of 2 ng·mL−1 to 500 ng·mL−1 (R2 > 0.99) with a LLOQ of 5 ng·mL−1. The intraday and interday accuracy and precision ranged from 0.4% to 12.2% and from 1.0% to 12.0%. RD2 remained stable in the freshly homogenized brain even after several freeze–thaw cycles, but stability decreased over time during long-term storage at −80 °C. Using this validated method, RD2-spiked brain homogenate samples and samples of a pharmacokinetic study with RD2 in mice were analyzed.

1. Introduction

The drug candidate RD2 (sequence ptlhthnrrrrr), also known as PRI-002 in clinical trials, is currently being investigated in a phase II proof-of-concept clinical trial (https://clinicaltrials.gov/study/NCT06182085; accessed on 30 December 2025) for the treatment of Alzheimer’s disease (AD). AD is a progressive neurodegenerative disease from which more than 33 million people suffer worldwide, with numbers increasing continuously [1]. The development and progression of AD are caused by the aggregation and self-assembly of monomeric Amyloid β (Aβ) peptides into neurotoxic soluble Aβ oligomers. RD2, which belongs to the relatively new drug class of all-d-enantiomeric peptides, was specifically developed for the direct disassembly of these Aβ oligomers [2], which play a major role in the pathology of AD [3,4]. Preclinical studies in four independent laboratories have demonstrated that RD2 can improve cognitive deficits in three different transgenic AD mouse models and in aged, cognitively impaired Beagle dogs, non-transgenic models for sporadic AD [2,5,6,7]. In addition, in vitro, ex vivo and in vivo target engagement was shown [2,7,8,9]. Furthermore, RD2 is remarkably resistant against metabolization in simulated gastrointestinal fluids, blood plasma and liver microsomes. It is not a substrate for the human d-amino acid oxidase (hDAAO did not influence the activity of the main cytochrome P450 (CYP) isoforms contained in human liver microsomes (CYP1A, CYP2C9, CYP2C19, CYP2D6, CYP3A4)) [10]. In addition, RD2 was shown to be safe and well-tolerated in healthy human volunteers and in patients with mild cognitive impairment and early AD [11,12]. A pharmacokinetic study with the radiolabeled compound (3H-RD2) in mice showed that RD2 has a high oral bioavailability, long blood circulation, and efficiently crosses the blood–brain barrier [13]. As it is beneficial to monitor RD2 levels without any radioactive label in order to follow, e.g., long-term treatment studies, we previously developed and validated an ultra-high-performance liquid chromatography coupled with electrospray ionization quadrupole time-of-flight mass spectrometry (UHPLC-ESI-QTOF-MS) method for the quantification of RD2 in mouse plasma [14]. The aim of this study was to develop and validate a UHPLC-ESI-QTOF method for the quantification of RD2 in the mouse brain, as it is of great use in determining the RD2 level in the target organ, the brain. This would allow the pharmacokinetic profile of RD2, e.g., plasma–brain ratios, to be investigated in more detail. Therefore, a suitable extraction method for the highly hydrophilic, arginine-rich RD2 from brain homogenate followed by a sensitive and validated method for quantitative analysis of RD2 via LC–MS was developed. All validation parameters were carried out in accordance with the ICH M10 guideline on bioanalytical method validation of the European Medicines Agency (EMA) (current version May 2022) [15].

2. Materials and Methods

2.1. Chemicals and Reagents

MS-grade acetonitrile (ACN) was purchased from Roth (Karlsruhe, Germany), MS-grade water was generated by a Mili-Q device (Merck, Darmstadt, Germany), heptafluorobutyric acid (HFBA) in LC grade was purchased from Sigma-Aldrich (Taufkirchen, Germany), formic acid (FA) in MS grade was purchased from Roth (Karlsruhe, Germany), and trichloroacetic acid (TCA) was purchased from Sigma-Aldrich (Taufkirchen, Germany). Low-binding Eppendorf tubes (Eppendorf, Hamburg, Germany) and autosampler vials (Duratec, Hockenheim, Germany) were used because of the adhesive characteristic of the peptides.

2.2. Peptides

The all-d-enantiomeric peptide RD2 consists of 12 amino acid residues, each in d-configuration, with an amidated C-terminus (ptlhthnrrrrr-NH2) and a monoisotopic mass of 1597.914 Da. The peptide was purchased from CBL Patras (Patras, Greece). The RD2 concentration was corrected for purity (95.2%), water content (2.1%), residual trifluoroacetic acid (TFA) (0.2%) and acetate content (23.9%). The internal standard (ISTD) has the same sequence as RD2 but with a substitution of leucine for valine at position 3. It has a monoisotopic mass of 1583.898 Da. All samples were prepared with RD2 from Batch 4714A.2 CBL Patras (Patras, Greece). The ISTD, which had a purity of 99.8%, was purchased from Peptides & Elephants GmbH (Potsdam, Germany).

2.3. Animals and Brain Homogenate Preparation

Healthy C57/BL6 mice were handled in the in-house facility. Mice received water and food ad libitum, and the housing rooms were maintained on a 12/12 h light–dark cycle at a temperature of 22 °C and a humidity of approximately 54%. All animal experiments were carried out according to the German law on the protection of animals and were approved by the local agencies (LANUV, North-Rhine-Westphalia, Germany, AZ 84-02.04.2017.A029). Mice were treated with RD2 via oral (p.o.) administration via gavage (200 mg/kg). RD2-treated mice brains were collected. Treated and untreated brain hemispheres were homogenized twice in 1 mL 20 mM Tris, 250 mM NaCl Buffer pH 8.8 including one EDTA-free protease inhibitor cocktail tablet (Roche, Basel, Switzerland) at 6500 rpm for 20 min with a pause of 30 s.

2.4. Sample Preparation and Peptide Extraction

40 µL of homogenized mouse brain was spiked with 5 µL of the corresponding RD2 working solution and 5 µL of the ISTD stock solution. In order to extract RD2 and ISTD, 25 µL 10% TCA was added, and the sample was vortexed and subsequently centrifuged at 14,000× g for 10 min at 4 °C. The supernatant was transferred to an autosampler vial and immediately analyzed.

2.5. Chromatographic and Mass Spectrometry Conditions

Extracted brain samples containing RD2 were first separated by reversed-phase UHPLC, and RD2 as well as its ISTD were detected by an Agilent 6550 iFunnel Q-TOF mass spectrometer (Agilent Technologies, Santa Clara, CA, USA). The Agilent 1290 UHPLC (Agilent Technologies, Santa Clara, CA, USA) consisted of a binary high-pressure pump, a thermostated column compartment and an autosampler with a fixed injection volume of 20 µL. For the separation, a Waters Acquity UPLC BEH C18 Column (100 × 2.1 mm, 1.7 µm, 130 A) (Waters Corporation, Milford, MA, USA) was employed and kept at 50 °C. The mobile phases consisted of (A) H2O + 0.2% formic acid + 0.015% heptafluorbuturic acid (HFBA) and (B) acetonitrile + 0.2% formic acid + 0.015% HFBA. The flow rate was set constant at 0.5 mL·min−1. After injection of the sample, a gradient was used from 5% B to 41% B over 5 min to separate the RD2 from any possibly interfering compounds from the sample matrix. RD2 eluted after 3.5 min, while the corresponding ISTD eluted slightly earlier at 3.4 min. After the gradient the column was washed with 95% B for 1.5 min before equilibrating the starting conditions for 2 min. In order to avoid carryover, the injection needle was rinsed with 30% acetonitrile + 0.1% formic acid after every injection.
The UHPLC system was coupled to the Q-TOF MS by a Dual Jet Stream Electrospray Ionization source, which was operated in the positive ionization mode with full-scan acquisition from 100 to 1700 m/z. The resolution of the MS was >40,000. The optimized source parameters can be found in Table 1.
The mass spectrometer was tuned in the low-mass range mode (max. 1700 m/z) with the high-sensitivity options enabled. For detection, two MS1 spectra were acquired every second, which resulted in about 10 spectra/chromatographic peaks. RD2 and its ISTD were detected with a charge of 3 at 533.650 m/z and at 528.983 m/z, respectively. Data acquisition was accomplished by the Agilent MassHunter Data Acquisition software version 10.0, and data was processed and analyzed by the Agilent MassHunter Quantitative Analysis (Q-TOF) (Quant-My-Way) Software version 10.2. Extracted Ion Chromatograms (EICs) were generated for RD2 and the ISTD and integrated. The resulting peak area was used for quantification.

2.6. Method Validation

All validation parameters were acquired according to the ICH M10 Guideline on bioanalytical method validation of the European Medicines Agency (Reference Number: EMA/CHMP/ICH/172948/2019) [15].

2.6.1. Selectivity

Selectivity enables the approach to distinguish between analytes and potentially interfering components in the matrix. To validate the selectivity, six blank samples from different brains were prepared and measured in triplicate. The addition of RD2 and ISTD was omitted and replaced with Milli-Q water in the sample preparation. The response of interfering components should not exceed 20% of the response for the analyte at LLOQ and not more than 5% of the response of the ISTD for the sample.

2.6.2. Specificity, Linearity, Sensitivity and Carryover

Specificity describes the ability of a method to distinguish between analytes and other structurally similar substances. Linearity and sensitivity were checked by analyzing calibration curves by fitting the resulting relative response–relative concentration plots to a linear regression fit with 1/x weighting. Calibration stock solutions of RD2 and ISTD were separately prepared in H2O at a final concentration of 15.000 ng·mL−1 and 750 ng·mL−1, respectively. Seven working solutions of RD2 were prepared, including 7500 ng·mL−1, 3750 ng·mL−1, 2500 ng·mL−1, 833.3 ng·mL−1, 277.8 ng·mL−1, 92.6 ng·mL−1 and 30.9 ng·mL−1 by serial dilution with H2O. From these working solutions seven calibration samples were made, with concentrations of 500 ng·mL−1, 250 ng·mL−1, 166.6 ng·mL−1, 55.5 ng·mL−1, 18.5 ng·mL−1, 6.2 ng·mL−1 and 2 ng·mL−1 of RD2 as the final concentration in the extraction setup. A total of 50 ng·mL−1 of ISTD was added to correct for the loss of analytes during sample preparation. The calibration curve should contain at least six concentrations that cover the concentrations in the RD2 pharmacokinetic (PK) study. A linear regression model with 1/x weighting was set. Four independent measurements on different days were documented with a maximum deviation of 20% of the concentration used for the lower limit of quantification (LLOQ) and a maximum deviation of 15% for the other concentrations.
LLOQ and LLOD were calculated as a signal/noise ratio of 10 (LLOQ) or 3 (LLOD), comparing measured signals from standards of low concentrations of RD2 with those of blank samples.
Carryover was assessed by injecting blank samples after each ULOQ (500 ng·mL−1) calibration sample. The RD2 response should not exceed 20%, and the ISTD response should not exceed 5%.

2.6.3. Accuracy and Precision Studies

All brain tissues were prepared with at least four different RD2 concentrations. For validation, the following concentrations were used as quality controls: 400 ng·mL−1 as the high QC, 250 ng·mL−1 as the medium QC, 5 ng·mL−1 as the low QC and 2 ng·mL−1 as the lower limit of quantification (LLOQ).
At least five replicates of each concentration series were analyzed in triplicate in three or more independent analytical measurements distributed over several days. Every day a fresh stock solution was prepared. The accuracy and precision were compared within the respective measurement series (within-run), but also between the individual measurement series (between-run). The accuracy of the measured concentrations should be within 15% of the concentration used, with a deviation of up to 20% acceptable for the LLOQ. The precision should be within 15% for each concentration level. The limit value for the LLOQ is 20%.

2.6.4. Matrix Effect

The matrix effect was an indicator of changes in the analyte response due to mostly unknown components in the same sample matrix. To examine possible matrix effects, three replicates of low QC and high QC were each measured in triplicate using six different brains in the presence of the ISTD. The data of the measured concentrations should not deviate by more than 15% from the concentration used.

2.6.5. Reinjection Reproducibility

In case of instrument interruption or equipment failure, samples could be reinjected at a later time. However, for RD2 we decided to freshly prepare new samples, so we did not check the extracted sample for long-term stability and reinjection reproducibility.

2.6.6. Stability

The stability measurement was used to test the sample’s stability under different storage conditions. The stability measurement was divided into four tests. In the freeze–thaw stability measurement, a sample of the matrix spiked with RD2 was frozen at −80 °C and thawed and refrozen two to three times over the next few days until extraction. In the benchtop stability measurement, the matrix spiked with RD2 was also frozen and left on ice for four hours on the day of the measurement after thawing until the sample extraction. For the long-term stability test, the matrix spiked with RD2 was frozen for three weeks at −80 °C and then extracted and measured. In order to check that the extracted peptide was still stable after 24 h in the autosampler at 4 °C, six samples of low and high QC were prepared and analyzed immediately. The same samples were then reinjected 24 h later and the difference was calculated. All four stability tests were performed with the low-QC and the high-QC samples. The measured concentration should be within 15% of the concentration used.

2.6.7. Dilution Integrity

In order to analyze the analytes’ dilution integrity, brain homogenates were spiked with RD2 at concentrations 10× of the high- and medium-QC concentrations, resulting in samples with a higher analyte concentration than the ULOQ (4000 ng/mL and 2500 ng/mL, respectively). These samples were then diluted 10-fold with blank brain homogenate, and 45 µL were used for the extraction procedure mentioned above. Both dilution QCs were prepared five times, and the mean accuracy should be within 15% of the nominal concentration. The precision (%CV) must not exceed 15%.

2.6.8. Recovery

The recovery (extraction efficiency) was tested at the low-, medium- and high-QC concentrations. Blank brain homogenates were spiked with RD2 and ISTD, extracted and analyzed. As a control, blank brain homogenate was extracted without the addition of both peptides. Afterward, 65 µL of extracted blank brain homogenate was spiked with 5 µL of RD2 corresponding working solution and 5 µL of ISTD stock solution and immediately analyzed. Six samples were set up for each concentration, and each sample was measured in triplicate. Recovery was determined by comparing the average concentration found in the extracted samples vs. the spiked concentration in the already extracted blank brain homogenates.

2.6.9. Incurred Sample Reanalysis

The reanalysis of samples (ISR) served as proof of the reliability of the measured analyte concentrations. Differences in protein binding, inhomogeneity within the tissue sample or biological components could influence the sample over the long term. A concentration difference of no more than ±20% for at least 2/3 of the reanalyzed samples should be achieved for a successful reanalysis. Nine brain samples were reanalyzed.

3. Results

On the basis of an UHPLC-ESI-QTOF-MS method for the quantification of RD2 in mouse plasma [14], which had already been developed in our lab, we optimized the method for the quantification of RD2 in mouse brain homogenate by testing different ion source conditions, acidic mobile phase modifiers, temperatures, gradient lengths and columns. In the following paragraphs we describe the validation results for the final method.

3.1. Selectivity

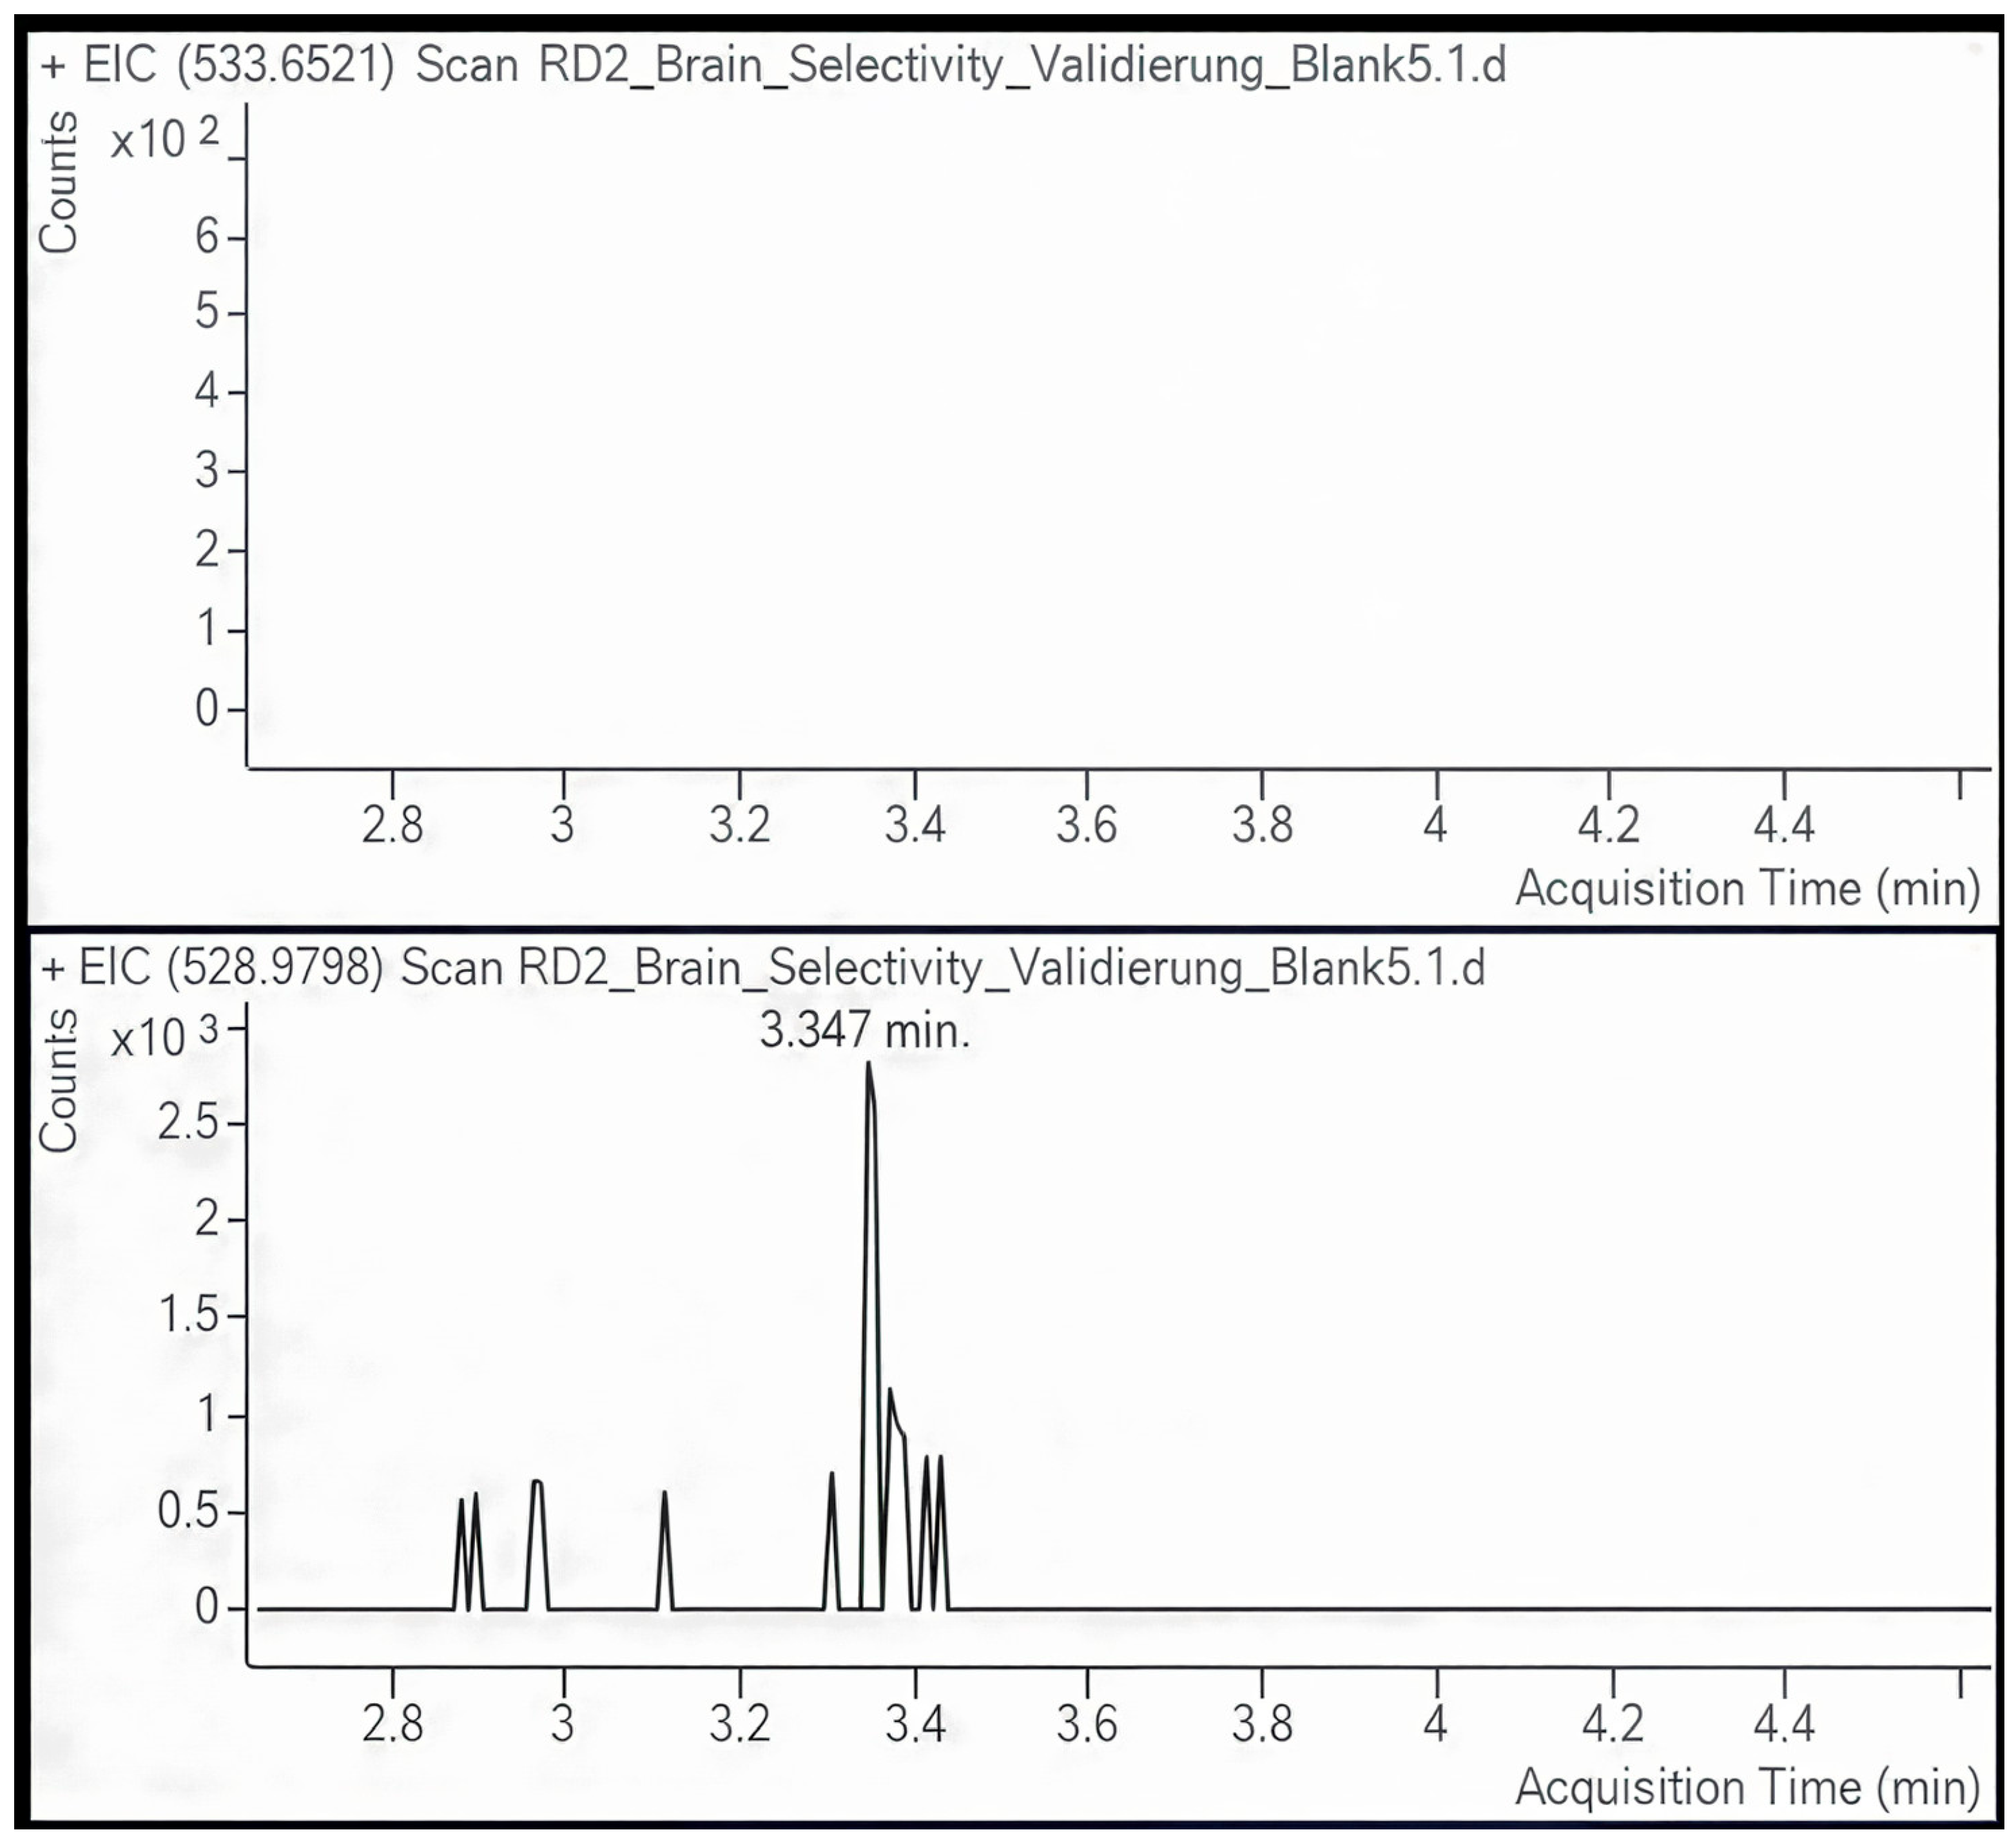
Q-TOF instruments enable high-resolution full-scan acquisition, allowing accurate, selective and reproducible quantification based on intact ions with high mass accuracy. Due to the high resolution of the Q-TOF, it can be assumed that interfering metabolites or components from the brain tissue are distinguished from RD2 or ISTD by their charge state and isotopic distribution. Peptides become charged due to an excess of positive ions, and the number of charges depends on the number of protonable functional groups present in the amino acid residues (e.g., lysine, arginine and histidine). RD2 and its ISTD eluted from the C18 column at 3.5 min and 3.4 min, respectively, and were ionized by electrospray ionization operated in positive mode. The ISTD can be clearly distinguished from RD2 by its mass. For both peptides, the triple-charged state of the intact molecules (533.650 m/z for RD2 and 528.983 m/z for the ISTD) was the most abundant and was therefore used for quantification. The mass accuracy of the system was 8.7 ppm. In order to check for the selectivity of the LC-MS method, six independently prepared blank mouse brain samples containing neither RD2 nor ISTD were extracted, and EICs were generated that showed no signal at 533.650 m/z and 528.983 m/z at the expected retention time for both peptides, as shown in Figure 1.
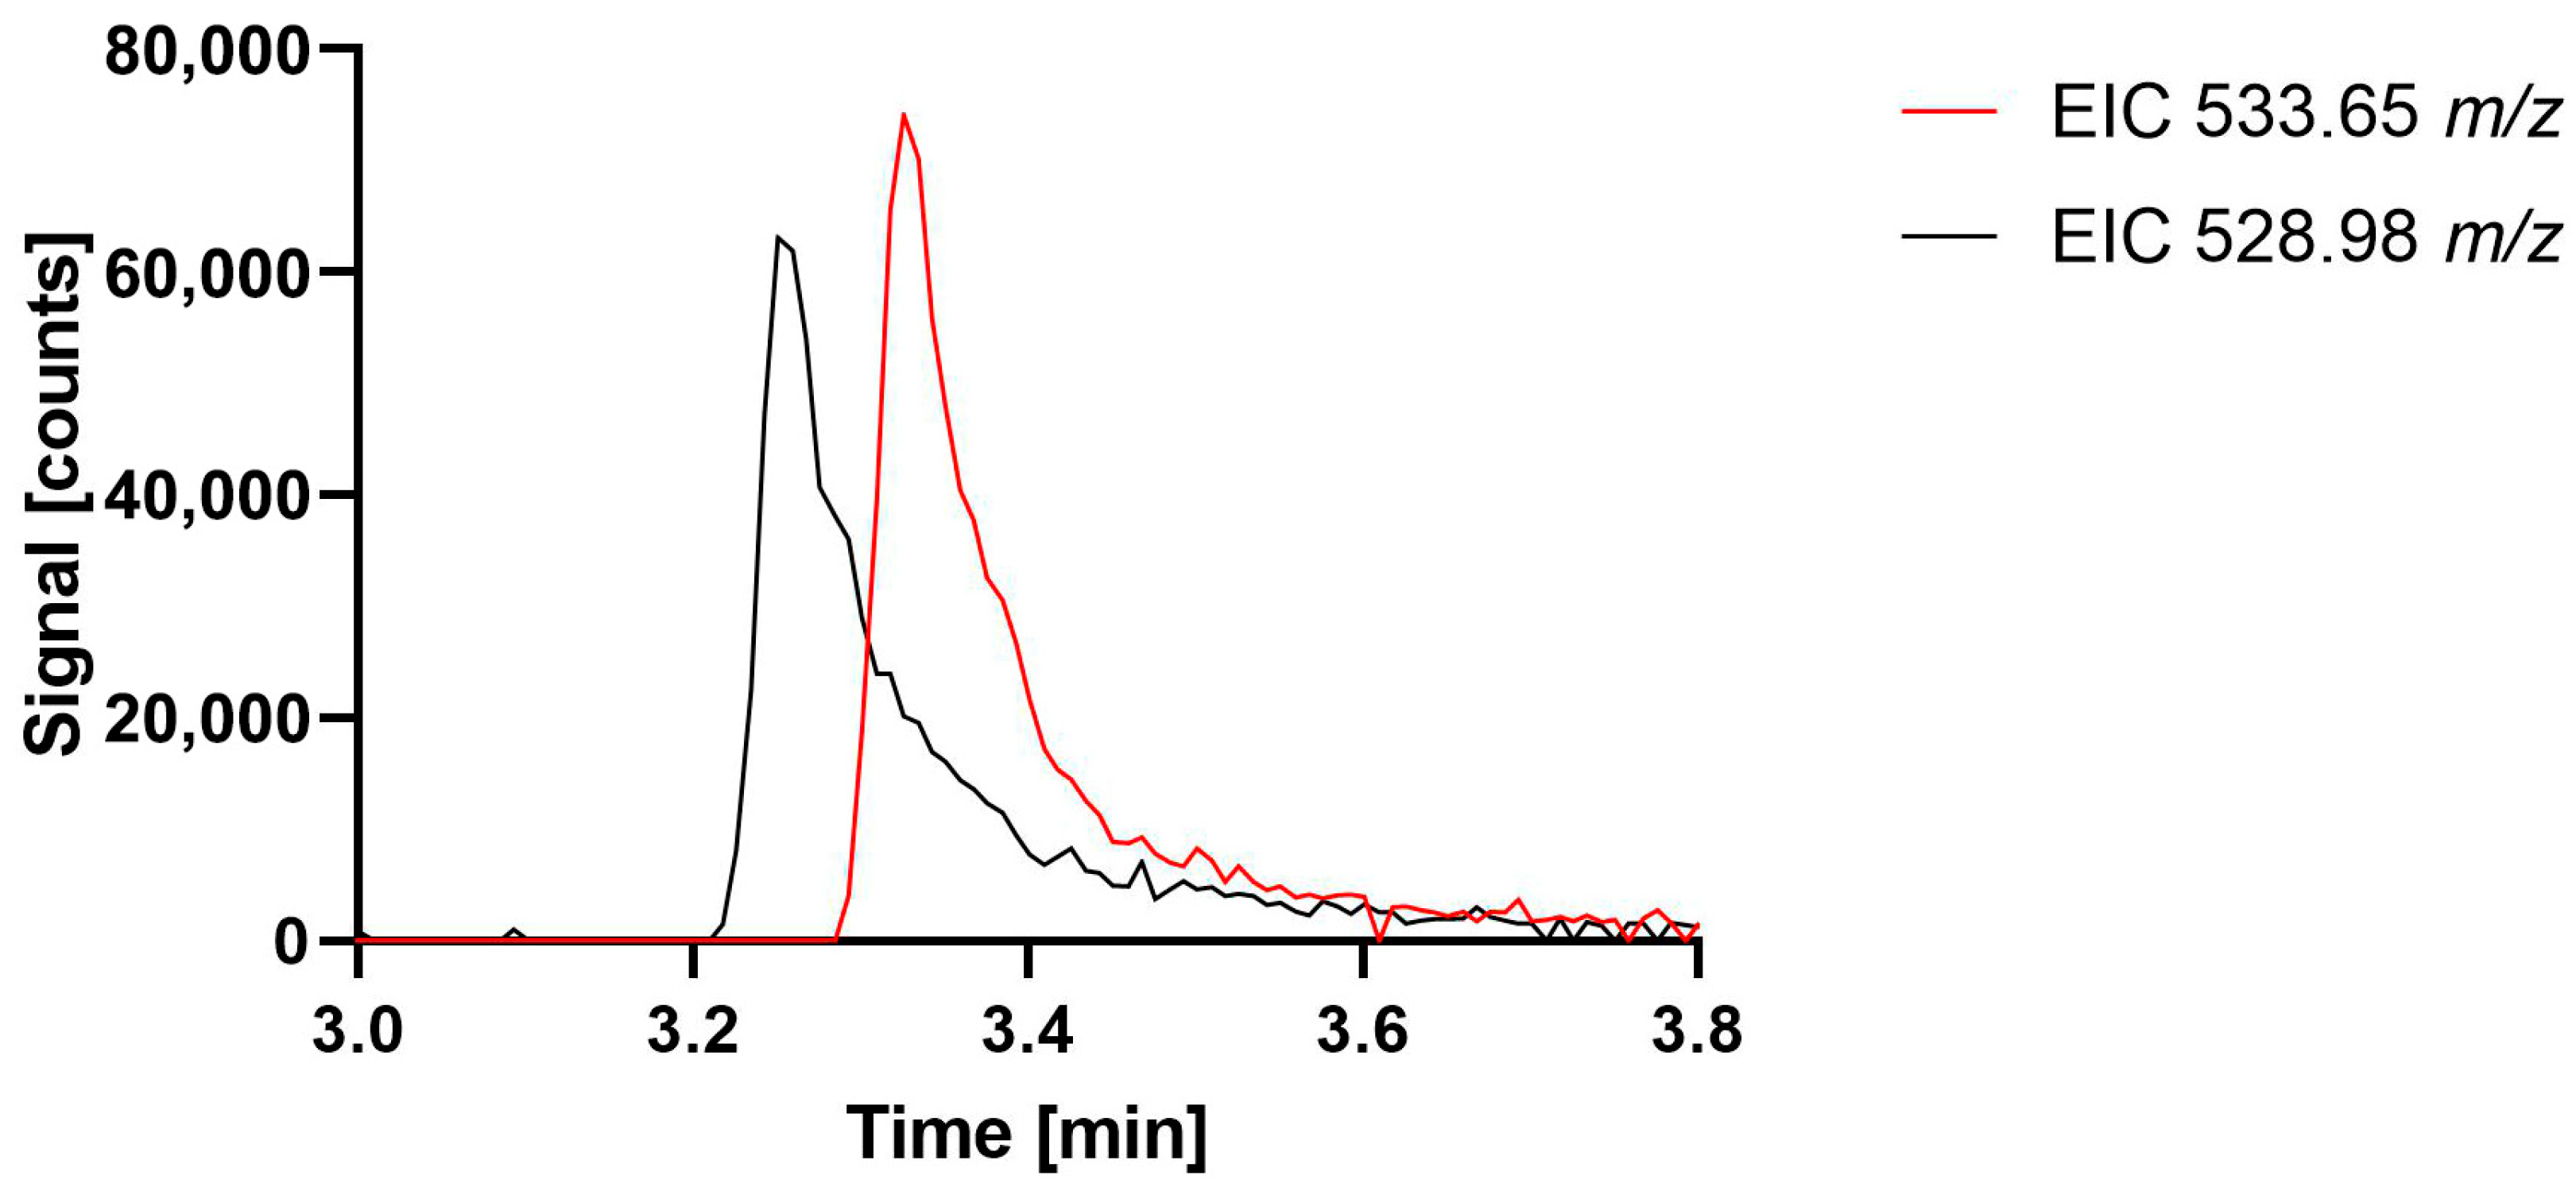
For the ISTD EICs a small peak, originating from the sample matrix, could be seen eluting 0.2 min before the expected retention time of the ISTD in the blank mouse brain sample; however, this peak was well resolved from the ISTD peak and displayed less than 5% of the intensity of the 50 ng·mL−1 ISTD signal. This suggests that there were no significant interferences for the detection of RD2 and ISTD. In Figure 2, exemplary EICs of a brain from a RD2-treated mouse spiked with ISTD are additionally depicted.

3.2. Specificity, Linearity, Sensitivity and Carryover

The developed method is specific as no interference from the components of the extracted mouse brain matrix was observed at the retention time of ISTD or RD2. ISTD and RD2 were well separated under the optimized chromatographic conditions, with retention times at 3.5 min and 3.4 min, respectively (Figure 1).
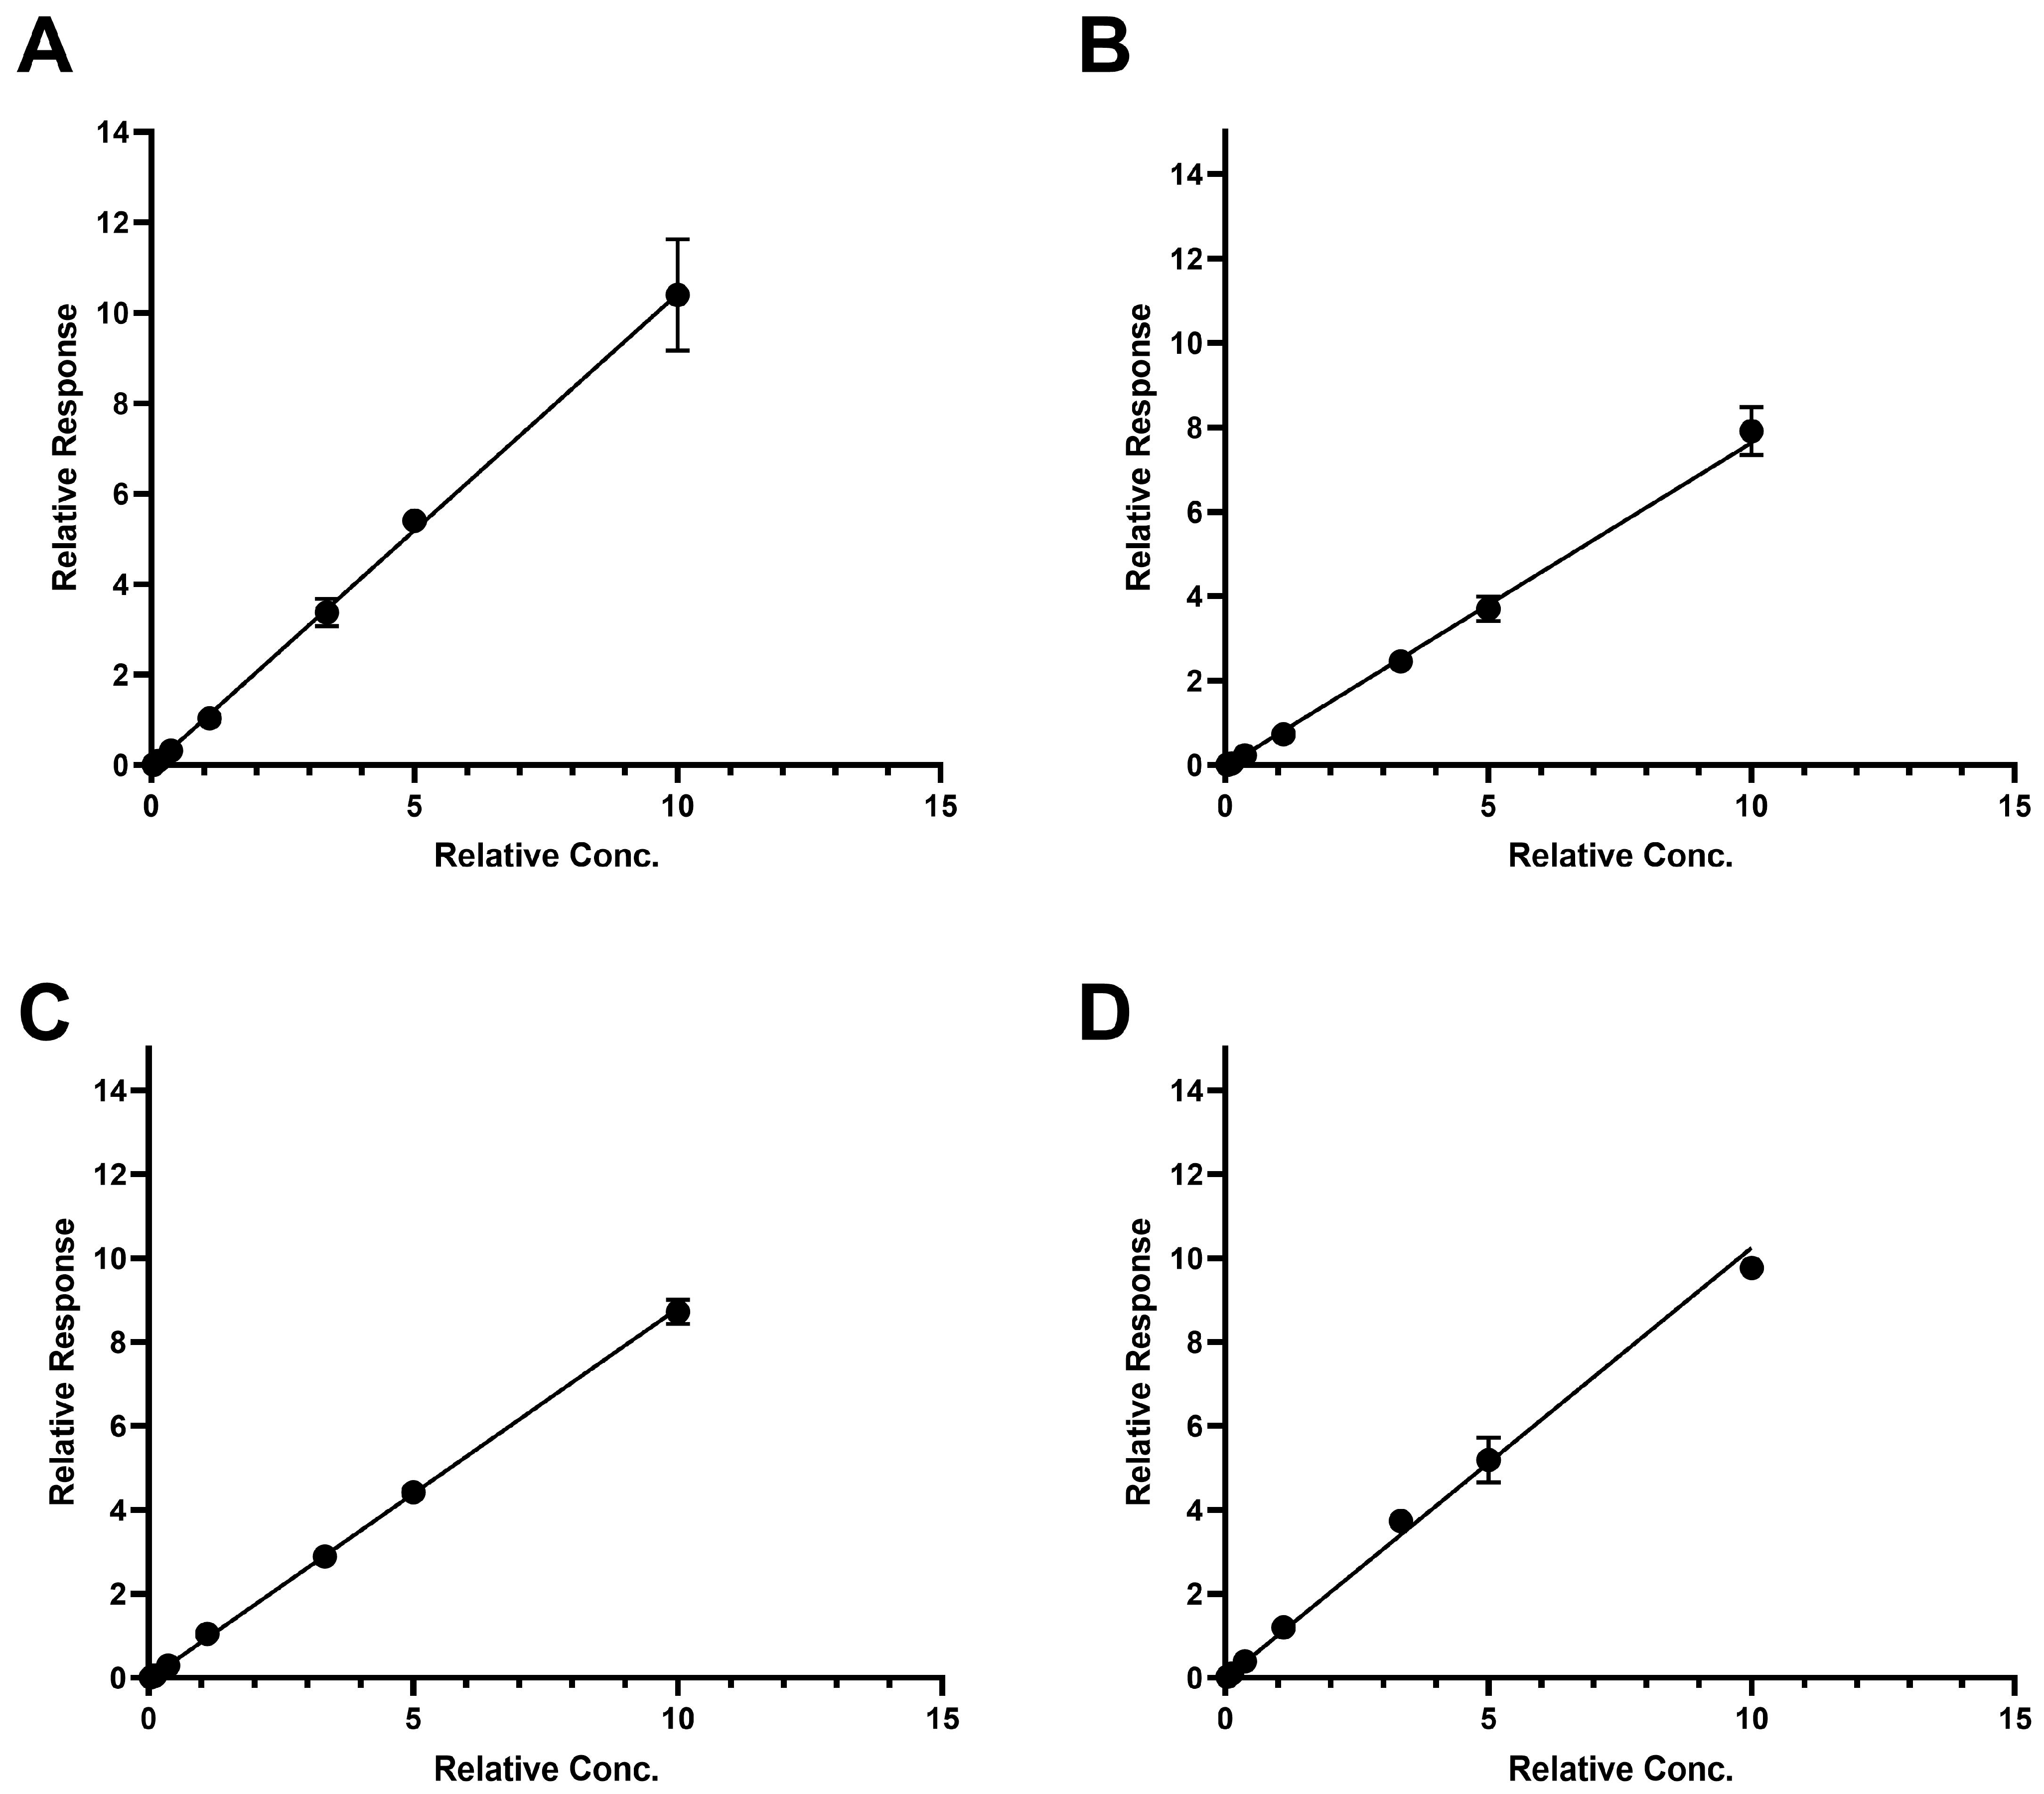
Calibration standards were freshly prepared using working solution and spiked to mouse brain homogenate immediately before extraction and analysis. For calibration, seven concentrations were used, ranging from 500 ng·mL−1 to 2 ng·mL−1 RD2 in a 1:2 serial dilution pattern. Each sample contained 50 ng·mL−1 ISTD. The resulting peak area ratios of RD2/ISTD were linearly fitted. The resulting R2s, depicted in the legend of Figure 3, were >0.992, showing a reliable, linear and sensitive calibration curve. The calibration curves can be seen in Figure 3. The ULOQ for this method was therefore set to the highest calibration standard used at 500 ng·mL−1, and an initial LLOQ of 2 ng·mL−1 and a LLOD of 0.68 ng·mL−1 was assumed.
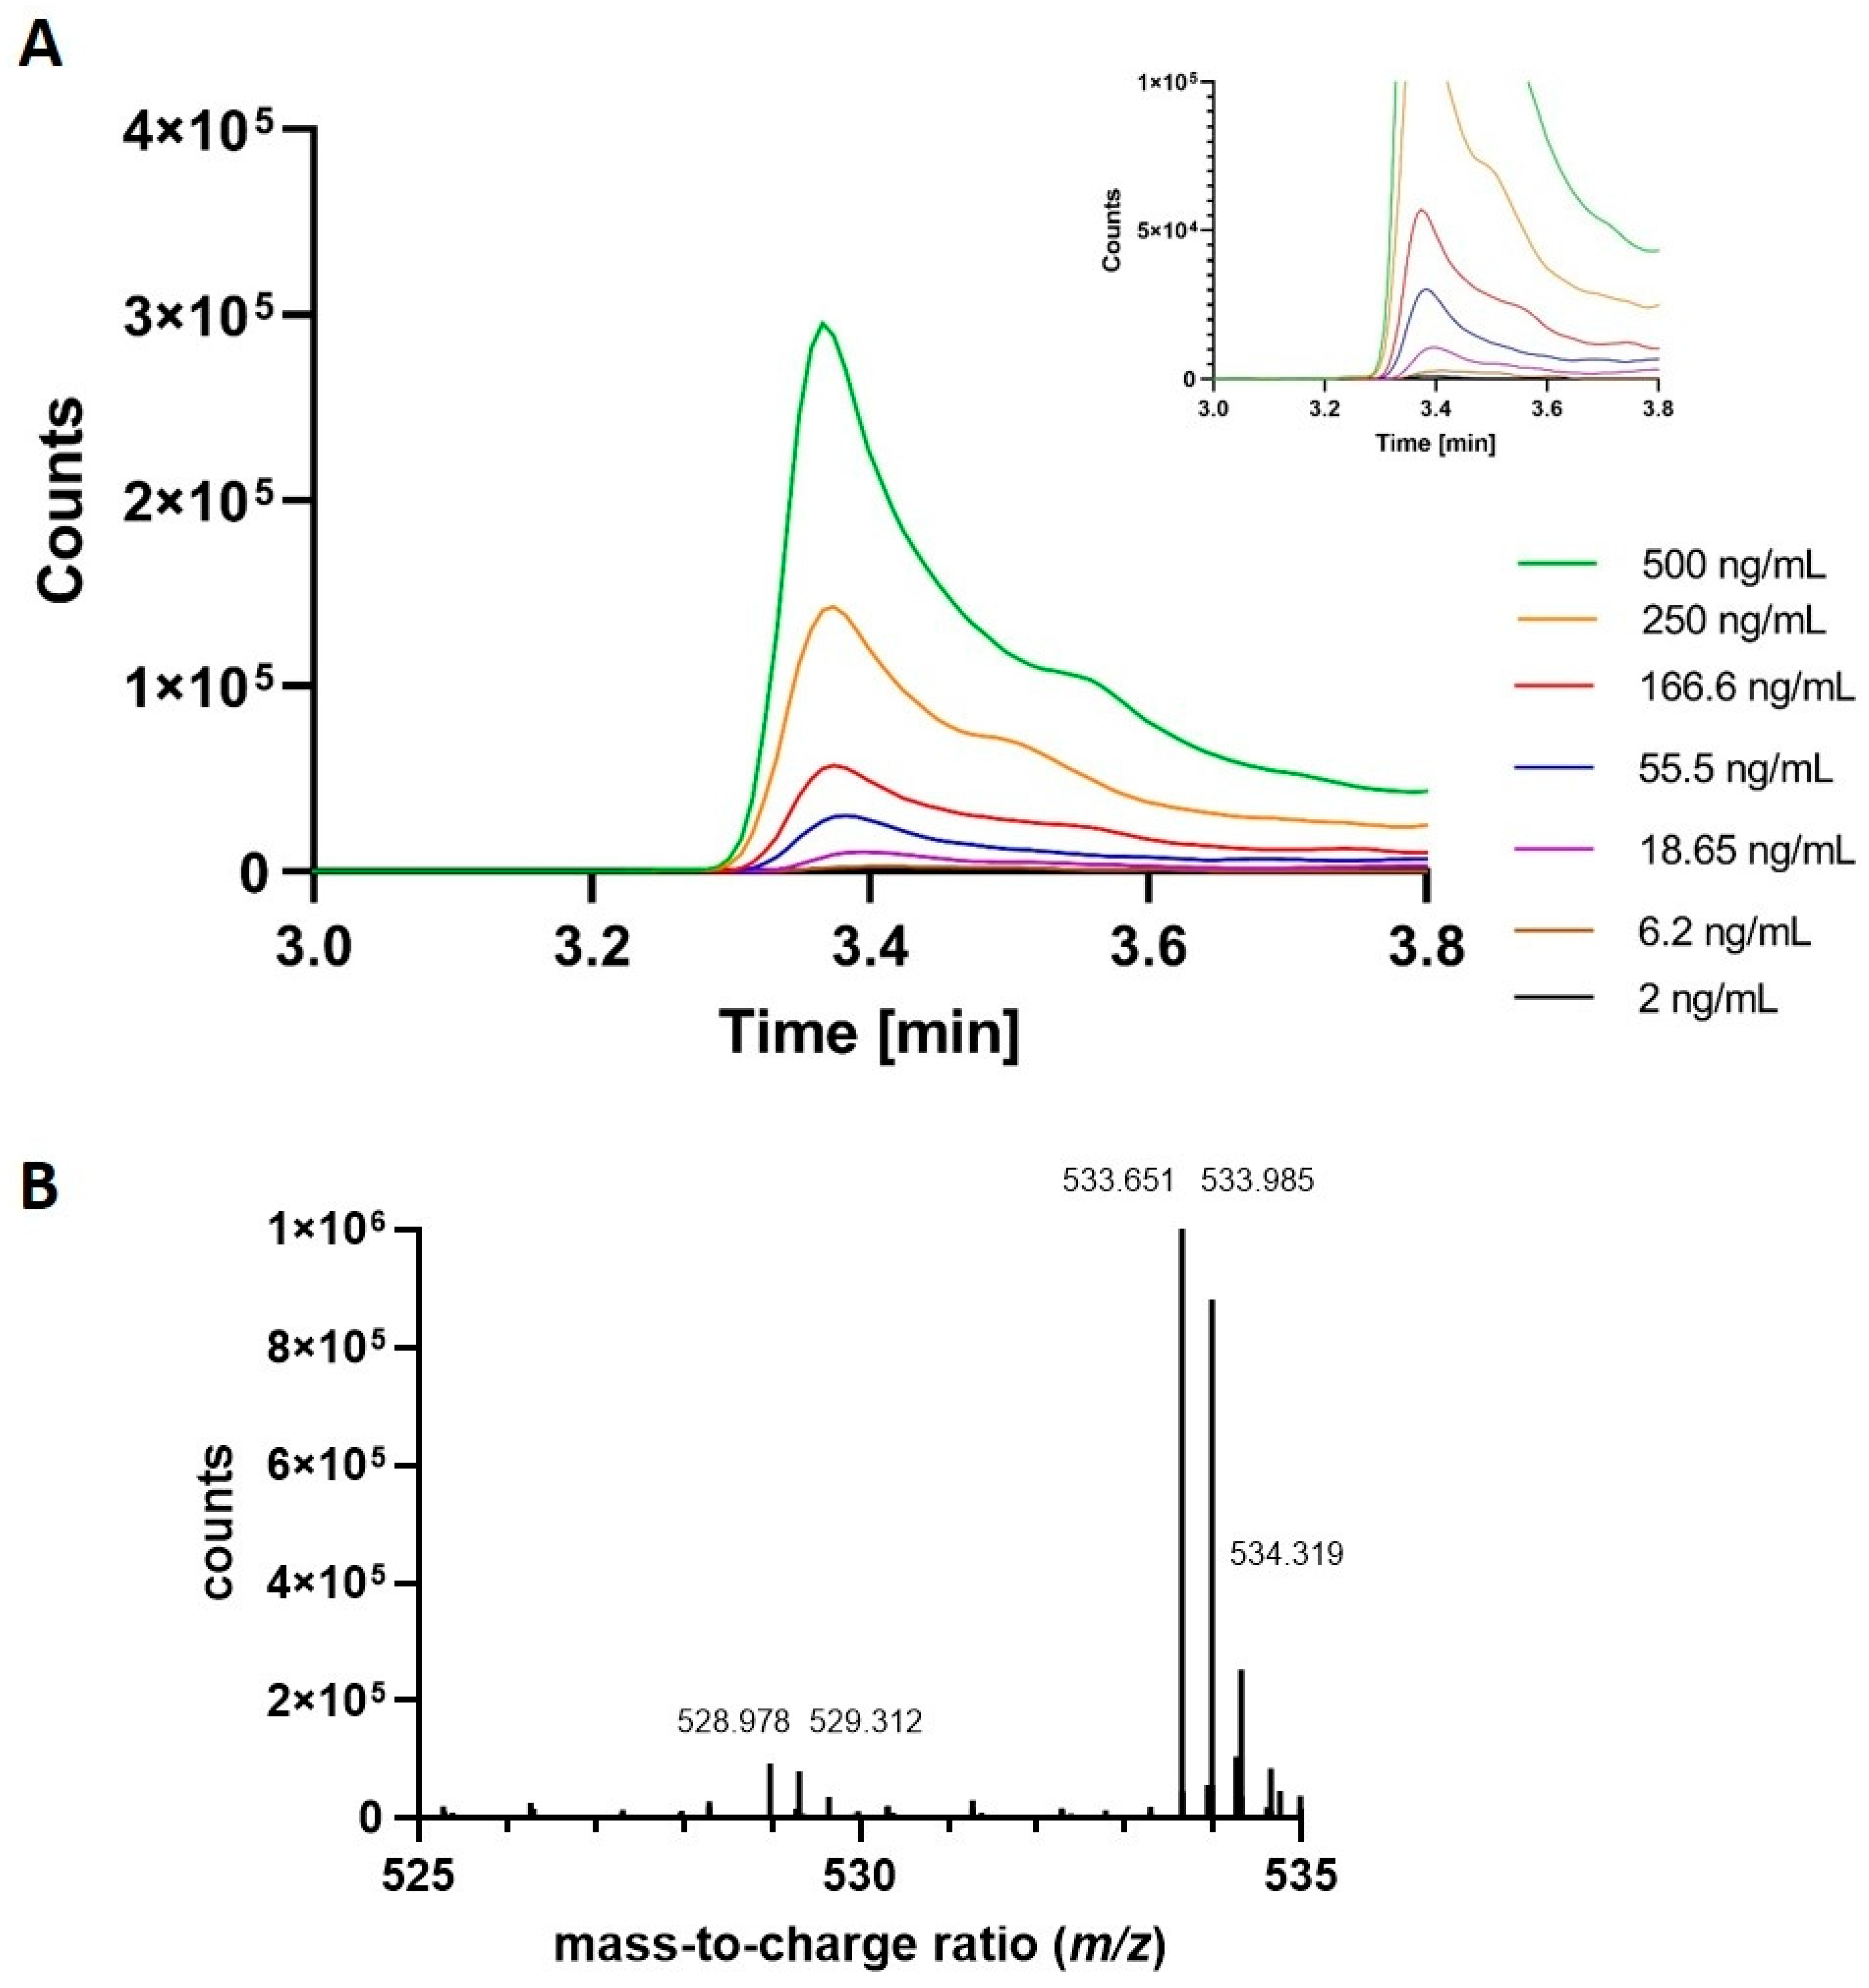
Figure 4 shows the stacked chromatograms of one calibration curve (A) as well as the mass spectra of RD2 and its ISTD for the 500 ng·mL−1 sample of that calibration curve.
Carryover was analyzed by injecting one blank sample after each ULOQ sample from the calibration curve. No RD2 or ISTD was detected in any blank injection.

3.3. Accuracy and Precision Study

In order to assess accuracy and precision, mouse brain homogenate was spiked with four different concentrations of RD2, extracted and analyzed. All concentrations were measured in triplicate. To assess the accuracy and precision, eight independent runs were set up. Two runs were set up each day, covering four days in total for the intraday and interday analysis of accuracy and precision. The results for the within-run accuracy are displayed in Table 2.
The between-run accuracy was 100.6%, 98.0% and 100.4% for the high-, medium-, and low-QC concentrations, respectively. For the LLOQ sample, the mean accuracy was only 42.0%, and only one run reached the ICH-M10 guideline criteria.
For the intraday precision analysis, all CV values for both runs of each concentration were averaged and are presented in Table 3.
All QC samples were within the limit of a maximum 15% difference. For the interday analysis, the averaged CVs of each day were compared to the next day Table 4. Again, all QC samples were within the limits.
Reinjection reproducibility was not determined, since in case of instrument interruption or equipment failure, samples were freshly prepared.

3.4. Matrix Effects

In order to assess the matrix effects of the brain homogenates on the quantification of RD2, the peptide was spiked to six different mouse brain homogenates and was subsequently extracted and analyzed both at the high QC (400 ng·mL−1) and low-QC (5 ng·mL−1) concentrations. Table 5 shows the results of the matrix effects on both concentrations, measured in triplicate. The mean accuracy was +3.4% for the high QC and +7.2% for the low QC. The CV was 3.8% for the high QC and slightly higher at 6.8% for the low QC. All values are in line with the ICH M10 guideline.

3.5. Stability

In order to assess the stability of the RD2 brain homogenate samples, RD2 was spiked at the high-QC and low-QC concentrations to blank brain homogenate, and the samples were divided into four groups (benchtop, freeze–thaw, long-term and autosampler). Table 6 shows the peptide stability for each group. At lower concentrations, RD2 was not particularly stable under each condition. At higher concentrations, samples were much more stable, reaching a stability of 97.5% for the high QC in the freeze–thaw cycle analysis. However, RD2 was least stable under the benchtop conditions (63.6% and 55.1% stability for high and low QC, respectively). In addition, long-term storage conditions at −80 °C also showed slight degradations for the high QC (78% stability) and significant degradation for the low QC (40.1% stability). This implies that study samples have to be processed as fast as possible on ice to avoid degradation of the sample during sample preparation. The extracted peptide showed very high stability in the autosampler at 4 °C for 24 h, with 99.3% and 98% stability for the high QC and low QC, respectively.

3.6. Dilution Integrity

Dilution integrity was checked by setting up 10-fold higher concentrated samples of the high and medium QC in blank brain homogenate, diluting them 1:10 in blank brain homogenate and performing the extraction and analysis of the diluted sample. Table 7 shows the mean accuracy and precision from the five replicates for each concentration.
Both mean accuracy and precision were within the 15% outlined in the guideline.

3.7. Recovery

Recovery was tested by analyzing high-, medium- and low-QC samples after extraction from brain homogenate and comparing them to samples set up in already extracted blank brain homogenate. Recovery for the high QC was 96.9%, for the medium QC 93.4% and for the low-QC 87.0%. The CV for all individual samples never exceeded 15%. Table 8 shows the results for the extraction recovery.

3.8. Incurred Sample Reanalysis (ISR)

Ten percent of the RD2 mouse brain homogenate samples from the initial study were reanalyzed according to the ICH M10 guideline. Table 9 shows the results of a reanalysis conducted about six months after the initial analysis. Between the analyses, samples were stored at −80 °C. More than 80% of the reanalyzed samples fulfilled the ICH M10 criteria.

4. Discussion

A Q-TOF instrument was used for the analysis of RD2 instead of the triple quadrupole instruments commonly used in trace analysis. This decision was based on the fact that the peptide does not produce specific product ions under standard collision-induced dissociation conditions when using N2 as the collision gas. Generating highly specific product ions is essential for establishing selective and robust multiple reaction monitoring (MRM) transitions, which are the basis for the high sensitivity of triple quadrupole instruments. The Q-TOF was operated in full-scan mode, providing a mass accuracy of 8.7 ppm, which enabled the accurate and selective quantification of the intact peptide ions based on accurate mass and isotopic distribution. Chromatographic separation of RD2 was achieved by a fast 5 min UHPLC method. For the quantification of RD2 from homogenized brain samples, a method was adapted from our previous ICH-M10-validated plasma method [14]. Key changes included increasing the formic acid concentration from 0.1% to 0.2% and simultaneously lowering the HFBA concentration from 0.025% to 0.015%. The reduction in perfluorinated organic acids increased the ion yield in the ESI-source, thereby increasing sensitivity, as perfluorinated organic acids are known for their ion suppression. However, they are necessary for the chromatographic separation of highly polar analytes, such as RD2, on reversed-phase columns [11]. We also used an advanced Q-TOF, with higher overall sensitivity than the Q-TOF previously used for the plasma method. The concentrations of the RD2 QC samples and the calibration samples were chosen based on the expected RD2 concentrations in the study samples. The acquired calibration curves were linear, with R2 values exceeding 0.992, and could be reproduced across several sample preparations. The upper limit of the method was set to 500 ng·mL−1 since we did not expect any study samples to have higher concentrations. Selectivity was checked by injecting blank brain homogenates from different brain sources. All samples showed no signal at the m/z values for RD2 and the ISTD, which is in accordance with the ICH-M10 guideline. To test for any matrix effects, RD2 was spiked at the low- and high-QC concentrations in six different brain homogenates. Both precision and accuracy were within the 15% limit of the guideline, fulfilling both criteria. Accuracy and precision were further analyzed over several sample extractions and analysis runs spanning several days. All QC samples fulfilled the acceptance criteria of the guideline for both accuracy and precision during each day (intraday) and also over several days (interday). However, the LLOQ sample at 2 ng·mL−1 showed significant deviations from the ±20% outlined in the guideline. This deviation was avoided by setting the LLOQ to the low-QC concentration of 5 ng·mL−1, which is still acceptable for the analysis of future study samples. After each high-QC sample was analyzed in this study, blank samples were injected to test for carryover. As no signal was detected for either the RD2 or the ISTD in the blank samples, carryover was excluded within the valid concentration range. Dilution integrity was checked by analyzing a 10× solution of the high- and medium-QC samples. Samples were diluted 1:10, and the mean accuracy and precision were determined from five individual samples per concentration. Both mean accuracy and precision of the diluted samples were within the guideline criteria of ±15%. This ensures that if study samples show concentrations above the ULOQ, a 1:10 dilution of the sample in blank brain homogenate is reliable to accurately quantify RD2. The recovery of RD2 from brain homogenate was reproducible within each tested concentration and consistent in the higher concentrations tested. The stability of RD2 brain homogenate samples was tested in three different ways according to the ICH-M10 guideline. Especially at the low-QC concentration, RD2 showed significant instability under all tested conditions, exceeding the criteria outlined in the guideline. Only in the freeze–thaw test did RD2 show acceptable stability at the high-QC concentration. This will have significant consequences for future study samples. First, all samples have to be analyzed within a short period of time (less than three weeks), since long-term stability cannot be assured. The number of samples that are simultaneously prepared in one session should carefully be calculated, as prolonged resting on ice will also lead to degradation of the sample. However, the tested conditions of several hours are usually not reached during routine sample preparation, since preparing a sample only takes a few minutes. Furthermore, samples should be aliquoted prior to the initial freezing at −80 °C, to avoid freeze–thaw cycles, although this has the least impact on the stability. The stability of RD2 and the ISTD in the stock solutions were analyzed previously [10], and fresh stock and working solutions were prepared regularly. The reproducibility of reinjection after prolonged storage of the extracted samples, e.g., in case of instrument interruption or equipment failure, was not tested, as we considered it would be more appropriate to perform a new extraction of the brain homogenates. We reanalyzed nine RD2 brain homogenate samples from a test sample group for the method validation. The samples were extracted about six months after their initial analysis. Seven out of nine (77.7%) of the ISR samples complied with the ICH-M10 guidelines’ acceptance criteria, which state that more than two-thirds of the reanalyzed samples have to be quantified within ±20% of their initial quantification results.

5. Conclusions

Here we describe the development and validation of a fast UHPL-ESI-QTOF-MS method for the quantification of the highly hydrophilic all-d-enantiomeric peptide RD2 in brain homogenates, which is currently being investigated as a potential treatment for AD. The analysis of brain homogenate samples was accomplished by a simple 5 min gradient enabling the analysis of several samples each day. The method showed linearity between 2 and 500 ng·mL−1 with an LLOQ of 5 ng·mL−1 and an ULOQ of 500 ng·mL−1. We demonstrated the accuracy, precision and reproducibility of the method both within a day and over several days. Furthermore, we discovered important stability characteristics of the RD2 peptide that will have an impact on future sample handling. The results of this study demonstrated the validity of the ICH-M10 guideline-based method and will be used for future analysis of RD2 in brain homogenates for PK analysis and treatment studies.

Author Contributions

Conceptualization, I.G. and J.K.; methodology, A.J., I.G., E.S., S.S. and B.S.-S.; validation, A.J. and I.G.; formal analysis, A.J. and I.G.; investigation, A.J. and I.G.; resources, D.W.; data curation, A.J. and I.G.; writing—original draft preparation, A.J., I.G., B.S.-S. and J.K.; writing—review and editing, A.J., I.G., E.S., S.S., D.W., B.S.-S. and J.K.; visualization, A.J. and I.G.; supervision, J.K.; project administration, J.K. All authors have read and agreed to the published version of the manuscript.

Funding

This research received no external funding.

Data Availability Statement

Data is contained within the article.

Conflicts of Interest

Dieter Willbold reports a relationship with Priavoid GmbH that includes employment. Dieter Willbold holds the patent “NOVEL D-ENANTIOMERIC PEPTIDES DERIVED FROM D3 AND USE THEREOF” (10889618). Dieter Willbold is the cofounder, co-owner and CEO of Priavoid GmbH and the coinventor of RD2. This did not have any influence on the interpretation of the data. All other authors have no conflicts of interest to report.

Abbreviations

The following abbreviations are used in this manuscript:
Amyloid β
ACNacetonitrile
ADAlzheimer’s disease
CVCoefficient of Variation
CYPcytochrome
EICExtracted Ion Chromatogram
EMAEuropean Medicines Agency
FAformic acid
hDAAOhuman d-amino acid oxidase
HFBAheptafluorobutyric acid
ICHInternational Council for Harmonisation
ISRIncurred sample reanalysis
ISTDinternal standard
LLOQlower limit of quantification
MRMmultiple reaction monitoring
PKpharmacokinetic
p.o.per oral
QCquality control
TCAtrichloroacetic acid
TFAtrifluoroacetic acid
UHPLC-ESI-QTOF-MSultra-high-performance liquid chromatography coupled with electrospray ionization quadrupole time-of-flight mass spectrometry
ULOQupper limit of quantification

References

  1. Better, M.A. 2024 Alzheimer’s disease facts and figures. Alzheimer’s Dement. 2024, 20, 3708–3821. [Google Scholar]
  2. van Groen, T.; Schemmert, S.; Brener, O.; Gremer, L.; Ziehm, T.; Tusche, M.; Nagel-Steger, L.; Kadish, I.; Schartmann, E.; Elfgen, E.; et al. The Abeta oligomer eliminating D-enantiomeric peptide RD2 improves cognition without changing plaque pathology. Sci. Rep. 2017, 7, 16275. [Google Scholar] [CrossRef] [PubMed]
  3. Tolar, M.; Hey, J.; Power, A.; Abushakra, S. Neurotoxic Soluble Amyloid Oligomers Drive Alzheimer’s Pathogenesis and Represent a Clinically Validated Target for Slowing Disease Progression. Int. J. Mol. Sci. 2021, 22, 6355. [Google Scholar] [CrossRef] [PubMed]
  4. Cline, E.N.; Bicca, M.A.; Viola, K.L.; Klein, W.L. The Amyloid-β Oligomer Hypothesis: Beginning of the Third Decade. J. Alzheimer’s Dis. JAD 2018, 64, S567–S610. [Google Scholar] [CrossRef] [PubMed]
  5. Kutzsche, J.; Schemmert, S.; Bujnicki, T.; Zafiu, C.; Halbgebauer, S.; Kraemer-Schulien, V.; Pils, M.; Blömeke, L.; Post, J.; Kulawik, A.; et al. Oral treatment with the all-d-peptide RD2 enhances cognition in aged beagle dogs—A model of sporadic Alzheimer’s disease. Heliyon 2023, 9, e18443. [Google Scholar] [CrossRef] [PubMed]
  6. Kutzsche, J.; Schemmert, S.; Tusche, M.; Neddens, J.; Rabl, R.; Jurgens, D.; Brener, O.; Willuweit, A.; Hutter-Paier, B.; Willbold, D. Large-Scale Oral Treatment Study with the Four Most Promising D3-Derivatives for the Treatment of Alzheimer’s Disease. Molecules 2017, 22, 1693. [Google Scholar] [CrossRef] [PubMed]
  7. Schemmert, S.; Schartmann, E.; Zafiu, C.; Kass, B.; Hartwig, S.; Lehr, S.; Bannach, O.; Langen, K.J.; Shah, N.J.; Kutzsche, J.; et al. Abeta Oligomer Elimination Restores Cognition in Transgenic Alzheimer’s Mice with Full-blown Pathology. Mol. Neurobiol. 2019, 56, 2211–2223. [Google Scholar] [CrossRef] [PubMed]
  8. Zhang, T.; Gering, I.; Kutzsche, J.; Nagel-Steger, L.; Willbold, D. Toward the Mode of Action of the Clinical Stage All-d-Enantiomeric Peptide RD2 on Abeta42 Aggregation. ACS Chem. Neurosci. 2019, 10, 4800–4809. [Google Scholar] [CrossRef]
  9. Kass, B.; Schemmert, S.; Zafiu, C.; Pils, M.; Bannach, O.; Kutzsche, J.; Bujnicki, T.; Willbold, D. Aβ oligomer concentration in mouse and human brain and its drug-induced reduction ex vivo. Cell Rep. Med. 2022, 3, 100630. [Google Scholar] [CrossRef] [PubMed]
  10. Elfgen, A.; Hupert, M.; Bochinsky, K.; Tusche, M.; Gonzalez de San Roman Martin, E.; Gering, I.; Sacchi, S.; Pollegioni, L.; Huesgen, P.F.; Hartmann, R.; et al. Metabolic resistance of the D-peptide RD2 developed for direct elimination of amyloid-beta oligomers. Sci. Rep. 2019, 9, 5715. [Google Scholar] [CrossRef] [PubMed]
  11. Kutzsche, J.; Cosma, N.C.; Kauselmann, G.; Fenski, F.; Bieniek, C.; Bujnicki, T.; Pils, M.; Bannach, O.; Willbold, D.; Peters, O. Oral PRI-002 treatment in patients with MCI or mild AD: A randomized, double-blind phase 1b trial. Nat. Commun. 2025, 16, 4180. [Google Scholar] [CrossRef] [PubMed]
  12. Kutzsche, J.; Jurgens, D.; Willuweit, A.; Adermann, K.; Fuchs, C.; Simons, S.; Windisch, M.; Humpel, M.; Rossberg, W.; Wolzt, M.; et al. Safety and pharmacokinetics of the orally available antiprionic compound PRI-002: A single and multiple ascending dose phase I study. Alzheimer’s Dement. 2020, 6, e12001. [Google Scholar] [CrossRef]
  13. Leithold, L.H.; Jiang, N.; Post, J.; Ziehm, T.; Schartmann, E.; Kutzsche, J.; Shah, N.J.; Breitkreutz, J.; Langen, K.J.; Willuweit, A.; et al. Pharmacokinetic Properties of a Novel D-Peptide Developed to be Therapeutically Active Against Toxic beta-Amyloid Oligomers. Pharm. Res. 2016, 33, 328–336. [Google Scholar] [CrossRef] [PubMed]
  14. Hupert, M.; Elfgen, A.; Schartmann, E.; Schemmert, S.; Buscher, B.; Kutzsche, J.; Willbold, D.; Santiago-Schubel, B. Development and validation of an UHPLC-ESI-QTOF-MS method for quantification of the highly hydrophilic amyloid-beta oligomer eliminating all-D-enantiomeric peptide RD2 in mouse plasma. J. Chromatogr. B Anal. Technol. Biomed. Life Sci. 2018, 1073, 123–129. [Google Scholar] [CrossRef] [PubMed]
  15. European Medicines Agency. ICH Guideline M10 on Bioanalytical Method Validation—Step 5; EMA: London, UK, 2023. [Google Scholar]
Figure 1. EICs of blank brain homogenate samples. No significant peak appears at the expected retention time for both peptides at ca. 3.4 min (for RD2 (m/z 533.650) and ISTD (528.983)).
Analytica 07 00015 g001
Figure 2. Exemplary EICs of a brain from a RD2-treated mouse spiked with ISTD.
Analytica 07 00015 g002
Figure 3. Four randomly selected calibration curves for RD2 from 500 ng·mL−1 to 2 ng·mL−1, with each sample containing 50 ng·mL−1 ISTD. Calibration curves (AD) were acquired independently from each other. The calibration curves show excellent linearity, with a high R2 value of more than 0.99. The linear equations are (A): y = 1.045·x − 0.03440, with an R2 of 0.992; (B): y = 0.7667·x − 0.03364, with an R2 of 0.994; (C): y = 0.8831·x − 0.02598, with an R2 of 0.994; and (D): y = 1.026·x − 0.008549, with a corresponding R2 of 0.994.
Analytica 07 00015 g003
Figure 4. EICs of RD2 (m/z 3 533.65) from one calibration curve (A) and the mass spectrum of the 500 ng·mL−1 sample showing the triply charged RD2 (m/z 3+ 533.65) and the triply charged ISTD (m/z 3+ 528.98) (B).
Analytica 07 00015 g004
Table 1. Parameters for the Dual Jetstream ESI source after method optimization.
ESI Source Parameters
Gas temperature290 °C
Drying gas flow14 L·min−1
Nebulizer pressure45 psi
Sheath gas temperature400 °C
Sheath gas flow11 L·min−1
Capillary Voltage3750 V
Nozzle Voltage1500 V
Fragmentor Voltage400 V
Octopole RF Voltage550 V
Table 2. Within-run accuracy measured in triplicate for four different concentrations (high-QC, medium-QC, low-QC and LLOQ).
Within-Run Accuracy
Concentration [ng·mL−1]Run 1
[%]
Run 2
[%]
Run 3
[%]
Run 4
[%]
Run 5
[%]
Run 6
[%]
Run 7
[%]
Run 8
[%]
40093.6101.1103.399.4104.7105.1100.297.7
250103.3101.395.198.793.1105.293.693.9
5106.795.493.9103.3105.6114.396.187.7
236.532.637.767.891.170.20.00.0
Table 3. Intraday precision. Coefficient of Variation (CV) for all samples from each day was calculated. Day 1 contains Run 1 and 2, day 2 contains Run 3 and 4, day 3 contains Run 5 and 6 and day 4 contains Run 7 and 8.
Intraday Precision
Concentration [ng·mL−1]CV Day 1
[%]
CV Day 2
[%]
CV Day 3
[%]
CV Day 4
[%]
4007.73.90.42.5
2502.03.712.20.3
511.19.68.09.1
211.557.026.0-
Table 4. Interday precision. Coefficient of Variation (CV) for all samples from day 1 to day 2 (intraday 1), day 2 to day 3 (intraday 2) and day 3 to day 4 (intraday 3).
Interday Precision
Concentration [ng·mL−1]CV Intraday 1
[%]
CV Intraday 2
[%]
CV Intraday 3
[%]
40010.411.87.0
2508.010.09.4
512.01.010.0
23.2149-
Table 5. Matrix effects for the high-QC and low-QC RD2 concentrations spiked to six different brain homogenates in triplicate. Average calculated concentration across the six homogenates for each replicate and its accuracy to the input concentration.
Matrix Effects
Concentration [ng·mL−1]Average Calc. Concentration [ng·mL−1]Accuracy [%]
400444.811.2
400445.911.5
400422.85.7
400407.01.7
400398.50.4
400363.49.2
55.11.1
55.713.8
55.611.9
55.35.0
55.47.7
55.12.5
Table 6. Analysis of the stability of RD2 in brain homogenate under different sample processing conditions.
Stability
ConditionConcentration
[ng·mL−1]
Calc. Concentration
[ng·mL−1]
Stability
[%]
Freeze–Thaw400389.997.5
53.569.5
Benchtop400254.363.6
52.855.1
Long term400311.978.0
52.040.1
Autosampler400397.299.3
54.998.0
Table 7. Dilution integrity. Shown are the average concentrations after dilution of the 10× high and medium QC as well as the corresponding mean accuracy and the CV of the triplicates of each sample.
Dilution Integrity
SampleCalc. Concentration [ng·mL−1]Accuracy [%]CV [%]
10× high375.3−6.24.8
10× medium284.1+13.62.2
Table 8. Extraction recovery of RD2 QC samples in brain homogenate (n = 6).
RD2 Extracted from Mouse Brain HomogenateRD2 Spiked to Blank Mouse Brain Homogenate Extract
Nominal Concentration [ng·mL−1]40025054002505
Average [ng·mL−1]393.5243.34.9405.9260.55.7
Recovery [%]98.497.398.9101.5104.2113.7
Standard Deviation [ng·mL−1]32.210.00.929.315.01.0
Precision [%]8.24.119.27.25.818.3
Accuracy [%]−1.6−2.7−1.11.54.213.7
Table 9. Reanalysis of 9 samples. Relative difference in RD2 concentrations for nine samples measured six months after the initial analysis.
Incurred Sample Reanalysis
SampleCalc. Concentration
Study [ng·mL−1]
Average Calc. Concentration Study [ng·mL−1]Calc. Concentration
ISR [ng·mL−1]
Average Calc. Concentration [ng·mL−1]Difference Initial Analysis ISR [%]
112.8
13.2
12.4

12.8
10.6
10.5
10.5

10.5

−19.1
211.4
11.8
12.1

11.7
10.3
10.5
10.5

10.5

−11.9
312.0
12.0
11.9

12.0
10.5
10.5
10.5

10.5

−13.0
412.8
13.2
12.5

12.8
10.8
10.8
10.9

10.8

−16.7
513.0
13.8
12.4

13.1
10.9
11.1
10.9

11.0

−17.7
613.3
13.1
14.0

13.5
10.5
10.5
10.6

10.5

−24.5
713.4
13.2
13.1

13.2
10.4
10.4
10.6

10.4

−23.7
812.9
12.9
12.7

12.8
10.8
10.7
10.5

10.7

−17.0
912.6
12.2
12.0

12.3
10.6
10.4
10.4

10.5

−16.1
Disclaimer/Publisher’s Note: The statements, opinions and data contained in all publications are solely those of the individual author(s) and contributor(s) and not of MDPI and/or the editor(s). MDPI and/or the editor(s) disclaim responsibility for any injury to people or property resulting from any ideas, methods, instructions or products referred to in the content.