Article

Analytical Characterisation of Oat-Enriched Binary Composites of Wheat Flour and Their Processing Behaviour in Bread Making


1
Department of Food Science, Faculty of Agrobiology, Food and Natural Resources, Czech University of Life Sciences, 165 00 Praha-Suchdol, Czech Republic
2
Faculty of Food and Biochemical Technology, University of Chemistry and Technology Prague, 166 28 Prague, Czech Republic
3
National Agricultural and Food Centre, Research Institute of Plant Production, 921 68 Piešťany, Slovakia
4
Department of Biotechnology, Faculty of Natural Sciences, University of Ss. Cyril and Methodius, 917 01 Trnava, Slovakia
*
Authors to whom correspondence should be addressed.
Analytica 2026, 7(1), 10; https://doi.org/10.3390/analytica7010010
Submission received: 22 December 2025 / Revised: 10 January 2026 / Accepted: 15 January 2026 / Published: 20 January 2026
(This article belongs to the Section Chemometrics)

Abstract

Oats (Avena sativa L.) are a rich source of β-d-glucans, dietary fibre, proteins, and lipids. However, the behaviour of these components in wheat–oat composite systems during baking, particularly with regard to matrix-dependent analytical responses, remains unclear. This study evaluated the compositional changes, technological performance, and sensory quality of wheat bread enriched with various forms of oat. Composite flours containing 5–15% wholegrain oat flour, commercial oat bran, milled commercial oat flakes, or milled sprouted oat grain (sprouted under laboratory conditions for three days at 25 °C) were prepared using the Slovakian oat cultivar ‘Peter’. The raw materials, flour blends, and baked breads were analysed for β-d-glucans (BG), total dietary fibre (TDF), starch, proteins, and lipids using standardised enzymatic, gravimetric, and polarimetric methods. Bread quality was assessed through loaf volume measurements and a sensory evaluation using a 5-point hedonic scale by seven trained panellists. Multivariate statistical analysis was applied to integrate compositional, technological, and sensory data. Compared to wheat flour (0.24% BG and 3.45% TDF), the incorporation of oats significantly increased the contents of BG, TDF, proteins, and lipids, with oat bran showing the strongest enrichment effect (owing to 15.69% TDF in the raw material). Baking induced oat-form-dependent changes in the measured BG and TDF content. The level of BG diminished in wholegrain oat blends but increased or remained stable in bran-rich systems. This reflects differences in matrix structure and analytical extractability, rather than true compositional gains. Meanwhile, starch content consistently declined across all composite breads. Fibre-rich formulations exhibited reduced loaf volume and altered both bread geometry and morphology, particularly at 15% substitution. Breads containing 5% oat flour or moderate levels of oat bran (5 or 10%) were considered the most acceptable in terms of nutritional enhancement and quality attributes. Germinated oat breads showed the greatest technological impairment and the lowest sensory scores. Overall, moderate oat enrichment strikes a balance between nutritional improvement and technological performance without significantly compromising sensory quality. These findings emphasise the significance of matrix effects when interpreting standard total dietary fibre and β-d-glucans analyses and offer an integrated analytical and technological framework for the rational design of fibre-enriched cereal products.

1. Introduction

The oat (Avena sativa L.) is increasingly recognised as a cereal with significant nutritional value due to its high protein content, its high content of unsaturated fatty acids, and its high dietary fibre content, particularly β-d-glucans (BG) [1,2]. In addition to these primary constituents, oats contain secondary metabolites that are relevant from a physiological perspective, such as the antioxidant-active compounds known as avenanthramides [3,4]. Continuous research has identified bioactive molecules and extraction strategies relevant to the development of functional foods [5,6,7].
A major nutritional advantage of oats lies in their protein composition. Unlike wheat and related cereals, oats contain storage proteins of predominantly globulin type, with a favourable essential amino acid profile and higher levels of lysine [8,9]. The lipid fraction comprises both neutral and polar lipids that exhibit antioxidant and emulsifying properties [10,11,12,13]. However, the high activity of endogenous lipolytic enzymes requires stabilisation through heat treatment to prevent hydrolysis and oxidation during storage [14,15].
Oats are also an important source of total dietary fibre (TDF), which includes insoluble fibre (IDF) and soluble fibre fractions (SDF). The composition and content of these fractions vary depending on the cultivar and processing method used, which in turn influence both the physiological and functional properties [16,17]. Dietary fibre contributes to the water binding of flour, the rheology of aqueous dispersion or dough, and the sensory properties of the final product; thus, it is widely used in the development of functional cereal products [18,19]. Among the fibre components, BG is particularly of importance. Their concentration varies from 1.8 to 7.0% across different oat cultivars [20,21], and their physiological effects depend on factors such as molecular weight, conformation, and viscosity in water [22,23,24,25].
The target polysaccharides BG have been linked to a reduced glycaemic response, lower cholesterol levels, modulation of the immune system, anti-inflammatory effects, and antioxidant activity [26,27], corresponding to the internal conformation. They also exhibit prebiotic properties and influence gut microbial metabolism [28,29].
Technological processing has a significant impact on the structure, solubility, and extractability of oat fibre components. Germination, fermentation, thermal treatment, and extrusion can alter the molecular weight of BG, their depolymerisation kinetics, and their interactions with the matrix [30,31,32,33]. During fermentation and baking, endogenous cereal enzymes can partially degrade polysaccharides, including BG, thereby reducing their molecular weight and influencing their physiological and functional properties [34,35,36]. The extent of these modifications depends strongly on the food matrix and the intensity of the raw material processing.
In wheat-based systems, incorporating oat fractions markedly affected dough water absorption, rheology, and bread quality. Oat flour, flakes, and bran increase hydration requirements and often reduce loaf volume at higher substitution levels [37,38]. However, these ingredients also enhance the nutritional value of bread by increasing just fibre and BG content [39,40,41]. While many studies have examined the effects of individual oat forms and fractions, few have only compared the impact of oat flour, bran, flakes, and germinated grain in a standardised study. Even fewer have combined nutritional profiling with the evaluation of processing effects and analytical behaviour in composite flour systems.
This represents a significant analytical gap and research opportunity. Standard enzymatic and AOAC methods for determining BG and total fibre have been primarily validated for relatively simple cereal matrices. The efficiency, robustness, and metrological accuracy of their extraction in composite wheat–oat systems with different processing histories (e.g., germination, fermentation, and baking) are not well described. Therefore, it is unclear the extent of the following: (i) reflecting the true composition in measured values; and (ii) influence of the matrix heterogeneity—alterations in macromolecular architecture propagate to changes in solubility, enzymatic activity, etc. Furthermore, the extent to which individual oat fractions differ in their analytical response and measurability after baking has not been systematically examined. Clarifying these matrix-dependent differences is essential for both cereal chemistry and the rational development of functional foods. Without such data, it is challenging to accurately assess the nutritional impact of various oat ingredients due to methodological and matrix effects that confound comparisons across studies. We hypothesise that the morphological and structural characteristics of oat components (flour, flakes, bran, and germinated grain) have a differential effect on the analytical accessibility of TDF and BG. This leads to apparent differences after thermal processing that reflect matrix-dependent analytical recovery rather than true compositional changes. Oat germination is associated with significant enzymatic and structural changes that may affect the accessibility of TDF and BG for analysis. The impact of these changes within oat composite systems after processing remains insufficiently explored.
The oat ingredients were selected to represent different material states, rather than to maximise compositional differences. Wholegrain flour, bran, flakes, and germinated grain differ primarily in terms of structural integrity and enzymatic modification, factors that affect hydration, enzyme accessibility, and polysaccharide extractability. A substitution level of 5–15% was defined as a technologically relevant range, allowing the assessment of structural and matrix effects without the introduction of significant processing artefacts or quality loss.
This study aims to comprehensively characterise the nutritional composition of wheat flour, commonly used oat forms, and their wheat–oat composite flours; it quantifies changes in major components, particularly BG, before and after baking; and evaluates differences in analytical response across matrices using identical standardised procedures. The goal is to describe the matrix effects; this study therefore provides the necessary data for the rational optimisation of functional bakery products, deepening our understanding of the limitations and capabilities of routine analytical methods for determining fibre and BG in technologically heterogeneous cereal systems.

2. Materials and Methods

2.1. Oat Cultivar and Derived Fractions

The selected oat ingredients—flour, flakes, bran, and germinated grain—were chosen to represent various levels of structural integrity and processing intensity relevant to cereal and bakery applications.
A set of 100 oat cultivars (Avena sativa L.), screened within the APVV-17-0113 project at the Vígľaš-Pstruša Breeding Station (Detva, Slovakia), was evaluated for TDF, BG, starch, protein, and lipid contents. The Slovak, yellow-hulled cultivar ‘Peter’ was selected, and dehulled grains produced at the same site (National Agricultural and Food Centre—Research Institute of Plant Production, Piešťany, Slovakia) were used to prepare wholegrain oat flour and germinated (sprouted) grain. Wholegrain flour was obtained by grain milling to a uniform particle size (ZM 100 ultra-centrifugal mill, Retsch GmbH., Haan, Germany). Germinated oat grains were prepared by soaking in distilled water for 12 h, incubating at 25 °C in darkness for 3 days with daily rinsing, and then finalised by drying and milling using the same device.
Commercial fine oat flakes (Mlyn Štúrovo, Štúrovo, Slovakia) and oat bran (Country Life, Prague, Czech Republic) were milled and sieved through a 0.5 mm screen using a ZM 100 ultra-centrifugal mill and a KS 1000 vibratory sieve shaker (Retsch GmbH., Haan, Germany). All oat materials were stored in sealed containers at 18 °C in darkness till further tests. Refined white wheat flour (WF), produced by commercial company Mlyn Pohronský (Ruskov, Slovakia), served as the control. Listed oat forms are coded as OFLO for the oat wholegrain flour (manufactured from a natural, non-treated grain), OB for the oat bran, OFLA for the oat flakes flour, and OSG for the germinated oat wholegrain flour, respectively. Composite wheat–oat flours were prepared by substituting wheat flour with 5, 10, or 15% (w/w) of the four supra-listed oat forms (wholegrain oat flour, bran, milled flakes, or germinated oat wholegrain flour) selected to ensure technological feasibility and comparability across all composite systems. All flour binary blends were homogenised horizontally on the BS–P06 device (Mezos, Hradec Králové, Czech Republic), pre-set to 100 RPM and 30 min. In cases of discussion of the results related to the breads (baked forms of the control WF and the blends WF + OFLO, … WF + OSG, letter ‘b’ was appointed (e.g., WF + 5OFLAb). After baking and sensory evaluation, the loaves were cut into 1 × 1 cm cubes manually and dried at 21 °C for 3 days, turning them twice a day to prevent uneven drying and mould formation. After drying, they were ground in a mill under the same conditions as other oat ingredients and stored similarly until the date of analysis. All plant samples (control flour, oat ingredients, flours, and loaves) were analysed using the same procedures and under the same conditions.

2.2. Considered Samples Analytes

Moisture was determined in duplicate using a semi-automatic moisture analyser (MA 45, Sartorius, Göttingen, Germany). The sample was dried at 110 °C until a constant weight was achieved, following the gravimetric AOAC Official Method 925.10 [42].
Protein content was measured in duplicate using a TruMac CNS analyser equipped by the Cornerstone software version 3.1.0 (LECO Corporation, St. Joseph, MI, USA), based on the Dumas method. Approximately 200 mg of homogenised samples were combusted, total nitrogen was quantified, and converted to protein using ‘N-to-protein’ factors 5.70 for wheat and 5.83 for oat in accordance with AOAC Official Method 992.23 [43].
The target polysaccharides BG were quantified enzymatically using the Mixed-linkage β-glucan Assay Kit (K-BGLU, Megazyme, Wicklow, Ireland) following the AOAC Official Method 995.16 [44], based on the procedure by McCleary and Codd [45]. Reagents included lichenase, β-glucosidase, and GOPOD (glucose oxidase, peroxidase, 4-aminoantipyrine). For each analysis, 100 mg of homogenised samples were suspended in 50% ethanol and 20 mM sodium phosphate buffer (pH 6.5), heated in a boiling water bath, and then incubated with lichenase at 50 °C. After dilution in 50 mM sodium acetate buffer (pH 4.0) and centrifugation (Universal 320R, Hettich Holding GmbH. & Co. KG, Kirchlengern, Germany), aliquots were incubated with β-glucosidase. Released d-glucose was quantified spectrophotometrically at 510 nm (SPEKOL 11, Carl Zeiss, Jena, Germany). The content of BG was expressed as a percentage of dry matter using a d-glucose standard.
The analyte TDF was determined using the enzymatic–gravimetric method according to AOAC Official Method 991.43 [46] using the Megazyme Total Dietary Fibre Assay Kit (K-TDFR, Megazyme, Wicklow, Ireland). Samples (1.0 g, in duplicate) were digested sequentially with thermostable α-amylase (100 °C), protease (60 °C), and amyloglucosidase in MES/TRIS buffer. Ethanol (96%, 60 °C) was added to precipitate the fibre. The residue was filtered through Celite-coated crucibles (Celite; Centralchem, Bratislava, Slovakia), washed with 78% and 96% ethanol and acetone, and dried at 103 °C in a laboratory oven (Memmert GmbH + Co. KG, Schwabach, Germany). The final residue was weighed and corrected for protein content, which was determined by the Dumas combustion method in accordance with AOAC Official Method 992.23 [43] using a TruMac CNS analyzer (LECO Corporation, St. Joseph, MI, USA).
Lipids were extracted using a hexane-based protocol adapted from Letellier and Budzinski [47] and Mandal et al. [48]. Briefly, 5.00 ± 0.01 g of sample was extracted in duplicate with n-hexane (Labo SK, Bratislava, Slovakia) under vigorous shaking, followed by centrifugation. The extracts were filtered through anhydrous sodium sulphate and evaporated to dryness using a rotary evaporator (Laborota 4001, Heidolph Instruments GmbH & Co. KG, Schwabach, Germany). Lipid content was expressed as a percentage of dry matter.
Total starch was determined polarimetrically using the Ewers method in accordance with ISO 10520:1997 [49]. The milled sample (5.00 ± 0.01 g) was hydrolysed with diluted HCl, clarified with Carrez solutions I and II, filled to 100 mL, and filtered. Optical rotation was measured at 20 °C in a 200 mm tube (P 3001RS polarimeter, A. Krüss Optronic, Hamburg, Germany). Starch content was calculated using conversion factors of 5.47 for wheat and 5.51 for oats [49].

2.3. Preparation of Breads in a Semi-Industrial Regime

Bread dough variants were prepared from 250.00 g WF or binary blend, 12.50 g retail compressed baker’s yeast (Saccharomyces cerevisiae; commercial), 3.75 g kitchen salt, 2.50 g sugar, and 2.50 g commercial pork lard (ingredients as 5.0, 1.5, 1.0, and 1.0 wt.% of the WF basis, respectively). Water addition was adjusted according to the farinograph absorption (Farinograph-E, Brabender, Duisburg, Germany). Doughs were mixed in an RM 800 A-B mixer (Gastrolux, Ryomgaard, Denmark), fermented for 30 min at 32 °C and 80% RH in a BT 12 thermostat (1-CUBE, Havlíčkův Brod, Czech Republic), and divided into five pieces of the same weight. Moulding was carried out manually into small, rounded breads (buns) and proofed for 25 min at 32 °C and RH 70–80% in the above-mentioned device.
Buns were baked in a steam-injected deck oven (DOMINO, Bratislava, Slovakia) at 230 °C for 15 min and cooled down freely to room temperature for 2 h. Buns’ weight was recorded, and volume was determined by the rapeseed displacement method to express the specific bread volume (internal repeatability ± 15 cm3∙100 g−1); the sensory evaluation followed. The sensory evaluation was conducted in accordance with the general recommendations for sensory testing environments, under controlled conditions ISO 8589:2007 [50], although the choice of hedonic scale and panel size followed study-specific design considerations. A trained sensory panel (N = 7), composed of assessors with long-term experience in bread quality evaluation, evaluated bread profiles using a five-point hedonic scale (1 pt.—the worst, 5 pt.—the best score) for 12 descriptors in total. Panellists were regularly trained persons and ‘calibrated’ using a reference bread sample before each of four evaluations. The simplified scale was chosen to facilitate practical interpretation in a technological context, which was considered sufficient for a trained panel. Samples were coded, evaluated under standardised laboratory conditions, and presented in a fixed order to ensure comparability. Assessed attributes included the bread’s overall appearance and shape, crust attributes (colour, thickness, and hardness), and the crumb ones (aroma, taste, elasticity, porosity, colour, firmness, and stickiness of mouthful), plus the overall impression. The partial results were summed into the 12th parameter sensory score (profile), i.e., to a point sum of all 11 attributes in a range of 15 to 55 pts. Considering the maximum of 55 pts. as the optimal quality, a relative comparison of the alternative products against the wheat control by the sensorial acceptability index was also carried out.

2.4. Statistical Analysis

Data were analysed using IBM SPSS Statistics v. 22. Descriptive analysis of variance (three-factor ANOVA) was applied to reveal the differences in single quality parameters statistically, and Tukey’s HSD test was used for such post hoc comparisons (p = 95%). The considered factors were the Oat form (OFLO, OB, OFLA, OSG) and Oat addition as the WF replacement (0, 5, 10, or 15%) plus the Physical stage of flour (unbaked ~ natural, baked ~ bread). For an illustration of overall data dissimilarity among the main sample groups WF, WF + OFLO, … WF + OSG, WFb, WF + OFLOb, …, and WF + OSGb, the factor Oat addition was suppressed in the second ‘groups’ ANOVA calculation. In tables, all items of the ANOVA significance longer than 3 letters were shortened to the first and the last letter (e.g., samples cluster ‘ab’ or ‘abc’ was maintained, but ‘abcd’ was shortened to ‘a-c’; for the ‘groups’ two-factor ANOVA, similarly, ‘ABCD’ was shortened to ‘A-D’).
Relationships among variables (the quality parameters) were described by a correlation matrix (p = 95%); the ones between the variables and cases (the samples tested) were explored using Principal Component Analysis, in which both plots of variable scores and sample loadings were constructed. In the PCA plots, a system of concentric circles was newly applied to allow a rough estimation of the statistical importance of the variables or the statistical similarity (inter-closeness) of the samples tested.

3. Results

3.1. Composition of Raw Materials

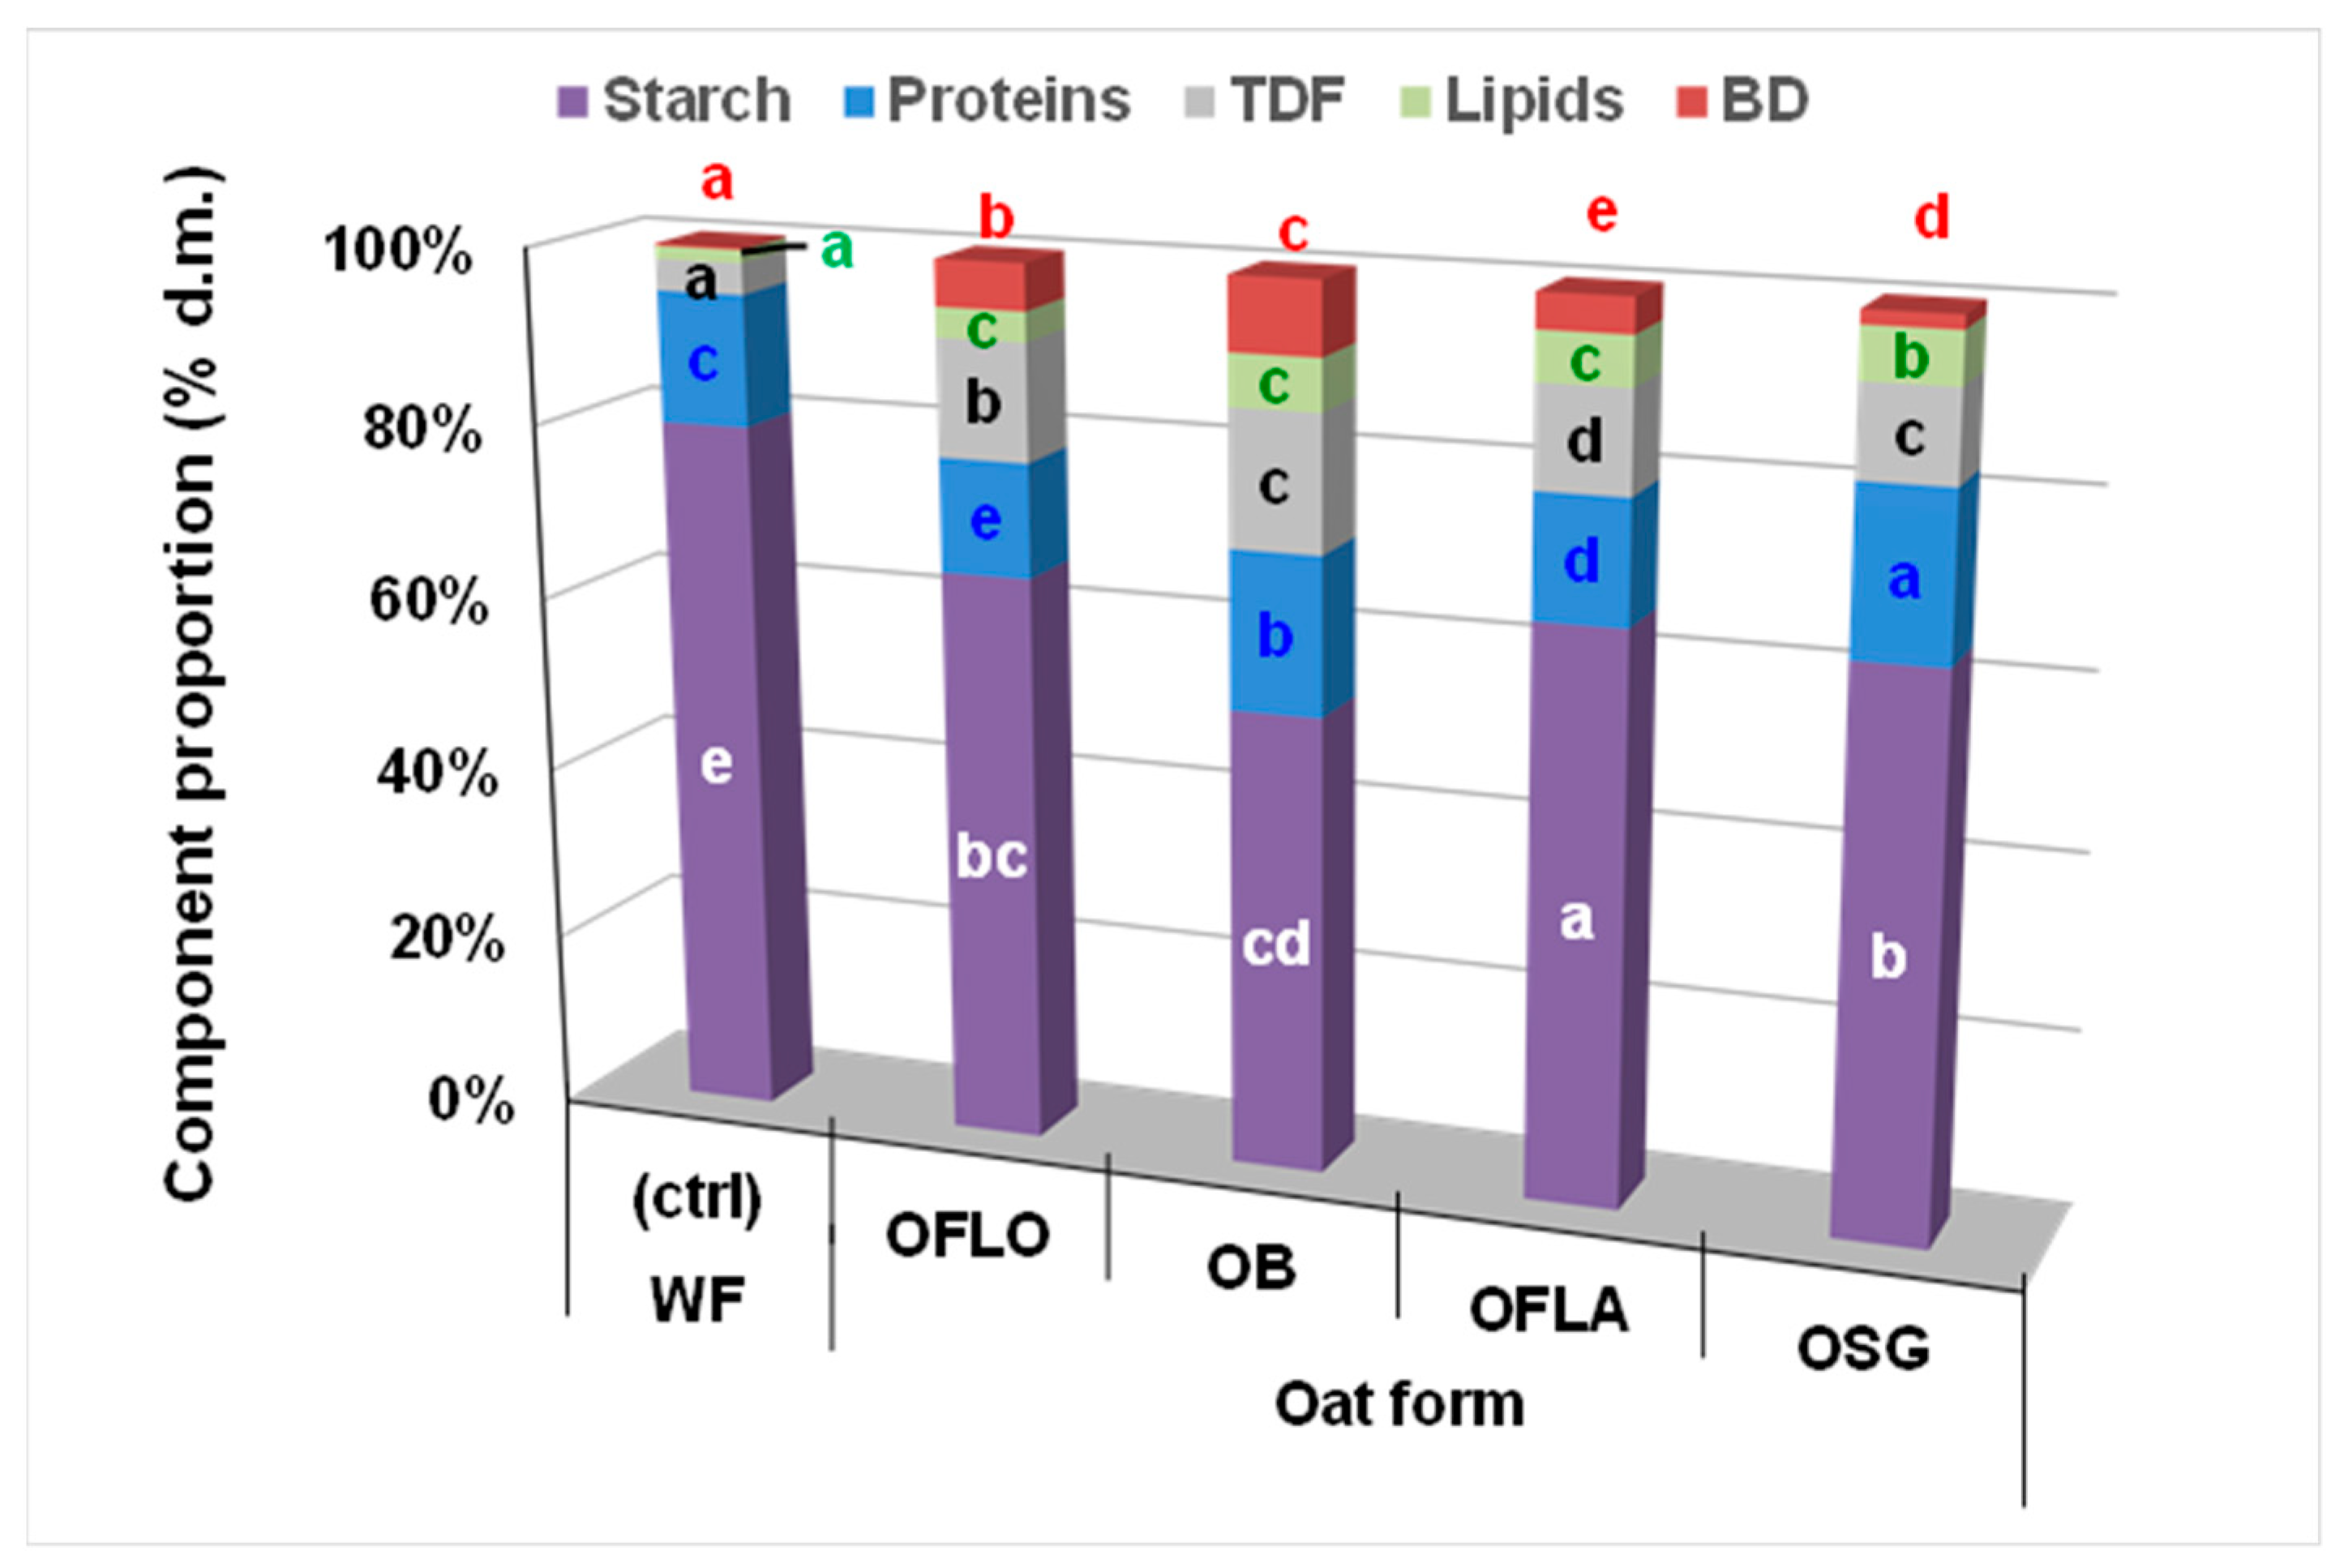
The wheat flour control contained 0.24% β-d-glucans (BG), 3.45% total dietary fibre (TDF), 1.45% lipids, 78.28% starch, and 14.74% protein (dry matter basis; Figure 1, Table 1). In contrast, all oat-derived raw materials exhibited substantially higher BG, TDF, and lipid contents, accompanied by markedly lower starch concentrations (Figure 1, Table 1).
Among the oat fractions, oat bran had the highest BG content (8.19%), followed by wholegrain oat flour (4.97%), oat flakes (3.97%), and germinated oat flour. Contents TDF ranged from 10.11% in germinated oat flour to 15.69% in oat bran, representing a three- to fivefold increase compared to wheat flour. Lipid content ranged from 3.22% to 5.81%, again exceeding the control value. Conversely, starch concentrations were logically the lowest in oat bran (51.17%), ranging between approximately 62% and 65% in the remaining oat forms. Protein content varied from 12.28% in wholegrain oat flour to 18.68% in germinated oat flour, indicating substantial compositional modification during germination (Figure 1, Table 1).
These pronounced differences establish compositionally distinct analytical matrices, particularly in terms of fibre enrichment, starch dilution, and lipid co-occurrence, which underpin the behaviour of composite flours and breads examined below.

3.2. Total Dietary Fibre (TDF) in Composite Flours and Breads

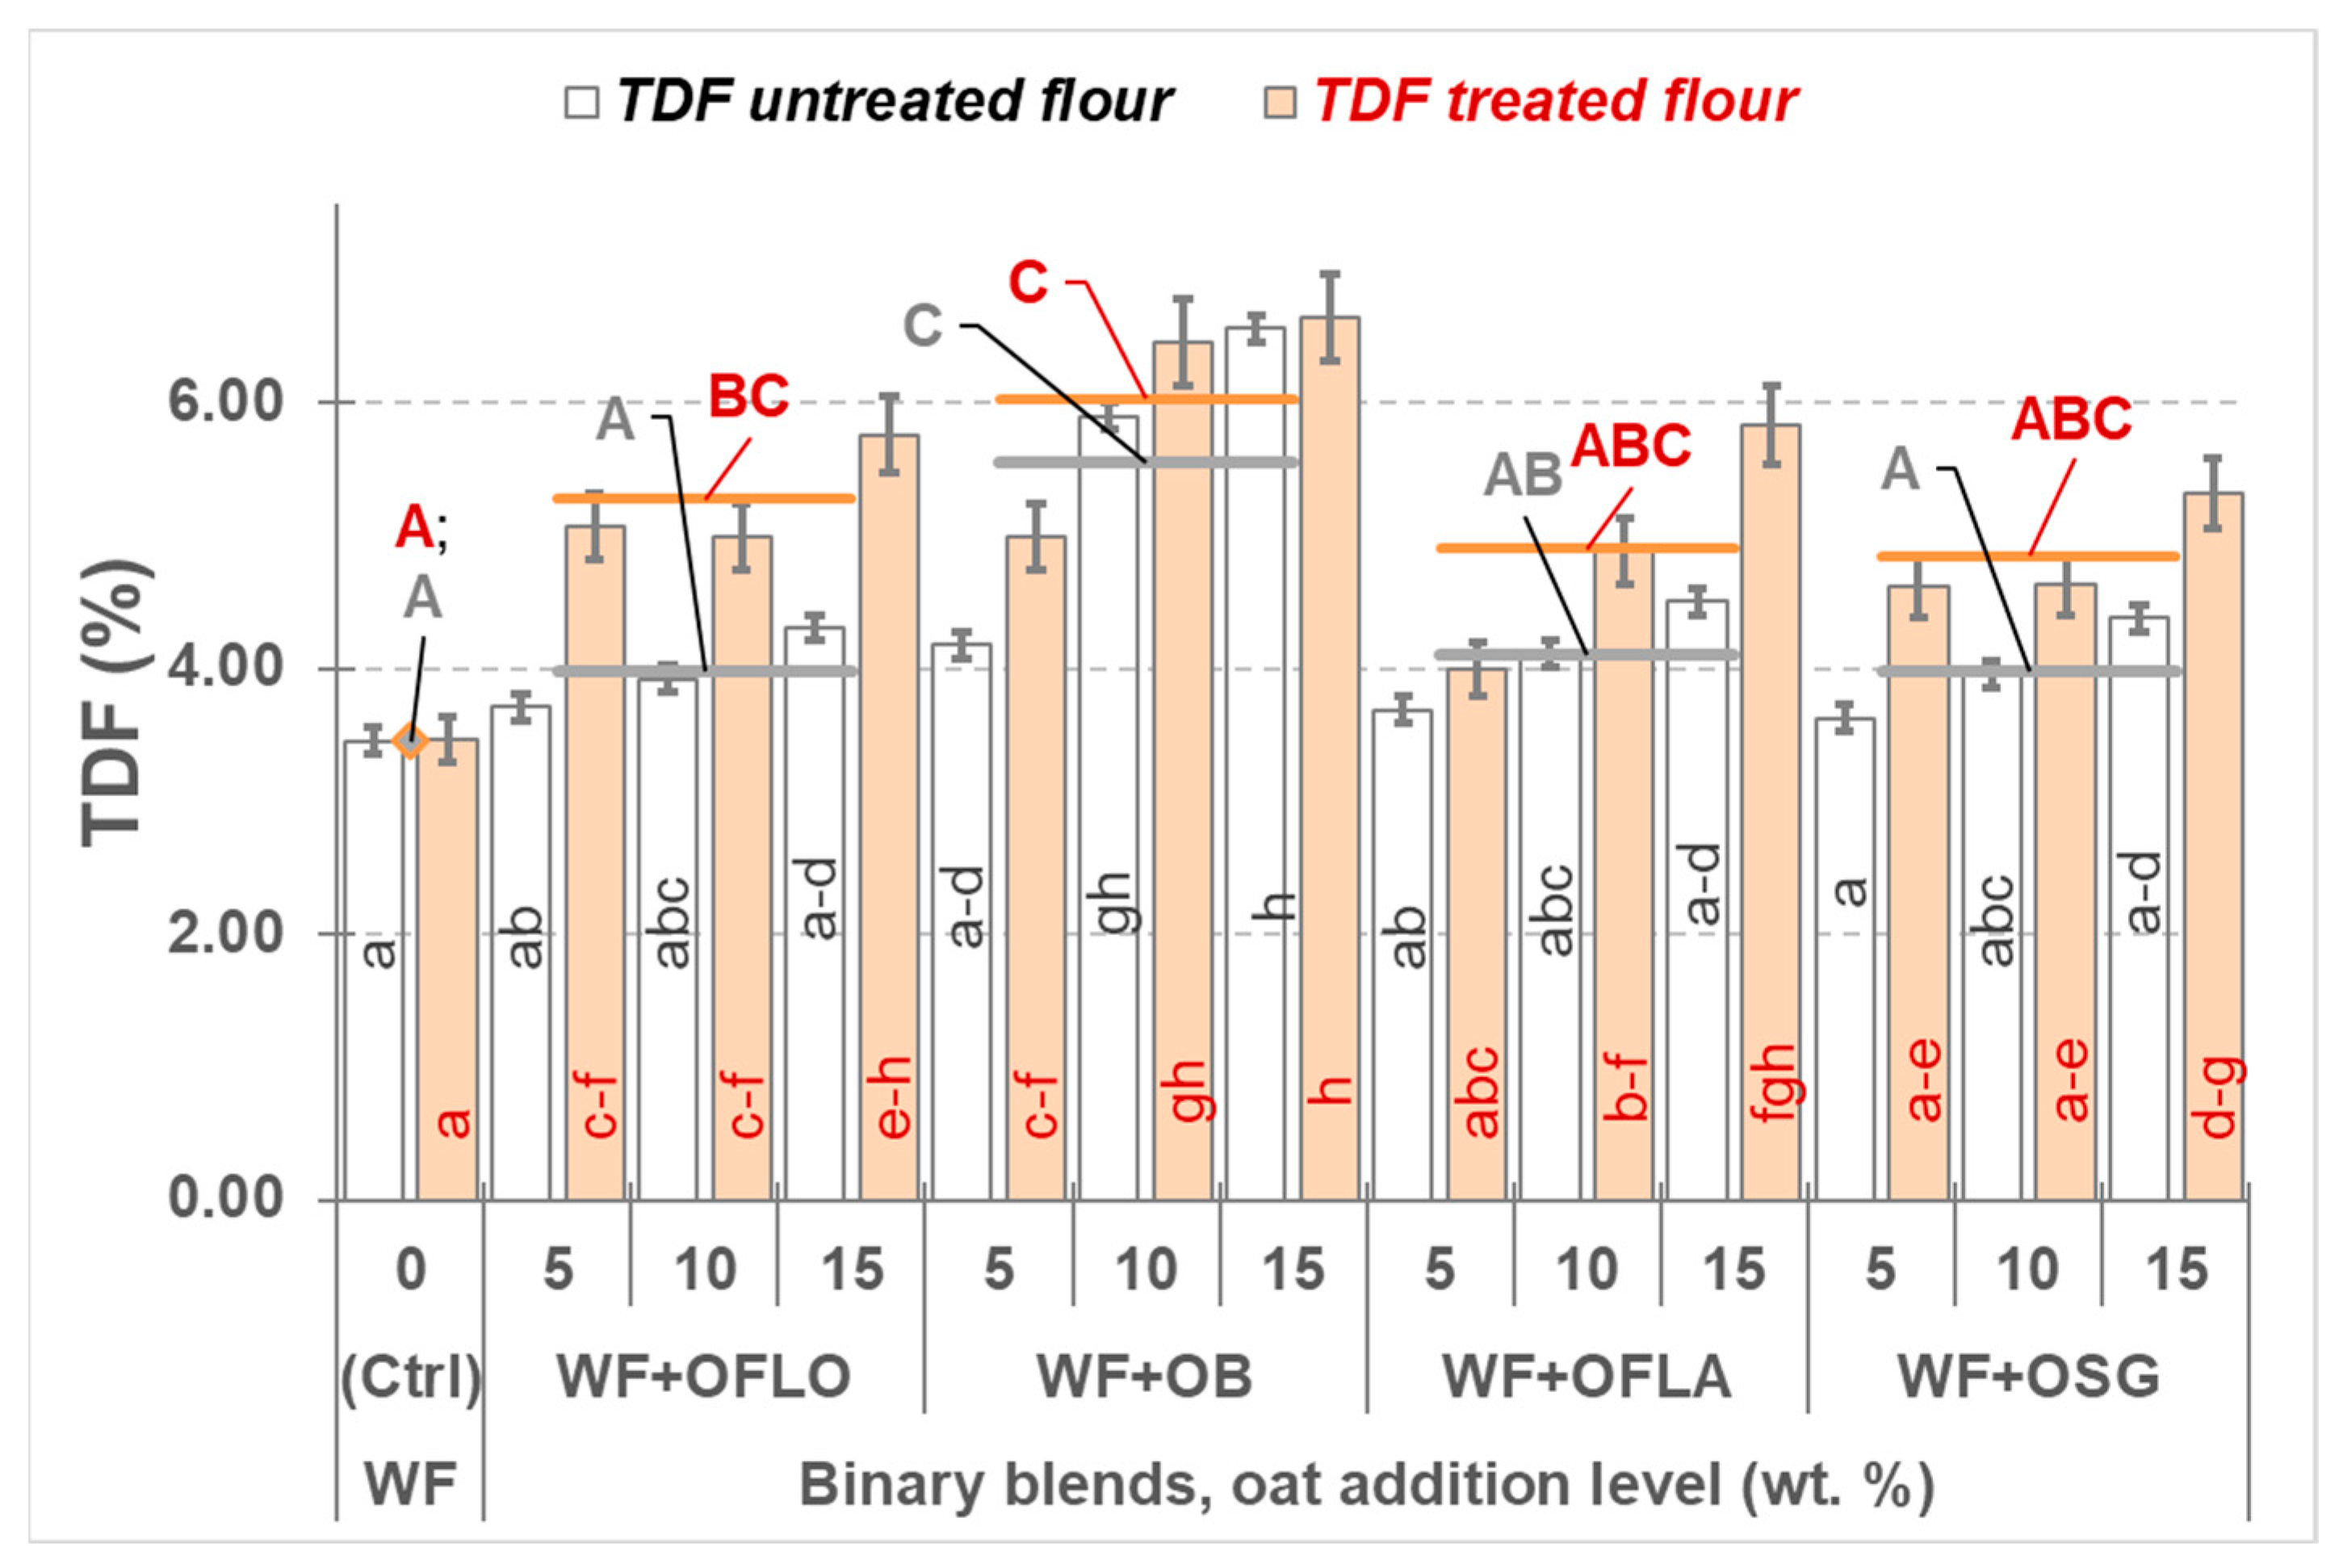
The TDF content of all composite flours increased significantly compared with wheat flour (Figure 2). The highest value was observed in the formulation containing 15% oat bran (TDF 6.56%) in agreement of the lowest starch content in this form of oat. Positively, baking did not alter the TDF content of the wheat control flour (3.45%), suggesting that thermal treatment alone does not affect the refined wheat matrix.
In contrast, several composite systems exhibited higher TDF proportions after baking than in the corresponding flour blends. This effect was most pronounced in the formulation containing 15% wholegrain oat flour, where TDF increased from 4.31% to 5.76%. Oat bran produced substantial TDF enhancement from 10% substitution onwards, both before and after baking. Oat flakes and germinated oat flour resulted in smaller increases at low inclusion levels. However, formulations containing 10 or 15% oat bran showed clear and statistically significant TDF enrichment, with baking accentuating the differences relative to the control formulation (Figure 2).
Flour TDF was strongly correlated with bread TDF across all formulations (r = 0.85, p = 99.9%; § 3.6 Statistical Exploration of Data), indicating a close quantitative relationship between fibre levels in flour blends and the corresponding baked products.

3.3. β-d-Glucans in Composite Flours and Breads

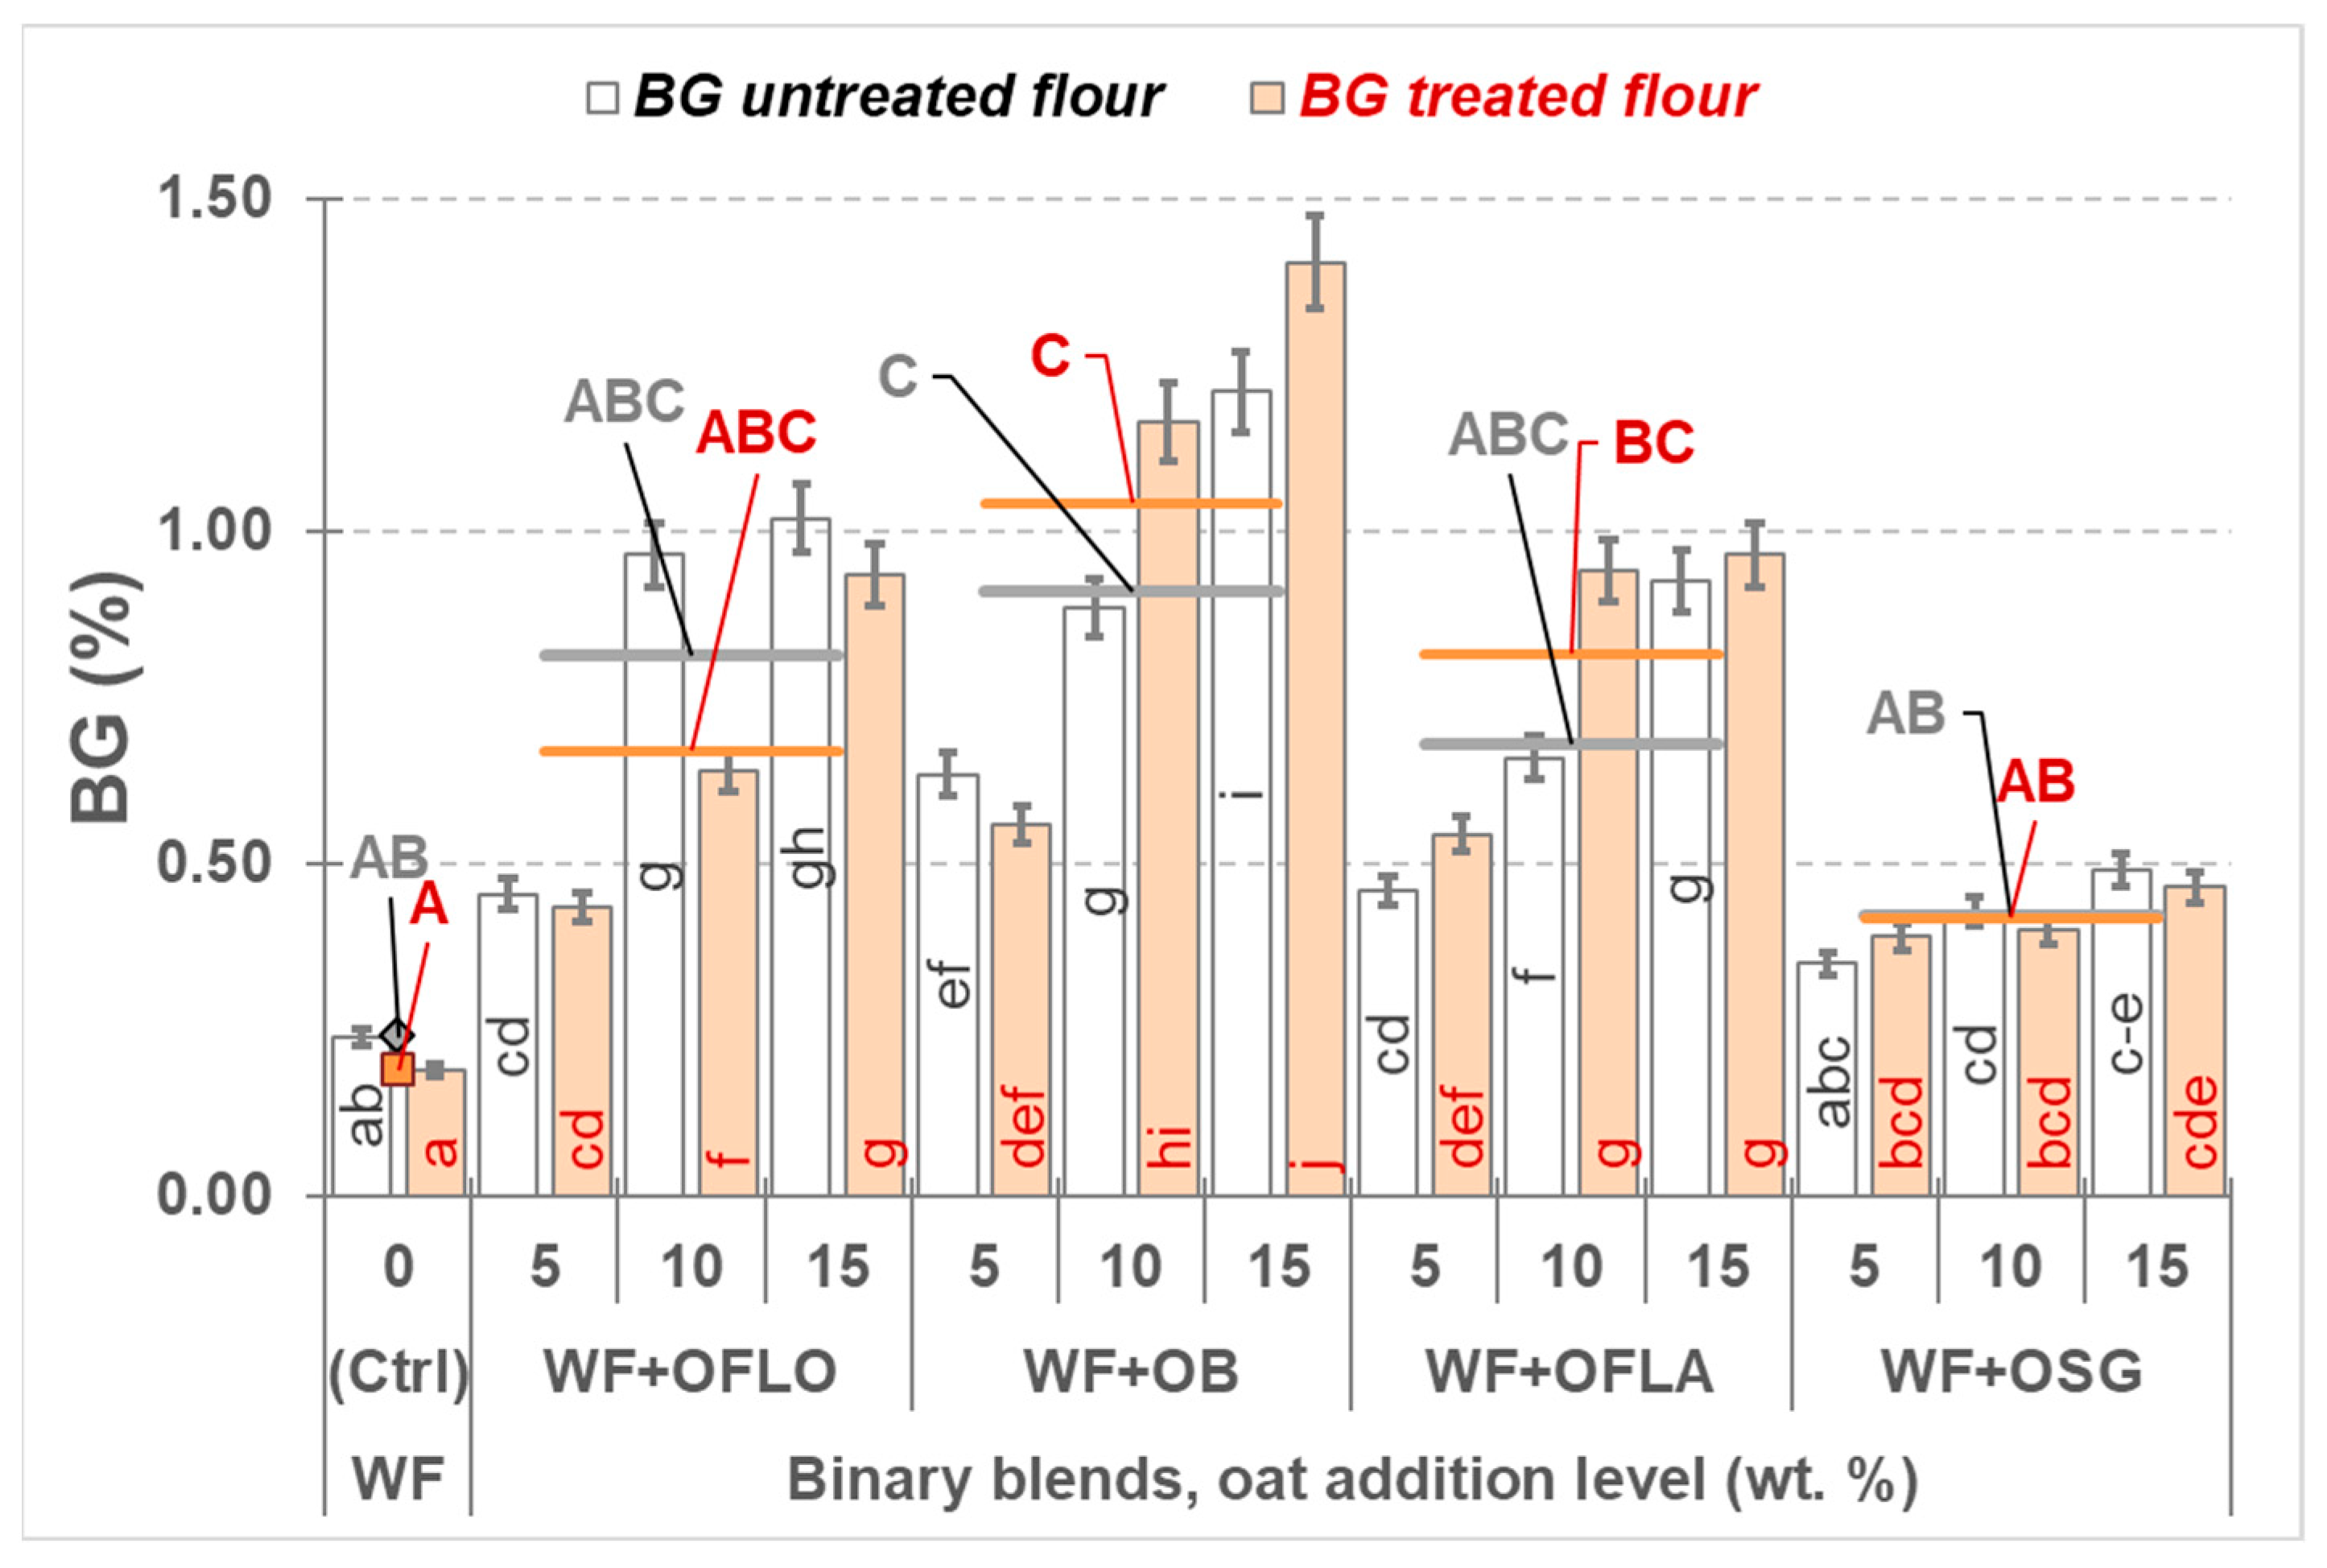
The addition of oat fractions at levels of 5–15% significantly increased the measured BG content of composite flours compared to wheat flour (Figure 3), with values ranging from 0.45% to 1.21% prior to baking. The highest enrichment was consistently observed in the 15% oat bran formulation, similarly to the case of TDF.
In the wheat control, baking caused only a minor, non-significant reduction in BG content (from 0.24% to 0.19%), indicating limited thermal effects on BG recoverability in the refined wheat matrix. In composite systems, the response to baking was strongly fraction-dependent. Wholegrain oat flour blends showed consistent decreases in measured BG after baking across all inclusion levels. In contrast, wheat–oat bran blends exhibited a nonlinear response, with reduced BG at 5% substitution and increased measured BG at 10% and 15% substitution. Oat flake blends showed stable or slightly increased BG values after baking, whereas germinated oat blends exhibited minor decreases at higher substitution levels and a slight increase at 5% substitution (Figure 3).
Flour BG content was strongly correlated with bread BG and negatively correlated with specific bread volume (r = 0.89 and r = −0.75, respectively; p = 99.9%; § 3.6). Our results highlight the close relationship between bread’s technological performance and its BG enrichment.

3.4. Macronutrient Composition of Composite Flours and Breads—Starch, Protein, and Lipids

The incorporation of oat-derived fractions substantially altered the macronutrient composition of composite flours and breads compared to the wheat control (Table 1). Across all formulations, the starch content decreased due to dilution by non-starch components. Baking reduced the starch content of the wheat control from 78.28% to 71.71% (Table 1). In wholegrain oat flour blends, the starch content generally diminished with increasing substitution, although a slight numerical increase was observed at a 15% substitution compared to 10%. Oat bran formulations exhibited the lowest starch content consistently, while germinated oat blends showed pronounced reductions in starch content from ≥10% substitution onwards, which persisted after baking (Table 1). Flour starch content was negatively correlated with flour TDF and BG (r = −0.71 to −0.77, p = 99.9%) and positively correlated with specific bread volume (r = 0.60, p = 99%). This suggests that starch dilution is a factor in determining technological performance.
The protein content increased in most composite flours, particularly in those containing wholegrain oat flour, oat bran, and germinated oat flour. The highest value was observed in the formulation containing 15% wholegrain oat flour (14.90%; Table 1). Baking induced formulation-specific changes without a consistent directional trend. Significant protein enrichment relative to the control occurred in oat bran and germinated oat blends with ≥ 10% substitution; however, oat flake blends consistently exhibited lower protein content (Table 1). Flour protein content was negatively correlated with bread shape (h/d; r = −0.60, p = 99%) and sensory acceptability (r = −0.44, p = 95%).
Lipid content increased in all composite flours compared to the wheat control, with the greatest enrichment observed in oat bran and germinated oat flour blends (Table 1). Baking slightly increased the lipid content of the control flour, whereas lipid concentrations decreased after baking in the wholegrain and germinated oat blends, though they remained above control values. Oat bran breads retained the highest lipid content after baking at 15% substitution (Table 1). Flour lipid content showed a strong positive correlation with flour BG (r = 0.78, p = 99.9%) and a negative correlation with specific bread volume (r = −0.42, p = 95%), suggesting an interplay between lipid-rich fractions and fibre-driven technological properties. All supra mentioned correlations are summarised into the correlation matrix (§ 3.6).

3.5. Baking Trial Results and Sensory Evaluation

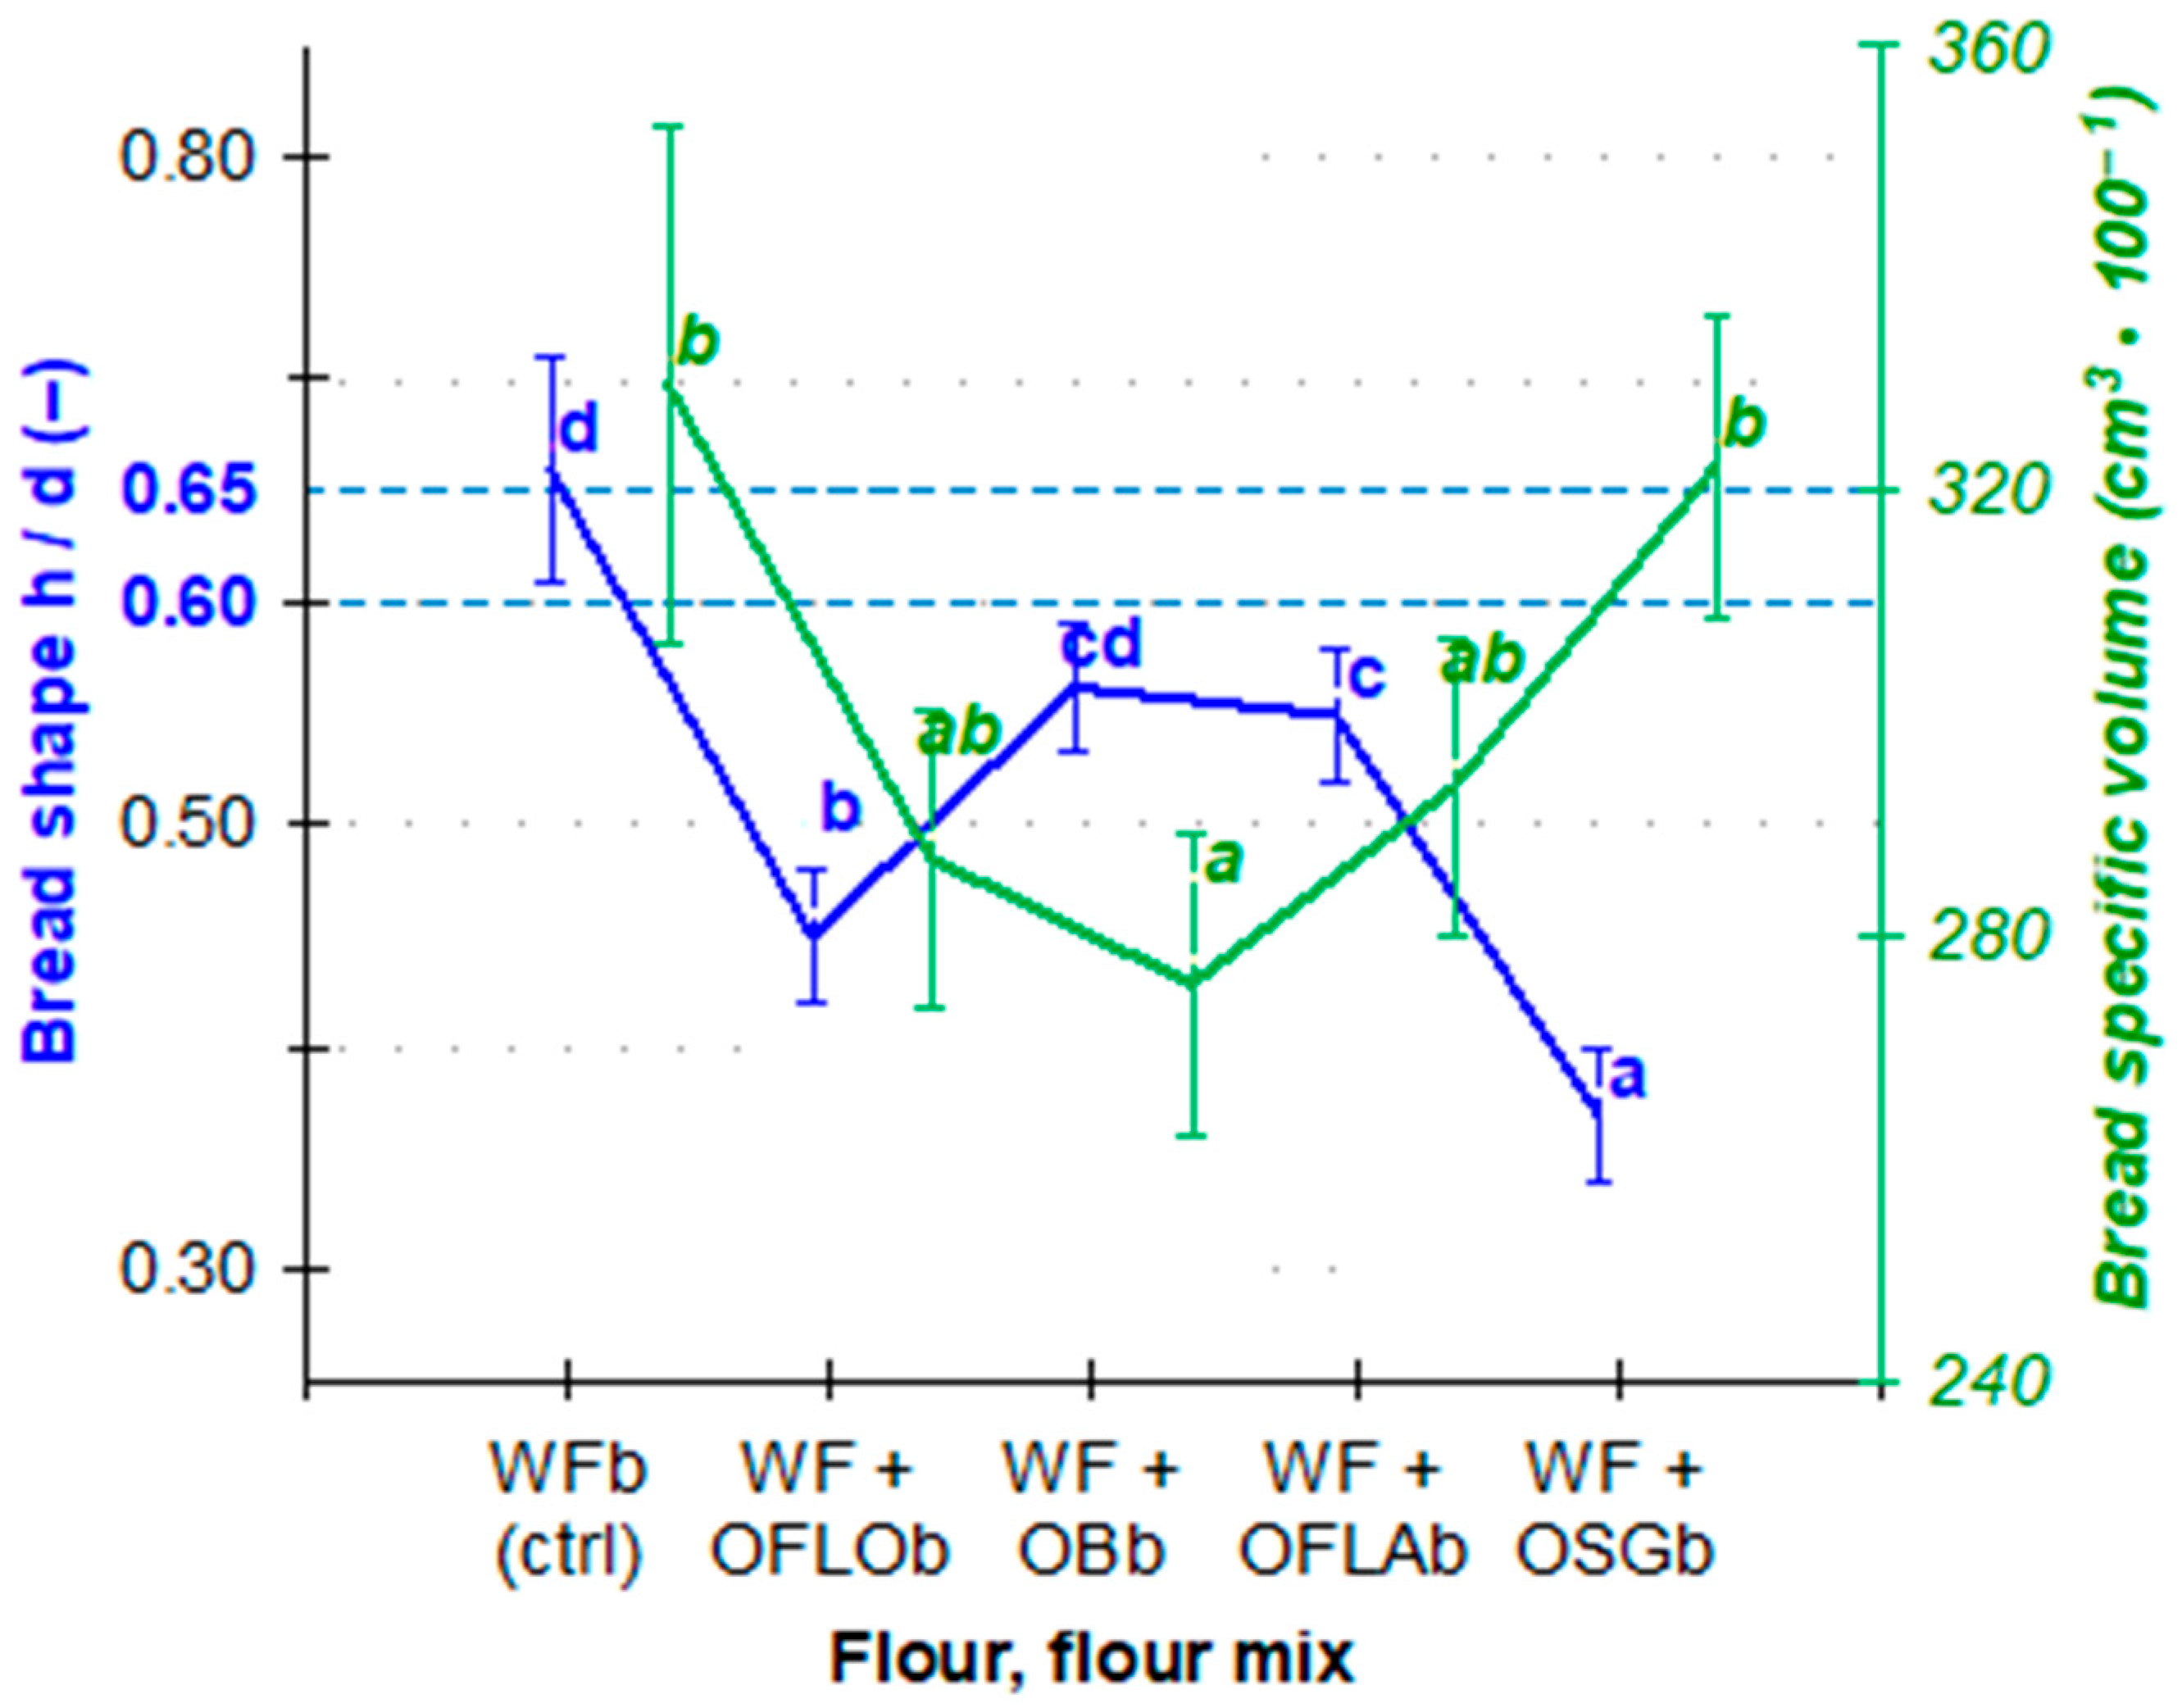
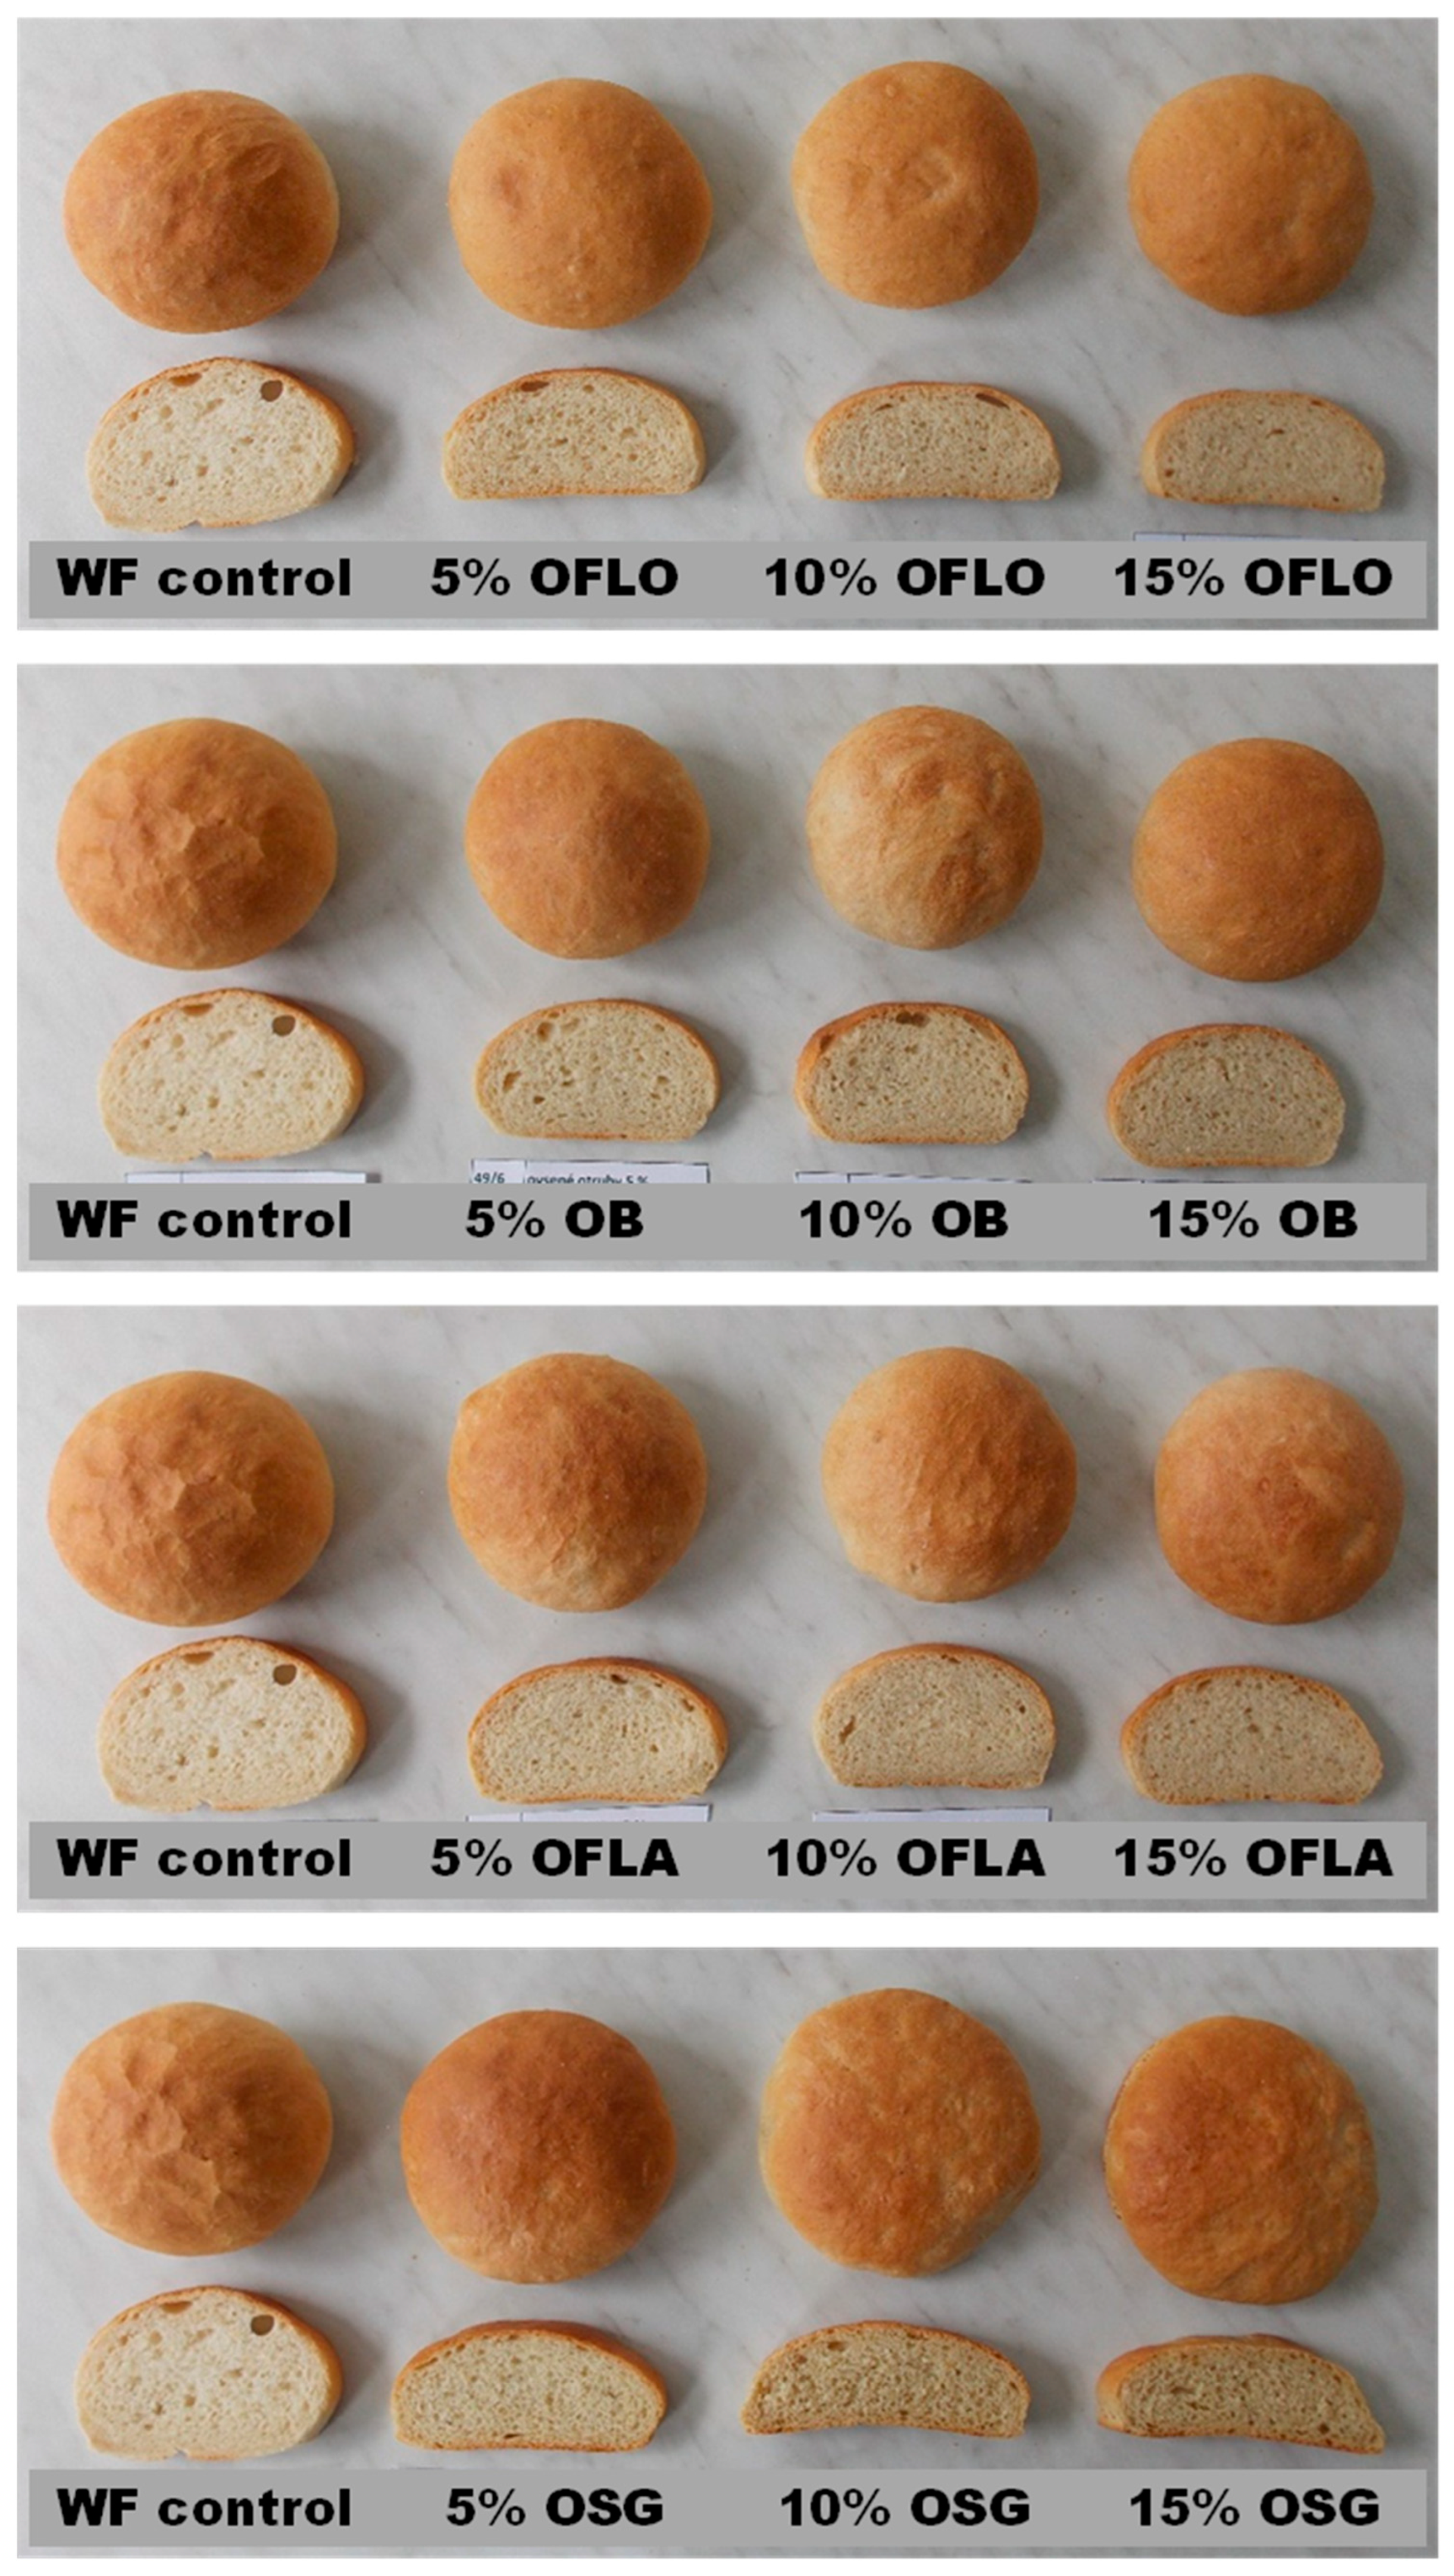
The overall appearance of the control WF bread together with all 12 wheat–oat variants was documented by a digital camera. The physical parameters of the bread variants are summarised in Table 2. The wheat control sample had the greatest loaf height and bread volume, reflecting the desired optimal technological performance. Composite breads generally showed reduced bun height and volume, with the most pronounced reductions observed in the oat bran and germinated oat formulations, particularly at ≥10% substitution. It can be deduced by reasoning that the reduction in the wheat dough elasticity and, conversely, its extensibility, caused by all forms of oats tested, group-averaged height-to-diameter ratios confirmed progressive loaf flattening in these complex biomaterial systems (Figure 4 and Figure 5).
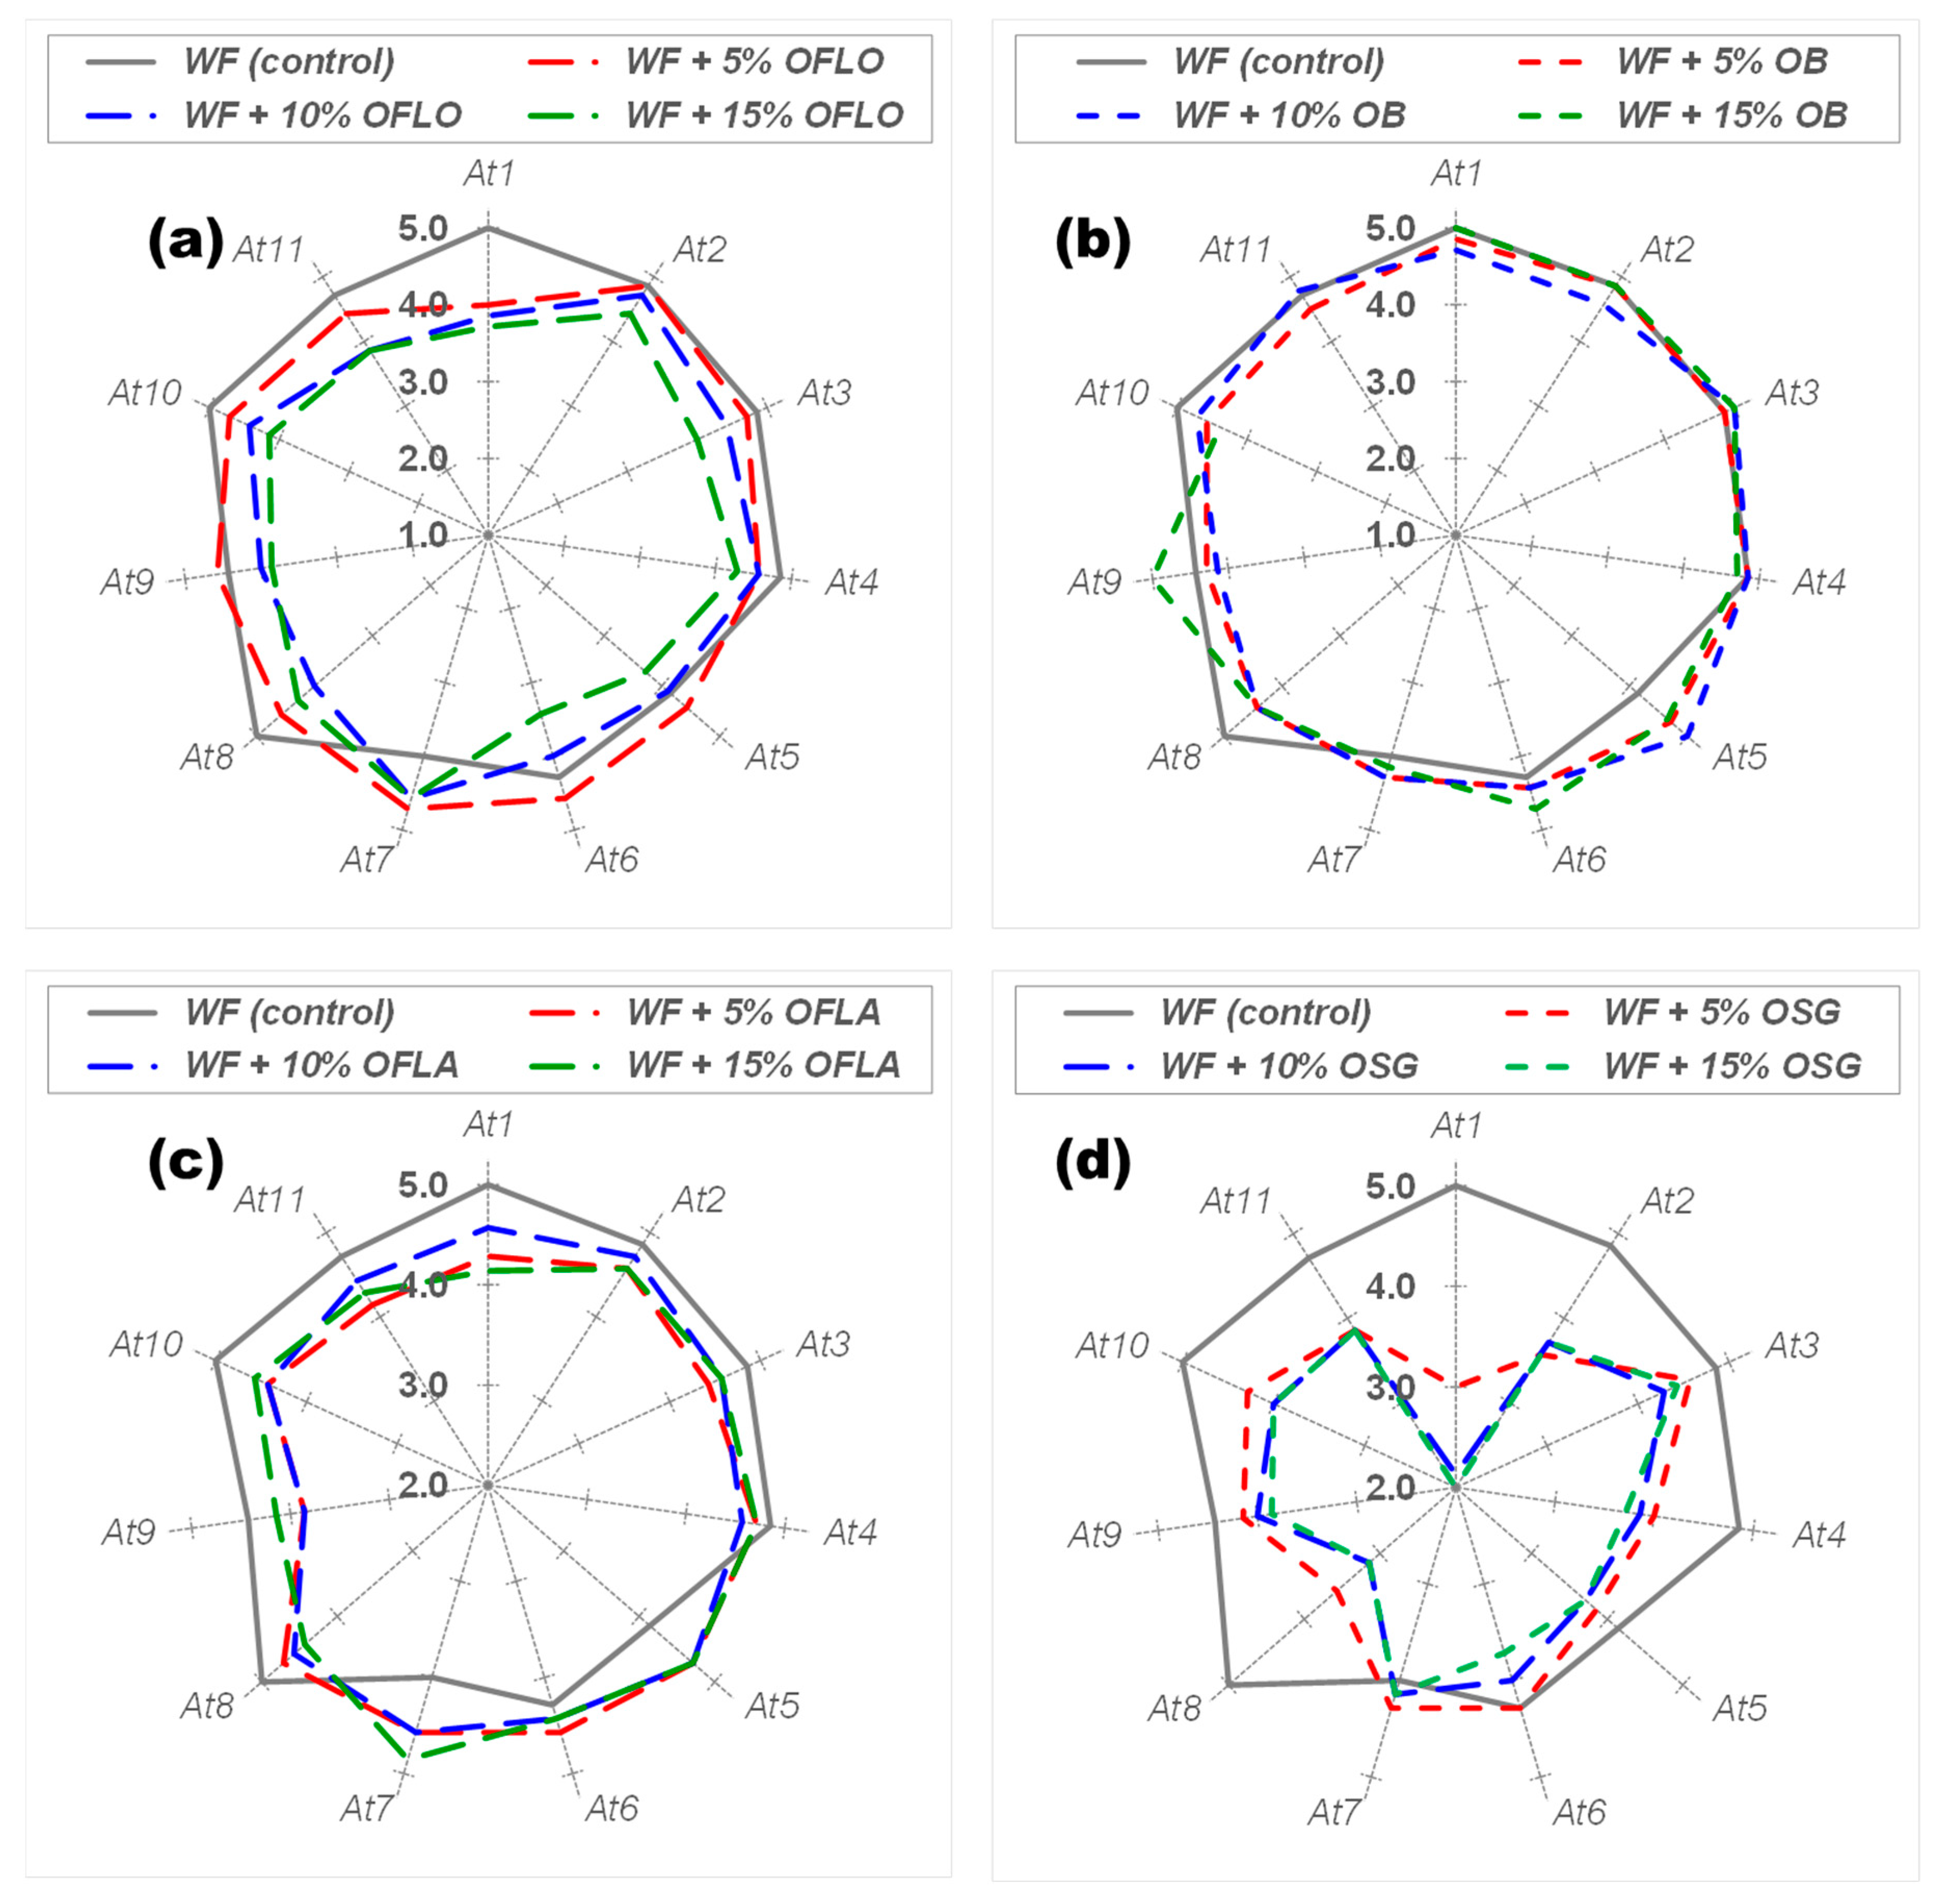
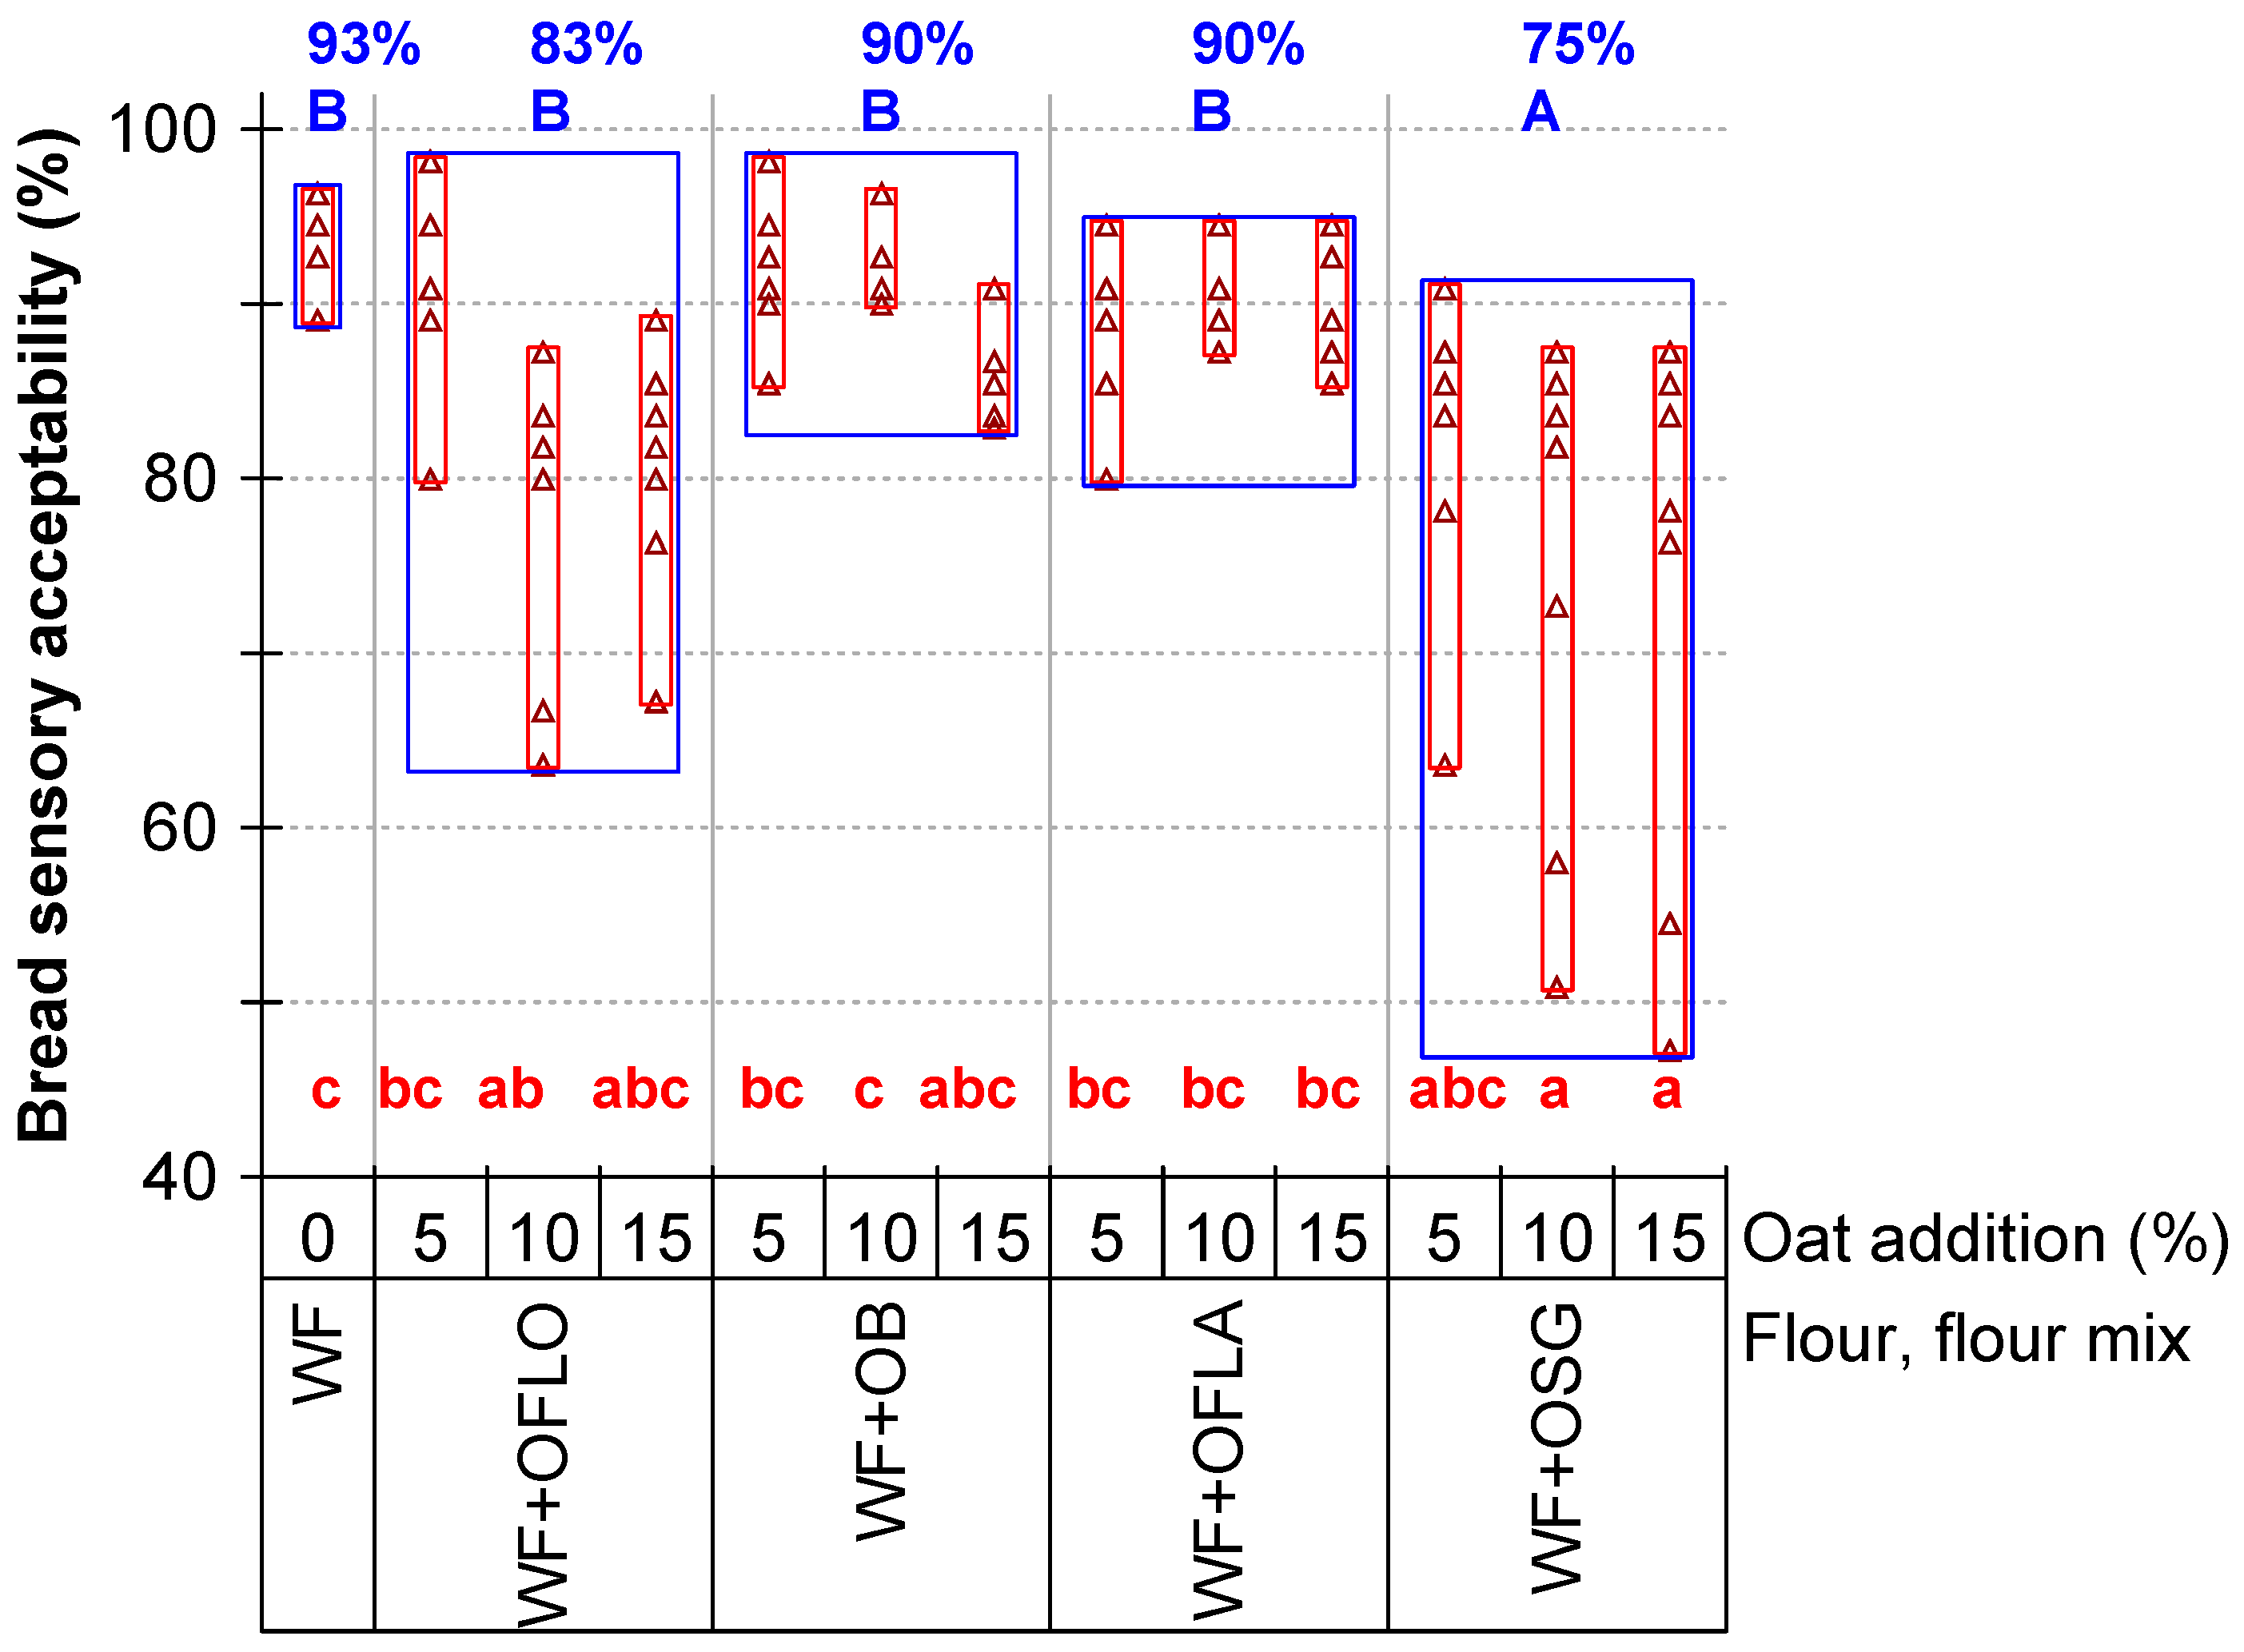
The sensory evaluation results are partially presented in Table 3 and by radar plots. The wheat control achieved the highest scores across all attributes. Wheat-wholegrain oat flour breads retained relatively favourable flavour and aroma profiles, whereas oat bran and germinated oat counterparts showed significant declines in terms of shape, crumb texture, and overall acceptability (Table 3, Figure 5, Figure 6 and Figure 7). Among composite breads, 5% substitution consistently yielded the highest acceptability within each oat fraction (Table 3, Figure 7). Distribution and variability analyses further demonstrated increasing dispersion and reduced sensory performance with higher substitution levels, particularly for bran and germinated oat formulations (Figure 5 and Figure 6). In detail, differences among the sensory attributes of the tested breads offer the radar plots (Figure 8).
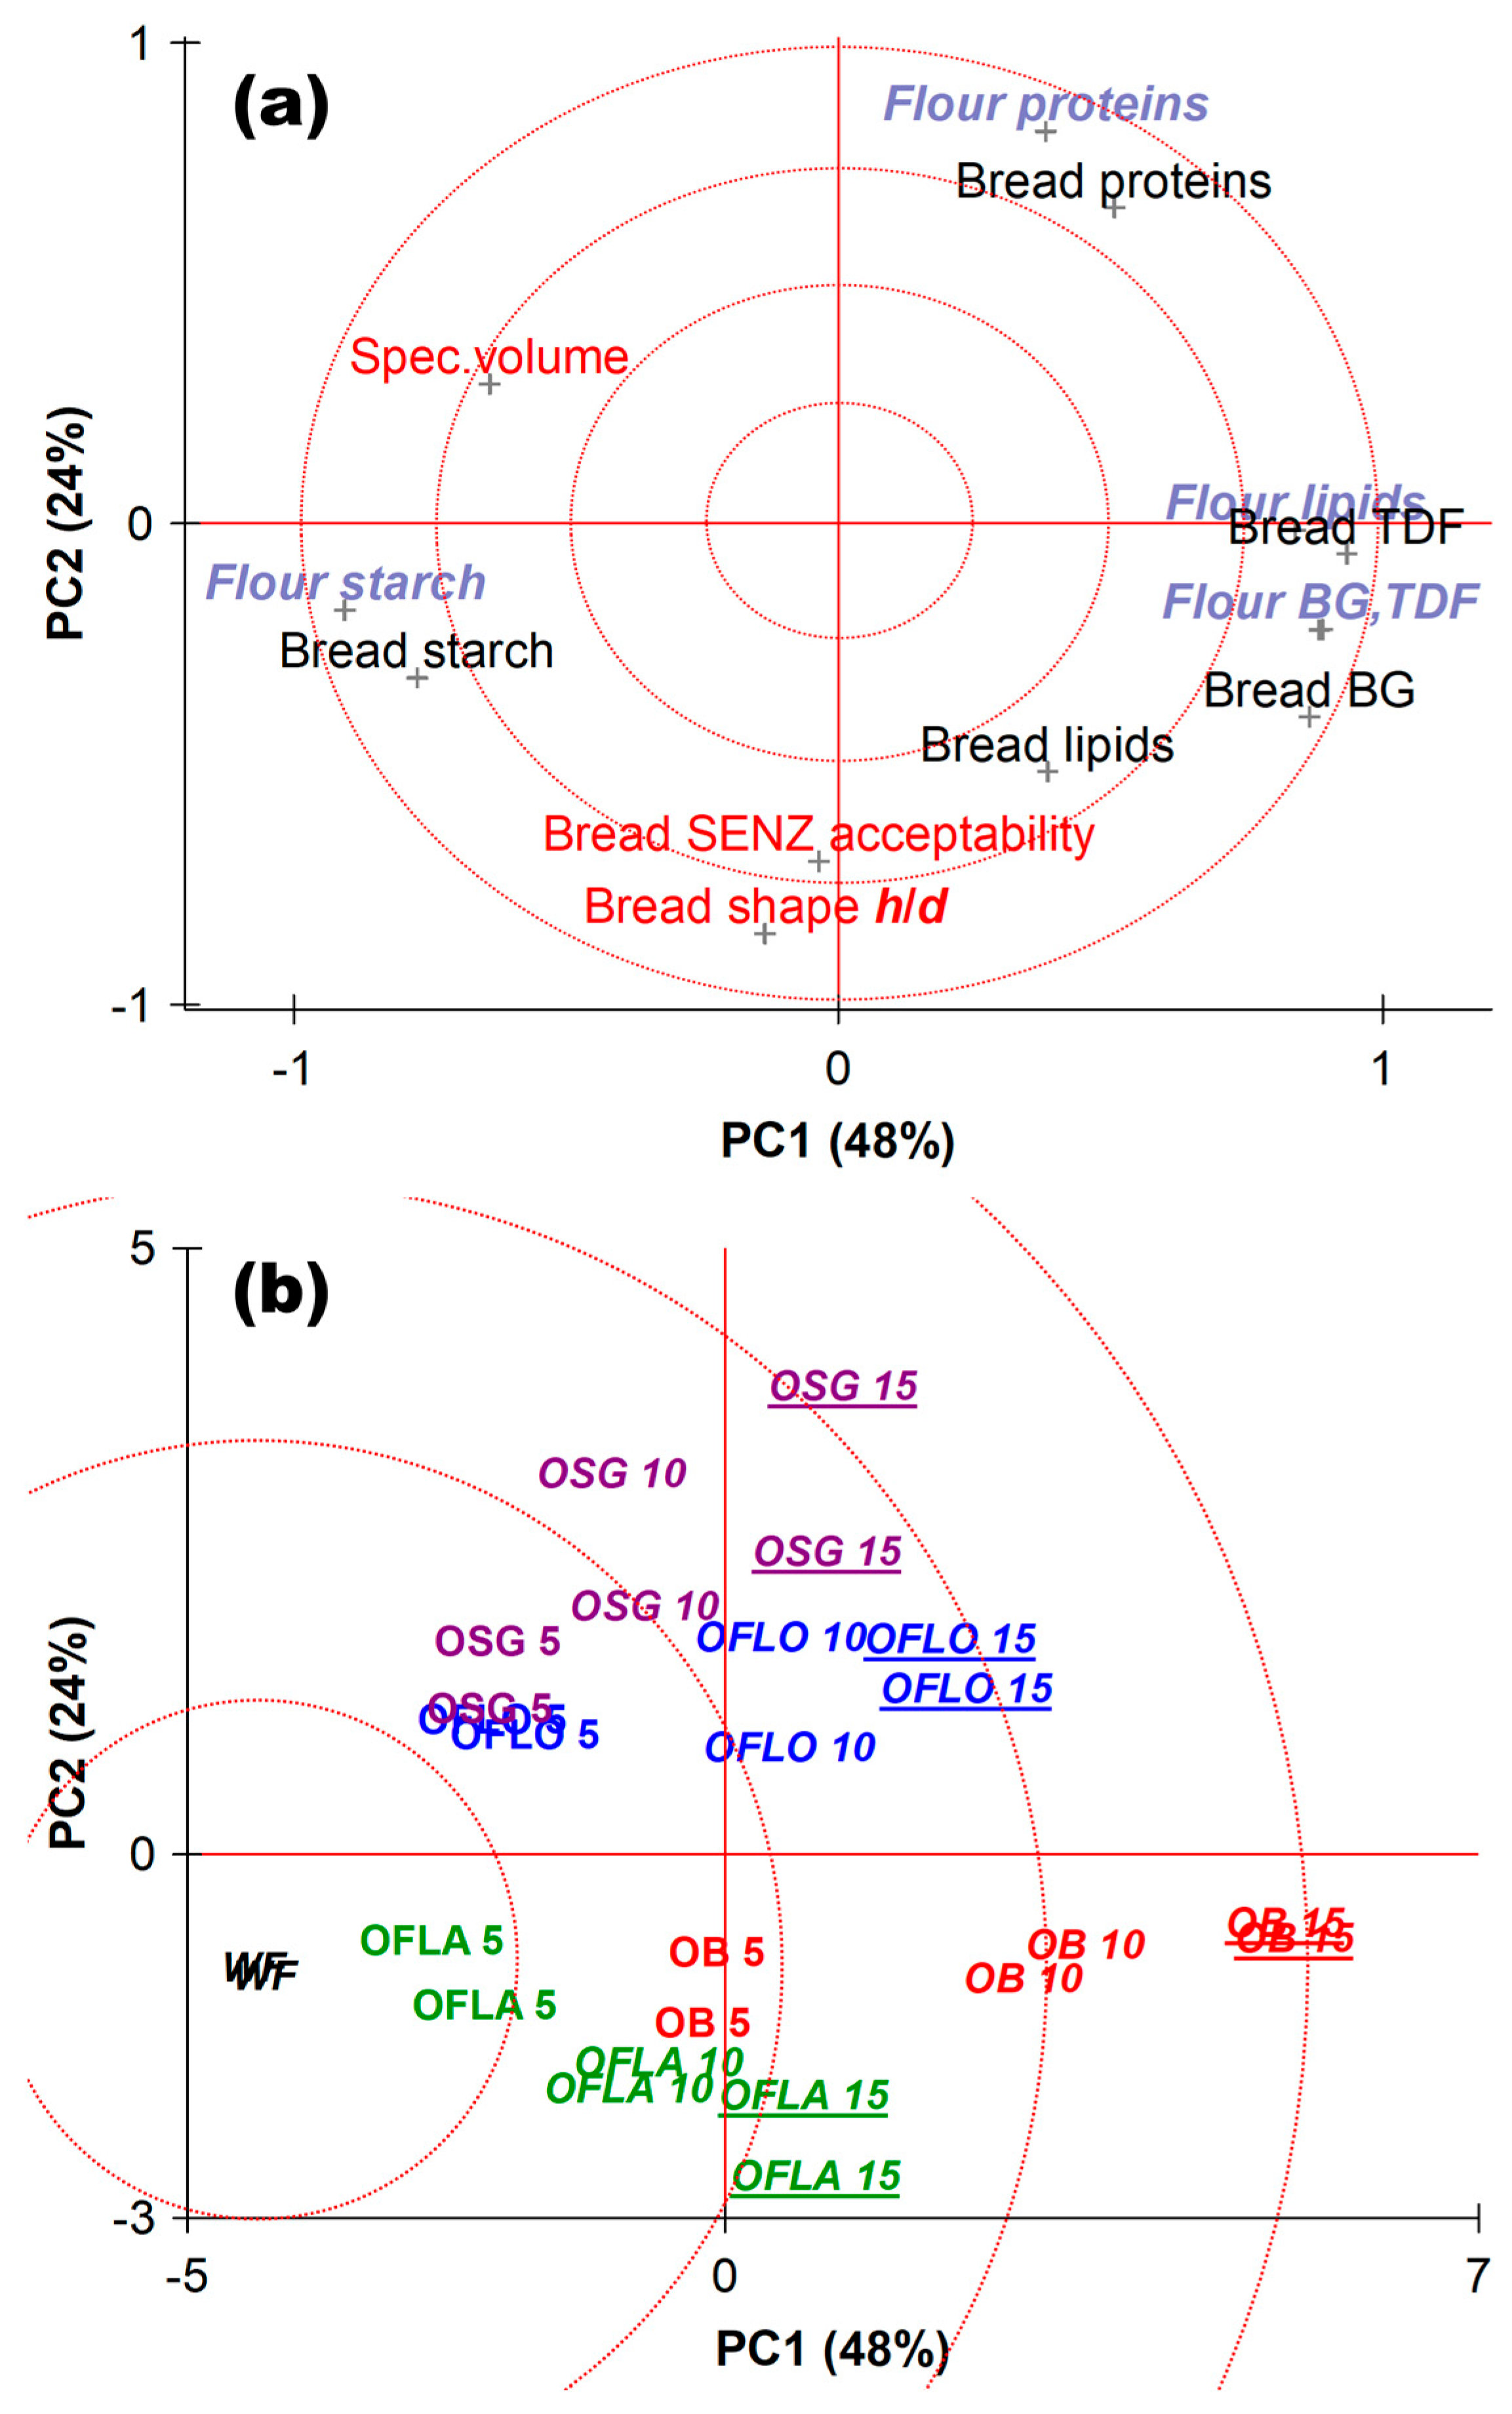
A multivariate analysis that integrated compositional, technological, and sensory variables revealed a primary axis characterised by fibre-related parameters (TDF and BG). Bread structure and sensory attributes, meanwhile, were captured along an orthogonal component (Figure 9 and table of communalities).
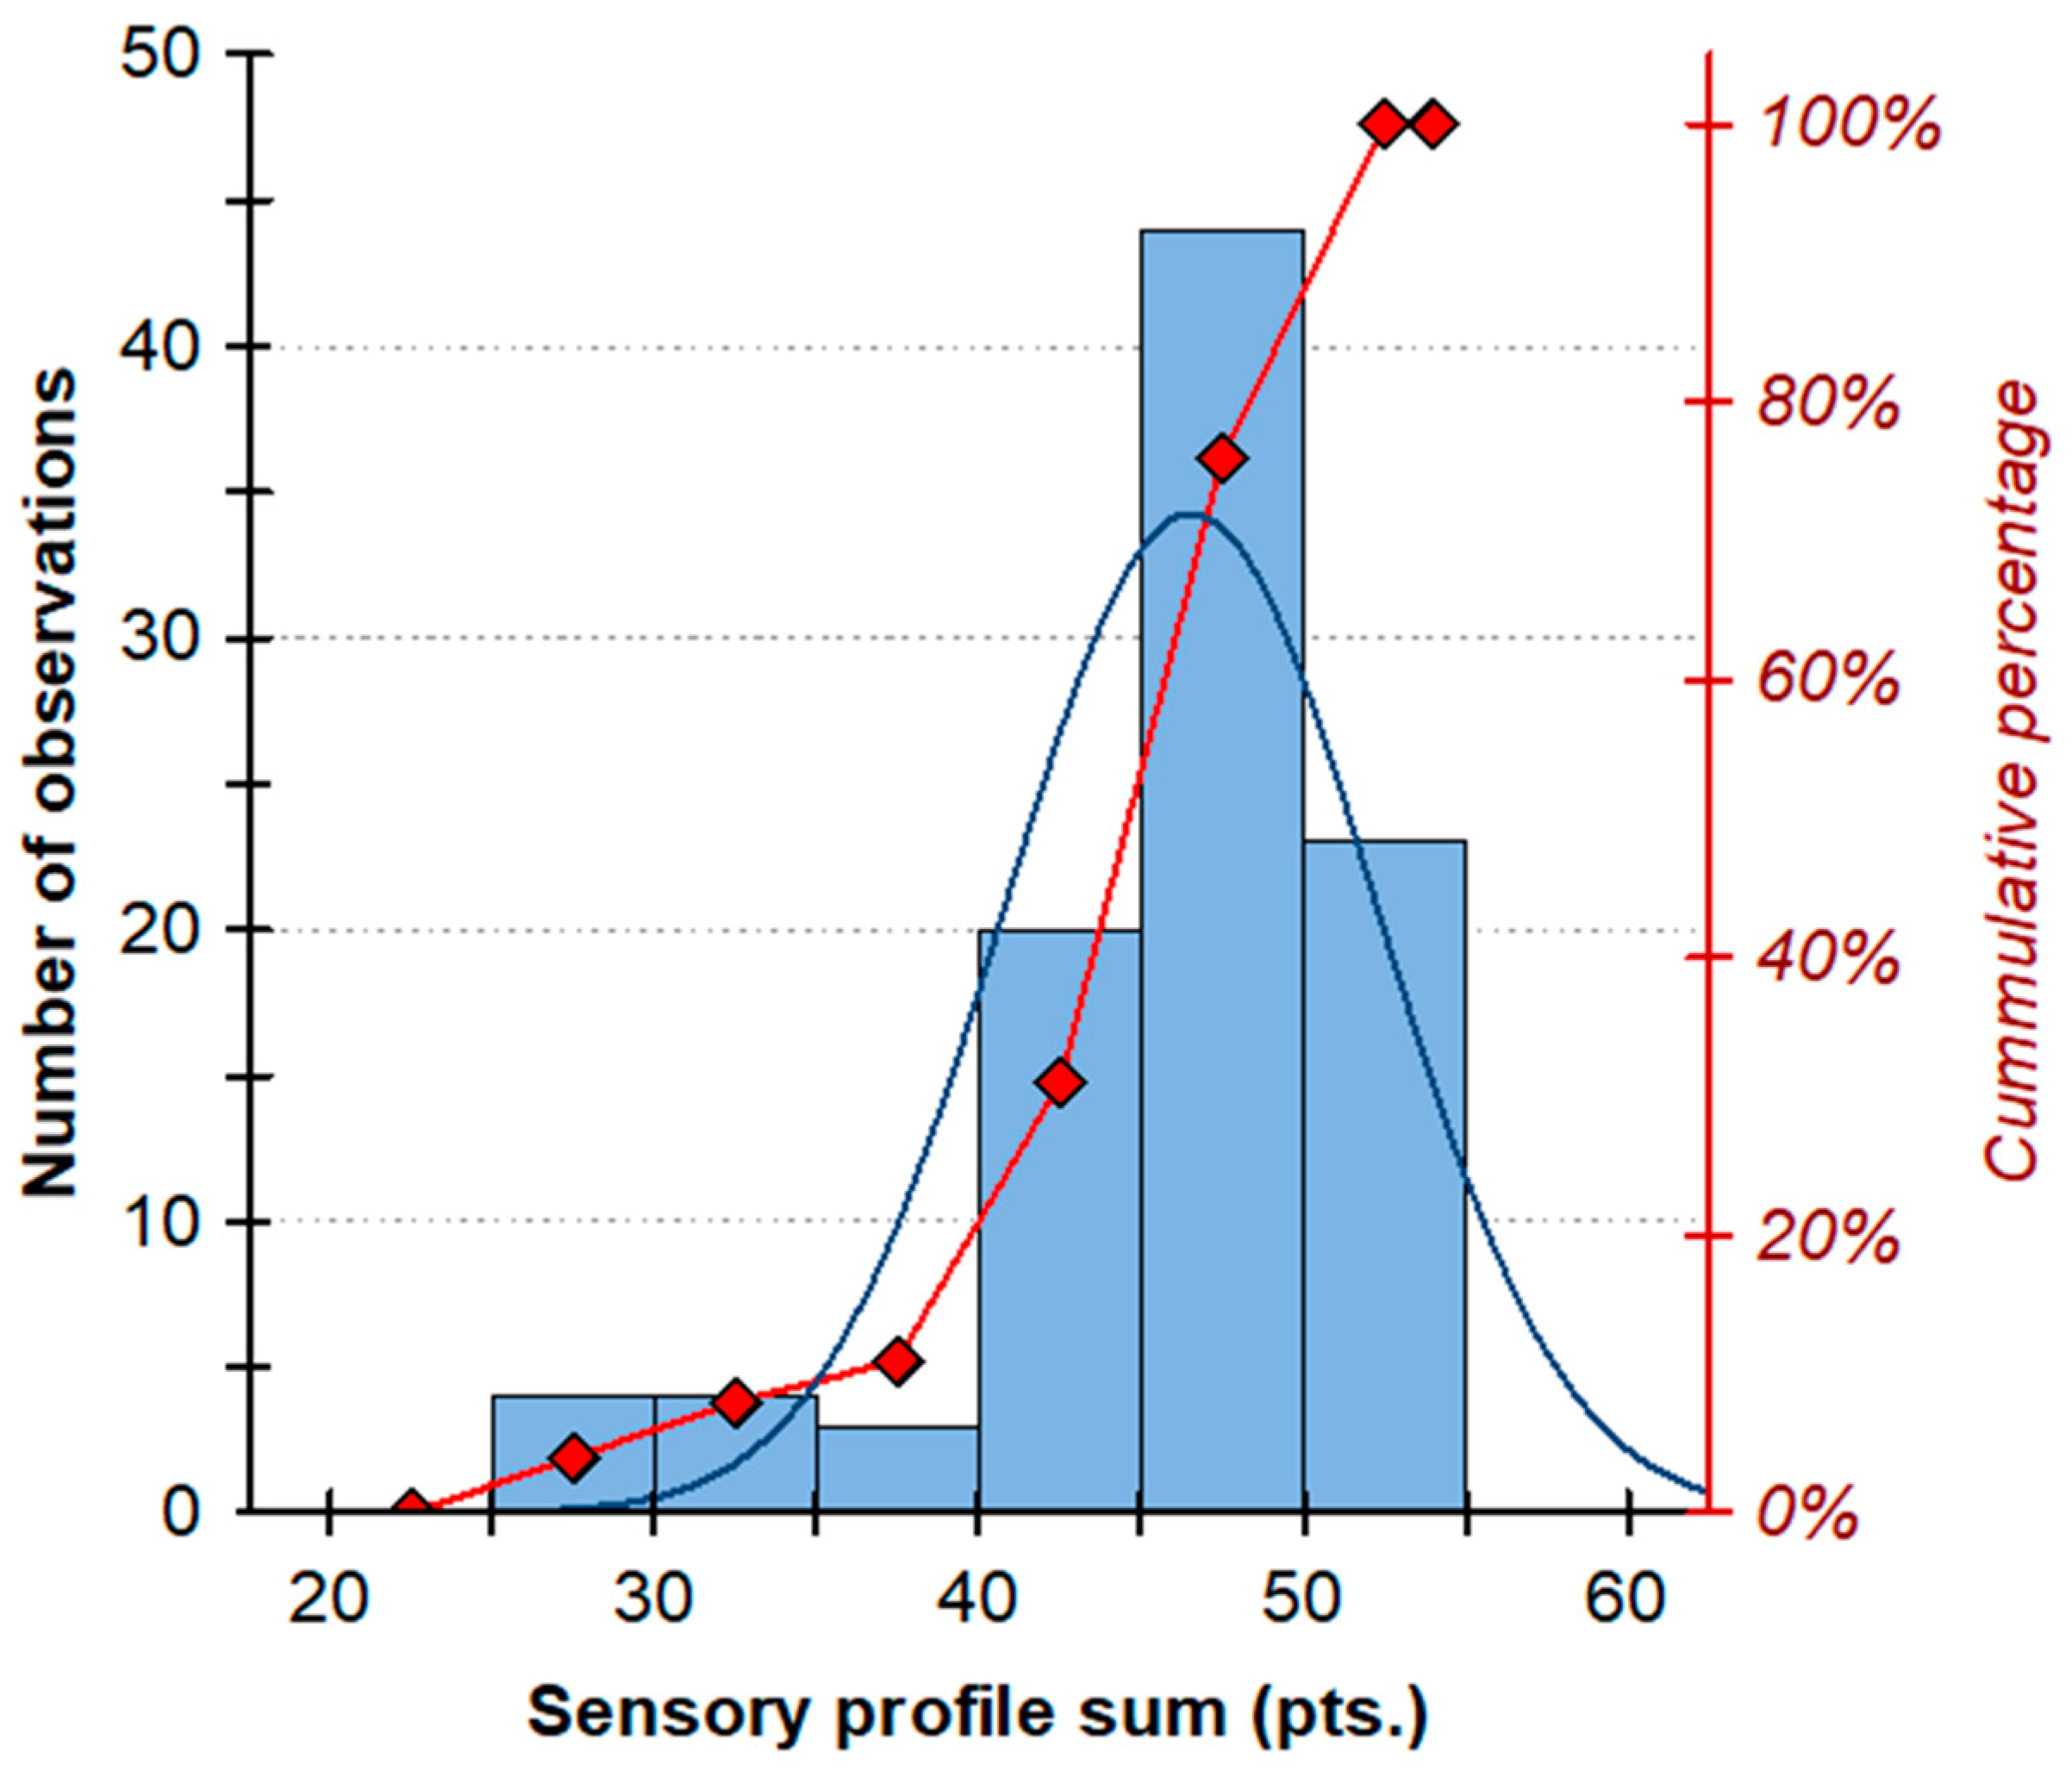
Based on 91 sensory scores, the summary sensory index called sensory score demonstrated a normal distribution of the 88% of input data (scores 40–55 pts.), as the 12 scores in range 25–40 pts. could be considered to be randomly occurring outliers. The most frequent category was the one with an average of 44 pts., representing 45% of the responses. Scores in intervals of 40–45 pts. and 50–55 pts., which represented 20% and 23% responses, were statistically equal in their percentages of all collected answers (20% and 23%, respectively; Figure 7).

3.6. Statistical Exploration of Data

In the correlation matrix (Table 4), there were 48 non-significant pair relationships and 10, 10, and 28 significant at p = 95%, 99%, or 99%. The percentages from a total count of 96 correlations are as follows: 50, 10, 10, and 30%, respectively. In the upper part of Table 4, as presumed, those frequencies confirm a tight interdependence of the rates of the analytes tested in flour, which logically predetermines their proportion in yeasted bread (left bottom corner of the matrix). Three basic constituents’ threesome—TDF, BG, and lipids—showed a negative correlation with bread specific volume; only the starch as a source of fermentable sugars supported the dough (right bottom corner of Table 4). Although the count of verifiable correlations was lowered by a subjective character of the sensory analysis, both the PCA plot of the variable scores and sample loadings (Figure 9a, Figure 9b, respectively) allow a meaningful interpretation (PCA based on the correlation matrix).
The first and the second principal components (PCs) covered 48 and 24% of the input data variability, overcoming a recommended border of 70%; PC3 absorbed 9% of data variability, but its interpretation is not necessary in general (Table 5). This third PC has a middle tight relation to the specific bread volume but a crucial role for the bread lipid content (18 and 47% of the feature scatter, respectively). Primarily, the PC1 is related to the polysaccharide constituent of the wheat–oat flour composites, confirming a positive effect of starch content on the specific bread volume (vice versa for TDF and BG). The second coordinate, PC2, is connected with protein and lipid content, which determines the loaf shape (the h/d ratio) and results of sensory testing (Figure 9a). Variability of the specific bread volume was unequally distributed between PC1 and PC5 (41, 8, 18, 15, and 10%, respectively); in the PC1 × PC2 plane, the parameter position is located close to the border of 75% of explained scatter. A mutual position of the bread shape h/d and the bread sensorial acceptability pair to the parameter specific bread volume is almost rectangular. According to the PCA method definition, an angle of 90° indicates zero correlation, i.e., this pair of variables could be considered as independent (cos 90° = 0). Second, a reciprocal closeness of the bread sensorial acceptability and the bread lipid content confirmed a generally known fact, that fat is connected to the pleasant taste as it is a carrier of taste (here, in fact, some typical oat and wholegrain taste could affect the sensory score itself).
In Figure 9b of the samples’ PCA scores, the higher the WF replacement ratio by any oat form, the lower the quality/statistical similarity of the binary flour blends, and from them resulted breads as presumed. It implies a clustering of samples in agreement with the fortification. Owing to the oat bran (OB) nature of “pure fibre”, the quality of the WF + 15OB bread was the most different per contra to the control (100% statistical dissimilarity). The inserted circles show approximate statistical similarity of the fortified flours/breads to the WF control from 75% up to 0% (from the centred WF pair). By a distribution of the statistical similarity, three most frequent categories were demonstrated between <60; 70), <50; 60), and <40; 50) percent; these categories collected six, three, and five samples, respectively (58% of all 13 samples pictured in duplicates as measured). Only 1 sample, a pair of WF + 5OFLA, differed from the WF control by less than 25%. In an overview, the milled oat flakes (OFLA) seemed to be the most promising form of oat for a recipe modification in praxis—the most enriched flour binary blend/bread WF + 15OFLA demonstrated the similarity to the WF control was roughly 50%. In comparison to wholegrain oat flour (OFLO), the technological steps of oat grain soaking followed by flaking itself represent an extra cost. At the same time, cereal grain sprouting is a traditional process applied in the brewery; in this direction, semi-industrial germination of oat grain instead of barley and wheat ones could be carried out at a professional, hygienic, and safe level.

4. Discussion

This study investigated the effects of incorporating distinct oat fractions, differing in both structure and composition, into wheat flour on the fibre content, macronutrient balance, technological performance, and sensory quality of composite breads. Through a combination of compositional analysis, baking trials, and multivariate statistical evaluation, this study provides an integrated view of how the type of oat fraction and the level of substitution modulate nutritional attributes and bread quality.
The results showed the fibre enrichment in wheat–oat systems depended not only on the number of oat-derived components present but also on matrix-dependent effects related to starch dilution, lipid co-occurrence, and changes in analytical recoverability induced by processing. These interactions underpin the fraction-specific responses observed during baking and explain the technological and sensory trade-offs associated with increased oat incorporation levels.

4.1. Composition of Raw Materials

The pronounced compositional differences observed between wheat flour and oat-derived raw materials are consistent with the well-established anatomical and biochemical heterogeneity of cereal grains, particularly concerning fibre localisation and the effects of starch dilution. Refined wheat flour is characterised by a predominance of endosperm tissue, explaining its high starch content and low concentrations of BG, total dietary fibre, and lipids [51,52].
In contrast, oats retain substantial proportions of bran, aleurone, and germ tissues, which are the primary reservoirs of mixed-linkage BG, non-starch polysaccharides, and lipids [53,54]. The markedly higher BG and TDF levels measured in oat bran and wholegrain oat flour reflect the preferential localisation of BG in subaleurone and cell wall structures in the outer kernel layers [55]. The intermediate BG and TDF levels observed in oat flakes and germinated oat flour are consistent with the partial removal or structural modification of these tissues during the sprouting and flaking processes.
The substantially lower starch concentrations in all oat fractions compared to wheat flour are primarily due to dilution by fibre, protein, and lipid components rather than absolute starch depletion. This starch dilution effect is a critical compositional feature as it alters the nutritional profile and functional behaviour of composite flours during dough formation and baking [56]. In germinated oat flour, the pronounced reduction in starch is further amplified by enzymatic mobilisation during sprouting, which activates α- and β-amylases and increases the proportion of non-starch components [57,58].
The elevated lipid content observed in all oat-derived materials, particularly oat bran and germinated oat flour, is another feature that distinguishes oats from wheat. Concentrated in the germ and aleurone layers, oat lipids are rich in polar lipids and unsaturated fatty acids. These lipids may interact with starch and fibre components, influencing analytical recoverability and technological performance [59,60]. The co-occurrence of lipids and polysaccharides is increasingly recognised as an important factor affecting enzyme accessibility and extractability in fibre and BG analytical methods [53,61,62].
The variability in protein content among the oat fractions, particularly the elevated protein content of germinated oat flour, reflects compositional remodelling that occurs during sprouting. In this process, starch degradation leads to the relative enrichment of nitrogenous compounds rather than de novo protein synthesis [9,63]. These changes result in a fundamentally different macronutrient balance compared with refined wheat flour.
Overall, oat-derived raw materials represent distinct compositional and analytical matrices characterised by fibre enrichment, starch replacement, and lipid co-occurrence. These features are not merely nutritional characteristics, but they are also expected to significantly impact enzymatic accessibility, analytical response, and processing behaviour in composite flours and breads. The compositional contrasts identified here therefore provide an essential framework for interpreting the effects observed on a per-fraction basis during baking and subsequent analytical determination of fibre-related components.

4.2. Total Dietary Fibre (TDF) in Composite Flours and Breads

In all composite flours, the increase in TDF content observed reflects the high fibre content of oat-derived fractions, particularly oat bran and wholegrain oat flour. These mill streams are characterised by their high levels of non-starch polysaccharides, including BG, arabinoxylans, and cellulose-rich insoluble fibre. Similar dose-dependent increases in TDF following the incorporation of oats into wheat-based matrices have been reported consistently in previous studies on composite flours and breads [18,22,64,65].
The absence of any measurable change in TDF content in the wheat control after baking confirms that thermal processing alone does not alter the fibre fraction of refined wheat flour as determined by gravimetry. This finding is consistent with earlier reports demonstrating the high thermal stability of wheat fibre components under conventional baking conditions when analysed using AOAC enzymatic–gravimetric methods [62,66].
In contrast, several composite systems exhibited higher TDF values after baking than in the corresponding flour blends. This phenomenon, most pronounced in formulations containing wholegrain oat flour and oat bran, is unlikely to reflect de novo fibre formation. Instead, it can be attributed to matrix- and method-dependent effects that affect fibre extractability and analytical recovery during the enzymatic–gravimetric determination process. Baking-induced structural disintegration of the starch–protein matrix, together with heat- and moisture-driven loosening of cell wall architecture, may increase the accessibility of fibre polymers to enzymatic digestion and subsequent gravimetric precipitation. This can lead to an apparent increase in measured TDF [67,68].
Wholegrain oat flour exhibited the most significant rise in TDF levels after baking, potentially reflecting the combined effects of partially disrupted endosperm cell walls and the enhanced solubilisation of fibre components during this process. Oat bran, characterised by a high proportion of insoluble fibre and intact cell wall structures, exhibited consistently elevated TDF levels at ≥10% substitution, both before and after baking. This indicates a more stable fibre contribution, which is largely independent of changes in extractability induced by processing. Similar behaviour has been reported for bran-enriched wheat products, where fibre enrichment is dominated by the absolute contribution of insoluble fractions rather than processing-induced transformations [69,70].
Oat flakes and germinated oat flour produced more modest TDF increases at lower substitution levels, which may be related to their distinct structural and compositional features. In flakes, prior hydrothermal treatment during flaking may enhance fibre accessibility, limiting changes during baking. In germinated oat flour, partial enzymatic degradation of cell wall polysaccharides during sprouting may reduce the proportion of high-molecular-weight insoluble fibre recovered by gravimetric methods, particularly at low inclusion levels [63,71,72].
The strong correlation between flour and bread TDF levels across all formulations (r = 0.85, p = 99.9%) confirms that fibre enrichment in baked products is primarily driven by the initial flour composition rather than processing variability. At the same time, the baking-associated amplification of TDF differences among formulations highlights the importance of considering analytical recoverability and matrix effects when interpreting fibre data in thermally processed cereal products. Therefore, increases in measured TDF after baking should be interpreted with caution, primarily as an analytical response to matrix modification rather than as an actual increase in dietary fibre available to consumers [73,74,75].
From a mechanistic perspective, the apparent increase in measured TDF after baking can be explained by several concurrent matrix transformations. Firstly, the thermal and moisture-induced disruption of cereal cell walls can expose fibre polymers that were previously embedded within intact tissues, particularly in whole grain and bran-rich matrices [67,68]. Secondly, starch gelatinisation during baking can alter the physical entrapment of fibre within the starch–protein network, either releasing fibre fractions or enabling them to be included in the gravimetric residue recovered during AOAC analysis [67,68,69,70]. Thirdly, protein denaturation and weakening of the gluten–starch matrix can enhance enzyme penetration during the enzymatic–gravimetric procedure further [69,70]. Taken together, these effects increase analytical accessibility rather than fibre mass, resulting in apparent, rather than compositional, increases in TDF.

4.3. β-d-Glucans in Composite Flours and Breads

The increase in β-d-glucans (BG) content observed following the incorporation of oat fractions is consistent with the well-documented enrichment of mixed-linkage BG in oat tissues, particularly in the aleurone and subaleurone layers. These layers are retained to varying degrees in wholegrain flour, flakes, and bran fractions [22,61,76]. The magnitude of BG enrichment observed in the present study, with composite flours reaching 1.21% BG at 15% oat bran substitution, is similar to values reported for wheat–oat composite systems within a similar substitution range [77,78].
The minimal and statistically non-significant reduction in BG content observed in the wheat control after baking indicates that thermal processing alone does not substantially affect BG recoverability in refined wheat matrices. This is consistent with previous findings that wheat-derived BG, present at low concentrations, exhibits limited susceptibility to thermal degradation under standard bread-making conditions [79,80]. In contrast, the fraction-dependent responses observed in composite systems demonstrate that BG behaviour during baking cannot be interpreted as a simple function of temperature exposure; rather, it reflects matrix-specific interactions and analytical accessibility.
The consistent decrease in measured BG content after baking in wholegrain oat flour blends suggests partial depolymerisation or reduced enzymatic recoverability of BG in these matrices. Heat-induced cleavage of β-(1 → 3)(1 → 4)-linkages, as well as interactions with gelatinising starch and denaturing proteins, have been shown to affect the solubility of BG and the efficiency of its enzymatic hydrolysis in mixed cereal systems [26,81]. In contrast, the nonlinear response observed in oat bran blends, with increased measured BG content at higher substitution levels after baking, strongly indicates enhanced extractability or analytical release of BG from bran-rich matrices following thermal processing. Previous studies have attributed similar apparent increases in BG content after baking to matrix loosening, disruption of cell wall integrity, and improved accessibility of BG to lichenase-based analytical methods rather than de novo BG formation [26,36,81].
The comparatively stable BG levels observed in oat flake formulations and the modest changes detected in germinated oat blends further highlight the importance of fraction-specific structural organisation. In oat flakes, partial pre-processing (steaming and rolling) may promote BG accessibility to some extent, thereby reducing the magnitude of further changes induced by baking [53,82]. In germinated oats, enzymatic activity during sprouting may lead to partial BG modification before baking, resulting in attenuated responses during subsequent thermal treatment [57,83].
The strong positive correlation between flour BG and bread BG confirms that BG is efficiently transferred from composite flours to baked products. This supports the nutritional relevance of BG enrichment strategies in bread making. Conversely, the pronounced negative correlation between flour BG content and specific bread volume highlights the well-known technological trade-off associated with BG enrichment. Increased BG levels increase dough viscosity, restrict gas cell expansion, and interfere with gluten network development, ultimately resulting in reduced loaf volume [84,85] as well as firmer, more chewable crumb.
Taken together, these findings show that changes in measured BG content during baking depend on a complex interplay between oat fraction type, substitution level, and matrix-dependent analytical recoverability. From a technological perspective, BG enrichment enhances the nutritional value of bread but imposes structural constraints on quality. From an analytical standpoint, however, post-baking BG values must be interpreted with caution as they may reflect altered extractability rather than true changes in BG mass. These insights are critical for the rational design of fibre-enriched bakery products and for correctly interpreting BG data in processed cereal matrices (e.g., during a sourdough production stage).
For BG, changes in measured content induced by baking can be explained by differences in the molecular organisation and matrix interactions of the fractions. In wholegrain matrices, partial depolymerisation of BG, interactions with gelatinising starch, and physical entrapment within the developing gluten network may reduce enzymatic recoverability [26,81,84,85]. Conversely, in bran-rich systems, the thermal loosening of cell wall architecture may increase the accessibility of BG to lichenase-based assays, resulting in an apparent increase in the measured amount of BG [26,36,81]. These opposing trends demonstrate that post-baking BG values primarily reflect matrix-dependent analytical behaviour rather than the true degradation or formation of BG.

4.4. Macronutrient Composition of Composite Flours and Breads

The reduction in starch content observed across all composite systems is primarily due to the dilution effect caused by incorporating oat-derived fractions that are enriched in non-starch components, such as dietary fibre, lipids, and proteins. This effect was most pronounced in oat bran formulations, where the high proportion of cell wall polysaccharides displaced a significant amount of starch in both the flours and the bread. Similar effects have been consistently reported in wheat-based composite systems following the incorporation of oat bran and are considered a driver of altered dough rheology and bread structure [86,87].
However, the pronounced starch reduction observed in germinated oat blends from ≥10% substitution cannot be attributed solely to dilution; rather, it reflects biochemical modification during germination, particularly the degradation of starch reserves by amylolytic enzymes. Sprouting activates endogenous α- and β-amylases, leading to partial starch hydrolysis and an increased proportion of soluble carbohydrates before baking [57,58,88]. The persistence of reduced starch levels after baking indicates that these compositional changes are retained through thermal processing, contributing to the weakened gas retention and reduced loaf volume observed in germinated oat breads.
The strong positive correlation between flour starch content and specific bread volume highlights the pivotal role of starch as the primary structural polysaccharide in wheat-based breads. Starch gelatinisation during baking provides mechanical stability to the crumb structure; moreover, it is a source of simple fermentable sugar, metabolised by yeasts to carbon dioxide. However, its progressive dilution by fibre-rich oat fractions compromises this function [69,89]. The inverse relationship between starch and both TDF and BG confirms that displacement of starch represents a key compositional trade-off that underlies the technological limitations of high-fibre formulations.
Protein enrichment in most composite flours reflects the higher natural protein content of oat fractions compared to refined wheat flour [90]. The strongest effects are observed with oat bran and germinated oat flour. In germinated oats, protein enrichment is additionally driven by starch mobilisation during sprouting, increasing nitrogenous compounds [91]. However, despite their higher protein content, negative correlations between flour protein content and both bread shape and sensory acceptability suggest that oat proteins do not functionally compensate for gluten dilution. Unlike wheat gluten, oat proteins support the elastic part of bread dough bionetwork required for sufficient (optimal) retention of fermentation gases; their incorporation tends to weaken rather than reinforce the dough structure [38,83].
The increase in lipid content across all composite systems is consistent with the high lipid content of oat grains, particularly in the germ and aleurone layers that are retained in the bran and wholegrain fractions. Depending on their concentration and interaction with starch and proteins, lipids are known to exert complex effects in bread making, acting both as crumb softeners and as potential inhibitors of gluten network development [92,93]. The strong positive correlation between lipid and BG content indicates that these components are located in the same area of oat tissues, particularly in bran-rich formulations. The negative correlation observed between flour lipid content and specific bread volume indicates that lipid enrichment may exacerbate structural weakening in fibre-rich matrices, possibly through competition for water and interference with gluten–starch interactions.
Taken together, these findings demonstrate that shifts in macronutrients induced by the incorporation of milled forms of oat grain are closely linked, with the partial replacement and dilution of starch, the enrichment of fibre, the co-occurrence of lipids, and the enrichment of non-gluten proteins acting synergistically to influence the structure and quality of final yeasted bread. From a technological perspective, starch reduction is the main cause of volume loss, while protein and lipid enrichment affect crumb structure and sensory attributes in a fraction-specific manner. These results highlight the importance of considering macronutrient balance rather than individual components when formulating new, fibre-enriched wheat–oat composite breads.

4.5. Baking Trial Results and Sensory Evaluation

In composite breads, the reductions observed in bun height and bread volume (particularly those containing oat bran and germinated oat fractions at ≥10% substitution levels) are consistent with the well-documented disruptive effects of high fibre content on gluten network development and gas retention capacity in wheat-based doughs [67,89,94]. The presence of insoluble fibre-rich fractions, such as oat bran, physically interferes with gluten continuity and competes for water. This limits dough development and extensibility, as well as later reduces oven spring [95,96]. This mechanism plausibly explains the pronounced loaf flattening and reduced height-to-diameter ratios observed in these formulations (Figure 4 and Figure 5).
In addition to the mechanical dilution of gluten and the physical effect of fibre particles, the evaluation of changes in loaf volume and crumb structure should also consider biochemical and physicochemical interactions occurring during mixing, fermentation, and baking [93,97]. Although the lipid content of oats and composite doughs remains low at the applied substitution levels, oat lipids, particularly polar lipids from bran and germ, may influence interfacial properties within the dough, such as gas cell stability and the behaviour of the continuous phase during oven spring [97,98].
Biopolymer BG plays a significant role. Due to its high water-binding capacity and ability to increase the viscosity of the aqueous phase, it alters water distribution among starch, proteins, and fibre. This can delay starch gelatinisation and disrupt crumb setting, leading to reduced loaf volume. These effects are pronounced in fibre-rich and germinated oat formulations, where the combined influence of BG-mediated water retention, starch dilution, and enzymatic weakening of structure impairs gas retention and crumb stabilisation [99,100].
Germinated oat formulations exhibited comparable or even stronger negative effects on loaf geometry, which may reflect additional enzymatic weakening of the dough structure. Sprouting is known to enhance amylolytic and proteolytic activities, leading to excessive starch degradation and protein modification. This can impair dough stability and gas-holding capacity during fermentation and baking [57,71,88]. The combined impact of fibre enrichment and enzymatic activity likely underpins the pronounced technological deterioration observed in germinated oat breads.
Sensory evaluation outcomes closely mirrored these technological trends. The consistently high acceptability of breads containing 5% oat substitution across all fraction types suggests that low-level enrichment remains within the tolerance threshold of the wheat bread matrix, preserving desirable texture and flavour attributes (Table 3; Figure 6). Similar substitution limits have been reported previously for oat fibre enrichment; beyond these limits, consumer acceptability declines sharply due to textural hardening and reduced loaf volume [89,96,101,102].
Wholegrain oat flour formulations retained relatively favourable flavour and aroma profiles, even at higher substitution levels. This may be due to the presence of lipid-associated volatile compounds and Maillard reaction precursors, which contribute to a pleasant cereal flavour [103,104]. By contrast, oat bran breads showed clear sensory deterioration, especially in terms of crumb firmness and texture, which is consistent with the high insoluble fibre content and reduced porosity that were observed using instruments (Figure 5, Figure 6 and Figure 7). These results are consistent with previous studies that have linked the enrichment of bread with insoluble fibre to increased crumb hardness and reduced sensory acceptance [67,83].
Germinated oat breads received the lowest sensory scores for most attributes, including bread shape, crumb texture, and taste. Beyond structural defects, atypical or slightly acidic flavour notes reported by panellists may reflect biochemical changes during germination, such as the formation of organic acids and altered lipid oxidation pathways [105,106]. While such changes are nutritionally relevant, they may negatively affect consumer perception of conventional bread products.
Multivariate analysis, which integrates compositional, technological, and sensory variables, further supports these interpretations. The dominance of fibre-related parameters (TDF and BG) along the primary principal component highlights fibre enrichment as the main factor influencing technological performance and sensory differentiation (Figure 9; Table 5). Bread structure and sensory attribute loading along an orthogonal axis indicate that consumer perception is modulated by factors beyond fibre concentration alone, including starch dilution, lipid co-occurrence, and protein–fibre interactions [107,108,109].
Overall, these results demonstrate that the technological and sensory feasibility of oat-enriched wheat breads depends heavily on the type of oat fraction used and the level of substitution. While moderate inclusion (approximately 5%) is compatible with acceptable bread quality, higher levels, especially of commercial bran of traditional rough granulation spectrum or whole sprouted-grain flour, pose significant structural and sensory challenges. These challenges must be addressed through formulation or processing strategies if the higher fibre content is desired (and it surely is).

4.6. Integrated Analytical and Technological Framework—Practical Application

This framework links component, technological, and sensory data, serving as a guide for product development and the interpretation of analytical results. It provides food manufacturers with recommendations on suitable oat forms and replacement levels for various products. For standard wheat bread, a low to medium proportion of whole grain oat flour (approx. 5%) appears to be optimal, as this allows for fibre enrichment without significantly compromising volume or quality. Conversely, oat bran and sprouted oat flour are better suited to dense or specialty products, where a firmer crumb and smaller volume are acceptable or desirable.
For analytical laboratory evaluation, the framework highlights the importance of considering matrix effects when determining the levels of fibre and BG in baked goods. It recommends introducing uniform sample pretreatment procedures, such as controlled drying, standardisation of particle size, and clearly defined extraction conditions, to ensure comparable and reliable results. By combining technological and analytical aspects in this way, the framework provides a practical basis for recipe development and more accurate data interpretation.

5. Conclusions

This study shows that the nutritional profile, technological behaviour, and final quality of wheat–oat composite breads are not solely determined by the level of oat substitution but are primarily influenced by the structural and compositional characteristics of the milled forms of oat grain used. Incorporating oat ingredients resulted in a significant increase in β-d-glucan and total dietary fibre contents, accompanied by a consistent reduction in starch proportion. However, the extent of these changes and their technological implications varied significantly depending on the oat fraction tested. Oat bran provided the greatest fibre enrichment, while germinated oat flour exhibited the most significant shifts in macronutrient balance due to starch mobilisation during germination.
Interpretation of the results indicates that the behaviour of wheat–oat composite systems is governed by two weakly coupled mechanisms only. The first mechanism is associated with the content and physicochemical nature of dietary fibre, particularly β-d-glucans. These influence water binding and dough rheology, which consequently affect the specific volume and crumb structure of bread. The second mechanism relates to compositional changes within the starch–protein matrix, including starch dilution, the presence of lipids, and protein–fibre interactions. These changes are strongly reflected in the sensory and shape-related characteristics of the breads. These distinct mechanisms explain why comparable levels of fibre enrichment can result in markedly different technological and sensory outcomes, depending on the type of oat form used. This was confirmed and visualised by multivariate statistical analysis. As the wheat flour still represented a substantial component of binary flour blends and resulting breads, a majority of tested oat-enriched variants demonstrated a statistical similarity to the wheat control in a range of 30–55%.
From an analytical perspective, the study highlights the significant impact of matrix effects in technologically heterogeneous systems. Any increase in the measured content of dietary fibre and β-d-glucans after baking should primarily be interpreted as a consequence of changes in the extractability and analytical accessibility of the polysaccharide components, rather than as an actual increase in their mass. These findings emphasise the limitations of routine enzymatic and AOAC methods when applied to composite flour systems with different processing histories and highlight the need for analytical data to be interpreted cautiously in the context of matrix-dependent changes.
From a formulation standpoint, a moderate substitution level of approximately 5% was identified as the most suitable compromise between nutritional enrichment and preservation of technological and sensory quality across all tested oat fractions. Higher substitution levels result in pronounced technological limitations, particularly with regard to bran and germinated fractions. Overall, this study provides a framework grounded in analysis for the rational optimisation of fibre-enriched bakery products, contributing to a deeper understanding of the capabilities and limitations of standard analytical methods for determining dietary fibre and β-d-glucans in complex cereal matrices.
The limitations of the study include a relatively small, albeit trained, sensory panel and the use of a simplified hedonic scale. In addition, the number of replicates per treatment was limited to two; however, the variability between replicates was minimal and did not exceed the deviation permitted by the relevant analytical standards. Important areas for future research to optimise recipes include evaluating the glycaemic index and shelf life of oat products, given the proven positive effect of β-d-glucans on glycaemic control and the lower stability of oat products due to the higher susceptibility of fats in oats to oxidation.

Author Contributions

Conceptualization, M.H., L.J. and I.Š.; methodology, M.H., S.G., L.J. and I.Š.; software, I.Š.; validation, M.H. and S.G.; formal analysis, I.Š.; investigation, S.G., P.H. and M.S.; resources, P.H. and M.H.; data curation, L.J. and I.Š.; writing—original draft preparation, L.J.; writing—review and editing, L.J., I.Š. and M.H.; visualisation, I.Š. and L.J.; supervision, M.H.; project administration, M.H. and L.J. All authors have read and agreed to the published version of the manuscript.

Funding

We would like to acknowledge the Slovak Research and Development Agency under project No. APVV-23-0375 and the National Agency for Agricultural Research of the Ministry of Agriculture of the Czech Republic under project QL24010080. The work used [data/tools/services/facilities] provided by the METROFOOD-CZ Research Infrastructure (https://metrofood.cz; accessed on 17 January 2026), supported by the Ministry of Education, Youth, and Sports of the Czech Republic (Project No. LM2023064).

Institutional Review Board Statement

Not applicable.

Informed Consent Statement

Not applicable.

Data Availability Statement

The raw data supporting the conclusions of this article will be made available by the authors on request.

Conflicts of Interest

The authors declare no conflicts of interest.

Abbreviations

AOACAssociation of Official Agricultural Chemists
BGβ-d-glucans
ddiameter of the small bread loaf (bun)
GOPODglucose oxidase, peroxidase, 4-aminoantipyrine
hheight of the small bread loaf (bun)
h/dheight-to-diameter ratio (bread shape indicator)
HClhydrochloric acid
ISOInternational Organisation for Standardisation
MES2-(N-morpholino)ethanesulfonic acid
PCAprincipal component analysis
TDFtotal dietary fibre
TRIStris(hydroxymethyl)aminomethane

References

  1. Mao, R.; Wu, L.; Zhu, N.; Liu, X.; Liu, R.; Li, Y. Naked Oat (Avena nuda L.) Oligopeptides: Immunomodulatory Effects on Innate and Adaptive Immunity in Mice via Cytokine Secretion, Antibody Production, and Th Cells Stimulation. Nutrients 2019, 11, 927. [Google Scholar] [CrossRef]
  2. Paudel, D.; Dhungana, B.; Caffe, M.; Krishnan, P. A Review of Health-Beneficial Properties of Oats. Foods 2021, 10, 2591. [Google Scholar] [CrossRef] [PubMed]
  3. Sur, R.; Nigam, A.; Grote, D.; Liebel, F.; Southall, M.D. Avenanthramides, Polyphenols from Oats, Exhibit Anti-Inflammatory and Anti-Itch Activity. Arch. Dermatol. Res. 2008, 300, 569–574. [Google Scholar] [CrossRef] [PubMed]
  4. Pichler, E.C.; Witlaczil, R.; Hofinger-Horvath, A.; Jágr, M.; Čepková, P.H.; D’Amico, S.; Grausgruber, H.; Dvořáček, V.; Schönlechner, R. Phenolic Compounds, Including Avenanthramides, and Antioxidant Properties in Conventionally and Organically Grown Oat Cultivars Affected by Germination. J. Agric. Food Res. 2025, 23, 102299. [Google Scholar] [CrossRef]
  5. Martínez-Villaluenga, C.; Peñas, E. Health Benefits of Oat: Current Evidence and Molecular Mechanisms. Curr. Opin. Food Sci. 2017, 14, 26–31. [Google Scholar] [CrossRef]
  6. Kim, I.-S.; Hwang, C.-W.; Yang, W.-S.; Kim, C.-H. Multiple Antioxidative and Bioactive Molecules of Oats (Avena sativa L.) in Human Health. Antioxidants 2021, 10, 1454. [Google Scholar] [CrossRef]
  7. Shvachko, N.A.; Loskutov, I.G.; Semilet, T.V.; Popov, V.S.; Kovaleva, O.N.; Konarev, A.V. Bioactive Components in Oat and Barley Grain as a Promising Breeding Trend for Functional Food Production. Molecules 2021, 26, 2260. [Google Scholar] [CrossRef]
  8. Gil-González, A.B.; Sjögren, L.L.E.; Bernfur, K.; Olsson, O.; Zambrano, J.A. Genomic Identification of Expressed Globulin Storage Proteins in Oat. Front. Plant Sci. 2024, 15, 1418658. [Google Scholar] [CrossRef]
  9. Klose, C.; Arendt, E.K. Proteins in Oats; Their Synthesis and Changes during Germination: A Review. Crit. Rev. Food Sci. Nutr. 2012, 52, 629–639. [Google Scholar] [CrossRef]
  10. Kaimainen, M.; Ahvenainen, S.; Kaariste, M.; Järvenpää, E.; Kaasalainen, M.; Salomäki, M.; Salonen, J.; Huopalahti, R. Polar Lipid Fraction from Oat (Avena sativa): Characterization and Use as an o/w Emulsifier. Eur. Food Res. Technol. 2012, 235, 507–515. [Google Scholar] [CrossRef]
  11. Banaś, K.; Harasym, J. Current Knowledge of Content and Composition of Oat Oil—Future Perspectives of Oat as Oil Source. Food Bioproc Technol. 2021, 14, 232–247. [Google Scholar] [CrossRef]
  12. Peterson, D.M. Oat Antioxidants. J. Cereal Sci. 2001, 33, 115–129. [Google Scholar] [CrossRef]
  13. Puganen, A.; Damerau, A.; Pöysä, M.; Lampi, A.-M.; Piironen, V.; Yang, B.; Linderborg, K.M. Lipid and Volatile Profiles of Finnish Oat Batches of Pure Cultivars: Effect of Storage on the Volatile Formation. Food Chem. 2024, 451, 139448. [Google Scholar] [CrossRef]
  14. Ekelund, S.; Gladkauskas, E.; Krause, S.; Sirijovski, N.; Adlercreutz, P.; Rayner, M.; Grey, C.; Tullberg, C. Oat Kilning and Its Effects on Liquid Oat-Base Production. Foods 2024, 13, 4083. [Google Scholar] [CrossRef]
  15. Huo, R.; Zhang, Y.; Zhang, M.; Sun, M.; Miao, Y.; Chen, Y.; Xie, J. Integrative Lipidomics and Proteomics Reveal the Aging Mechanisms of Heat-Treated Oat Flour during Long-Term Storage. Food Chem. X 2025, 27, 102481. [Google Scholar] [CrossRef] [PubMed]
  16. Ciudad-Mulero, M.; Fernández-Ruiz, V.; Matallana-González, M.C.; Morales, P. Dietary Fiber Sources and Human Benefits: The Case Study of Cereal and Pseudocereals. Adv. Food Nutr. Res. 2019, 90, 83–134. [Google Scholar] [PubMed]
  17. Ariyarathna, P.; Mizera, P.; Walkowiak, J.; Dziedzic, K. Physicochemical and Functional Properties of Soluble and Insoluble Dietary Fibers in Whole Grains and Their Health Benefits. Foods 2025, 14, 2447. [Google Scholar] [CrossRef]
  18. Hüttner, E.K.; Bello, F.D.; Arendt, E.K. Rheological Properties and Bread Making Performance of Commercial Wholegrain Oat Flours. J. Cereal Sci. 2010, 52, 65–71. [Google Scholar] [CrossRef]
  19. Maphosa, Y.; Jideani, V.A. Dietary Fiber Extraction for Human Nutrition—A Review. Food Rev. Int. 2016, 32, 98–115. [Google Scholar] [CrossRef]
  20. Decker, E.A.; Rose, D.J.; Stewart, D. Processing of Oats and the Impact of Processing Operations on Nutrition and Health Benefits. Br. J. Nutr. 2014, 112, S58–S64. [Google Scholar] [CrossRef]
  21. Havrlentová, M.; Hlinková, A.; Žofajová, A.; Kováčik, P.; Dvončová, D.; Deáková, Ľ. Effect of Fertilization on SS-D-Glucan Content in Oat Grain (Avena sativa L.). Agriculture 2013, 59, 111–119. [Google Scholar] [CrossRef]
  22. Lazaridou, A.; Biliaderis, C.G. Molecular Aspects of Cereal β-Glucan Functionality: Physical Properties, Technological Applications and Physiological Effects. J. Cereal Sci. 2007, 46, 101–118. [Google Scholar] [CrossRef]
  23. Gajdošová, A.; Petruláková, Z.; Havrlentová, M.; Červená, V.; Hozová, B.; Šturdík, E.; Kogan, G. The Content of Water-Soluble and Water-Insoluble β-d-Glucans in Selected Oats and Barley Varieties. Carbohydr. Polym. 2007, 70, 46–52. [Google Scholar] [CrossRef]
  24. Jurkaninová, L.; Dvořáček, V.; Gregusová, V.; Havrlentová, M. Cereal β-d-Glucans in Food Processing Applications and Nanotechnology Research. Foods 2024, 13, 500. [Google Scholar] [CrossRef]
  25. Liu, R.; Wang, N.; Li, Q.; Zhang, M. Comparative Studies on Physicochemical Properties of Raw and Hydrolyzed Oat β-Glucan and Their Application in Low-Fat Meatballs. Food Hydrocoll. 2015, 51, 424–431. [Google Scholar] [CrossRef]
  26. Mejía, S.M.V.; de Francisco, A.; Bohrer, B.M. A Comprehensive Review on Cereal β-Glucan: Extraction, Characterization, Causes of Degradation, and Food Application. Crit. Rev. Food Sci. Nutr. 2020, 60, 3693–3704. [Google Scholar] [CrossRef] [PubMed]
  27. Wang, Q.; Ellis, P.R. Oat β-Glucan: Physico-Chemical Characteristics in Relation to Its Blood-Glucose and Cholesterol-Lowering Properties. Br. J. Nutr. 2014, 112, S4–S13. [Google Scholar] [CrossRef]
  28. Zhang, P.-P.; Hu, X.-Z.; Zhen, H.-M.; Xu, C.; Fan, M.-T. Oat β-Glucan Increased ATPases Activity and Energy Charge in Small Intestine of Rats. J. Agric. Food Chem. 2012, 60, 9822–9827. [Google Scholar] [CrossRef] [PubMed]
  29. Silva, V.d.O.; de Moura, N.O.; de Oliveira, L.J.R.; Peconick, A.P.; Pereira, L.J. Promising Effects of Beta-Glucans on Metabolism and on the Immune Responses: Review Article. Am. J. Immunol. 2017, 13, 62–72. [Google Scholar] [CrossRef]
  30. Dong, Y.; Chen, L.; Gutin, B.; Zhu, H. Total, Insoluble, and Soluble Dietary Fiber Intake and Insulin Resistance and Blood Pressure in Adolescents. Eur. J. Clin. Nutr. 2019, 73, 1172–1178. [Google Scholar] [CrossRef]
  31. Singh, S.; Gamlath, S.; Wakeling, L. Nutritional Aspects of Food Extrusion: A Review. Int. J. Food Sci. Technol. 2007, 42, 916–929. [Google Scholar] [CrossRef]
  32. Zhang, M.; Liang, Y.; Pei, Y.; Gao, W.; Zhang, Z. Effect of Process on Physicochemical Properties of Oat Bran Soluble Dietary Fiber. J. Food Sci. 2009, 74, C628–C636. [Google Scholar] [CrossRef]
  33. Zhang, M.; Bai, X.; Zhang, Z. Extrusion Process Improves the Functionality of Soluble Dietary Fiber in Oat Bran. J. Cereal Sci. 2011, 54, 98–103. [Google Scholar] [CrossRef]
  34. Cleary, L.; Andersson, R.; Brennan, C. The Behaviour and Susceptibility to Degradation of High and Low Molecular Weight Barley β-Glucan in Wheat Bread during Baking and In Vitro Digestion. Food Chem. 2007, 102, 889–897. [Google Scholar] [CrossRef]
  35. Djurle, S.; Andersson, A.A.M.; Andersson, R. Effects of Baking on Dietary Fibre, with Emphasis on β-Glucan and Resistant Starch, in Barley Breads. J. Cereal Sci. 2018, 79, 449–455. [Google Scholar] [CrossRef]
  36. Henrion, M.; Francey, C.; Lê, K.-A.; Lamothe, L. Cereal B-Glucans: The Impact of Processing and How It Affects Physiological Responses. Nutrients 2019, 11, 1729. [Google Scholar] [CrossRef] [PubMed]
  37. Lebesi, D.M.; Tzia, C. Use of Endoxylanase Treated Cereal Brans for Development of Dietary Fiber Enriched Cakes. Innov. Food Sci. Emerg. Technol. 2012, 13, 207–214. [Google Scholar] [CrossRef]
  38. Rieder, A.; Holtekjølen, A.K.; Sahlstrøm, S.; Moldestad, A. Effect of Barley and Oat Flour Types and Sourdoughs on Dough Rheology and Bread Quality of Composite Wheat Bread. J. Cereal Sci. 2012, 55, 44–52. [Google Scholar] [CrossRef]
  39. Hager, A.-S.; Ryan, L.A.M.; Schwab, C.; Gänzle, M.G.; O’Doherty, J.V.; Arendt, E.K. Influence of the Soluble Fibres Inulin and Oat β-Glucan on Quality of Dough and Bread. Eur. Food Res. Technol. 2011, 232, 405–413. [Google Scholar] [CrossRef]
  40. Tiwari, U.; Cummins, E. Factors Influencing Β-Glucan Levels and Molecular Weight in Cereal-Based Products. Cereal Chem. 2009, 86, 290–301. [Google Scholar] [CrossRef]
  41. Andersson, A.A.M.; Armö, E.; Grangeon, E.; Fredriksson, H.; Andersson, R.; Åman, P. Molecular Weight and Structure Units of (1 → 3, 1 → 4)-β-Glucans in Dough and Bread Made from Hull-Less Barley Milling Fractions. J. Cereal Sci. 2004, 40, 195–204. [Google Scholar] [CrossRef]
  42. AOAC Official Method 925.10; Total Moisture Determination AOAC Offical Method 925.10 Air Oven Method. AOAC International: Rockville, MD, USA, 2023.
  43. AOAC Official Method 992.23; AOAC Official Method 992.23 Crude Protein in Cereal Grains and Oilseeds. AOAC International: Rockville, MD, USA, 2023.
  44. AOAC Official Method 995.16; AOAC Official Method 995.16 β-D-Glucan in Oats: Streamlined Enzymatic Method. AOAC International: Rockville, MD, USA, 2023.
  45. McCleary, B.V.; Codd, R. Measurement of (1 → 3),(1 → 4)-β-D-glucan in Barley and Oats: A Streamlined Enzymic Procedure. J. Sci. Food Agric. 1991, 55, 303–312. [Google Scholar] [CrossRef]
  46. AOAC Official Method 991.43; AOAC Official Method 991.43 Total, Soluble, and Insoluble Dietary Fibre in Foods. AOAC International: Rockville, MD, USA, 2023.
  47. Letellier, M.; Budzinski, H. Microwave Assisted Extraction of Organic Compounds. Analusis 1999, 27, 259–270. [Google Scholar] [CrossRef]
  48. Mandal, V.; Mohan, Y.; Hemalatha, S. Microwave Assisted Extraction—An Innovative Adsorption-Enhanced Method. Pharmacogn. Rev. 2007, 1, 7–18. [Google Scholar]
  49. ISO 10520:1997; Native Starch—Determination of Satrch Content—Ewers Polarimetric Method. International Organization of Standard: Geneva, Switzerland, 1997.
  50. ISO 8589:2007; Sensory Analysis—General Guidance for the Design of Test Rooms. International Organization of Standard: Geneva, Switzerland, 2007.
  51. Shewry, P.R.; Hey, S.J. The Contribution of Wheat to Human Diet and Health. Food Energy Secur. 2015, 4, 178–202. [Google Scholar] [CrossRef]
  52. Khalid, A.; Hameed, A.; Tahir, M.F. Wheat Quality: A Review on Chemical Composition, Nutritional Attributes, Grain Anatomy, Types, Classification, and Function of Seed Storage Proteins in Bread Making Quality. Front Nutr. 2023, 10, 1053196. [Google Scholar] [CrossRef]
  53. Grundy, M.M.-L.; Fardet, A.; Tosh, S.M.; Rich, G.T.; Wilde, P.J. Processing of Oat: The Impact on Oat’s Cholesterol Lowering Effect. Food Funct. 2018, 9, 1328–1343. [Google Scholar] [CrossRef]
  54. Vaishnavi; Mamta. Oats. In Cereals and Nutraceuticals; Springer Nature: Singapore, 2024; pp. 81–106. [Google Scholar]
  55. Åman, P.; Rimsten, L.; Andersson, R. Molecular Weight Distribution of β-Glucan in Oat-Based Foods. Cereal Chem. 2004, 81, 356–360. [Google Scholar] [CrossRef]
  56. de la Rosa-Millan, J. The Role of Molecular and Structural Characteristics of Starch, Hydrocolloids, and Gluten in Bread In Vitro Digestibility. Polysaccharides 2025, 6, 46. [Google Scholar] [CrossRef]
  57. Cao, H.; Wang, C.; Li, R.; Guan, X.; Huang, K.; Zhang, Y. Influence of Sprouted Oat Flour Substitution on the Texture and in Vitro Starch Digestibility of Wheat Bread. Food Chem. X 2022, 15, 100428. [Google Scholar] [CrossRef]
  58. Krapf, J.; Kandzia, F.; Brühan, J.; Walther, G.; Flöter, E. Sprouting of Oats: A New Approach to Quantify Compositional Changes. Cereal Chem. 2019, 96, 994–1003. [Google Scholar] [CrossRef]
  59. Popa, C.-N.; Tamba-Berehoiu, R.-M. Oat Flour in Bread Manufacturing. In Trends in Wheat and Bread Making; Elsevier: Amsterdam, The Netherlands, 2021; pp. 279–309. [Google Scholar]
  60. Shen, M.; Huang, K.; Cao, H.; Zhang, Y.; Sun, Z.; Yu, Z.; Guan, X. Rheological, Thermal, and In Vitro Starch Digestibility Properties of Oat Starch-Lipid Complexes. Int. J. Biol. Macromol. 2024, 268, 131550. [Google Scholar] [CrossRef]
  61. Li, X.; Wu, Y.; Duan, R.; Yu, H.; Liu, S.; Bao, Y. Research Progress in the Extraction, Structural Characteristics, Bioactivity, and Commercial Applications of Oat β-Glucan: A Review. Foods 2024, 13, 4160. [Google Scholar] [CrossRef] [PubMed]
  62. McCleary, B.V. Measurement of Dietary Fiber: Which AOAC Official Method of Analysis SM to Use. J. AOAC Int. 2023, 106, 917–930. [Google Scholar] [CrossRef]
  63. Hübner, F.; Arendt, E.K. Studies on the Influence of Germination Conditions on Protein Breakdown in Buckwheat and Oats. J. Inst. Brew. 2010, 116, 3–13. [Google Scholar] [CrossRef]
  64. Havrlentová, M.; Jurkaninová, L.; Švec, I.; Jánoška, D.; Klimáčková, J.; Hendrichová, J.; Hozlár, P.; Gavurníková, S. Nutritional and Sensory Enhancement of Traditional Wheat-Based Yeasted Steamed Dumplings through Oat Flour Fortification. Front. Nutr. 2025, 12, 1676290. [Google Scholar] [CrossRef]
  65. Ruja, A.; Cozma, A.; Cozma, B.; Horablaga, N.M.; Dinulescu, C.; Alexa, E.; Buzna, C.; Cocan, I.; Berbecea, A.; Dossa, S.; et al. Nutritional, Phytochemical, and Rheological Profiles of Different Oat Varieties and Their Potential in the Flour Industry. Agronomy 2024, 14, 1438. [Google Scholar] [CrossRef]
  66. Saroj, R.; Kaur, S.; Malik, M.A.; Puranik, V.; Kaur, D. Thermal Processing of Wheat Bran: Effect on the Bioactive Compounds and Dietary Fiber. Bioact. Carbohydr. Diet. Fibre 2024, 32, 100433. [Google Scholar] [CrossRef]
  67. Astiz, V.; Guardianelli, L.M.; Salinas, M.V.; Brites, C.; Puppo, M.C. High β-Glucans Oats for Healthy Wheat Breads: Physicochemical Properties of Dough and Breads. Foods 2022, 12, 170. [Google Scholar] [CrossRef]
  68. Fang, F.; He, Y.; Zhao, J.; Zhang, Y.; Chen, C.; He, H.; Wu, Q.; Hu, M.; Nie, S.; Xie, M.; et al. Effects of Boiling and Steaming Process on Dietary Fiber Components and In Vitro Fermentation Characteristics of 9 Kinds of Whole Grains. Food Res. Int. 2023, 164, 112328. [Google Scholar] [CrossRef]
  69. Németh, R.; Farkas, A.; Martin, E.; Gaál, A.; Schall, E.; Szilágyi, R.; Tömösközi, S. Investigation of the Functionality of Macromolecules in the Rheological and Baking Properties of Oat Milling Fractions. Food Hydrocoll. 2024, 146, 109241. [Google Scholar] [CrossRef]
  70. Nikolić, V.; Žilić, S.; Simić, M.; Šavikin, K.; Stević, T.; Živković, J.; Sarić, B.; Milovanović, D.; Kandić Raftery, V. Characterization and Potential Food Applications of Oat Flour and Husks from Differently Colored Genotypes as Novel Nutritional Sources of Bioactive Compounds. Foods 2024, 13, 3853. [Google Scholar] [CrossRef] [PubMed]
  71. Li, C.; Jeong, D.; Lee, J.H.; Chung, H.-J. Influence of Germination on Physicochemical Properties of Flours from Brown Rice, Oat, Sorghum, and Millet. Food Sci. Biotechnol. 2020, 29, 1223–1231. [Google Scholar] [CrossRef] [PubMed]
  72. Sammalisto, S.; Laitinen, M.; Katina, K.; Sontag-Strohm, T. The Role of Hydrothermal Treatment (Steaming and Tempering) Parameters on Oat Groat, Flake and Flour Properties. LWT—Food Sci. Technol. 2022, 171, 114137. [Google Scholar] [CrossRef]
  73. Wyrwisz, J.; Moczkowska-Wyrwisz, M.; Kurek, M.A. Modeling of Texture and Starch Retrogradation of High-in-Fiber Bread Using Response Surface Methodology. Appl. Sci. 2024, 14, 11603. [Google Scholar] [CrossRef]
  74. Hollmann, J.; Themeier, H.; Neese, U.; Lindhauer, M.G. Dietary Fibre Fractions in Cereal Foods Measured by a New Integrated AOAC Method. Food Chem. 2013, 140, 586–589. [Google Scholar] [CrossRef] [PubMed]
  75. Varo, P.; Veijalainen, K.; Koivistoinen, P. Effect of Heat Treatment on the Dietary Fibre Contents of Potato and Tomato. Int. J. Food Sci. Technol. 1984, 19, 485–492. [Google Scholar] [CrossRef]
  76. Hu, X.; Zhao, J.; Zhao, Q.; Zheng, J. Structure and Characteristic of β-Glucan in Cereal: A Review. J. Food Process Preserv. 2015, 39, 3145–3153. [Google Scholar] [CrossRef]
  77. Sibakov, J.K.; Kirjoranta, S.J.; Alam, S.A.; Kokkonen, H.; Jurvelin, J.S.; Jouppila, K.; Poutanen, K.S.; Sozer, N. Effect of Oat Bran Fractions on Extrudates Made of Defatted Oats. Food Bioproc Technol. 2015, 8, 445–458. [Google Scholar] [CrossRef]
  78. Ortiz de Erive, M.; He, F.; Wang, T.; Chen, G. Development of β-Glucan Enriched Wheat Bread Using Soluble Oat Fiber. J. Cereal Sci. 2020, 95, 103051. [Google Scholar] [CrossRef]
  79. Gao, M.; Hu, Z.; Yang, Y.; Jin, Z.; Jiao, A. Effect of Different Molecular Weight β-Glucan Hydrated with Highland Barley Protein on the Quality and In Vitro Starch Digestibility of Whole Wheat Bread. Int. J. Biol. Macromol. 2024, 268, 131681. [Google Scholar] [CrossRef]
  80. Wang, X.; Peng, C.; Fan, J.; Si, H.; Sun, S.; Dong, X.; Wang, H.; Wang, Y.; Deng, P.; Peng, L. Comparative Analysis of β-Glucan, Phenolic Compounds, and Targeted Metabolomics in Whole-Grain Highland Barley Varieties: Effects of Cooking-Induced Changes. Food Chem. X 2025, 29, 102675. [Google Scholar] [CrossRef] [PubMed]
  81. Lante, A.; Canazza, E.; Tessari, P. Beta-Glucans of Cereals: Functional and Technological Properties. Nutrients 2023, 15, 2124. [Google Scholar] [CrossRef] [PubMed]
  82. Zhang, Y.; Li, J.; Xie, J.; Xue, B.; Li, X.; Gan, J.; Sun, T. The Impact of Food Processing on the Structure and Hypoglycemic Effect of Oat β-Glucan. Plant Foods Hum. Nutr. 2023, 78, 506–511. [Google Scholar] [CrossRef] [PubMed]
  83. Cao, H.; Gao, F.; Shen, H.; Su, Q.; Guan, X.; Sun, Z.; Yu, Z. Influence of Partial Substitution of Wheat Flour with Sprouted Oat Flours on Physicochemical and Textural Characteristics of Wheat Bread. J. Cereal Sci. 2023, 110, 103649. [Google Scholar] [CrossRef]
  84. Schmidt, M.; Sciurba, E.; Nikolay, S.; Hüsken, A.; Smit, I. Relevance of β-Glucan Molecular Properties on Its Suitability as Health Promoting Bread Ingredient. Nutrients 2022, 14, 1570. [Google Scholar] [CrossRef]
  85. Londono, D.M.; Gilissen, L.J.W.J.; Visser, R.G.F.; Smulders, M.J.M.; Hamer, R.J. Understanding the Role of Oat β-Glucan in Oat-Based Dough Systems. J. Cereal Sci. 2015, 62, 1–7. [Google Scholar] [CrossRef]
  86. Miranda, C.G.; Garcia, Y.R.; Ai, Y.; Nickerson, M.T. Oat Protein Extraction: The Role of Oat Flour Composition on Extraction Yield, Purity, and Functionality. Food Chem. 2025, 492, 145377. [Google Scholar] [CrossRef]
  87. Mustafa, G.; Arshad, M.U.; Saeed, F.; Afzaal, M.; Niaz, B.; Hussain, M.; Raza, M.A.; Nayik, G.A.; Obaid, S.A.; Ansari, M.J.; et al. Comparative Study of Raw and Fermented Oat Bran: Nutritional Composition with Special Reference to Their Structural and Antioxidant Profile. Fermentation 2022, 8, 509. [Google Scholar] [CrossRef]
  88. Sergiacomo, A.; Bresciani, A.; Marti, A. Sprouting of Oats: A Review on the Relationship between Processing Conditions and Chemico-Physical Properties of Flour. Crit. Rev. Food Sci. Nutr. 2025, 65, 7774–7791. [Google Scholar] [CrossRef]
  89. Rashed, M.S.; Pojić, M.; McDonagh, C.; Gallagher, E.; Frias, J.M.; Pathania, S. Structure-function Relationship of Oat Flour Fractions When Blended with Wheat Flour: Instrumental and Nutritional Quality Characterization of Resulting Breads. J. Food Sci. 2024, 89, 3347–3368. [Google Scholar] [CrossRef]
  90. Holopainen-Mantila, U.; Vanhatalo, S.; Lehtinen, P.; Sozer, N. Oats as a Source of Nutritious Alternative Protein. J. Cereal Sci. 2024, 116, 103862. [Google Scholar] [CrossRef]
  91. Bagarinao, N.C.; King, J.; Leong, S.Y.; Agyei, D.; Sutton, K.; Oey, I. Effect of Germination on Seed Protein Quality and Secondary Metabolites and Potential Modulation by Pulsed Electric Field Treatment. Foods 2024, 13, 1598. [Google Scholar] [CrossRef]
  92. Goesaert, H.; Brijs, K.; Veraverbeke, W.S.; Courtin, C.M.; Gebruers, K.; Delcour, J.A. Wheat Flour Constituents: How They Impact Bread Quality, and How to Impact Their Functionality. Trends Food Sci. Technol. 2005, 16, 12–30. [Google Scholar] [CrossRef]
  93. Qian, X.; Sun, B.; Ma, S.; Liu, C.; Wang, X. The Role of Lipids in Determining the Gas Cell Structure of Gluten-Free Steamed Oat Cake. Food Hydrocoll. 2024, 148, 109460. [Google Scholar] [CrossRef]
  94. Saka, M.; Özkaya, B.; Saka, İ. The Effect of Bread-Making Methods on Functional and Quality Characteristics of Oat Bran Blended Bread. Int. J. Gastron. Food Sci. 2021, 26, 100439. [Google Scholar] [CrossRef]
  95. Renzetti, S.; Theunissen, M.; Horrevorts, K. A Systematic Comparison of the Intrinsic Properties of Wheat and Oat Bran Fractions and Their Effects on Dough and Bread Properties: Elucidation of Chemical Mechanisms, Water Binding, and Steric Hindrance. Foods 2021, 10, 2311. [Google Scholar] [CrossRef]
  96. Wu, Y.; Wang, T.; de Erive, M.O.; Chen, G. Pre-Saturation of Bran as a Strategy for Developing Oat Bran-Enriched Bread. Foods 2025, 14, 2071. [Google Scholar] [CrossRef] [PubMed]
  97. Janssen, F.; Wouters, A.G.B.; Linclau, L.; Waelkens, E.; Derua, R.; Dehairs, J.; Moldenaers, P.; Vermant, J.; Delcour, J.A. The Role of Lipids in Determining the Air-Water Interfacial Properties of Wheat, Rye, and Oat Dough Liquor Constituents. Food Chem. 2020, 319, 126565. [Google Scholar] [CrossRef] [PubMed]
  98. Doehlert, D.C.; Moreau, R.A.; Welti, R.; Roth, M.R.; McMullen, M.S. Polar Lipids from Oat Kernels. Cereal Chem. 2010, 87, 467–474. [Google Scholar] [CrossRef]
  99. Huang, Z.; Zhao, Y.; Zhu, K.; Guo, X.; Peng, W.; Zhou, H. Effect of Barley β-glucan on Water Redistribution and Thermal Properties of Dough. Int. J. Food Sci. Technol. 2019, 54, 2329–2337. [Google Scholar] [CrossRef]
  100. Welc-Stanowska, R.; Karp, S.; Kurek, M.; Miś, A.; Nawrocka, A. Effect of β-Glucans on Water Redistribution and Gluten Structure in a Model Dough during the Mixing Process. Int. Agroph. 2023, 37, 151–158. [Google Scholar] [CrossRef]
  101. He, X.; Li, X.; Chen, D.; Huang, S.; Tao, N. Effect on Bread Properties of Partial Substitution of Wheat Flour with Oat Flour and Flour from Oat Grain Germinated in the Light or Dark. Int. J. Food Sci. Technol. 2023, 58, 1979–1986. [Google Scholar] [CrossRef]
  102. Jaworska, D.; Królak, M.; Jeżewska-Zychowicz, M. Reformulation of Bread Rolls Using Oat Fibre: An Acceptable Way of Dietary Fibre Enrichment? Nutr. Bull. 2020, 45, 189–198. [Google Scholar] [CrossRef]
  103. McGorrin, R.J. Key Aroma Compounds in Oats and Oat Cereals. J. Agric. Food Chem. 2019, 67, 13778–13789. [Google Scholar] [CrossRef] [PubMed]
  104. Li, X.; Oey, I.; Kebede, B. Effect of Industrial Processing on the Volatiles, Enzymes and Lipids of Wholegrain and Rolled Oats. Food Res. Int. 2022, 157, 111243. [Google Scholar] [CrossRef] [PubMed]
  105. Tian, B.; Xie, B.; Shi, J.; Wu, J.; Cai, Y.; Xu, T.; Xue, S.; Deng, Q. Physicochemical Changes of Oat Seeds during Germination. Food Chem. 2010, 119, 1195–1200. [Google Scholar] [CrossRef]
  106. Yi, K.; Gao, L.; Xu, Y.; Yang, J.; Mao, P.; Dou, L.; Li, M. Lipid Remodeling and Response Mechanisms during the Germination of Aged Oat Seeds. BMC Plant Biol. 2025, 25, 186. [Google Scholar] [CrossRef]
  107. Verbeke, C.; Debonne, E.; Versele, S.; Van Bockstaele, F.; Eeckhout, M. Technological Evaluation of Fiber Effects in Wheat-Based Dough and Bread. Foods 2024, 13, 2582. [Google Scholar] [CrossRef]
  108. Heiniö, R.L.; Noort, M.W.J.; Katina, K.; Alam, S.A.; Sozer, N.; de Kock, H.L.; Hersleth, M.; Poutanen, K. Sensory Characteristics of Wholegrain and Bran-Rich Cereal Foods—A Review. Trends Food Sci. Technol. 2016, 47, 25–38. [Google Scholar] [CrossRef]
  109. Żakowska-Biemans, S.; Kostyra, E. Sensory Profile, Consumers’ Perception and Liking of Wheat–Rye Bread Fortified with Dietary Fibre. Appl. Sci. 2023, 13, 694. [Google Scholar] [CrossRef]
Figure 1. Comparison of the basic chemical composition of wheat flour (WF, control) and 4 oat forms used for fortification. TDF—total dietary fibre; BG—β-d-glucans; OFLO—oat wholegrain flour (from natural grains); OB—oat bran (commercial); OFLA—oat flakes (milled commercial); OSG—wholegrain flour from laboratory-sprouted grains. Note: a–e: different letters across the columns identify statistically significant difference (p = 95%).
Analytica 07 00010 g001
Figure 2. Effect of oat form/addition level and heat treatment on the content of total dietary fibre (TDF) in wheat flour-based blends. WF—wheat flour; OFLO—oat wholegrain flour (from natural grains); OB—oat bran (commercial); OFLA—(milled commercial) oat flakes; OSG—wholegrain flour from laboratory-sprouted grains. Note: a–h: for 2 × 13 samples, different letters across the columns identify a statistically significant difference (p = 95%); A–C: for 2 × 5 averages, different letters identify a statistically significant difference among the WF and groups WF + OFLO, …, WF + OSG in non-treated and heat-treated (baked) forms (p = 95%).
Analytica 07 00010 g002
Figure 3. Effect of oat form/addition level and heat treatment on the content of β-d-glucans (BG) in wheat flour-based blends. WF—wheat flour; OFLO—oat wholegrain flour (from natural grains); OB—oat bran (commercial); OFLA—oat flakes (milled commercial); OSG—wholegrain flour from laboratory-sprouted grains. Note: a–j: for 2 × 13 samples, different letters across the columns identify a statistically significant difference (p = 95%); A–C: for 2 × 5 averages, different letters identify a statistically significant difference among the WF and groups WF + OFLO, …, WF + OSG in non-treated and heat-treated (baked) forms (p = 95%).
Analytica 07 00010 g003
Figure 4. Wheat and wheat–oat breads—a comparison of group averages of variants containing oat wholegrain flour (OFLO), oat bran (OB), milled oat flakes (OFLA), or milled–dried oat sprouted grain (OSG); h/d: height-to-diameter ratio (small bread shape as its vaulting); averages over the oat additions 5, 10, and 15%. Note: a–d: averages signed by the same letter are not statistically different (two-factor ANOVA, p = 95%); for the round bread type tested, h/d in a range of 0.60–0.65 is usually considered optimal.
Analytica 07 00010 g004
Figure 5. Comparison of overall and crumb appearance of the control wheat bread (WF) and wheat–oat breads. Forms of oat tested: Wholegrain oat flour (OFLO), oat bran (OB), milled oat flakes (OFLA), or milled–dried oat sprouted grain (OSG) at levels 5, 10, or 15% as the WF replacement.
Analytica 07 00010 g005
Figure 6. Histogram of the sensorial profile—point sums, given by 7 assessors for 13 tested bread variants (N = 91). Note: In total, 12 sensorial profiles reached a sum of <40 pts. (13% of observations—the first three blue columns from the left); : points of the Cumulative percentage.
Analytica 07 00010 g006
Figure 7. Variability plot of sensory acceptability of the wheat bread (WF) and wheat–oat bread (∆, N = 91). Forms of oat: wholegrain flour (OFLO), oat bran (OB), milled oat flakes (OFLA), or milled–dried oat sprouted grain (OSG) at levels 5, 10, or 15% as WF replacement. Note: a–c: columns signed by the same letter are not statistically different (p = 95%). A–B: bread groups signed by the same letter are not statistically different (p = 95%).
Analytica 07 00010 g007
Figure 8. Comparison of the sensory attributes of wheat (WF) and wheat–oat breads with: (a) wholegrain flour (OFLO), (b) oat bran (OB), (c) milled oat flakes (OFLA), or (d) dried–milled oat sprouted grain (OSG) at levels 5, 10, or 15% as WF substitution. Attributes 1–11: bread’s overall appearance and shape, crust characteristics (colour, thickness, and hardness), and the crumb ones (aroma, taste, elasticity, porosity, colour, firmness, and stickiness of mouthful), plus the overall impression, respectively.
Analytica 07 00010 g008
Figure 9. Principal Components Analysis of 4 oat forms and their heat treatment in composition, physical parameters of the control wheat flour, and 13 variants of bread. (a) plot of variable loadings (TDF, BG—total dietary fibre and β-d-glucan contents, respectively); from the centre, circles expressed stepwise 25, 50, 75, or 100% of the parameters scatter explained by principal components sum PC1 + PC2; (b) plot of sample scores; circles centred above the WF control expressed stepwise 75, 50, and 25% statistical similarity to this control flour/bread. Note: Forms of oat added (as the WF replacement): wholegrain flour (OFLO), oat bran (OB), milled oat flakes (OFLA), dried-milled sprouted oat grain (OSG) at levels 5, 10, or 15%.
Analytica 07 00010 g009
Table 1. Effect of addition of four forms of oat and heat treatment on basic chemical composition of wheat flour (WF), for form of oat and wheat–oat binary blends (ANOVA, p = 95%).
Sample FormFlour, Flour Mix, BreadOat Add. (%)Lipids (%)Starch (%)Proteins (%)
FlourFlour typeControlWF01.45a–f1.45AB78.28n78.28D14.70d–i14.70A
Oat formOFLO1003.22i5.07C61.32b60.00A12.28a15.67AB
OB1005.81j51.17a17.69n
OFLA1005.55j64.79cd14.04b
OSG1005.72j62.74bc18.68o
Binary blendWF-OFLO51.72c–h1.89AB77.27mn75.39D14.82g–j14.87A
101.93e–h74.92jkl14.87g–k
152.02fgh74.00ijk14.93i–l
WF-OB51.68c–h1.96B75.29j–m74.36BCD14.73e–i14.84A
101.96fgh74.45jkl14.87h–k
152.25h73.35ij14.92i–l
WF-OFLA51.68c–h1.94B77.49mn76.36D14.59c–g14.52A
101.93e–h76.16k–n14.53c–f
152.21h75.43j–m14.43cd
WF-OSG51.69c–h1.87AB76.37lmn75.59D14.81f–j14.94A
101.85e–h76.14k–n14.94i–l
152.08gh74.25jkl15.08j–m
BreadFlourWFb01.56b–g1.56AB71.71hi71.71ABCD14.74e–i14.74A
Binary blendWF-OFLOb50.95a1.02A69.46fgh69.97AB14.94i–l15.09AB
101.14abc69.40fgh14.97i–l
150.97ab66.97de15.36m
WF-OBb51.74d–h1.81AB70.69fgh68.61A14.72e–i14.99A
101.82e–h69.29fg15.14klm
151.86e–h69.92fgh15.10klm
WF-OFLAb51.36a–e1.43AB70.50fgh70.52ABC14.60c–h14.48A
101.36a–e70.99gh14.51cde
151.58c–g70.08fgh14.34c
WF-OSGb51.22a–d1.34AB69.90fgh69.15A14.77ei14.97A
101.35a–e68.92efg14.97i–l
151.45a–f68.63ef15.18lm
Note: a–o: in columns, different letters identify a statistically significant difference among samples (N = 30, p = 95%). A–D: different letters identify a statistically significant difference among the WF and averages of 5 binary flour blends plus the resulting breads (N = 10, p = 95%).
Table 2. Wheat bread physical parameters as affected by the addition of four forms of oats at three replacement levels.
Flour,
Flour
Mix
Oat
Add.
(%)
Bun Height
(cm)
Bun Diameter
(cm)
Bread Weight *
(g)
Bread Volume *
(cm3)
WFb05.7e; C8.7abc; AB355.1a; AB1170e; B
WF +
OFLOb
54.3bcd4.1A9.1bc9.1B356.8a358.4B1130de1028AB
104.1a–d9.3cd358.2a1035bc
153.9abc9.0abc360.3a920a
WF +
OBb
55.0de4.8B8.7abc8.6A361.6a362.8B965ab1000A
104.6cd8.4a360.0a990ab
154.9de8.7abc366.8a1045bcd
WF +
OFLAb
54.9de4.8B8.7abc8.7A355.0a356.2B1055bcd1045AB
104.8d8.6ab358.7a1030bc
154.6cd8.7abc355.0a1050bcd
WF +
OSGb
54.2a–d3.7A9.7de10.0C339.6a340.5A1130de1097B
103.6ab10.3e342.2a1110cde
153.4a10.2e339.6a1050bcd
Note: WF—wheat flour; Oat forms: OFLO—wholegrain oat flour; OB—oat bran; OFLA—(milled) oat flakes; OSG (milled) sprouted oat grain; “b” means “baked”—e.g., WF + 5OSGb means bread baked from this binary flour blend. *: For both parameters, 5 pieces of small bread (buns) measured together; a–e: in columns, averages of 13 bread samples signed by the same letter are not statistically different (p = 95%). A–C: In columns, averages of 5 groups of samples signed by the same letter are not statistically different (p = 95%).
Table 3. One and two-factor ANOVA of the selected results of sensory analysis—effect of fortification of wheat bread by four types of milled oat grain at three distinctive levels (p = 95%).
Bread
Variant
Oat
Add.
(%)
Bread Shape
and Appearance
(pts.)
Crust Colour
(pts.)
Crust and Crumb
Taste (pts.)
Crumb Stiffness
(pts.)
WFb05.00 d; C4.86 c; B4.14 a; AB4.43 a; A
WF + OFLOb54.00bcd3.86B4.86c4.67B4.43a4.08AB4.57a4.14A
103.86bcd4.71bc4.10a4.00a
153.71bc4.43abc3.71a3.86a
WF + OBb54.86cd4.76C4.86c4.81B4.71a4.81B4.29a4.29A
104.71cd4.57abc5.00a4.14a
154.71cd5.00c4.71a4.43a
WF + OFLAb54.29cd4.33BC4.57abc4.62B4.71a4.71B3.86a3.95A
104.57cd4.71bc4.71a3.86a
154.14bcd4.57abc4.71a4.14a
WF + OSGb53.00ab2.38A3.57a3.67A3.86a3.76A4.14a4.00A
102.13a3.71ab3.71a4.00a
152.00a3.71ab3.71a3.86a
Note: Bread variant: WFb—wheat control; WF + OFLOb—wheat–oat flour one; WF + OBb—wheat–oat bran one; WF + OFLA—wheat–oat flakes one; WF + OSG—wheat–oat sprouted-grain one. a–d: between 13 bread samples, averages in columns, signed by the same letter, are not statistically different (p = 95%). A–C: between 5 bread groups, averages in columns, signed by the same letter, are not statistically different (p = 95%).
Table 4. Correlation analysis between the wheat–oat flour composition, bread physical parameters, and wheat–oat bread composition.
VariableFlour
TDF
Flour
BG
Flour
Lipids
Flour
Starch
Flour
Proteins
Bread
Shape
h/d
Bread
Specific
Volume
Bread
Sensory
Acceptability
Flour TDF10.72***0.68***−0.71***0.26ns0.13ns−0.44*0.18ns
Flour BG0.72***10.78***−0.77***0.08ns0.07ns−0.75***0.08ns
Flour lipids0.68***0.78***1−0.75***0.15ns−0.27ns−0.42*−0.04ns
Flour starch−0.71***−0.77***−0.75***1−0.46*0.31ns0.60**0.18ns
Flour proteins0.26ns0.08ns0.15ns−0.46*1−0.60**0.02ns−0.44*
Bread shape h/d0.13ns0.07ns−0.27ns0.31ns−0.60**1−0.21ns0.54**
Bread specific volume−0.44*−0.75***−0.42*0.60**0.02ns−0.21ns1−0.12ns
Bread sensory acceptability0.18ns0.08ns−0.04ns0.18ns−0.44*0.54**−0.12ns1
Bread TDF0.85***0.82***0.82***−0.81***0.27ns−0.13ns−0.57**0.05ns
Bread BG0.86***0.89***0.76***−0.68***−0.05ns0.21ns−0.67***0.19ns
Bread lipids0.63***0.22ns0.21ns−0.26ns−0.11ns0.48*−0.18ns0.28ns
Bread starch−0.70***−0.54**−0.63***0.69***−0.59**0.37ns0.23ns0.28ns
Bread proteins0.37ns0.29ns0.23ns−0.53**0.92***−0.45*−0.24ns−0.30ns
Note: TDF–total dietary fibre, BG—β-d-glucans; ns, *, **, ***: pair correlation non-significant (p < 95%), or significant at p = 95%, 99% or 99.9%, respectively (N = 26).
Table 5. Communalities, a percentage of explained data scatter by the first three principal components (PC).
VariablePC1PC2PC3Sum
PC1–3
Flour TDF 179%*5%11%95%
Flour BG 278% *5%9%92%
Flour lipids70% *0%4%74%
Flour starch82% *3%1%86%
Flour proteins14%67% *8%89%
Bread shape h/d 32%73% *3%78%
Bread specific volume41% *8%18%67%
Bread sensory acceptability0%49% *1%50%
Bread TDF 187% *0%0%88%
Bread BG 275% *16%2%93%
Bread lipids15%27%47% *89%
Bread starch60% *10%12%82%
Bread proteins26%43% *1%70%
Average48%24%9%81%
1, 2 Total dietary fibre and β-d-glucan content, respectively; 3 bread shape (vaulting) as the height-to-diameter ratio. Note: * Pair correlation of the variable and principal component is significant at p = 95% (other pair correlations were statistically insignificant); underlined italics value format signifies a negative relationship within the proper pair.
Disclaimer/Publisher’s Note: The statements, opinions and data contained in all publications are solely those of the individual author(s) and contributor(s) and not of MDPI and/or the editor(s). MDPI and/or the editor(s) disclaim responsibility for any injury to people or property resulting from any ideas, methods, instructions or products referred to in the content.