Article

Investigation of Halloumi Cheese Adulteration Due to the Addition of Milk Powder Using BET and FTIR Measurements

by
Maria Tarapoulouzi
1,*,
Małgorzata Ruggiero-Mikołajczyk
2,
Ioannis Pashalidis
1 and
Charis R. Theocharis
1
1
Department of Chemistry, Faculty of Pure and Applied Science, University of Cyprus, P.O. Box 20537, CY-1678 Nicosia, Cyprus
2
Jerzy Haber Institute of Catalysis and Surface Chemistry, Polish Academy of Sciences, Niezapominajek 8, 30-239 Krakow, Poland
*
Author to whom correspondence should be addressed.
Analytica 2025, 6(3), 34; https://doi.org/10.3390/analytica6030034
Submission received: 29 April 2025 / Revised: 21 July 2025 / Accepted: 29 July 2025 / Published: 8 September 2025
(This article belongs to the Special Issue Feature Papers in Analytica)

Abstract

Halloumi cheese, a traditional Cypriot dairy product with Protected Designation of Origin (PDO) status, is renowned for its unique texture and high melting point. PDO certification is crucial for Halloumi cheese as it ensures the product’s authenticity, protects its traditional production methods and geographical origin, and safeguards consumers and producers against fraud and mislabeling. However, concerns over adulteration, particularly through the addition of skim milk powder, pose challenges to its authenticity and quality control. This study is the first to analyze Halloumi cheese using Brunauer–Emmett–Teller (BET) analysis and Fourier Transform Infrared (FTIR) spectroscopy, providing a novel approach to assessing its composition and authenticity. Furthermore, it marks the first time Halloumi samples have been examined in the context of PDO certification. Alongside PDO-certified Halloumi, two additional sample sets were produced following PDO specifications for moisture, fat, and salt content, with the controlled incorporation of skim milk powder as an adulterant at concentrations of 1% and 5%. Principal component analysis (PCA) was employed to visualize and interpret the spectral data, revealing promising results. Chemometric analysis showed that the specific surface area from BET measurements and the FTIR spectral subregion between 1650 and 1100 cm−1 were key factors, and they were retained for model construction. These findings could play a crucial role in establishing official food fraud detection methodologies, particularly for the Cyprus and EU markets. While this study serves as an initial investigation, additional samples will be tested in future studies to validate these preliminary results and to assess the potential of applying these techniques in real-world food fraud detection scenarios.

1. Introduction

Cyprus has a long-standing tradition of dairy production, with Halloumi cheese being its most renowned Protected Designation of Origin (PDO) product [1]. The primary raw materials for Halloumi production are sheep and goat milk, although in recent years, cow milk has also been incorporated into its formulation to meet increasing demand. The composition and quality of Halloumi are directly influenced by milk origin, animal diet, and environmental conditions, including water availability for fodder production. Similar to the case of Oscypek cheese in Poland, which has a historical association with sheep milk production in the Podhale region [2], Halloumi is deeply rooted in Cypriot heritage and has gained international recognition due to its unique texture and grilling properties. Given the island’s semi-arid climate and frequent droughts, optimizing water use in agricultural systems is crucial for maintaining the quality and authenticity of Halloumi [1].
Milk powder (MP) is sometimes added to cheese for several reasons, primarily driven by cost and production efficiency. One of the main reasons is cost reduction, as powdered milk is significantly cheaper than fresh milk, making it an attractive alternative for manufacturers looking to cut expenses. Additionally, it helps in increasing yield by adding more solids, such as protein and fat, to the cheese mass, ultimately leading to a higher production output. Another advantage is its extended shelf life, as powdered milk can be stored for long periods without refrigeration, unlike fresh milk, which spoils quickly. Furthermore, it allows for manipulation of composition, helping producers control moisture, fat, and protein content in the cheese to achieve specific textures and consistency [3,4].
Despite these benefits, the use of milk powder in cheese, particularly when fraudulent or excessive, can compromise quality, authenticity, and nutritional value. While legally permitted in some cases, its undeclared or excessive use is considered adulteration, especially in Protected Designation of Origin (PDO) cheeses like Halloumi, Parmesan, and Feta, which must follow traditional recipes. Key issues include altered texture and taste, often resulting in a grainy or unnatural mouthfeel. In addition, this practice violates regulations for PDO cheeses, which require fresh milk as stated in the EU Regulation 2021/591 [5]. Undeclared milk powder use deceives consumers, leading them to believe they are purchasing a traditional, high-quality product when it has been modified with cheaper ingredients [6,7].
Specific surface area is a material property that is of particular importance when considering adsorption, heterogeneous catalysis, and reactions on the surfaces of different materials. Brunauer–Emmett–Teller (BET) technique is a very useful method for determining the specific surface area of solids and powders. In the context of food fraud detection, this technique can be applied to characterize food products in solid or powdered form, such as spices, protein powders, or dairy powders, where variations in surface area may indicate adulteration or quality inconsistencies. Information about the specific surface area value is very important for industrial processes and chemical reactions [8,9]. The specific surface area can have a significant effect on various processes, such as aggregation or disaggregation of particles [10,11] and flowability [12]. The BET technique may be a powerful tool in food safety studies. It can help detect adulteration, ensure product quality, and verify the origin and authenticity of food products by characterizing their surface area, pore structure, and adsorption properties of some nanomaterials employed as platforms for sensing adulterants [13,14].
FTIR spectroscopy is a well-established method for detecting adulterants in food products due to its rapid, non-destructive, and highly sensitive analytical capabilities. This technique enables the identification of chemical compounds based on their unique infrared absorption spectra, allowing for the detection of food fraud, contamination, and quality deviations [15]. FTIR has been successfully applied to various food matrices, including dairy products [16,17], oils [15,18,19], honey [20,21], meat [22,23], beverages [24,25], etc., to identify adulteration with lower-quality ingredients or unauthorized substances. By integrating FTIR spectroscopy with chemometric analysis, the detection and quantification of adulterants can be further enhanced, providing a robust approach for food authenticity and safety assessment [6,26].
Concerns over adulteration, particularly through the addition of skim milk powder, pose challenges to Halloumi cheese authenticity and quality control. As adulterants often alter the physical structure of food products, this study aimed to examine whether Halloumi cheese samples made with and without milk powder as an adulterant, have differences in BET analysis, by comparing the measured parameters related to porosity, i.e., primarily the specific surface area, pore volume, and pore size distribution. Therefore, the goal was to investigate if, through BET analysis, it is feasible to detect changes in porosity and surface area caused by the addition of foreign substances in terms of adulteration. In addition, FTIR measurements were obtained to characterize both adulterated and non-adulterated PDO Halloumi samples. The samples were made with three different percentages of adulterations (0%, 1%, 5%) by using a skim milk powder. Moreover, the extraction of a chemometric model was another goal by using all the measurements, and also to highlight the most important variables among the measured parameters regarding milk powder addition in PDO Halloumi cheese.

2. Materials and Methods

2.1. Sample Details

Halloumi cheese was produced according to PDO regulations at a local company in Cyprus, using milk samples exclusively of goat origin, which were prepared for our previous study, as well as skimmed milk powder from Belarus, also tested in Tarapoulouzi et al. [27]. In total, 20 PDO Halloumi cheese samples without any milk powder addition (0% MP) were produced, serving as the authentic group. Additionally, two samples adulterated with 1% and 5% MP were prepared while ensuring compliance with PDO regulations regarding their basic components (fat, moisture, salt). These two adulterated samples were produced to compare with the authentic ones.

2.2. Pre-Treatment of Samples

Freeze-drying was the pre-treatment technique, as described in Tarapoulouzi and Theocharis [28]. Freeze-drying was chosen to prepare the cheese matrix for BET and FTIR measurements, as it removes water from the samples without altering their structural or chemical properties, thereby ensuring accurate surface area and spectral measurements. A Christ Alpha 1–2 (Osterode, Germany) freeze dryer was utilized. The condenser was set to a temperature of 233 K, and the final pressure in the drying chamber was 3 MPa. Each 5 g cheese sample underwent a 5 h freeze-drying process, after which the residue was homogenized.

2.3. Physicochemical Characteristics

All the samples in this study were assessed for fat, moisture, and salt content, as required by the Official Journal of the European Union (EU Regulation No. 591/2021) regarding PDO Halloumi cheese [5]. Deviations from the limits set in EU Regulation No. 591/2021 may indicate non-compliance with PDO standards or potential adulteration with substances such as milk powder. This highlights the importance of these parameters in quality assurance and food fraud detection, directly supporting the core objective of the study.
Fat content in dry weight was analyzed using the butyrometric method, moisture content was determined by drying at 102 °C, and salt content was measured by Mohr’s method, as in the study of Kedzierska-Matysek et al. [2].

2.4. Characterization Measurements

2.4.1. FTIR Data

FTIR spectroscopy was selected for this study due to its high sensitivity to molecular vibrations related to fat and protein components, making it well-suited for detecting compositional changes and potential adulteration in dairy products. The FTIR measurements followed the methodology detailed in Tarapoulouzi et al. [26]. Spectra were recorded in duplicate using a Shimadzu Fourier Transform 8900 Spectrometer equipped with a potassium bromide (KBr) beamsplitter. The samples were analyzed in the form of pressed KBr pellets, with each measurement comprising twenty co-added scans at a standard resolution of 8 cm−1, covering the spectral range of 4000–400 cm−1. To reduce interference from carbon dioxide and water vapor, the samples were measured against an air background. The software KaleidaGraph (version 5, Synergy) was used to display the spectra. Before chemometric analysis, spectral data were subjected to baseline correction to reduce instrumental and sample-related variability.

2.4.2. BET Measurement-Specific Surface Area and Porosity Data

BET analysis was employed to measure the specific surface area and porosity of Halloumi cheese samples, as these physical properties can be altered by the presence of milk powder adulterants. Changes in surface area and pore structure may affect the cheese’s texture and physicochemical behavior.
The determination of specific surface area and porosity (including total pore volume and pore size distribution) was conducted using gas sorption and liquid vapor analysis. These measurements were performed using the AUTOSORB-1 device (Quantachrome, Berlin, Germany), utilizing the multipoint Brunauer–Emmett–Teller (BET) analysis method. Nitrogen adsorption was carried out at a temperature of −196 °C (liquid nitrogen). The Autosorb-1 allows for the measurement of adsorbed and desorbed nitrogen volumes at relative pressures ranging from 0.001 to just below 1.0. The apparatus is equipped with a Quantachrome computer program designed for compatibility with the Autosorb-1 device.
Before measurements, all samples were degassed under vacuum at 25 °C for 18 h, to gently remove moisture and adsorbed gases without causing thermal degradation or structural changes in the cheese matrix. Given the high organic content and delicate nature of Halloumi cheese, this relatively mild temperature was chosen to ensure the preservation of sample integrity while achieving sufficient moisture removal for reliable BET analysis. Although higher temperatures can expedite degassing, they risk altering the sample’s physicochemical properties, which could affect surface area measurements.
Micropore volume and micropore surface area were analyzed using the t-plot method, while mesopore volume and pore size distribution were determined using the Barrett–Joyner–Halenda (BJH) and Density Functional Theory (DFT) methods. However, for samples with a low specific surface area, i.e., those lacking micropores (pores smaller than 20 Å)—the BJH desorption method is more suitable.
Therefore, in this study, multiple analysis methods were applied to characterize the pore structure of Halloumi cheese samples. The BJH method was used primarily to analyze mesopores (2–50 nm), while the DFT approach allowed for more detailed pore size distribution, including micropores (<2 nm). Using these complementary methods enabled a comprehensive assessment of pore structure changes potentially related to milk powder adulteration.

2.5. Chemometrics

The principal component analysis (PCA) chemometric method was applied to visualize and provide an overview of the samples through a score scatter plot. Due to the small dataset, further chemometric analysis using a discriminant method or dataset validation was not feasible. While supervised methods typically benefit from larger datasets for robust model training and validation, this preliminary dataset provides valuable initial insights into compositional differences relevant to food fraud detection.
This study also explores data fusion by combining the outputs of two different instrumental techniques, BET and FTIR, to enhance analytical insights. Data fusion refers to the integration of data from multiple analytical techniques to provide a more comprehensive understanding of a sample’s properties [28]. Combining BET and FTIR data leverages their complementary strengths—BET offers detailed information on surface area and porosity (structural characteristics), while FTIR provides chemical composition insights. This fusion enhances the detection and characterization of adulteration in Halloumi cheese by capturing both physical and molecular changes.

3. Results and Discussion

3.1. Physicochemical Measuremnts

Based on EU Regulation 591/2021, fresh Halloumi cheese PDO must have a max moisture of 52%, a min fat content of 43% (in dry weight), and a max salt content of 3%. All the samples that were used in this study fulfilled these requirements. Specifically, the moisture content of the samples was on average 48 ± 3.6 g, while fat content was in the range of 45 ± 1.1 g/100 g in dry weight. The average salt content found in the samples used in this study was 2.8 ±0.4 g/100 g. Results showed low variability of salt content in cheeses, as all the samples were prepared by the same manufacturer.
It is well known that cow milk has a lower fat content compared to goat or sheep milk [2,29], and that milk powders are predominantly made from cow milk. Based on these factors, and given that this is the first study conducted using PDO Halloumi cheese samples (with and without milk powder addition), we exclusively used goat milk in combination with cow milk powder. This approach was chosen for two key reasons: first, to ensure that all samples met the physicochemical characteristics required by EU Regulation 591/2021, and second, to minimize variability and facilitate more precise conclusions by minimizing confounding variables in the detection of milk powder adulteration. The use of cow milk powder to adulterate goat milk in Halloumi production is particularly relevant, as it can introduce detectable spectral and structural changes due to compositional differences in proteins, fats, and other matrix components. These changes may influence both FTIR and BET measurements, thus reinforcing the importance of using these techniques for detecting such adulteration.

3.2. Characterization of Samples

3.2.1. BET Measurement-Specific Surface Area and Porosity Studies

The N2 adsorption/desorption isotherms of the Halloumi cheese samples without milk powder (0% MP) addition (presented in Figure 1) can be classified as type II, which is typical for non-porous or macroporous adsorbents. This type of isotherm represents unrestricted monolayer–multilayer adsorption. This shape (almost linear in the middle section) of isotherms indicates the stage at which monolayer coverage is complete, and multilayer adsorption is about to begin. The nearly linear middle section of the isotherms indicates the completion of monolayer coverage and the onset of multilayer adsorption. Additionally, this isotherm shape may be associated with capillary condensation occurring in mesopores if present in the structure.
In the obtained isotherms, very small hysteresis loops are observed. Their shape corresponds to type H4, indicating the presence of narrow slit-like pores. The hysteresis loop for the Halloumi cheese samples without milk powder addition appears in the relative pressure range of 0.8 to 0.9 P/P0. This isotherm shape is characteristic of materials with very low porosity.
Considering the BET measurement results and the shape of the adsorption isotherms, it can be concluded that the analyzed samples are nonporous. Their structure does not contain pores whose shape and size can be estimated with high accuracy. However, this structure can be easily altered if the composition of the materials is modified. The addition of milk powder is indeed a factor that changes the properties of the samples, and this is reflected in the BET measurement results.
As in Figure 1, N2 adsorption–desorption isotherms are presented in Figure 2. However, in the latter, the isotherms for the samples with milk powder addition are shown. It should be noted that the shape of the isotherms in both figures is the same. However, in Figure 2, when comparing the two adulterated samples, it is evident that an increase in milk powder percentage decreases the specific surface area by a factor of 10. This is also reflected in Table 1. All milk powders exhibit a very low specific surface area, which is attributed, among other factors, to their fat content. In these materials, fat may be present in the form of free globules, which significantly reduces the specific surface area. Incorporating milk powder into the analyzed cheese samples can lead to a drastic—up to tenfold—reduction in specific surface area. Such a reduction serves as a clear indicator of adulteration, suggesting the addition of milk powder to the original cheese composition. This observation underscores the relevance of the BET method as a tool for detecting adulteration through measurable structural changes.
Furthermore, the decrease in BET surface area may also be associated with variations in the binding energy of the sample’s molecular components. The results indicate differences in binding energies among the samples, likely linked to both the surface composition and the structural characteristics of the powder particles. The observed reduction in surface area in samples containing milk powder may also result from pore clogging by fat molecules or from the densification of the matrix structure.
The specific surface area, pore size, and pore volume are presented in Table 1. The underlined pore size values in Table 1 indicate the dominant pore sizes in each sample, while the values in parentheses represent pore sizes present in very small amounts but still detectable using the BJH desorption method. Regarding the parameters related to micropores, both the micropore volume and the specific surface area of micropores were determined using the Vt plot method for all samples. In all cases, both parameters were found to be zero. All samples exhibited a very low specific surface area (below 1 m2/g), indicating their non-porous structure. Specifically, the specific surface area for all samples remained under 1 m2/g. Additionally, the samples displayed varying pore sizes. The pore volume, determined using the BJH desorption method, ranged from 0.0013 cm3/g to 0.0350 cm3/g, while the specific surface area (related to pore volume) varied between 0.02 m2/g and 0.7 m2/g. The total pore volume is determined from the adsorption isotherm, as it is assumed that at a relative pressure (P/P0) of 1.0, all pores are filled with condensed or liquefied adsorbate. The pore volume values are typically estimated by assuming a cylindrical pore geometry. For all analyzed samples, both those without milk powder and those with its addition, the measured pore volumes are comparable. Therefore, this parameter cannot be used to effectively differentiate between the samples.
The analysis of calculations performed using the BJH desorption method (values presented in Table 1) indicates that the dominant pore size can be determined for all samples, despite their low overall pore content. The pore volume ranged from 0.0043 cm3/g to 0.0350 cm3/g, with pore sizes falling within the mesopore range (20 Å to 500 Å). Given the extremely low specific surface area of these samples, the results of the V-t plot method confirm that both the surface area and volume of micropores are equal to zero. The BET analysis results also suggest the presence of micropores with sizes around 13 Å and 16 Å in the analyzed samples. However, these findings are likely to be artifacts, as they fall outside the reliable detection range and measurement accuracy of the method. Therefore, this part of the data should be interpreted with caution.
It is highly doubtful to discuss porosity for the 5% MP sample because the determined specific surface area value falls below the measurement accuracy for this type of analysis. The 1% MP sample has a significantly larger specific surface area compared to the 5% MP sample. Therefore, an increase in the amount of milk powder results in a lower specific surface area. The determined values of specific surface area can be considered reliable when either the value exceeds 1 m2/g or, if below 1 m2/g, the data points on the adsorption isotherm used in the BET calculation fall within the standard range for BET surface area determination, exhibit linearity, and the C parameter in the BET equation is positive. When interpreting low BET surface area values (i.e., below 1 m2/g), it is important to note that discussions regarding the presence of micropores in such samples is generally inappropriate, even if the porosity-related calculations suggest their existence, due to the limitations in sensitivity and accuracy of the method in this range [30].
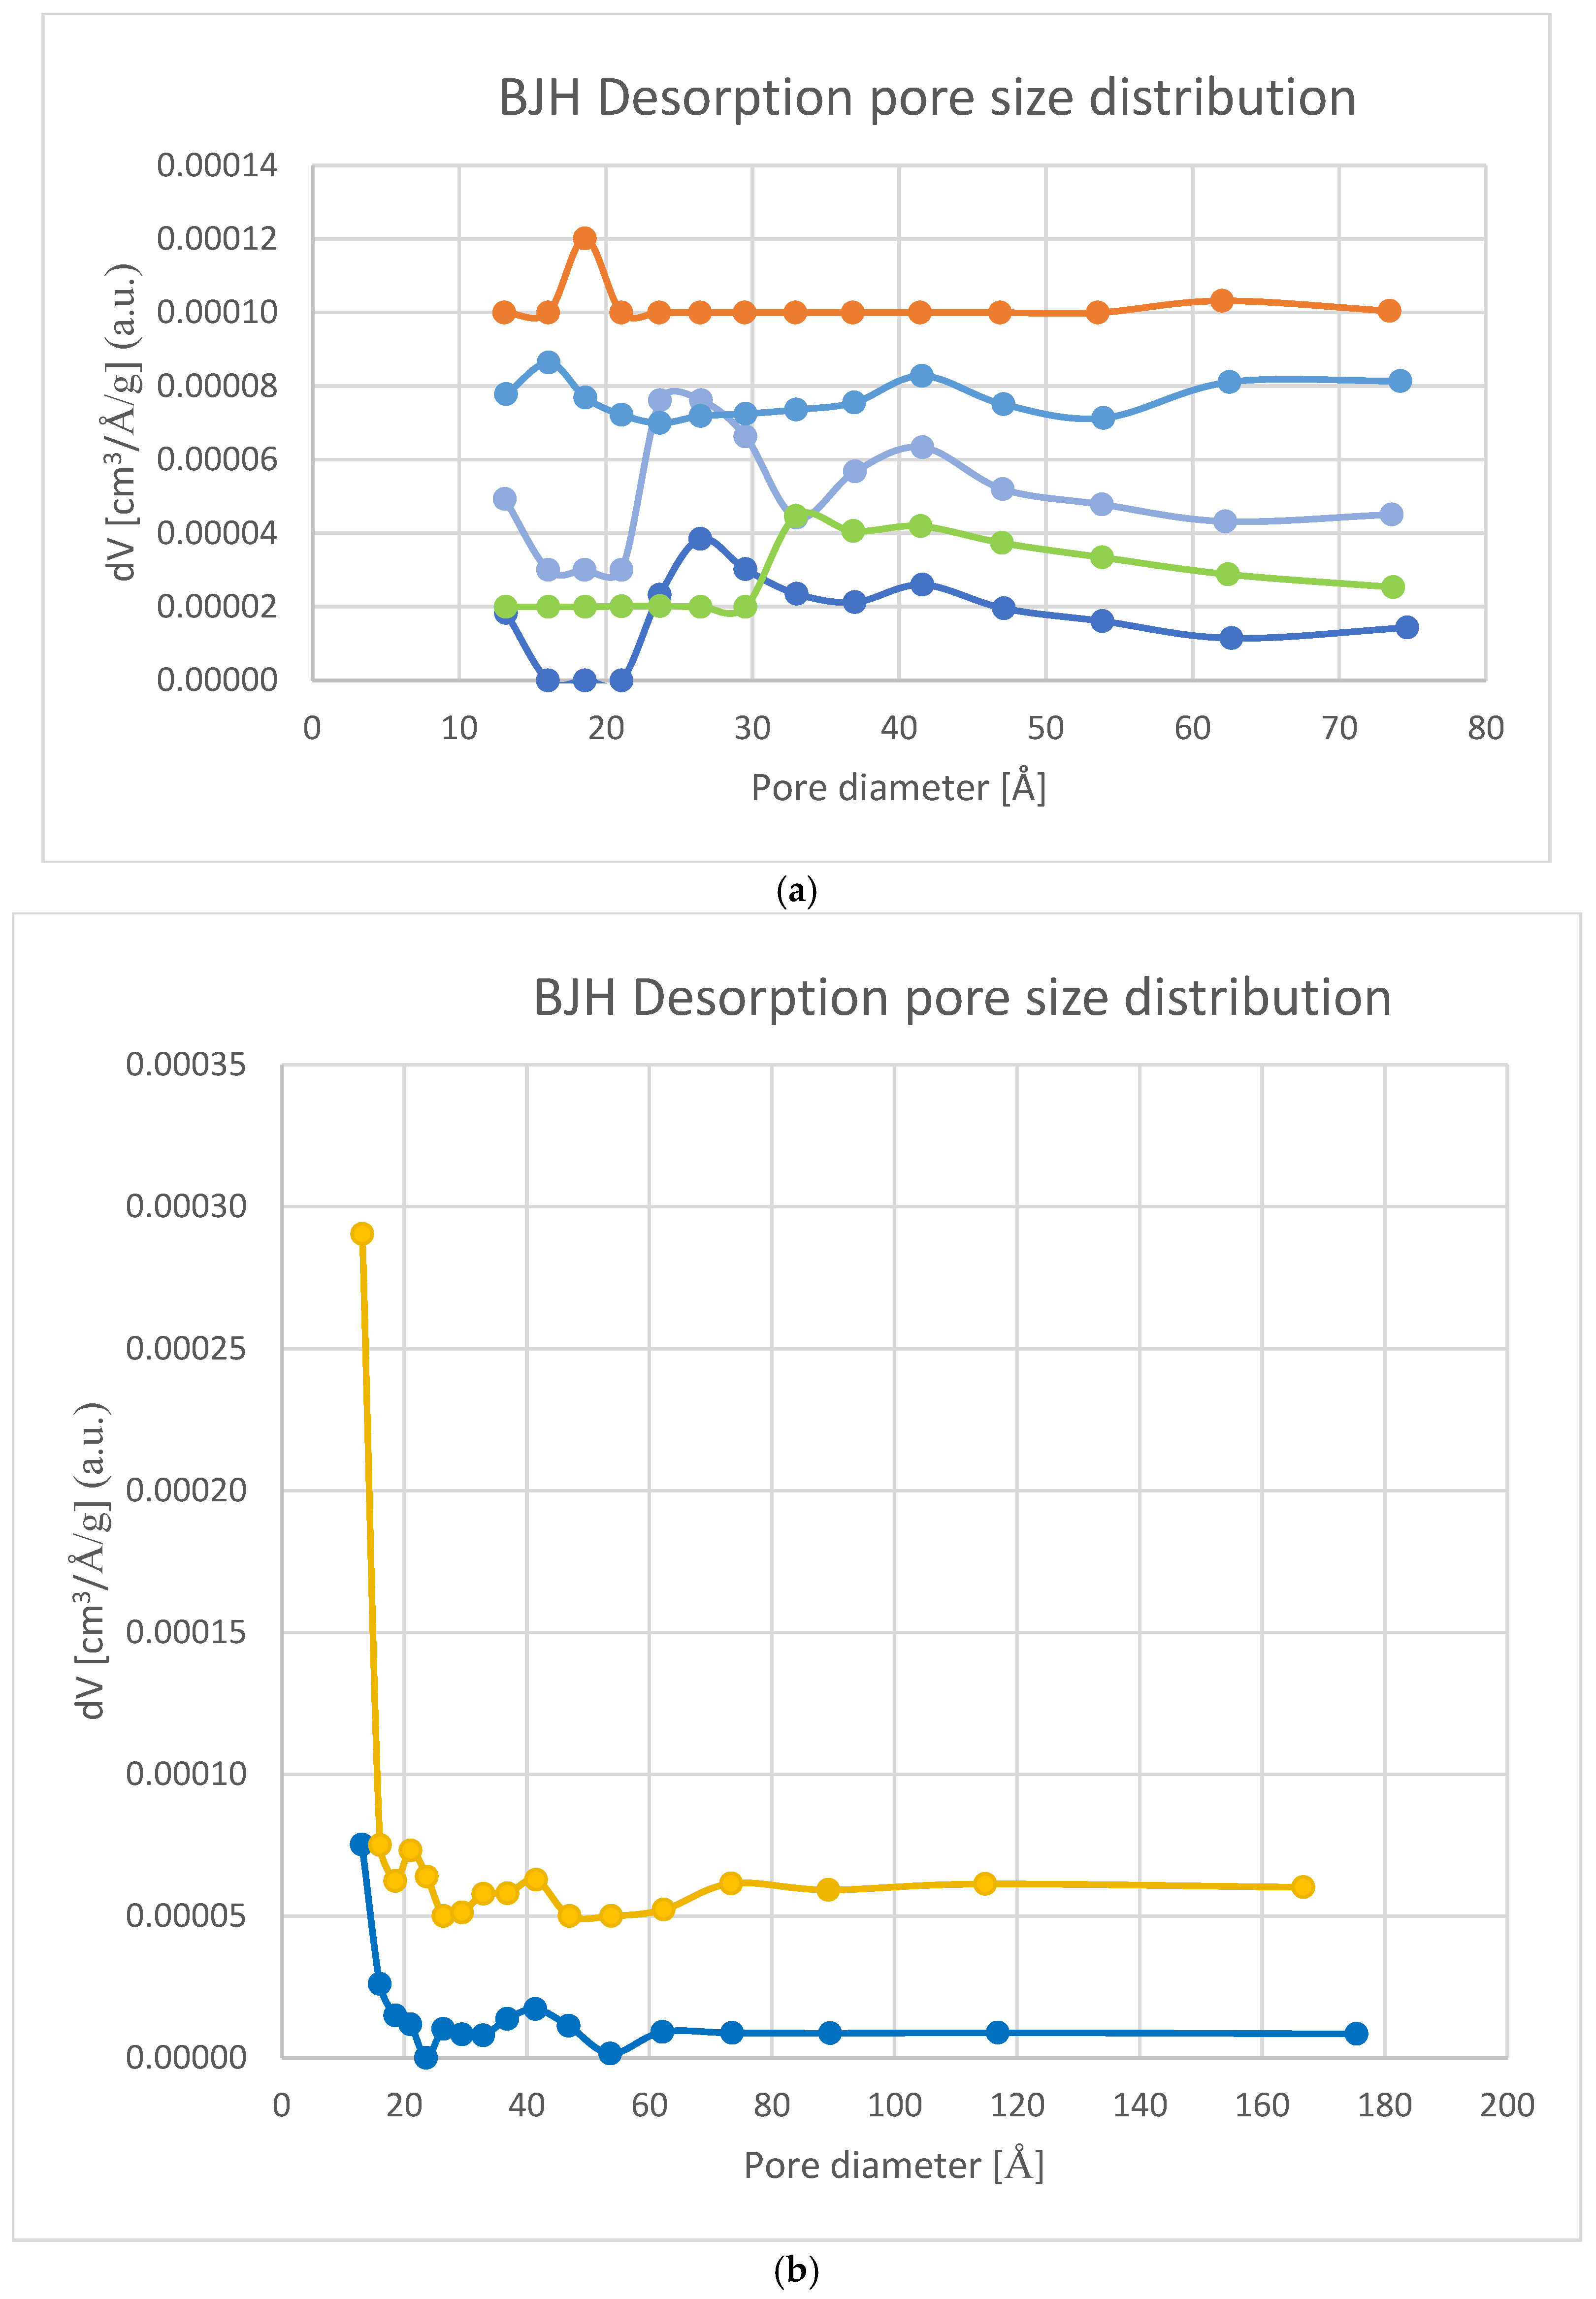
Moreover, Figure 3a,b represent the BJH desorption pore size distribution. However, Figure 3a shows a representative portion of the non-adulterated samples (0% MP), while Figure 3b presents the two adulterated samples (1% and 5% MP) from this study. Based on Figure 3a,b as well as Table 1, it can be concluded that pore size also differs between the two sample categories in this study. For all analyzed samples, in addition to the specific surface area, both the total pore volume and the dominant pore sizes were determined. The results indicate that in samples without milk powder, the predominant pore sizes are approximately 40, 50, and 60 Å. In contrast, samples containing milk powder exhibit smaller dominant pore sizes, around 20 and 30 Å. This is a significant and informative observation, as it suggests the presence of an adulterating substance, i.e., milk powder, based on detectable changes in the pore structure. Such findings highlight the utility of porosity analysis in the identification of product adulteration.
While surface area, pore size, and pore volume appear to be influential parameters in detecting milk powder adulteration in this study, these conclusions are based on preliminary findings and may vary depending on the specific dairy product and matrix composition. Nevertheless, the observed differences in surface characteristics, such as reduced porosity and altered surface area, suggest that milk powder incorporation modifies the microstructure of the cheese. These structural changes can serve as potential markers for identifying adulteration in dairy products.
It is important to note that nitrogen adsorption-based BET analysis can yield very low specific surface area values (below 1 m2/g) for dense or low-porosity samples such as Halloumi cheese, which is a known limitation of this method. Despite this, BET was applied to provide comparative data across samples and to investigate potential differences in surface characteristics associated with milk powder adulteration.

3.2.2. FTIR Measurements

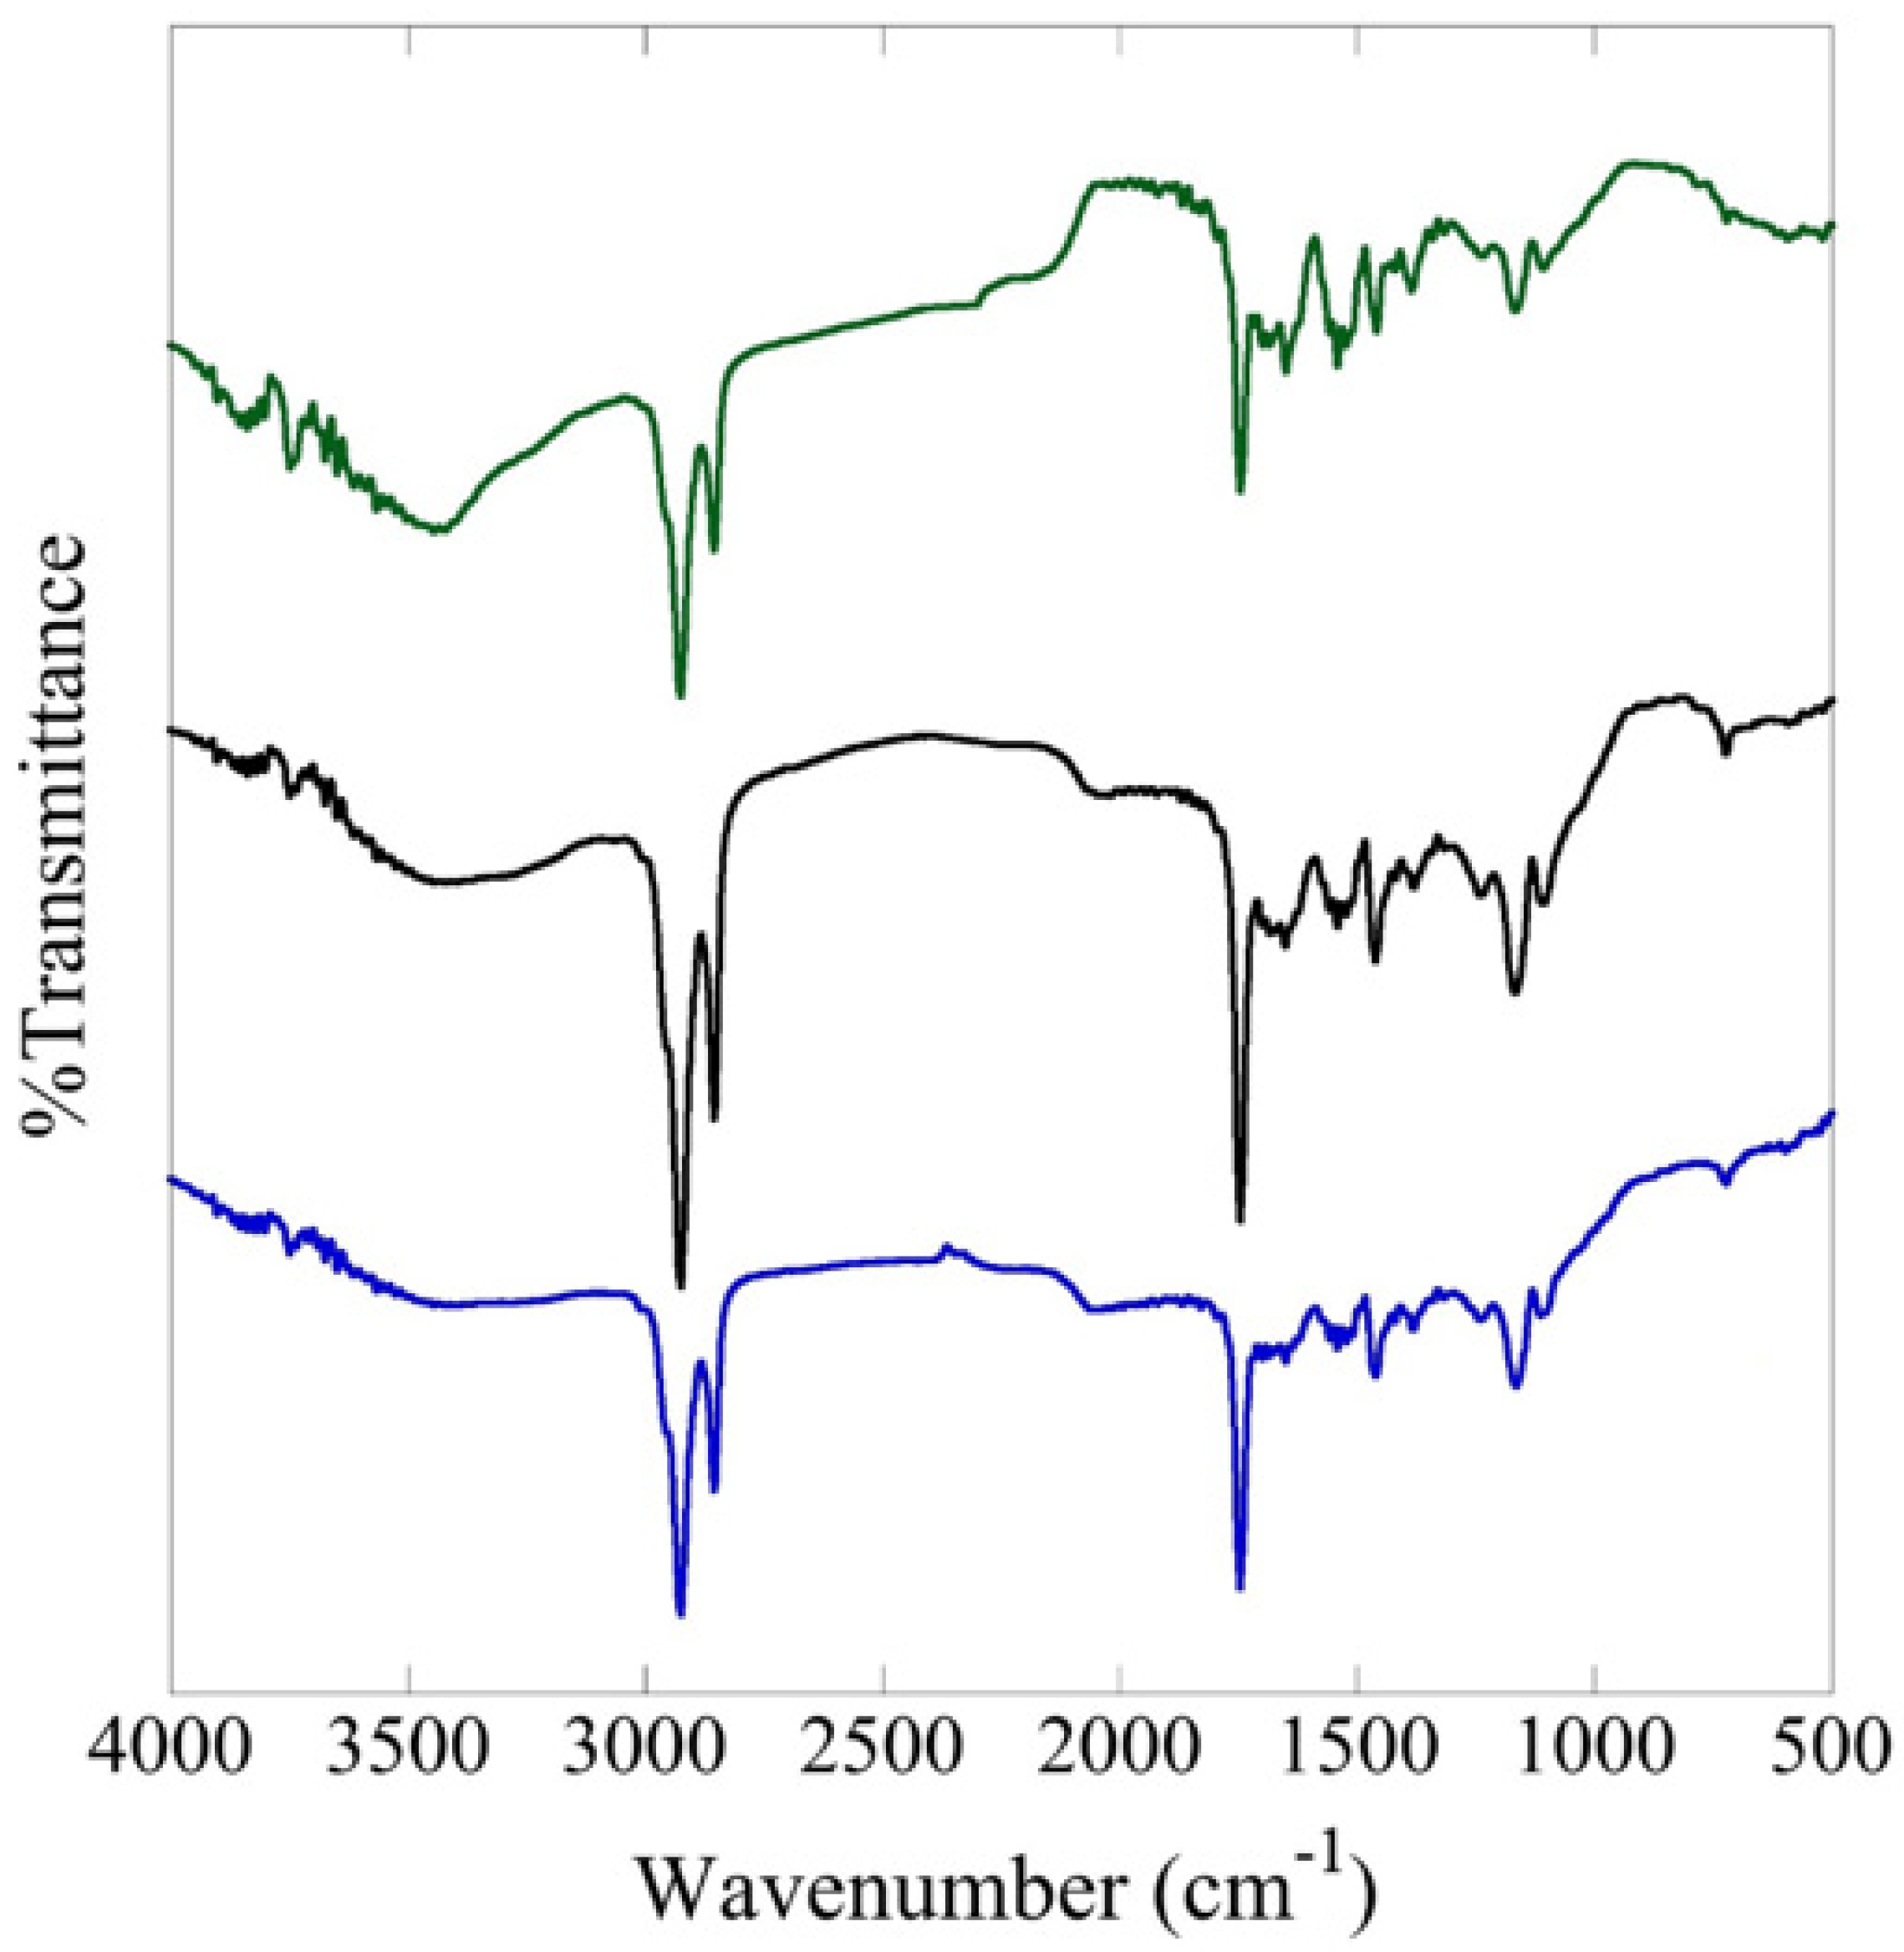
In Figure 4, the FTIR spectra of Halloumi cheese are presented. Blue represents the average spectrum of 20 PDO Halloumi cheese samples without any milk powder addition (0% MP), black represents the 1% MP addition, and green represents the 5% MP addition. From Figure 5, the three spectra exhibit similar profiles, which are attributed to the fact that the main constituents of the samples are the same.
Furthermore, the spectroscopic analysis of Halloumi samples offers valuable insights into their molecular structure. Subtle but meaningful differences, such as peak intensity shifts or region-specific absorptions, are still detectable and diagnostic; thus, the identification and characterization of specific vibrational modes remain essential [28]. Although key spectral regions of Halloumi cheese have been assigned in our previous studies [26,31], Table 2 has been created here to summarize the relative intensity of absorption for important subregions (based on Figure 4), in terms of the influence of milk powder. It has to be noted that by comparing our previous studies with the outcome of this study, we noticed shifts in the amide I and II bands among samples. Therefore, this study supports but also challenges earlier findings, as these shifts indicate subtle protein structural changes or protein–powder interactions that are responsible for the final texture and quality of Halloumi. More specifically, the observed shifts in the amide I and II bands upon the addition of milk powder suggest alterations in protein secondary structure, likely due to changes in hydrogen bonding and protein folding. These shifts may indicate conformational modifications associated with the presence of cow-derived milk proteins, which differ structurally from those in traditional Halloumi made from goat milk. Such variations can disrupt the native protein matrix, providing a biochemical basis for detecting adulteration through FTIR spectroscopy.
Subsequently, based on Table 2, two subregions (red color) seem to be important for differentiating the three sample categories, as they follow a logical trend of increasing relative absorption intensity as the MP amount increases: (a) 1650–1500 cm−1, which corresponds to the amide groups in peptides and is sensitive to the protein backbone’s conformation, and (b) 1450–1300 cm−1, which is related to carbohydrate content and ester bonds in triglycerides and lipid components [26,31,32]. In more detail, the spectral region from 1650 to 1500 cm−1 is primarily associated with protein-related vibrations, particularly the amide I and amide II bands. The amide I band (~1650 cm−1) originates mainly from C=O stretching in the peptide backbone and is sensitive to the secondary structure of proteins, while the amide II band (~1540 cm−1) corresponds to N–H bending and C–N stretching, providing information about protein conformation and hydrogen bonding. The 1450 to 1300 cm−1 region includes CH2/CH3 bending and C–H deformation vibrations, which are attributed to lipid components. Although authentic Halloumi contains minimal lactose, this region may still reflect subtle structural changes introduced by the addition of milk powder, particularly due to its different fat and protein composition. These spectral features can therefore serve as useful markers in identifying adulteration.

3.3. Chemometric Analysis

Regarding FTIR measurements, the region between 2700 and 1900 cm−1 was removed before multivariate data analysis because it includes the absorbance of carbon dioxide, specifically, the absorption at 2360 cm−1, which is known to be caused by atmospheric carbon dioxide. Additionally, this region may contribute more noise than chemical information due to the lack of molecular vibrations in these parts of the spectra, as noted by Tarapoulouzi et al. [26]. Baseline correction and normalization were applied to the remaining data before performing PCA. These preprocessing steps were essential for ensuring data quality and enhancing the validity of the resulting model [6].
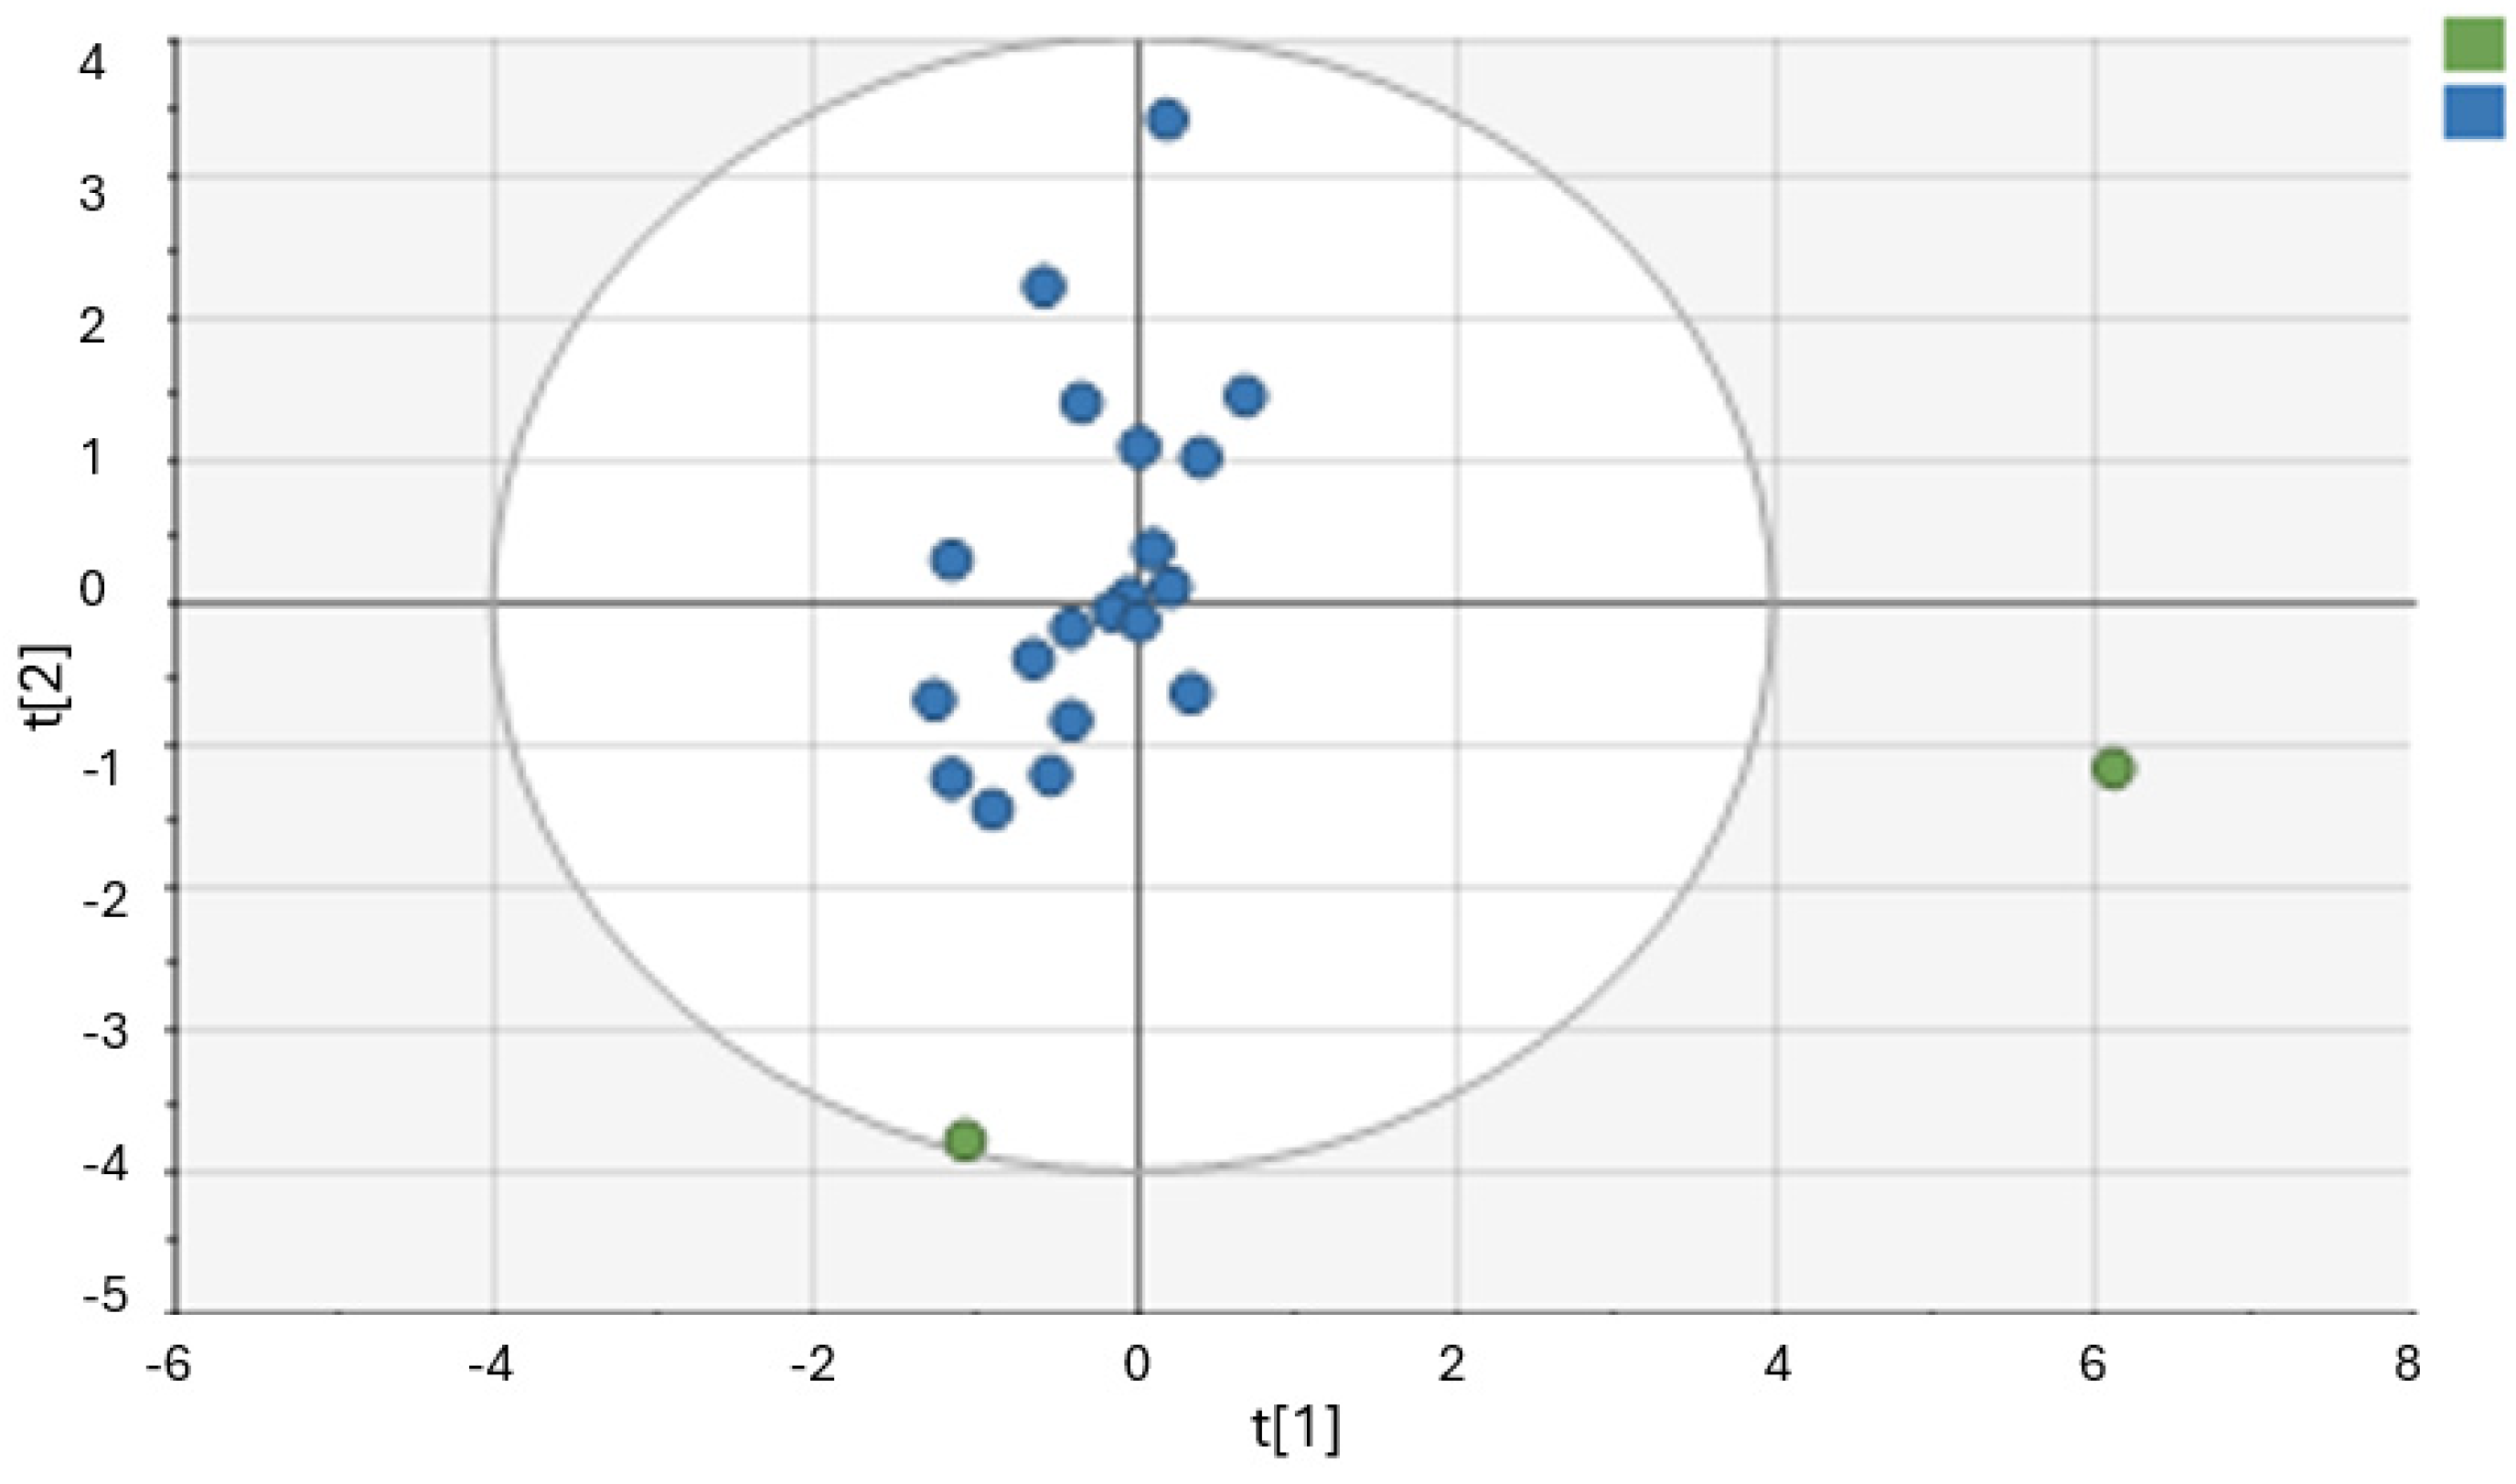
Chemometric analysis of the measurements in this study was conducted by creating a PCA model to provide an overview of the sample distribution. Therefore, Figure 5 presents a PCA plot produced using both BET and FTIR data. The values of R2X(cum) = 0.996 and Q2(cum) = 0.991 show the importance of the model produced for the test set, as they are both close to 1. Moreover, it is clear from Figure 5 that the two adulterated samples (green) are well separated from the non-adulterated samples (blue), and more specifically, one of the two adulterated samples is an outlier, falling outside the T2 Hotelling’s ellipse, while the other is borderline. Lastly, it is important to highlight that the key factors for PCA clustering were eventually the specific surface area from BET measurements and the FTIR spectral subregion between 1650 and 1100 cm−1, which were retained for model construction.
A sufficient number of these samples will enable validation as well as the application of supervised chemometric methods. Given the extremely high R2X(cum) and Q2(cum) values, combined with the relatively small number of adulterated samples, there is a potential risk of overfitting. Therefore, the results should be interpreted with caution, and the analysis should be regarded as exploratory in nature.
Milk powder, which is typically used as a cost-reducing agent, contains a higher concentration of non-water components like fats, proteins, and minerals, which can influence the cheese’s texture, moisture content, and flavor. For instance, the addition of milk powder can enhance the cheese’s water-binding capacity, which may result in a firmer texture, but also potentially lower the product’s quality. Furthermore, the increased presence of fats and proteins from the milk powder may alter the cheese’s nutritional profile and organoleptic qualities, such as its taste, mouthfeel, and meltability. These changes can be particularly concerning in cheese varieties that have specific compositional standards, such as PDO cheeses, where adherence to traditional production methods is critical. Such alterations can not only compromise the authenticity of the product but may also lead to consumer deception. The impact of milk powder and other additives on cheese composition has been studied extensively, with researchers noting the significant effects these substances have on cheese’s basic structure and functionality [1,3]. These compositional changes may explain the FTIR and BET signals used in the PCA model.

4. Conclusions

The BET analysis revealed a marked reduction in specific surface area, often more than tenfold, alongside a shift toward smaller dominant pore sizes in the adulterated samples, suggesting structural densification and potential pore blockage by fat molecules. Additionally, the FTIR spectra of samples with added milk powder exhibited subtle but consistent shifts in characteristic absorption bands, particularly those associated with protein and lipid functional groups, indicating compositional and surface chemistry changes. Together, these results empirically substantiate the observed physical modifications in the adulterated cheese samples.
To our knowledge, measurements below 1 m2 involve large errors. Despite this, the BET analysis proved valuable for characterizing and classifying Halloumi cheese samples. The combined use of BET analysis and FTIR spectroscopy demonstrated strong potential for detecting adulteration and ensuring compliance with PDO regulations. We believe that the combination of BET and FTIR adds significant value compared to the use of either method alone. A specific benefit observed in this study was the ability to confirm compositional versus structural changes, made possible by employing both analytical techniques. In the future, we will evaluate the samples using krypton instead of nitrogen sorption, which is suitable for measuring BET surface areas smaller than 1 m2/g.
Furthermore, integrating analytical data from multiple techniques is a complex yet valuable process, presenting both a challenge and an opportunity for chemometricians to enhance data interpretation and visualization. Moreover, chemometric analysis showed that only the specific surface area from BET measurements and the FTIR spectral subregion between 1650 and 1100 cm−1 were key factors and were ultimately retained for model construction.
The preliminary results of this study will be further enriched, as there is a clear need for additional validation using a more extensive dataset of adulterated samples. In addition, future studies will incorporate a broader range of milk combinations, including cow, goat, and sheep milk, to better reflect the diversity of PDO Halloumi samples available on the market. The findings of this study have practical implications and could inform food quality control standards, screening protocols, and regulatory frameworks. Future steps, such as scaling up the study and applying supervised classification models, will help strengthen the link between research and real-world application. Future investigations will build upon these findings, supporting the long-term sustainability of Halloumi cheese production in Cyprus and strengthening efforts to protect its integrity in both local and international markets.

Author Contributions

Conceptualization, M.T.; methodology, M.T. and M.R.-M.; software, M.T. and M.R.-M.; validation, I.P. and C.R.T.; data curation, M.T.; writing—original draft preparation, M.T. and M.R.-M.; writing—review and editing, I.P. and C.R.T.; supervision, I.P. and C.R.T. All authors have read and agreed to the published version of the manuscript.

Funding

This research received no external funding.

Data Availability Statement

The original contributions presented in this study are included in the article. Further inquiries can be directed to the corresponding author.

Conflicts of Interest

The authors declare no conflicts of interest.

Abbreviations

The following abbreviations are used in this manuscript:
BETBrunauer–Emmett–Teller analysis
FTIRFourier Transform Infrared
PCAPrincipal Component Analysis
PDOProtected Designation of Origin
BJH Barrett–Joyner–Halenda
DFTDensity Functional Theory
MPMilk Powder

References

  1. Tarapoulouzi, M.; Agriopoulou, S.; Artemi, A. Quality Schemes and Geographical Indicators in the Cheese Agribusiness and the Case of the Cypriot Traditional Cheese Halloumi. In Agribusiness Innovation and Contextual Evolution, Volume I: Strategic, Managerial and Marketing Advancements; Springer International Publishing: Cham, Switzerland, 2024; pp. 155–182. [Google Scholar]
  2. Kedzierska-Matysek, M.; Barlowska, J.; Wolanciuk, A.; Litwinczuk, Z. Physicochemical, mechanical and sensory properties of long-ripened Polish and Italian cheeses and their content of selected minerals. J. Elem. 2018, 23, 985–998. [Google Scholar]
  3. Strani, L.; Grassi, S.; Alamprese, C.; Casiraghi, E.; Ghiglietti, R.; Locci, F.; Pricca, N.; De Juan, A. Effect of physicochemical factors and use of milk powder on milk rennet-coagulation: Process understanding by near infrared spectroscopy and chemometrics. Food Control 2021, 119, 107494. [Google Scholar] [CrossRef]
  4. Smaoui, S.; Tarapoulouzi, M.; Agriopoulou, S.; D’Amore, T.; Varzakas, T. Current state of milk, dairy products, meat and meat products, eggs, fish and fishery products authentication and chemometrics. Foods 2023, 12, 4254. [Google Scholar] [CrossRef]
  5. EU Regulation 2021/591. Available online: https://eur-lex.europa.eu/eli/reg_impl/2021/591/oj (accessed on 4 April 2025).
  6. Grassi, S.; Tarapoulouzi, M.; D’Alessandro, A.; Agriopoulou, S.; Strani, L.; Varzakas, T. How chemometrics can fight milk adulteration. Foods 2022, 12, 139. [Google Scholar] [CrossRef]
  7. Hebling e Tavares, J.P.; da Silva Medeiros, M.L.; Barbin, D.F. Near-infrared techniques for fraud detection in dairy products: A review. J. Food Sci. 2022, 87, 1943–1960. [Google Scholar] [CrossRef]
  8. Kaim, J.; Śliwa, M.; Kuterasiński, Ł.; Samson, K.; Ruggiero-Mikołajczyk, M.; Zimowska, M.; Mordarski, G.; Karcz, R.; Podobiński, J.; Datka, J.; et al. Gas-phase hydrogenation and decarbonylation of furfuryl aldehyde over catalysts containing Cu and Ni. Catal. Today 2024, 441, 114897. [Google Scholar] [CrossRef]
  9. Sławińska, A.; Tyszka-Czochara, M.; Serda, P.; Oszajca, M.; Ruggiero-Mikołajczyk, M.; Pamin, K.; Karcz, R.; Łasocha, W. Newly-obtained two organic-inorganic hybrid compounds based on potassium peroxidomolybdate and dicarboxypyridinic acid: Structure determination, catalytic properties, and cytotoxic effects of eight peroxidomolybdates in colon and hepatic cancer cells. Materials 2021, 15, 241. [Google Scholar] [CrossRef] [PubMed]
  10. Bu, E.; Chen, X.; López-Cartes, C.; Monzón, A.; Delgado, J.J. Induced-aggregates in photocatalysis: An unexplored approach to reduce the noble metal co-catalyst content. J. Colloid Interface Sci. 2024, 676, 1055–1067. [Google Scholar] [CrossRef]
  11. Saffirio, S.; Pylypko, S.; Fiorot, S.; Schiavi, I.; Fiore, S.; Santarelli, M.; Ferrero, D.; Smeacetto, F.; Fiorilli, S. Hydrothermally-assisted recovery of Yttria-stabilized zirconia (YSZ) from end-of-life solid oxide cells. Sustain. Mater. Technol. 2022, 33, e00473. [Google Scholar] [CrossRef]
  12. Shah, D.S.; Moravkar, K.K.; Jha, D.K.; Lonkar, V.; Amin, P.D.; Chalikwar, S.S. A concise summary of powder processing methodologies for flow enhancement. Heliyon 2023, 9, e16498. [Google Scholar] [CrossRef] [PubMed]
  13. Mahapatra, P.L.; Das, S.; Keasberry, N.A.; Ibrahim, S.B.; Saha, D. Copper ferrite inverse spinel-based highly sensitive and selective chemiresistive gas sensor for the detection of formalin adulteration in fish. J. Alloys Compd. 2023, 960, 170792. [Google Scholar] [CrossRef]
  14. Singh, M. Nanosensor platforms for detection of milk adulterants. Sens. Actuators Rep. 2023, 5, 100159. [Google Scholar]
  15. Kumari, S.; Jamwal, R. Use of FTIR spectroscopy integrated with multivariate chemometrics as a swift, and non-destructive technique to detect various adulterants in virgin coconut oil: A comprehensive review. Food Chem. Adv. 2023, 2, 100203. [Google Scholar] [CrossRef]
  16. Tan, E.; Binti Julmohammad, N.; Koh, W.Y.; Abdullah Sani, M.S.; Rasti, B. Application of ATR-FTIR incorporated with multivariate data analysis for discrimination and quantification of urea as an adulterant in UHT milk. Foods 2023, 12, 2855. [Google Scholar] [CrossRef]
  17. Arifah, M.F.; Irnawati; Ruslin; Nisa, K.; Windarsih, A.; Rohman, A. The application of FTIR spectroscopy and chemometrics for the authentication analysis of horse milk. Int. J. Food Sci. 2022, 2022, 7643959. [Google Scholar] [CrossRef]
  18. Irnawati, I.; Windarsih, A.; Indrianingsih, A.W.; Apriyana, W.; Ratnawati, Y.A.; Nadia, L.O.M.H.; Rohman, A. Rapid detection of tuna fish oil adulteration using FTIR-ATR spectroscopy and chemometrics for halal authentication. J. Appl. Pharm. Sci. 2023, 13, 231–239. [Google Scholar] [CrossRef]
  19. Kumari, S.; Jamwal, R.; Suman, P.; Singh, D.K. Expeditious and accurate detection of palm oil adulteration in virgin coconut oil by utilizing ATR-FTIR spectroscopy along with chemometrics and regression models. Food Chem. Adv. 2023, 3, 100377. [Google Scholar] [CrossRef]
  20. Ciursă, P.; Pauliuc, D.; Dranca, F.; Ropciuc, S.; Oroian, M. Detection of honey adulterated with agave, corn, inverted sugar, maple and rice syrups using FTIR analysis. Food Control 2021, 130, 108266. [Google Scholar] [CrossRef]
  21. Cárdenas-Escudero, J.; Galan-Madruga, D.; Cáceres, J.O. Rapid, reliable and easy-to-perform chemometric-less method for rice syrup adulterated honey detection using FTIR-ATR. Talanta 2023, 253, 123961. [Google Scholar] [CrossRef] [PubMed]
  22. Lestari, D.; Rohman, A.; Syofyan, S.; Yuliana, N.D.; Abu Bakar, N.K.B.; Hamidi, D. Analysis of beef meatballs with rat meat adulteration using Fourier Transform Infrared (FTIR) spectroscopy in combination with chemometrics. Int. J. Food Prop. 2022, 25, 1446–1457. [Google Scholar] [CrossRef]
  23. Wirnawati, W.; Lestari, D.; Rohman, A.; Andayani, R.; Hamidi, D. Analysis of Adulteration Dog Meat in Beef Sausages Using FTIR Spectroscopy Combined with Chemometrics. Res. Sq. 2023, 1–11. [Google Scholar] [CrossRef]
  24. de Paulo, E.H.; Rech, A.M.; Weiler, F.H.; Nascimento, M.H.; Filgueiras, P.R.; Ferrão, M.F. Evaluation of adulteration in soy-based beverages by water addition using chemometrics applied to ATR-FTIR spectroscopy. Food Control 2024, 166, 110746. [Google Scholar] [CrossRef]
  25. Calle, J.L.P.; Ferreiro-González, M.; Ruiz-Rodríguez, A.; Fernández, D.; Palma, M. Detection of adulterations in fruit juices using machine learning methods over FT-IR spectroscopic data. Agronomy 2022, 12, 683. [Google Scholar] [CrossRef]
  26. Tarapoulouzi, M.; Kokkinofta, R.; Theocharis, C.R. Chemometric analysis combined with FTIR spectroscopy of milk and Halloumi cheese samples according to species’ origin. Food Sci. Nutr. 2020, 8, 3262–3273. [Google Scholar] [CrossRef]
  27. Tarapoulouzi, M.; Kyriacou, S.; Ioannidis, I.; Pashalidis, I.; Theocharis, C. FTIR Spectroscopy for Detecting Milk Powder Adulteration in Cyprus Goat Milk: A Preliminary Step Toward Safeguarding Halloumi Cheese Authenticity. Qual. Assur. Saf. Crops Food, 2025; in press. [Google Scholar]
  28. Tarapoulouzi, M.; Theocharis, C.R. Discrimination of Cheddar, Kefalotyri, and Halloumi cheese samples by the chemometric analysis of Fourier transform infrared spectroscopy and proton nuclear magnetic resonance spectra. J. Food Process Eng. 2022, 45, e13933. [Google Scholar] [CrossRef]
  29. Tarapoulouzi, M.; Logan, N.; Hardy, M.; Montgomery, H.; Haughey, S.A.; Elliott, C.T.; Theocharis, C.R. A Pre-Trial Study to Identify Species of Origin in Halloumi Cheese Utilising Chemometrics with Near-Infrared and Hyperspectral Imaging Technologies. Analytica 2024, 5, 17–27. [Google Scholar] [CrossRef]
  30. Yanazawa, H.; Ohshika, K.; Matsuzawa, T. Precision evaluation in kr adsorption for small bet surface area measurements of less than 1 m2. Adsorption 2000, 6, 73–77. [Google Scholar] [CrossRef]
  31. Tarapoulouzi, M.; Theocharis, C.R. Discrimination of Cheddar and Kefalotyri cheese samples: Analysis by chemometrics of proton-NMR and FTIR spectra. J. Agric. Sci. Technol. 2019, 9, 347–355. [Google Scholar] [CrossRef]
  32. Foschi, M.; Biancolillo, A.; Reale, S.; Poles, F.; D’Archivio, A.A. Classification of “Ricotta” whey cheese from different milk and Designation of Origin-protected samples through infrared spectroscopy and chemometric analysis. J. Food Compos. Anal. 2025, 138, 107019. [Google Scholar] [CrossRef]
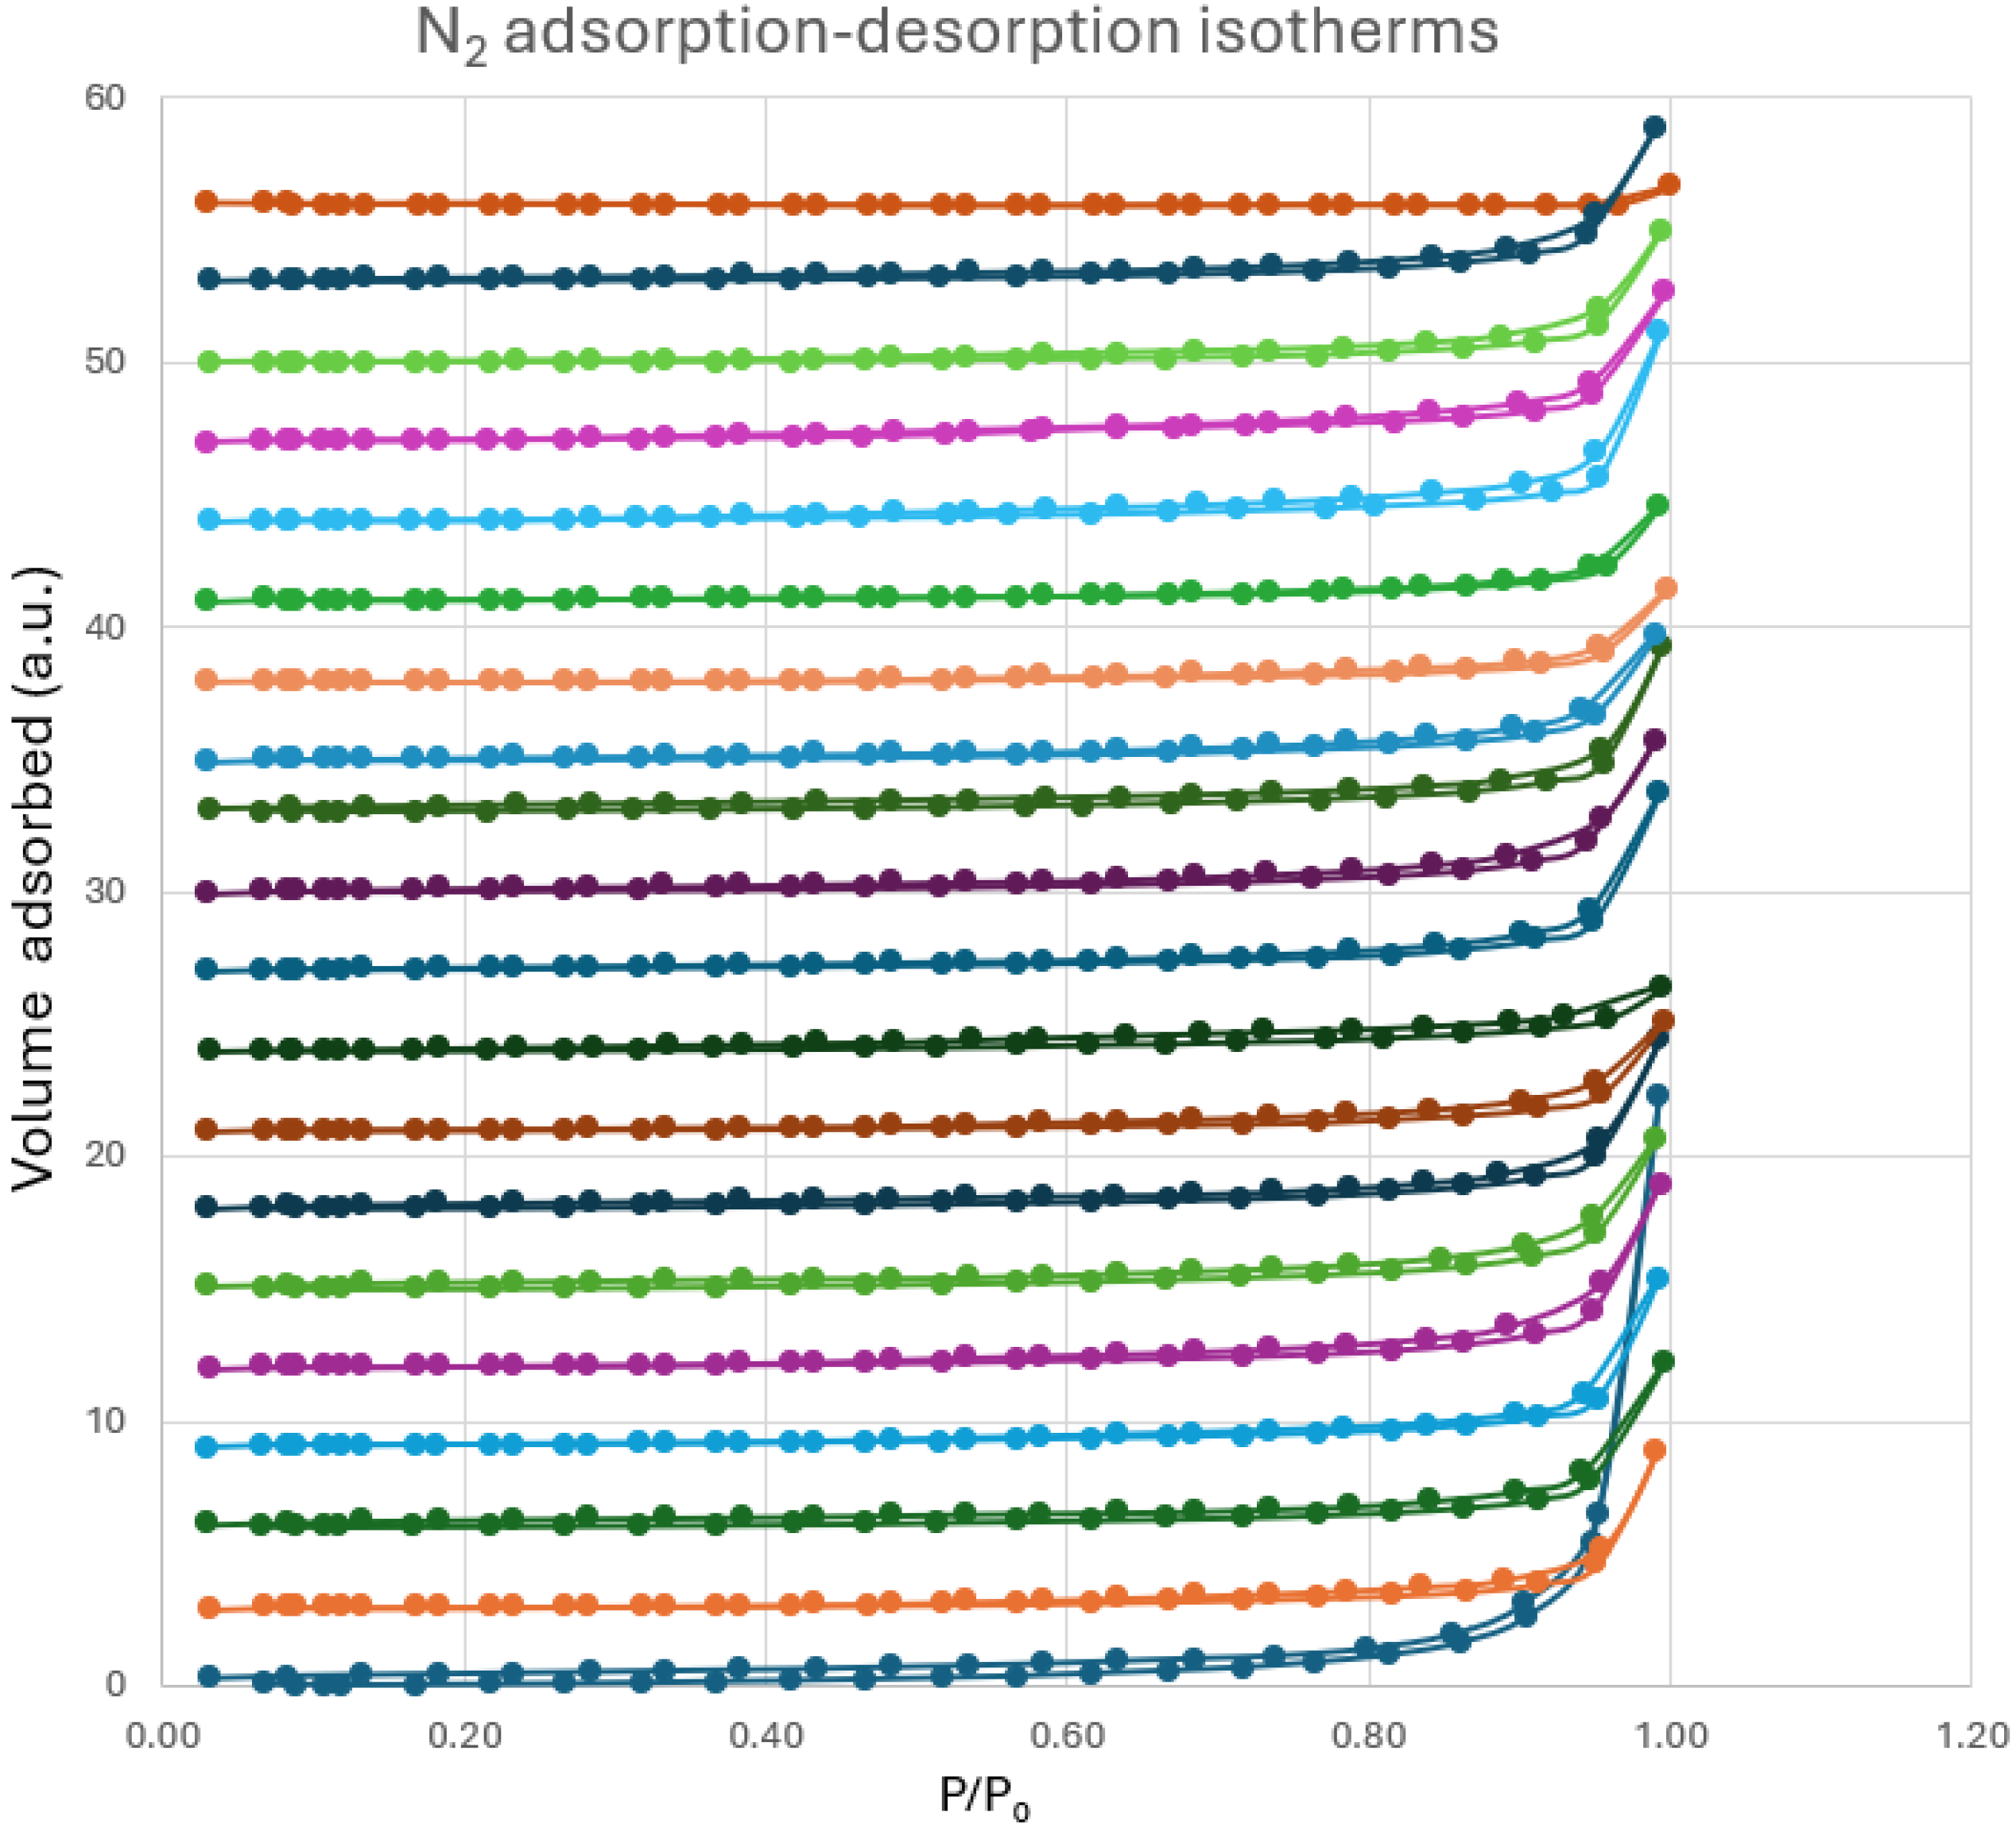
Figure 1. N2 adsorption–desorption isotherms of the Halloumi cheese samples without milk powder addition (0% MP).
Analytica 06 00034 g001
Figure 2. N2 adsorption–desorption isotherms of the two Halloumi cheese samples with milk powder addition, blue: 5% MP, and yellow: 1% MP.
Analytica 06 00034 g002
Figure 3. Pore size distributions calculated from the desorption branch using the BJH (desorption) method for (a) a representative portion of the non-adulterated samples (0% MP) and (b) the two adulterated samples (1% MP—blue and 5% MP—yellow) from this study.
Analytica 06 00034 g003
Figure 4. FTIR spectra of Halloumi cheese. Blue represents the average spectrum of 20 PDO Halloumi cheese samples without any milk powder addition, i.e., 0% MP, black represents the 1% MP addition, and green represents the 5% MP addition.
Analytica 06 00034 g004
Figure 5. PCA score plot of both BET and FTIR data, green: the two adulterated samples, and blue: non-adulterated samples in this study.
Analytica 06 00034 g005
Table 1. Basic data from the low-temperature N2 sorption method. The underlined pore size values indicate the dominant pore sizes in the samples of this study, while the values in parentheses represent pore sizes present in very small amounts but still detectable using the BJH desorption method.
Sample Specific Surface Area BET [m2/g]Pore Size Distribution (Pore Diameter) [Å]Pore Volume [cm3/g]

0% MP

0.2(13), 26, 33, 42, (115)0.0043

0% MP

0.513, (19), (42), 530.0111

0% MP

0.7(13), 37, 54, 1810.0350

0% MP

0.413, 33, 420.0099

0% MP

0.313, (21), 42, 73, (116)0.0101

0% MP

0.513, 370.0106

0% MP

0.513, 410.0116

0% MP

0.716, (24), 470.0092

0% MP

0.513, (21), 41, (89)0.0106

0% MP

0.313, (27), 41, (73)0.0070

0% MP

0.513, (24), 36, (62)0.0095

0% MP

0.616, 21, 33, (41), (114)0.0100

0% MP

0.613, (21), 540.0080

0% MP

0.2(13), 37, 63, (311)0.0059

0% MP

0.213, (41), (61)0.0061

0% MP

0.413, 26, 42, 74, (312)0.0118

0% MP

0.413, 23, 25, 41, (73)0.0096

0% MP

0.333, 41, (89), (158)0.0081

0% MP

0.416, 41, (63), (74), (90)0.0093

1% MP

0.02(13), 21, 420.0087

5% MP

0.23(13), 27, 41
0.0081


Min
Max

0.02
0.7
13
311
0.0043
0.0350
Table 2. Type of relative intensity of absorption for important subregions (Figure 4) in terms of MP influence.
Subregion
(cm−1)
Relative Intensity of Absorption
0% MP, Blue1% MP, Black5% MP, Green
3000–2800mediumstrongmedium
1750–1650mediumstrongmedium
1650–1500weakmediumstrong
1500–1450weakmediumweak
1450–1300mediumweakweak
1300–1000weakmediumweak
Disclaimer/Publisher’s Note: The statements, opinions and data contained in all publications are solely those of the individual author(s) and contributor(s) and not of MDPI and/or the editor(s). MDPI and/or the editor(s) disclaim responsibility for any injury to people or property resulting from any ideas, methods, instructions or products referred to in the content.