
Article

An Interpretable Machine Learning Model for the Differentiation of Liver Cysts and Liver Tumors Based on Computed Tomography (CT) Imaging

1
Higher School of Applied Sciences of Tangier, Abdelmalek Essaadi University, Tangier 93030, Morocco
2
Faculty of Sciences Dhar le Mehraz of Fez, Sidi Mohammed Ben Abdellah University, Fez 30000, Morocco
3
National Institute of Oncology of Rabat, Mohammed V University, Rabat 10000, Morocco
4
Department of Computer Science and Engineering, Université du Québec en Outaouais, Gatineau, QC J8X 3X7, Canada
5
Engineering Sciences Department, Faculty of Engineering Sciences, Private University of Fès, Fez 30000, Morocco
*
Author to whom correspondence should be addressed.
Livers 2026, 6(4), 66; https://doi.org/10.3390/livers6040066
Submission received: 22 March 2026 / Revised: 22 June 2026 / Accepted: 29 June 2026 / Published: 9 July 2026

Abstract

Background: Metastatic liver tumors (MLT) and parasitic liver cysts (PLC) are common liver conditions that often exhibit similar imaging characteristics, making accurate diagnosis challenging using imaging alone. This overlap can result in diagnostic errors and delayed treatment, particularly in resource-limited settings or when invasive procedures such as biopsies are not feasible due to risk or unavailability. This study aimed to develop a reliable and transparent machine learning approach to distinguish MLT from PLC using radiomic features derived from computed tomography (CT). Methods: We propose an explainable radiomics-based machine learning framework for the non-invasive, accurate, and interpretable discrimination of MLT and PLC, designed to assist radiologists in reducing diagnostic ambiguity and expediting patient management. This retrospective study included 30 adult patients, comprising 15 with liver metastases and 15 with pathologic hepatic cysts. Radiomic features were extracted from pre-treatment CT scans using PyRadiomics. Feature selection was performed using three complementary methods: Mutual Information, Lasso regression, and LightGBM importance ranking. HistGradientBoosting classifiers were then trained on each selected feature set. Results: Model performance was evaluated using 5-fold cross-validation and assessed with ROC AUC, accuracy, precision, recall, and F1-score. SHAP analysis was applied to interpret the models and identify key radiomic biomarkers. Statistical comparisons were performed using DeLong’s test for AUCs, McNemar’s test for classification agreement, and paired t-tests for metrics such as accuracy and F1-score. The Mutual Information-based model achieved the highest mean AUC (0.9717 ± 0.0267), significantly outperforming the other models (p < 0.035). Key features contributing to classification included texture entropy, interquartile range, and gray level non-uniformity. Conclusion: We developed a robust and interpretable machine learning framework for differentiating metastatic liver tumors from parasitic liver cysts using CT-derived radiomic features. The integration of Mutual Information feature selection, ensemble learning, and SHAP explainability ensured high diagnostic accuracy, strong calibration, and transparency. The proposed framework demonstrates substantial clinical relevance and holds promise for real-world implementation.

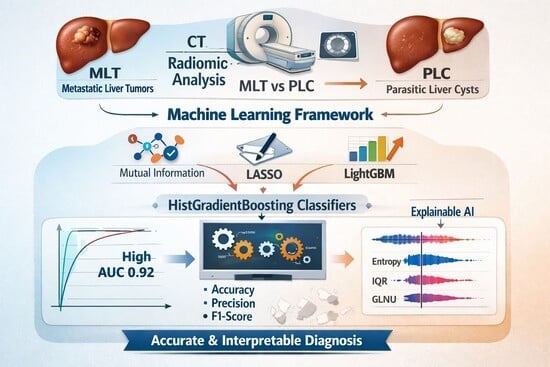
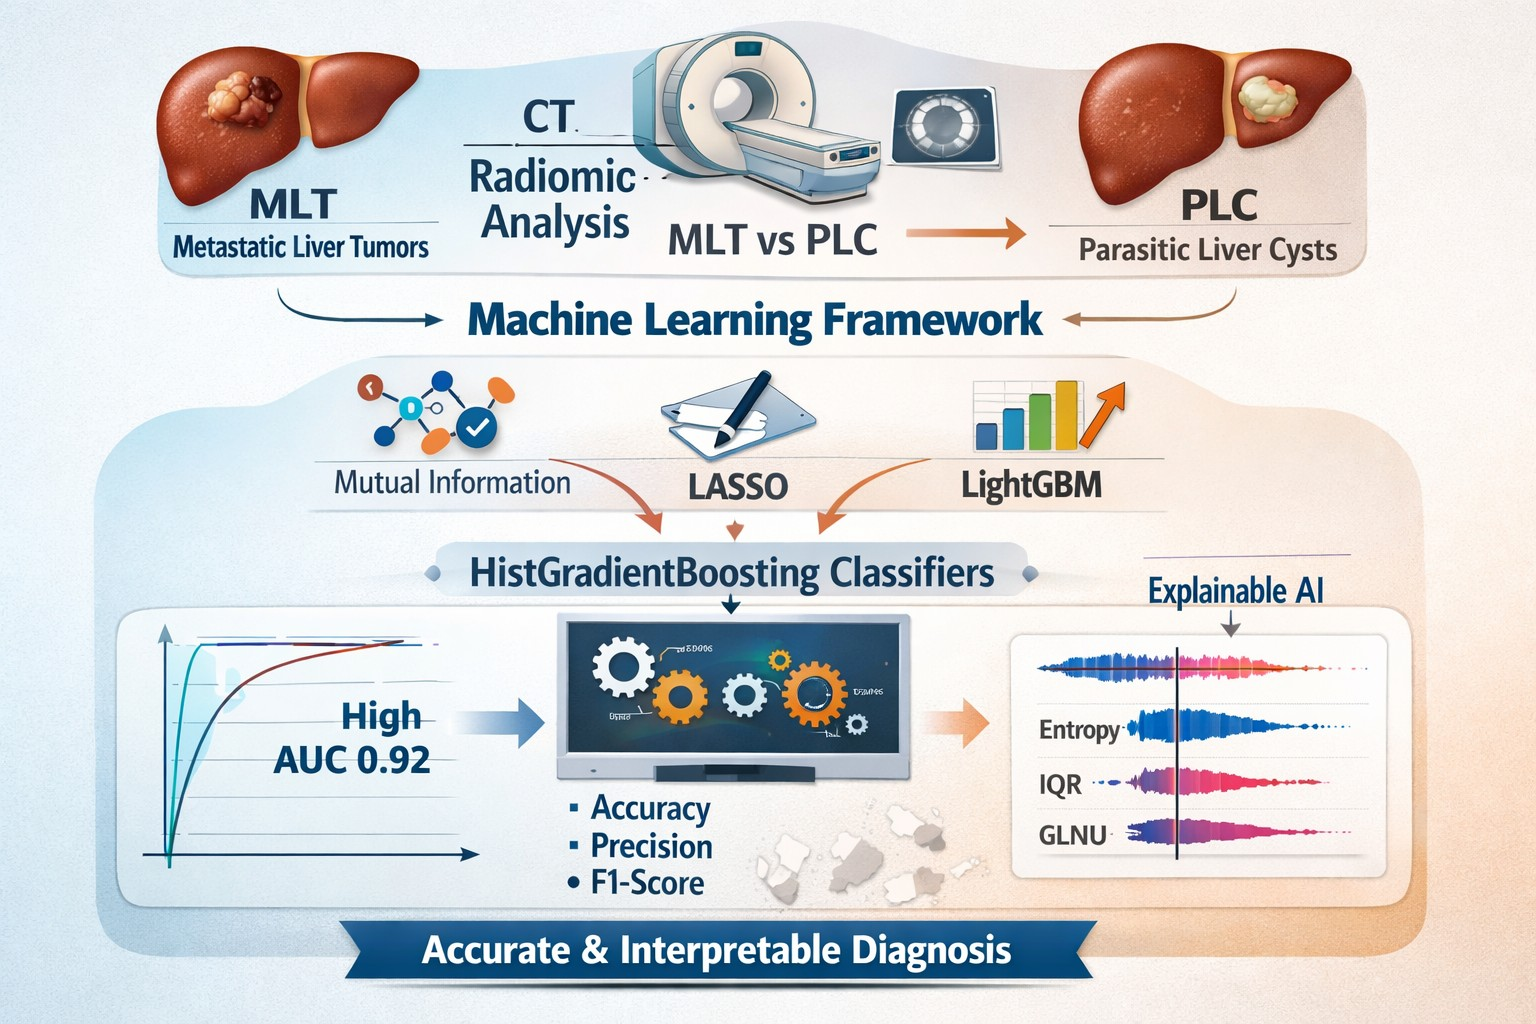
Graphical Abstract

1. Introduction

Parasitic cystic lesions of the liver are frequently encountered in clinical practice, with a reported prevalence ranging from 5% to 18% in the adult population [1]. These lesions are most often discovered incidentally during abdominal imaging examinations performed for unrelated indications. In most cases, hepatic cysts are benign and asymptomatic and therefore do not require therapeutic intervention or long-term follow-up [2,3]. In contrast, metastatic liver cancer represents a major global health challenge.
Liver cancer remains a major global health burden, with more than 860,000 new cases and nearly 760,000 deaths reported worldwide in 2022 [4]. Among primary liver cancers, hepatocellular carcinoma (HCC) accounts for approximately 75–85% of cases [5].
Accurate differentiation between hepatic cysts and liver tumors is critical because these lesions have substantially different clinical implications and management strategies. While hepatic cysts are generally benign fluid-filled lesions, liver tumors may be benign or malignant and can require significantly different therapeutic approaches [6,7,8,9,10,11,12,13].
Several studies have emphasized the importance of reliable lesion characterization. Imaging features of hepatic cysts and their distinction from other focal liver lesions have been described by Spalice et al. [9]. The growing role of artificial intelligence in differentiating benign and malignant liver lesions has been highlighted by Urhuț et al. [10]. Other authors have reported diagnostic challenges caused by overlapping radiological appearances and have explored advanced imaging- and radiomics-based strategies to improve diagnostic accuracy [11,12,13].
Medical imaging plays a central role in the evaluation of focal liver lesions. Ultrasound, computed tomography (CT), and magnetic resonance imaging (MRI) are routinely used to support diagnosis and treatment planning [14,15]. Among these modalities, multiphasic contrast-enhanced CT is widely adopted because of its accessibility, high spatial resolution, and ability to reveal lesion enhancement patterns across vascular phases.
Despite significant technological progress, differentiating hepatic cysts from liver tumors remains challenging in daily clinical practice [16,17]. Diagnostic uncertainty is particularly common in complicated cysts, necrotic tumors, small lesions, or examinations affected by suboptimal image quality [5]. In these situations, similar radiological appearances can lead to misclassification and increased variability among radiologists [18,19].
Although biopsy remains the gold standard for definitive diagnosis, it is invasive and associated with risks such as bleeding and infection [20]. Furthermore, access to specialized pathological assessment may be limited in some healthcare settings. These limitations underscore the need for accurate, reproducible, and non-invasive diagnostic tools.
Hepatic cysts and liver tumors exhibit important biological differences in tissue composition, vascular architecture, morphology, and contrast-enhancement behavior [9]. These differences generate distinct quantitative patterns on CT images, including variations in intensity, texture, shape, and enhancement dynamics [21]. However, the extraction and interpretation of such complex information often exceed the capabilities of conventional visual assessment.
Artificial intelligence (AI) is increasingly playing an important role in the management of liver diseases by supporting clinicians in diagnosis, prognosis, and treatment planning. Advanced AI techniques, such as deep learning and machine learning, can analyze medical images, clinical data, and laboratory results to detect liver abnormalities and predict disease progression with high accuracy. Convolutional neural networks have shown particular value in identifying liver lesions, assessing fibrosis and steatosis, and improving the consistency of image interpretation. In addition, machine learning models can help estimate the risk of hepatocellular carcinoma and other liver-related complications using routinely collected clinical information. Natural language processing further enhances patient care by extracting relevant information from electronic health records and facilitating clinical decision-making. More recently, multimodal AI systems have begun combining imaging, clinical, and molecular data to provide a more comprehensive view of each patient. Although challenges remain regarding interpretability, data quality, and external validation, AI holds great promise for advancing precision hepatology and improving patient outcomes in the coming years. The applications, advantages, and disadvantages of different artificial intelligence models used in the field of liver diseases are summarized in Table 1.
Several recent studies have demonstrated the clinical value of these approaches in hepatic imaging. For example, Huang et al. [22] developed a deep learning framework capable of accurately diagnosing liver tumors from multiphase contrast-enhanced CT scans, while Kanan et al. [23] showed that deep learning-based CT reconstruction can significantly improve the detection of liver metastases by enhancing image quality. Similarly, the combination of radiomics and deep learning has been successfully applied to distinguish hepatocellular carcinoma from focal nodular hyperplasia on MRI examinations [24]. Beyond lesion classification, AI models have also shown promising results in predicting hepatocellular carcinoma development from digital pathology images [25] and in the non-invasive assessment of advanced chronic liver disease using elastography-based imaging biomarkers [26]. Furthermore, recent reviews have emphasized the growing impact of radiomics and deep learning on liver disease detection, staging, and treatment planning, highlighting their potential to support clinical decision-making and improve patient management [27]. These advances suggest that AI-driven imaging biomarkers may provide valuable complementary information to conventional radiological assessment and contribute to the more accurate characterization of hepatic lesions.
Recent advances in machine learning (ML) and deep learning (DL) have opened new opportunities for automated image analysis [28,29]. These techniques can identify subtle imaging patterns by integrating information related to texture, intensity, morphology, and lesion dynamics. In particular, convolutional neural networks and attention-based architectures have shown promising results for liver lesion characterization [30,31].
Radiomics has emerged as a complementary quantitative imaging approach that converts medical images into large sets of measurable features [32,33,34,35]. By capturing tissue heterogeneity, texture, and morphological characteristics, radiomics enables a more objective description of lesions than traditional visual interpretation. Numerous studies have demonstrated the value of radiomic features for characterizing focal liver lesions and supporting machine learning classification models [36].
Pioneering studies by Mougiakakou et al. [37] showed the potential of CT texture analysis for differentiating normal liver tissue, hepatic cysts, hemangiomas, and HCC. Subsequent works by Zossou et al. [38], Xu et al. [39], and Lysdahlgaard et al. [40] further demonstrated the usefulness of CT-based radiomics and machine learning approaches for liver lesion classification and diagnostic support.
Nevertheless, the clinical implementation of ML- and radiomics-based systems remains challenging. High-dimensional feature spaces may increase the risk of overfitting and reduce model robustness and generalizability across different imaging protocols and patient populations. Addressing these limitations is therefore essential for developing reliable and clinically applicable decision-support tools for liver lesion characterization.
In the present study, we address this challenge by focusing on effective radiomic feature selection strategies aimed at reducing noise, eliminating redundancy, and retaining the most informative predictors for differentiating hepatic cysts from liver tumors. Three complementary feature selection approaches were employed. First, mutual information was used to quantify the statistical dependency between individual features and the target variable, capturing both linear and nonlinear relationships [41]. Second, the Least Absolute Shrinkage and Selection Operator (Lasso) was applied to enforce L1 regularization, promoting sparsity and suppressing irrelevant or redundant features [42]. Third, feature importance scores derived from the Light Gradient Boosting Machine (LightGBM), a decision tree-based gradient boosting framework, were exploited to account for complex feature interactions learned during model training [43]. The combination of these approaches enables cross-validation of informative features and mitigates biases associated with any single selection method.
After feature selection, an ensemble learning model based on the Hist Gradient Boosting Classifier (HGB) was trained to perform lesion classification. This model is recognized for its computational efficiency and robustness when handling high-dimensional tabular data while maintaining strong predictive performance and reduced susceptibility to overfitting [44]. However, the intrinsic complexity of ensemble models may limit their interpretability, which remains a critical requirement for clinical adoption.
To enhance model transparency and facilitate clinical interpretability, we incorporated SHapley Additive exPlanations (SHAP), a model-agnostic explainability framework grounded in cooperative game theory [45]. SHAP values provide both global and local insights into model behavior by quantifying the contribution of each feature to individual predictions. Visualization tools such as SHAP summary plots, beeswarm plots, and dependence plots enable intuitive interpretation of feature importance and interactions, thereby strengthening clinician confidence and supporting potential integration into clinical workflows [46].

2. Materials and Methods

2.1. Study Design

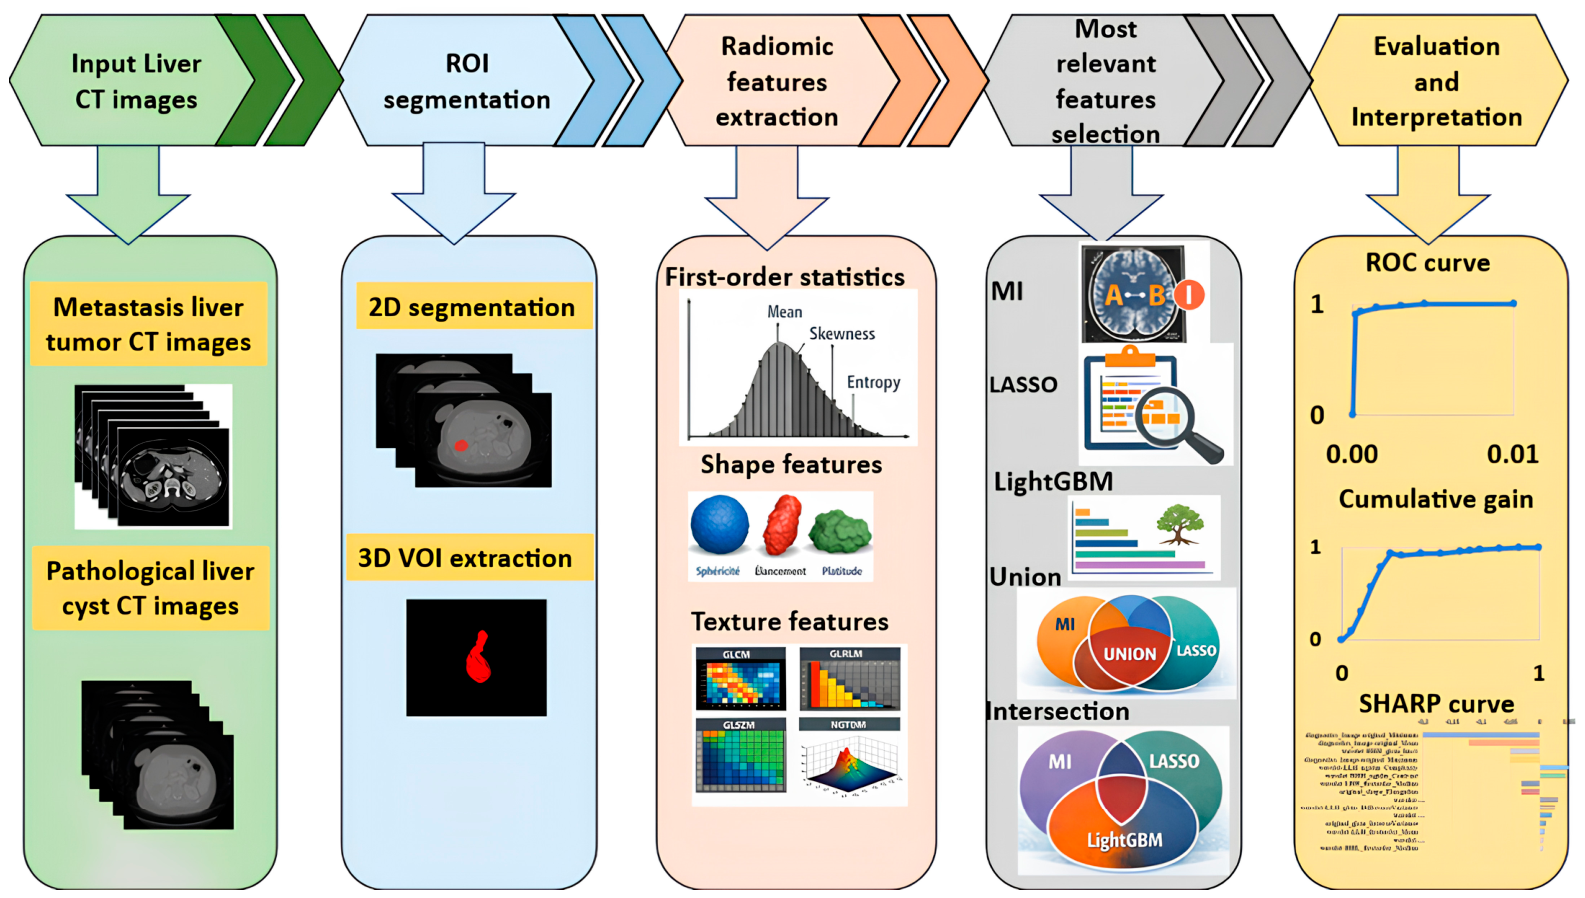
The overall workflow of this study is illustrated in Figure 1 and comprises five sequential stages: (1) CT image acquisition and input, (2) region of interest (ROI) and volume of interest (VOI) segmentation, (3) radiomic feature extraction, (4) selection of the most relevant features, and (5) evaluation and interpretation of the machine learning models.

2.2. Study Design and Patient Cohort

This retrospective study included 30 adult patients, divided into two groups: 15 patients with liver metastases and 15 patients with pathologic hepatic cysts.
The metastasis group was derived from a single-center retrospective cohort at Rabat University Hospital, following approval by the institutional review board (IRB No. 38/20). Eligible patients were aged ≥18 years, underwent hepatectomy for a hepatic or biliary tumor, and had a preoperative contrast-enhanced liver CT scan performed according to institutional protocols and stored in DICOM format. Written informed consent was obtained from all participants. Exclusion criteria included incomplete clinical or imaging data, prior preoperative oncologic treatment, significant CT artifacts, or non-diagnostic image reconstruction. After applying these criteria, 15 patients were retained from an initial cohort of 112 cases.
The pathological hepatic cyst group was identified at Hassan II University Hospital of Fez through a retrospective review of the institutional electronic pathology database. Pathology reports containing the keywords “liver” and “cyst” between 2019 and 2021 were screened. Inclusion criteria were age ≥18 years and a final histopathological diagnosis of a simple hepatic cyst or simple biliary cyst following surgical resection. Ultimately, 15 patients met the eligibility criteria from an initial pool of 108 cases.
All patients in both groups underwent a preoperative contrast-enhanced liver CT examination acquired in DICOM format and provided written informed consent.

2.3. Imaging Protocol and Preprocessing

Computed tomography (CT) images were acquired using multi-detector CT scanners according to a standardized acquisition protocol. Imaging parameters included a tube voltage of 120 kVp, automatic exposure control, and a slice thickness ranging from 1 to 1.25 mm. Acquisition settings were kept as consistent as possible across examinations to minimize variability related to scanner hardware and imaging conditions.
To ensure data harmonization and inter-patient comparability, all CT volumes were resampled to an isotropic voxel spacing of 1 × 1 × 1 mm3 using cubic interpolation. This preprocessing step was performed in accordance with the recommendations of the Image Biomarker Standardization Initiative (IBSI) and represents a standard practice in radiomics analysis aimed at improving feature reproducibility and robustness [47].

2.4. Roi Segmentation

Lesion segmentation was performed by selecting, for each patient, the largest visible hepatic lesion on CT images. A multi-method segmentation strategy was adopted to improve the robustness and reliability of the regions of interest (ROIs). Three complementary approaches were used. First, manual segmentation was performed by an experienced radiologist. Second, semi-automated segmentation was conducted using ITK-SNAP, which incorporates active contour models and boundary-based algorithms for lesion delineation [48]. Third, segmentation was performed using 3D Slicer (version 5.2), applying region-growing and thresholding techniques [49].
Segmentations obtained from the three approaches were performed independently and subsequently compared within a cross-validation framework. Only ROIs demonstrating satisfactory morphological agreement across all segmentation methods were retained for further radiomic analysis. This multi-level validation strategy was implemented to reduce interobserver variability and enhance the reliability of the extracted radiomic features.
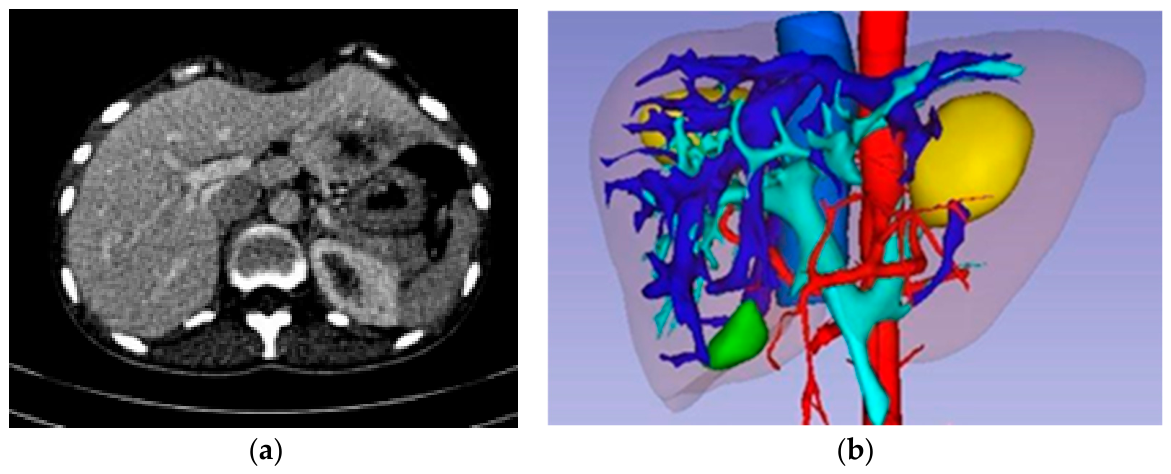
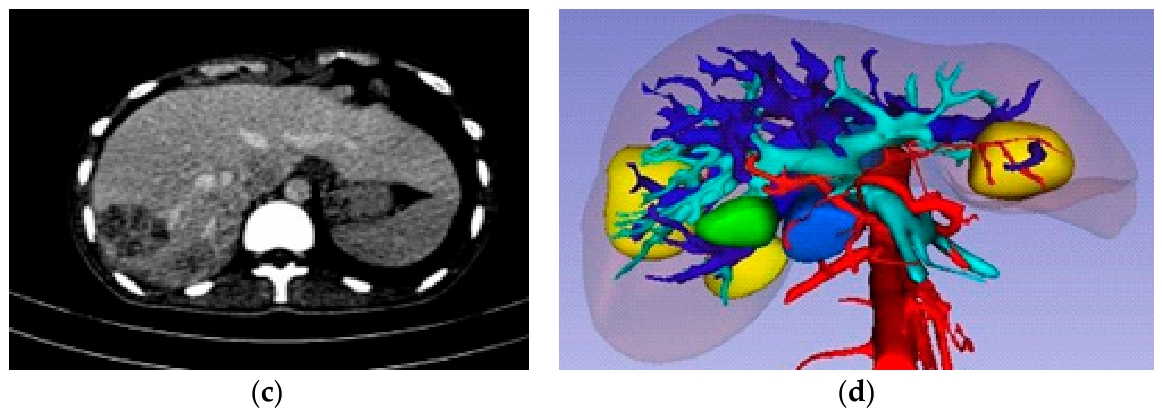
Figure 2 illustrates an example of segmentation obtained using the proposed method, showing the liver, tumor, and vessels of patient 3 from the liver metastasis group.
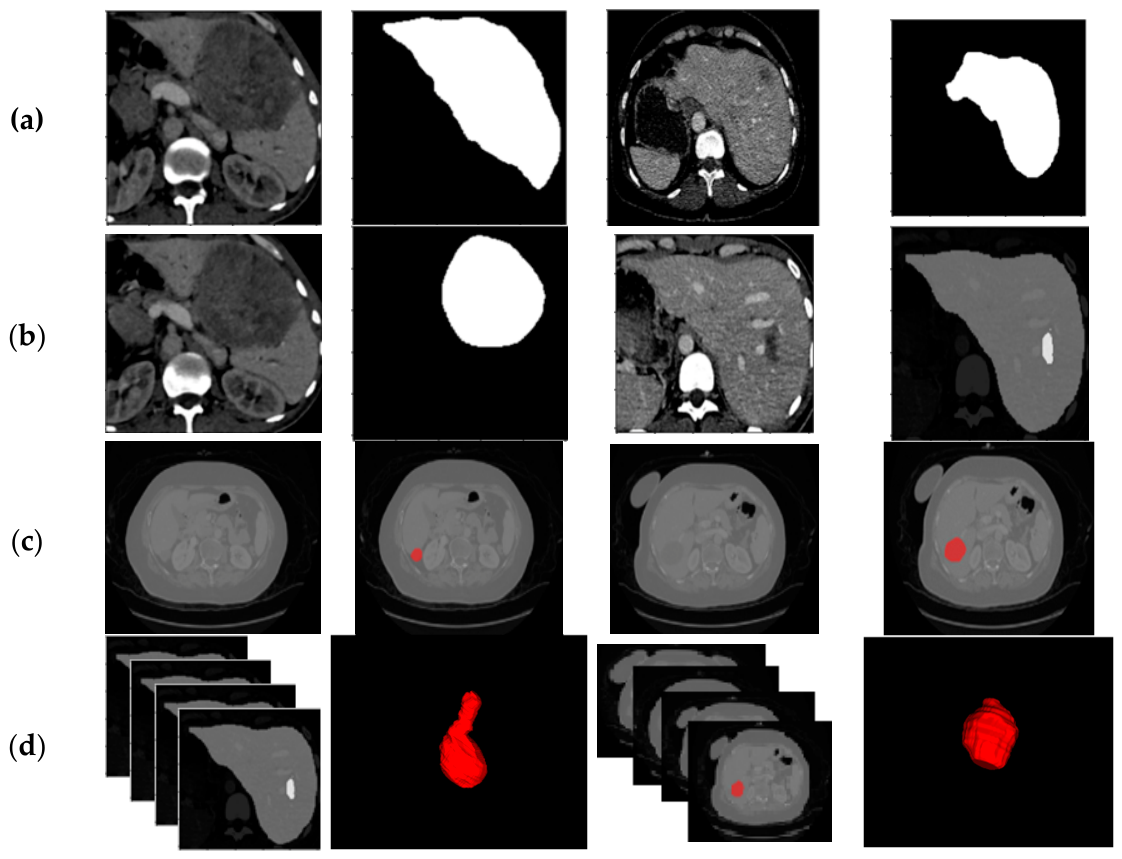
Figure 3 presents an example of volume of interest (VOI) segmentation obtained by combining the segmentations of the regions of interest (ROIs) across the different CT image slices of a liver tumor and a liver cyst.
All validated segmentation masks were exported in NRRD format and used as input for radiomic feature extraction using the PyRadiomics library. This workflow ensured accurate anatomical correspondence between CT images and segmentation masks, as well as the preservation of volumetric data integrity, which are essential requirements for reproducible and high-quality radiomic profiling [50].

2.5. Radiomic Feature Extraction

A total of 956 radiomic features were extracted from segmented ROI lesions using the PyRadiomics library (version 3.1.0), following the Image Biomarker Standardization Initiative (IBSI) guidelines [47]. Features were computed from the largest lesion per patient on high-resolution CT images. Prior to feature extraction, all CT volumes were resampled to an isotropic voxel size of 1 × 1 × 1 mm3 using B-spline interpolation to ensure uniform spatial resolution across the cohort [51].
Radiomic features were classified into seven main categories:
  • First-order statistics, describing voxel intensity distributions (e.g., mean, variance, and skewness) [52];
  • Shape-based features, quantifying three-dimensional morphological properties of the segmented region (e.g., sphericity, compactness, and elongation);
  • Texture features [53] derived from matrix-based descriptors, including:
    Gray Level Co-occurrence Matrix (GLCM);
    Gray Level Run Length Matrix (GLRLM);
    Gray Level Size Zone Matrix (GLSZM);
    Neighborhood Gray-Tone Difference Matrix (NGTDM);
    Gray Level Dependence Matrix (GLDM).
In addition to features derived from the original images, wavelet-transformed images were generated using combinations of high- and low-pass filters (HHH, HHL, and HLH), allowing multiscale characterization of lesion heterogeneity and substantially increasing the dimensionality of the feature space [54].
To reduce intensity-related bias and ensure inter-patient comparability, all features were standardized using z-score normalization. Feature reproducibility was further ensured by applying a fixed bin width for intensity discretization and by relying on standardized segmentation protocols validated by multiple radiologists. Ultimately, the extracted 956 features for the 30 patients formed the input matrix for subsequent feature selection and machine learning analyses.

2.6. Feature Selection

High-dimensional radiomic datasets can compromise machine learning performance due to redundant or non-informative features and increase the risk of overfitting. To address this, a multi-strategy feature selection framework combining filter-based, embedded, and tree-based methods was implemented. This approach aimed to retain the most discriminative features for differentiating PLC from MLT while minimizing noise and computational complexity.

2.6.1. Mutual Information (MI)

Mutual Information quantifies the statistical dependency between each feature and the target label, capturing both linear and non-linear relationships. It is distribution-agnostic, making it suitable for heterogeneous radiomic features. MI scores were computed using the mutual_info_classif function from Scikit-learn with 5 nearest neighbors and a fixed random seed for reproducibility. Features with strictly positive MI scores were retained, and the 20 highest-ranking features were selected as a baseline filter-based subset [42].

2.6.2. Least Absolute Shrinkage and Selection Operator (Lasso)

Lasso regression [55] imposes L1 regularization, promoting sparsity and eliminating irrelevant or redundant features. The optimal subset of 20 features was selected based on non-zero coefficients after model training on the full dataset. This embedded method captures linear relationships while enforcing parsimony.

2.6.3. Lightgbm Feature Importance

Light Gradient Boosting Machine (LightGBM) is a decision tree-based gradient boosting framework optimized for speed and large feature spaces. Feature importance scores were computed during model training based on split frequency and gain. The top 20 features ranked by importance were selected. This tree-based method complements MI and Lasso by capturing non-linear interactions and hierarchical feature relationships [39].

2.6.4. Combined Selection Strategies

To enhance generalizability and mitigate bias from any single method, two combination strategies were applied:
  • Union: All unique features selected by MI, Lasso, or LightGBM were pooled.
  • Intersection: Only features selected by all three methods were retained.
A comparative model was also trained using all 956 radiomic features without selection to provide an upper-bound reference for performance. Each feature subset was used to train and evaluate a HistGradientBoostingClassifier, with performance averaged over 5-fold stratified cross-validation.

2.7. Classification Modeling and Training Strategy

A supervised machine learning pipeline was implemented using the HistGradientBoostingClassifier (HGB) from Scikit-learn to differentiate PLC from MLT based solely on radiomic features [40]. HGB is a tree-based ensemble algorithm combining histogram-based gradient boosting with early stopping and monotonic constraints, suitable for structured tabular data with heterogeneous feature distributions.

2.7.1. Model Configuration

HGB was chosen for its robustness, scalability, and proven performance in medical imaging applications [41]. It employs binned feature histograms to accelerate split-finding and reduce memory usage. A fixed random seed ensured reproducibility, while the other hyperparameters remained at default values to minimize overfitting. Compared with deep neural networks, HGB performs efficiently on smaller datasets, is resilient to multicollinearity, and handles redundant features effectively.

2.7.2. Training and Validation

The dataset was evaluated using 5-fold stratified cross-validation to preserve class proportions. Within each fold, 80% of the data were used for training and 20% for testing. Model performance was quantified using Accuracy, Precision, Recall, F1-score, and ROC AUC, averaged across folds. Metrics were computed using Scikit-learn implementations with zero_division = 0 to handle potential minority class edge cases [56].

2.7.3. Probabilistic Outputs and Thresholding

HGB provides probabilistic predictions, which were used to compute ROC curves and evaluate decision thresholds. The default threshold of 0.5 was used for standard metric reporting, while alternative thresholds were explored to assess sensitivity–specificity trade-offs.

2.7.4. Model Comparison Across Feature Sets

The same HGB configuration and validation strategy were applied to all six feature subsets:
  • Lasso-selected features;
  • MI-selected features;
  • LightGBM-selected features;
  • Union of the three methods;
  • Intersection of the three methods;
  • All features without selection.
Performance differences were evaluated using DeLong’s test for ROC AUC, McNemar’s test for classification agreement, and paired t-tests across folds.

2.7.5. Model Explainability

To enhance transparency and clinical interpretability, SHapley Additive exPlanations (SHAP) were applied [57]. SHAP decomposes individual predictions into feature-level contributions, enabling global and local interpretability. Visualizations included summary bar plots, beeswarm plots, and dependence plots, highlighting the most discriminative radiomic biomarkers and supporting explainable AI for clinical decision-making [58].

3. Results

To address the limitations associated with the dataset size, a 2D model was employed using individual computed tomography (CT) slices as inputs, which expanded the dataset to approximately 6000 slices (up to 200 slices per patient). Furthermore, data augmentation was applied during training, including horizontal flipping, rotation (up to 25°), horizontal and vertical shifts, random occlusion, and Gaussian noise addition.

3.1. Radiomic Feature Selection Interpretability and Classification Performance

The performance of the radiomics model was driven by the relevance of the selected features. Feature importance analysis using Lasso, Mutual Information (MI), and LightGBM revealed distinct and complementary importance patterns.
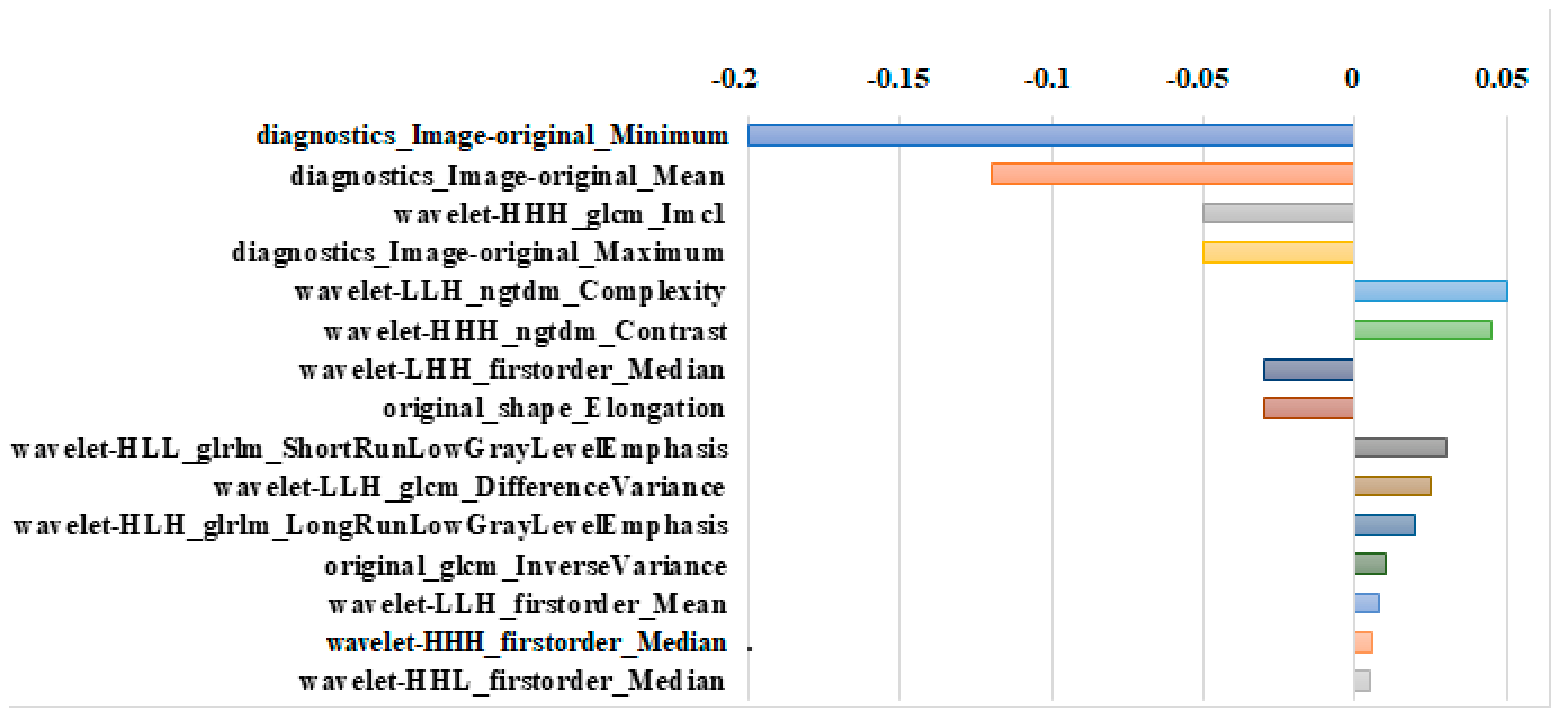
Lasso-based selection, as shown in Figure 4, yielded a sparse and interpretable feature set, with dominant contributions from diagnostics_Image-original_Minimum, diagnostics_Image-original_Mean, wavelet-HHH_glcm_Imc1 and diagnostics_Image-original_Miximum. These features primarily represent first-order intensity statistics and contrast-related textural descriptors, indicating robust discriminative capability across varying imaging conditions.
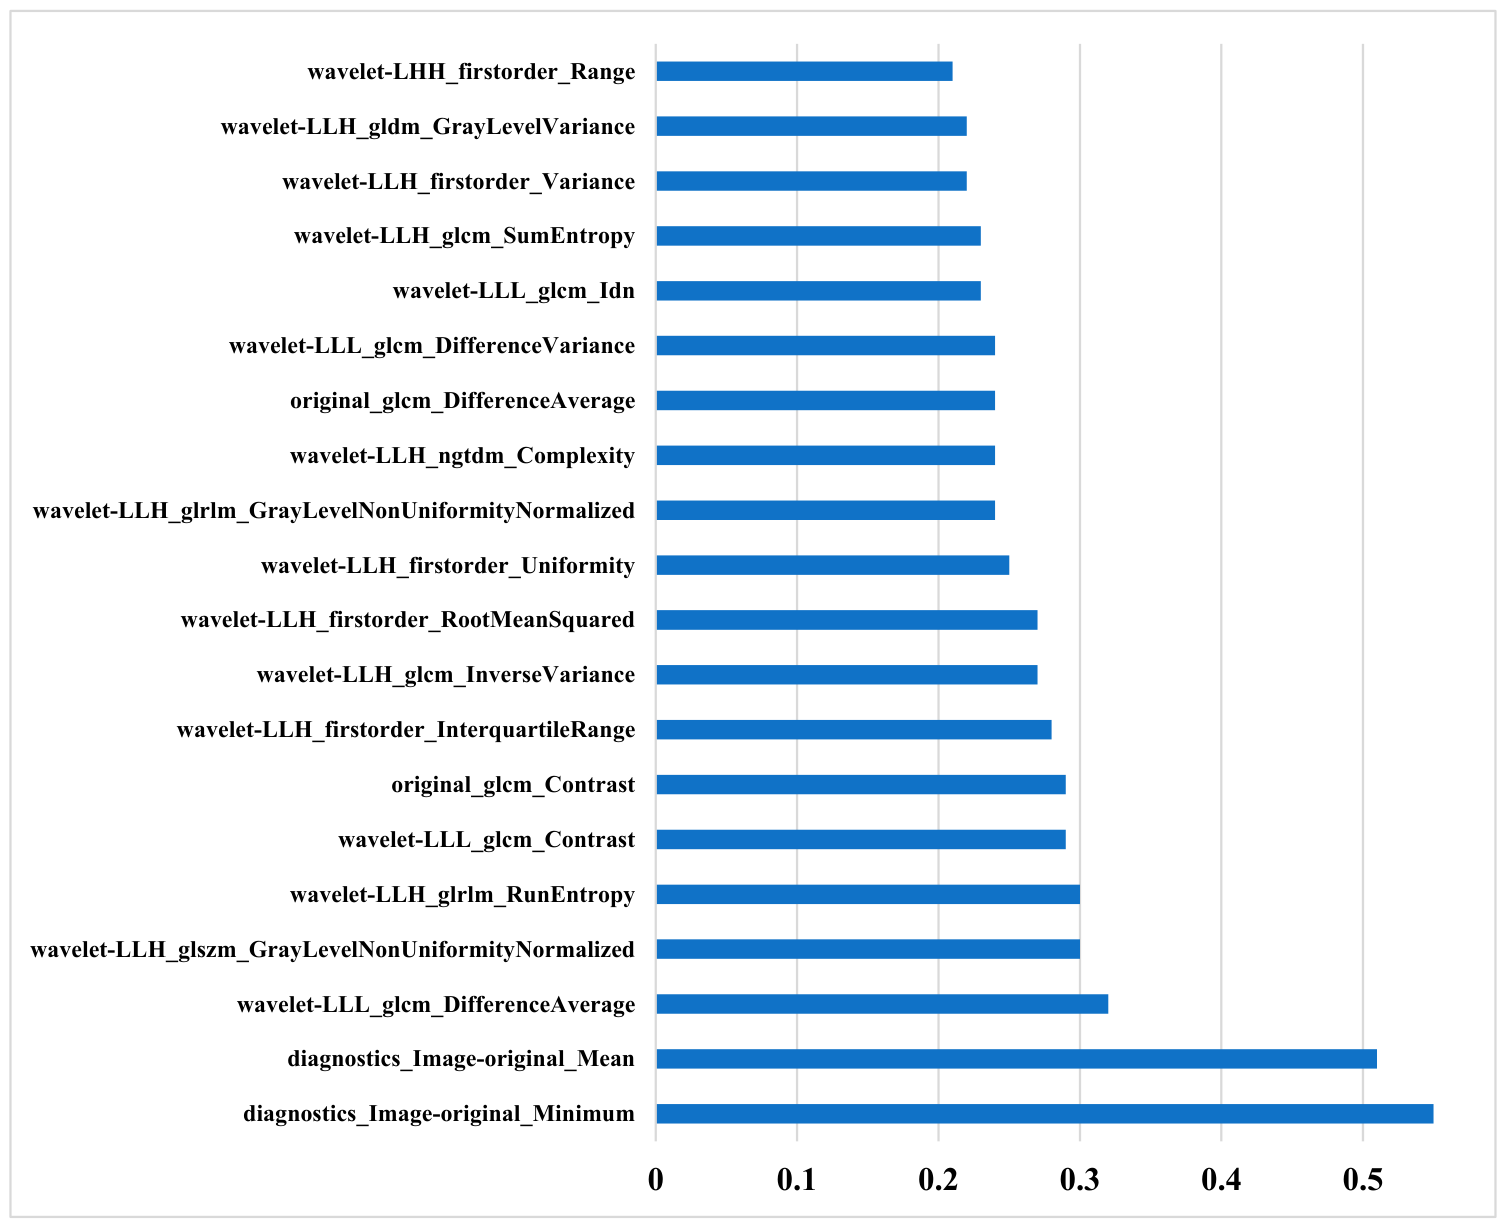
As illustrated in Figure 5, Mutual Information-based feature ranking identified 4 radiomic features that capture non-linear relationships with lesion class, including diagnostics_Image-original_Minimum, diagnostics_Image-original_Mean, wavelet-HHH_ glcm_Difference_Average and wavelet-HLL_glszm_Gray_Level_Non_Uniformity_Normalied. These latter features mainly characterize local intensity patterns, lesion heterogeneity, and textural coarseness, emphasizing their discriminative value for differentiating hepatic cysts from liver tumors.
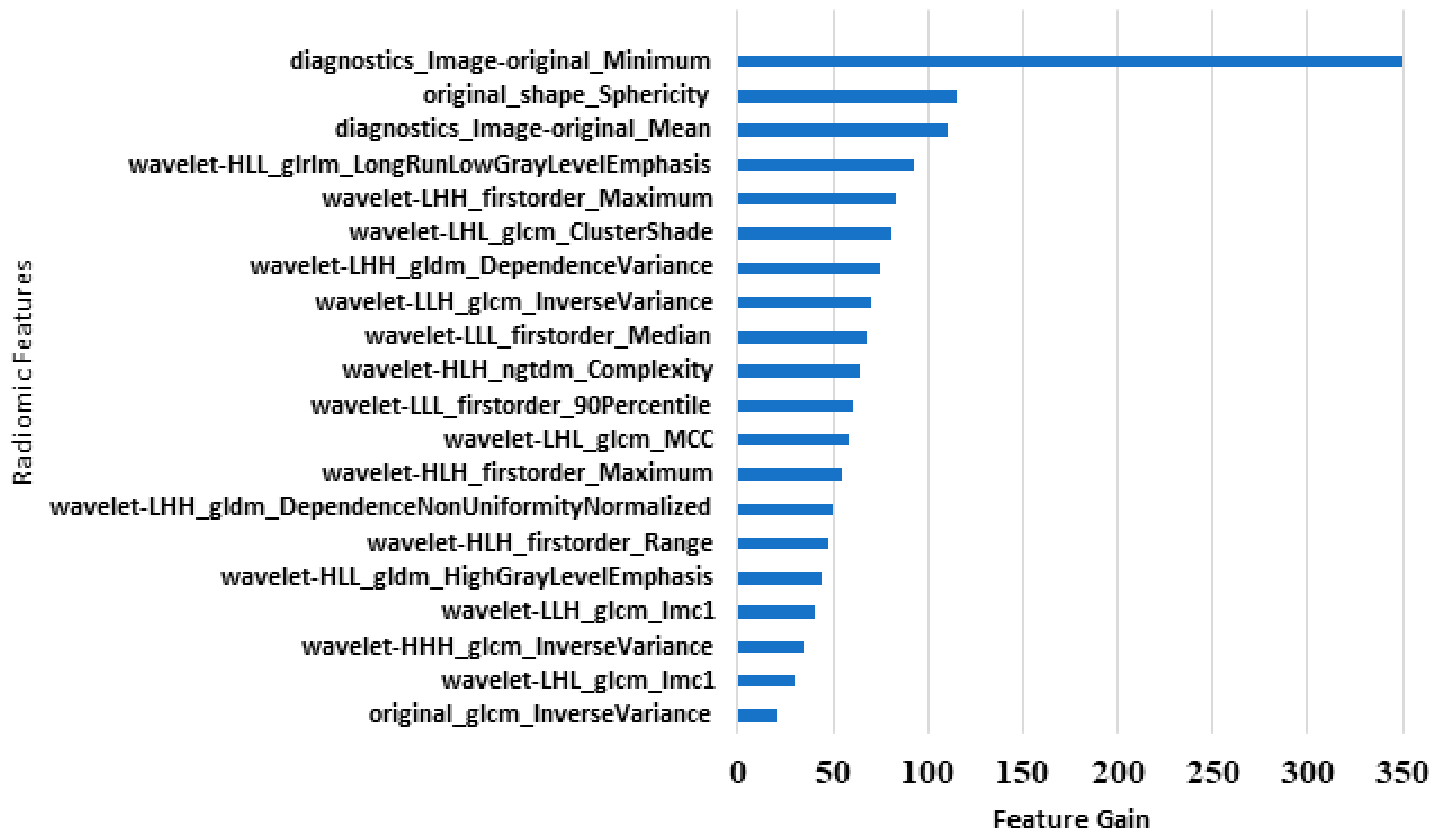
LightGBM-based feature importance analysis, as illustrated in Figure 6, assigned high relevance to diagnostics Image original Minimum, original_shape_Sphericity, diagnostics image original mean and wavelet HLL_glrlm Long Run Low Gray Level Emphasis. These features capture lesion morphology and high-frequency textural characteristics, underscoring their contribution to discriminating hepatic cysts from liver tumors.
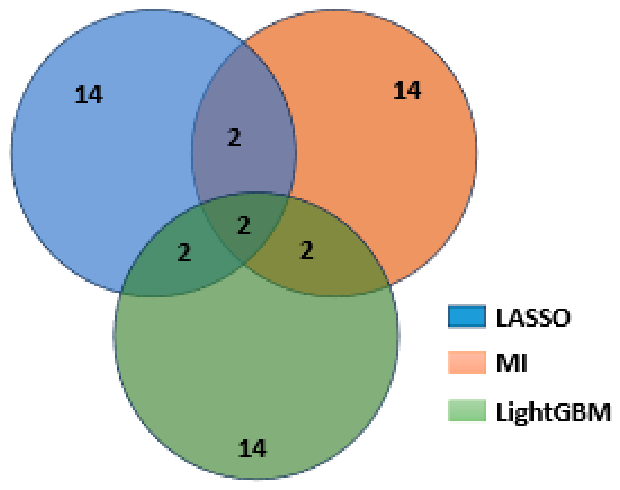
Comparison of the top 20 features selected by each method using a Venn diagram, as illustrated in Figure 7, showed limited overlap, with only two features shared across all three approaches. This low concordance indicates that each selection method captures distinct and complementary aspects of the radiomic feature space.

3.2. Comparative Performance of Feature Selection Strategies

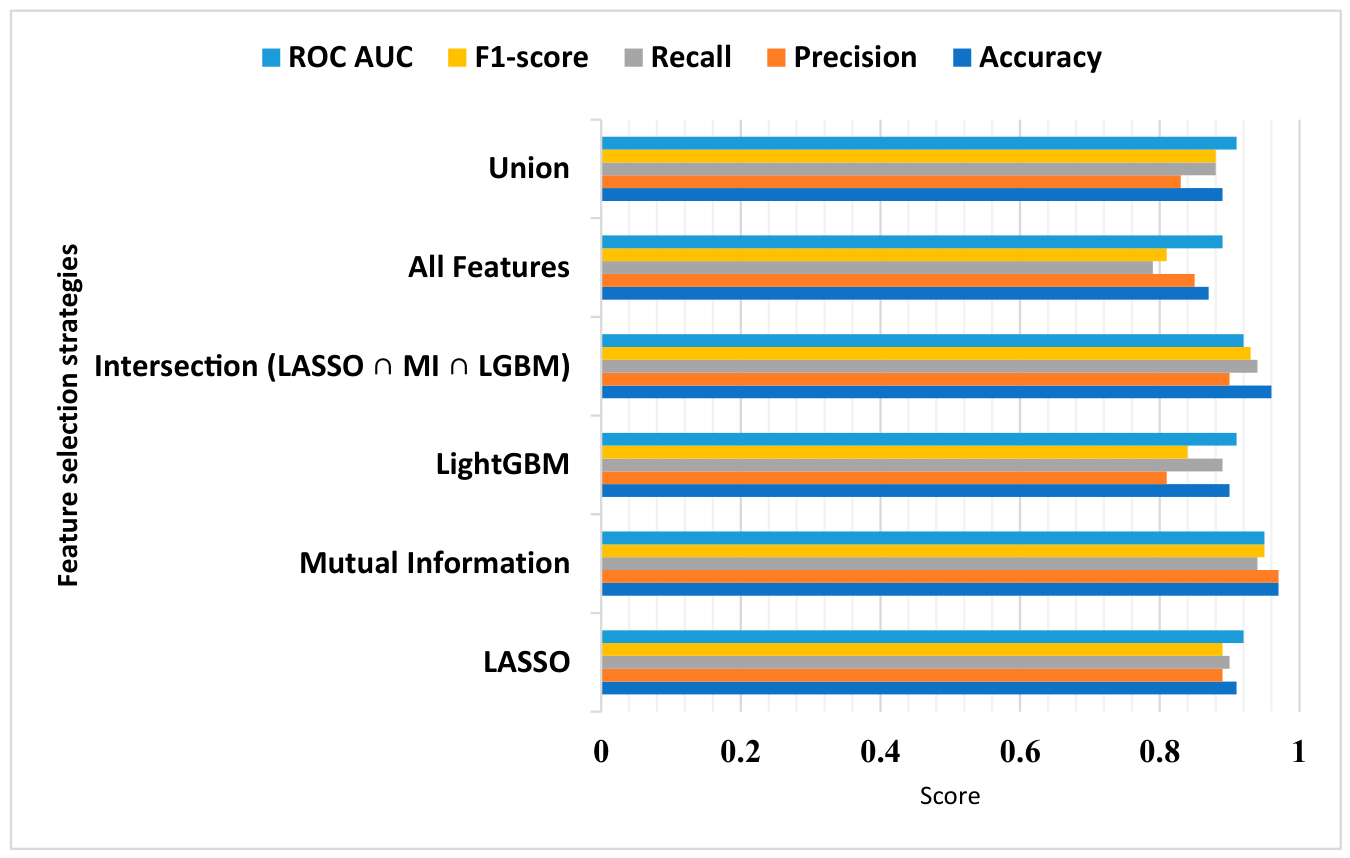
The predictive performance of radiomic feature subsets was evaluated using the HistGradientBoosting Classifier across six feature selection strategies. As summarized in Table 2 and illustrated in Figure 8, substantial performance differences were observed among the evaluated approaches.
The Mutual Information (MI)-based feature subset achieved the highest overall performance, with a mean accuracy of 0.9826 ± 0.025, a recall of 0.9616 ± 0.0712 and an ROC AUC of 0.9717 ± 0.0267, indicating a strong ability to discriminate between metastatic liver tumors and parasitic liver cysts. The intersection subset, comprising features common to Lasso, MI, and LightGBM, yielded comparable performance (accuracy = 0.9228 ± 0.0285) despite its reduced dimensionality, underscoring the effectiveness of consensus-based feature selection.
In contrast, models trained using all features without selection demonstrated the lowest performance (accuracy = 0.9034 ± 0.0306), suggesting that redundant or non-informative features adversely affect classification accuracy. Feature subsets derived from LightGBM and the union-based selection achieved intermediate performance, further supporting the importance of targeted dimensionality reduction.
Figure 7 visually summarizes these results, highlighting the consistent superiority of the MI and intersection strategies across most evaluation metrics compared with the remaining feature selection approaches.
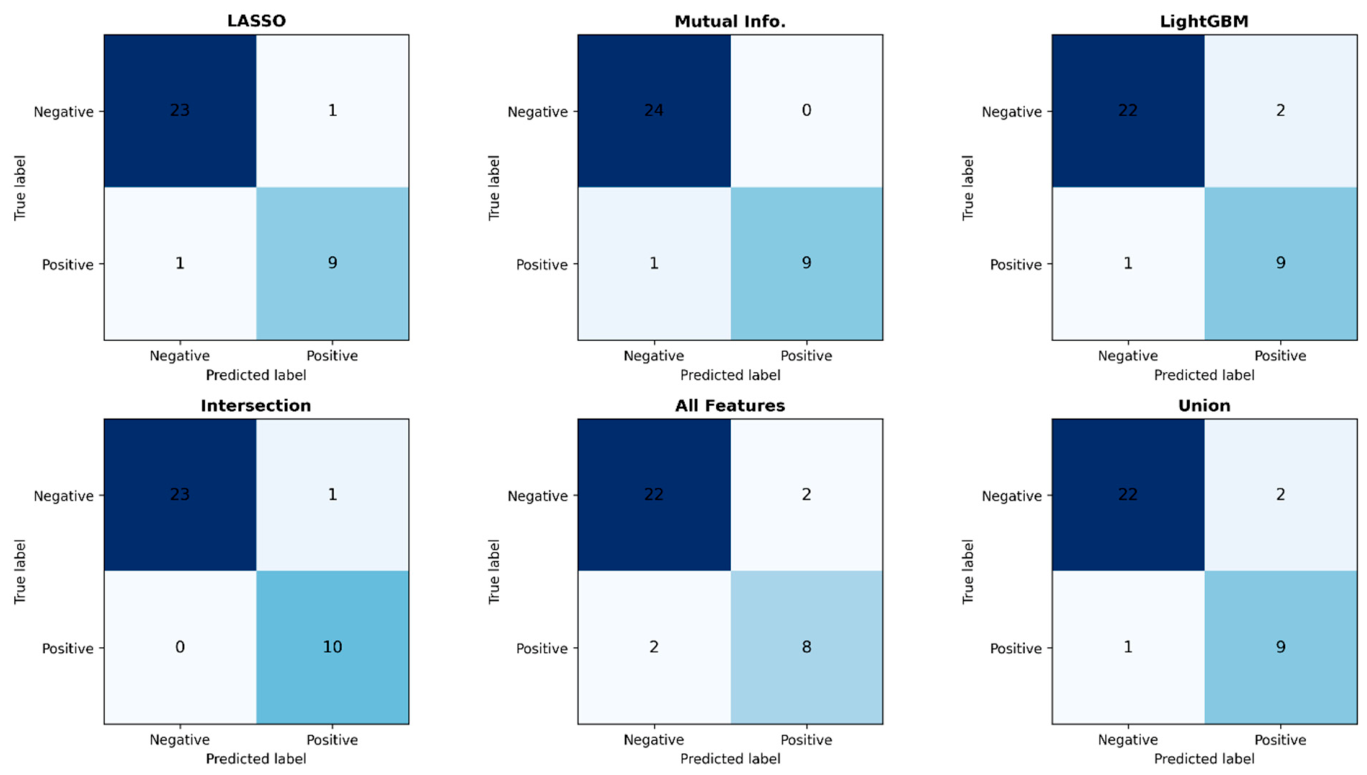
The confusion matrices presented in Figure 9 summarize model performance by reporting the averaged counts of true positives (TP), true negatives (TN), false positives (FP), and false negatives (FN) across the cross-validation folds for each feature selection method.
The confusion matrix analysis further showed that the intersection feature subset minimized both false positives and false negatives, achieving perfect discrimination between metastatic liver tumors and parasitic liver cysts (TP = 10, FN = 0). The Mutual Information (MI)-based model, while highly accurate, exhibited a small number of false negatives. In contrast, the model trained on the full feature set produced the highest number of misclassifications, indicating the negative impact of feature redundancy in radiomic analysis.
Overall, MI- and intersection-based feature selection strategies yielded higher accuracy, precision, recall, and AUC than the remaining approaches, reflecting improved discrimination between metastatic liver tumors and parasitic liver cysts. Notably, the intersection strategy achieved strong predictive performance with a reduced number of features, supporting its suitability for compact and efficient model design.

3.3. Performance of the MI-Based Model

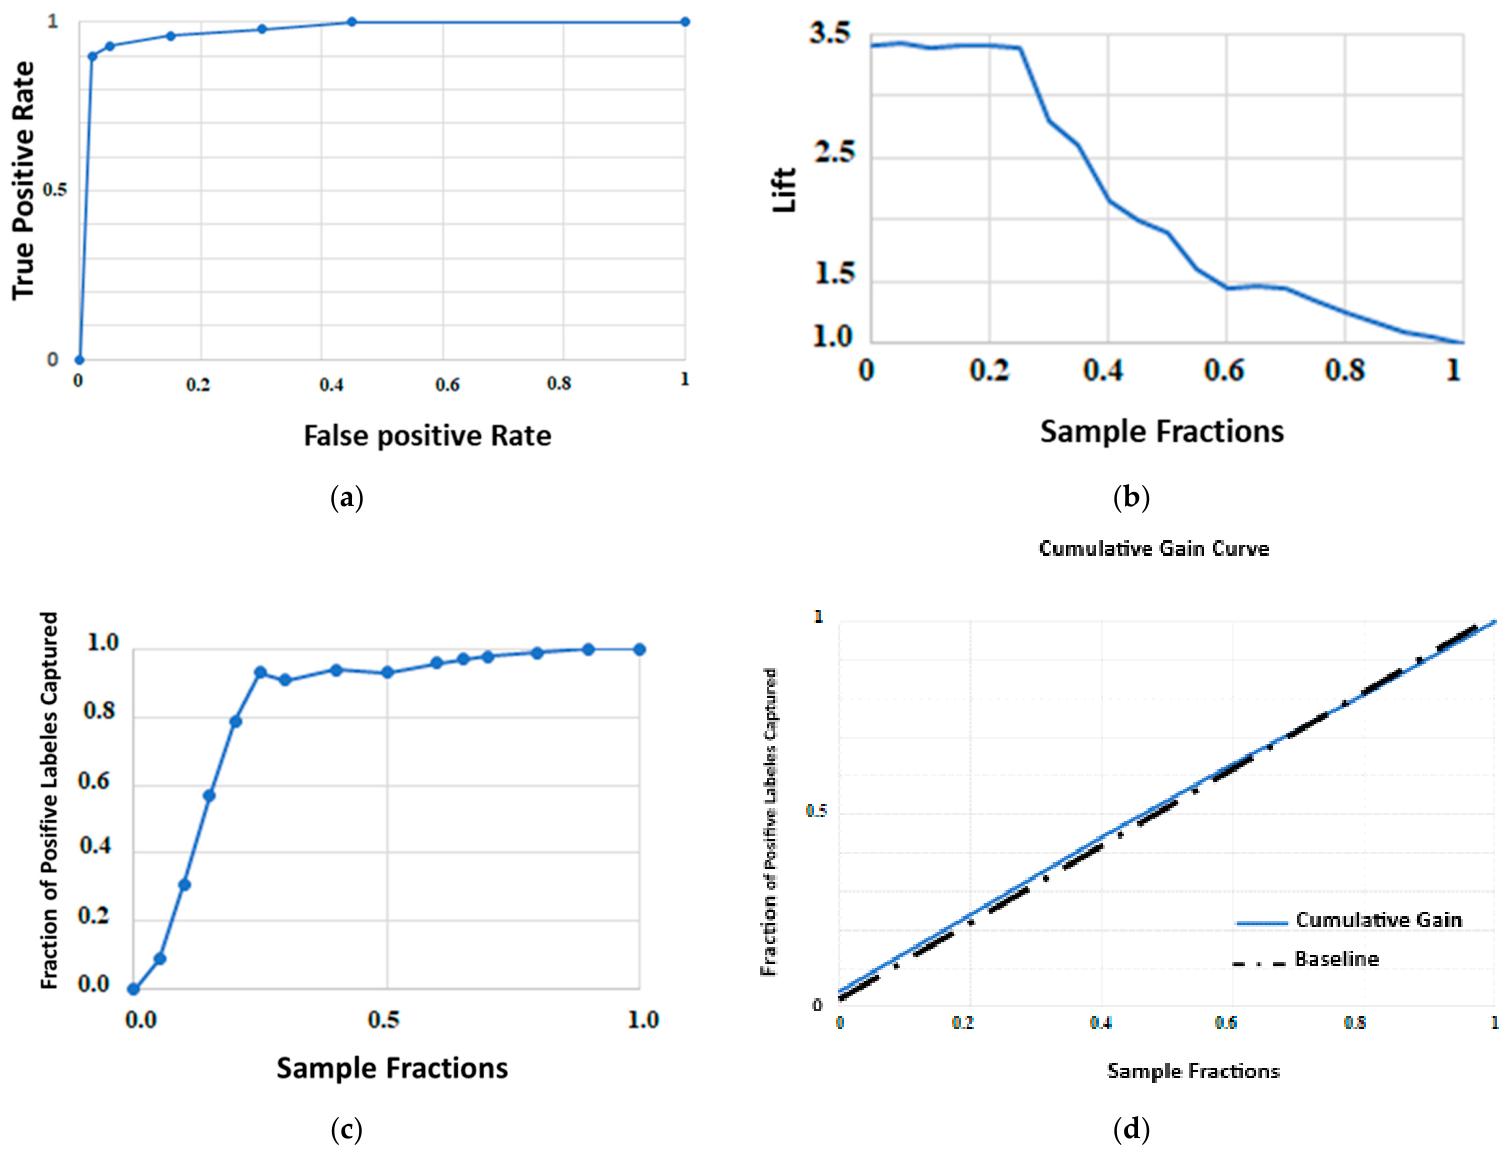
Additional performance evaluation of the Mutual Information-based model is presented in Figure 10. The ROC curve (Figure 10a) demonstrated strong discriminative ability (AUC = 0. 0.9717). The lift curve (Figure 10b) indicated consistent improvement over random classification across all deciles, particularly for the highest-ranked predictions. The cumulative gain curve (Figure 10c) revealed a high concentration of true positive cases within the top prediction intervals. Lastly, the calibration curve (Figure 10d) showed close alignment between predicted probabilities and observed outcomes, confirming the model’s excellent calibration.
These complementary analyses further confirm the robustness and deployability of the MI-based model for non-invasive differentiation of liver cysts and liver tumors.

3.4. Statistical Significance Analysis

In order to validate whether the observed performance differences between feature selection strategies were statistically significant, we conducted a comprehensive statistical comparison using three complementary tests: DeLong’s test for ROC AUC comparison, McNemar’s test for classification agreement, and paired t-tests on repeated cross-validation scores.

3.4.1. Roc Auc Comparisons Using DeLong’s Test

The DeLong test is a non-parametric method widely used for comparing correlated ROC AUC scores across different classifiers. As reported in Table 3, the AUC of the Mutual Information (MI)-based model was significantly higher than that of the other models, including Lasso (p = 0.035), LightGBM (p = 0.005), and the full feature set (p = 0.001), indicating superior discriminatory capability.
Interestingly, the Intersection model also yielded statistically significant differences over several strategies, notably outperforming LightGBM (p = 0.031) and All Features (p = 0.009). These findings highlight the robustness of the minimal consensus-selected features and reinforce the importance of well-curated feature engineering in radiomic pipelines.

3.4.2. Classification Agreement with McNemar’s Test

The McNemar test was applied to paired classification predictions to assess whether two models differed in their tendency to misclassify instances. As shown in Table 4, significant disagreement was observed between the Mutual Information model and nearly all other models (e.g., p = 0.004 vs. All Features, p = 0.008 vs. LightGBM), reinforcing that the MI made systematically different and superior predictions.
Likewise, the Lasso and Intersection models yielded significantly different classification patterns compared to the Union and All Features models (p < 0.05), suggesting greater consistency in correctly classifying cases, especially for borderline or ambiguous lesions.

3.4.3. Paired T-Test on Cross-Validation Scores

To further confirm statistical robustness across the cross-validation folds, we performed paired t-tests comparing mean metric scores (accuracy, F1-score, and AUC) between feature selection strategies. Results in Table 5 indicate that the Mutual Information model significantly outperformed the Lasso (p = 0.040), LightGBM (p = 0.007), and All Features (p = 0.002) configurations. The Intersection subset also achieved statistically superior performance to the All Features (p = 0.011) and LightGBM (p = 0.036), confirming its value as a parsimonious yet discriminative feature representation.
These three levels of statistical assessment, ROC AUC (DeLong), classification agreement (McNemar), and metric consistency (paired t-test), provide convergent evidence that the Mutual Information and Intersection feature selection strategies consistently outperform the others in differentiating metastatic liver tumors from parasitic liver cysts using radiomic data. These findings not only justify their use in downstream interpretability analyses but also support their potential translation into clinically deployable diagnostic tools.

3.5. Model Explainability with SHAP Analysis

Global Feature Importance and Impact

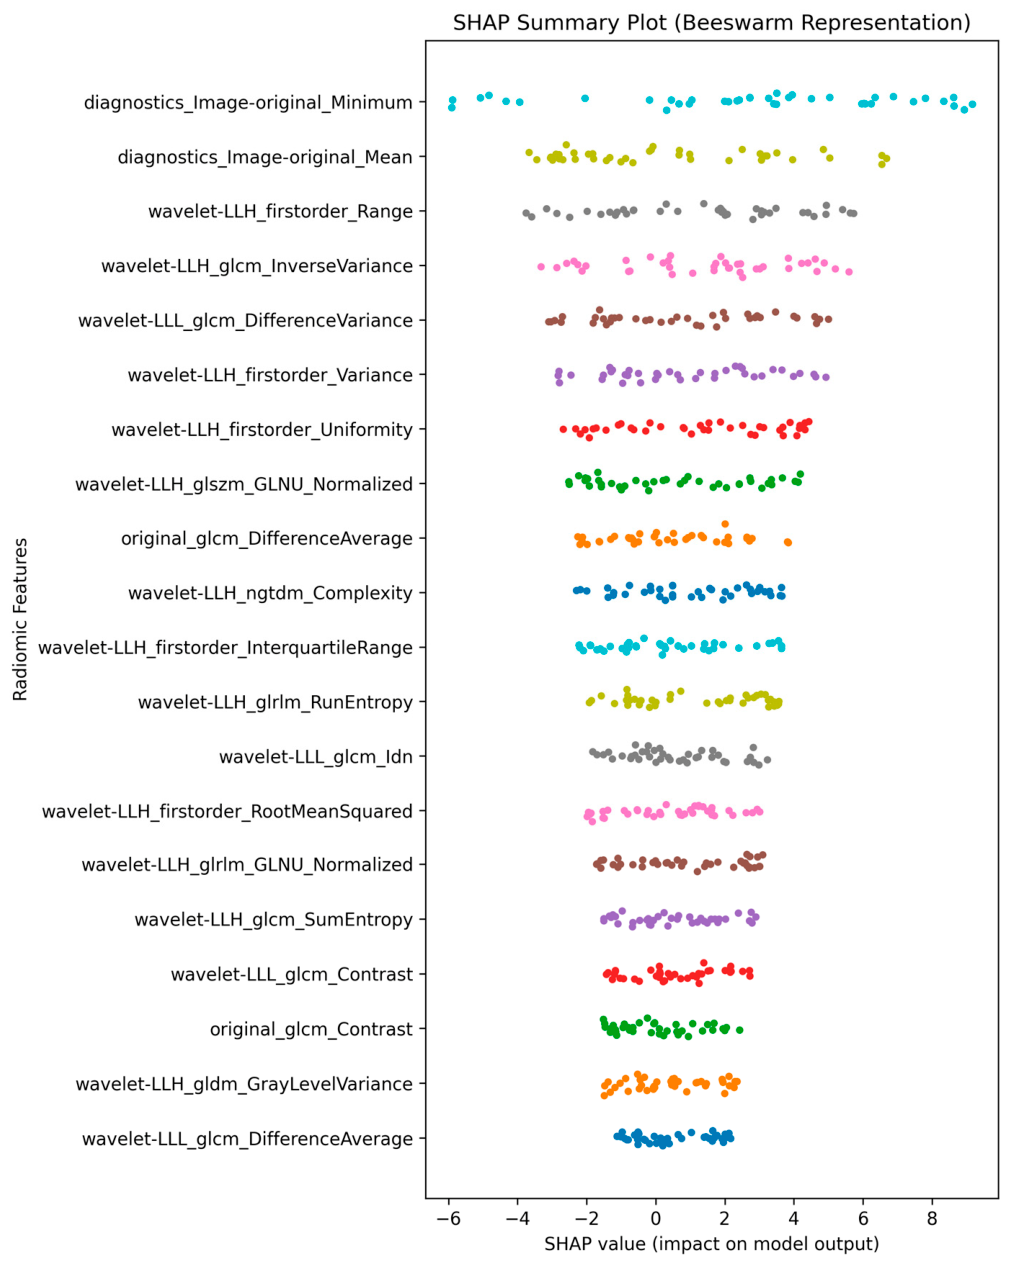
To enhance model interpretability, an SHAP (Shapley Additive Explanations) analysis was performed to quantify the contribution of each radiomic feature to the model predictions. The SHAP summary beeswarm plot (Figure 11) illustrates the distribution of SHAP values across all patients for the most influential radiomic features. Each point represents an individual case, and the horizontal position reflects the magnitude and direction of the feature’s contribution to the model output. Features positioned toward the right increase the predicted probability, whereas those toward the left decrease it. The analysis revealed that diagnostics_Image-original_Minimum and diagnostics_Image-original_Mean exhibited the highest influence on model predictions, indicating that global intensity characteristics play a major role in discrimination. In addition, several wavelet-based radiomic features, including first-order and texture descriptors derived from the GLCM, GLRLM, GLSZM, GLDM, and NGTDM matrices, contributed substantially to the model decision process.
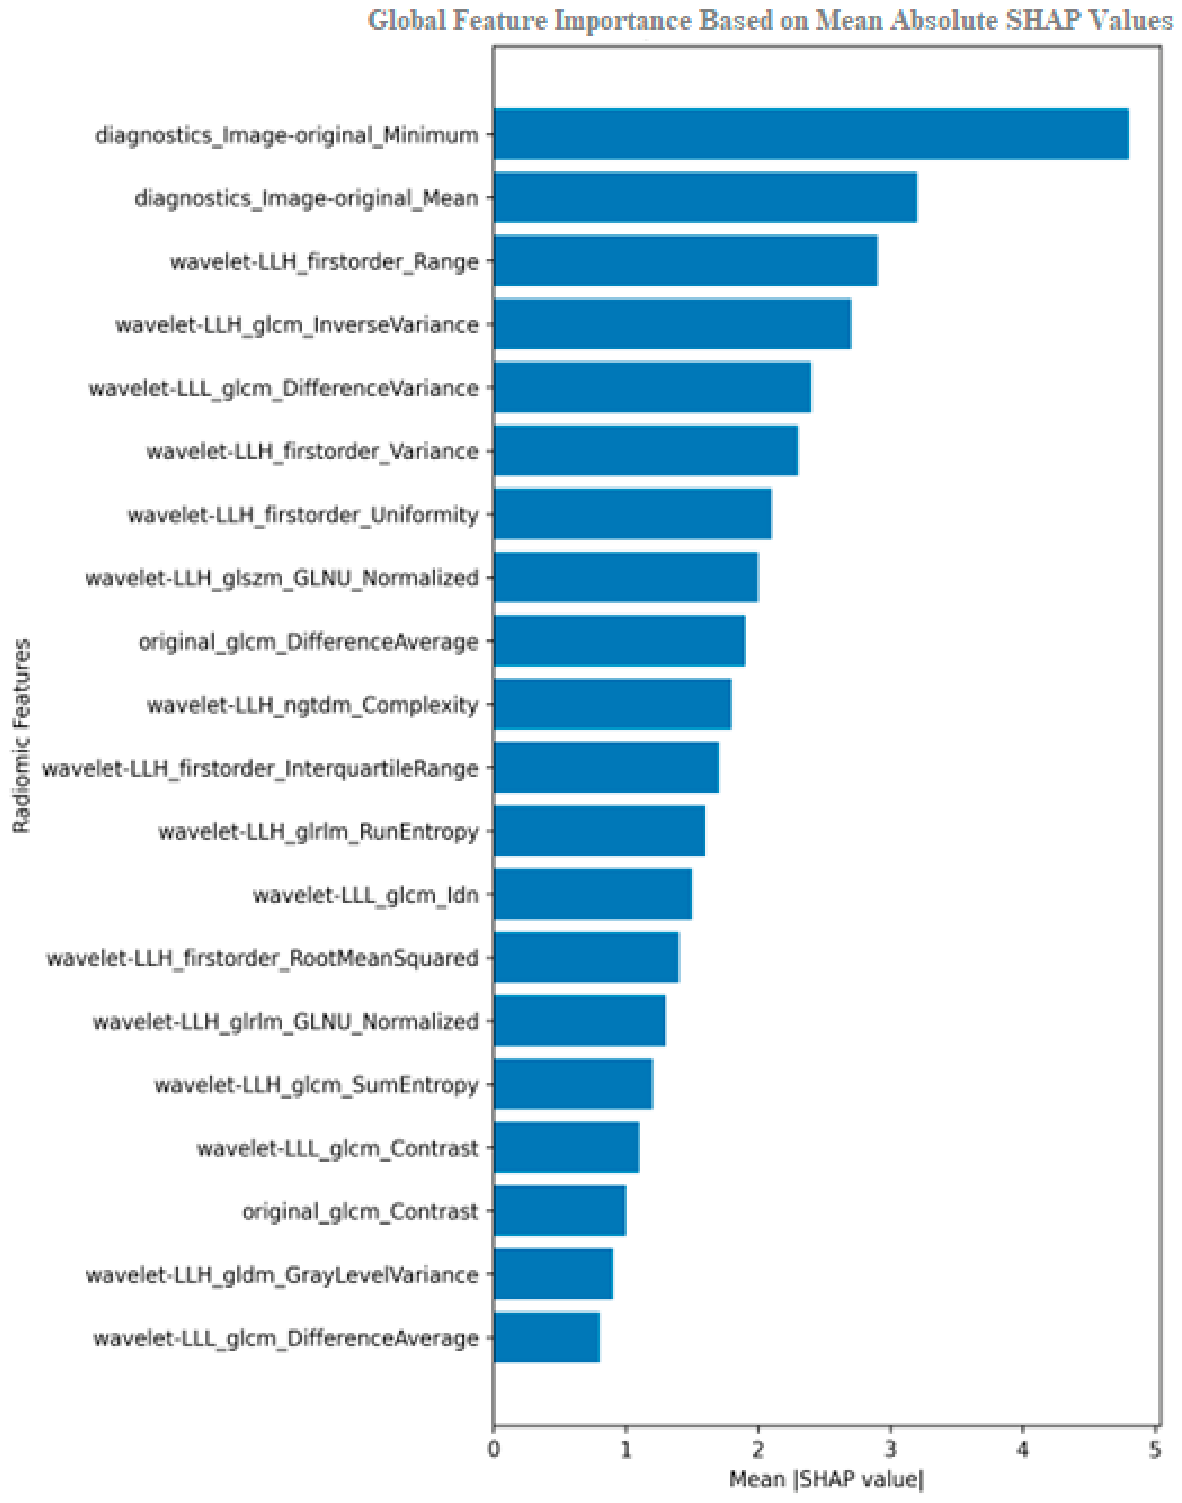
The global importance ranking (Figure 12), based on the mean absolute SHAP values, confirmed the dominance of intensity-based descriptors, followed by multiscale textural heterogeneity features. This suggests that the model leverages complementary information related to both signal intensity distribution and spatial texture patterns within the lesion.
Overall, the SHAP analysis demonstrates that the proposed model relies on a combination of intensity and texture radiomic biomarkers, supporting the biological plausibility and interpretability of the predictive framework.

4. Discussion

This study presents a non-invasive, explainable radiomic and machine learning pipeline capable of differentiating metastasis liver tumors and parasitical liver cysts using CT images. Among the six tested feature selection strategies, the Mutual Information-based model achieved the highest overall classification performance, followed closely by the intersection of the top features from MI, Lasso, and LightGBM. These results highlight the effectiveness of radiomic features in capturing subtle imaging differences between malignant and infectious pulmonary processes that are often indistinguishable to human observers.
Importantly, SHAP explainability analysis revealed that a small number of radiomic features contributed disproportionately to model differentiation. First-order statistics such as diagnostics_Image-original_Minimum and Mean, along with second-order texture features like DifferenceAverage and GrayLevelNonUniformityNormalized, were strongly associated with the class labels. These findings align with prior studies demonstrating that MLT lesions tend to exhibit more heterogeneous internal architecture compared to PLC, likely due to irregular angiogenesis and necrosis patterns. The ability to visualize and interpret these patterns via SHAP enhances clinical trust and interpretability, which are crucial for AI acceptance in healthcare.
Statistical tests confirmed that performance differences across feature subsets were not only observed numerically but were also statistically significant. The DeLong test, McNemar test, and paired t-tests each demonstrated that the MI and intersection models significantly outperformed models using all features or those selected by single-method approaches. This strengthens the case for multi-method feature selection strategies in radiomic pipelines, especially when generalizability and robustness are desired.
Beyond predictive accuracy, the clinical deployment of any AI-based diagnostic tool requires careful evaluation of its calibration and decision-making support capacity. In this study, the model trained on Mutual Information (MI)-selected features demonstrated excellent agreement between predicted probabilities and actual outcomes, as evidenced by the calibration curve presented in Figure 10d). The curve closely follows the diagonal, indicating that the model’s probability estimates are reliable and well calibrated across the risk spectrum. This reliability is essential for integrating the tool into clinical workflows, where probabilistic outputs are often used to guide downstream decisions such as biopsy recommendations or second-line investigations.
The Lift Curve and the Cumulative Gain Curve offer additional insights into the model’s clinical value. The lift curve shows that, across all quantiles, the MI-based model consistently outperforms random guessing, with a particularly strong lift in the top decile. This suggests that the model is effective at prioritizing patients who are truly at risk. Similarly, the cumulative gain curve confirms that a high proportion of true positive cases are captured early when patients are ranked by predicted probability, making the model a promising candidate for triage applications.
The ROC curve, with an AUC of 0.981, further supports the model’s utility, confirming its excellent discrimination capacity across various thresholds. This is especially relevant in clinical environments where the acceptable balance between sensitivity and specificity may vary depending on patient condition, comorbidities, or resource constraints.
Together, these curves substantiate the model’s readiness for clinical translation. Its high calibration, prioritization power, and discrimination capacity indicate that it can meaningfully augment radiological decision-making in differentiating metastatic liver tumors from pathological liver cysts, particularly in settings with limited access to invasive diagnostics.
Nevertheless, several limitations must be acknowledged. The study is retrospective and monocentric, which may limit generalizability. Although 5-fold cross-validation reduces the risk of overfitting, external validation on independent datasets is necessary before clinical deployment. Furthermore, while CT-based radiomics offers great promise, real-world scenarios may benefit from multimodal integration (e.g., PET-CT, genomics, and clinical biomarkers) to further enhance diagnostic precision.
This study contributes to the expanding body of research on machine learning applications in liver lesion analysis by proposing a distinct approach with high classification accuracy. However, the single-region focus may introduce potential biases. Incorporating multi-source data from diverse populations could improve the model’s generalizability, applicability, and fairness.
The strong discriminative performance of the selected radiomic features can be explained by the fundamental biological and histopathological differences between pathological liver cysts (PLCs) and liver metastases (MLTs). These differences directly influence lesion appearance on computed tomography (CT) images, particularly in terms of density, texture, homogeneity, and shape, all of which can be quantitatively assessed through radiomic analysis.
Pathological liver cysts are primarily fluid-filled cavities characterized by homogeneous content, low attenuation values, and smooth, well-defined borders. Owing to their relatively simple internal structure, they generally exhibit a uniform radiological appearance throughout the lesion. In contrast, liver metastases are secondary malignant tumors composed of proliferating cancer cells, fibrotic stroma, necrotic areas, occasional hemorrhagic components, and heterogeneous vascularization. This complex tissue architecture results in substantial variations in image intensity and texture within the lesion.
First-order features, such as Original Minimum and Original Mean, directly reflect the differences in attenuation values between these two lesion types. Fluid-filled cysts typically exhibit low and relatively stable Hounsfield Unit (HU) values, whereas metastatic lesions demonstrate higher and more variable attenuation values due to their heterogeneous tissue composition. Consequently, these features effectively capture differences in lesion density and overall intensity distribution.
Texture features derived from the Gray-Level Co-occurrence Matrix (GLCM), including Wavelet-HHH GLCM IMC1 and Wavelet-HHH GLCM Difference Average, characterize the spatial distribution and relationships of gray level intensities within the lesion. Because cysts contain a relatively homogeneous fluid component, they generate regular and uniform texture patterns. In contrast, metastases often contain regions of necrosis, fibrosis, and viable tumor tissue, producing more complex and irregular texture patterns. These features are therefore particularly sensitive to intralesional heterogeneity, which is a hallmark of malignant tumors.
Similarly, Wavelet-HLL GLSZM Gray Level Non-Uniformity Normalized provides valuable information regarding lesion organization and structural complexity. Owing to their homogeneous nature, cysts generally exhibit low gray level variability across homogeneous zones. Conversely, the coexistence of multiple tissue components within metastatic lesions increases gray level non-uniformity, making this feature a relevant indicator of tissue heterogeneity.
Shape-related characteristics also play an important role in lesion differentiation. Original Shape Sphericity quantifies the degree to which a lesion resembles a perfect sphere. Liver cysts typically display a rounded and regular morphology resulting from fluid accumulation within a confined cavity. In contrast, metastatic lesions frequently exhibit irregular contours due to infiltrative growth patterns and interactions with the surrounding hepatic parenchyma. Consequently, lower sphericity values are often associated with malignant lesions and more complex biological behavior.
Furthermore, Wavelet-HLL GLRLM Long Run Low Gray Level Emphasis measures the presence of extended homogeneous regions characterized by low gray level values. Such patterns are commonly observed in cystic lesions because their fluid content generates uniformly low attenuation. In metastatic lesions; however, the heterogeneous internal architecture disrupts these homogeneous low-intensity regions, leading to significantly different feature values.
Collectively, these radiomic features capture complementary aspects of lesion phenotype, including tissue composition, internal organization, texture heterogeneity, and morphological characteristics. Their combined ability to quantify biologically meaningful differences between pathological liver cysts and liver metastases explains their high discriminative performance. These findings further support the potential of radiomics as a non-invasive decision-support tool for improving the characterization and differential diagnosis of hepatic lesions in clinical practice.
The main practical value of this work is its potential contribution to the daily diagnostic approach for hepatic focal lesions, especially in situations where metastatic liver tumors (MLTs) and parasitic liver cysts (PLCs) present similar CT features and remain difficult to differentiate. In clinical practice, this diagnostic overlap can create uncertainty and may influence patient management, either by delaying appropriate treatment or by leading to unnecessary additional investigations. The proposed radiomics-based approach offers a complementary tool that may help clinicians identify subtle quantitative imaging characteristics that are difficult to appreciate through conventional visual assessment alone.
By using routinely available CT images, the developed model provides a non-invasive and relatively accessible method that could support radiologists in cases where MRI or biopsy is not feasible, unavailable, or associated with potential risks. The ability of the selected radiomic features to accurately distinguish MLTs from PLCs suggests that these imaging biomarkers may provide additional information beyond morphological evaluation and could improve diagnostic confidence in challenging cases.
In everyday practice, this approach should be viewed as a support tool rather than a substitute for radiological expertise. Its potential interest lies in assisting decision-making, particularly in ambiguous cases, by providing an objective and reproducible second opinion that may help guide further management. Moreover, the explainable nature of the model increases its clinical acceptability by allowing physicians to better understand which imaging characteristics contribute to the final prediction.
This study demonstrates that CT radiomics combined with interpretable machine learning has the potential to become a useful aid in the everyday differential diagnosis of hepatic focal lesions, improving diagnostic accuracy and supporting faster, more appropriate patient care.
The clinical relevance of this study is its potential to provide practical support for healthcare professionals dealing with challenging liver lesion diagnoses. In routine practice, distinguishing metastatic liver tumors from parasitic liver cysts can be difficult because these lesions may present with similar imaging features on CT scans. This diagnostic overlap can create uncertainty, delay appropriate management, and sometimes lead to unnecessary invasive procedures.
The proposed radiomics-based machine learning approach offers a non-invasive and accessible tool that could help radiologists and clinicians make more confident decisions, especially in cases where biopsy is risky, unavailable, or not immediately feasible. By identifying quantitative imaging patterns that are difficult to appreciate through visual assessment alone, this method may complement the expertise of radiologists and improve the characterization of indeterminate hepatic lesions.
For clinicians, a more reliable differentiation between metastatic lesions and parasitic cysts could directly influence patient management by guiding appropriate treatment strategies and avoiding delays.
For pathologists, such a tool may help identify patients who would benefit most from biopsy and optimize the use of pathological examination when imaging findings remain inconclusive.
An additional practical advantage of this approach is its reliance on CT images, which are widely available in many healthcare settings. Therefore, it could be particularly valuable in hospitals with limited access to advanced imaging techniques or invasive diagnostic procedures.

5. Conclusions

In this study, we developed a robust, interpretable, and highly accurate machine learning framework for distinguishing metastatic liver tumors from parasitic liver cysts using CT-derived radiomic features. By combining radiomic analysis, feature selection methods, ensemble classification, and SHAP-based explainability, the proposed approach delivers both strong predictive performance and clinical interpretability. Among the strategies evaluated, the Mutual Information-based feature selection method achieved the highest overall performance, enabling effective model simplification without compromising diagnostic accuracy. Moreover, the framework showed good calibration, reliable prioritization, and a high degree of transparency, all of which are essential for potential adoption in routine clinical practice.

Author Contributions

Conceptualization: A.B. (Amine Benkabbou), M.Q. and A.C.; Methodology, A.B. (Amine Benkabbou), M.Q. and A.C.; Software, A.B. (Anass Benfares); Validation: A.M., R.M., O.L., Z.E.M., M.M., A.B. (Amine Benkabbou), M.Q., A.S., A.C., M.M. and A.B. (Alami Badreddine), M.A.E.A.E.H.; formal analysis, A.B. (Amine Benkabbou), M.Q., M.O., O.J.M. and A.L.; Resources: M.A.E.A.E.H.; investigation, M.M., R.M., A.B. and M.Q.; writing—review and editing: O.J.M., A.L., H.Q., M.S. and O.J.M.; supervision: A.B. (Amine Benkabbou), M.Q. and A.C. All authors have read and agreed to the published version of the manuscript.

Funding

This research received no external funding.

Institutional Review Board Statement

The study was conducted in accordance with the Declaration of Helsinki and approved by the Institutional Review Board of the faculty of Medicine and Pharmacy Ethics Committee of Casablanca, Morocco, according to Helsinki Declaration under reference 17/15 (protocol code 17/15 and date of approval 15 April 2015).

Informed Consent Statement

Informed consent was obtained from all subjects involved in the study.

Data Availability Statement

Data available upon reasonable request to the corresponding author.

Conflicts of Interest

The authors declare no conflicts of interest.

References

  1. Rawla, P.; Sunkara, T.; Muralidharan, P.; Raj, J.P. An updated review of cystic hepatic lesions. Clin. Exp. Hepatol. 2019, 5, 22–29. [Google Scholar] [CrossRef]
  2. Borhani, A.A.; Wiant, A.; Heller, M.T. Cystic hepatic lesions: A review and an algorithmic approach. AJR Am. J. Roentgenol. 2014, 203, 1192–1204. [Google Scholar] [CrossRef] [PubMed]
  3. Lantinga, M.A.; Gevers, T.J.; Drenth, J.P. Evaluation of hepatic cystic lesions. World J. Gastroenterol. 2013, 19, 3543–3554. [Google Scholar] [CrossRef] [PubMed]
  4. Oh, J.H.; Jun, D.W. The latest global burden of liver cancer: A past and present threat. Clin. Mol. Hepatol. 2023, 29, 355–357. [Google Scholar] [CrossRef] [PubMed]
  5. Chon, Y.E.; Park, S.Y.; Hong, H.P.; Son, D.; Lee, J.; Yoon, E.; Kim, S.S.; Ahn, S.B.; Jeong, S.W.; Jun, D.W. Hepatocellular carcinoma incidence is decreasing in Korea but increasing in the very elderly. Clin. Mol. Hepatol. 2023, 29, 120–134. [Google Scholar] [CrossRef] [PubMed]
  6. Spalice, E.; D’Alterio, C.; Lanzone, M.; Iannone, I.; De Padua, C.; De Pastena, M.; Coppola, A. Liver Cysts and Artificial Intelligence: Is AI Really a Patient-Friendly Support? Surgeries 2025, 6, 73. [Google Scholar] [CrossRef]
  7. Nishigaki, D.; Nakamoto, A.; Tsuboyama, T.; Onishi, H.; Suzuki, Y.; Wataya, T.; Kita, K.; Sato, J.; Tomiyama, M.; Yanagawa, M.; et al. Performance of Radiologists in Characterizing and Diagnosing Hepatic Lesions Using Dynamic Contrast-Enhanced CT With and Without Artificial Intelligence. Appl. Biosci. 2025, 4, 56. [Google Scholar] [CrossRef]
  8. Amin, N.; Anwar, J.; Sulaiman, A.; Naumova, N.N.; Anwar, N. Hepatocellular Carcinoma: A Comprehensive Review. Diseases 2025, 13, 207. [Google Scholar] [CrossRef] [PubMed]
  9. Kinsey, E.; Lee, H.M. Management of Hepatocellular Carcinoma in 2024: The Multidisciplinary Paradigm in an Evolving Treatment Landscape. Cancers 2024, 16, 666. [Google Scholar] [CrossRef] [PubMed]
  10. Urhuț, M.-C.; Săndulescu, L.D.; Streba, C.T.; Mămuleanu, M.; Ciocâlteu, A.; Cazacu, S.M.; Dănoiu, S. Diagnostic Performance of an Artificial Intelligence Model Based on Contrast-Enhanced Ultrasound in Patients with Liver Lesions: A Comparative Study with Clinicians. Diagnostics 2023, 13, 3387. [Google Scholar] [CrossRef] [PubMed]
  11. Kovač, J.D.; Mitrović, M.; Janković, A.; Andrejević, M.; Bogdanović, A.; Zdujić, P.; Đinđić, U.; Dugalić, V. Hepatocellular Carcinoma Presenting Simultaneously with Echinococcal Cyst Mimicking a Single Liver Lesion in a Non-Cirrhotic Patient: A Case Report and Review of the Literature. Diagnostics 2022, 12, 1583. [Google Scholar] [CrossRef] [PubMed]
  12. Moga, T.V.; Lupusoru, R.; Danila, M.; Ghiuchici, A.M.; Popescu, A.; Miutescu, B.; Ratiu, I.; Burciu, C.; Bizerea-Moga, T.; Voron, A.; et al. Challenges in Diagnosing Focal Liver Lesions Using Contrast-Enhanced Ultrasound. Diagnostics 2024, 15, 46. [Google Scholar] [CrossRef] [PubMed]
  13. Anichini, M.; Galluzzo, A.; Danti, G.; Grazzini, G.; Pradella, S.; Treballi, F.; Bicci, E. Focal Lesions of the Liver and Radiomics: What Do We Know? Diagnostics 2023, 13, 2591. [Google Scholar] [CrossRef] [PubMed]
  14. Yıldırım, H.Ç.; Kavgaci, G.; Chalabiyev, E.; Dizdar, O. Advances in the Early Detection of Hepatobiliary Cancers. Cancers 2023, 15, 3880. [Google Scholar] [CrossRef] [PubMed]
  15. Kazi, I.A.; Jahagirdar, V.; Kabir, B.W.; Syed, A.K.; Kabir, A.W.; Perisetti, A. Role of Imaging in Screening for Hepatocellular Carcinoma. Cancers 2024, 16, 3400. [Google Scholar] [CrossRef] [PubMed]
  16. Ghenciu, L.A.; Grigoras, M.L.; Rosu, L.M.; Bolintineanu, S.L.; Sima, L.; Cretu, O. Differentiating Liver Metastases from Primary Liver Cancer: A Retrospective Study of Imaging and Pathological Features in Patients with Histopathological Confirmation. Biomedicines 2025, 13, 164. [Google Scholar] [CrossRef] [PubMed]
  17. Candita, G.; Rossi, S.; Cwiklinska, K.; Fanni, S.C.; Cioni, D.; Lencioni, R.; Neri, E. Imaging Diagnosis of Hepatocellular Carcinoma: A State-of-the-Art Review. Diagnostics 2023, 13, 625. [Google Scholar] [CrossRef] [PubMed]
  18. Sah, A.K.; Afzal, M.; Elshaikh, R.H.; Abbas, A.M.; Shalabi, M.G.; Prabhakar, P.K.; Babker, A.M.A.; Khalimova, F.T.; Sabrievna, V.A.; Choudhary, R.K. Innovative Strategies in the Diagnosis and Treatment of Liver Cirrhosis and Associated Syndromes. Life 2025, 15, 779. [Google Scholar] [CrossRef] [PubMed]
  19. Afyouni, S.; Zandieh, G.; Nia, I.Y.; Pawlik, T.M.; Kamel, I.R. State-of-the-art imaging of hepatocellular carcinoma. J. Gastrointest. Surg. 2024, 28, 1717–1725. [Google Scholar] [CrossRef] [PubMed]
  20. Choi, J.H. Histological and Molecular Evaluation of Liver Biopsies: A Practical and Updated Review. Int. J. Mol. Sci. 2025, 26, 7729. [Google Scholar] [CrossRef] [PubMed]
  21. Le, M.H.N.; Kha, H.Q.; Tran, N.M.; Nguyen, P.K.; Huynh, H.H.; Huynh, P.K.; Lam, H.; Le, N.Q.K. Radiomics in liver research: A paradigm shift in disease detection and staging. Eur. J. Radiol. Artif. Intell. 2025, 2, 100016. [Google Scholar] [CrossRef]
  22. Huang, S.; Nie, X.; Pu, K.; Wan, X.; Luo, J. A Flexible Deep Learning Framework for Liver Tumor Diagnosis Using Variable Multi-Phase Contrast-Enhanced CT Scans. J. Cancer Res. Clin. Oncol. 2024, 150, 443. [Google Scholar] [CrossRef] [PubMed]
  23. Kanan, A.; Pereira, B.; Hordonneau, C.; Cassagnes, L.; Pouget, E.; Tianhoun, L.A.; Chauveau, B.; Magnin, B. Deep Learning CT Reconstruction Improves Liver Metastases Detection. Insights Imaging 2024, 15, 167. [Google Scholar] [CrossRef] [PubMed]
  24. Mao, H.-Y.; Hu, J.-C.; Zhang, T.; Li, Y.; Wang, X.; Chen, Z.; Liu, H. Hepatocellular Carcinoma and Focal Nodular Hyperplasia Showing Iso- or Hyperintensity in the Hepatobiliary Phase: Differentiation Using Gd-EOB-DTPA-Enhanced MRI Radiomics and Deep Learning Features. BMC Med. Imaging 2025, 25, 397. [Google Scholar] [CrossRef] [PubMed]
  25. Nakatsuka, T.; Tateishi, R.; Sato, M.; Hashizume, N.; Kamada, A.; Nakano, H.; Kabeya, Y.; Yonezawa, S.; Irie, R.; Tsujikawa, H.; et al. Deep Learning and Digital Pathology Powers Prediction of Hepatocellular Carcinoma Development in Steatotic Liver Disease. Hepatology 2025, 81, 976–989. [Google Scholar] [PubMed]
  26. Lu, X.; Zhang, H.; Kuroda, H.; Garcovich, M.; de Ledinghen, V.; Grgurević, I.; Linghu, R.; Ding, H.; Chang, J.; Wu, M.; et al. Deep Learning Radiomics of Elastography for Diagnosing Compensated Advanced Chronic Liver Disease: An International Multicenter Study. Hepatology 2025, 82, 1123–1137. [Google Scholar]
  27. Saini, A.; Breen, I.; Pershad, Y.; Naidu, S.; Knuttinen, M.G.; Alzubaidi, S.; Sheth, R.; Albadawi, H.; Kuo, M.; Oklu, R. Radiogenomics and Radiomics in Liver Cancers. Diagnostics 2019, 9, 4. [Google Scholar] [CrossRef] [PubMed]
  28. Razzaq, K.; Shah, M. Machine Learning and Deep Learning Paradigms: From Techniques to Practical Applications and Research Frontiers. Computers 2025, 14, 93. [Google Scholar] [CrossRef]
  29. Mienye, I.D.; Swart, T.G. A Comprehensive Review of Deep Learning: Architectures, Recent Advances, and Applications. Information 2024, 15, 755. [Google Scholar] [CrossRef]
  30. Song, Z.; Wu, W.; Wu, S. Multi-Scale Convolutional Attention and Structural Re-Parameterized Residual-Based 3D U-Net for Liver and Liver Tumor Segmentation from CT. Sensors 2025, 25, 1814. [Google Scholar] [CrossRef] [PubMed]
  31. Zhang, B.; Qiu, S.; Liang, T. Dual Attention-Based 3D U-Net Liver Segmentation Algorithm on CT Images. Bioengineering 2024, 11, 737. [Google Scholar] [CrossRef] [PubMed]
  32. Torra-Ferrer, N.; Duh, M.M.; Grau-Ortega, Q.; Cañadas-Gómez, D.; Moreno-Vedia, J.; Riera-Marín, M.; Aliaga-Lavrijsen, M.; Serra-Prat, M.; García López, J.; González-Ballester, M.Á.; et al. Machine Learning-Driven Radiomics Analysis for Distinguishing Mucinous and Non-Mucinous Pancreatic Cystic Lesions: A Multicentric Study. J. Imaging 2025, 11, 68. [Google Scholar] [CrossRef] [PubMed]
  33. Raza, A.; Guzzo, A.; Ianni, M.; Lappano, R.; Zanolini, A.; Maggiolini, M.; Fortino, G. Federated Learning in radiomics: A comprehensive meta-survey on medical image analysis. Comput. Methods Programs Biomed. 2025, 267, 108768. [Google Scholar] [CrossRef] [PubMed]
  34. Lambin, P.; Rios-Velazquez, E.; Leijenaar, R.; Carvalho, S.; van Stiphout, R.G.; Granton, P.; Zegers, C.M.; Gillies, R.; Boellard, R.; Dekker, A.; et al. Radiomics: Extracting more information from medical images using advanced feature analysis. Eur. J. Cancer 2012, 48, 441–446. [Google Scholar] [CrossRef] [PubMed]
  35. Jain, A.K.; Zongker, S. Feature selection: Evaluation, application, and small sample performance. IEEE Trans. Pattern Anal. Mach. Intell. 1997, 19, 153–158. [Google Scholar] [CrossRef]
  36. Aerts, D.; Velazquez, E.R.; Leijenaar, R.T.H.; Parmar, C.; Grossmann, P.; Carvalho, S.; Bussink, J.; Monshouwer, R.; Haibe-Kains, B.; Rietveld, D.; et al. Decoding tumour phenotype by noninvasive imaging using a quantitative radiomics approach. Nat. Commun. 2014, 5, 4006. [Google Scholar] [CrossRef] [PubMed]
  37. Mougiakakou, S.G.; Valavanis, I.K.; Nikita, A.; Nikita, K.S. Differential diagnosis of CT focal liver lesions using texture features, feature selection and ensemble driven classifiers. Artif. Intell. Med. 2007, 41, 25–37. [Google Scholar] [CrossRef] [PubMed]
  38. Zossou, V.-B.S.; Gnangnon, F.H.R.; Biaou, O.; de Vathaire, F.; Allodji, R.S.; Ezin, E.C. Radiomics-Based Classification of Tumor and Healthy Liver on Computed Tomography Images. Cancers 2024, 16, 1158. [Google Scholar] [CrossRef] [PubMed]
  39. Xu, Y.; Guo, Y.-L.; Lv, Q.-Y.; Wang, Z.; Zhou, J.; Hu, J. From Large-Scale Characterization to Subgroup-Specific Predictive Modeling: A Study on the Diagnostic Value of Liver Stiffness Measurements in Focal Liver Lesions. Diagnostics 2025, 15, 1986. [Google Scholar] [CrossRef] [PubMed]
  40. Lysdahlgaard, S. Comparing Radiomics features of tumour and healthy liver tissue in a limited CT dataset: A machine learning study. Radiography 2022, 28, 718–724. [Google Scholar] [CrossRef] [PubMed]
  41. Kraskov, A.; Stögbauer, H.; Grassberger, P. Estimating mutual information. Phys. Rev. E 2004, 69, 066138. [Google Scholar] [CrossRef]
  42. Fira, M.; Goras, L.; Costin, H.-N. Evaluating Sparse Feature Selection Methods: A Theoretical and Empirical Perspective. Appl. Sci. 2025, 15, 3752. [Google Scholar] [CrossRef]
  43. Ke, G.; Meng, Q.; Finley, T.; Wang, T.; Chen, W.; Ma, W.; Ye, Q.; Liu, T. LightGBM: A highly efficient gradient boosting decision tree. In NIPS’17: Proceedings of the 31st International Conference on Neural Information Processing Systems, Long Beach, CA, USA, 4–9 December 2017; Curran Associates, Inc.: Red Hook, NY, USA, 2017; pp. 3146–3154. [Google Scholar]
  44. Pedregosa, F.; Varoquaux, G.; Gramfort, A.; Michel, V.; Thirion, B.; Grisel, O.; Blondel, M.; Prettenhofer, P.; Weiss, R.; Dubourg, V.; et al. Scikit-learn: Machine learning in Python. J. Mach. Learn. Res. 2011, 12, 2825–2830. [Google Scholar]
  45. Lundberg, S.M.; Lee, S.-I. A unified approach to interpreting model predictions. In Proceedings of the NIPS’17: Proceedings of the 31st International Conference on Neural Information Processing Systems, Long Beach, CA, USA, 4–9 December 2017. [Google Scholar]
  46. Lundberg, S.M.; Erion, G.; Chen, H.; DeGrave, A.; Prutkin, J.M.; Nair, B.; Katz, R.; Himmelfarb, J.; Bansal, N.; Lee, S.-I. From local explanations to global understanding with explainable AI for trees. Nat. Mach. Intell. 2020, 2, 56–67. [Google Scholar] [CrossRef] [PubMed]
  47. Zwanenburg, A.; Vallières, M.; Abdalah, M.A.; Aerts, J.W.L.A.; Andrearczyk, V.; Apte, A.; Ashrafinia, S.; Bakas, S.; Beukinga, R.J.; Boellaard, R.; et al. The Image Biomarker Standardization Initiative: Standardized quantitative radiomics for high-throughput image-based phenotyping. Radiology 2020, 295, 328–338. [Google Scholar] [CrossRef] [PubMed]
  48. Yushkevich, P.A.; Piven, J.; Hazlett, H.C.; Smith, R.G.; Ho, S.; Gee, J.C.; Gerig, G. User-guided 3D active contour segmentation of anatomical structures. Neuroimage 2006, 31, 1116–1128. [Google Scholar] [CrossRef] [PubMed]
  49. Fedorov, A.; Beichel, R.; Kalpathy-Cramer, J.; Finet, J.; Fillion-Robin, J.-C.; Pujol, S.; Bauer, C.; Jennings, D.; Fennessy, F.; Sonka, M.; et al. 3D Slicer as an image computing platform for the quantitative imaging network. Magn. Reson. Imaging 2012, 30, 1323–1341. [Google Scholar] [CrossRef] [PubMed]
  50. Van Griethuysen, J.J.M.; Fedorov, A.; Parmar, C.; Hosny, A.; Aucoin, N.; Narayan, V.; Beets-Tan, R.G.H.; Fillion-Robin, J.-C.; Pieper, S.; Aerts, H.J.W.L. Computational Radiomics System to Decode the Radiographic Phenotype. Cancer Res. 2017, 77, e104–e107. [Google Scholar] [CrossRef] [PubMed]
  51. Moummad, I.; Jaudet, C.; Lechervy, A.; Valable, S.; Raboutet, C.; Soilihi, Z.; Thariat, J.; Falzone, N.; Lacroix, J.; Batalla, A.; et al. The Impact of Resampling and Denoising Deep Learning Algorithms on Radiomics in Brain Metastases MRI. Cancers 2022, 14, 36. [Google Scholar] [CrossRef] [PubMed]
  52. Larue, A.C.; Defraene, G.; De Ruysscher, D.; Lambin, P.; van Elmpt, W. Quantitative radiomics studies for tissue characterization: A review of technology and methodological procedures. Br. J. Radiol. 2017, 90, 20160614. [Google Scholar] [CrossRef] [PubMed]
  53. Parmar, M.; Grossmann, P.; Bussink, J.; Lambin, P.; Aerts, H.J.E.L. Machine learning methods for quantitative radiomic biomarkers. Sci. Rep. 2015, 5, 13087. [Google Scholar] [CrossRef] [PubMed]
  54. Sheng, L.; Yang, C.; Chen, Y.; Song, B. Machine Learning Combined with Radiomics Facilitating the Personal Treatment of Malignant Liver Tumors. Biomedicines 2024, 12, 58. [Google Scholar] [CrossRef] [PubMed]
  55. Tibshirani, R. Regression Shrinkage and Selection via the Lasso. J. R. Stat. Soc. Ser. B 1996, 58, 267–288. [Google Scholar] [CrossRef]
  56. Nasrullah, N.; Sang, J.; Alam, M.S.; Mateen, M.; Cai, B.; Hu, H. Automated Lung Nodule Detection and Classification Using Deep Learning Combined with Multiple Strategies. Sensors 2019, 19, 3722. [Google Scholar] [CrossRef] [PubMed]
  57. van der Velden, B.H.M.; Kuijf, H.J.; Gilhuijs, K.G.A.; Viergever, M.A. Explainable artificial intelligence (XAI) in deep learning-based medical image analysis. Med. Image Anal. 2022, 79, 102470. [Google Scholar] [CrossRef] [PubMed]
  58. Liu, X.; Huang, D.; Yao, J.; Dong, J.; Song, L.; Wang, H.; Yao, C.; Chu, W. From Black Box to Glass Box: A Practical Review of Explainable Artificial Intelligence (XAI). AI 2025, 6, 285. [Google Scholar] [CrossRef]
Figure 1. Overall workflow of this study.
Livers 06 00066 g001
Figure 2. CT images of patient 3 from our internal dataset (https://p3d.in/WOG6P (accessed on 20 January 2026) and their corresponding ground-truth masks. Panels (a,c) show representative CT slices, whereas (b,d) present the corresponding 3D ground-truth segmentation masks, where tumors are shown in yellow, the gallbladder in green, the hepatic portal veins in blue, and the abdominal aorta in red.
Livers 06 00066 g002aLivers 06 00066 g002b
Figure 3. Examples of volume-of-interest (VOI) segmentation: (a) two liver segmentations, (b) two liver tumor segmentations, (c) two liver cyst segmentations, and (d) two VOI segmentations corresponding to a liver cyst and a liver tumor.
Livers 06 00066 g003
Figure 4. Top 20 radiomic features ranked according to their importance in the Lasso model, highlighting the relative contribution of each feature to the classification task.
Livers 06 00066 g004
Figure 5. Twenty highest-ranked features based on the calculated Mutual Information (MI) score.
Livers 06 00066 g005
Figure 6. Top 20 most important features and their respective contributions to the LightGBM model predictions.
Livers 06 00066 g006
Figure 7. Venn diagram showing the overlap among the top 20 radiomic features identified by the Lasso, Mutual Information, and LightGBM feature selection methods.
Livers 06 00066 g007
Figure 8. Comparison of classification performance across different feature selection strategies using the HGB classifier. Bars indicate the mean values of five metrics: Accuracy, Precision, Recall, F1-score, and ROC AUC, calculated over five cross-validation folds. Mutual Information- and intersection-based feature selection demonstrated the highest performance across all metrics.
Livers 06 00066 g008
Figure 9. Comparison of confusion matrices across different feature selection and classification strategies.
Livers 06 00066 g009
Figure 10. Performance evaluation of the Mutual Information-based model: (a) ROC curve, (b) lift curve, (c) cumulative gain curve, and (d) calibration curve.
Livers 06 00066 g010
Figure 11. SHAP summary plot showing the distribution of SHAP values for the most influential radiomic features. Each point represents an individual patient, while the horizontal axis indicates the SHAP value, reflecting the contribution of each feature to the model prediction.
Livers 06 00066 g011
Figure 12. Global feature importance ranking based on the mean absolute SHAP values. Features are ordered according to their average contribution to the predictive model across all observations.
Livers 06 00066 g012
Table 1. Applications, advantages, and disadvantages of different artificial intelligence models used in the field of liver diseases.
AI ModelApplicationsBenefitsDisadvantages
Convolutional Neural Networks (CNNs)Detection and classification of lesions on magnetic resonance imaging (MRI), quantification of hepatic fat and iron content, and histopathological image analysis for the assessment of steatosis and fibrosisCan automatically extract complex imaging features that may not be perceptible to the human eye, thereby improving diagnostic accuracy and reducing inter-observer variability among clinicians.Often considered “black-box” models, making their clinical interpretation challenging. In addition, they require substantial computational resources and large annotated datasets for training.
Supervised Machine Learning Models (Random Forest, Support Vector Machine)Applied to predict the risk of hepatocellular carcinoma (HCC) and to stratify the risk of hepatic decompensation in patients with cirrhosis.Perform well on routinely collected clinical data, offer relatively good interpretability, and generally require fewer computational resources than deep learning approaches.Their performance strongly depends on the quality, completeness, and representativeness of the training data. Furthermore, they may be less effective in capturing highly complex and nonlinear relationships.
Natural Language Processing (NLP) and Generative Artificial IntelligenceThese technologies enable the automated analysis of electronic health records (EHRs) for the early detection of liver-related complications and the generation of concise clinical summaries from extensive patient histories.Facilitates the rapid extraction of clinically relevant information from large volumes of unstructured text, supporting earlier identification of disease progression and complications.Risk of “hallucinations” (generation of factually incorrect medical information) and significant concerns regarding patient privacy, data security, and regulatory compliance.
Multimodal Models and Transformer ArchitecturesShow promise in personalized medicine, the prediction of responses to antiviral therapies, and optimization of donor–recipient matching in liver transplantation.By integrating multiple data modalities, they provide a comprehensive and holistic representation of the patient, enabling the identification of complex biomarker interactions.Remain difficult to implement in routine clinical practice due to their complexity. Moreover, many studies report limited external validation, raising concerns about the generalizability of models beyond the institutions in which they were developed.
Table 2. Classification performance (mean and standard deviation) of the HGB classifier across six feature selection strategies using 5-fold cross-validation.
Accuracy ± StdPrecision ± StdRecall ± StdF1-Score ± StdROC AUC ± Std
Lasso0.9520 ± 0.04060.9121 ± 0.05020.9160 ± 0.11010.9191 ± 0.06670.9536 ± 0.0335
Mutual Information0.9826 ± 0.02500.9966 ± 0.06440.9616 ± 0.07120.9684 ± 0.03530.9717 ± 0.0267
LightGBM0.9228 ± 0.02850.8292 ± 0.06210.9110 ± 0.06120.8681 ± 0.04270.9297 ± 0.0126
Intersection (Lasso ∩ MI ∩ LGBM)0.9816 ± 0.02910.9203 ± 0.24600.9611 ± 0.07320.9534 ± 0.03810.9410 ± 0.0235
All Features0.9034 ± 0.03060.8710 ± 0.06320.8210 ± 0.43600.8410 ± 0.05640.9199 ± 0.0421
Union (Lasso ∪ MI ∪ LGBM)0.9228 ± 0.03670.8592 ± 0.05670.9110 ± 0.10130.8881 ± 0.08610.9399 ± 0.0421
Table 3. Pairwise ROC AUC comparisons with corresponding DeLong’s test p-values.
LassoMutual InformationLightGBMIntersection (Lasso ∩ MI ∩ LGBM)All FeaturesUnion (Lasso ∪ MI ∪ LGBM)
Lasso1.00.0350.4420.0870.020.012
Mutual Information0.0351.00.0050.0410.0010.024
LightGBM0.4420.0051.00.0310.1090.06
Intersection (Lasso ∩ MI ∩ LGBM)0.0870.0410.0311.00.0090.033
All Features0.020.0010.1090.0091.00.089
Union (Lasso ∪ MI ∪ LGBM)0.0120.0240.060.0330.0891.0
Table 4. McNemar’s test p-values for classification agreement.
ModelLassoMILightGBMIntersectionAll FeaturesUnion
Lasso1.0000.0430.5010.1120.0360.017
Mutual Information0.0431.0000.0080.0550.0040.031
LightGBM0.5010.0081.0000.0420.1210.075
Intersection (Lasso ∩ MI ∩ LGBM)0.1120.0550.0421.0000.0120.045
All Features0.0360.0040.1210.0121.0000.097
Union (Lasso ∪ MI ∪ LGBM)0.0170.0310.0750.0450.0971.000
Table 5. Paired t-test p-values for classification metric comparisons across folds.
ModelLassoMILightGBMIntersectionAll FeaturesUnion
Lasso1.0000.0400.4700.0900.0230.015
Mutual Information0.0401.0000.0070.0480.0020.027
LightGBM0.4700.0071.0000.0360.1100.067
Intersection (Lasso ∩ MI ∩ LGBM)0.0900.0480.0361.0000.0110.038
All Features0.0230.0020.1100.0111.0000.091
Union (Lasso ∪ MI ∪ LGBM)0.0150.0270.0670.0380.0911.000
Disclaimer/Publisher’s Note: The statements, opinions and data contained in all publications are solely those of the individual author(s) and contributor(s) and not of MDPI and/or the editor(s). MDPI and/or the editor(s) disclaim responsibility for any injury to people or property resulting from any ideas, methods, instructions or products referred to in the content.