Article

A Metabolomics-Based Approach for Diagnosing NAFLD and Identifying Its Pre-Condition Along the Potential Disease Spectrum

1
Center for Preventive Medicine, St. Luke’s International University, Tokyo 104-0044, Japan
2
Center for Translational Research, The Institute of Medical Science Hospital, The University of Tokyo, Tokyo 108-8639, Japan
3
Life Science Research Center, Technology Research Laboratory, Shimadzu Corporation, Tokyo 101-8448, Japan
4
Faculty of Data Science, Kyoto Women’s University, Kyoto 605-8501, Japan
5
Center for Medical Sciences, St. Luke’s International University, Tokyo 104-0044, Japan
6
Graduate School of Public Health, St. Luke’s International University, Tokyo 104-0044, Japan
7
Graduate School of Public Health, Teikyo University, Tokyo 173-8605, Japan
*
Author to whom correspondence should be addressed.
These authors contributed equally to this work.
Livers 2025, 5(1), 12; https://doi.org/10.3390/livers5010012
Submission received: 11 December 2024 / Revised: 29 January 2025 / Accepted: 4 March 2025 / Published: 12 March 2025

Abstract

:
Introduction: The significant impact of nonalcoholic fatty liver disease (NAFLD) on public health, combined with the limitations of current diagnostic approaches, demands a more comprehensive and accurate method to identify NAFLD cases in large general populations. Methods: In this cross-sectional study, we recruited 3733 individuals (average age 51.8 years) who underwent health check-ups between October 2015 and October 2016. NAFLD was diagnosed using ultrasound; 114 serum metabolites were measured using gas chromatography–mass spectrometry. We adopted the least absolute shrinkage and selection operator (LASSO) method to build a metabolomic-based diagnostic model. Results: NAFLD was diagnosed in 826 participants. While each metabolite exhibited a limited diagnostic ability for NAFLD when used individually, compared with BMI, the model constructed using the LASSO demonstrated adequate diagnostic power (area under the curve [AUC] 0.866, 95% confidence interval 0.847–0.885 in test set) and even for lean (BMI < 23) populations (AUC for LASSO 0.828, for BMI 0.78). Moreover, the LASSO model-derived ‘pre-NAFLD’ condition showed a potential association with insulin resistance and elevated triglycerides. Conclusions: Our metabolomic-based approach provides a comprehensive evaluation of NAFLD or ‘pre-NAFLD’, both considered parts of a hypothetical ‘NAFLD spectrum’, independent of body type. Metabolomics could offer additional diagnostic benefits and potentially expand the disease concept.

1. Introduction

Over the last few decades, the prevalence of NAFLD has increased alongside the global rise in obesity. NAFLD is common not only in obese individuals but also frequently found in those of normal weight, known as lean NAFLD [1,2,3]. NAFLD may lead to nonalcoholic steatohepatitis (NASH) and a variety of other potentially serious diseases [4,5,6,7,8]. Besides its prevalence in obese populations, NAFLD is also common in lean individuals, with a similar risk of serious sequelae [9,10,11,12,13]. As a result, a method is needed to detect NAFLD cases in the general population [14]. Although diagnostic imaging modalities (e.g., ultrasound), liver biochemical tests, and liver biopsies are standard practices for diagnosing NAFLD/NASH, they have several limitations, which are widely acknowledged by the medical community [14,15,16,17]. These include inter-operator variability in ultrasound, low sensitivity for detecting hepatic steatosis in ultrasound and liver biochemical tests, and the invasive nature of procedures such as liver biopsies. Thus, a more broadly effective screening tool is necessary that can identify patients with NAFLD and their disease phenotype.
Metabolomics, an emerging research field in systems biology [18], can detect subtle metabolite alterations in organisms. This characteristic has the advantage of detecting the ‘effector phase’ of biological reactions that arise from the genome in living organisms [19]. Mass spectrometry (MS) measurement techniques, such as gas chromatography-MS (GC-MS), have become common, and high-throughput analyses allow for the comprehensive analysis of metabolites in biofluids from thousands of individuals [19]. Furthermore, with recent progress in data analysis, machine learning has been used to handle the very large, complex data sets generated using high-throughput analysis [20]. These advances have allowed the phenotyping of individuals, based on their metabolite levels [20,21], and research into the development of disease biomarkers is ongoing [22].
In this study, we investigated the potential of metabolomics to develop a comprehensive diagnostic model for NAFLD that could serve as a standard for clinical use.

2. Materials and Methods

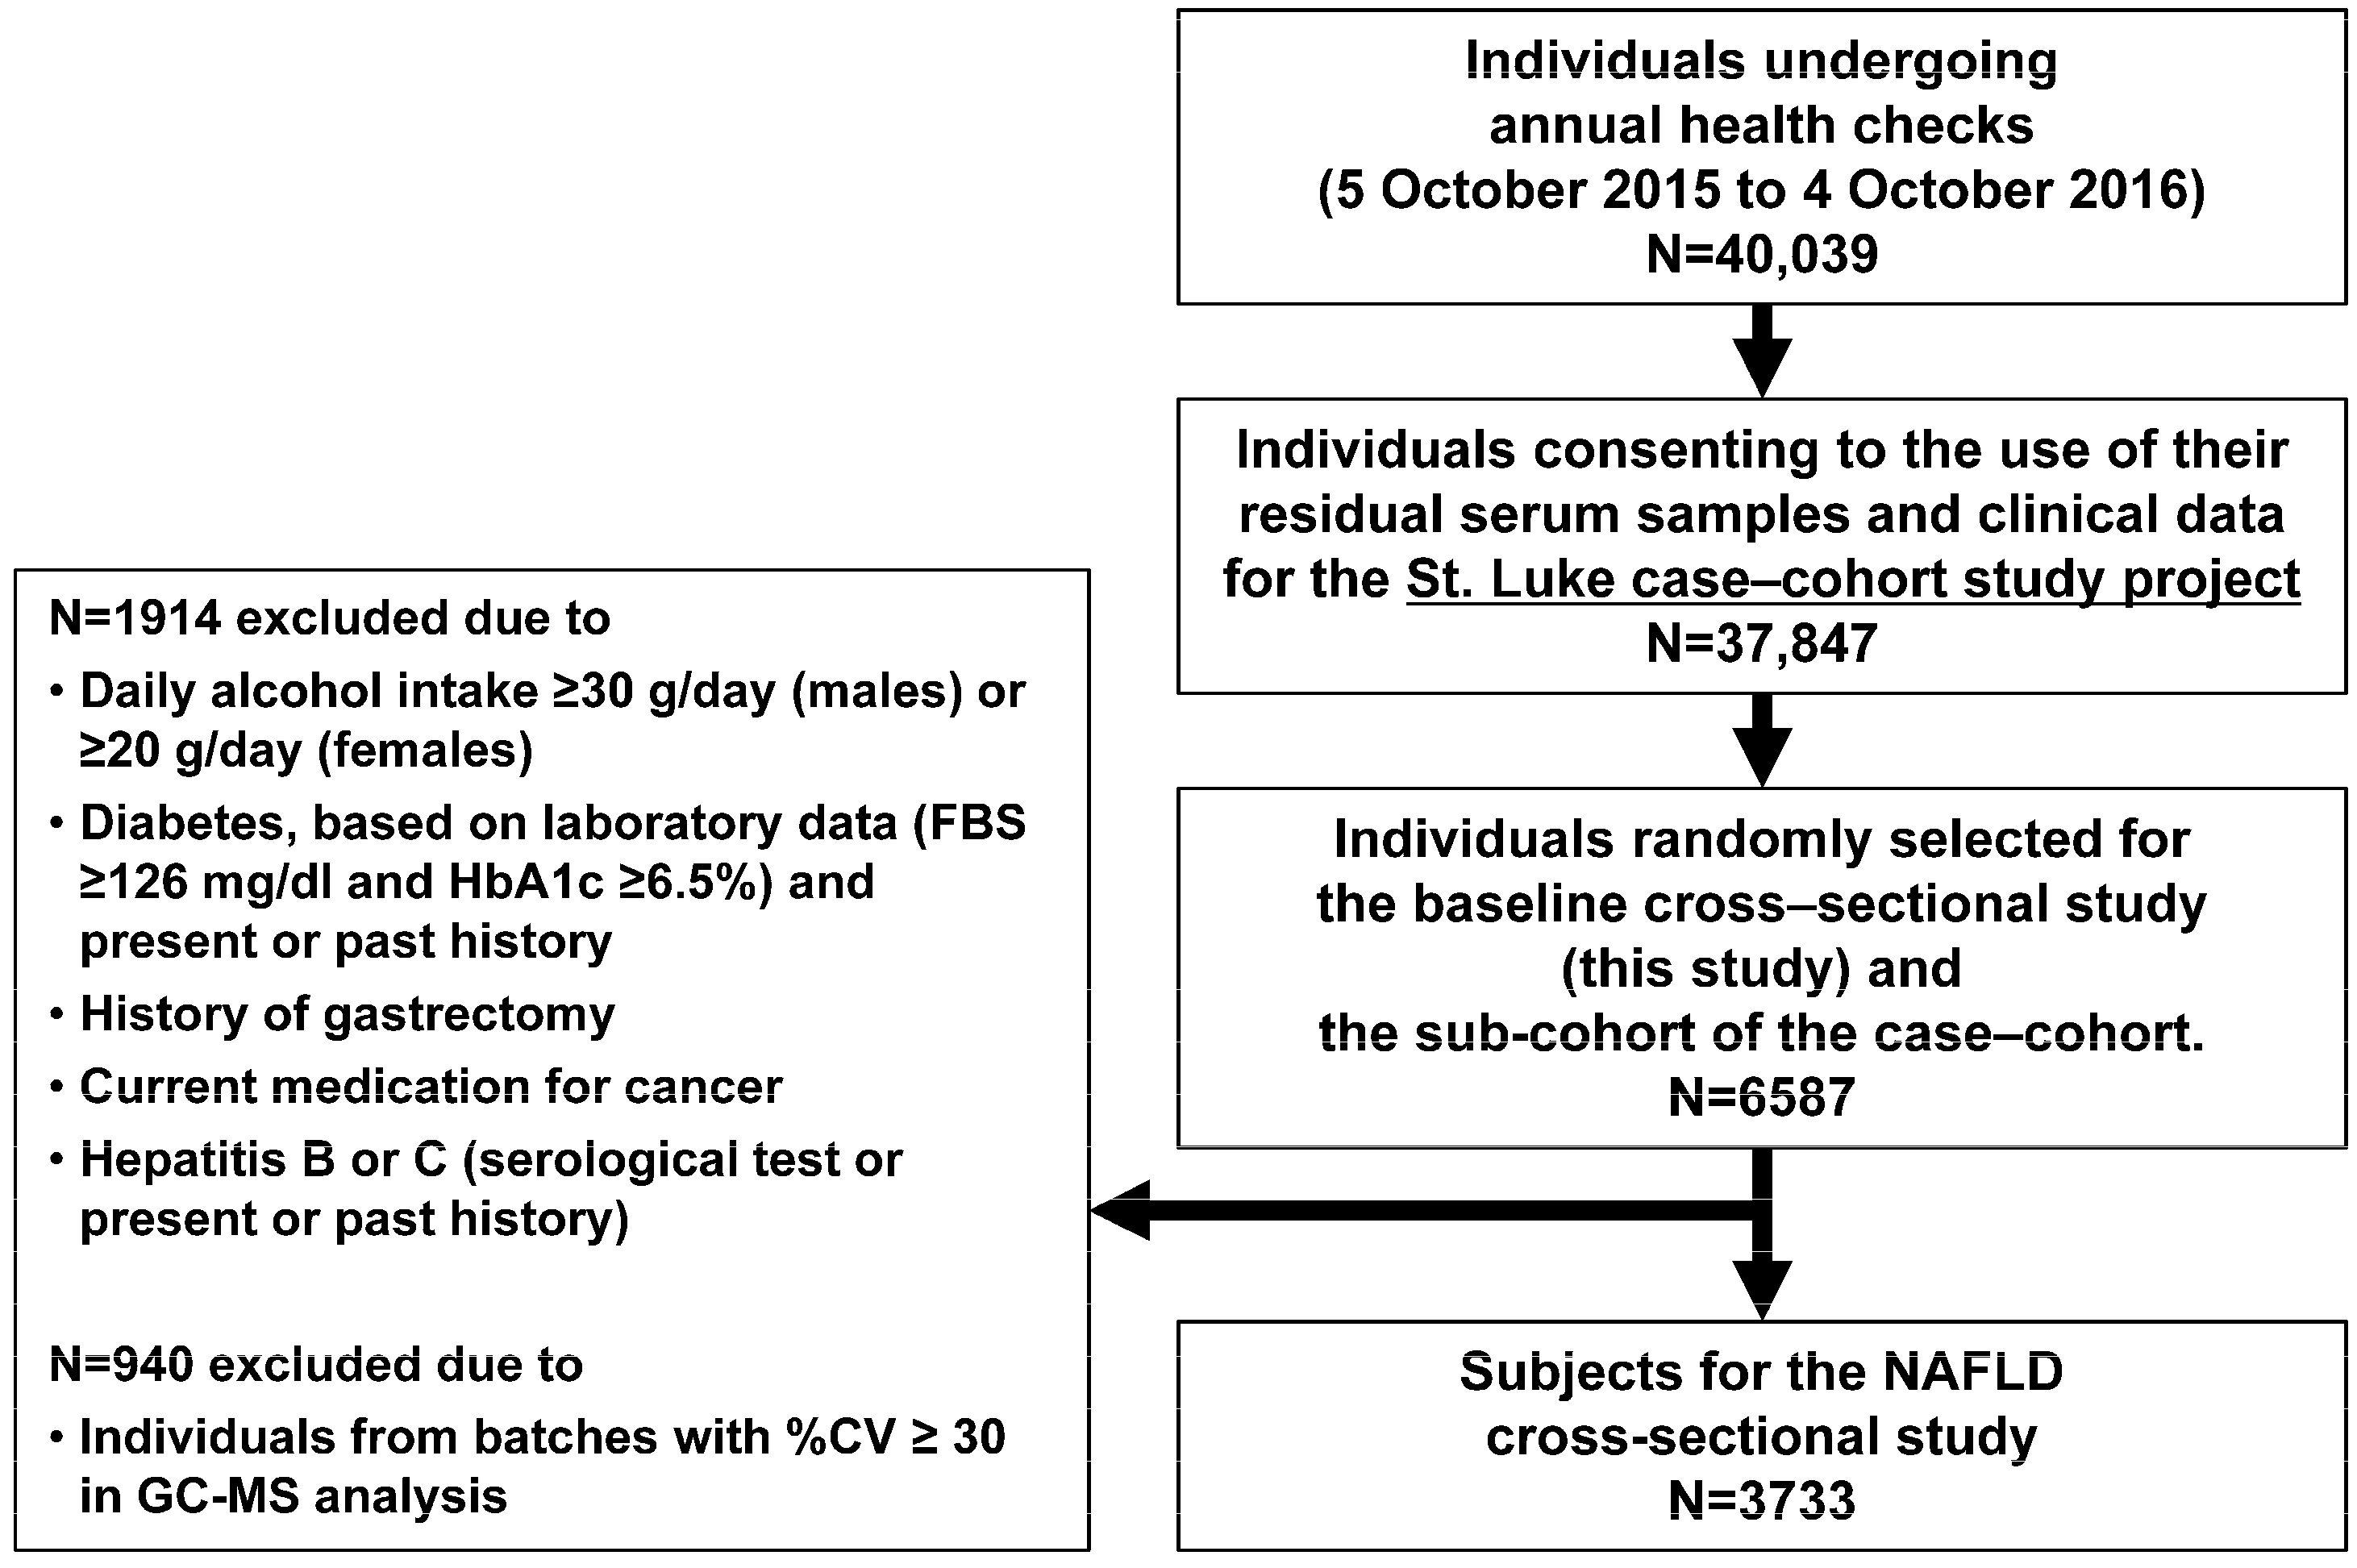
2.1. Study Design and Population

This cross-sectional study was conducted as a part of the St. Luke’s case–cohort study project, aimed at developing a prospective prediction model. In this study project, we recruited individuals who underwent annual health check-ups between 5 October 2015 and 4 October 2016 at the Center for Preventive Medicine, St. Luke’s International Hospital, Tokyo, Japan. In Japan, employers are required to conduct annual health screenings for all employees; thus, most participants (80%) were referred by employer-funded programs [23]. During the study period, 40,039 individuals underwent health checks; 37,847 consented to the use of their residual serum samples and clinical data for this research. We then randomly selected 6587 individuals from this population as subjects for both the baseline cross-sectional study and the sub-cohort of the further case–cohort study. We excluded individuals with missing data and those who reported daily alcohol intake, the presence of diabetes, and/or a present or past history of specific illnesses (Figure 1). The reason for excluding individuals who consume more than a certain amount of alcohol is that excessive alcohol intake is one of the diagnostic criteria for NAFLD. The purpose of excluding individuals with diabetes and other diseases is to exclude those who have developed fatty liver due to the effects of their conditions, thereby approximating a general healthy population more closely. Thus, samples from 3733 participants were included in the GC-MS analyses.
To determine the requisite number of participants for this study, we made the following assumption and determinations: If there are markers that predict a disease with a prevalence of 5% and do so with a sensitivity of 90% and a specificity of 70%, even at a strict level of α = 0.001, the power of detection would be 99% or higher if we collected 2000 cases. For markers that affect only a specific subgroup (assuming a statistical interaction) and if the frequency of the disease within the relevant subgroup is 10%, the power would be 70.8% or higher for 1000 cases and 99.5% or higher for 2000 cases (sensitivity, 90%; specificity, 70%; α = 0.05). For factors with lower predictive accuracy, e.g., a sensitivity of 55% and a specificity of 55%, there would be a corresponding odds ratio of approximately 1.5, a prevalence of 10%, and α = 0.05, and the power of each factor would be 74.4% with 2000 cases. If the number of participants is increased, the power for the preceding assumptions increases. To maximize the coverage of the sub-cohort in a case–cohort study, we set the largest sample size for which measurement was considered feasible. Further, we selected a larger number of participants than indicated by the sample size calculations to avoid any unexpected decreases in the number of included participants through the selection process. With the sample size and number of outcomes in this study, the detection of a difference in the means of one quarter of a standard deviation, with 85% power, was possible.

2.2. Data Collection and Fatty Liver Diagnosis

Heights, body weights, and blood pressure values were routinely measured. Laboratory tests provided levels of the following: fasting blood glucose, glycated hemoglobin (HbA1c; National Glycohemoglobin Standardization Program), low-density lipoprotein cholesterol (LDL-C), high-density lipoprotein cholesterol (HDL-C), aspartate aminotransferase, alanine aminotransferase (ALT), creatinine, total protein, and albumin. Participants also completed a self-administered questionnaire regarding lifestyle habits andmedical history, including daily alcohol intake (grams/week), present illness(es), and past medical history; a trained team of registered nurses verified the answers during face-to-face interviews.
Each participant also routinely underwent an abdominal ultrasound (Xario XG SSA-680A, Aplio400 TUS-A400, or Aplio500 TUS-A500 instrument [Canon Medical Systems, Tochigi, Japan]) examination, which is the standard method for NAFLD screening. The results were reviewed by board-certified (ultrasonography) radiologists and physicians to assess fatty liver indicators, without access to any other test results. The following four findings were considered characteristic of fatty liver [24]: bright liver, hepato-renal contrast, deep attenuation of ultrasound, and vascular burring. Participants were diagnosed with NAFLD if they demonstrated at least the first two findings [23,24]. Although the definition of obesity varies, including adjustments based on ethnicity [25], we considered participants with a body mass index (BMI) < 23 kg/m2 and NAFLD to have ’lean NAFLD’, in accordance with the definition adopted by Younes et al. [26]. Additionally, according to the WHO expert consultation, BMI of 23 kg/m2 was identified as potential public health action point for Asian population.

2.3. Sample Collection

Blood samples for routine laboratory tests were obtained after 12 h of fasting. Serum was prepared from the venous blood of participants using a serum separator tube (NP-SP0705-2, Nipro, Osaka, Japan). After standing for 15 min, each blood sample was centrifuged at 3500× g rpm for 5 min.
Residual serum samples were collected and stored after completion of the routine laboratory tests that were part of the annual health check-up. The blood sample tube stood at room temperature (average temperature, 23.5 °C) for 3–7 h until the serum was separated (visually noticeable hemolysis was rarely observed). Serum samples were separated using an automatic pipette (Biomek NXp Automated Workstation, Beckman Coulter, Brea, CA, USA) into a cryotube (SAFE® 2D Barcode tubes, LVL Technologies, Crailsheim, Germany). Serum (300 µL) was stored in a cryotube at −80 °C until used in the metabolomic analysis.

2.4. Metabolome Analysis

The following procedures are based on previously reported methods [27,28,29]: Excess serum samples were collected and stored after the routine laboratory investigations were completed. Serum metabolites were extracted using methanol/chloroform/water (2.5:1:1) containing 2-isopropylmalic acid (Merck, Tokyo, Japan) as an internal standard. Metabolites were derivatized with methoxyamine hydrochloride (Merck) followed by trimethylsilylation with N-methyl-N-trimethylsilyltrifluoroacetamide (GL Science, Tokyo, Japan). The derivatized metabolites were separated on a DB-5 column (Agilent, Santa Clara, CA, USA), and GC-MS measurements were performed in scan mode using a GCMS-TQ8040 instrument (Shimadzu, Kyoto, Japan). Detection of mass spectral peaks and waveform processing were performed using GCMSsolution software (Version 4.20; Shimadzu). Metabolite peaks were identified using spectral library matches and normalized using the peak area of 2-isopropylmalic acid as an internal standard (see Supplementary Methods).

2.5. Statistical Analysis

Since the study objective was exploratory, Welch’s t-test was applied regardless of normality of distribution. Categorical variables were compared using Fisher’s exact test. Continuous correlations were assessed using Pearson’s correlation coefficient. The diagnostic ability for the outcome was assessed using receiver operating characteristic (ROC) analysis with the area under the curve (AUC) calculation. Multivariate regression analysis was performed appropriately for adjustment of potential confounders or assessment of explanatory power of indicators. These statistical analyses were performed using SPSS 25 (IBM, Armonk, NY, USA). To develop a logistic regression-based diagnostic model, least absolute shrinkage and selection operator (LASSO) was applied using the ‘glmnet’ package (version 2.0-16) in R 3.3.4 (R Foundation for Statistical Computing, Vienna, Austria) [30,31]. After the development of the model in the training set, model validation was performed in the independent test set (1:1 ratio). The 10-fold cross-validation was implemented within the LASSO algorithm to identify an optimal number of metabolites in the model while avoiding overfitting. In the model-building step, missing metabolite measurements in the training set were complemented with the mean from the other participants. The minimum lambda value was selected to determine coefficients of the model. Logistic regression to adjust for potential confounders was performed for the evaluation of the independence of the metabolites or LASSO model on the diagnostic power of NAFLD. Linear regression model was constructed for the assessment of explanatory power of the LASSO score compared with BMI, using standardized coefficient and R-squared as coefficient of determination.
Metabolite Set Enrichment Analysis (MSEA) was performed using the web-based software ‘MetaboAnalyst 60’ (https://www.metaboanalyst.ca/MetaboAnalyst/home.xhtml accessed on 29 January 2025) [32]. Two-tailed p-values < 0.05 were considered statistically significant. Supplementary Methods provide more detailed information.

3. Results

Following the metabolic peak analyses, 114 metabolites from the 3733 participants were included in the statistical analysis (see Figure 1). The numbers of participants with and without NAFLD were 826 and 2907, respectively. The general demographic and clinical factors of the participants are listed in Supplementary Table S1. Factors associated with the metabolic syndrome (e.g., BMI, abdominal circumference, blood pressure, etc.) differed between individuals with and without NAFLD.

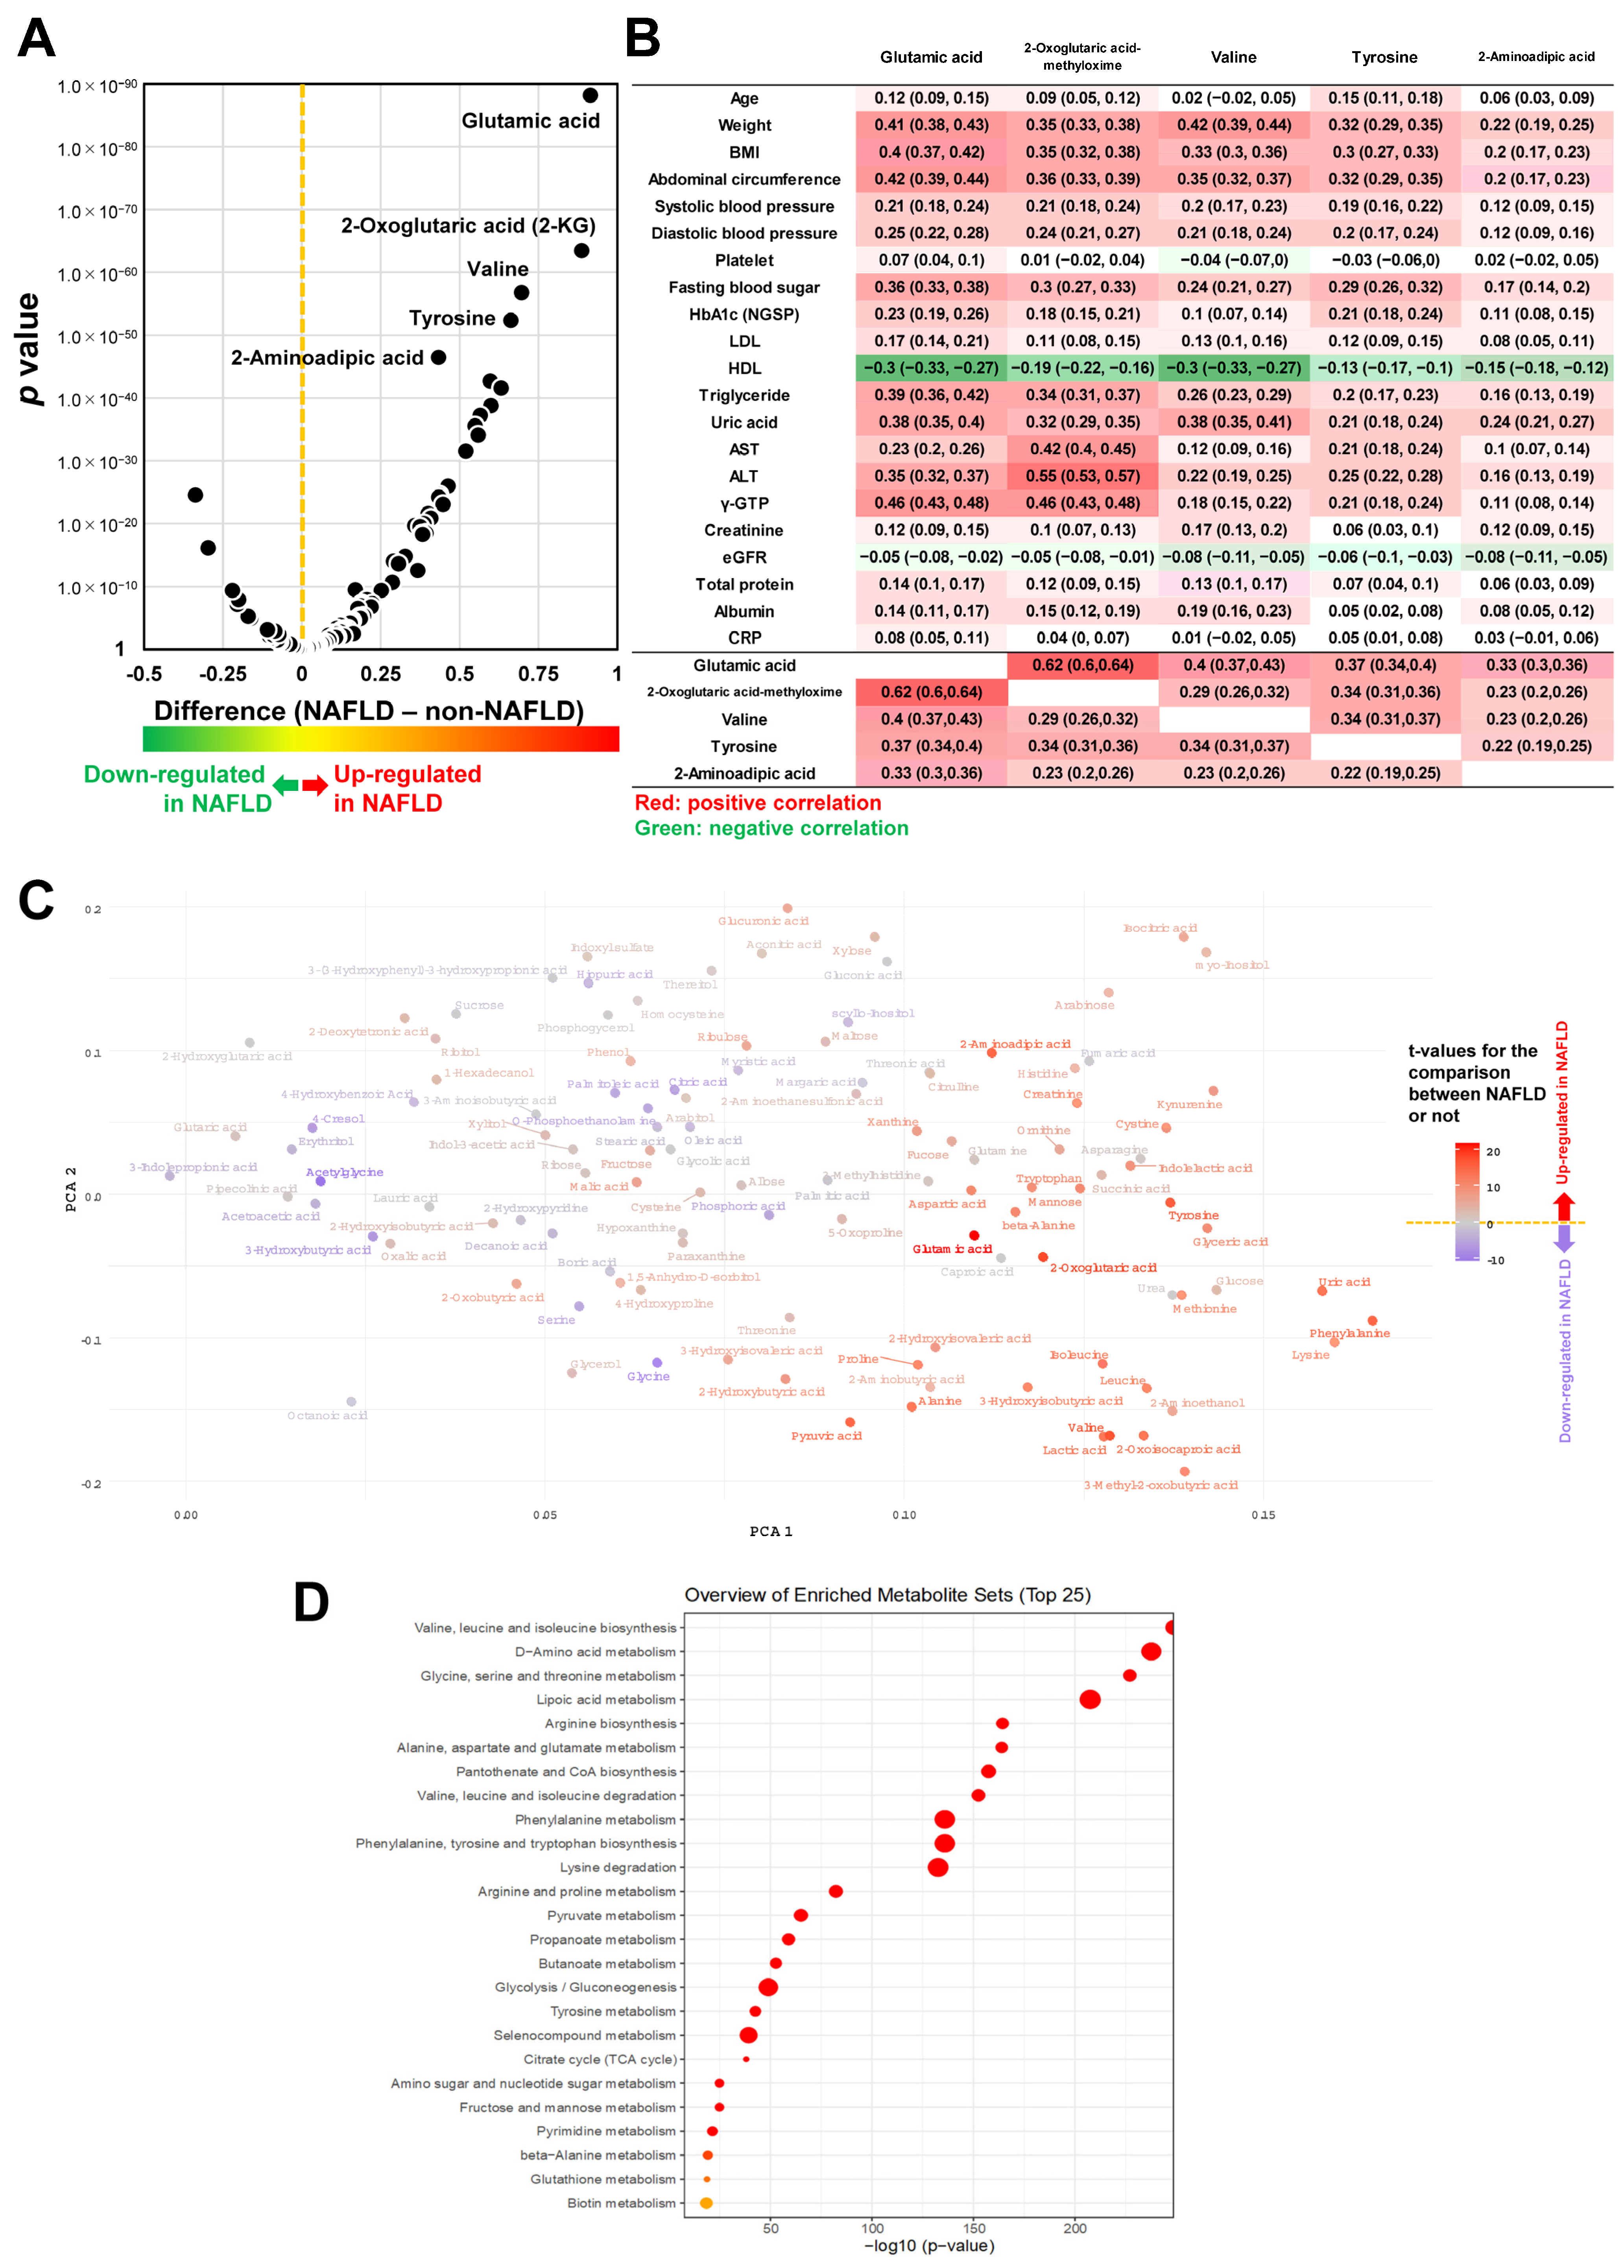
3.1. The Association Bewteen Metabolites and NAFLD

A volcano plot, highly skewed to the right, of the 114 measured metabolites is shown in Figure 2A. More than 70% of metabolites were upregulated in participants with NAFLD (83/115, 72.2%) and were significantly different between groups (81/115, 70.4%), suggesting a dynamic change in the metabolome of participants with NAFLD. The top 10 metabolites with the highest t-test-based upregulation in NAFLD are listed in Table 1. Based on both the mean difference and diagnostic ability (ROC analysis), glutamic acid was suggested to be the most strongly associated with NAFLD (AUC of approximately 0.75). Other metabolites were amino acids and metabolites involved in the tricarboxylic acid cycle. Even though the top 10 metabolites demonstrated highly significant differences, each used individually showed an AUC of 0.6–0.75, which is insufficient for clinical use.
Figure 2B demonstrates the correlation of the five metabolites exhibiting the highest upregulation in NAFLD with the general clinical parameters listed. These metabolites were commonly correlated with direct indicators of obesity (weight, BMI, and abdominal circumference; R = 0.3–0.4). Liver function markers, blood pressure, blood sugar, LDL-C, triglycerides, and uric acid were also intermediately correlated with the metabolites. The metabolites also showed mutual correlation (Figure 2B, lower panel). Figure 2C presents a plot of the first and second principal components (PC1 and PC2) and their loadings with various metabolites from a principal component analysis (PCA). The PC1 intermediately correlates with creatinine, uric acid, waist circumference, and fasting blood sugar (R = 0.2–0.3), suggesting that it reflects renal function and the degree of obesity. The PC2 is also associated with creatinine and low albumin, primarily reflecting renal function. Metabolites indicated by reddish dots (mean elevated in NAFLD) were clustered to highlight that similarities in the metabolite profiles among participants are closely linked with the metabolic variations in NAFLD.
Using a logistic regression model with adjustment for age, sex, and BMI as potential confounder, the odds ratios for the 10 most up- and downregulated metabolites slightly shifted to 1.0 (Supplementary Table S2), indicating weakened associations. This reduction may correspond to an indirect association with NAFLD through confounding by BMI. However, most of the metabolites were still associated with NAFLD, even after adjustment, indicating that these associations were independent of age, sex, and BMI.

3.2. MSEA

Highly significant enrichments of metabolites in NAFLD were observed in the pathways of ‘valine, leucine, and isoleucine biosynthesis’, ‘D-amino acid metabolism’, and ‘glycine, serine, and threonine metabolism’ (Figure 2D). These findings indicate that NAFLD involves systemic metabolic alterations, potentially impacting various biological processes associated with amino acid metabolism and energy regulation.

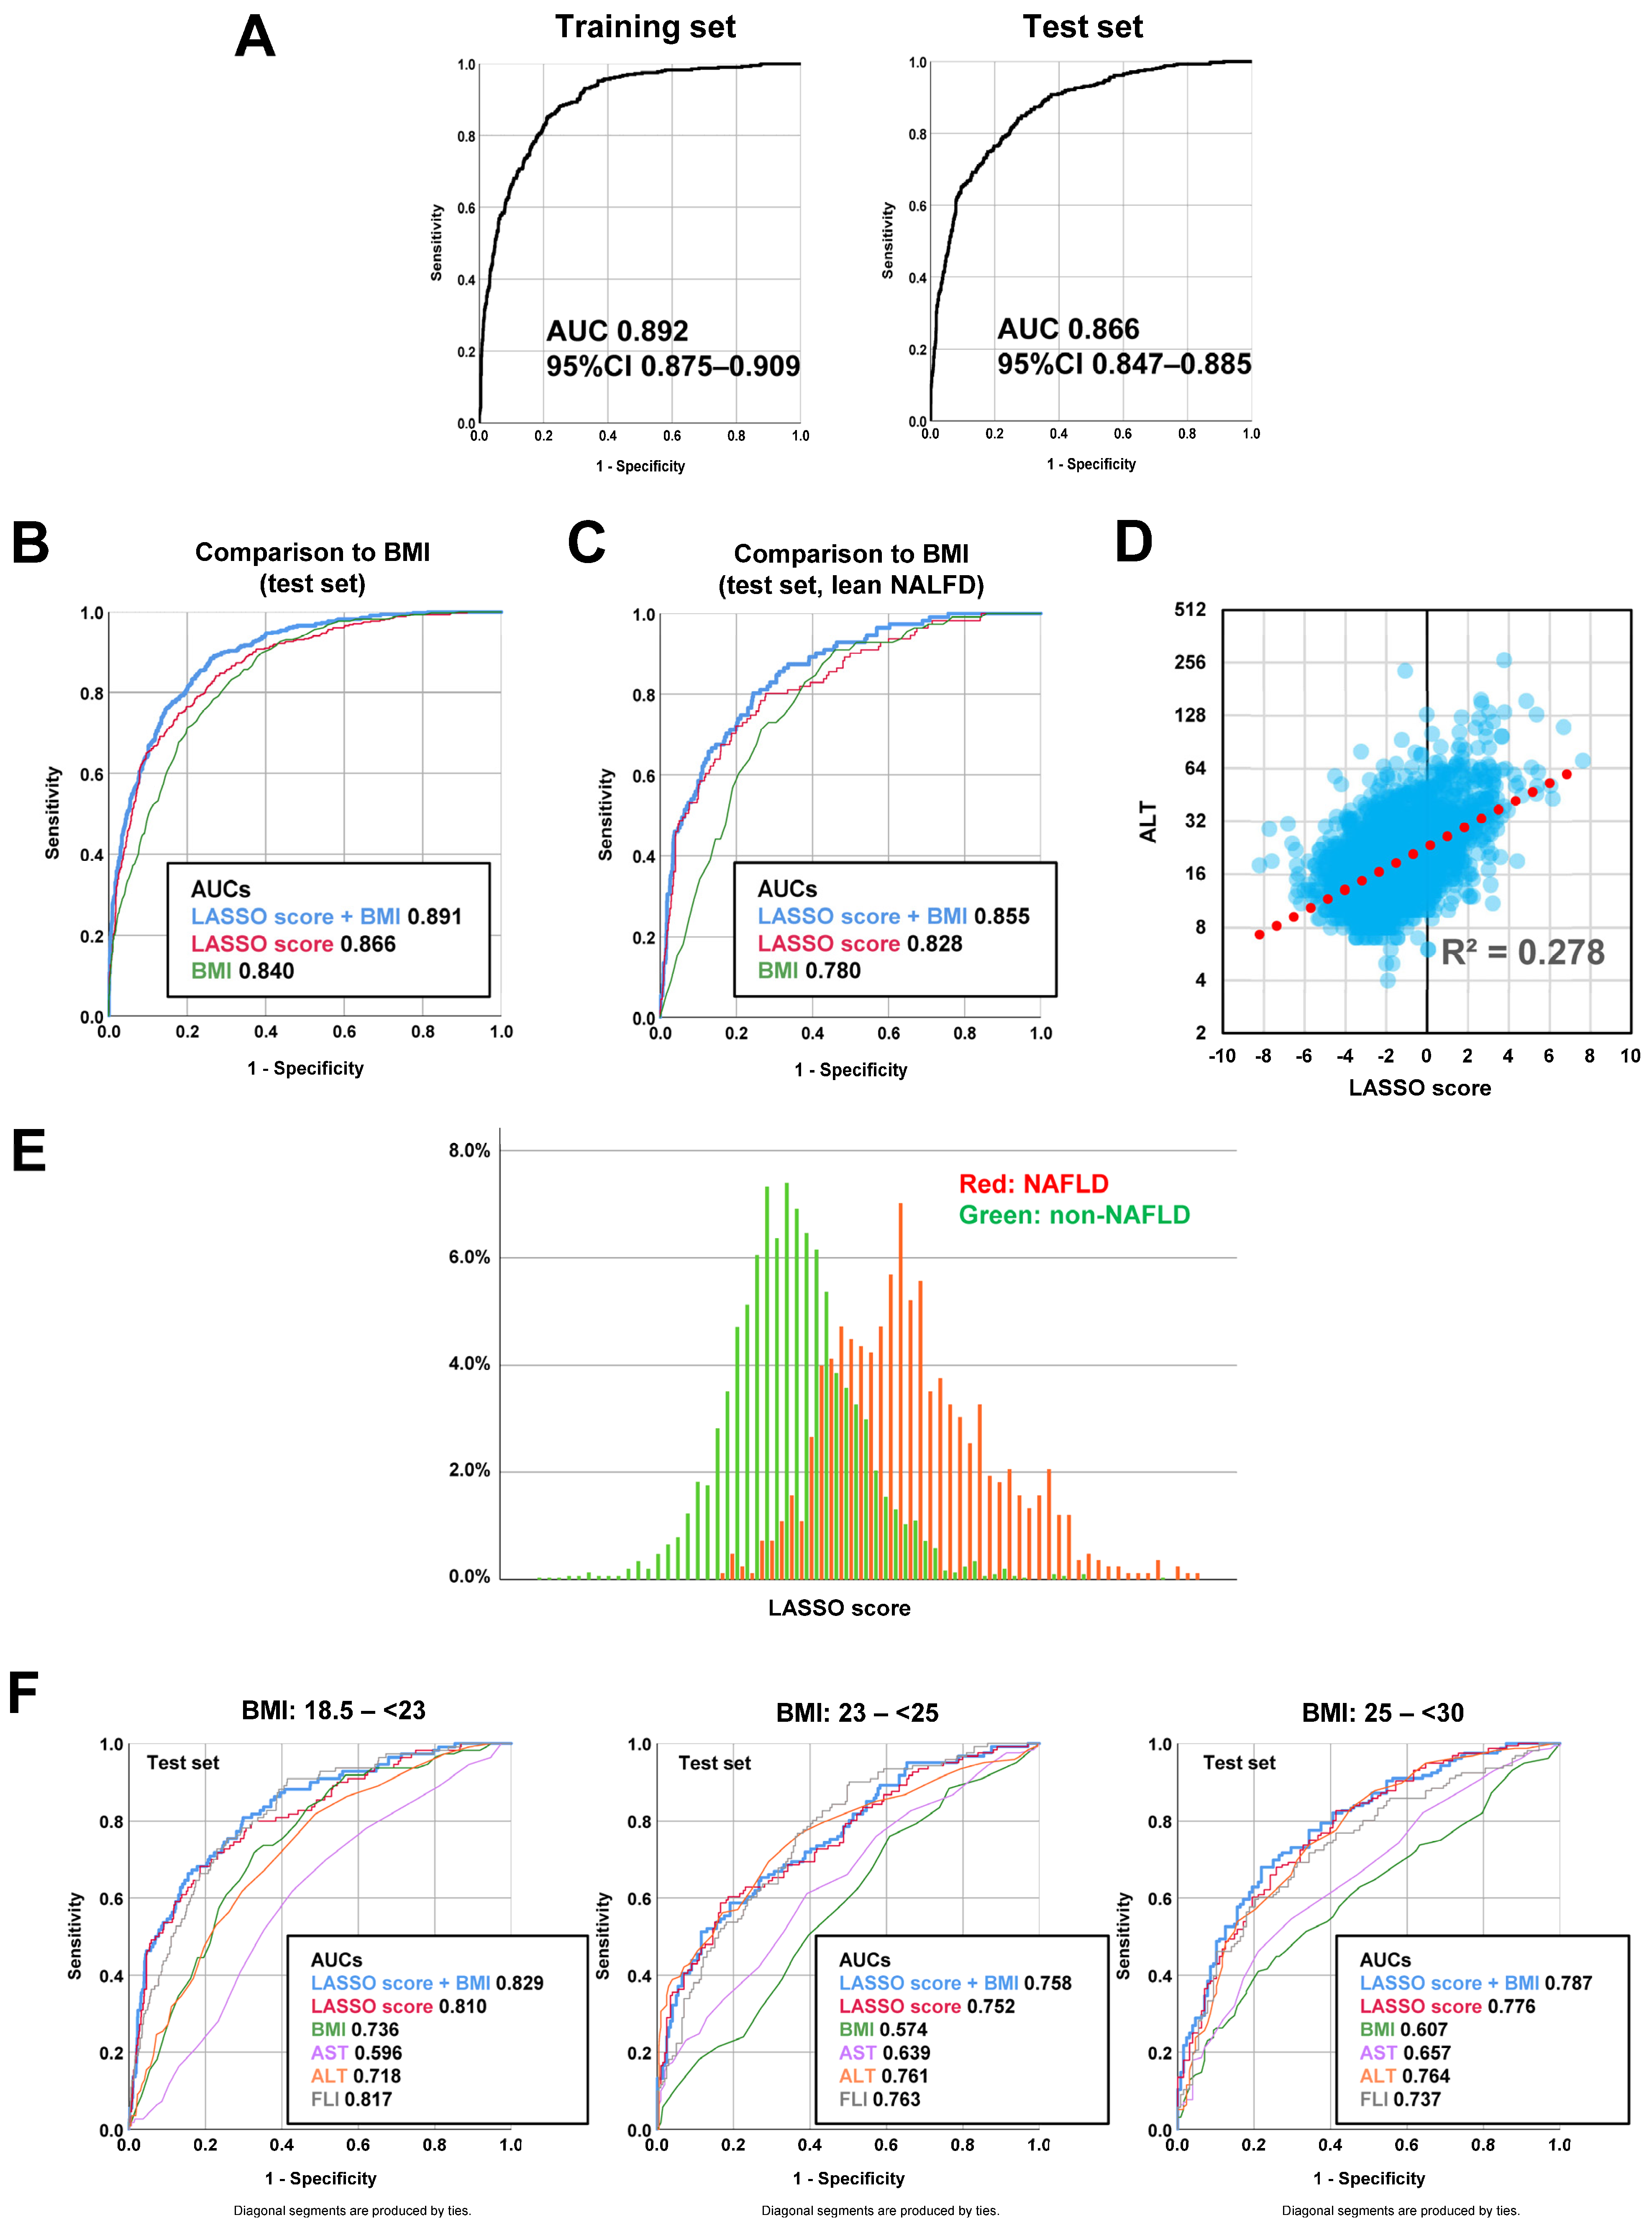
3.3. Diagnostic Model Development Using a Machine Learning Method

We then developed a diagnostic model using the LASSO in conjunction with the measured metabolite levels. The linear connections of selected metabolite levels multiplied by the coefficients were used as a diagnostic score (LASSO score). As a result, we obtained a model with 70 metabolites (Supplementary Table S3) in which the AUCs of the ROC analyses were 0.892 and 0.866 in the training and test sets, respectively (Figure 3A). An optimal cutoff (according to the left-upper corner) of the LASSO score for NAFLD diagnosis was −1.34, corresponding to a sensitivity of 79.3% and a specificity of 76.6% in the training set.
When we compared the diagnostic ability of the model with BMI, which was the most efficient maker with an AUC of 0.840 (Figure 3B), the LASSO (metabolites only) model was only slightly better (AUC = 0.866). Combining the LASSO score and BMI using logistic regression further improved diagnostic ability (AUC = 0.891 for the combination). In the model for the combination, we observed a good association of the LASSO score with NAFLD independent from BMI. This independent association suggested the diagnostic potential for NAFLD in the non-obese population. As shown in Figure 3C, the LASSO score and the combination (LASSO + BMI) remained well associated with NAFLD in the lean population determined by BMI < 23 (AUC = 0.828 and 0.855, respectively; BMI AUC = 0.780). This suggests the usefulness of a metabolomic-based approach for diagnosing NAFLD, regardless of BMI. A correlation analysis to assess the LASSO score performance as a liver function indicator demonstrated a high correlation with ALT (R = 0.528, Figure 3D), suggesting the quantitative association between the score and liver function. Figure 3E demonstrates the separation of participants using the LASSO model.

3.4. Predictive Advantage of LASSO Model Independent from BMI

In addition to the lean NAFLD assessment, we evaluated the diagnostic advantage of the LASSO model across more specific BMI categories (<18.5, 18.5–<22, 22–<25, 25–<30, 30≤). The lowest (BMI < 18.5) and highest (BMI ≥ 30) categories were excluded due to the small number of events and controls for some analyses. The LASSO score, both alone and combined with BMI (LASSO + BMI, Supplementary Table S4), showed a stronger association with NAFLD than either BMI or AST/ALT levels alone across BMI categories (Figure 3F). While the fatty liver index (FLI) also demonstrated good diagnostic ability in the lower and middle BMI category, it was a bit weaker in the higher BMI category. This result suggests that the LASSO score’s association with NAFLD is strongly independent of BMI again, while the association was more stable in the lower BMI category (18.5 ≤ BMI < 22) with a higher AUC over 0.8. A logistic model with the interaction term of the BMI category* the LASSO score demonstrates that the score was more associated with NAFLD in lower BMI categories; the correlation coefficient of interaction term was 0.80 (p = 0.019, 95% CI 0.66 to 0.96). Figure 3F further suggests that traditional liver function indicators (AST/ALT) are not sensitive to detecting lean NAFLD.

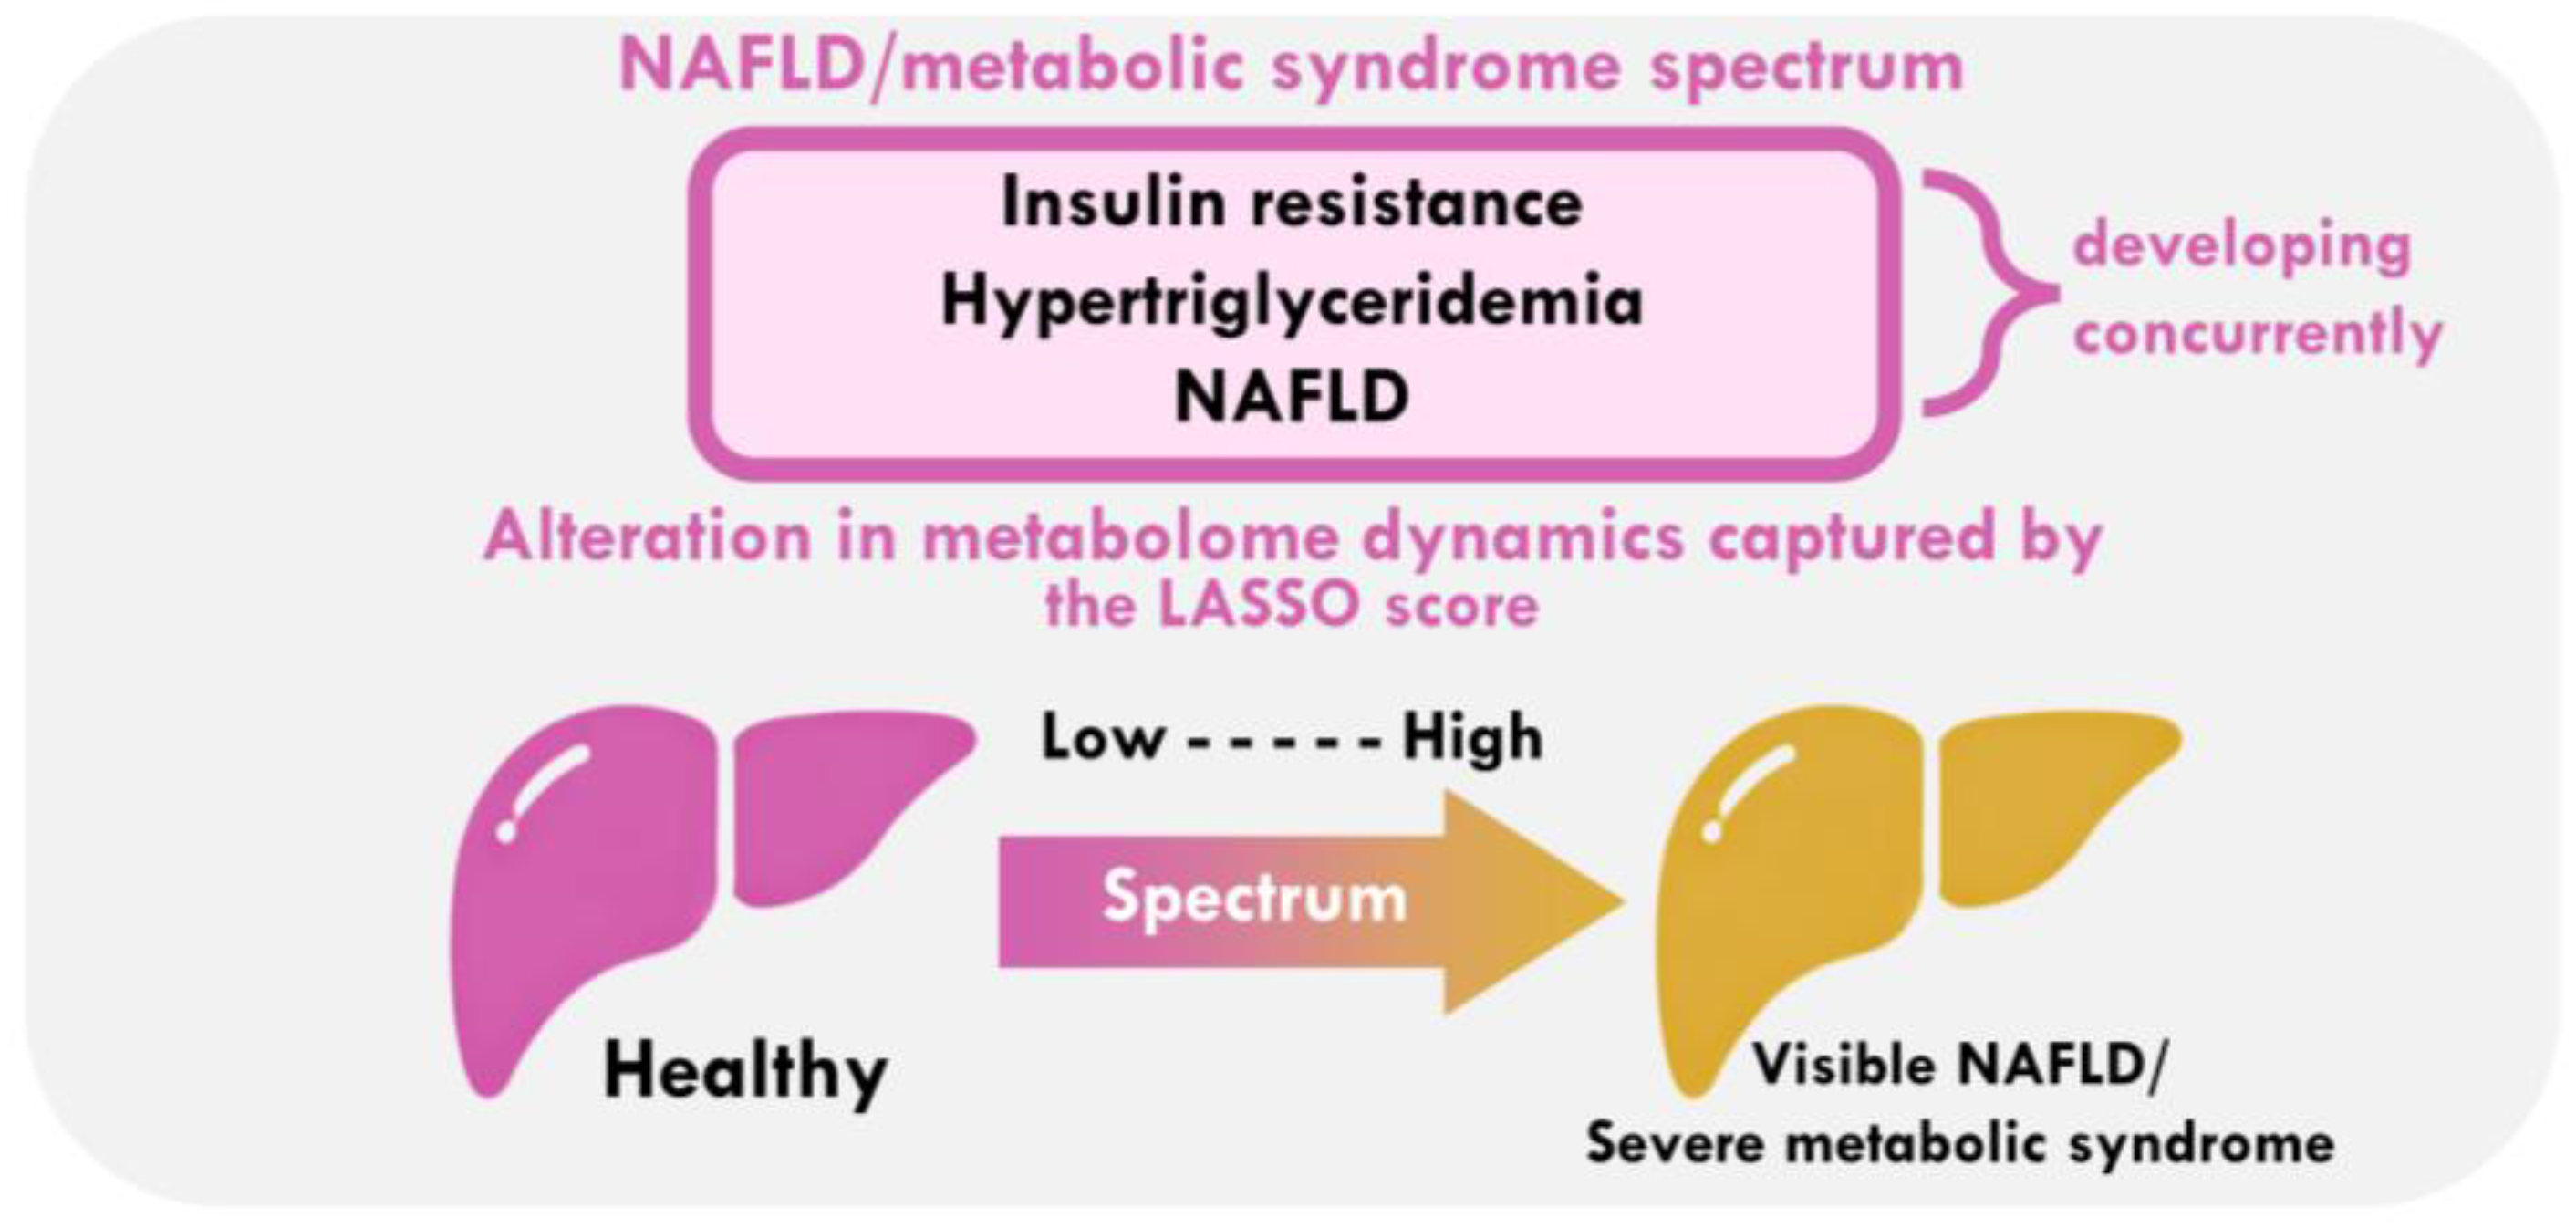
3.5. What Does the LASSO Score Reflect Clinically?

Next, we assessed the association between the LASSO score, NAFLD diagnosis, and common metabolic syndrome indicators. For further analysis, we established an ‘NAFLD Diagnostic Spectrum (NDS)’ category, as detailed in the legend of Figure 4A. Interestingly, metabolic indicators such as fasting blood sugar (FBS), HbA1c, and triglycerides were significantly higher in lean individuals with a LASSO score above the cutoff, even in the absence of an NAFLD diagnosis (see Figure 4A). These indicators were higher in this group than in the ‘healthy’ overweight population (BMI ≥ 25). This suggests that the LASSO score can detect a ‘pre-NAFLD’ or ‘invisible NAFLD (metabolic change cannot be captured by diagnostic imaging)’ condition, indicative of an emerging metabolic syndrome, regardless of BMI. We therefore determined non-NAFLD individuals with the LASSO score above cutoff as ‘pre-NAFLD’. It also implies that the development of insulin resistance and elevated triglycerides may precede overt liver dysfunction in lean or pre-NAFLD populations. The enhancement of explanatory power by NDS category in linear regression (Figure 4B), as indicated by the R-squared change rate from the BMI-only model, was remarkable for FBS (57.1%), HbA1c (91.9%), triglycerides (61.2%), and AST (65.6%). The standardized coefficients of the NDS category were higher compared to those of BMI, suggesting a strong association between the presence of NAFLD/pre-NAFLD conditions and these metabolic indicators. After dividing the NAFLD population based on the LASSO score cutoff into two groups—referred to as NAFLD-low and NAFLD-high—the NAFLD-low group exhibited better averages of FBS, triglycerides, and AST/ALT ratios compared to the pre-NAFLD population (Figure 4C). This finding suggests that the LASSO score, by which alterations in the metabolome were captured, can detect metabolic disruptions before the development of visible NAFLD (this concept is illustrated in Figure 5). Therefore, a comprehensive assessment of metabolites can serve as a reliable indicator of a pre-metabolic syndrome condition, offering insights into the metabolic profile of NAFLD as a phenotype of metabolic syndrome. In particular, glutamic acid, the most influencing component of the LASSO score, exhibited a significant difference of 1 standard deviation between the pre-NAFLD and healthy groups.

4. Discussion

In this study, we developed a diagnostic model for NAFLD based on LASSO-identified metabolites, which was useful regardless of BMI. In addition to diagnosis, we identified a potential ‘pre-NAFLD’ condition determined by exceeding the cutoff of the LASSO score.
Previous studies have focused on amino acid metabolism alterations in individuals with NAFLD and its related disorders, such as type 2 diabetes mellitus (T2DM) and obesity [33,34]. Despite inconsistencies across studies due to variations among the examined populations and their status (targeted diseases and stages), consistent associations with changes in circulating amino acids and their metabolites have been observed: (1) insulin resistance is associated with increased levels of branched chain amino acids (BCAAs: isoleucine, leucine, and valine) and aromatic amino acids (phenylalanine and tyrosine) [35,36], (2) oxidative stress is linked to elevated glutamate [35] and 2-aminoadipic acid [37], and (3) mitochondrial dysfunction, due to lipid accumulation in hepatocytes, is associated with increased 2-oxoglutaric acid and pyruvate [38,39]. These findings were also observed in our study. Corroborating the reported associations, we observed the association between LASSO scores and diabetes biomarkers (FBS and HbA1c). This suggests the possibility that insulin resistance may precede the onset of NAFLD (Figure 4A). Notably, ‘pre-NAFLD’ conditions could develop latently even without visible liver changes, driven by insulin resistance.
To cope with the increasing prevalence of NAFLD, effective screening is needed, particularly since the disease is a precursor to the more serious disease–NASH. Additionally, the rise in lean NAFLD has heightened concerns [13]. However, based on current recommendations, NAFLD screening is limited to high-risk populations (e.g., obese individuals or those with T2DM for fibrosis) [14,15]. Part of the reason for limiting screening to this population may be related to the resource-intensive nature of screening and an emerging concern to liver fibrosis. Although a recent study suggested that lean NAFLD leads to the same subsequent diseases associated with NAFLD in obese individuals [12], most scoring systems incorporate BMI; thus, the NAFLD risk was estimated depending on the BMI [40,41,42], resulting in an underestimation of NAFLD risk in lean individuals. In this context, our serum metabolite-based LASSO model offers a significant advantage. The LASSO scores provide the enhanced diagnostic benefit independent of BMI and demonstrated high diagnostic power even in lean populations. While metabolomic-based methods share some accessibility limitations of conventional laboratory tests [43], the potential to diagnose NAFLD and other non-communicable diseases with a single blood draw highlights the value of pursuing international discussions that could bring this technology closer to practical application. Moreover, it was suggested that the LASSO score could potentially identify ‘pre-NAFLD’ conditions within our hypothetical ‘NAFLD spectrum’ regardless of BMI. The metabolomic-based approach could provide a further additional benefit to conventional diagnostic methods, expanding the disease concept. Since this study did not directly examine whether individuals categorized as ‘pre-NAFLD’ are more susceptible to developing NAFLD, whether factors such as weight gain, aging, and changes in lifestyle have a stronger impact on the pre-NAFLD population should be verified in future prospective studies. Remarkably, the simple fatty liver index (FLI), which includes triglycerides, γ-GTP, BMI, and abdominal circumference, also demonstrated a good association with lean NAFLD (Figure 3F). It is apparent that the LASSO score demonstrates high diagnostic ability across all BMI categories, possibly due to its lower dependency on obesity-related indicators such as BMI, compared to the FLI.
This study has several strengths. The first is its larger sample size compared with other studies [34]. This enabled sufficient validation analysis and allowed the development of a robust diagnostic model. The second is the characteristics of the study participants. Unlike patient-based research studies, most of our participants were healthy; the checkups were part of mandatory, employer-sponsored health screenings. This may increase the applicability of the study results to the general population. This study also had some limitations. First, the study population comprised only one ethnic group and a single center. Therefore, our research requires validation in geographically heterogeneous populations. Second, ultrasound-based diagnoses of NAFLD may be less robust than histology-based diagnoses using liver biopsies. This may affect the accuracy of the research results, including the influence of liver fibrosis on amino acid metabolism. However, histological evaluations of liver biopsies are neither feasible nor ethical for large-scale research in the general population. Additionally, since our diagnostic model provides a level of precision for diagnosing NAFLD similar to that of ultrasound, it has merit for use in screening within the general population. Furthermore, more sensitive indicators of visceral fat obesity such as the waist-to-hip ratio and quantification of visceral fat were not assessed. These measures, potentially more relevant than BMI for metabolic syndrome and NAFLD onset, could serve as more appropriate stratification indicators and may also show a stronger correlation with the LASSO score. However, a BMI of 23 is still widely used as a useful benchmark for Asians and is therefore considered a reasonable standard [25,26].
In conclusion, the metabolomic-based NAFLD diagnostic model developed in this study may provide comprehensive NAFLD or ‘pre-NAFLD’ evaluation independent of body type. The availability of a more accurate, minimally invasive screen for NAFLD should also have the benefit of allowing lifestyle changes that will minimize the development of NASH and the other serious sequelae of NAFLD. It could offer a further additional diagnostic benefit and potentially expand the disease concept.

Supplementary Materials

The following supporting information can be downloaded at: https://www.mdpi.com/article/10.3390/livers5010012/s1. There are two supplementary files: Supplementary Methods and Supplementary Tables, which include the following: Supplementary Table S1. General Demographic and Clinical Characteristics of the participants. Supplementary Table S2. Univariate and Multivariate Logistic Analyses to Assess the Risk of NAFLD. Supplementary Table S3. Selected metabolites and coefficients of the LASSO model. Supplementary Table S4. Logistic regression analyses of the LASSO score with BMI.

Author Contributions

Conceptualization: T.K., M.N., H.F., K.U., T.-A.S. and K.M.; data curation: T.K., Y.A., H.F. and J.O.; formal analysis: M.N., K.H. and M.M.; funding acquisition: T.-A.S. and K.M.; investigation: M.K.-A., K.S., T.K., Y.A., H.F. and J.O.; methodology: M.N., K.H. and M.M.; project administration: T.K. and H.F.; resources: Y.A., H.F. and J.O.; software: M.N.; supervision: T.K., H.F., T.-A.S. and K.M.; validation: M.N., Y.A., H.F. and J.O.; visualization: T.K., M.N., Y.A. and H.F.; writing—original draft: T.K., M.N., Y.A. and H.F.; reviewing, editing, and approving the final draft: all authors participated in this process. All authors have read and agreed to the published version of the manuscript.

Funding

This study was supported by funds from a collaborative research contract between Shimadzu Corporation and St. Luke’s International University. The funding source was not involved in any research process or decision.

Institutional Review Board Statement

This study protocol conformed to the ethical guidelines of the 1975 Declaration of Helsinki and was approved by the Institutional Review Board of St. Luke’s International University (approval number: 15-R008). This study was approved by the institutional review board on 29 May 2015.

Informed Consent Statement

Informed consent was obtained by mailing explanatory documents (for further information, see Supplementary Method). This ensures that this study was conducted according to ethical principles that protect patients’ rights and well-being.

Data Availability Statement

To obtain the anonymized datasets and code, an application detailing the desired data needs to be submitted and approved by our designated departments, followed by the execution of a Data Transfer Agreement (DTA) that stipulates confidentiality and intellectual property rights.

Acknowledgments

We thank the staff at the Center for Preventive Medicine, St. Luke’s International University, for helping generate the data through their health check-ups. We also thank those at the Center for Information, St. Luke’s International University, for their work extracting data from the hospital electronic records system.

Conflicts of Interest

Y.A., H.F., and T.S. are employees of Shimadzu Corporation, Tokyo, Japan. The other authors declare no competing financial, professional, or personal interests.

References

  1. Estes, C.; Razavi, H.; Loomba, R.; Younossi, Z.; Sanyal, A.J. Modeling the epidemic of nonalcoholic fatty liver disease demonstrates an exponential increase in burden of disease. Hepatology 2018, 67, 123–133. [Google Scholar] [CrossRef] [PubMed]
  2. Estes, C.; Anstee, Q.M.; Arias-Loste, M.T.; Bantel, H.; Bellentani, S.; Caballeria, J.; Razavi, H.; Negro, F.; Nakajima, A.; Marchesini, G.; et al. Modeling NAFLD disease burden in China, France, Germany, Italy, Japan, Spain, United Kingdom, and United States for the period 2016–2030. J. Hepatol. 2018, 69, 896–904. [Google Scholar] [CrossRef] [PubMed]
  3. Younossi, Z.; Anstee, Q.M.; Marietti, M.; Hardy, T.; Henry, L.; Eslam, M.; George, J.; Bugianesi, E. Global burden of NAFLD and NASH: Trends, predictions, risk factors and prevention. Nat. Rev. Gastroenterol. Hepatol. 2018, 15, 11–20. [Google Scholar] [CrossRef] [PubMed]
  4. Mantovani, A.; Byrne, C.D.; Bonora, E.; Targher, G. Nonalcoholic fatty liver disease and risk of incident type 2 diabetes: A meta-analysis. Diabetes Care 2018, 41, 372–382. [Google Scholar] [CrossRef]
  5. Adams, L.A.; Anstee, Q.M.; Tilg, H.; Targer, G. Non-alcoholic fatty liver disease and its relationship with cardiovascular disease and other extrahepatic diseases. Gut 2017, 66, 1138–1153. [Google Scholar] [CrossRef]
  6. Byrne, C.D.; Targher, G. NAFLD as a driver of chronic kidney disease. J. Hepatol. 2020, 72, 785–801. [Google Scholar] [CrossRef]
  7. Targher, G.; Byrne, C.D. Non-alcoholic fatty liver disease: An emerging driving force in chronic kidney disease. Nat. Rev. Nephrol. 2017, 13, 297–310. [Google Scholar] [CrossRef]
  8. Kim, G.A.; Lee, H.C.; Choe, J.; Kim, M.J.; Chang, H.S.; Bae, I.Y. Association between non-alcoholic fatty liver disease and cancer incidence rate. J. Hepatol. 2017, 68, 140–146. [Google Scholar] [CrossRef]
  9. Wang, A.Y.; Dhaliwal, J.; Mouzaki, M. Lean non-alcoholic fatty liver disease. Clin. Nutr. 2019, 38, 975–981. [Google Scholar] [CrossRef]
  10. Albhaisi, S.; Chowdhury, A.; Sanyal, A.J. Non-alcoholic fatty liver disease in lean individuals. JHEP Rep. 2019, 1, 329–341. [Google Scholar] [CrossRef]
  11. Golabi, P.; Paik, J.; Fukui, N.; Locklear, C.T.; de Avilla, L.; Younossi, Z.M. Patients with lean nonalcoholic fatty liver disease are metabolically abnormal and have a higher risk for mortality. Clin. Diabetes 2019, 37, 65–72. [Google Scholar] [CrossRef] [PubMed]
  12. Younes, R.; Govaere, O.; Petta, S.; Miele, L.; Tiniakos, D.; Burt, A. Caucasian lean subjects with non-alcoholic fatty liver disease share long-term prognosis of non-lean: Time for reappraisal of BMI-driven approach? Gut 2022, 71, 382–390. [Google Scholar] [CrossRef] [PubMed]
  13. Ye, Q.; Zou, B.; Yeo, Y.H.; Li, J.; Huang, D.Q.; Wu, Y. Global prevalence, incidence, and outcomes of non-obese or lean non-alcoholic fatty liver disease: A systematic review and meta-analysis. Lancet Gastroenterol. Hepatol. 2020, 5, 739–752. [Google Scholar] [CrossRef] [PubMed]
  14. Rinella, M.E.; Neuschwander-Tetri, B.A.; Siddiqui, M.S.; Abdelmalek, M.F.; Caldwell, S.; Barb, D.; Kleiner, D.E.; Loomba, R. AASLD Practice Guidance on the clinical assessment and management of nonalcoholic fatty liver disease. Hepatology 2023, 77, 1797–1835. [Google Scholar] [CrossRef]
  15. European Association for the Study of the Liver (EASL), European Association for the Study of Diabetes (EASD), European Association for the Study of Obesity (EASO). EASL-EASD-EASO Clinical Practice Guidelines for the management of metabolic dysfunction-associated steatotic liver disease (MASLD). J. Hepatol. 2024, 81, 492–542. [Google Scholar] [CrossRef]
  16. Browning, J.D.; Szczepaniak, L.S.; Dobbins, R.; Nuremberg, P.; Horton, J.D.; Cohen, J.C. Prevalence of hepatic steatosis in an urban population in the United States: Impact of ethnicity. Hepatology 2004, 40, 1387–1395. [Google Scholar] [CrossRef]
  17. Williams, C.D.; Stengel, J.; Asike, M.I.; Torres DMShaw, J.; Contreras, M. Prevalence of nonalcoholic fatty liver disease and nonalcoholic steatohepatitis among a largely middle-aged population utilizing ultrasound and liver biopsy: A prospective study. Gastroenterology 2011, 140, 124–131. [Google Scholar] [CrossRef]
  18. Aretz, I.; Meierhofer, D. Advantages and pitfalls of mass spectrometry-based metabolome profiling in systems biology. Int. J. Mol. Sci. 2016, 17, 632. [Google Scholar] [CrossRef]
  19. Klassen, A.; Faccio, A.T.; Canuto, G.A.B.; Rocha da Cruz, P.L.; Ribeiro, H.C.; Tavares, M.F.M. Metabolomics: Definitions and significance in systems biology [internet]. Adv. Exp. Med. Biol. 2017, 965, 3–17. [Google Scholar]
  20. Lindon, J.C.; Nicholson, J.K.; Holmes, E. (Eds.) The Handbook of Metabolic Phenotyping; Elsevier: Amsterdam, The Netherlands, 2019; Available online: https://linkinghub.elsevier.com/retrieve/pii/C20160031650 (accessed on 22 November 2021).
  21. Wang, T.J.; Larson, M.G.; Vasan, R.S.; Cheng, S.; Rhee, E.P.; McCabe, E. Metabolite profiles and the risk of developing diabetes. Nat. Med. 2011, 17, 448–453. [Google Scholar] [CrossRef]
  22. Scalbert, A.; Ferrari, P. Biomarker discovery. In Metabolomics for Biomedical Research; Adamski, J., Ed.; Elsevier: Amsterdam, The Netherlands, 2020. [Google Scholar]
  23. Kimura, T.; Deshpande, G.A.; Urayama, K.Y.; Masuda, K.; Fukui, T.; Matsuyama, Y. Association of weight gain since age 20 with non-alcoholic fatty liver disease in normal weight individuals. J. Gastroenterol. Hepatol. 2015, 30, 909–917. [Google Scholar] [CrossRef] [PubMed]
  24. Dasarathy, S.; Dasarathy, J.; Khiyami, A.; Joseph, R.; Lopez, R.; McCullough, A.J. Validity of real time ultrasound in the diagnosis of hepatic steatosis: A prospective study. J. Hepatol. 2009, 51, 1061–1067. [Google Scholar] [CrossRef] [PubMed]
  25. WHO Expert Consultation. Appropriate body-mass index for Asian populations and its implications for policy and intervention strategies. Lancet 2004, 363, 157–163. [Google Scholar] [CrossRef] [PubMed]
  26. Younes, R.; Bugianesi, E. NASH in lean individuals. Semin. Liver Dis. 2019, 39, 86–95. [Google Scholar] [CrossRef]
  27. Nishiumi, S.; Shinohara, M.; Ikeda, A.; Yoshie, T.; Hatano, N.; Kakuyama, S. Serum metabolomics as a novel diagnostic approach for pancreatic cancer. Metabolomics 2010, 6, 518–528. [Google Scholar] [CrossRef]
  28. Brial, F.; Alzaid, F.; Sonomura, K.; Kamatani, Y.; Meneyrol, K.; Le Lay, A. The natural metabolite 4-cresol improves glucose homeostasis and enhances β-cell function. Cell Rep. 2020, 30, 2306–2320. [Google Scholar] [CrossRef]
  29. Dunn, W.B.; Broadhurst, D.; Begley, P.; Zelena, E.; Francis-McIntyre, S.; Anderson, N. Procedures for large-scale metabolic profiling of serum and plasma using gas chromatography and liquid chromatography coupled to mass spectrometry. Nat. Protoc. 2011, 6, 1060–1083. [Google Scholar] [CrossRef]
  30. Friedman, J.; Hastie, T.; Tibshirani, R. Regularization paths for generalized linear models via coordinate descent. J. Stat. Softw. 2010, 33, 1–22. [Google Scholar] [CrossRef]
  31. R Core Team. R: A Language and Environment for Statistical Computing, 2016. Available online: https://www.R-project.org (accessed on 3 March 2022).
  32. Pang, Z.; Lu, Y.; Zhou, G.; Hui, F.; Xu, L.; Viau, C.; Spigelman, A.F.; MacDonald PEWishart, D.S.; Li, S.; Xia, J. MetaboAnalyst 6.0: Towards a unified platform for metabolomics data processing, analysis and interpretation. Nucleic Acids Res. 2024, 52, W398–W406. [Google Scholar] [CrossRef]
  33. Masoodi, M.; Gastaldelli, A.; Hyötyläinen, T.; Arretxe, E.; Alonso, C.; Gaggini, M. Metabolomics and lipidomics in NAFLD: Biomarkers and non-invasive diagnostic tests. Nat. Rev. Gastroenterol. Hepatol. 2021, 18, 835–856. [Google Scholar] [CrossRef]
  34. Guerra, S.; Mocciaro, G.; Gastaldelli, A. Adipose tissue insulin resistance and lipidome alterations as the characterizing factors of non-alcoholic steatohepatitis. Eur. J. Clin. Invest. 2022, 52, e13695. [Google Scholar] [CrossRef] [PubMed]
  35. Gaggini, M.; Carli, F.; Rosso, C.; Buzzigoli, E.; Marietti, M.; Latta, V.D.; Ciociaro, D.; Abate, M.L.; Gastaldelli, A.; Bugianesi, E.; et al. Altered amino acid concentrations in NAFLD: Impact of obesity and insulin resistance. Hepatology 2018, 67, 145–158. [Google Scholar] [CrossRef] [PubMed]
  36. Newgard, C.B.; An, J.; Bain, J.R.; Muehlbauer, M.J.; Stevens, R.D.; Lien, L.F.; Haqq, A.M.; Shah, S.H.; Arlotto, M.; Slentz, C.A.; et al. A branched-chain amino acid-related metabolic signature that differentiates obese and lean humans and contributes to insulin resistance. Cell Metab. 2009, 9, 311–326. [Google Scholar] [CrossRef]
  37. Lee, H.J.; Jang, H.B.; Kim, W.H.; Park, K.J.; Kim, K.Y.; Park, S.I.; Lee, H.J. 2-Aminoadipic acid (2-AAA) as a potential biomarker for insulin resistance in childhood obesity. Sci. Rep. 2019, 9, 13610. [Google Scholar] [CrossRef] [PubMed]
  38. Rodríguez-Gallego, E.; Guirro, M.; Riera-Borrull, M.; Hernandez-Aguilera, A.; Marine-Casado, R.; Fernández-Arroyo, S.; Beltrán-Debón, R.; Sabench, F.; Hernández, M.; del Castillo, D.; et al. Mapping of the circulating metabolome reveals α-ketoglutarate as a predictor of morbid obesity-associated non-alcoholic fatty liver disease. Int. J. Obes. 2015, 39, 279–287. [Google Scholar] [CrossRef]
  39. Cabré, N.; Luciano-Mateo, F.; Baiges-Gayà, G.; Fernandez-Arroyo, S.; Rodriguez-Tomas, E.; Hernández-Aguilera, A.; París, M.; Sabench, F.; Del Castillo, D.; López-Miranda, J.; et al. Plasma metabolic alterations in patients with severe obesity and non-alcoholic steatohepatitis. Aliment. Pharmacol. Ther. 2020, 51, 374–387. [Google Scholar] [CrossRef]
  40. Lind, L.; Johansson, L.; Ahlström, H.; Eriksson, J.W.; Larsson, A.; Risérus, U.; Kullberg, J.; Oscarsson, J. Comparison of four non-alcoholic fatty liver disease detection scores in a Caucasian population. World J. Hepatol. 2020, 12, 149–159. [Google Scholar] [CrossRef]
  41. Hsu, C.L.; Wu, F.Z.; Lin, K.H.; Chen, Y.H.; Wu, P.C.; Chen, Y.H.; Chen, C.-S.; Wang, W.-H.; Mar, G.-Y.; Yu, H.-C. Role of fatty liver index and metabolic factors in the prediction of nonalcoholic fatty liver disease in a lean population receiving health checkup. Clin. Transl. Gastroenterol. 2019, 10, e00042. [Google Scholar] [CrossRef]
  42. Bedogni, G.; Bellentani, S.; Miglioli, L.; Masutti, F.; Passalacqua, M.; Castiglione, A.; Tiribelli, C. The Fatty Liver Index: A simple and accurate predictor of hepatic steatosis in the general population. BMC Gastroenterol. 2006, 6, 33. [Google Scholar] [CrossRef] [PubMed] [PubMed Central]
  43. Kirwan, J.A. Translating metabolomics into clinical practice. Nat. Rev. Bioeng. 2023, 1, 228–229. [Google Scholar] [CrossRef]
Figure 1. Schematic representation of the participant selection process. Refer to the “Data Processing” section of Supplementary Methods. CV, coefficient of variation; FBS, fasting blood sugar; GC-MS, gas chromatography mass spectrometry; and HbA1c, glycated hemoglobin.
Livers 05 00012 g001
Figure 2. NAFLD, common clinical factors and serum metabolites: (A) A volcano plot of 115 measured metabolites, based on Welch’s t-test. The horizontal axis depicts the difference in the log-transformed values of metabolite measurements between participants with and without NAFLD. The vertical axis shows the p values. Metabolites upregulated in the NAFLD group are located on the right. NAFLD, non-alcoholic fatty liver disease. (B) Correlation coefficients between common clinical factors and the top five metabolites that demonstrate a significant difference between NAFLD and non-NAFLD groups. Positive correlations are colored red, and negative correlations are green. These metabolites are commonly correlated with direct indicators of obesity (weight, BMI, and abdominal circumference; R = 0.3–0.4). Liver function markers are also intermediately correlated with the metabolites. In particular, the correlation of 2-oxoglutaric acid with liver function is relatively high compared with the others (approximate R = 0.5). Other factors associated with NAFLD, including blood pressure, blood sugar, LDL-C, triglycerides, and uric acid, are intermediately correlated with the metabolites. In contrast, HDL-C levels are inversely correlated with the metabolites. (C) A plot of the first and second principal components (PC1 and PC2) and their loadings with various metabolites from PCA. This allows for the representation of similarities in metabolite levels across participants. Metabolites, indicated by dots that are closer to red in the figure, are more elevated in NAFLD. (D) Metabolite set enrichment analysis (MSEA) for metabolites that are upregulated in NAFLD. MSEA, metabolite set enrichment analysis; NAFLD, non-alcoholic fatty liver disease; and PCA, principal component analysis.
Livers 05 00012 g002
Figure 3. Development and evaluation of a LASSO-based diagnostic model: (A) ROC curves of the LASSO diagnostic model including metabolites for training and test sets. (B) Comparison of the diagnostic model with models including BMI with/without metabolites. Red, metabolites (LASSO). Blue, metabolites + BMI. Green, BMI. (C) Ability to diagnose NAFLD in a lean population (BMI < 23). The performance of the LASSO model is examined in two ways (D,E). (D) Correlation between the score in the LASSO score and ALT as an indicator of liver function. (E) LASSO score distribution stratified by NAFLD or not. (F) ROC curves of LASSO diagnostic model with other indicators including metabolites for test sets stratified by BMI categories. Red, metabolites (LASSO). Blue, metabolites + BMI. Green, BMI. Purple, AST. Orange; ALT. Gray, FLI. AST, aspartate aminotransferase; ALT, alanine aminotransferase; BMI, body mass index; FLI, fatty liver index; LASSO, least absolute shrinkage and selection operator; and NAFLD, non-alcoholic fatty liver disease.
Livers 05 00012 g003
Figure 4. Clinico-biological implications of the LASSO scores and NAFLD-specific metabolome status: (A) Variation in metabolic indicators stratified by BMI categories and ‘NAFLD Diagnostic Spectrum (NDS)’ categories determined as follows: Blue, Non-NAFLD with the LASSO score < Cutoff (Healthy); Orange, Non-NAFLD with the LASSO score ≥ Cutoff (pre-NAFLD); and Red, NAFLD diagnosed by ultrasound. The light orange area is corresponding to the values more undesirablely than the average for the overweight category (BMI: 25.0–29.9) with healthy status. Diamond, average value (linked by line); error-bar, 1 standard deviation. (B) Variation in metabolic indicators stratified by ‘NAFLD Diagnostic Spectrum (NDS)’ with an additional category determined as follows: Blue, Non-NAFLD with the LASSO score < Cutoff (Healthy); Orange, Non-NAFLD with the LASSO score ≥ Cutoff (pre-NAFLD); Light Red, NAFLD with the LASSO score < Cutoff (NAFLD-low); and Deep red, NAFLD with the LASSO score < Cutoff (NAFLD-high). (C) Standardized coeffiecients and the enhancement of explanatory power. Linear regression analysis is performed to calculate standardized coefficients for the association of BMI and NDS categories with the metabolic indicators. The enhancement of explanatory power is indicated by the R-squared change rate from the BMI-only model. ALT, alanine aminotransferase; AST, aspartate aminotransferase; AUC, area under the curve; BMI, body mass index; CI, confidence interval; LASSO, least absolute shrinkage and selection operator; FBS, fasting blood sugar; NAFLD, non-alcoholic fatty liver disease; NDS, NAFLD diagnostic spectrum; ROC, receiver operating characteristics; and SBP, systolic blood pressure.
Livers 05 00012 g004
Figure 5. An illustration of the relationship between NAFLD/metabolic syndrome spectrum, the LASSO score, and metabolome dynamics.
Livers 05 00012 g005
Table 1. Univariate analysis using Welch’s t-test and ROC Analysis.
Metabolites Most Upregulated in Participants with NAFLDUnivariate Analysis (Welch’s t-Test)ROC Analysis
p ValueDifference
NAFLD-
non-NAFLD a
95% CIAUC95% CI
Glutamic acid6.4 × 10−890.9140.996–0.8330.7590.740–0.778
2-Oxoglutaric acid3.5 × 10−640.8870.982–0.7910.7290.709–0.750
Valine1.6 × 10−570.6960.777–0.6150.6990.678–0.719
Tyrosine4.4 × 10−530.6620.743–0.5820.6850.664–0.705
2-Aminoadipic acid3.3 × 10−470.4330.491–0.3760.7290.710–0.748
Phenylalanine2.1 × 10−430.5970.678–0.5160.6670.646–0.688
Pyruvic acid2.7 × 10−420.6320.719–0.5440.6710.649–0.692
Uric acid1.6 × 10−390.5990.685–0.5130.6660.645–0.687
2-Oxoisocaproic acid5.8 × 10−380.5650.648–0.4820.6590.638–0.680
Alanine2.6 × 10−360.5490.632–0.4660.6540.633–0.675
BMI5.0 × 10−1641.2641.199–1.3300.8530.840–0.867
AUC, area under the curve; BMI, body mass index; CI, confidence interval; NAFLD, non-alcoholic fatty liver disease; and ROC, receiver operating characteristic. a These values represent the difference observed between participants with NAFLD and those without, after z-transformation. All metabolite measurements are centered to the mean and divided by the SD.
Disclaimer/Publisher’s Note: The statements, opinions and data contained in all publications are solely those of the individual author(s) and contributor(s) and not of MDPI and/or the editor(s). MDPI and/or the editor(s) disclaim responsibility for any injury to people or property resulting from any ideas, methods, instructions or products referred to in the content.

