Abstract
FYB2 (also known as C1orf168 or ARAP) is an adaptor protein involved in T-cell receptor (TCR)-mediated T-cell activation and adhesion. However, the correlation of FYB2 with prognosis and cancer needs further investigation. In this study, we analyzed the expression levels of FYB2 in hepatocellular carcinoma (LIHC) tumor tissues and correlated it with the pathological stages, survival outcomes, and tumor grades. We found that the expression of FYB2 was significantly downregulated in LIHC. Low FYB2 level leading to weak survival outcomes is linked with advanced tumor grades and elevated pathological stages. Cox regression analysis showed that FYB2 and AJCC-M stages can be used as independent prognostic factors for LIHC. GSEA analysis revealed that FYB2 would be notably correlated with the cellular metabolism-related pathways and particularly involved in the regulation of cancer-related pathways. Single-cell transcriptome analysis revealed that FYB2-positive cells were mainly distributed in hepatocytes, and compared with other cells, the upregulated genes of these cells were mainly enriched in metabolism-related functions. The results of the spatial transcriptome revealed that the expression of FYB2 in the adjacent area was higher than in the tumor area. These results showed that FYB2 is likely to be a new prognostic biomarker in LIHC and would help provide individual treatment decisions for LIHC patients.
1. Introduction
Liver cancer is a type of malignant liver tumor. It can be categorized into primary and secondary types. Hepatocellular carcinoma (LIHC) is one of the main histologic subtypes of liver cancer with a high mortality rate [1,2,3,4,5,6]. The disease arises in the hepatocytes, which constitute the main liver and is the third major cause of cancer-related mortality. Epigenetic and genetic changes, aflatoxin exposure, diabetes, obesity, and smoking are the major risk factors for liver cancer [7,8]. To provide efficient initial treatment, such as local area ablation and early detection of liver cancer by monitoring methods, advance the survival rate of patients [9,10]. LIHC monitoring and diagnosis methods rely on some biomarkers, which can be objectively defined in body fluids. Most LIHC patients are generally diagnosed at advanced stages [11]; metastasis and recurrence are still the main challenges of LIHC treatment, which lead to a very poor prognosis. Therefore, it is urgent to determine new prognostic and diagnostic biomarkers for LIHC [12].
Although the function of the FYB2 gene has not been fully elucidated, it is known to encode a new type of T-cell adaptor protein. FYB2 is involved in T-cell receptor (TCR)-mediated T-cell activation and adhesion pathways. Previous research revealed that FYB2 may act as a key differentially expressed gene in breast cancer and might provide a novel target for drug discovery [13]. However, the correlation of FYB2 to prognosis and cancers awaits further investigation. Therefore, we conducted the study to check the prognosis function of FYB2 and its potential relationship with LIHC.
Here, we analyzed the expression of FYB2 in LIHC tumor tissues and associated it with survival outcomes, tumor grades, and pathological stages by different methods. The research results showed that FYB2 is likely to be a new prognostic biomarker in LIHC and would help provide a theoretical basis for the individual treatment decisions for LIHC patients and the future design of targeted therapeutic drugs.
2. Materials and Methods
To further explore the prognostic function of FYB2 and its potential relationship with LIHC, we performed bioinformatic analyses on publicly available datasets from the GEO, HRA, and TCGA database. Our bioinformatic analysis includes 50 normal and 374 tumor samples from the TCGA LIHC dataset, 52 normal and 115 tumor samples from the GEO GSE76427 dataset, 7 samples from the GSE112271 dataset, which is a 10x single cell transcriptome database containing 3 and 4 tumor samples from different regions of 2 different individuals, and 3 samples from HRA000437, which is a spatial transcriptome dataset. Based on the continuous progress of transcriptomic technology, we not only use traditional pan-oncogene analysis methods but also analyze through single-cell transcriptome and spatial transcriptome. We consider the study to be eligible for analysis based on the following criteria: (1) Studies of samples of hepatocellular carcinoma tissue. (2) Information on the technology and platform used for the study. (3) Studies with normal groups as control. Some of the applied methods are briefly described below.
2.1. GEPIA Analysis
The figures of “The gene expression profiles of all tumor samples and matched normal tissues” provided by GEPIA (http://gepia.cancer-pku.cn/index.html (accessed on 19 December 2020)) are not only used to display the distribution differences of FYB2 in different cancer types but also in normal and tumor tissues.
2.2. The Cancer Genome Atlas (TCGA)
Easy access to The Cancer Genome Atlas (TCGA) database allows for large-scale global gene expression profiling and database mining for potential correlations between genes and overall survival in a wide range of malignancies, including LIHC. It will also facilitate a better understanding of the impact of the genetic composition of tumors on clinical prognosis. In this paper, we used RNA-seq datasets in the TCGA database (50 normal samples and 374 tumor samples) to analyze the differences in FYB2 expression in normal and tumor tissues. Related datasets can be downloaded from https://portal.gdc.cancer.gov/projects/TCGA-LIHC (accessed on 19 December 2020).
2.3. Gene set Enrichment Analysis (GSEA)
We downloaded LIHC patient data from the NCBI-GEO database and analyzed them using GSEA V4.0.3 software. GSEA is applied to study the enrichment of the defined gene sets between the low-expression group and the high-expression group [14]. The samples are divided into a high group and a low group. The p value is calculated using 1000 permutations. The significant gene set was defined with p < 0.05. The data of LIHC patients are available for downloading at https://www.ncbi.nlm.nih.gov/gene/?term=FYB2 (accessed on 19 December 2020). The relevant raw data are integrated and placed at the end of the paper.
2.4. Statistical Analysis
The survival curve was drawn by using Kaplan–Meier chart. We further assessed the association between FYB2 levels and clinical features, where a Wilcoxon grade test was used between clinical variable groups, and three or more groups were tested using Kruskal–Wallis (K–W) method. The results generated in Oncomine will show the p value, multiple changes, and levels. Kaplan–Meier chart, PrognoScan, and GEPIA results are presented with log-rank test HR and P or Cox p values. Of which, GEPIA data are taken from the website http://gepia.cancer-pku.cn/index.html (accessed on 19 December 2020). The correlation of gene expression was assessed using spearman correlation and statistical significance, and the p value of <0.05 is defined as statistically significant.
2.5. Single-Cell Transcriptome Sequencing Analysis
GSE115469 is a 10× single-cell transcriptome dataset containing five healthy liver samples that clustered all cells in healthy livers into twenty cell populations with detailed cell annotation. We retrieved the matrix file and cell type annotation information from https://www.ncbi.nlm.nih.gov/geo/query/acc.cgi?acc=GSE115469 (accessed on 15 October 2022). We used Seurat (3.2.0) to do basic data processing and annotated cells using the author’s annotation information. By using clusterProfiler (3.14.3), we examined differentially expressed genes between these cells and other cells that had high FYB2 expression and conducted enrichment analysis on these differential genes. GSE112271 is a 10× single-cell transcriptome database that contains three and four tumor samples coming from different regions of two different individuals. The expression matrix of GSE112271 was retrieved from https://0-www-ncbi-nlm-nih-gov.brum.beds.ac.uk/geo/query/acc.cgi?acc=GSE112271 (accessed on 15 October 2022). By using the MNN approach, the datasets of seven samples were combined using bachelor (1.2.4). We performed cell type annotation based on each population’s differentially expressed genes. We also looked for cells that expressed FYB2 and compared them to other cells to see which genes were different. The results were then compared to those of healthy livers.
2.6. Spatial Transcriptome Analysis
HRA000437 is a spatial transcriptome dataset containing different locations of primary liver cancer. We downloaded datasets of the spatial transcriptome of liver cancer from https://ngdc.cncb.ac.cn/gsa-human/browse/HRA000437 (accessed on 15 October 2022). Seurat (3.2.0) was used to create objects, and the expression of FYB2 in each sample was examined.
3. Results
3.1. The mRNA Expression Level of FYB2 Is Downregulated in LIHC Tumor Tissues
At first, we used RNA-seq data in the TCGA LIHC dataset (50 normal samples and 374 tumors samples) and GEO GSE76427dataset (52 normal samples and 115 tumor samples) to analyze the difference in expression of FYB2 between normal and tumor tissues (Figure 1). Images showed the expression of FYB2 in normal tissues is significantly higher than that in tumor tissues. Next, we specifically compared FYB2 expression in 50 pairs of LIHC tumor tissues and adjacent normal tissues (Figure 2). By using the paired two-tailed t-test for the dataset, which gave p < 0.01, this paired plot supported the result of low expression of FYB2 in tumors.
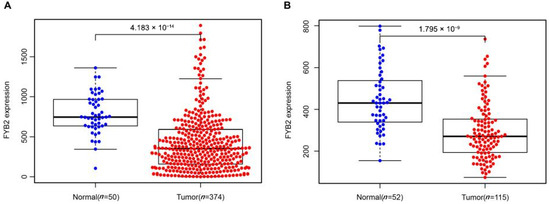
Figure 1.
FYB2 expression levels in normal tissues and LIHC tumor tissues. TCGA LIHC dataset (A) and GEO LIHC GSE76427 dataset (B) were used to analyze the difference in expression of FYB2 between normal and LIHC tumor tissues.
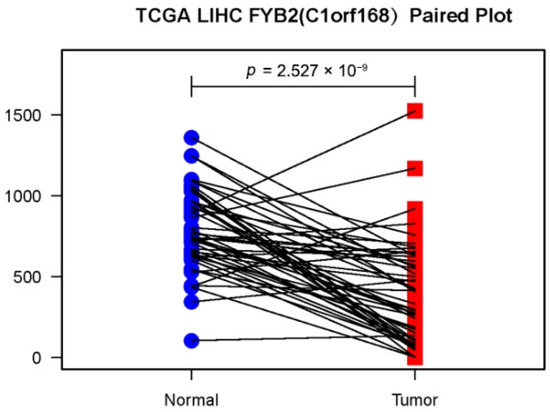
Figure 2.
Representation of paired data. Lines have been drawn between LIHC tumor tissues and tumor side tissues data points from the same case.
3.2. FYB2 Is Related to Survival Outcomes, Tumor Grades, and Pathological Stages
We further divided the patients, taking the median as the cutoff value, into two groups with low and high FYB2 levels. Survival prognosis for FYB2 was analyzed through batch survival analysis carried out with R. High expression of FYB2 is positively related to good survival outcomes, and the group with the low expression level of FYB2 has a significantly inferior prognosis compared with that of high expression (p = 0.0042) (Figure 3A). Furthermore, we examined the FYB2 expression in different cancer stages. We found that reduced expression of FYB2 was associated with the disease severity (p = 0.007) (Figure 3B). Significant differences were observed in AJCC-T stages (p = 0.005) (Figure 3D) and AJCC-M stages(p = 0.015) (Figure 3F), but significant differences were not observed in the associations of tumor grade (Figure 3C), AJCC-N stages (Figure 3E), gender (Figure 3G), and clinical variables of age (Figure 3H).
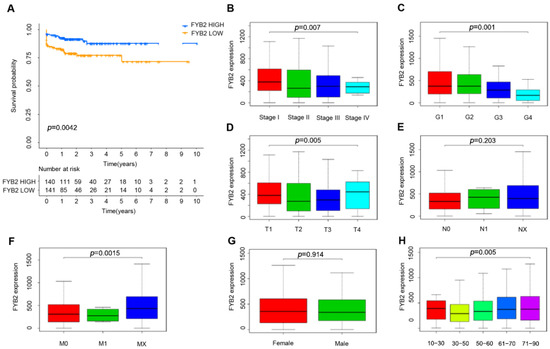
Figure 3.
FYB2 prognostic and relationships with clinical risk features. (A) Higher FYB2 levels were related to good survival outcomes. (B) ReducedFYB2 level was related to higher stages. (C) No significant differences in FYB2 level were detected with advanced tumor grades. (D) Significant differences in FYB2 level were detected with AJCC-T stages. (E) No significant differences in FYB2 level were observed with AJCC-N stages. (F) Significant differences in FYB2 level were detected with AJCC-M stages. (G,H) No significant differences in FYB2 level were observed with gender and clinical variables of age.
3.3. Analysis of the Correlation of FYB2 Expression with LIHC
We used Cox proportional hazard model to check the overall survival (OS) and verify if the FYB2 expression can be used as an independent predictor. We entered the factors, such as gender, age, stage, T, M, N, grade, and FYB2 (FYB2) expression, into the univariate Cox regression analysis (Table 1) to judge their influence on the OS of LIHC patients. The significant variable exhibited in univariate analysis was a further study by multivariate analysis. We also performed the forest map of Cox regression analysis (Figure 4) and used strata of tumor risk factors to evaluate the modification of the relationship between FYB2 expression and LIHC. We found that FYB2(C1orf168) and AJCC-M staging may have an impact on the OS of LIHC patients.

Table 1.
The univariate analysis and multivariate analysis of the correlation of LIHC with FYB2 expression.
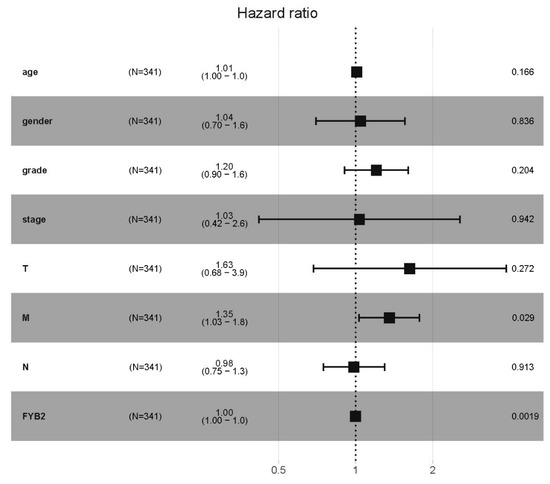
Figure 4.
The forest map of Cox regression analysis. Forest map describing 95% CI and hazard ratio (HR) of the correlation of FYB2 expression with LIHC. Strata were gender, age, stage, grade, T, M, N, and FYB2 (FYB2).
3.4. Gene Set Enrichment Analyses
We conducted gene set enrichment analysis (GSEA) to discover the signaling pathways related to high and low expression of FYB2 in LIHC (Figure 5). The results showed that genes involved in DNA replication, glyoxylate and dicarboxylate metabolism, hedgehog signaling pathway, Huntington’s disease, oxidative phosphorylation, Parkinson’s disease, and ribosome were enriched in the FYB2 low expression group. These results suggested that the downregulation of FYB2 was associated with a variety of cellular metabolism-related pathways as described above, as well as with diseases, and in particular with the regulation of cancer-related pathways.
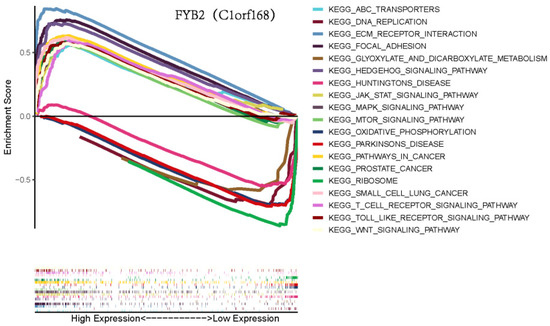
Figure 5.
Gene set enrichment analysis (GSEA) for FYB2.
3.5. Single-Cell Transcriptome Sequencing Revealed Differences in FYB2+ Cells between Healthy Liver and Liver Cancer
We combined the single-cell transcriptome sequencing datasets of healthy liver and liver cancer from the GEO database to further study the expression differences of FYB2 in healthy liver and liver cancer at the single-cell level, respectively (Figure 6a,b). We discovered that FYB2+ cells were mostly present in hepatocytes in the healthy liver (Figure 6b). The upregulated genes of FYB2+ cells were then analyzed using GO enrichment analysis. According to our findings, these upregulated genes were mostly discovered in functional pathways associated with metabolism, inflammatory response, and homeostasis (Figure 6c). However, we discovered that FYB2+ cells were present in malignancies in cell types other than hepatocytes (Figure 6e). We identified genes that were specifically highly expressed in FYB2+ cells in healthy liver and liver cancer, respectively, and later found that these genes were mainly different in healthy liver and liver cancer (Figure 6f).
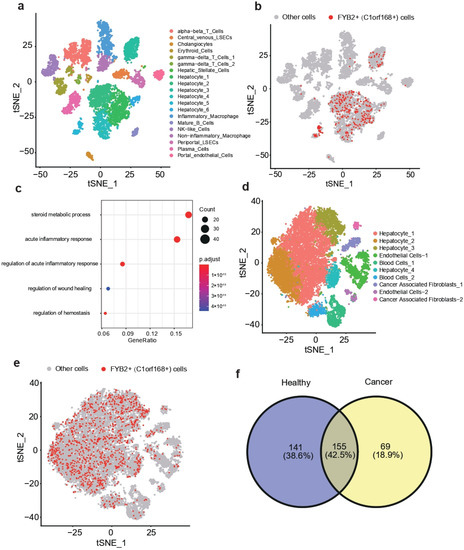
Figure 6.
t-SNE visualization of combined datasets from GSE115469 (a). t-SNE visualization of FYB2+ cells (b). Go enrichment analysis of upregulated genes of FYB2+ cells (c). t-SNE visualization of combined datasets from GSE112271 (d). t-SNE visualization of FYB2+ cells (e). Venn diagram showed the intersection of highly expressed genes of FYB2+ cells between healthy cancer and liver cancer (f).
3.6. Spatial Transcriptome Analysis Reveals Differences in FYB2 between Tumoral and Paracancerous Regions of the Liver
Spatial transcriptomics allows visualization and quantitative analysis of the transcriptome with spatial resolution in individual tissue sections. We used the spatial transcriptome datasets from the HRA database to investigate the distribution characteristics of FYB2 in tumor and non-tumor regions on a spatial basis. After evaluating three samples obtained from the area between the tumor and the adjacent tissue in the liver, in terms of visualization and quantitative analysis, we determined that FYB2 expression in the adjacent area was higher than that in the tumor area (Figure 7a–c).
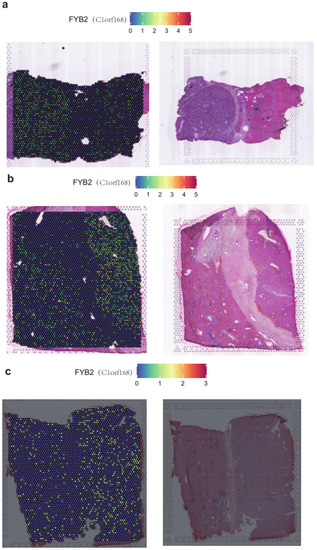
Figure 7.
SpatialFeaturePlot of FYB2 in the liver cancer sample1 (a). SpatialFeaturePlot of FYB2 in the liver cancer sample2 (b). SpatialFeaturePlot of FYB2 in the liver cancer sample3 (c).
4. Discussion
LIHC has a serious threat to human health around the world [15,16,17,18,19,20]. Even though immunotherapy and targeted molecular therapy have gotten great development, the OS of LIHC is still poor owing to the lack of exact early diagnosis and prognostic markers. Because of the tumor’s heterogeneity, the clinical parameters, for instance, TNM staging, cannot meet the accuracy and individual demands of prognosis prediction. The discovery of precise prognostic biomarkers and new therapeutic targets is still urgent.
In the current study, we found that FYB2 may be possible as a new prognostic biological marker in LIHC. FYB2 is an adaptor protein involved in T-cell receptor (TCR)-mediated T-cell activation and adhesion. Related studies have already suggested that FYB2 may be a key differentially expressed gene in breast cancer, which may provide a new target for future drug development.
By the use of GEPIA, we can observe that the differential distribution of FYB2 in LIHC versus normal tissues is significantly higher than that of FYB2 in other types of cancer versus normal tissues, such as Kidney Chromophobe (KICH) and Cholangiocarcinoma (CHOL). However, the role of FYB2 in tumor progression is poorly understood. We checked the expression levels of FYB2 in the TCGA LIHC dataset and GEO GSE76427 dataset and found that FYB2 expression was significantly downregulated in LIHC. The low FYB2 levels gave poor survival outcomes and were linked with upper tumor grades and advanced pathological stages. Cox regression analysis showed that FYB2 and AJCC-M stages can be used as independent prognostic factors for LIHC. GSEA analysis revealed that FYB2 would be notably correlated with the genetic materials metabolism and particularly involved in the regulation of cancer-related pathways. These results showed that C1RF168 is likely to be a new prognostic biomarker in LIHC and would help provide a theoretical basis for the future design of targeted therapeutic drugs.
Overall, our study supposed a genomic prognostic model for OS in LIHC cases. FYB2and AJCC-M stages can be used as independent prognostic factors for LIHC. Therefore, it will contribute to the prognosis and subsequent monitoring of LIHC patients with lower cost of molecular diagnosis, for example, whole-genome sequencing. Clarifying the mechanism of FYB2 in tumorigenesis and development will increase our understanding of cancers such as LIHC, which is of great scientific and theoretical significance.
In addition, we further explored the expression of FYB2 at the single-cell level through single-cell transcriptome and spatial transcriptome. We found that both in healthy liver and liver cancer, FYB2+ cells were mainly distributed in hepatocytes, which indicated that FYB2 was closely related to the function of hepatocytes. Spatial transcriptome analysis can further compare the gene expression characteristics of FYB2 in tumor and paracancerous regions from the spatial perspective, which can reflect that the expression of FYB2 in paracancerous regions is significantly higher than that in tumor regions.
Nevertheless, our research still has a few limits. Firstly, the data in our research are mainly from GEO and TCGA databases. It is necessary to further validate the prognostic value and expression levels of FYB2 in an independent and large clinical cohort. Secondly, the potential biological mechanism of FYB2 in LITC needs to be further elucidated through functional studies. Thirdly, the combination of various prognostic genes would be more promising and valuable. The prognostic predictive models derived from multi-gene combinations have been established and verified in a range of cancers [21,22,23,24,25,26]. We should introduce multiple-gene prognostic prediction models in our further LITC research.
In summary, we found that FYB2 might be a potential biomarker of LITC. FYB2 would be notably correlated with the genetic materials metabolism and particularly involved in the regulation of cancer-related pathways. Our study supposed a genomic prognostic model for OS in LIHC cases, which may help provide theoretical basis for the individual treatment decisions for LIHC patients and the future design of targeted therapeutic drugs.
Author Contributions
Conceptualization, Y.Q.; validation, X.S.; formal analysis, Y.Q., X.S.; resources, X.Y.; writing—original draft preparation, Y.Q., X.S.; writing—review and editing, Y.Q., X.S.; visualization, Y.Q., X.S.; supervision, B.L. All authors have read and agreed to the published version of the manuscript.
Funding
This research received no external funding.
Informed Consent Statement
Informed consent was obtained from all subjects involved in the study.
Data Availability Statement
- The gene expression profiles of all tumor samples and matched normal tissues provided by GEPIA (http://gepia.cancer-pku.cn/index.html (accessed on 19 December 2020).
- RNA-seq datasets in the TCGA database (50 normal samples and 374 tumor samples) can be downloaded from https://portal.gdc.cancer.gov/projects/TCGA-LIHC (accessed on 19 December 2020).
- The data of LIHC patients are available for downloading at https://www.ncbi.nlm.nih.gov/gene/?term=FYB2 (accessed on 19 December 2020).
- The matrix file and cell type annotation information can be downloaded from https://www.ncbi.nlm.nih.gov/geo/query/acc.cgi?acc=GSE115469 (accessed on 15 October 2022).
- The expression matrix of GSE112271 was retrieved from https://0-www-ncbi-nlm-nih-gov.brum.beds.ac.uk/geo/query/acc.cgi?acc=GSE112271 (accessed on 15 October 2022).
- Datasets of the spatial transcriptome of liver cancer are downloaded from https://ngdc.cncb.ac.cn/gsa-human/browse/HRA000437 (accessed on 15 October 2022).
Acknowledgments
We acknowledge that Yifan Qu and Xiaozhong Shen contributed equally to this work.
Conflicts of Interest
The authors declare no conflict of interest.
References
- Global Burden of Disease Liver Cancer Collaboration; Akinyemiju, T.; Abera, S.; Ahmed, M.; Alam, N.; Alemayohu, M.A.; Allen, C.; Al-Raddadi, R.; Alvis-Guzman, N.; Amoako, Y.; et al. The Burden of Primary Liver Cancer and Underlying Etiologies From 1990 to 2015 at the Global, Regional, and National Level: Results From the Global Burden of Disease Study 2015. JAMA Oncol. 2017, 3, 1683–1691. [Google Scholar] [PubMed]
- Soerjomataram, I.; Lortet-Tieulent, J.; Parkin, D.M.; Ferlay, J.; Mathers, C.; Forman, D.; Bray, F. Global burden of cancer in 2008: A systematic analysis of disability-adjusted life-years in 12 world regions. Lancet 2012, 380, 1840–1850. [Google Scholar] [CrossRef]
- Ferlay, J.; Colombet, M.; Soerjomataram, I.; Mathers, C.; Parkin, D.M.; Piñeros, M.; Znaor, A.; Bray, F. Estimating the global cancer incidence and mortality in 2018: GLOBOCAN sources and methods. Int. J. Cancer 2019, 144, 1941–1953. [Google Scholar] [CrossRef] [PubMed]
- Fang, F.; Wang, X.; Song, T. Five-CpG-based prognostic signature for predicting survival in hepatocellular carcinoma patients. Cancer Biol. Med. 2018, 15, 425–433. [Google Scholar] [CrossRef] [PubMed]
- Hao, K.; Luk, J.M.; Lee, N.P.Y.; Mao, M.; Zhang, C.; Ferguson, M.D.; Lamb, J.; Dai, H.; Ng, I.O.; Sham, P.C.; et al. Predicting prognosis in hepatocellular carcinoma after curative surgery with common clinicopathologic parameters. BMC Cancer 2009, 9, 389. [Google Scholar] [CrossRef] [PubMed]
- El-Serag, H.B.; Rudolph, K.L. Hepatocellular carcinoma: Epidemiology and molecular carcinogenesis. Gastroenterology 2007, 132, 2557–2576. [Google Scholar] [CrossRef]
- Parkin, D.M. The global health burden of infection-associated cancers in the year 2002. Int. J. Cancer 2006, 118, 3030–3044. [Google Scholar] [CrossRef]
- Makarova-Rusher, O.V.; Altekruse, S.F.; McNeel, T.S.; Ulahannan, S.; Duffy, A.G.; Graubard, B.I.; Greten, T.F.; McGlynn, K.A. Population attributable fractions of risk factors for hepatocellular carcinoma in the United States. Cancer 2016, 122, 1757–1765. [Google Scholar] [CrossRef]
- Zhang, B.H.; Yang, B.H.; Tang, Z.Y. Randomized controlled trial of screening for hepatocellular carcinoma. J. Cancer Res. Clin. Oncol. 2004, 130, 417–422. [Google Scholar] [CrossRef]
- Chaiteerakij, R.; Zhang, X.; Addissie, B.D.; Mohamed, E.A.; Harmsen, W.S.; Theobald, P.J.; Peters, B.E.; Balsanek, J.G.; Ward, M.M.; Giama, N.H.; et al. Combinations of biomarkers and Milan criteria for predicting hepatocellular carcinoma recurrence after liver transplantation. Liver Transpl. 2015, 21, 599–606. [Google Scholar] [CrossRef]
- Elzouki, A.N.; Elkhider, H.; Yacout, K.; Al Muzrakchi, A.; Al-Thani, S.; Ismail, O. Metastatic hepatocellular carcinoma to parotid glands. Am. J. Case Rep. 2014, 15, 343–347. [Google Scholar] [PubMed]
- Guo, P.; He, Y.; Chen, L.; Qi, L.; Liu, D.; Chen, Z.; Xiao, M.; Chen, L.; Luo, Y.; Zhang, N.; et al. Cytosolic phospholipase A2α modulates cell-matrix adhesion via the FAK/paxillin pathway in hepatocellular carcinoma. Cancer Biol. Med. 2019, 16, 377–390. [Google Scholar] [PubMed]
- Wang, P.; Sun, Z.; Zhang, Z.; Yin, Q. Immune response pathways enriched in breast cancer samples with brain metastasis. Gland Surg. 2021, 10, 3334–3341. [Google Scholar] [CrossRef] [PubMed]
- Jung, S.H.; Yoo, E.H.; Yu, M.J.; Song, H.M.; Kang, H.Y.; Cho, J.; Lee, J.R. ARAP, a Novel Adaptor Protein, Is Required for TCR Signaling and Integrin-Mediated Adhesion. J. Immunol. 2016, 197, 942–952. [Google Scholar] [CrossRef] [PubMed]
- Subramanian, A.; Tamayo, P.; Mootha, V.K.; Mukherjee, S.; Ebert, B.L.; Gillette, M.A.; Paulovich, A.; Pomeroy, S.L.; Golub, T.R.; Lander, E.S.; et al. Gene set enrichment analysis: A knowledge-based approach for interpreting genome-wide expression profiles. Proc. Natl. Acad. Sci. USA 2005, 102, 15545–15550. [Google Scholar] [CrossRef]
- Fattovich, G.; Stroffolini, T.; Zagni, I.; Donato, F. Hepatocellular carcinoma in cirrhosis: Incidence and risk factors. Gastroenterology 2004, 127 (Suppl. S1), S35–S50. [Google Scholar] [CrossRef]
- Kanwal, F.; Hoang, T.; Kramer, J.R.; Asch, S.M.; Goetz, M.B.; Zeringue, A.; Richardson, P.; El-Serag, H.B. Increasing prevalence of HCC and cirrhosis in patients with chronic hepatitis C virus infection. Gastroenterology 2011, 140, 1182–1188.e1. [Google Scholar] [CrossRef]
- Janevska, D.; Chaloska-Ivanova, V.; Janevski, V. Hepatocellular Carcinoma: Risk Factors, Diagnosis and Treatment. Open Access Maced. J. Med. Sci. 2015, 3, 732–736. [Google Scholar] [CrossRef]
- Zou, Y.; Guo, C.G.; Zhang, M.M. Inhibition of human hepatocellular carcinoma tumor angiogenesis by siRNA silencing of VEGF via hepatic artery perfusion. Eur. Rev. Med. Pharmacol. Sci. 2015, 19, 4751–4761. [Google Scholar]
- Yang, J.D.; Roberts, L.R. Hepatocellular carcinoma: A global view. Nat. Rev. Gastroenterol. Hepatol. 2010, 7, 448–458. [Google Scholar] [CrossRef]
- Zhou, X.; Liu, C.; Zeng, H.; Wu, D.; Liu, L. Identification of a thirteen-gene signature predicting overall survival for hepatocellular carcinoma. Biosci. Rep. 2021, 41, BSR20202870. [Google Scholar] [CrossRef] [PubMed]
- Zuo, S.; Zhang, X.; Wang, L. A RNA sequencing-based six-gene signature for survival prediction in patients with glioblastoma. Sci. Rep. 2019, 9, 2615. [Google Scholar] [CrossRef] [PubMed]
- Wang, Z.; Wang, Z.; Niu, X.; Liu, J.; Wang, Z.; Chen, L.; Qin, B. Identification of seven-gene signature for prediction of lung squamous cell carcinoma. OncoTargets Ther. 2019, 12, 5979–5988. [Google Scholar] [CrossRef]
- MacParland, S.A.; Liu, J.C.; Ma, X.; Innes, B.T.; Bartczak, A.M.; Gage, B.K.; Manuel, J.; Khuu, N.; Echeverri, J.; Linares, I.; et al. Single cell RNA sequencing of human liver reveals distinct intrahepatic macrophage populations. Nat. Commun. 2018, 9, 4383. [Google Scholar] [CrossRef] [PubMed]
- Losic, B.; Craig, A.J.; Villacorta-Martin, C.; Martins-Filho, S.N.; Akers, N.; Chen, X.; Ahsen, M.E.; von Felden, J.; Labgaa, I.; DʹAvola, D.; et al. Intratumoral heterogeneity and clonal evolution in liver cancer. Nat. Commun. 2020, 11, 291. [Google Scholar] [CrossRef] [PubMed]
- Wu, R.; Guo, W.; Qiu, X.; Wang, S.; Sui, C.; Lian, Q.; Jianmin, W.; Shan, Y.; Yang, Z.; Yang, S.; et al. Comprehensive analysis of spatial architecture in primary liver cancer. Sci. Adv. 2021, 7, eabg3750. [Google Scholar] [CrossRef]
Publisher’s Note: MDPI stays neutral with regard to jurisdictional claims in published maps and institutional affiliations. |
© 2022 by the authors. Licensee MDPI, Basel, Switzerland. This article is an open access article distributed under the terms and conditions of the Creative Commons Attribution (CC BY) license (https://creativecommons.org/licenses/by/4.0/).