Abstract
Hepatocellular carcinoma (HCC) is the third major cause of cancer-related death worldwide and responds positively to tyrosine kinase inhibitors (TKIs). Dasatinib (Das) is an Src/Abl family kinase and has been successfully utilized in the treatment of various cancers. Cancer cells are known to limit their oxidative phosphorylation to minimize oxidative stress. Palmitoylcarnitine (Pcar) incubation triggers mitochondria-mediated apoptosis in cancer cells by increasing the mitochondrial respiration rate. It stimulates the H2O2 production in cancer cells and thus induces oxidative stress. Thus, considering the above observations, the combined effect of Pcar and Das on HepG2, liver cancer cells has been evaluated in the present study. Results demonstrated that combined exposure to Pcar and dasatinib inhibited cell growth, proliferation, and invasion efficiency of cancerous cells more than single-drug treatment. Further, cells undergo membrane depolarization and caspase-dependent apoptosis upon exposure to combined treatment. In addition, in vivo study showed that Pcar and dasatinib treatment reduced the tumor size in mice more significantly than single-drug treatment. Thus, considering the above remarks, combined therapy of Pcar and dasatinib may serve as a potential candidate in the treatment of liver cancer in human and animal tissues.
1. Introduction
Hepatocellular carcinoma (HCC) represents a major health challenge worldwide as most patients suffer advanced disease conditions and carry poor prognoses [1]. Src family kinase (SFK) is considered a potential target in HCC therapy as cellular Rous sarcoma oncogene cellular homolog (c-Src) is a critical component in various signaling pathways that regulate metastasis, invasion, proliferation, and angiogenesis [1]. Further, c-Src interacts with other receptor kinases for downstream signaling by PI3K/PTEN/Akt, Ras/Raf/Mek, and STATs [2]. Metastasis is also a primary cause of cancer-related death and can be treated by targeting the oncoprotein Src, which is found to be elevated in various cancer cells. Thus, it may possible to reduce the metastasis in cancer cells by inhibiting the expression of the Src protein [3,4]. Das, a Food and Drug Administration (FDA) approved drug, is currently in a phase II trial for the treatment of various cancers. It can be used for targeted therapy as it strongly binds to the SFK members and also inhibits BCR/ABL fusion protein [5]. Several studies reported the anti-tumor activity of Das in combination with other chemotherapeutic drugs in the treatment of tumors [6,7]. In vitro studies reported that Das treatment can successfully suppress the migration, proliferation, and invasion in HCC cells by inhibiting the Src tyrosine kinase via affecting PI3K/PTEN/Akt pathways [8]. In another report, Sayed et al. reported the synergistic anti-tumor effect of Das in combination with rosuvastatin in an in vitro HCC model and showed the involvement of the signaling pathway HCG/FAK/Src and its downstream pathways such as Ras/Raf/ERK and PI3K/Akt and molecules such as matrix metalloprotease 9 (MMP-9) and caspase-3 [1]. Combined treatment of Das and temozolomide also causes synergistic effects and induces autophagic cell death and disruption to the cell cycle in glioma cells. In another study, Das in combination with cabozantinib was significantly effective against alveolar soft part sarcoma (ASPS) cells [6].
Oncogenesis involves several metabolic changes that occur to fulfill the specific metabolic requirement of cancerous cells. These changes may enhance the rate of glucose transport associated with a high glycolysis rate, decrease pyruvate oxidation with increased lactate production, reduce fatty acid oxidation rate, and decrease the activity of the glycerol-3-phosphate shuttle system [9,10]. Pcar, C16:00, is synthesized from palmitic acid (PA) and represents ~80% of the total fatty acids present in cells. Various studies have reported the Pcar and carnitine levels in the tissues of humans and animals such as fish and rats [11,12,13]. However, it is not clear how targeting mitochondrial oxidative phosphorylation can decrease the survival of cancerous cells. Several research groups demonstrated that the fatty acid-derived mitochondrial substrate Pcar proved toxic to prostate [11] and colorectal cancerous cells [14,15]. Cancer cell metabolism is reported to have limited oxidative phosphorylation to minimize oxidative stress. Various available studies demonstrated that activation of oxidative phosphorylation promotes the reactive oxygen species (ROS) generation in cells. For example, activation of pyruvate dehydrogenase can redirect pyruvate towards oxidative phosphorylation which generates ROS and reduces proliferation in lung and tongue cancer cells [16]. The supply of Pcar to cancerous cells in combination with carnitine increases mitochondrial respiration and induces apoptosis. Wenzel et al. also reported that the production of superoxide during Pcar oxidation is lethal to HT29 cancer cells but tolerated by preneoplastic NCOL-1 epithelial cells [14]. Thus, this approach proves that Pcar oxidation may be less toxic to healthy cells as Pcar is a natural metabolite oxidized by mitochondria. The heterogeneous effect of Pcar on cell survival can be linked to inherent differences in glutathione redox buffering response [15]. Pcar has also been reported to alter the activity of several enzymes and transporters located in a mitochondrial membrane that triggers the caspase activity in cells [17].
Based on the aforementioned data, the present study aims to demonstrate the synergistic anti-tumor potential of Das and Pcar in an in vitro and in vivo HCC model by inducing HepG2-mediated liver cancer in nude mice. Several signaling pathways related to cancer cell survival, metastasis, and proliferation are also evaluated to elucidate the mechanism behind the anti-tumor activity of Das and Pcar. Results suggest that Das in combination with Pcar acts synergistically and inhibits the proliferation as well as migration of cancerous cells. The in vivo study also supports the observation that it suppresses tumor growth in an induced HCC mouse model.
2. Material and Method
2.1. Synthesis of Palmitoylcarnitine Chloride
First, 6 g of thionyl chloride and 50 g of palmitic acid were mixed and stirred for 3 h at 80 °C, followed by the addition of a solution containing 9.9 g of dl-carnitine chloride in 50 g of trichloroacetic acid at 40 °C. The final solution was stirred at 80 °C for 3 h and then poured into 200 mL of dry ether. The precipitate obtained was filtered, washed with ether, and dissolved in 50 mL of hot isopropyl alcohol. Turbid isopropyl alcohol solution (due to dl-carnitine chloride) was filtered, followed by the addition of 400 mL dry acetone to the filtrate. Pcar chloride was precipitated, filtered, washed with ether, and dried [18]. The purity of synthesized Pcar was found to be approximately 99%. NMR spectra were obtained to confirm the synthesis of Pcar (Figure S1).
The 1H NMR spectra were recorded with a Varian Mercury Plus 400 spectrometer operating at 400.1 MHz. The spectra were acquired at room temperature (298 K). The chemical shifts are reported in ppm for reference and are stated relative to external tetramethylsilane (TMS) for 1H NMR.
1H NMR [DMSO-d6, ppm]: δ 5.50, 5.48, 5.47, 5.45 (q, J = 6.4 Hz, 1H, 1O-CH), 3.88, 3.84 (dd, J = 14.4, 8.3 Hz, 1H, 1N-CH), 3.74, 3.71 (d, J = 13.7 Hz, 1H, 1N-CH), 3.16 (s, 9H, 3N-CH3), 2.70, 2.68 (d, J = 6.0 Hz, 2H, O=C-CH2), 2.34, 2.32, 2.30 (td, J = 7.5, 2.7 Hz, 2H, O=C-CH2), 1.57, 1.55, 1.53 (t, J = 6.8 Hz, 2H, CH2), 1.25 (m, 24H, CH2), 0.88, 0.87, 0.85 (t, J = 6.8 Hz, 3H, CH3).
2.2. Cell Culture
Liver cancer cell line HepG2 cells and non-cancerous cell line HEK293 cells were cultured in Dulbecco’s Modified Eagle Medium (DMEM) supplemented with 1% antibiotic and 10% FBS. Cells were maintained in a humified atmosphere with 5% CO2 at 37 °C.
2.3. Cell Viability Assay
Cell viability was determined by mitochondrial 3-(4, 5-dimethylthiazolyl-2)-2, 5-diphenyltetrazolium bromide) (MTT) assay. In this assay, 1 × 10⁴ cells were seeded in a 96-well plate and treated with different concentrations of Das (10 and 20 µM in DMEM media) and Pcar (100 µM in DMEM media) alone and in combination for 24 h. Following the completion of the exposure period, the media were withdrawn, and each well received 100 µL of MTT (0.5 mg/mL in media), followed by incubation for 3–4 h at 37 °C. Dimethyl sulfoxide (DMSO) was added after the MTT dye was discarded in order to solubilize the blue formazan. Color intensity was quantified in an iMark Bio-rad microplate reader by recording the absorbance at 590 nm.
2.4. Combination Index Analysis
In combination therapy, the interaction between two drugs is evaluated by combinational index (CI) analysis. It provides a quantitative measure of drug interaction [19].
CI = (CA,X/ICX,A) + (CBX/ICX,B)
CA,X and CB,X are the concentrations of drugs A and B used to achieve X% effect in combination therapy. ICX,A and ICX,B are the concentrations of a single drug used to achieve the same effect. In general, CI < 0.9, CI = 0.9–1.1, and CI > 1.1 indicate synergism, additivity, and antagonism, respectively.
2.5. Clonogenic Assay
In order to investigate the colony-forming efficiency of cells, a clonogenic assay was performed. One thousand cells were seeded in a 6-well plate, followed by the addition of Das (10 and 20 µM) and Pcar (100 µM) alone and in combination. In order to form the colonies, cells were further incubated for 10 more days.
2.6. Migration Assay
Cells were seeded in a 6-well plate and grown up to 90% confluency, and a linear wound in the cell monolayer was created using a 200 µL tip, followed by washing with phosphate buffer saline (PBS) to eliminate detached cells and exposure to 10 and 20 µM Das and 100 µM Pcar, alone and in combination, for 48 h. Edge movement of cells was then followed by using microscopy.
2.7. Nuclear Fragmentation
In cells treated with Das and Pcar, nuclear fragmentation was evaluated by DAPI staining. For this purpose, 5 × 10⁴ cells were seeded in 12-well plates, followed by exposure to 10 and 20 µM Das and 100 µM Pcar, alone and in combination, for 24 h. Following the completion of the exposure period, the medium was withdrawn, and cells were washed in PBS and stained for 10 min with DAPI (1 g/mL in methanol). Fluorescence microscopy was used to capture images after the dye was removed, and cells were rinsed with PBS to remove background staining. By counting three independent areas, a graph was created.
2.8. Intracellular Reactive Oxygen Species Generation
First, 5 × 10⁴ cells were seeded in 12-well plates and incubated for 24 h, followed by exposure to 10 and 20 µM Das and 100 µM Pcar, alone and in combination, for 24 h. Following the completion of the exposure period, media were removed, and cells were washed with PBS and then stained with H2DCFDA dye (2, 7-dichlorofluorescein diacetate) (20 µM in PBS) for 30 min at 37 °C. In order to remove any more background staining, the dye was withdrawn and cells were rinsed with PBS before fluorescence microscopy was used to capture the images.
2.9. Mitochondrial Membrane Potential
JC-1 dye was used to estimate the mitochondrial membrane potential of cells. For this purpose, 5 × 10⁴ cells were seeded in 12-well plates and incubated for 24 h, followed by exposure to 10 and 20 µM Das and 100 µM Pcar, alone and in combination, for 24 h. After completion of exposure time, media were removed, and cells were washed with PBS and then stained with JC-1 dye (20 µM in PBS) for 20 min at 37 °C. Cells were washed with PBS to remove background staining, and images were acquired using fluorescence microscopy.
2.10. Lysotracker
Lysotracker red was used to evaluate lysosomal accumulation. For this purpose, 5 × 10⁴ cells were seeded in 12-well plates and incubated for 24 h, followed by exposure to 10 and 20 µM Das and 100 µM Pcar, alone and in combination, for 24 h. After the medium had been removed and the cells had been rinsed with PBS, Lysotracker red was used to stain them (75 nM). Images were taken using fluorescence microscopy after the cells were washed in PBS to remove any remaining background staining.
2.11. Apoptosis
Apoptosis in cancerous cells was detected by using an annexin V/fluorescein isothiocyanate (FITC) detection kit (BD Biosciences). For this purpose, 2.0 × 10⁴ cells were seeded in a 6-well plate and treated with 10 and 20 µM Das and 100 µM Pcar for 24 h. After completion of exposure time, media were removed, trypsinized, washed with PBS, and incubated with 100 µL of binding buffer containing 5 µL PI and FITC for 15 min in the dark. The sample was supplemented with 400 µL of binding buffer, and the results were obtained using a flow cytometer with red and green channels.
2.12. Western Blot
For protein isolation, 2 × 10⁵ cells were seeded in a 6-well plate and treated with 10 µM Das and 100 µM Pcar in combination or alone. Media were removed and cells were washed with ice-cold PBS, harvested, and lysed by sonication in the lysis buffer consisting of PMSF protease inhibitor. Isolated protein was quantified using the bicinchoninic acid (BCA) method (Pierce, BCA Protein Assay kit, Burlington, MA, USA). Protein (30 µg) was loaded on 12% SDS PAGE and transferred to a polyvinylidene difluoride (PVDF) membrane at 300 mV for 3 h. The membrane was blocked with 5% BSA, washed with Tris-buffered saline (TBST), and then incubated with specific primary antibodies overnight at 4 °C. Membranes were washed thrice with TBST and incubated with specific secondary antibodies for 2 h. Immobilon Western-HRP substrate (Millipore, Billerica, MA, USA) was used to develop the blots. MMP-9, MMP-2, cleaved caspase-3, cleaved poly (ADP-ribose) polymerase (PARP), cleaved caspase-6, pAKT, AKT, cleaved caspase-7, and phospho C-raf antibody antibodies were purchased from Cell Signaling Technology, with catalog numbers #3852, #4022, #9661, #9541, #9761, #9275, #4691, #9491, and #9421. Anti-LC3 antibody was purchased from Sigma-Aldrich, Burlington, MA, USA with catalog No. L7543-25UL. Anti-Src and anti-Src (phospho Y419) antibodies were obtained from Abcam, having catalog numbers ab47405 and ab185617. Primary antibodies were diluted at 1:1000 in the experiment. A secondary antibody, having catalog number #7074, was obtained from Cell Signaling Technology and diluted to 1:2000 in the experiment.
2.13. In Vivo Experiment
Male nude mice (4–6 weeks old) were used for the development of the ectopic HepG2 tumor models in the right flank of each mouse. The protocol was approved by the Animal Ethical Committee of Liaocheng University, China. HepG2 cells were mixed with matrigel in a 1:1 v:v ratio and kept in ice until use, to prevent the gelation of matrigel. One hundred microliters of a solution containing 1 × 10⁵ HepG2 cells was injected subcutaneously into the right flank of each mouse and observed daily to check the tumor development. Mouse tumor size was measured externally by using a digital caliper, and drug exposure was started when tumor size reached 50–100 mm3. Mice were divided into four groups and given an intraperitoneal injection two times a week for 5 weeks with a solution containing (i) 0.9% saline buffer (control group), (ii) 2 mg/kg Pcar in PBS, (iii) 10 mg/kg DAS in PBS, or (iv) combined treatment of 2 mg/kg Pcar and 10 mg/kg DAS in PBS. At the end of the experiment, animals were euthanized by the cervical dislocation method. All efforts were made to minimize the suffering of animals. Tumor sizes were measured by using the formula (length) × (width)2 × 1/2. Table S1 shows the development of tumor in given time period.
2.14. Statistical Analysis
One-way ANOVA (GraphPad Prism 5.0) was used to perform the statistical analysis and determine the significance of the results of in vitro and in vivo experiments. Three independent experiments were performed in each case, and data are presented as the mean ± standard error (SE).
3. Results
3.1. Combined Treatment of Das and Pcar Inhibits of Cell Growth and Colony Formation
To evaluate the effect of Das and Pcar, alone and in combination, on HepG2 cells, an MTT assay was performed. Figure S2A,B show that Das and Pcar are toxic to cells and reduce cell viability in a concentration-dependent manner. Further, a combined synergistic effect of Pcar and Das was evaluated. As shown in Figure 1A, exposure to 100 µM Pcar slightly reduces the cell viability to ~85%; however, exposure to 10 and 20 µM Das reduces the cell viability to 91% and 86%, respectively. Next, combined exposure to Pcar (100 µM) and Das (10 and 20 µM) shows synergistic toxic effects and a reduction in cell viability to 70% and 60%, respectively. Thus, the result indicates that combined treatment of these two drugs proves to be more toxic to cancerous cells in comparison to single-drug treatment. Further, as shown in Figure S2C, in HEK293 non-cancerous cells, Pcar and Das did not exhibit a significant cytotoxic effect when administered alone, whereas, when administered in combination, they possess a toxic effect. The combination index (CI) analysis of both drugs has shown the value 0.83, which corresponds to synergistic action between two drugs.
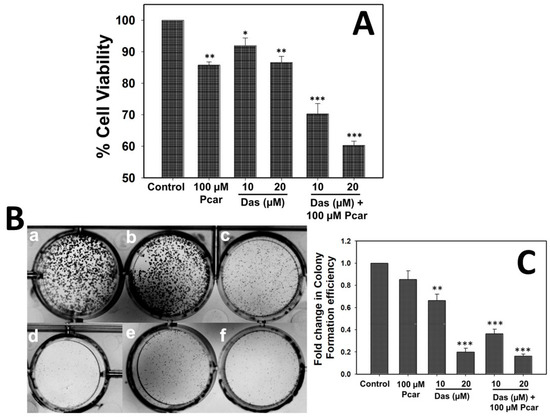
Figure 1.
Pcar and Das combined treatment induces more toxicity and inhibits colony formation efficiency in HepG2 cells. (A) MTT assay showing that combined treatment of Pcar and Das acts synergistically and reduces the cell viability. (B) Colony formation efficiency showing less colony formation in the combination treatment group (e and f) than in single-treatment groups (c and d) and control group (a). (a) Control; (b) 100 µM Pcar; (c,d) 10 and 20 µM Das; (e,f) 100 µM Pcar + 10 and 20 µM Das. (C) Quantitative estimation of colony formation efficiency of treated and control cells. Data expressed as mean ± standard error (SE) calculated from three (n = 3) independent experiments, * p < 0.05, ** p < 0.01, *** p < 0.001. Statistical significance has been calculated by comparing the treated cells (only Pcar, only Das, and Pcar+Das) in reference to control cells in each group.
The ability of Pcar and Das to disrupt the replication of HepG2 cells was determined by clonogenic assay (Figure 1B,C). Results demonstrated that control cells exhibit well-formed colonies; treatment of 100 µM Pcar also exhibits no toxic effect, and a higher number of colonies were observed. However, 10 and 20 µM Das exhibited a toxic effect and thus inhibited the colony formation efficiency of cells; thus, only a few colonies were formed. Next, combined treatment of Pcar (100 µM) and Das (10 and 20 µM) was evaluated, and the result showed that the drug combinations have a higher toxic effect; thus, very few colonies were formed in combined treatment groups in comparison to single-treatment groups.
3.2. Combined Exposure to Das and Pcar Suppresses the MMP-9 and MMP-2 Protein Expression and thus Aggressive Migration of Cancer Cells
To evaluate the inhibitory effect of Das and Pcar on the migratory potential of HepG2 cells, a wound healing assay was performed. As shown in Figure 2A,B, control cells have a high migration rate and the wound is almost closed, whereas cells treated with Pcar (100 µM) and Das (10 and 20 µM) alone and in combination still display a visible wound. The result clearly shows that wounds in combination treatment groups are more prominent than those in single-treatment groups; thus, it can be suggested that combined treatment of Pcar and Das has a higher potential for inhibiting cancer cell migration than a single treatment.
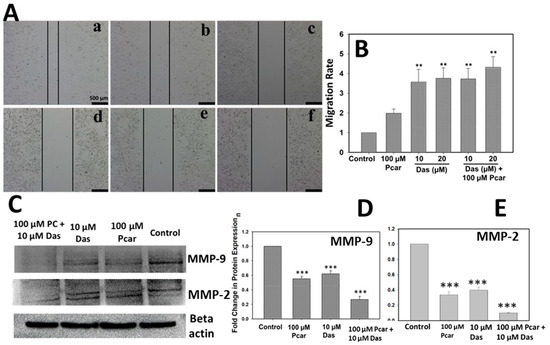
Figure 2.
Pcar and Das combined therapy inhibited the migration of cancerous cells. (A) Microscopic images showing the wound healing assay revealed that Pcar and Das in combination efficiently suppress the migration rate of cancerous cells. (B) Quantitative analysis of migration assay was obtained by measuring 3 independent microscopic areas. (C) Analysis of MMP-9 and MMP-2 protein expression. (a) Control; (b) 100 µM Pcar; (c,d) 10 and 20 µM Das; (e,f) 100 µM Pcar + 10 and 20 µM Das. Quantitative estimation of (D) MMP-9 and (E) MMP-2 protein expression in control and treated cells. Data expressed as mean ± standard error (SE) calculated from three (n = 3) independent experiments, ** p < 0.01, *** p < 0.001. Scale bar 500 µm.
Further, MMP-9 and MMP-2 protein expression was analyzed to examine the inhibitory activity mechanism of Pcar and Das. MMP-9 and MMP-2 play an important role in the migration and invasion of cancerous cells. As shown in Figure 2C,D, the combined treatment of Das and Pcar significantly inhibited the expression of MMP-9 and MMP-2 proteins in comparison to the control and single-treatment groups. Thus, it can be concluded that Das and Pcar inhibited the cancerous cell migration by reducing the expression of MMP-9 and MMP-2 proteins.
3.3. Pcar and Das Induce Nuclear Fragmentation and Apoptosis in HepG2 Cells
To investigate whether the inhibited proliferation of HepG2 cells was caused by induced apoptosis, DAPI and annexin V/FITC staining were used. Nuclear fragmentation in Pcar and Das single and combination treatment groups was analyzed by DAPI staining. Figure 3A,B show that HepG2 cells exhibit nuclear fragmentation and condensation (indicated by white arrows) induced by Das and Pcar, both in combination and single treatment. However, as shown in Figure 3A, more nuclear-fragmented cells were found in Pcar and Das combined treatment groups in comparison to single-treatment groups, in a concentration-dependent manner. Figure 3B shows the quantitative analysis, which was performed by counting the cells with nuclear fragmentation from three different microscopic areas. The graph clearly shows the increased nuclear fragmentation intensity in combination treatment groups when compared to single-treatment groups.
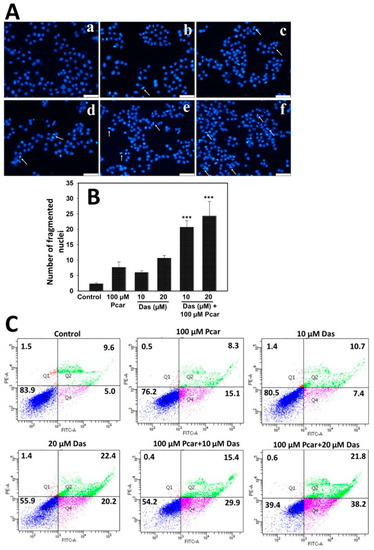
Figure 3.
Nuclear fragmentation and apoptosis in groups treated with Pcar and Das both alone and in combination were determined by DAPI and annexin V/PI staining, respectively. (A) Fluorescence microscopy showed that Pcar and Das in combination induce nuclear fragmentation (white arrows) in HepG2 cells. (a) Control; (b) 100 µM Pcar; (c,d) 10 and 20 µM Das; (e,f) 100 µM Pcar + 10 and 20 µM Das (B) Quantitative analysis was performed by analyzing 3 independent microscopic areas in each group. (C) Flow cytometric analysis of annexin V/FITC-stained cells showing that Pcar and Das combination therapy induces apoptotic induction in HepG2 cells. Data represented as mean ± standard error (SE) obtained from three (n = 3) independent experiments, *** p < 0.001. Scale bar 100 µm.
Further, flow cytometric analysis was conducted for the quantitative estimation of apoptotic cells by annexin V/FITC staining. As shown in Figure 3C, control cells exhibit an apoptotic cell population of 5.0% that increases to 15.4, 7.4, and 20.2% upon exposure to 100 µM Pcar, 10 µM Das, and 20 µM Das, respectively. Interestingly, upon combined exposure to Pcar (100 µM) and Das (10 and 20 µM), the apoptotic population increases to 29.9 and 38.2%, respectively. Thus, this result indicates that in combination, Pcar and Das significantly enhanced the apoptotic cells in a concentration-dependent manner. Quantitative estimation was performed and the results are shown in Figure S2D, which also clearly reveals the increase in the apoptotic population of the combined treatment group in comparison to the control and single-treatment group.
3.4. Pcar and Das Induce Oxidative Stress via Intracellular ROS Generation
Intracellular ROS generation was determined by monitoring the DCFDA fluorescence in order to investigate the role of ROS in cell apoptosis. As shown in Figure 4A, cells treated with 100 µM Pcar and 10 and 20 µM Das do not show an increase in green fluorescence in comparison to control cells, and thus these treatments did not induce ROS formation in HepG2 cells. However, combination treatment groups show increased green fluorescence when compared to control and single-treatment groups, which indicates the increased ROS generation in HepG2 cells. Increased ROS generation causes cells to experience more oxidative stress, which destroys important biological macromolecules and triggers apoptosis in the cells. Figure 4B shows the quantitative analysis of ROS generation. Results indicate increased fluorescence in the Pcar and Das combination treatment group compared to the control and single-treatment groups.
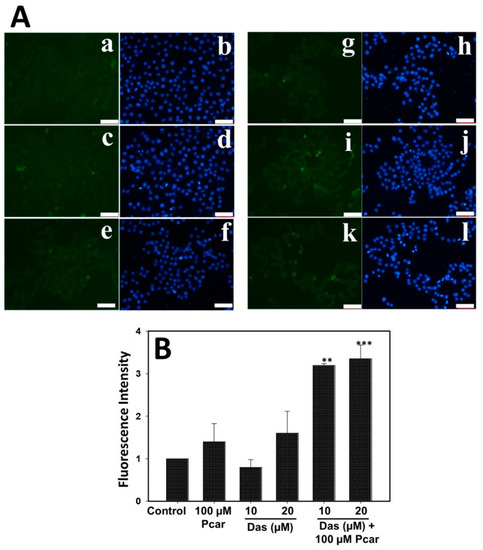
Figure 4.
ROS generation in HepG2 cells was determined by DCFDA staining. (A) Fluorescence microscopy images show increased green fluorescence in Pcar and Das combination treatment group indicating increased ROS generation. (B) Quantitative analysis was performed by measuring the fluorescence of 3 independent areas. (a,b) Control; (c,d) 100 µM Pcar; (e–h) 10 and 20 µM Das; (i–l) 100 µM Pcar + 10 and 20 µM Das. Data represented as mean ± standard error (SE) obtained from three (n = 3) different experiments, ** p < 0.01, *** p < 0.001. Scale bar 100 µm.
3.5. Pcar and Das in Combination Induce Membrane Depolarization in HepG2 Cells
Mitochondrial membrane depolarization in cancerous cells was examined by staining cells with JC-1 dye. As shown in Figure 5, cells treated with Pcar and Das exhibit increased green:red fluorescence compared to control cells, indicating the membrane depolarization in the treated group. The Pcar and Das combination treatment exhibits higher green:red fluorescence than single-treatment groups. Thus, the result indicates that Pcar and Das combination treatment significantly decreases the membrane potential in comparison to the single-treatment group.
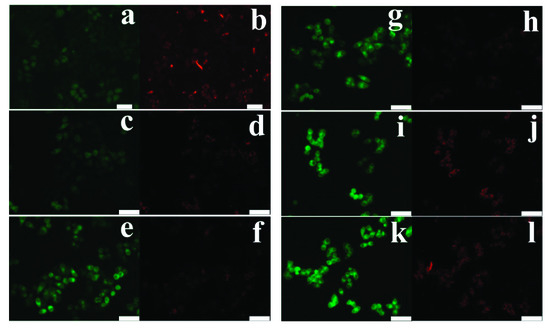
Figure 5.
Pcar and Das combined therapy induces mitochondrial membrane depolarization in HepG2 cells. Fluorescence microscopy images show that in JC-1 dye staining, combination treatment groups show increased green fluorescence indicating the reduction in membrane potential. (a,b) Control; (c,d) 100 µM Pcar; (e–h) 10 and 20 µM Das; (i–l) 100 µM Pcar + 10 and 20 µM Das. Scale bar 100 µm.
3.6. Combined Exposure to Pcar and Das Causes Autophagy in Liver Cancer Cells
Autophagy induction in cells was examined by staining with Lysotracker red and following the expression of LC3 protein. As shown in Figure 6B,C, the combined treatment of Pcar and Das reduced the expression of LC3-I protein, whereas a similar expression of autophagic marker LC3-II was found in only Das and combination treatment groups, indicating cellular damage and increased autophagic flux in HepG2 cells. Further, Lysotracker staining (Figure 6A) shows that Pcar and Das combined exposure significantly enhanced the lysosomal activation in comparison to a single treatment, which further promotes the autophagosomal degradation in a later stage of autophagy.
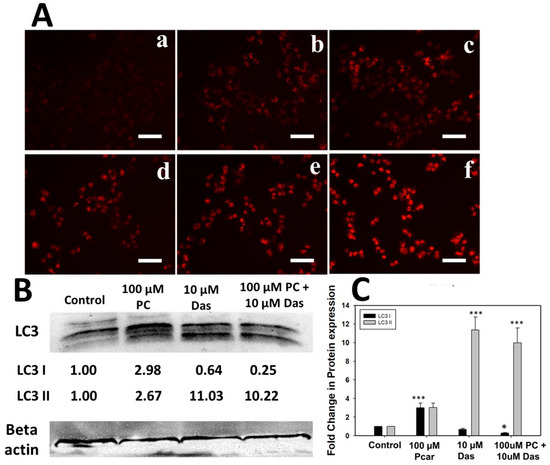
Figure 6.
Lysotracker accumulation in HepG2 cells. (A) Pcar and Das combined effect showed more Lysotracker accumulation in lysosomes, thus confirming the autophagy induction. (B) Expression analysis of LC3 protein. (a) Control; (b) 100 µM Pcar; (c,d) 10 and 20 µM Das; (e,f) 100 µM Pcar + 10 and 20 µM Das. (C) Quantitative estimation of LC3 protein expression in control and treated cells. Scale bar 100 µm. Data represented as mean ± standard error (SE) obtained from three (n = 3) different experiments, * p < 0.05, *** p < 0.001. Scale bar 100 µm.
3.7. Effects of Pcar and Das on Various Signaling Pathways
To investigate the molecular mechanism governing the anti-tumor activity of Pcar and Das, the expression of several proteins involved in signaling pathways was analyzed (Figure 7A,B). Firstly, the combined treatment of Pcar and Das was found to inhibit the phosphorylation of Src to a greater degree than the single-treatment groups, without affecting the total Src protein. Similarly, Pcar and Das combined exposure was also observed to inhibit the phosphorylation of the downstream protein Akt, while there was no effect on total AKT protein. Akt activation is responsible for cancer survival, progression, proliferation, and metastasis [20].
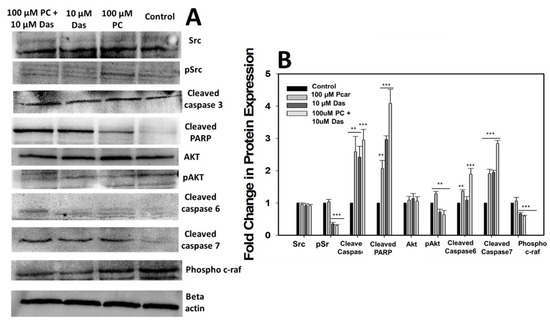
Figure 7.
(A) Western blot analysis showing the expression of several proteins involved in signaling pathways involved in cancer. (B) Quantitative estimation of protein expression. Data expressed as mean ± standard error (SE) calculated from three (n = 3) independent experiments, ** p < 0.01, *** p < 0.001.
The apoptosis in cancerous cells treated with Pcar and Das was observed further, and the molecular mechanisms involved in apoptosis mediated by Pcar and Das were explored. Thus, the expression of apoptosis-related proteins, i.e., cleaved caspase-3, -6, and -7 and cleaved PARP, was investigated. Results showed that combined treatment of Pcar and Das promotes the cleavage of all caspase-related proteins as well as PARP protein, which indicates the involvement of these proteins in apoptosis-mediated cell death induced by combined therapy of drugs.
The Raf1 pathway is considered to be closely related to the prognosis of various cancers. In the present study, it has been observed that combined treatment of Pcar and Das decreased the phosphorylation of Raf1 compared to control and single-treatment groups, which indicates that combined drug treatment can block the Ras/Raf1/Erk1/2 signaling pathway in cancerous cells.
3.8. Effect of Pcar and Das on the Growth of HepG2 Cells In Vivo
In vivo anti-tumor efficacy of Pcar and Das was evaluated in BALB/c male nude mice injected with HepG2 cells. As shown in Figure 8A, mice receiving the combined treatment of Pcar and Das had a smaller tumor volume than the control and single-treated mice. There was no significant change in body weight of combination-treated, single-treated, or control groups (see Figure 8B). Thus, it can be suggested that overall combined treatment was well tolerated by mice, with no weight loss and no sign of acute or delayed toxicity. Figure 8C shows the representative images of tumors from each group. Representative images of a mouse with tumor growth and migration are shown in Figures S3 and S4, respectively. Figure 8D shows the decrease in mouse tumor weight upon treatment for the combined group in comparison to the single-treatment and control groups.
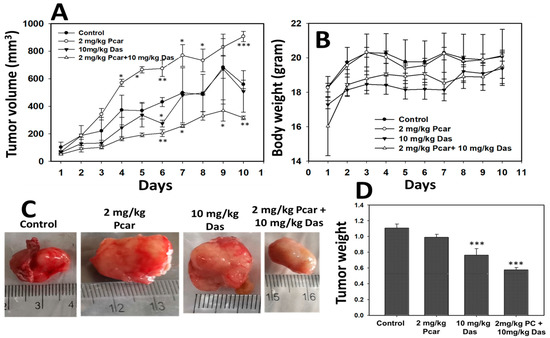
Figure 8.
Pcar and Das combined treatment shows anti-tumor in vivo activity. (A) Mouse tumor volume decreases significantly in Pcar and Das combination treatment group compared to single-treated and control groups. (B) Bodyweight of mice does not change in response to combined or single-drug treatment. (C) Representative images showing mouse tumors of each group. (D) Result shows a decrease in the tumor weight of the Pcar and Das combination treatment group compared to the single-treated and control groups. Data represented as mean ± standard error (SE) obtained from three (n = 3) different experiments, * p < 0.05, ** p < 0.01, *** p < 0.001.
4. Discussion
The present study suggested that Pcar and Das acted synergistically to inhibit the growth of liver cancer cells in both in vitro and in vivo models. HCC is reported to be a hypervascular tumor type having an enhanced tendency for angiogenesis and neovascularization [21]. In order to overcome the single-treatment resistance in cancer cells, combined therapy is used in this study to enhance the treatment effect and reduce the dose-responsive side effects [22,23]. In this regard, Xiao et al. demonstrated that Das in combination with paclitaxel significantly inhibited the proliferation and induced apoptosis in ovarian cancer cells. Further, an in vivo study also showed that combined treatment of Das and paclitaxel has a tumor growth inhibition rate of 76.7% and 58.5% for mice xenografted with A2780 and HO8910 cells, respectively [24]. Other studies also supported the fact that Das in combination with other drugs provides an additive or synergistic anti-tumor effect [1,6,25]. Similarly, acetylcarnitine in combination with butyrate has anticarcinogenic properties superior to those of butyrate alone and is shown to inhibit the survival of colon cancer in vitro [26]. Based on these observations, the combined toxic effect of Pcar and Das was evaluated, and the result showed that the combined treatment exhibits enhanced anti-tumor effect in terms of apoptosis induction, cytotoxicity, membrane depolarization, metastasis, and tumor growth.
Various reports demonstrate the toxic effect of Das and Pcar on cancerous cells through different mechanisms. Thus, in the present study, the cytotoxic effect of Pcar and Das on HepG2 cells was first evaluated by MTT assay. The in vitro study showed that the growth of the HepG2 cell line was slightly inhibited by single treatments of Das and Pcar exposure, but a marked significant reduction was recorded in the Pcar and Das combination treatment group. Further, the synergistic interaction between Pcar and Das was confirmed by the CI value (0.83) being less than one, which clearly indicates the synergistic interaction between the two drugs. Thus, it can be seen that the combined treatment of Pcar and Das proved to be more toxic to liver cancer cells and induced more cell death in comparison to single-drug treatments. Similar to our result, combined treatment of acetylcarnitine and butyrate is also reported to inhibit the survival of SW480 colon cancer cells more significantly than single-drug exposure. The clonogenic assay is also an in vitro cell survival assay that shows the ability of single cells to grow and form a colony [27]. Another report shows that Das treatment significantly inhibited the colony formation efficiency of ovarian cancer cells [28]. Thus, to evaluate the combined effect of Das and Pcar on the colony formation efficiency of HepG2 cells, a clonogenic assay was performed. Results revealed that combined exposure to Pcar and Das inhibited the colony formation efficiency of HepG2 cells to a greater degree than single-drug treatment. Thus, the above results in combination with other observations suggest that Pcar and Das in combination act synergistically and can efficiently inhibit the growth and proliferation of cancerous cells.
Earlier it was reported that exposure of Pcar and carnitine to HT-29 causes O2− production in the mitochondria of cancerous cells that promotes apoptosis initiation [14]. Another report also suggests that cancerous cells are susceptible to Pcar exposure due to the production of H2O2 [15]. Following the above observations, our study also showed that Pcar and Das combined exposure induces ROS generation in HepG2 cells which further leads to nuclear fragmentation and apoptosis in liver cancer cells. It has been well reported that increased H2O2 production in cancerous cells can trigger deleterious cellular effects such as caspase activation [15]. Results also showed that combined exposure to Pcar and Das increased the expression of cleaved caspase-3, -7, and -6, which are apoptosis-related proteins. It has also been reported that during apoptosis, PARP is known to be cleaved by caspase, which is an important marker of caspase-dependent apoptosis [29]. As expected, PARP cleavage was increased significantly upon Pcar and Das combined exposure in comparison to single-drug treatment, thus confirming its crucial role in the apoptotic process. Additionally, a number of chemotherapeutic treatments are known to change the integrity of the mitochondrial membrane, which results in a collapse in the membrane potential [30]. Thus, in the present study, the membrane potential of HepG2 cells in response to Pcar and Das combined treatment was evaluated, and the result clearly showed that combined treatment induces membrane depolarization to a greater degree than single treatment. Thus, the crucial role of mitochondria in the apoptotic process and cell death induced by Pcar and Das is confirmed.
Das is also reported to induce autophagic cell death mediated by Beclin-1, AKT, and Bcl-2 in ovarian cancer cells. Das-induced autophagy is also reported to be responsible for the Das-induced inhibition of cell growth [28]. Das treatment significantly increased the levels of autophagosomes and autophagolysosomes in the cytoplasm of cancerous cells [28]. Similar to this, our study also demonstrated autophagy induction in liver cancer cells, as shown by an accumulation of Lysotracker and overexpression of LC3 protein (Figure 6). Feng Le reported that Das-induced autophagy partially depends on the AKT pathway and Bcl-2 expression [28]. Thus, in the present study, the dependency of autophagy induced by Pcar and Das in liver cancer cells has been investigated. Results showed that combined treatment of Pcar and Das reduced the phosphorylation of Akt, which in accordance with the above result, could be considered as one of the factors that induce autophagy in cancerous cells.
To reveal the further molecular mechanisms involved in the Pcar and Das anti-tumor effect, several proteins involved in cancer signaling pathways were also analyzed. Results showed that Pcar and Das downregulate several cancer-related proteins and upregulate the expression of apoptotic proteins. Mayor and Krop demonstrated that Src is overexpressed in numerous cancers and can regulate several signaling pathways that affect the proliferation, survival, invasion, migration, and angiogenesis in tumor cells [31]. Further, Sayed et al. showed that Das in combination with rosuvastatin acts synergistically to suppress the growth of HCC by decreasing the expression of p-Src [1]. Likewise, our result also suggests the decreased phosphorylation of Src upon Pcar and Das combined exposure. Other reports also showed that the chemotherapeutic effect of Das is primarily due to the inhibition of Src expression, which can also provide more sensitivity to oxaliplatin in cancer treatment. Contrary to this, cancer cells that did not show high Src expression failed to show the synergistic action between the two [32]. Our finding also supports the idea that cancer cells highly dependent on Src signaling are more susceptible to Das in combination therapy (Src-targeted therapy).
Das is a Bcr-Abl TKI and SRC family tyrosine kinase inhibitor that has been approved for the treatment of chronic myelogenous leukemia, Philadelphia chromosome-positive acute lymphoblastic leukemia, and alveolar soft part sarcoma [6,7,33]. In vivo studies also showed that Das exposure either in combination or alone reduces tumor size [6,28]. Following the above observation, our result also showed that exposure of mice to Das and Pcar significantly reduces the tumor volume in comparison to a single treatment of Das. Figures S4 and S5 shows the tumor migration in a mouse treated with only Das, which further leads to mouse death and mouse survival graph. The percentage of death in the group treated with only Das is recorded as 37.5%, whereas it is reduced to 20% for the Pcar and Das combination treatment group. This result also confirms that in comparison to single treatment, combined drug treatment shows more efficiency as an anti-tumor agent.
5. Conclusions
The obtained results demonstrated that the combined therapy of Pcar and Das exhibited excellent anti-tumor activity by suppressing the growth and proliferation of cancerous cells as well as inhibiting their migration and invasion. This chemotherapeutic effect may be achieved by inhibiting the phosphorylation of Src and Akt proteins and overexpressing the apoptosis-promoting proteins such as cleaved caspase 3, -6, and -7 and PARP. Autophagy-induced cell death could also be one of the possible mechanisms underlying the anti-tumor activity of Das and Pcar. Further, in vivo study also supports the above observation, as combined treatment of Pcar and Das inhibited tumor growth in an induced HCC mouse model. These findings suggest that Das in combination with Pcar will be an excellent therapeutic agent for patients suffering from liver cancer (in tissues of humans and animals (e.g., fish cultures)) and also a useful biomedicine tool in the prevention of oxidative stress-mediated diseases.
Supplementary Materials
The following supporting information can be downloaded at: https://www.mdpi.com/article/10.3390/livers2040026/s1, Figure S1: NMR spectra of synthesized Pcar; Figure S2: MTT assay showing the concentration dependent toxicity of (A) Das, (B) Pcar, (C) Pcar and Das alone and in combination in HEK293 cells, and (D) Represent the quantitative estimation of apoptotic cells; Figure S3: Representative image showing tumor growth in control mouse as well as Pcar and Das treated mouse both in combination and alone.; Figure S4: Representative image showing tumor migration on Das treated group; Figure S5: Mouse survival graph; Table S1: Tumor measurement (length and width).
Author Contributions
R.S.: Methodology, Conceptualization, Formal Analysis, Validation, Funding Acquisition, Writing—Original Draft. S.C.: Resources, Supervision, Writing—Review and Editing. Q.Z.: Validation, Writing—Review and Editing. S.K.: Formal Analysis, Validation, Writing—Review and Editing. C.M.: Resources, Formal Analysis, Validation, Writing—Review and Editing. All authors have read and agreed to the published version of the manuscript.
Funding
This work was supported by Liaocheng University, China (Grant No. 318051901) and the Natural Science Foundation of Shandong Province (Grant No. ZR2020QC061), PR China. C. Marques is thankful for the financial support of the project i3N (UIDB/50025/2020, UIDP/50025/2020, LA/P/0037/2020), grant 2021.00667.CEECIND, and DigiAqua project (PTDC/EEI-EEE/0415/2021) financed by national funds through the FCT/MEC.
Institutional Review Board Statement
All procedures were carried out in accordance with the relevant guidelines and regulations in the manuscript. The animals and other materials we used for the experiment all met the requirement of the Animal Ethics committee of Liaocheng University.
Data Availability Statement
All data generated or analyzed during this study are included in this published article (and its supplementary Materials Files).
Conflicts of Interest
The authors declare no conflict of interest.
References
- El Sayed, I.; Helmy, M.W.; El-Abhar, H.S. Inhibition of SRC/FAK cue: A novel pathway for the synergistic effect of rosuvastatin on the anti-cancer effect of dasatinib in hepatocellular carcinoma. Life Sci. 2018, 213, 248–257. [Google Scholar] [CrossRef] [PubMed]
- Ishizawar, R.; Parsons, S.J. c-Src and cooperating partners in human cancer. Cancer Cell 2004, 6, 209–214. [Google Scholar] [CrossRef] [PubMed]
- Summy, J.M.; Gallick, G.E. Src family kinases in tumor progression and metastasis. Cancer Metastasis Rev. 2003, 22, 337–358. [Google Scholar] [CrossRef] [PubMed]
- Hughes, V.S.; Siemann, D.W. Treatment with Src inhibitor Dasatinib results in elevated metastatic potential in the 4T1 murine mammary carcinoma model. Tumor Microenviron. 2018, 1, 30–36. [Google Scholar] [CrossRef] [PubMed]
- Araujo, J.; Logothetis, C. Dasatinib: A potent SRC inhibitor in clinical development for the treatment of solid tumors. Cancer Treat Rev. 2010, 36, 492–500. [Google Scholar] [CrossRef] [PubMed]
- Mukaihara, K.; Tanabe, Y.; Kubota, D.; Akaike, K.; Hayashi, T.; Mogushi, K.; Hosoya, M.; Sato, S.; Kobayashi, E.; Okubo, T.; et al. Cabozantinib and dastinib exert anti-tumor activity in alveolar soft part sarcoma. PLoS ONE 2017, 12, e0185321. [Google Scholar] [CrossRef] [PubMed]
- Talpaz, M.; Shah, N.P.; Kantarjian, H.; Donato, N.; Nicoll, J.; Paquette, R.; Cortes, J.; O’Brien, S.; Nicaise, C.; Bleickardt, E.; et al. Dasatinib in imatinib-resistant Philadelphia chromosome-positive leukemias. N. Engl. J. Med. 2006, 354, 2531–2541. [Google Scholar] [CrossRef]
- Chang, A.Y.; Wang, M. Molecular mechanisms of action and potential biomarkers of growth inhibition of dasatinib (BMS-354825) on hepatocellular carcinoma cells. BMC Cancer 2013, 13, 267. [Google Scholar] [CrossRef]
- Liberti, M.V.; Locasale, J.W. The Warburg effect: How does it benefit cancer cells? Trends Biochem. Sci. 2016, 41, 211–218. [Google Scholar] [CrossRef]
- Wenzel, U.; Nickel, A.; Daniel, H. Increased mitochondrial palmitoylcarnitine/carnitine countertransport by flavone causes oxidative stress and apoptosis in colon cancer cells. Cell Mol. Life Sci. 2005, 62, 3100–3105. [Google Scholar] [CrossRef]
- Al-Bakheit, A.; Traka, M.; Saha, S.; Mithen, R.; Melchini, A. Accumulation of palmitoylcarnitine and its effect on pro-inflammatory pathways and calcium influx in prostate cancer. Prostate 2016, 76, 1326–1337. [Google Scholar] [CrossRef]
- Chen, X.; Niu, J.; Wang, J.; Zhao, W. Effects of L-carnitine supplementation in high-fat diet on growth, antioxidant capacity and lipid metabolism of Golden Pompano (Trachinotus ovatus). Front. Mar. Sci. 2022, 9, 831153. [Google Scholar] [CrossRef]
- Harpaz, S. l-Carnitine and its attributed functions in fish culture and nutrition—A review. Aquaculture 2005, 249, 3–21. [Google Scholar] [CrossRef]
- Wenzel, U.; Nickel, A.; Daniel, H. Increased carnitine-dependent fatty acid uptake into mitochondria of human colon cancer cells induces apoptosis. J. Nutr. 2005, 135, 1510–1514. [Google Scholar] [CrossRef] [PubMed]
- Turnbull, P.C.; Hughes, M.C.; Perry, C.G.R. The fatty acid derivative palmitoylcarnitine abrogates colorectal cancer cell survival by depleting glutathione. Am. J. Physiol. Cell Physiol. 2019, 317, C1278–C1288. [Google Scholar] [CrossRef] [PubMed]
- Ayyanathan, K.; Kesaraju, S.; Dawson-Scully, K.; Weissbach, H. Combination of sulindac and dichloroacetate kills cancer cells via oxidative damage. PLoS ONE 2012, 7, e39949. [Google Scholar] [CrossRef] [PubMed]
- Galvez, L.; Rusz, M.; Schwaiger-Haber, M.; Abiead, Y.E.; Hermann, G.; Jungwirth, U.; Berger, W.; Keppler, B.K.; Jakupec, M.A.; Koellensperger, G. Preclinical studies on metal based anticancer drugs as enabled by integrated metallomics and metabolomics. Metallomics 2019, 11, 1716–1728. [Google Scholar] [CrossRef]
- Ziegler, H.J.; Bruckner, P.; Binon, F. O-acylation of dl-carnitine chloride. J. Org. Chem. 1967, 32, 3989–3991. [Google Scholar] [CrossRef]
- Zhao, L.; Au, J.L.; Wientjes, M.G. Comparison of methods for evaluating drug-drug interaction. Front. Biosci. 2010, 2, 241–249. [Google Scholar]
- Calvo, E.; Bolos, V.; Grande, E. Multiple roles and therapeutic implications of Akt signaling in cancer. Onco. Targets Ther. 2009, 2, 135–150. [Google Scholar]
- Geis, T.; Döring, C.; Popp, R.; Grossmann, N.; Fleming, I.; Hansmann, M.-L.; Dehne, N.; Brüne, B. HIF-2alpha-dependent PAI-1 induction contributes to angiogenesis in hepatocellular carcinoma. Exp. Cell Res. 2015, 331, 46–57. [Google Scholar] [CrossRef] [PubMed]
- Wang, D.; Yang, C.; Wang, Z.; Yang, Y.; Li, D.; Ding, X.; Xu, W.; Zheng, Q. Norcantharidin combined with Coix seed oil synergistically induces apoptosis and inhibits hepatocellular carcinoma growth by downregulating regulatory T cells accumulation. Sci. Rep. 2017, 7, 9373. [Google Scholar] [CrossRef] [PubMed]
- Huang, L.; Liu, Q.; Chen, S.; Shao, Z. Cisplatin versus carboplatin in combination with paclitaxel as neoadjuvant regimen for triple negative breast cancer. Onco. Targets Ther. 2017, 10, 5739–5744. [Google Scholar] [CrossRef] [PubMed]
- Xiao, J.; Xu, M.; Hou, T.; Huang, Y.; Yang, C.; Li, J. Dasatinib enhances antitumor activity of paclitaxel in ovarian cancer through Src signaling. Mol. Med. Rep. 2015, 12, 3249–3256. [Google Scholar] [CrossRef] [PubMed]
- Zhu, Y.; Pan, L.; Hong, M.; Liu, W.; Qiao, C.; Li, J.; Qian, S. The combination therapy of imatinib and dasatinib achieves long-term molecular response in two imatinib-resistant and dasatinibintolerant patients with advanced chronic myeloid leukemia. J. Biomed. Res. 2016, 30, 525–528. [Google Scholar] [PubMed]
- Elimrani, I.; Dionne, S.; Saragosti, D.; Qureshi, I.; Levy, E.; Delvin, E.; Seidman, E.G. Acetylcarnitine potentiates the anticarcinogenic effects of butyrate on SW480 colon cancer cells. Int. J. Oncol. 2015, 47, 755–763. [Google Scholar] [CrossRef] [PubMed]
- Franken, N.A.P.; Rodermond, H.M.; Stap, J.; Haveman, J.; van Bree, C. Clonogenic assay of cells in vitro. Nat. Protoc. 2006, 1, 2315–2319. [Google Scholar] [CrossRef]
- Le, X.-F.; Mao, W.; Lu, Z.; Carter, B.Z.; Bast, R.C., Jr. Dasatinib induces autophagic cell death in human ovarian cancer. Cancer 2010, 116, 4980–4990. [Google Scholar] [CrossRef]
- Schwab, M.; Reynders, V.; Steinhilber, D.; Stein, J. Combined treatment of Caco-2 cells with butyrate and mesalazine inhibits cell proliferation and reduces Survivin protein level. Cancer Lett. 2009, 273, 98–106. [Google Scholar] [CrossRef]
- Shen, B.; He, P.J.; Shao, C.L. Norcantharidin induced DU145 cell apoptosis through ROS-mediated mitochondrial dysfunction and energy depletion. PLoS ONE 2013, 8, e84610. [Google Scholar]
- Mayer, E.L.; Krop, I.E. Advances in targeting SRC in the treatment of breast cancer and other solid malignancies. Clin. Cancer Res. 2010, 16, 3526–3532. [Google Scholar] [CrossRef] [PubMed]
- Kopetz, S.; Lesslie, D.P.; Dallas, N.A.; Park, S.I.; Johnson, M.; Parikh, N.U.; Kim, M.P.; Abbruzzese, J.L.; Ellis, L.M.; Chandra, J.; et al. Synergistic activity of the SRC family kinase inhibitor dasatinib and oxaliplatin in colon carcinoma cells is mediated by oxidative stress. Cancer Res. 2009, 69, 3842–3849. [Google Scholar] [CrossRef] [PubMed]
- Araujo, J.C.; Trudel, G.C.; Saad, F.; Armstrong, A.J.; Yu, E.Y.; Bellmunt, J.; Wilding, G.; McCaffrey, J.; Serrano, S.V.; Matveev, V.B.; et al. Docetaxel and dasatinib or placebo in men with metastatic castration-resistant prostate cancer (READY): A randomised, double-blind phase 3 trial. Lancet Oncol. 2013, 14, 1307–1316. [Google Scholar] [CrossRef]
Publisher’s Note: MDPI stays neutral with regard to jurisdictional claims in published maps and institutional affiliations. |
© 2022 by the authors. Licensee MDPI, Basel, Switzerland. This article is an open access article distributed under the terms and conditions of the Creative Commons Attribution (CC BY) license (https://creativecommons.org/licenses/by/4.0/).