Abstract
This work aims to develop bio-based and biodegradable materials for active food packaging purposes by comparing the properties of avocado seed flour (ASF) and avocado extracted starch (AES). A 36.4% dry basis yield is obtained for the extracted AES from ASF. ASF presents a higher crystallinity, and SEM images show a mixture of starch granules and other materials, whereas AES presents lower ash, protein, and lipid content relative to ASF. To make a comparison between the two, ASF or AES are mixed with glycerol at different concentrations, then twin-screw extruded and injection-molded to develop thermoplastic starch-based materials. The morphological, mechanical, barrier, antioxidant, antimicrobial, and disintegrability properties are evaluated to compare their different compositions. ASF-based films exhibit better barrier properties and a 134% higher intrinsic antioxidant capacity. Conversely, the homogenous nature of AES-based materials results in better interactions with the plasticizer, allowing a wide range of mechanical properties. Moreover, cinnamon essential oil (CEO) was incorporated into the preferred compositions of both ASF and AES to improve antimicrobial properties. Adding a 5% concentration of CEO to samples was sufficient to completely inhibit the growth of P. expansum. These results support waste valorization for developing active packaging materials with high antioxidant and antimicrobial properties without competing for resources with the food industry.
1. Introduction
The growing environmental impact of conventional plastics has accelerated the search for sustainable alternatives in food packaging. Biopolymers derived from renewable sources, particularly polysaccharides, represent a promising option due to their biodegradability and potential functional properties. At the same time, the food industry generates large amounts of agro-industrial residues that remain underutilized despite being rich in valuable biopolymers and bioactive compounds. In this context, avocado seeds offer an interesting and abundant raw material for the development of biodegradable packaging. The present study aims to valorize this waste stream by formulating starch-based films plasticized with glycerol and enriched with cinnamon essential oil, thereby addressing both the challenge of agro-food waste management and the urgent need to reduce reliance on petroleum-based plastics.
The ever-increasing demand for food and feed has led to substantial losses, waste, and discards in agricultural and food supply chains, resulting in significant environmental issues. These plant materials are prone to microbial spoilage, cause odors, emit greenhouse gases, and contaminate the environment [1]. While the disposal or treatment of waste is costly for food industries, efficient use can create opportunities to add value to agro-industrial byproducts. Bioactive compounds such as polysaccharides, proteins, flavor components, dietary fibers, and phytochemicals may be abundantly found in agricultural processing by-products like skins, pomace, seeds, leaves, gums, and extracts, among others [2]. The European Commission is adopting circular economy approaches to complete product life cycles within industrial systems, seeking to transform low-value by-products into higher-value goods [3]. Strategies that support valorization of food waste include fermentation bioprocessing to alter feedstock compositions, resulting in better nutritional feed [4], bioproduction of renewable and carbon-neutral fuels and chemical products [5], as well as the production of biopolymeric films.
Biopolymeric films, consisting of a combination of biopolymer and plasticizer, offer excellent availability, low cost, and good biodegradability. Starch can be used as a polymeric matrix, filler, or coating due to its film-forming capability, high availability, abundance, biodegradability, low cost, and requirement of the same processing techniques used for traditional polymers, including extrusion and injection molding [6]. Starch extracted from conventional sources (i.e., potatoes, rice, maize, or wheat) has been extensively explored over the past few decades to develop biofilms. Recent studies are now focusing on waste revalorization as a new alternative starch source, including seeds from tamarind [7], pumpkin [8], or durian [9]. Glycerol, a viscous, colorless, and odorless liquid, is the most prevalent plasticizer for bio-based materials. It is non-toxic and commonly produced as a byproduct of biodiesel manufacturing, with widespread use in the pharmaceutical and food sectors [10].
In our previous study [11], avocado seed starch-based films were prepared at a laboratory scale using solvent casting methodology, with avocado starch nanocrystals as reinforcements. The primary disadvantages of the solvent casting process include its batch nature and slow processing, which make industrial-scale production difficult. Additionally, it offers limited control over film thickness and uniformity, and it usually cannot accommodate samples exceeding 100–200 cm2 [12]. Extrusion is a common technique for shaping thermoplastic materials derived from synthetic, semi-synthetic, or natural polymers. When applied to starch, this process involves thermomechanical energy and plasticization that disintegrate its granular and semicrystalline form, transforming it into an amorphous, uniform substance called thermoplastic starch (TPS). In injection molding, the thermoplastic polymer passes through the mold by applying pressure using a pump. In this method, injection pressure and temperature are the key factors that determine the properties of samples [13].
Persea americana Mill., commonly known as avocado, originates from Central America and has become globally popular because of its many health advantages. The elaboration of processed products derived from avocados generates large amounts of byproducts, mainly pulp and seeds, which present interesting opportunities to expand the value chain [14]. Avocado residues are unsuitable for animal feed because they contain elevated levels of polyphenols, which give a bitter flavor and could be toxic if consumed in large quantities [15]. However, the seeds, which comprise 15–16% of the fruit and contain roughly 29% starch, can be repurposed as a starch source [16].
Avocado seeds have been found to possess high antioxidant activity, which is attributed to their high content of flavonoids and phenolic compounds [17]. Antioxidants are interesting for both protecting the polymeric matrix during melt extrusion and developing active packaging materials that can interact with food to enhance its shelf life. Oxidation plays a significant role in the decline of food quality. Particularly, foods high in polyunsaturated fats are prone to oxidation by oxygen molecules, leading to nutritional loss, undesirable flavors, discoloration, and overall deterioration [18].
One approach to prolong the shelf life of food products involves antimicrobial packaging, which incorporates active agents into the packaging material to create a barrier that inhibits microbial growth, either through vapor release or direct contact with the food. Despite the efficiency of synthetic antimicrobial components, concerns over potential health risks associated with them have led to a growing demand for natural antimicrobial alternatives. Essential oils (EOs) can be considered a natural source of antimicrobial compounds that can be integrated into polymeric matrices. Their application as additives may be restricted due to factors such as expensive extraction processes, strong aromatic characteristics, possible toxic effects, and low stability and volatility, which can cause degradation during thermal processing [19]. Despite these limitations, EOs provide additional beneficial properties that can outweigh the drawbacks, including antioxidant capacity and reduced water vapor permeability. Moreover, their volatile nature also enables safe consumption in small concentrations. Cinnamon essential oil (CEO) is classified as Generally Recognized as Safe (GRAS) and has gained great attention for its antimicrobial, antioxidant, and antifungal properties in packaging materials. For example, Xu et al. [20] described the outstanding antimicrobial activity of a chitosan-gum-based solvent-casted film with bark CEO against Staphylococcus aureus and Escherichia coli. There are two types of CEO with clear differences in chemical composition: leaf CEO is predominantly composed of eugenol, while bark CEO is predominantly composed of cinnamaldehyde [18].
Although starch is widely used in developing biodegradable materials because of its availability, renewability, and excellent film-forming ability, its extraction from botanical sources often involves additional energy consumption, the use of solvents or chemicals, and relatively low yields. In particular, avocado seed starch studies typically yield less than 25% [21,22]. An alternative approach is to grind the entire avocado seed into flour, thereby eliminating the need for extraction and maximizing the use of the raw materials. Avocado seed flour contains not only starch but also cellulose, lignin, and other polysaccharides as well as bioactive compounds, which could influence the final material properties.
This study compares the properties of injection-molded samples made from avocado seed flour and extracted starch from avocado seeds. For this, avocado seed flour (ASF) or avocado extracted starch (AES) with varying glycerol concentrations were extruded to create thermoplastic materials for active food packaging. The thermal, morphological, mechanical, barrier, antioxidant, and disintegrability properties were examined to compare how the thermoplastic starch (TPS) behaves depending on the material and plasticizer ratio used. Cinnamon essential oil (CEO) was added in different amounts to the preferred ASF and AES formulations (35 wt. % glycerol) to improve the antimicrobial and antioxidant properties of both materials. Finally, the antimicrobial properties of all the extruded plates were tested and evaluated to identify the optimal formulation.
2. Materials and Methods
Avocado seeds (Persea americana Miller, cv. Hass) were kindly provided by “Grupo La caña” plantation (Malaga, Spain). Vegetable glycerin (USP, 99.5%), zinc acetate dehydrate [Zn(CH3CO2)2·2H2O], 6-hydroxy-2,5,7,8-tetramethylchroman-2-carboxylic acid (Trolox), and Iodine (CAS 7553-56-2) were acquired from Sigma-Aldrich Química S.A. (Madrid, Spain). Potassium iodide was purchased from Quimicen SA (Madrid, Spain), while ethanol, glacial acetic acid, hydrochloric acid and 2,2-diphenyl-1-picrylhydrazyl (DPPH) were obtained from Scharlau (Barcelona, Spain). Potassium hexacyanoferrate (II) trihydrate [K4[Fe(CN]6]·3H2O] was purchased from Carlo Erba Reagents (Sabadell, Spain). Cinnamon essential oil (CEO) was kindly provided by Destilerias Muñoz Gálvez (Murcia, Spain). Avocado seeds were obtained as per consumption standards (food-grade) and the rest of the materials were obtained for laboratory use (analytical grade).
2.1. Avocado Seed Flour and Avocado Extracted Starch Preparation
Avocado Seed Flour (ASF) was prepared by drying the seeds at 58 °C in a ventilated oven for 18 h. The seeds were then ground using an SM 200 Retsch cutting mill (Retsch GmbH, Haan, Germany) equipped with a 2 mm sieve mesh. The resulting ASF was dried in an oven at 40 °C before being stored in sealed bags. Avocado Extracted Starch (AES) was subsequently extracted from ASF. A small quantity of 100 g of ASF was ground in 500 milliliters of distilled water with an IKA Multidrive blender (located in Staufen, Germany). The mixture was then filtered through a mesh sieve with a 50 µm pore size. To purify the starch, it was rinsed with distilled water and subsequently dried via vacuum filtration. Both ASF and AES were stored in airtight bags within a dry environment at room temperature.
2.2. Mold Injection
Formulations of ASF and AES were created using three different glycerol concentrations—25, 35, and 45 wt. %—designated as ASF25, ASF35, ASF45, and AES25, AES35, AES45, respectively. These glycerol concentrations were selected to represent low, medium, and high plasticizer levels commonly reported in TPS films. The samples were produced with a micro compounder Xplore MC15 HT (Xplore Instruments BV, Sittard, The Netherlands, 15 cm3 capacity). The ASF/AES mixtures and the corresponding glycerol amounts were manually combined until uniformity was achieved. This blend was then processed in an extruder for 10 min, with the screw operating at 200 rpm and the temperature set to 110–115–120 °C, from the hopper onward. The intermediate level (35 wt. % glycerol) was chosen as the reference matrix for CEO incorporation at 1, 3, and 5 wt. %. These CEO levels are typical in active packaging studies, where lower amounts may be insufficient and higher levels (>5%) can compromise film integrity and sensory properties. CEO was added inside the extruder using a syringe 90 s before injection to prevent volatilization. Samples were designated as ASF35-C1, ASF35-C3, ASF35-C5, and AES35-C1, AES35-C3, AES35-C5, respectively. The thermoplastic material was directly injected from the extruder using a Micro molder (IM 12) into dog-bone or plate molds. The rectangular injection-molded plates (approx. 3 × 2 cm) were produced in a rectangular cavity. The injector temperature was set to 135 °C and the mold to 45 °C, while the pressure ramp was adjusted based on the flow capacity of the mixture and mold type.
The torque of the drive motor resistance inside the extruder barrel was measured to assess the relative viscosities of polymer melts during the extrusion process. Generally, torque values at the start of the mixing samples displayed a rapid increase, followed by a progressive decrease to a steady value. The highest initial torque corresponded to ASF25 and AES25 (8–9 N·m), followed by the 35 wt. % glycerol formulations (6–7 N·m), and finally, ASF45 and AES45 (2–3 N·m). As expected, this decrease in torque with increasing glycerol concentrations is related to the plasticizer’s ability to reduce friction between starch granules, as reported by Otarola et al. [23]. The essential oil was added 90 s before opening the extruder, which resulted in a torque drop proportional to the concentration, from a 35% drop for AES35-C1 to 55% for AES35-C5.
After injection, the AES and ASF dog-bone formulations used for mechanical characterization exhibited a smooth surface and a brown aspect. Increasing the concentration of glycerol did not result in sticky plates. However, AES45 dog-bones started to whiten their surface two weeks after extrusion, which could indicate excessive plasticizer and subsequent leaching. On the other hand, the squared plates presented a lighter brown color compared to the dog-bones due to their lower thickness, as seen in Figure 1. Moreover, AES-based plates with a higher glycerol content (AES45) presented an even lighter brown to dark orange aspect. Other researchers have highlighted how the yellow color of the CEO led to a significant increase in the yellowness of transparent starch films [24]. However, due to the dark color of avocado starch, plates containing CEO were visually similar to their neat counterparts, with no apparent difference.
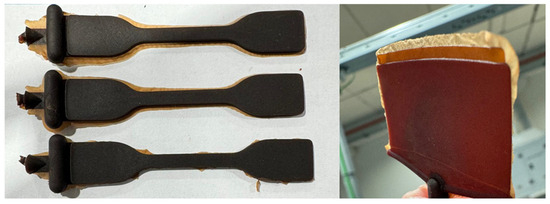
Figure 1.
Visual comparison between dog-bones and squared plates of AES45.
2.3. Avocado Seed Flour, Starch and CEO Characterization
The composition of ASF and AES was estimated using various characterization techniques. Starch content was determined following Ewers polarimetric method according to ISO 10520:1997 [25]. Each sample was measured in duplicate with ten scans per run, using a sodium lamp (589 nm) and a 100 mm path-length cell in a JASCO 2000 Polarimeter (Jasco Deutschland GmbH, Pfungstadt, Germany). The instrument automatically calculated the Specific Optical Rotation (O.R.) based on the known concentration (2.1% m/v). The Specific O.R. of starch was considered 184°.
The total ash content was calculated following the Analytical Standards of Instituto Adolfo Lutz [26], according to:
The protein content of AES and ASF was estimated using the nitrogen content of the samples (%, dry weight) through elemental analysis. The protein content was determined by multiplying the total nitrogen value by the factor 6.25 (the nitrogen converter) [22].
Total lipids were thoroughly extracted using hexane in a Soxhlet setup, following the method described by Manirakiza et al. [27].
The estimated amount of carbohydrates in the sample was calculated by subtracting the combined percentages of moisture, ash, protein, and lipids from 100% [22], corresponding to:
The proportion of amylose-amylopectin within the starch was measured using the total amylose content method [28]. A brief overview: starch was first placed in a cellulose extraction thimble within a Soxhlet extractor. Lipid removal was carried out by heating 200 mL of a 75% (v/v) n-propanol-water mixture at 110 °C for 24 h. The lipid-free starch was then air-dried for 12 h before being placed in an oven set at 37 °C for another 24 h. For analysis, triplicate samples of 20 mg dried starch were dissolved in 8 mL of a 90% DMSO-water solution and heated at 85 °C for 15 min with occasional mixing. These samples were then diluted to 25 mL with deionized water, with 1 mL of this solution further diluted with 50 mL of diluent containing 5 mL of iodine solution. Additionally, standard mixtures consisting of pure amylose and amylopectin at varying ratios (0%, 10%, 20%, 40%, 50%, 60%, 80%, 90%, and 100% amylose) were prepared at 20 mg each. The absorbance of all samples and standards was measured at 600 nm using a UV-Vis Cary 1E spectrophotometer, with a reagent blank serving as the reference.
The analytical determination of compounds in ASF, AES and CEO was carried out using a Hewlett-Packard 6890 HRGC gas chromatograph equipped with an Agilent Technologies mass spectrometry detector model 5973 (GC-MS) (Santa Clara, CA, USA). The compounds were separated on a DB5-HT capillary column (15 m × 250 µm and 0.1 µm), using helium with a flow rate of 1 mL/min as the carrier gas. The mass spectrometry analysis employed an electron impact ionization at 70 eV. Samples, each weighing 50 mg, were extracted using dichloromethane at a temperature of 40 °C over 24 h. After solvent evaporation to dryness, the extracts underwent GC-MS analysis. Compound identification was performed by comparing their mass spectra to the NIST20 library (developed by the US National Institute of Standards and Technology in Gaithersburg, MD, USA), considering a match score exceeding 900.
The structure of ASF and AES granules was examined through field emission scanning electron microscopy (FE-SEM) (Hitachi S8000, Hitachi Co., Tokyo, Japan), utilizing an accelerating voltage of 30 kV and a working distance of 8 mm.
The chemical structures of ASF and AES were studied using Fourier transform infrared (FTIR) spectroscopy, with a Spectrum One FTIR spectrometer (PerkinElmer Instruments, Madrid, Spain). Samples were analyzed at room temperature in the spectral range of 400–4000 cm−1 at a resolution of 4 cm−1.
The crystal structure was examined utilizing a Bruker D8 Advance apparatus equipped with a CuK radiation source (wavelength 0.154 nm) and a Vantec1 detector. The measurement conditions included an X-ray wavelength of 1.5406 Å, with the instrument operated at 40 kV and 40 mA. Samples were placed on an aluminum holder, and X-ray diffraction patterns were collected over the 2θ range from 0° to 60°, at a scanning speed of 0.02° per second. The crystallinity index (Xc) was calculated based on the methodology outlined by Hulleman et al. [29]:
Hc and Ha represent the intensities corresponding to the crystalline and amorphous phases, respectively, with typical baseline values observed at 2θ angles between 17° and 18°.
Thermal stability assessments were conducted utilizing a TGA Q500 analyzer(TA Instruments, Madrid, Spain). Approximately 10 mg of samples were subjected to heating from 30 °C to 800 °C at a rate of 10 °C/min under either nitrogen or oxygen atmospheres. The temperature corresponding to maximum degradation (Tmax) was derived from the first derivative of the thermogravimetric curves.
2.4. Sample Characterization
The microstructure of the plates was studied by taking pictures of the cryo-fractured cross-sections using a FE-SEM (Hitachi S8000, Hitachi Co., Tokyo, Japan), with an accelerating voltage of 30 kV and a working distance of 8 mm.
Tensile testing was carried out following the guidelines specified in the standard test procedure ISO 527 [30]. The tests were performed using injected dog-bone “1BA” type (75 mm × 10 mm × 5 mm) samples in an Instron Universal Machine (Barcelona, Spain), with a cell load of 100 N and a crosshead speed of 10 mm/min. A minimum of five dog-bone samples per formulation were analyzed to calculate the mean values of their respective Young’s modulus (E), tensile strength (σ), and elongation (ε) at break, along with standard deviations.
Statistical analysis of significant differences among formulations was performed using two-way analysis of variance (ANOVA) with OriginPro 2023 software, applying Tukey’s test at a 95% confidence level. For each studied property, a p-value lower than 0.05 indicates that the formulation has a statistically significant effect on that property, meaning that at least one group mean differs significantly from the others. Two-way analyses were carried out to determine the influence of the material, glycerol concentration and their interaction. The same methodology was used to study the interaction between material and CEO content.
Dynamical mechanical thermal analysis (DMTA) was performed utilizing a DMA instrument (Mettler-Toledo, Columbus, OH, USA) operating in clamp tension mode. The tests were carried out at various frequencies of 0.5, 1, 3, and 10 Hz, with a steady amplitude of 15 μm and a normal force maintained at ±2 N. Temperature variation was recorded from −80 °C to 130 °C at a heating rate of 2 °C per minute. The specimens measured approximately 15.0 mm in length, 5.0 mm in width, and 0.5 mm in thickness. The apparent activation energy (Ea) was calculated based on the Arrhenius equation, utilizing time-temperature superposition principles, by overlaying the tan δ peaks recorded across different frequencies [31]. The temperature dependence of the frequency of excitation can be expressed as:
Rephrasing this equation enables plotting the natural logarithm of frequency (ln f) versus the reciprocal of temperature (1/T), based on the identified peak maxima. The activation energy (Ea) can then be calculated by multiplying the slope of the resulting straight line by the universal gas constant (R = 8.314 × 10⁻³ kJ mol−1 K−1).
Water vapor permeability (WVP) was assessed at room temperature (23 °C) and 50% relative humidity (RH), using a Permatran-W Model 3/34 G and adhering to ASTM F1249-20 [26]. The water vapor permeability (WVP) was determined according to:
where ε represents the thickness of the plate, S denotes the saturation vapor pressure of water at 23 °C (21.068 mmHg), and R1 (50%) and R2 (0%) indicate the relative humidity on both sides of the plates.
The law requires that packaging materials designed for storing food at room temperature—specifically between 20 °C and 40 °C for a maximum of 30 days—must undergo testing by exposure to a food simulant at 40 °C for 10 days. This procedure is particularly intended for fatty foods, using a fatty food simulant (Simulant D1 = ethanol 50% v/v). In order to perform double-sided total immersion migration experiments, two 15 × 15 mm plate samples were completely submerged in 7.5 mL of Simulant D1 in a glass vial at 40 °C for 10 days [32]. All samples were tested in triplicate, and simulant D1 was utilized as a control and ran concurrently with the migration test. After 10 days, the plate samples were taken out, and the absorbance of the D1 simulant was assessed following a 15 min exposure to 2,2-diphenyl-1-picrylhydrazyl (DPPH) radicals at a concentration of 2 mM in ethanol. The measurement was performed at a wavelength of 526 nm using a UV-Vis Cary 1E spectrophotometer from Varian. The decrease in the absorbance due to the antioxidant capacity of the samples was used to estimate the radical scavenging activity (RSA).
where Acontrol is the absorbance of DPPH radical in simulant D1 and Asample is the absorbance of DPPH solution after 15 min in contact with each food simulant sample after 10 contact days with the samples. The quantification was determined using a calibration curve of Trolox standards (y = −0.093x + 1.007, R2 = 0.9955), and the antioxidant activity of the films was calculated based on a linear regression equation, then expressed as mmol of Trolox equivalents (TAE) per gram.
Samples were dissolved in a water/ethanol mixture, filtered through 0.45 µm PTFE syringe filters, and 9 µL were injected into a reverse-phase HPLC–MS system. Chromatographic separation was performed on a Waters Alliance e2695 Separations Module (Waters Cromatografía, SA; Barcelona, Spain) equipped with a Waters 2998 photodiode array detector and coupled to a Waters Acquity QDa single quadrupole mass spectrometer.
The separation was carried out using a Waters SunFire C18 RP VanGuard Cartridge (2.1 mm × 5 mm, pre-column) in line with a Waters SunFire C18 RP analytical column (2.1 mm × 50 mm), operating at a flow rate of 0.35 mL/min. The elution was achieved with a 10 min linear gradient from 2% to 95% solvent A–B (solvent A: acetonitrile; solvent B: water), supplemented with a fixed 5% of solvent C (2% formic acid in water), resulting in a final concentration of 0.1% formic acid throughout the gradient. +Detection was performed by PDA in the range of 190–700 nm (spectral resolution: 1.2 nm), and by MS using an electrospray ionization (ESI) interface operated in both positive and negative modes. The capillary voltage was set at 0.8 kV, with cone voltages of 20 V and 40 V, a probe temperature of 600 °C, and a source temperature of 120 °C. Mass spectra were acquired in full scan mode over an m/z range of 85–1250, with automated resolution control at 0.7 Da.
Penicillium expansum cultures obtained from Spanish type culture collection (CECT) were grown on Potato Dextrose Agar (PDA) plates for a period of seven days at 26 °C. To prepare a conidial suspension, the surface of the PDA plates was covered with sterile peptone water containing 0.05% (v/v) Tween 80, and then gently scraped with a Drigalski spatula to release the conidia. A 1 mL aliquot of this suspension was transferred into sterile tubes and mixed thoroughly to ensure uniformity. Serial dilutions were performed to reach a concentration of 106 spores/mL. Spore enumeration was carried out using the improved Neubauer counting chamber with a Bright-Line Hemacytometer (Hausser Scientific, Horsham, PA, USA).
The antifungal effects of CEO were tested in vitro through the vapor phase disc diffusion method. The minimum fungicidal concentration (MFC) was identified as the quantity of CEO required on each plate to completely halt the growth of P. expansum after a 10-day incubation period. To perform this test, different volumes of CEO (0.5, 1, 2.5, 5, 10, and 20 μL) were applied onto sterile paper discs of 50 mm diameter, which were then positioned on the lids of PDA Petri dishes. These dishes were inoculated at three equidistant points with 3 μL of a conidia suspension containing 106 spores/mL and sealed with Parafilm to contain volatile compounds. Control samples used sterile paper discs without CEO. All plates were incubated at 26 °C for seven days, after which the discs were removed, and incubation continued for three more days. The colony diameter of P. expansum was measured to evaluate radial mycelial growth and compared against the control. Each experimental setup was performed in triplicate.
Thereafter, the antifungal activity of CEO-containing samples was assessed using the micro-atmosphere method, wherein the fungal culture of P. expansum was exposed to the volatile compounds released by the plates. To perform this, 3 μL of a conidial suspension containing 106 spores/mL was inoculated at three equidistant points on sterile PDA plates. Three rectangular plates (3 cm × 2 cm) were fixed to the inner surface of the Petri dish lid, which was then placed over the inoculated plate and sealed with Parafilm. The control experiments were conducted using empty PDA plates. The plates were incubated at 26 °C for 10 days. After 7 days of incubation, the samples were removed to assess any residual fungicidal effect over an additional 3-day incubation period. Fungal growth was evaluated by measuring the colony diameter at 7 and 10 days post-inoculation, and calculating the percentage of growth inhibition relative to the control. All samples were performed in triplicate.
The biodegradability of the disposable plates was assessed through a disintegration assay in accordance with the ISO 20200 standard. Samples measuring 20 × 20 mm2 were dried, weighed (M0) with an analytical balance (precision ±0.1 mg), and then enclosed in mesh bags. These bags were subsequently placed into plastic reactors filled with 1 kg of synthetic soil. The soil mixture comprised about 40% sawdust, 30% rabbit feed, 10% compost, 10% corn starch, 5% sugar, 4% corn oil, and 1% urea. Deionized water was added until the total moisture content reached 55%. To facilitate aerobic conditions, two small holes with a 5 mm diameter were punctured on opposite sides of each reactor. The reactors were placed in the oven at 58 ± 5 °C to ensure thermophilic conditions. As specified in ISO 20200 [33], the reactors were weighed, and water was added to keep the compost wet and stirred throughout the testing period. Samples were removed from the reactor at different control times (t) after 1, 3, 7, 14, 30, 50, 70 and 90 days, dried at 40 °C for 24 h, and weighed (Mt). The disintegration percentage was determined according to:
3. Results
3.1. Seed Flour, Extracted Starch and CEO Characterization
The grounded ASF powder presents a dark orange/brown color. Most authors [34,35] have linked the brown color with the presence of phenolic compounds. AES powder exhibits a pale brown color with a smoother texture. This whitening tendency has been frequently described when comparing AES with ASF and could be due to a lower concentration of antioxidants after extraction. The AES extraction yield was estimated at 36.4 ± 1.5% on a dry basis from the dried ASF powder, similar to other studies [36].
The composition of ASF and AES was estimated using various characterization techniques, as seen in Table 1. The starch content of the ASF was estimated to be approximately 27.7% (dry basis), while AES reached a purity of around 75.2%. These values indicate that although the raw seed flour contains a moderate proportion of starch, the extraction process substantially enriches the starch fraction, resulting in a material with characteristics closer to those of commercial starches. Moreover, the isolated starch (AES) exhibits a reduction in lipid, ash, and protein content, validating the extraction process and highlighting the potential of avocado seeds as a source of high-purity starch. Starch content in ASF was lower than the 44.0% reported in another study using the polarimetric method [37]. The remaining carbohydrate content of ASF is most likely cellulose and hemicelluloses, as described by Diana et al. [38]. De Dios-Avila et al. [39] also observed decreases in ash, protein and lipid content when comparing the composition of ASF and AES, and also reported a similar amylose content. It is important to highlight that variability in composition can be influenced by the variety of avocados and their ripening stage [40].

Table 1.
Composition of ASF and AES.
The GC–MS analysis of ASF/AES allowed the identification of a series of characteristic compounds common in both materials, as shown in Table 2. Several furan derivatives were detected (such as avocadenofuran, avocadynofuran, and (E)-avocadienofuran), along with fatty acids and their esters (e.g., n-hexadecanoic acid and 7,10,13-eicosatrienoic acid, methyl ester). More complex oxygenated molecules were also observed, including avocadene acetate and 1,2-dihydroxyheptadec-16-yn-4-yl acetate in different forms. In the later eluting fraction, higher molecular weight metabolites were identified, such as lobophorone E, long-chain polyunsaturated fatty acids, and bioactive compounds including vitamin E (tocopherol) and the phytosterols campesterol and β-sitosterol. Overall, the obtained profile reveals a composition rich in lipids, furans, and sterols, consistent with other studies of avocado seeds [41,42]. As a consequence of the variety of bioactive compounds present, ASF has been reported to have antioxidant, antimicrobial, antihypertensive, fungicidal, larvicidal, hypolipidemic, amoebicidal and giardicidal activities [43].
Table 2.
Proposed compounds of avocado seed flour and starch identified using GC-MS analysis. Rt: experimental retention time calculated from the elution times of the identified compounds.
GC-MS analysis of the CEO was performed to determine its composition, as shown in Table 3. Cinnamaldehyde was found to be the main bioactive compound (81.0%), along with D-Limonene (3.5%), Copaene (3.3%), Linalool (2.1%) and α-Pinene (1.6%). The profile of CEO is well-known, with abundant literature data documenting its marker compounds. However, the composition and characteristics of essential oils (EOs) differ depending on various elements such as the plant’s phenotype, soil and climate conditions, how the plants are harvested, storage practices, as well as the methods used for processing and extraction [44].
Table 3.
GC–MS analysis of cinnamon essential oil (CEO) using NIST library. Rt: experimental retention time calculated from the elution times of the identified compounds.
FE-SEM micrographs were used to study the morphology of ASF and AES, as shown in Figure 2. ASF exhibited starch granules alongside large fiber structures. These fibers are lignin–cellulosic materials characterized by their roughness. FE-SEM images reveal that the starch extraction treatment effectively eliminates most impurities while preserving the integrity of the granule. AES exhibited lenticular, spherical, and non-conventional pear-like shape granular morphologies with apparently smooth surfaces, and sizes ranging from 3 to 37 μm. The length and width distribution of the AES granules was obtained from Figure 2. Their mean length is 14.8 ± 6.3 μm, while the mean width is 10.0 ± 3.0 μm. Builders et al. [21] reported a comparable binomial distribution in the size of their Miller variety AES granules.
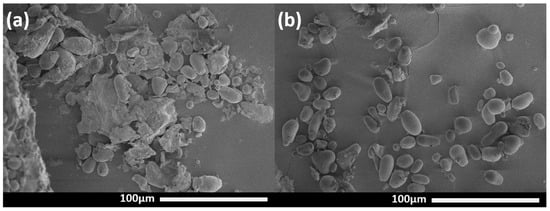
Figure 2.
FE-SEM images of avocado seed: (a) flour and (b) extracted starch granules.
The FTIR spectra displayed in Figure 3 include ASF, AES, glycerol, and CEO. The starch spectrum features two distinctive regions: the fingerprint area, which encompasses the -OH and -CH stretching vibrations of glucose units within the range of 3650–3000 cm−1, and the carbohydrate vibration region between 1200 and 800 cm−1 [45]. The spectral bands observed at 1047 cm−1 and 1022 cm−1 are associated with crystalline (amylopectin) and amorphous (amylose) regions, respectively. Nearby secondary peaks at 1077 cm−1 and 1148 cm−1 correspond to C–O–(H) and C–O–C bond vibrations within polysaccharides. Additionally, the absorption at 1362 cm−1 and 1465 cm−1 is linked to O-H bending vibrations on the plane in glucose units, while the band at 931 cm−1 reflects O-H out-of-plane bending vibrations.
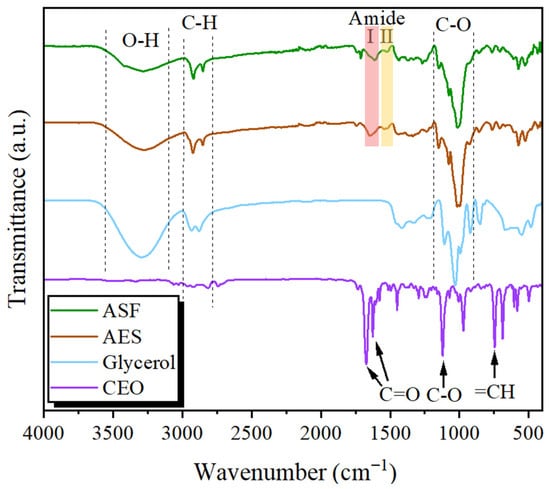
Figure 3.
FTIR spectra of avocado seed flour, extracted starch, glycerol and cinnamon oil.
The ASF spectrum presents additional signals associated with lignin, including the peak at 1438 cm−1 (C–H deformation), and the peaks at 1520 and 1610 cm−1 (aromatic bonds) [46]. The prominent peak observed at 1740 cm−1 corresponds to ester linkages present in the carboxylic groups and ferulic acid derived from hemicellulose or lignin, as well as acetyl and uronic ester groups associated with hemicellulose [47]. The peaks observed in the 3000–3600 cm−1 range are due to the -OH groups involved in hydrogen bonding, which are present in phenols and alcohols within lignin and cellulose [48]. All these changes between FTIR spectra demonstrate the reduction in cellulose and lignin content in AES. However, bands for amide I at 1642 cm−1 and amide II at 1543 cm−1 can be detected in both ASF and AES samples [36], indicating that the starch extraction process partially removed the protein content, as confirmed previously in the AES composition results.
FTIR spectroscopy was employed to determine the functional groups in CEO. The spectral peaks near 1671 cm−1 and 1626 cm−1 are indicative of aldehyde carbonyl (C=O) stretching vibrations, suggesting a significant presence of cinnamaldehyde and aldehyde compounds. Additional peaks included a band at 683 cm−1 representing alkane vibrations, a 745 cm−1 peak associated with =CH groups in benzene rings, and a 970 cm−1 signal corresponding to C-H bonds. The spectrum also showed a band at 1120 cm−1 for C-O and C-OH bonds, a range between 1235 and 1250 cm−1 related to C-O-C linkages in aromatic acid esters and phenolic groups, and a peak at 1294 cm−1 attributed to alkane -CH2 stretching. Further signals included an alcohol C-OH stretch at 1448 cm−1, aromatic C=C bonds spanning 1450–1626 cm−1, a peak at 1575 cm−1 for aromatic C=C bonds, a C-H stretching mode of carbonyl groups at 2814 cm−1, additional C-H bonds at 2925 cm−1, and aromatic C-H stretching at 3026 cm−1 [49]. The FTIR spectra confirmed that CEO is rich in phenolic and aromatic compounds, particularly cinnamaldehyde, which matches the previous GC-MS analysis.
The TGA analysis of ASF and AES presents a comparable behavior, with three main areas of weight loss, as shown in Figure 4. The first step occurs at temperatures below 200 °C, resulting from the elimination of moisture and dehydration of polysaccharides, which is slightly higher in AES. The second (200–400 °C) primarily describes the degradation of the polysaccharides. The AES main step occurs at 300–330 °C, while ASF presents a wider range (250–340 °C) due to the presence of proteins, cellulose and hemicellulose. The last stage, occurring above 350 °C, involves the gradual carbonization of the solid component along with the thermal breakdown and volatilization of heavy tars. When comparing both samples, ASF presents a lower moisture content, lower Tmax and higher residue at 600 °C, as seen in Table 4, and in accordance with Sánches et al. [46] values for their ASF. In the TGA carried out under an O2 atmosphere, AES presents a complete degradation at 600 °C, while ASF had a 3.12% residue, as shown in Figure S1.
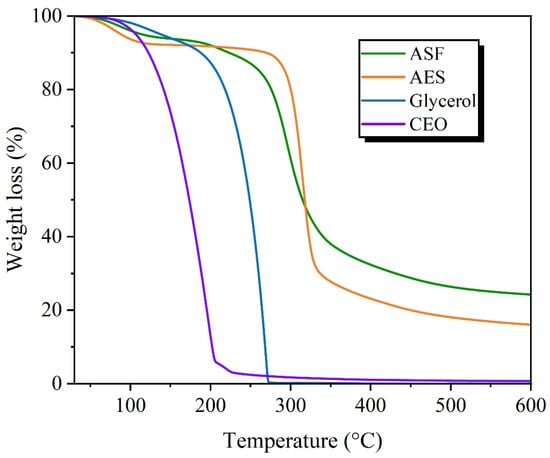
Figure 4.
TGA of avocado seed flour and starch, glycerol and cinnamon essential oil.
Table 4.
TGA properties of avocado seed flour, extracted starch and extruded plates.
3.2. Extruded Materials Characterization
The morphology of the cryogenic fractured surfaces of the plates was observed by FE-SEM, as seen in Figure 5. Generally, all the samples present a smooth and homogeneous surface, in some cases with some dispersed small voids or cavities. This indicates a compact and well-plasticized material. No significant visual differences were perceived between the ASF- and AES-based plates, meaning no big particles or fibers of ASF remained after extrusion.
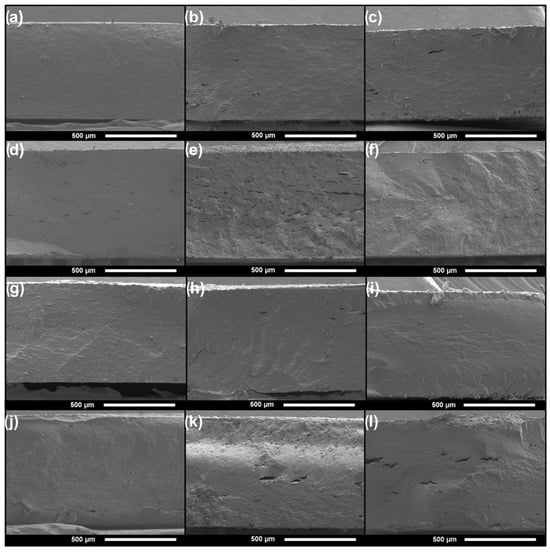
Figure 5.
FE-SEM micrographs of the fractured surfaces of the extruded plates: (a) ASF25, (b) ASF35, (c) ASF45, (d) ASF35C1, (e) ASF35C3, (f) ASF35C5, (g) AES25, (h) AES35, AND (i) AES45, (j) AES35C1, (k) AES35C3 and (l) AES35C5.
The incorporation of CEO into the films does not alter the homogenous cross-section of the plates. Moreover, EOs usually have a plasticizing effect, reducing polymer–polymer interactions. However, higher CEO concentration leads to a slight increase in the formation of voids within the polymer matrix, as seen in ASF35C3 or AES35C5. Other authors have described the appearance of similar voids. Silveira et al. [50] explain that cavities are a result of the formation of stable microemulsions within the starch-casted films, while López-Terán et al. [51] attribute them to the volatilization of the excess EO that does not interact with the extruded TPS, mainly during processing.
The FTIR spectra of the plates remain similar to those of their unplasticized source, with some minor changes, as shown in Figure 6. Compared to native ASF/AES, the films show a broader –OH absorption band at ~3280 cm−1, attributed to glycerol. Extrusion heat and shear enhance starch chain mobility and plasticizer diffusion, disrupting starch hydrogen bonds and forming new ones with glycerol [52]. This plasticization of the matrix significantly influences the mechanical and barrier properties of the films. Spectra based on ASF exhibit additional minor peaks within the broad absorption 3000–3600 cm−1 range. These are usually linked to –OH groups involved in hydrogen bonding with phenols and alcohols present in lignin and cellulose, as well as their interactions with glycerol and water. Similarly, a shift in the characteristic absorption bands in the 1150–950 cm−1 region is observed as a result of the plasticization. This shift indicates the formation of more stable bonds and stronger interactions between the hydroxyl groups of ASF/AES and the plasticizer, surpassing the strength of the intramolecular and intermolecular hydrogen bonds present in the native material [53]. As a result, the plasticization of AES causes a decrease in the 990/1020 ratio in AES25, which further diminishes with increasing glycerol and CEO concentrations. In contrast, this trend is reversed in the ASF-based spectra, where the 990/1020 ratio increases with higher glycerol content but continues to decrease with increasing CEO concentration. Moreover, the ASF-based spectra present additional peaks at 1026, 992 and 888 cm−1, which also vary with the plasticizer and CEO concentration.
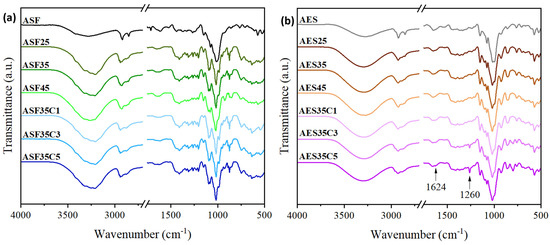
Figure 6.
FTIR spectra of avocado seed (a) flour-based and (b) extracted starch-based injected plates with different concentrations of glycerol and cinnamon essential oil.
In AES35C3 and AES35C5, some signals corresponding to the CEO spectra become more pronounced as the concentration of CEO increases. A distinct peak at 1260 cm−1 is observed, previously attributed to the C-O-C bond in aromatic acid esters and C-OH groups in phenolic compounds. Additionally, a smaller peak at 1624 cm−1 is detected, which corresponds to the stretching vibrations of the aldehyde carbonyl group in cinnamaldehyde.
The thermogravimetric analyses (TGA) of the ASF, AES, and extruded samples are shown in Figure S2, while Table 4 compiles the main TGA parameters derived from these analyses. ASF-/AES-based plates depict akin behavior. In general, the increase in glycerol concentration resulted in a lower T5% due to plasticizer loss, leading to lower thermal stability and a lower final residue. This is expected, as glycerol has a lower degradation temperature and undergoes complete decomposition by 300 °C, as shown in Figure 4. Moreover, glycerol can reduce the number of inter- and intramolecular bonds in the starchy structure, decreasing the thermal stability of the whole system.
Despite the low degradation temperature of CEO, the additive increases the thermal stability of the plates. However, this improvement is independent of concentration, as all compositions containing CEO share similar thermal profiles. The increased thermal stability could be related to the antioxidant nature of CEO, which protects the polymer from thermal degradation during processing, as well as to a stronger film network, which was favored by the interaction between ASF/ASS and CEO, as seen in the FTIR spectra. Other studies have reported an increase in thermal stability with CEO incorporation, but also highlight that high concentrations of CEO (greater than 10%) result in decreased compatibility and the formation of a multiphased system, which hinders the film’s heat resistance [20]. In the present work, the CEO incorporation leads to higher Tmax values, supporting the interaction between all components in the polymeric system at all concentrations.
The XRD patterns of ASF and AES, shown in Figure 7, exhibited starch B-type crystallinity, a characteristic common to tubers and high-amylose cereals. Type B starches contain hexagonal crystals with more compact structures than type A, and therefore require more energy to melt because their glycosidic bonds are less exposed [54]. Diffraction peaks were identified at 15.2°, 17.1°, 19.9°, 22.2° and 26.3° (2θ), consistent with other studies using Hass avocados [55]. The crystallinity indexes (Xc) are 0.42 and 0.29 for ASF and AES, respectively. The higher crystallinity index of ASF can be attributed to the presence of microcellulose crystals and can influence functional properties such as water absorption capacity [39].
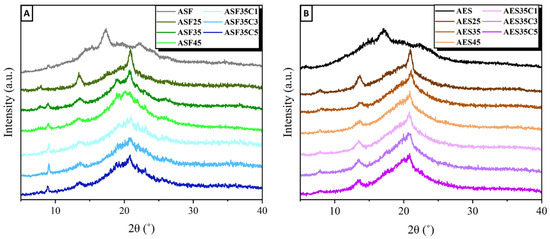
Figure 7.
XDR of avocado seed: (A) flour-based and (B) starch-based injected plates with different concentrations of glycerol and cinnamon essential oil.
Following extrusion, the plates display a primary diffraction peak along with broad amorphous halos, indicating a semi-crystalline polymer with reduced crystallinity. Both ASF and AES-based plates show similar patterns, marked by a steady decline in peak intensity as the plasticizer concentration increases. ASF plates present diffraction peaks at 8.9, 13.6, 17.3, 19.0 and 20.9°. In comparison, AES plates show peaks (2θ) at 7.8, 13.6, 17.7, 20.4 and 21.0°. The main peaks at 13.6 and 21.0° are assigned to the VH-type crystals of amylose complexed with glycerol or residual lipids [56]. During processing, VH-crystals form as a result of heat treatment, which replaces the hydroxyl group interactions in starch molecules with hydrogen bonds established between the plasticizer and starch [57]. The peak at 17.7° is associated with EH-type crystals formed due to the recrystallization of amylopectin [58]. CEO incorporation does not cause significant alterations in the XDR diffraction patterns.
Native starch exhibits low mechanical performance due to its inherent brittleness and limited flexibility, which can be improved through the addition of plasticizers. Small, non-volatile molecules such as glycerol diffuse into the intermolecular spaces of starch, forming interactions (primarily hydrogen bonds) with the hydroxyl groups of starch [52]. This interaction reduces the glass transition temperature (Tg) of TPS, increasing the free volume between starch chains and thereby enhancing chain mobility and flexibility. As a result, Young’s modulus and tensile strength decrease, while elongation at break increases. The mechanical characteristics of the AES and ASF samples were examined to assess the impact of plasticizer and CEO concentration when subjected to tensile stress. Key tensile parameters of the extruded dog-bone specimens are listed in Table 5 and Figure S3. A two-factor analysis of variance (ANOVA) was performed at a 95% confidence level (α = 0.05) to analyze how the base material (ASF or AES), glycerol concentration, and their interaction affect the mechanical properties. The ANOVA findings are provided in Figure S5 and Table S1. Additionally, another two-way ANOVA was conducted to evaluate the effect of the base material and varying CEO levels (0, 1, 3, and 5%) on the mechanical features, with results shown in Table S2.
Table 5.
Mechanical properties of avocado seed flour and extracted starch-based dog bones.
When comparing the samples with the lowest plasticizer content, AES25 displays a higher elastic modulus (E) (188.0 ± 12.5 MPa) and tensile strength (σ) than ASF25. This can be attributed to the more homogeneous nature of AES, which allows for better distribution. Enhanced interaction between starch and glycerol results from their increased hydrogen bonding ability, which improves σ and elongation at break (ε at break) of the material. Conversely, ASF exhibits a more heterogeneous structure. This heterogeneity, likely caused by the presence of large lignocellulosic particles, although not visible in the SEM images, can generate stress concentration zones within the sample’s cross-section, resulting in increased brittleness.
As expected, increasing the glycerol content to 35 wt. % significantly decreased E and σ in both materials, while significantly increasing ε at break only in AES-based dog-bones. E and σ further decreased in the samples with 45 wt. % glycerol. However, no increase in ε at break was recorded for both 45 wt. % glycerol formulations compared to 35 wt. % glycerol, probably due to the anti-plasticizing effect caused by the high plasticizer content. Anti-plasticization occurs when the concentration of plasticizer exceeds a critical value (in this case, glycerol > 35 wt. %.), weakening the interaction between the plasticizer and starch molecules [59].
The CEO also acted as a plasticizing agent, promoting the movement of polymer chains and enhancing the flexibility of the dog-bones by partially replacing stronger intermolecular polymer-polymer interactions with weaker polymer-oil interactions [24]. Similar plasticizing effects have been observed in starch-based films using other EOs, such as oregano, orange, and clove essential oils [60]. However, the effect on the mechanical properties varied depending on the matrix material. ASF samples exhibited significant decreases in E and σ, along with a non-significant decrease in ε at break (all group a). In contrast, AES formulations showed relatively smaller decreases in E and σ, but a pronounced increase in ε at break upon the addition of CEO. This difference in behavior may be attributed to the heterogeneous nature of ASF, which likely limits the stretching capacity. When comparing the 1, 3, and 5% CEO formulations of both materials, only one group letter change can be seen across all the mechanical parameters. This highlights how the influence of CEO on the mechanical properties was mostly only relevant between the neat matrix and 1 wt. % CEO. This contrasts with Zhou et al. [24], as they described a steady trend in their 0, 1 and 2.5 wt. % CEO-cassava starch-based films, reporting an ε at break relative increase of 223.8% and 182.5%, and a relative decrease in σ of 34.2% and 42.4%, respectively.
The films exhibit mechanical properties within the expected range of starch-based films, with reported values usually between E: 10–500 MPa, σ: 2–20 MPa, and ε at break: 20–100% [51,61,62,63]. For comparison, conventional LDPE packaging films typically exhibit σ in the 10–25 MPa range, and ε at break above 200% [64,65]. In contrast, PET typically exhibits E in the range of approximately 1–3.5 GPa, σ between 40 and 60 MPa, and ε at break around 16–46% [66], notably superior in mechanical strength and ductility compared to pure TPS. Nevertheless, our materials offer a balance of moderate stiffness and flexibility, which may be advantageous for applications where biodegradability and ductility are desired.
The analysis of dynamic mechanical properties was performed at four different frequencies (0.5, 1, 3, and 10 Hz) to examine the viscoelastic characteristics and to identify the glass transition temperature along with the activation energy (Ea). As illustrated in Figure 8, the variation in the storage modulus (E’), the loss modulus (E’’), and the loss factor (tan δ) for ASF and AES samples across temperature at the specified frequencies is shown. The storage modulus (E’), which indicates elastic response and material stiffness, exhibits a continuous decline during heating, a typical response observed in thermoplastic materials. At room temperature, the injected plates present E’ values directly correlated to the glycerol fraction. As seen in Table 6, the less plasticized samples, ASF25 and AES25, exhibit values of around 1000 MPa, while formulations with 45 wt. % glycerol is close to 50 MPa. These findings align with the elevated Elastic Modulus values observed during the mechanical evaluation. Similarly, a higher fraction of CEO generally resulted in lower modules, which is justified by the relaxation of the interactions between polymeric chains, as a result of the plasticizing effect of CEO.
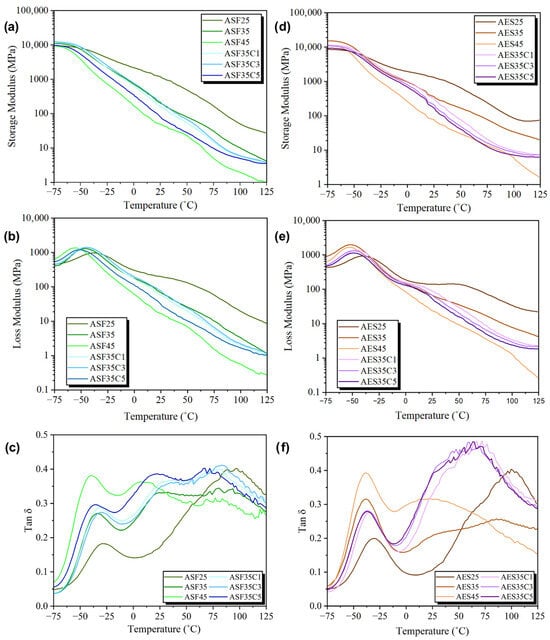
Figure 8.
E’, E’’, and Tan δ at 10 Hz for avocado seed flour (a–c) and extracted starch-based plates (d–f).
Table 6.
Storage Modulus (E’) of avocado seed flour and starch-based plates.
Tan δ indicates the amount of energy dissipated in a system as a result of deformation, and it is connected to how resistant a material is to impact. For each formulation examined, two relaxation processes are identified, each marked by a peak in tan δ, corresponding to the β and α relaxations, as illustrated in Figure 8. The presence of these two transitions in plasticized starches has been previously documented by other studies, who attributed them to the uneven distribution of the plasticizer within the sample. This uneven distribution leads to the formation of separate regions that are rich in plasticizer and regions that are rich in starch [67]. Tβ (<−20 °C) is attributed to the glycerol glass transition and Tα (>0 °C) is attributed to the TPS glass relaxation [68]. Most samples presented two Tα local maxima, except for AES25 and ASF45. The presence of double Tα peaks is clearly defined in the ASF-based compositions, whereas in the AES-based formulations, only minor secondary contributions to the main Tα peak are observed, as illustrated in Figure 8. Saparová et al. [69] assigned the lower point to the more mobile linear amylose chains and assigned the highest point to the branched amylopectin chains.
Since plasticization involves adding plasticizers to soften a material, lower its glass-transition temperature, enhance flexibility, and boost ductility, it is anticipated that increasing glycerol content would result in a reduction in Tβ and Tα. This suggests an intensified plasticizing effect owing to greater starch chain mobility [70]. As expected, the Tβ values of the materials decreased significantly with increasing glycerol content (25/35/45 wt. %), as shown in Table 7. Interestingly, the plasticizing effect was stronger on ASF, averaging a Tβ difference of 13.5 °C between ASF25 and ASF45, compared to the 8.0 °C for AES25 and AES45. Moreover, the small difference in Tβ between AES35 and AES45, averaging a difference of 0.35 °C across all frequencies, could be an indicator of excessive plasticization, in accordance with the mechanical properties. The analysis of Tα was more complex as tan δ values within this temperature range exhibit greater instability, attributed to the low E’ and E’’ values, which result in reduced precision on the Tα peaks. This phenomenon is demonstrated by the lower R2 regression values observed in the lines used for Tα activation energy calculations, as shown in Table 8, compared to those for Tβ. The wide Tα transition peaks align well with the existing literature and indicate a high degree of polydispersity in TPS, stemming from varying polymer chain lengths [71]. When comparing the activation energies (Ea), a clear decreasing trend can be seen as glycerol content increases. This is expected, as increasing glycerol content reduces the intermolecular forces between starch molecules, making starch chains more flexible and mobile, thereby lowering the energy required to overcome the resistance to movement.
Table 7.
Tβ of avocado seed flour and extracted starch-based plates.
Table 8.
Tα of avocado seed flour and extracted starch-based plates.
Following the results of the mechanical properties, it was expected that CEO would have a plasticizing effect, lowering the relaxation temperatures, as the formation of hydrogen bonds between EOs, glycerol, and the starch chains is increased. However, DMTA results show conflicting results. Small increases in Tβ values can be seen for all samples containing CEO, except for ASF35C5, compared to their respective 35 wt. % glycerol matrix. Thus, the CEO had an anti-plasticising effect. Similarly, Estevez-Areco et al. [72] described how Tβ peaks shifted to higher temperatures and widened with increasing rosemary EO concentration. Moreover, Ea calculated with Tβ presented a decreasing pattern for both ASF/AES + CEO samples, indicating a small plasticizing effect. A simultaneous rise in Tβ alongside a decline in Tα may suggest that phases rich in starch and glycerol are more compatible following the addition of CEO, as evidenced by the relaxation temperatures becoming more similar.
Food packaging aims to extend the shelf life of foodstuffs by minimizing transfers between the food and its surrounding atmosphere. Therefore, water permeability determination is a crucial property, with a lower water vapor permeability (WVP) meaning a better water barrier performance of the plate. For this study, WVTR was measured at 23 °C and a relative humidity of 50%, as shown in Figure 9. WVP significantly increases with the incorporation of glycerol, as ASF35 presents a 163% increase over ASF25, while AES35 shows a 76% increase compared to AES25. AES45 presents the highest value with 6.43 g mm/m2 day mmHg. WVP can be easily correlated with the glycerol content and relative humidity gradient [73]. Increasing the amount of plasticizer enhances the hydrophilic nature of the plates and exposes more active hydroxyl groups, enabling better absorption of water molecules [74]. Additionally, it is well known that increasing the plasticizer content creates more free volume, which enhances chain mobility in the polymeric structure, thereby improving the mobility and diffusion coefficients of water molecules. ASF-based plates presented lower WVP values than AES plates with the same glycerol content, which is probably related to the cellulose or lignin-cellulose content in ASF, previously observed in SEM. Even though starch and cellulose share similar chemical compositions, the more crystalline structure of cellulose, resulting from its dense fibrillar organization, forms a more complex path, which makes it harder for water vapor to diffuse through [52].
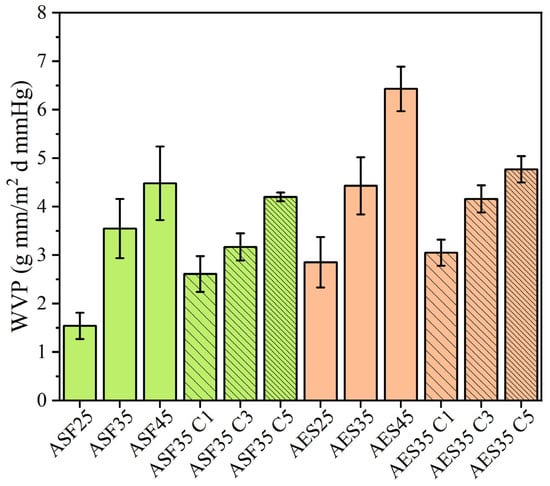
Figure 9.
Water Vapor permeability of avocado seed-based plates.
The results for plates containing CEO demonstrate a consistent trend across both the ASF-based and AES-based formulations. When comparing WVTR values with their respective 35 wt. % glycerol matrix, the addition of 1 wt. % CEO significantly decreases, 3 wt. % CEO and 5 wt. % CEO values are very similar. The literature indicates varying effects on WVP upon incorporating EOs. Research indicating an increase in Water Vapor Permeability (WVP) often attributes this rise to the creation of cavities resulting from EO addition, which expands the free space within the polymer structure. Conversely, decreases in WVP are generally associated with hydrogen bonding and covalent interactions between the starch network and polyphenolic compounds, which reduce the availability of hydrogen groups needed to form hydrophilic bonds with water [60].
Antioxidants play a role in safeguarding the contents of packaging films from oxidation, which can lead to spoilage or deterioration of the food. The antioxidant potential of the plates was tested by immersing them in a fatty food simulant and measuring their activity using the DPPH assay. The results indicate that ASF-based plates exhibit higher antioxidant activity, as illustrated in Figure 10. This is expected as ASF presents an intense brown color, which is linked to antioxidant compounds as mentioned previously. During the AES extraction process, some bioactive compounds of ASF were lost, decreasing its oxidation capacity. These findings align with other studies on Hass avocados, which report high antioxidant activity [75]. Values remain similar across the plates, regardless of the base material, despite varying plasticizer concentrations. This observation is consistent with the AES-based films prepared via solvent casting in our previous paper [11], in which increasing glycerol content only caused a small reduction in radical scavenging activity.
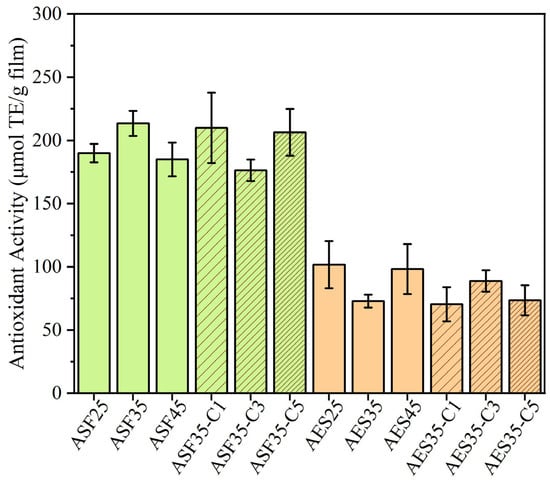
Figure 10.
Antioxidant capacity of the avocado seed flour and extracted starch-based plates.
The HPLC–MS analysis of ASF was carried out to determine the source of the antioxidant properties. The analysis revealed the presence of a variety of primary metabolites and phenolic compounds, as shown in Table S3. Among the early eluting signals, several organic acids were identified, including quinic, malic, citric and isocitric acids, as well as perseitol, a characteristic avocado sugar alcohol. In addition, phenolic acids such as protocatechuic acid and different caffeoylquinic acid isomers (3-O-, 4-O- and 5-O-caffeoylquinic acids) were detected, together with coumaroylquinic acid derivatives, all of which are well known for their antioxidant activity [76]. The presence of tyrosol-glucoside, a compound with reported antioxidant and cardioprotective effects, was also observed. Flavan-3-ols, including (+)-catechin and (−)-epicatechin were identified, both of which are recognized for their strong radical-scavenging properties and contribution to overall antioxidant potential [77]. Overall, the metabolite profile highlights the richness of avocado seeds in phenolic acids and flavonoids, which are associated with antioxidant and health-promoting effects. The proposed identifications are consistent with previously reported retention times and fragmentation patterns for analogous samples analyzed under comparable experimental setups [78].
Despite the high antioxidant capacity of CEO, mainly attributed in the literature to its cinnamaldehyde and eugenol content [79], no improvement is achieved. A significant limitation of using essential oils (EOs) to produce biodegradable films is their high volatility and thermal instability. However, the TGA data showed that thermal degradation of CEO starts at 145 °C with Tmax at 207 °C, which is lower than the extrusion (120 °C) and injection (135 °C) temperatures. This behavior could be ascribed to the protective effect provided by the CEO during the melt extrusion process, as already commented on the TGA results. Moreover, it should be mentioned that GC-MS analysis of the plates confirms that high amounts of cinnamaldehyde are still present after the extrusion process, as shown in Figure S4. Nevertheless, all the formulations intrinsically present very high antioxidant capacity, making them ideal for active food packaging applications. For comparison, Estevez-Areco et al. [72] incorporated 10% w/w rosemary extract into starch-glycerol films to obtain a 123.1 ± 8.0 µmol TE/g film.
The antifungal activity of CEO in the vapor phase against Penicillium expansum was evaluated by determining the minimum fungicidal concentration (MFC). The findings suggest that adding 1 μL of CEO to each plate fully prevents fungal growth, as depicted in Figure S6. The antifungal efficacy of CEO is broad, targeting various spoilage fungi and foodborne yeasts, primarily due to its rich cinnamaldehyde content, which is its principal bioactive component [80]. Although the exact mechanism of action is not fully understood, cinnamaldehyde is believed to interfere with fungal cell division and disrupt membrane integrity, ultimately leading to growth inhibition or cell death [81].
The antifungal effectiveness of the plates incorporated with different concentrations of CEO is summarized in Table 9, while representative images of P. expansum growth are shown in Figure 11. The results demonstrate a concentration-dependent antifungal effect, with complete inhibition observed in both ASF35 and AES35 plates containing 5 wt. % CEO after 10 days of incubation. This result indicates that the antifungal activity of CEO is retained even after its direct incorporation through a melt extrusion process, confirming its effectiveness at higher concentrations. Only partial inhibition is observed at 1 and 3 wt. % CEO concentrations. Although plates containing 3 wt. % CEO show slightly higher inhibition rates than those with 1 wt. %, the differences are not significant. This suggests that some loss of active compounds in CEO may occur during the plate manufacturing process, and that a minimum threshold concentration (5%) may be necessary to ensure prolonged antifungal efficacy. This trend aligns with other findings that report raising CEO concentration significantly reduces the growth of P. expansum [59] or Gram-negative (E. coli) and Gram-positive (S. aureus) bacteria [18].
Table 9.
Antifungal effectiveness of extruded avocado seed flour- and extracted starch-based plates loaded with cinnamon essential oil against P. expansum.
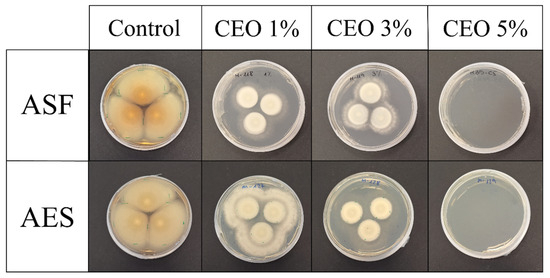
Figure 11.
Antifungal effect against P. expansum of extruded avocado seed flour- and starch-based plates loaded with cinnamon essential oil after 10 days of incubation.
A visual comparison of the fungal colonies reveals differences in mycelial density and colony morphology. The control exhibits dense, well-developed mycelial networks, whereas ASF-based plates with 1 and 3 wt. % CEO results in visibly sparser and thinner fungal growth. Furthermore, ASF-based plates appear to perform slightly better than AES-based plates at equivalent CEO concentrations, particularly after prolonged incubation. This may be attributed to differences in the structure, with the heterogeneous ASF matrix delaying and prolonging the release kinetics of CEO and its diffusion into the vapor phase.
The biodegradability of the disposable plates was assessed through a disintegration assay in accordance with the ISO 20200 standard. Within laboratory conditions that mimic real-world scenarios, the test replicates typical thermophilic composting environments, characterized by humidity levels around 55% and temperatures at approximately 58 °C. The morphological changes observed at various composting intervals are illustrated in Figure 12, while the changes in weight throughout the process are displayed in Figure 13. During the test, the plates exhibit a sponge-like behavior, absorbing moisture from the compost, adhering small wooden chips on their surface, and visually changing from a brown color to a darker tone or black color upon prolonged contact with the dark compost soil.
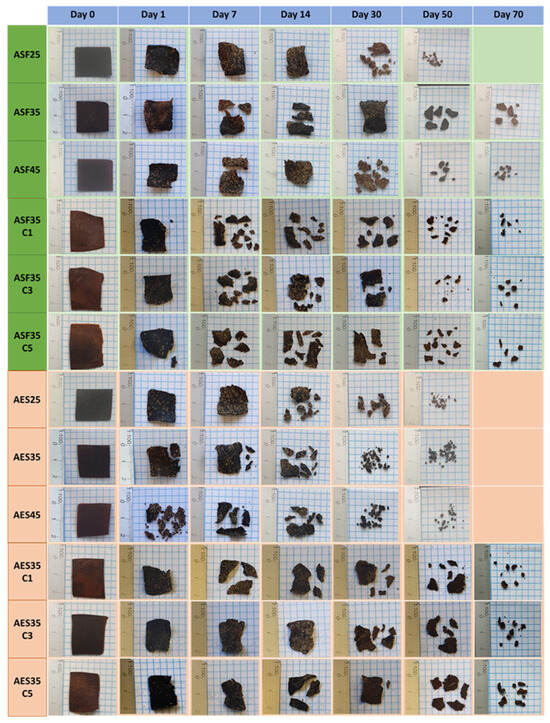
Figure 12.
Visual appearance of avocado seed flour and starch-based plates during disintegration.
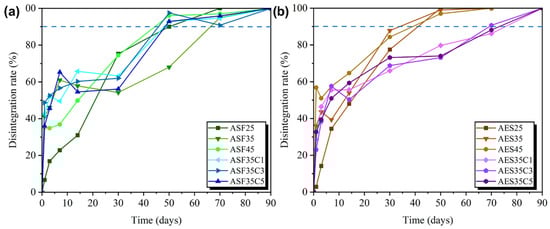
Figure 13.
Disintegration rate under composting conditions of: (a) avocado seed flour and (b) starch-based plates.
The initial degradation phase is mainly determined by the plasticizer concentration, as plates with 25 wt. % glycerol has a lower disintegration compared to those with 35 and 45 wt. %. After the initial 24 h, the disintegration rate is determined by the matrix base (ASF or AES). At 30 and 50 days, all ASF-based plates present a lower disintegration rate than their AES counterparts. On day 50 of the experiment, it was observed that all AES-based plates and ASF45 were degraded (weight loss > 95%), with ASF45 reaching the 90% disintegration mark at day 50 and ASF35 after 70 days. The slower decomposition of ASF-based plates was probably due to the lignin-cellulose and fiber content in the seed flour.
In a similar way, Torres et al. [82] described how their starch films displayed a three-stage degradation behavior: leaching of glycerol during the first 24 h, a main degradation process marked by biological activity, and a slower final decomposition. In our previous study [11], solvent-cast ASS-based films with different glycerol concentrations all disintegrated within 48 h, and glycerol concentration did not significantly alter the disintegration rate. However, solvent-casted films had a thickness of 45–60 µm, compared to the 500–600 µm of the injected plates.
Samples containing CEO present an interesting disintegration behavior, with CEO loaded ASF-based plates degrading like their neat counterpart (ASF35). However, AES-based plates exhibit a slightly slower degradation rate. The initial phase, which is determined by the glycerol migration, was similar to the neat sample (AES35). However, after 3 days, when the biological activity starts to determine the rate, the disintegration slowed down. This is probably due to the high antimicrobial activity of the cinnamaldehyde. Srivastava et al. [83] describe how the antimicrobial properties of peppermint EO reduced the degradation rate of corn starch films. In the literature, it is frequently targeted that the mass of test material residues is less than 10% of the original mass of test material after being composted with biowaste for 3 months [84]. As all the plates reach this milestone within three months, all the formulations can be considered disintegrable materials.
4. Discussion
A comparative analysis of all the studied properties of ASF- and AES-based formulations was conducted to determine their suitability for food packaging applications, as illustrated in Figure 14. All properties were normalized to a 0–1 scale to allow for direct visual and quantitative comparison across formulations, using a radar chart. Parameters in which higher values indicate better performance (e.g., mechanical strength, antioxidant capacity) were scaled directly, while WVP was inversely normalized, since lower values represent improved barrier properties.
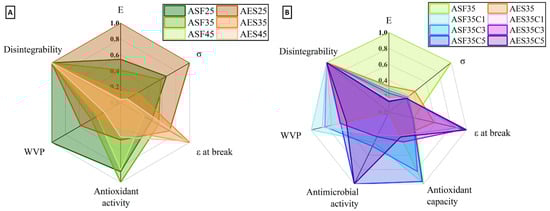
Figure 14.
Impact on properties of avocado seed flour- and extracted starch-based samples by the influence of: (A) glycerol and (B) CEO content.
ASF-based plates (ASF25 and ASF35) exhibit superior water vapor barrier performance, with ASF25 showing the lowest WVP value (1.5 g·mm/m2·d·mmHg), which is particularly desirable for reducing moisture transfer in packaged food systems. ASF formulations also demonstrate high antioxidant activity, especially ASF35 (213.4 µg Trolox/g plate), making them promising materials aimed at preserving food quality and shelf life.
In terms of mechanical properties, AES-based dog-bones (mainly AES25) showed significantly higher σ (7.4 MPa) and E (188 MPa), suggesting greater rigidity and structural integrity. However, AES dog-bones also displayed higher ε at break, with AES35 reaching 34.3%, indicating enhanced flexibility, which can be advantageous for packaging irregularly shaped products or applications requiring elasticity.
ASF45 and AES45 showed very low mechanical performance, indicating that plasticizer concentrations beyond 35% significantly compromise sample integrity. All formulations achieve 100% disintegration under composting conditions after 90 days, confirming their environmental compatibility. Similarly, both ASF and AES displayed strong antimicrobial properties upon the addition of sufficient CEO (5%), which completely inhibited fungal growth.
ASF-based plates are more suitable for food packaging applications requiring strong barrier and antioxidant performance, while AES-based plates offer better mechanical flexibility, particularly at moderate plasticizer levels.
Although CEO exhibits strong antimicrobial activity, its direct incorporation into food packaging materials presents several challenges. The volatile nature of CEO components, such as cinnamaldehyde, can lead to rapid loss during processing and storage, reducing their long-term efficacy. It should be noted that, although the presence of CEO was confirmed by GC–MS after extrusion, a quantitative assessment of its retention was not performed. Given the known thermal sensitivity of CEO, future studies should include quantitative analyses to establish retention efficiency and its correlation with film functionality.
Furthermore, the intense aroma and flavor of CEO can easily migrate into the packaged food, potentially altering its sensory profile beyond consumer acceptance thresholds. In this study, film performance was only evaluated under laboratory conditions using food simulants. Although this provides valuable standardized information, future studies should assess the interaction of these films with real food products, with particular attention to the release kinetics of CEO, to establish migration profiles and validate their functional effectiveness in real packaging applications. CEO is also chemically sensitive to light, oxygen, and elevated temperatures, which can promote degradation and diminish bioactivity over time. From a safety standpoint, while CEO is generally recognized as safe (GRAS), its release rate and total migration must comply with food contact material regulations. Achieving a controlled release that ensures antimicrobial performance without exceeding sensory or regulatory limits remains the main limitation for its practical application in active food packaging systems.
5. Conclusions
Avocado seeds are a noteworthy byproduct for creating eco-friendly packaging because of their abundant starch levels. Utilizing the seeds, often considered a byproduct, would align with the principles of a zero-waste and circular economy. This work demonstrates that it is possible to obtain environmentally friendly thermoplastic starch materials from avocado seeds. A comparison was carried out between the starch-rich lignocellulosic seed flour (ASF) and the extracted starch (AES) with different glycerol concentrations.
The homogeneous nature of AES allowed glycerol to have a higher influence capacity, producing plates with a wide range of mechanical properties, with AES25 showing the highest E (188 MPa) and σ (7.4 MPa) of all samples, and AES45 the lowest. On the other hand, the heterogeneous composition of ASF offered a better barrier and higher intrinsic antioxidant properties. Increasing the glycerol content facilitates the processability of the material but reduces the tensile strength and barrier properties of the plates. Samples with 45 wt. % glycerol presented excessive plasticizer, resulting in poor mechanical and barrier properties. The plates with 35 wt. % glycerol content presented a good compromise of these properties and were selected to incorporate cinnamon essential oil (CEO). CEO provided strong antifungal properties to the final material, especially the 5 wt. % formulations, which completely inhibited the growth of P. expansum during the 10-day test. Although CEO does not provide additional antioxidant capacity, it can protect the starch from thermal degradation during processing and act as a plasticizer, decreasing E and water barrier properties as concentration increases. All formulations achieve 100% disintegration under composting conditions after 90 days, confirming their environmental compatibility.
By extruding ASF directly, the need for all the starch extraction resources is eliminated and the use of the raw material is maximized. ASF25 presents a good equilibrium of mechanical properties (E: 102 MPa), water barrier, and antioxidant properties. In ASF35C5, the high intrinsic antioxidant activity of the seed, combined with the antimicrobial properties of CEO, creates ideal characteristics for active packaging materials. Given their composition from widely available and low-cost components and compatibility with conventional extrusion and injection molding processes, the developed films show promise for scale-up and potential adoption in industrial packaging applications. Future research should concentrate on new combinations of additives, reinforcements, blends, and synergies with ASF to provide a broader range of properties.
Supplementary Materials
The following supporting information can be downloaded at https://www.mdpi.com/article/10.3390/polysaccharides6030083/s1: Figure S1. TGA of avocado seed and starch in O2 atmosphere. Figure S2. TGA of avocado seed: (A) flour-based and (B) starch-based plates. Figure S3. Mechanical properties of avocado seed flour- and starch-based plates. Figure S4. GC-MS spectra of cinnamon essential oil and AES35-C5. Figure S5. Interaction on mechanical properties. Table S1. ANOVA analysis of the effect of the material with glycerol on the mechanical properties. Table S2. ANOVA analysis of the effect of the material with CEO on the mechanical properties. Table S3. Proposed compounds identified by HPLC-MS of the avocado seed flour. Figure S6. MFC study of cinnamon essential oil.
Author Contributions
Conceptualization, D.L. and L.P.; methodology, P.F.M.-G., A.A.-G., E.B.-B. and M.P.A.; software, P.F.M.-G.; validation, A.A.-G., M.P.A., L.P. and D.L.; investigation, A.A.-G. and P.F.M.-G.; resources, D.L. and L.P.; writing—original draft preparation, P.F.M.-G.; writing—review and editing, A.A.-G., M.P.A., D.L. and L.P.; supervision, D.L. and L.P.; project administration, D.L. and L.P., funding acquisition, D.L. and L.P. All authors have read and agreed to the published version of the manuscript.
Funding
This research was funded by the Agencia Estatal de Investigación (AEI, MICINN, Spain), Fondo Europeo de Desarrollo Regional (FEDER, EU), NextGenerationEU MRR TED2021-129335B-C21, and MCIN/AEI/10.13039/501100011033/ by “ERDF A way of making Europe” for the PID2021-123753NB-C31 and PID2021-123753NB-C32 projects.
Institutional Review Board Statement
Not applicable.
Data Availability Statement
Data will be made available on request.
Conflicts of Interest
The authors declare no conflicts of interest.
References
- Van Dyk, J.S.; Gama, R.; Morrison, D.; Swart, S.; Pletschke, B.I. Food Processing Waste: Problems, Current Management and Prospects for Utilisation of the Lignocellulose Component through Enzyme Synergistic Degradation. Renew. Sustain. Energy Rev. 2013, 26, 521–531. [Google Scholar] [CrossRef]
- Coman, V.; Teleky, B.E.; Mitrea, L.; Martău, G.A.; Szabo, K.; Călinoiu, L.F.; Vodnar, D.C. Bioactive Potential of Fruit and Vegetable Wastes. Adv. Food Nutr. Res. 2020, 91, 157–225. [Google Scholar] [CrossRef] [PubMed]
- Gonzalez-Garcia, S.; Gullón, B.; Moreira, M.T. Environmental Assessment of Biorefinery Processes for the Valorization of Lignocellulosic Wastes into Oligosaccharides. J. Clean. Prod. 2018, 172, 4066–4073. [Google Scholar] [CrossRef]
- Sun, X.; Dou, Z.; Shurson, G.C.; Hu, B. Bioprocessing to Upcycle Agro-Industrial and Food Wastes into High-Nutritional Value Animal Feed for Sustainable Food and Agriculture Systems. Resour. Conserv. Recycl. 2024, 201, 107325. [Google Scholar] [CrossRef]
- Zhang, Z.; O’Hara, I.M.; Mundree, S.; Gao, B.; Ball, A.S.; Zhu, N.; Bai, Z.; Jin, B. Biofuels from Food Processing Wastes. Curr. Opin. Biotechnol. 2016, 38, 97–105. [Google Scholar] [CrossRef] [PubMed]
- Muñoz-Gimena, P.F.; Oliver-Cuenca, V.; Peponi, L.; López, D. A Review on Reinforcements and Additives in Starch-Based Composites for Food Packaging. Polymers 2023, 15, 2972. [Google Scholar] [CrossRef]
- Thivya, P.; Bhosale, Y.K.; Anandakumar, S.; Hema, V.; Sinija, V.R. Exploring the Effective Utilization of Shallot Stalk Waste and Tamarind Seed for Packaging Film Preparation. Waste Biomass Valorization 2021, 12, 5779–5794. [Google Scholar] [CrossRef]
- Lalnunthari, C.; Devi, L.M.; Amami, E.; Badwaik, L.S. Valorisation of Pumpkin Seeds and Peels into Biodegradable Packaging Films. Food Bioprod. Process. 2019, 118, 58–66. [Google Scholar] [CrossRef]
- Ginting, M.H.S.; Hasibuan, R.; Lubis, M.; Tanjung, D.S.; Iqbal, N. Effect of Hydrochloric Acid Concentration as Chitosan Solvent on Mechanical Properties of Bioplastics from Durian Seed Starch (Durio Zibethinus) with Filler Chitosan and Plasticizer Sorbitol. IOP Conf. Ser. Mater. Sci. Eng. 2017, 180, 012126. [Google Scholar] [CrossRef]
- Rasel, H.; Johansson, T.; Gällstedt, M.; Newson, W.; Johansson, E.; Hedenqvist, M. Development of Bioplastics Based on Agricultural Side-stream Products: Film Extrusion of C Rambe Abyssinica/Wheat Gluten Blends for Packaging Purposes. J. Appl. Polym. Sci. 2016, 133, 42442. [Google Scholar] [CrossRef]
- Muñoz-Gimena, P.F.; Aragón-Gutiérrez, A.; Blázquez-Blázquez, E.; Arrieta, M.P.; Rodríguez, G.; Peponi, L.; López, D. Avocado Seed Starch-Based Films Reinforced with Starch Nanocrystals. Polymers 2024, 16, 2868. [Google Scholar] [CrossRef]
- García, N.L.; Famá, L.; D’Accorso, N.B.; Goyanes, S. Biodegradable Starch Nanocomposites. Adv. Struct. Mater. 2015, 75, 17–77. [Google Scholar] [CrossRef]
- Nida, S.; Moses, J.A.; Anandharamakrishnan, C. Biopolymers and Biocomposites from Agricultural Waste; Elsevier Ltd.: Amsterdam, The Netherlands, 2020; ISBN 9780128199886. [Google Scholar]
- García-Vargas, M.C.; Contreras, M.D.M.; Castro, E. Avocado-Derived Biomass as a Source of Bioenergy and Bioproducts. Appl. Sci. 2020, 10, 8195. [Google Scholar] [CrossRef]
- Dinan, D. The Environment, Energy, and Climate Change. In Ever Closer Union; Lynne Rienner Pub: Boulder, CO, USA, 2010; ISBN 9783319170992. [Google Scholar]
- Pires, J.B.; dos Santos, F.N.; da Cruz, E.P.; Fonseca, L.M.; Siebeneichler, T.J.; Lemos, G.S.; Gandra, E.A.; Zavareze, E.d.R.; Dias, A.R.G. Starch Extraction from Avocado By-Product and Its Use for Encapsulation of Ginger Essential Oil by Electrospinning. Int. J. Biol. Macromol. 2024, 254, 127617. [Google Scholar] [CrossRef] [PubMed]
- Kurniawan, K.; Rahmat, A. Determination of Antioxidant Activity, Total Phenolic, and Total Flavonoid Contents from Avocado Seeds (Persea americana). IOP Conf. Ser. Earth Environ. Sci. 2023, 1201, 012098. [Google Scholar] [CrossRef]
- Singh, G.; Maurya, S.; deLampasona, M.P.; Catalan, C.A.N. A Comparison of Chemical, Antioxidant and Antimicrobial Studies of Cinnamon Leaf and Bark Volatile Oils, Oleoresins and Their Constituents. Food Chem. Toxicol. 2007, 45, 1650–1661. [Google Scholar] [CrossRef]
- Yuan, G.; Chen, X.; Li, D. Chitosan Films and Coatings Containing Essential Oils: The Antioxidant and Antimicrobial Activity, and Application in Food Systems. Food Res. Int. 2016, 89, 117–128. [Google Scholar] [CrossRef]
- Xu, T.; Gao, C.C.; Feng, X.; Huang, M.; Yang, Y.; Shen, X.; Tang, X. Cinnamon and Clove Essential Oils to Improve Physical, Thermal and Antimicrobial Properties of Chitosan-Gum Arabic Polyelectrolyte Complexed Films. Carbohydr. Polym. 2019, 217, 116–125. [Google Scholar] [CrossRef]
- Builders, P.F.; Nnurum, A.; Mbah, C.C.; Attama, A.A.; Manek, R. The Physicochemical and Binder Properties of Starch from Persea americana Miller (Lauraceae). Starch/Staerke 2010, 62, 309–320. [Google Scholar] [CrossRef]
- Martins, S.H.F.; Pontes, K.V.; Fialho, R.L.; Fakhouri, F.M. Extraction and Characterization of the Starch Present in the Avocado Seed (Persea americana Mill) for Future Applications. J. Agric. Food Res. 2022, 8, 100303. [Google Scholar] [CrossRef]
- Otálora González, C.M.; Alvarez Castillo, E.; Flores, S.; Gerschenson, L.N.; Bengoechea, C. Effect of Plasticizer Composition on the Properties of Injection Molded Cassava Starch-Based Bioplastics. Food Packag. Shelf Life 2023, 40, 101218. [Google Scholar] [CrossRef]
- Zhou, Y.; Wu, X.; Chen, J.; He, J. Effects of Cinnamon Essential Oil on the Physical, Mechanical, Structural and Thermal Properties of Cassava Starch-Based Edible Films. Int. J. Biol. Macromol. 2021, 184, 574–583. [Google Scholar] [CrossRef] [PubMed]
- ISO 10520:1997; Almidones y Féculas Nativos Determinación Del Contenido de Almidón Método Polarimétrico de Ewers. Normas UNE: Madrid, Spain, 2000.
- IAL. Métodos Físicos-Quimicos Para Análise de Alimentos, 4th ed.; Pascuet, O.Z.N.S., Ed.; IMESP: Sao Paulo, Brazil, 2008; Volume 1a Edicao. [Google Scholar]
- Manirakiza, P.; Covaci, A.; Schepens, P. Comparative Study on Total Lipid Determination Using Soxhlet, Roese-Gottlieb, Bligh & Dyer, and Modified Bligh & Dyer Extraction Methods. J. Food Compos. Anal. 2001, 14, 93–100. [Google Scholar] [CrossRef]
- Hoover, R.; Ratnayake, W.S. Determination of Total Amylose Content of Starch. Curr. Protoc. Food Anal. Chem. 2001, 00, E2.3.1–E2.3.5. [Google Scholar] [CrossRef]
- Hulleman, S.H.D.; Kalisvaart, M.G.; Janssen, F.H.P.; Feil, H.; Vliegenthart, J.F.G. Origins of B-Type Crystallinity in Glycerol-Plasticized, Compression-Moulded Potato Starches. Carbohydr. Polym. 1999, 39, 351–360. [Google Scholar] [CrossRef]
- AENOR Spanish Standard UNE-EN ISO 527-1; Plastics Determination of Tensile Properties Part 1: General Principles. AENOR: Madrid, Spain, 2019.
- Karbhari, V.M.; Wang, Q. Multi-Frequency Dynamic Mechanical Thermal Analysis of Moisture Uptake in E-Glass/Vinylester Composites. Compos. Part B Eng. 2004, 35, 299–304. [Google Scholar] [CrossRef]
- The European Commis. Commission Regulation (Eu) No. 10, 2011 of 14, on Plastic Materials and Articles Intended to Come into Contact with Food. Off. J. Eur. Union 2011, L12/1, 1–89. [Google Scholar]
- ISO 20200:2015; Plastics—Determination of the Degree of Disintegration of Plastic Materials under Simulated Composting Conditions in a Laboratory-Scale Test. ISO: Geneva, Switzerland, 2015; pp. 1–8.
- Aguilar, G.J.; Tapia-Blácido, D.R. Evaluating How Avocado Residue Addition Affects the Properties of Cassava Starch-Based Foam Trays. Int. J. Biol. Macromol. 2023, 240, 124348. [Google Scholar] [CrossRef]
- Utari, I.; Rahmayani, I. Effect of Various Processing Processes on The Characteristics of Avocado Seed Flour (Persea an Americana Mill). J. Bio-Geo Mater. Energi 2023, 3, 12–19. [Google Scholar] [CrossRef]
- Esquivel-Fajardo, E.A.; Martinez-Ascencio, E.U.; Oseguera-Toledo, M.E.; Londoño-Restrepo, S.M.; Rodriguez-García, M.E. Influence of Physicochemical Changes of the Avocado Starch throughout Its Pasting Profile: Combined Extraction. Carbohydr. Polym. 2022, 281, 119048. [Google Scholar] [CrossRef]
- Pușcaș, A.; Tanislav, A.E.; Marc, R.A.; Mureșan, V.; Mureșan, A.E.; Pall, E.; Cerbu, C. Cytotoxicity Evaluation and Antioxidant Activity of a Novel Drink Based on Roasted Avocado Seed Powder. Plants 2022, 11, 1083. [Google Scholar] [CrossRef] [PubMed]
- Diana, Y.; Carlos, M.; Edith, C. Effect of Maturity State of Avocado (Persea americana Mill. Cv. Hass) on Seed Characteristics. Adv. J. Food Sci. Technol. 2018, 16, 301–306. [Google Scholar] [CrossRef]
- De Dios-Avila, N.; Tirado-Gallegos, J.M.; Rios-Velasco, C.; Luna-Esquivel, G.; Isiordia-Aquino, N.; Zamudio-Flores, P.B.; Estrada-Virgen, M.O.; Cambero-Campos, O.J. Physicochemical, Structural, Thermal and Rheological Properties of Flour and Starch Isolated from Avocado Seeds of Landrace and Hass Cultivars. Molecules 2022, 27, 910. [Google Scholar] [CrossRef] [PubMed]
- Cáscara De Tres, P.Y.; María Ceballos, A.P.; Montoya, S.B. Evaluación Quimica De La Fibra En Semilla Chemical Evaluation of Fiber Nib, Pulp and Three Shell Avocado Varieties Avaliação Química Em Sementes, Polpa E Casca De Três Variedades De Abacate. Biotecnol. Sect. Agropecu. Agroindustrial 2013, 11, 103–112. [Google Scholar]
- Nasri, C.; Halabi, Y.; Aghzaf, S.; Nounah, I.; Brunel, M.; Oubihi, A.; El-Guorrami, O.; Harhar, H.; Costa, J.; Tabyaoui, M. Seven Persea americana Varieties Essential Oils Comparison: Chemical Composition, Toxicity, Antibacterial, and Antioxidant Activities. Biocatal. Agric. Biotechnol. 2022, 44, 102468. [Google Scholar] [CrossRef]
- Bhuyan, D.J.; Alsherbiny, M.A.; Perera, S.; Low, M.; Basu, A.; Devi, O.A.; Barooah, M.S.; Li, C.G.; Papoutsis, K. The Odyssey of Bioactive Compounds in Avocado (Persea americana) and Their Health Benefits. Antioxidants 2019, 8, 426. [Google Scholar] [CrossRef]
- Hamouda, A.F.; Farawilla, T.-L.M.; Attafi, I.M.; Khardali, I.A.; Attafi, M.A.; Essa Oraiby, M.; Abualsail, F.M. Screening Pilot Study of Fruit Seed Compositions by GC-MS and Their Potential Scenario Anti ACE2 and 2rh1 Receptors as a Recycling Possibility in the Coronavirus Pandemic. J. Clin. Med. Res. 2021, 02, 1–65. [Google Scholar] [CrossRef]
- Trifan, A.; Zengin, G.; Brebu, M.; Skalicka-woźniak, K.; Luca, S.V. Phytochemical Characterization and Evaluation of the Antioxidant and Anti-enzymatic Activity of Five Common Spices: Focus on Their Essential Oils and Spent Material Extractives. Plants 2021, 10, 2692. [Google Scholar] [CrossRef]
- Araújo, R.G.; Rodríguez-Jasso, R.M.; Ruiz, H.A.; Govea-Salas, M.; Rosas-Flores, W.; Aguilar-González, M.A.; Pintado, M.E.; Lopez-Badillo, C.; Luevanos, C.; Aguilar, C.N. Hydrothermal-Microwave Processing for Starch Extraction from Mexican Avocado Seeds: Operational Conditions and Characterization. Processes 2020, 8, 759. [Google Scholar] [CrossRef]
- Sánchez, F.; Araus, K.; Domínguez, M.P.; Miguel, G.S. Thermochemical Transformation of Residual Avocado Seeds: Torrefaction and Carbonization. Waste Biomass Valorization 2017, 8, 2495–2510. [Google Scholar] [CrossRef]
- García-Guzmán, L.; Arzate-Vázquez, I.; Velazquez, G.; Díaz-Bandera, D.; García-Eleno, M.A.; Castaño, J.; Guadarrama-Lezama, A.Y. Isolation and Characterization of Starch, Cellulose, and Their Nanostructures Obtained from Commelina Coelestis Willd Root. J. Polym. Environ. 2024, 32, 4550–4566. [Google Scholar] [CrossRef]
- Díaz-Muñoz, L.L.; Bonilla-Petriciolet, A.; Reynel-Ávila, H.E.; Mendoza-Castillo, D.I. Sorption of Heavy Metal Ions from Aqueous Solution Using Acid-Treated Avocado Kernel Seeds and Its FTIR Spectroscopy Characterization. J. Mol. Liq. 2016, 215, 555–564. [Google Scholar] [CrossRef]
- Alizadeh Behbahani, B.; Falah, F.; Lavi Arab, F.; Vasiee, M.; Tabatabaee Yazdi, F. Chemical Composition and Antioxidant, Antimicrobial, and Antiproliferative Activities of Cinnamomum Zeylanicum Bark Essential Oil. Evid.-Based Complement. Altern. Med. 2020, 2020, 5190603. [Google Scholar] [CrossRef] [PubMed]
- Silveira, M.P.; Silva, H.C.; Pimentel, I.C.; Poitevin, C.G.; da Costa Stuart, A.K.; Carpiné, D.; de Matos Jorge, L.M.; Jorge, R.M.M. Development of Active Cassava Starch Cellulose Nanofiber-Based Films Incorporated with Natural Antimicrobial Tea Tree Essential Oil. J. Appl. Polym. Sci. 2020, 137, 48726. [Google Scholar] [CrossRef]
- López Terán, J.L.; Cabrera Maldonado, E.V.; Araque Rangel, J.d.C.; Poveda Otazo, J.; Beltrán Rico, M.I. Development of Antibacterial Thermoplastic Starch with Natural Oils and Extracts: Structural, Mechanical and Thermal Properties. Polymers 2024, 16, 180. [Google Scholar] [CrossRef]
- Cataño, F.A.; Moreno-Serna, V.; Cament, A.; Loyo, C.; Yáñez-S, M.; Ortiz, J.A.; Zapata, P.A. Green Composites Based on Thermoplastic Starch Reinforced with Micro- and Nano-Cellulose by Melt Blending—A Review. Int. J. Biol. Macromol. 2023, 248, 125939. [Google Scholar] [CrossRef]
- Paluch, M.; Ostrowska, J.; Tyński, P.; Sadurski, W.; Konkol, M. Structural and Thermal Properties of Starch Plasticized with Glycerol/Urea Mixture. J. Polym. Environ. 2022, 30, 728–740. [Google Scholar] [CrossRef]
- Chel-Guerrero, L.; Barbosa-Martín, E.; Martínez-Antonio, A.; González-Mondragón, E.; Betancur-Ancona, D. Some Physicochemical and Rheological Properties of Starch Isolated from Avocado Seeds. Int. J. Biol. Macromol. 2016, 86, 302–308. [Google Scholar] [CrossRef]
- Macena, J.F.F.; de Souza, J.C.A.; Camilloto, G.P.; Cruz, R.S. Physico-Chemical, Morphological and Technological Properties of the Avocado (Persea americana Mill. Cv. Hass) Seed Starch. Cienc. Agrotecnologia 2020, 44, e001420. [Google Scholar] [CrossRef]
- Azevedo, V.M.; Carvalho, R.A.; Borges, S.V.; Claro, P.I.C.; Hasegawa, F.K.; Yoshida, M.I.; Marconcini, J.M. Thermoplastic Starch/Whey Protein Isolate/Rosemary Essential Oil Nanocomposites Obtained by Extrusion Process: Antioxidant Polymers. J. Appl. Polym. Sci. 2019, 136, 47619. [Google Scholar] [CrossRef]
- Mendes, J.F.; Paschoalin, R.T.; Carmona, V.B.; Sena Neto, A.R.; Marques, A.C.P.; Marconcini, J.M.; Mattoso, L.H.C.; Medeiros, E.S.; Oliveira, J.E. Biodegradable Polymer Blends Based on Corn Starch and Thermoplastic Chitosan Processed by Extrusion. Carbohydr. Polym. 2016, 137, 452–458. [Google Scholar] [CrossRef]
- Averous, L.R.; Halley, P.J. From Genetic Engineering to Green Applications; Elsevier: Amsterdam, The Netherlands, 2014; ISBN 9780444537300. [Google Scholar]
- Souza, A.C.; Benze, R.; Ferrão, E.S.; Ditchfield, C.; Coelho, A.C.V.; Tadini, C.C. Cassava Starch Biodegradable Films: Influence of Glycerol and Clay Nanoparticles Content on Tensile and Barrier Properties and Glass Transition Temperature. LWT 2012, 46, 110–117. [Google Scholar] [CrossRef]
- Vianna, T.C.; Marinho, C.O.; Marangoni Júnior, L.; Ibrahim, S.A.; Vieira, R.P. Essential Oils as Additives in Active Starch-Based Food Packaging Films: A Review. Int. J. Biol. Macromol. 2021, 182, 1803–1819. [Google Scholar] [CrossRef]
- Díaz-Galindo, E.P.; Nesic, A.; Cabrera-Barjas, G.; Mardones, C.; Von Baer, D.; Bautista-Baños, S.; Garcia, O.D. Physical-Chemical Evaluation of Active Food Packaging Material Based on Thermoplastic Starch Loaded with Grape Cane Extract. Molecules 2020, 25, 1306. [Google Scholar] [CrossRef] [PubMed]
- Dominici, F.; Puglia, D.; Luzi, F.; Governatori, C.; Tosti, G.; Benincasa, P. The Bran and Grain Grinding Level Affect the Tensile Characteristics of Bioplastics Derived from Wholegrain Wheat Flours. Polymers 2023, 15, 4381. [Google Scholar] [CrossRef] [PubMed]
- Santhosh, R.; Ahmed, J.; Thakur, R.; Sarkar, P. Starch-Based Edible Packaging: Rheological, Thermal, Mechanical, Microstructural, and Barrier Properties—A Review. Sustain. Food Technol. 2024, 2, 307–330. [Google Scholar] [CrossRef]
- Rennert, M.; Nase, M.; Lach, R.; Reincke, K.; Arndt, S.; Androsch, R.; Grellmann, W. Influence of Low-Density Polyethylene Blown Film Thickness on the Mechanical Properties and Fracture Toughness. J. Plast. Film Sheeting 2013, 29, 327–346. [Google Scholar] [CrossRef]
- Szlachetka, O.; Witkowska-Dobrev, J.; Baryła, A.; Dohojda, M. Low-Density Polyethylene (LDPE) Building Films—Tensile Properties and Surface Morphology. J. Build. Eng. 2021, 44, 103386. [Google Scholar] [CrossRef]
- Olam, M. PET: Production, Properties and Applications. In Advances in Materials Science Research; Wythers, M.C., Ed.; Nova Science Publishers: New York, NY, USA, 2022; ISBN 978-1-68507-388-6. [Google Scholar]
- Mikus, P.Y.; Alix, S.; Soulestin, J.; Lacrampe, M.F.; Krawczak, P.; Coqueret, X.; Dole, P. Deformation Mechanisms of Plasticized Starch Materials. Carbohydr. Polym. 2014, 114, 450–457. [Google Scholar] [CrossRef]
- Averous, L.; Boquillon, N. Biocomposites Based on Plasticized Starch: Thermal and Mechanical Behaviours. Carbohydr. Polym. 2004, 56, 111–122. [Google Scholar] [CrossRef]
- Saparová, S.; Ondriš, L.; Kovaľaková, M.; Fričová, O.; Peidayesh, H.; Baran, A.; Hutníková, M.; Chodák, I. Effects of Glycerol Content on Structure and Molecular Motion in Thermoplastic Starch-Based Nanocomposites during Long Storage. Int. J. Biol. Macromol. 2023, 253, 126911. [Google Scholar] [CrossRef]
- Jeziorska, R.; Szadkowska, A.; Studzinski, M.; Chmielarek, M.; Spasowka, E. Morphology and Selected Properties of Modified Potato Thermoplastic Starch. Polymers 2023, 15, 1762. [Google Scholar] [CrossRef]
- Aldas, M.; Pavon, C.; De La Rosa-Ramírez, H.; López-Martínez, J.; Arrieta, M.P. Effect of Processing Temperature Profile during Melt Extrusion on Thermoplastic Starch Production. Food Packag. Shelf Life 2025, 47, 101411. [Google Scholar] [CrossRef]
- Estevez-Areco, S.; Guz, L.; Famá, L.; Candal, R.; Goyanes, S. Bioactive Starch Nanocomposite Films with Antioxidant Activity and Enhanced Mechanical Properties Obtained by Extrusion Followed by Thermo-Compression. Food Hydrocoll. 2019, 96, 518–528. [Google Scholar] [CrossRef]
- Basiak, E.; Lenart, A.; Debeaufort, F. How Glycerol and Water Contents Affect the Structural and Functional Properties of Starch-Based Edible Films. Polymers 2018, 10, 412. [Google Scholar] [CrossRef] [PubMed]
- Tang, X.; Alavi, S.; Herald, T.J. Effects of Plasticizers on the Structure and Properties of Starch–Clay Nanocomposite Films. Carbohydr. Polym. 2008, 74, 552–558. [Google Scholar] [CrossRef]
- Rodríguez-Carpena, J.G.; Morcuende, D.; Andrade, M.J.; Kylli, P.; Estevez, M. Avocado (Persea americana Mill.) Phenolics, in Vitro Antioxidant and Antimicrobial Activities, and Inhibition of Lipid and Protein Oxidation in Porcine Patties. J. Agric. Food Chem. 2011, 59, 5625–5635. [Google Scholar] [CrossRef]
- López-Cobo, A.; Gómez-Caravaca, A.M.; Pasini, F.; Caboni, M.F.; Segura-Carretero, A.; Fernández-Gutiérrez, A. HPLC-DAD-ESI-QTOF-MS and HPLC-FLD-MS as Valuable Tools for the Determination of Phenolic and Other Polar Compounds in the Edible Part and by-Products of Avocado. LWT 2016, 73, 505–513. [Google Scholar] [CrossRef]
- Weremfo, A.; Adulley, F.; Adarkwah-Yiadom, M. Simultaneous Optimization of Microwave-Assisted Extraction of Phenolic Compounds and Antioxidant Activity of Avocado (Persea americana Mill.) Seeds Using Response Surface Methodology. J. Anal. Methods Chem. 2020, 2020, 7541927. [Google Scholar] [CrossRef]
- Figueroa, J.G.; Borrás-Linares, I.; Lozano-Sánchez, J.; Segura-Carretero, A. Comprehensive Characterization of Phenolic and Other Polar Compounds in the Seed and Seed Coat of Avocado by HPLC-DAD-ESI-QTOF-MS. Food Res. Int. 2018, 105, 752–763. [Google Scholar] [CrossRef]
- El-baky, H.H.A.; Farag, R.S.; Saleh, M.A. Characterization of Antioxidant and Antimicrobial Compounds of Cinnamon and Ginger Essential Oils. Afr. J. Biochem. Res. 2010, 4, 167–174. [Google Scholar]
- Alonso, P.; Fernández-Pastor, S.; Guerrero, A. Application of Cinnamon Essential Oil in Active Food Packaging: A Review. Appl. Sci. 2024, 14, 6554. [Google Scholar] [CrossRef]
- Hyldgaard, M.; Mygind, T.; Meyer, R.L. Essential Oils in Food Preservation: Mode of Action, Synergies, and Interactions with Food Matrix Components. Front. Microbiol. 2012, 3, 12. [Google Scholar] [CrossRef]
- Torres, F.G.; Troncoso, O.P.; Torres, C.; Díaz, D.A.; Amaya, E. Biodegradability and Mechanical Properties of Starch Films from Andean Crops. Int. J. Biol. Macromol. 2011, 48, 603–606. [Google Scholar] [CrossRef]
- Srivastava, V.; Singh, S.; Das, D. Development and Characterization of Peppermint Essential Oil/Rice Husk Fibre/Corn Starch Active Biocomposite Film and Its Performance on Bread Preservation. Ind. Crops Prod. 2024, 208, 117765. [Google Scholar] [CrossRef]
- Gomez-Caturla, J.; Ivorra-Martinez, J.; Quiles-Carrillo, L.; Balart, R.; Garcia-Garcia, D.; Dominici, F.; Puglia, D.; Torre, L. Improvement of the Barrier and Mechanical Properties of Environmentally Friendly Mango Kernel Flour/Glycerol Films by Varying the Particle Size of Mango Kernel Flour. Ind. Crops Prod. 2022, 188, 115668. [Google Scholar] [CrossRef]
Disclaimer/Publisher’s Note: The statements, opinions and data contained in all publications are solely those of the individual author(s) and contributor(s) and not of MDPI and/or the editor(s). MDPI and/or the editor(s) disclaim responsibility for any injury to people or property resulting from any ideas, methods, instructions or products referred to in the content. |
© 2025 by the authors. Licensee MDPI, Basel, Switzerland. This article is an open access article distributed under the terms and conditions of the Creative Commons Attribution (CC BY) license (https://creativecommons.org/licenses/by/4.0/).