Abstract
This study chemically characterized three Pleurotus ostreatus fruiting bodies cultivated in the Iberian Peninsula under different conditions (biological and industrial), with emphasis on polysaccharide analysis. Comprehensive comparative data on cultivation-dependent nutritional variations will potentially improve their nutritional and therapeutic applications. Industrial mushrooms (POC and POA) contained significantly higher carbohydrate content (74%), while the biologically cultivated mushroom (POL) exhibited more protein (22.6%), fat (4.2%), and ashes (8.0%). Monosaccharide analysis showed glucose dominance (28.7–45.5%), with mannose, galactose, xylose, and arabinose also present. Trehalose was the primary free sugar (4.8–14.9%). The (1→3)(1→6)-β-glucans varied significantly across samples (POL: 20.5%; POC: 29.3%; POA: 34.3%). Nuclear magnetic resonance analysis suggested complex polysaccharide arrangements. Water-soluble carbohydrates and proteins showed molecular weight distributions of 0.18–21 kDa and 0.20–75 kDa, respectively. All mushrooms were rich in essential amino acids, phosphorus (2.79–3.07%), potassium (0.56–0.68%), linoleic acid (0.82–1.14%), and oleic acid (0.22–0.31%). Fourier transform infrared confirmed a mushroom-specific biochemical profile. These findings corroborate the high nutritional value of POL, POC, and POA, with a significant contribution to the daily requirements of fiber, protein, and minerals (phosphorus, potassium, magnesium, iron, zinc, copper, and selenium), making them suitable for functional foods and nutraceuticals with cultivation-dependent nutritional profiles.
1. Introduction
Mushrooms are increasingly recognized as a next-generation food due to their rich nutritional and bioactive profiles, with diverse applications in functional foods, nutraceuticals, and pharmaceuticals [1,2,3,4]. Although hypocaloric, these macrofungi represent a valuable source of essential nutrients, including polysaccharides, proteins, fatty acids (FAs), and minerals [1,2,5]. Carbohydrates are the most abundant macronutrient (37–87%), positioning mushrooms as a valuable source of dietary fiber (4.5–65%) [6]. Furthermore, mushrooms contain a significant protein content (19–35%), characterized by high digestibility and the presence of essential amino acids (AA). They are also good sources of some important unsaturated fatty acids (UFAs), particularly oleic and linoleic acids, and key minerals, including potassium (K), phosphorus (P), and magnesium (Mg) [1,3,4,7]. The diverse bioactive compounds (e.g., β-glucans, α-glucans, and lectins) found in mushrooms have been associated with numerous health benefits, such as prebiotic, immunomodulatory, antitumor, antiviral, and neuroprotective [2,5,8]. Although most studies focus on mushroom extracts, the interaction of diverse macromolecules has been proposed to enhance the bioactive properties compared to individual fractions [2,9,10], which may be advantageous in functional foods and nutraceutical formulations.
Europe produces about 3% of worldwide mushroom products [11]. For 2025, the European Union Agricultural Committee expects approximately 1 million tons of mushrooms to be produced in Europe. Poland, the Netherlands, and Spain are leading European producers [12,13]. In 2021, most of 79% of Spain’s mushroom and truffle production was exported to Portugal [14,15]. Among edible fungi, Pleurotus ostreatus (PO), known as oyster mushroom, is one of the most widely cultivated species globally [2,16,17,18]. Its popularity emerges from its exceptional nutritional, medicinal, and organoleptic properties, coupled with its easy cultivation [16,17,18]. Different studies demonstrate the versatility of substrates used in PO growth, which can be rich in carbon or nitrogen. This species can grow in several agricultural and industrial wastes (e.g., sawdust, corncob, sugarcane bagasse, tea waste, and wheat bran) [18,19,20]. PO has a short life cycle, and its cultivation requires minimal resources and technological efforts [16,17,18,20].
Although mushrooms within the same species share specific chemical characteristics, significant variations in the biochemical composition are reported in the literature data. These variations arise from differences in strain genetics, substrate composition, cultivation methodologies, and geographic and environmental parameters (e.g., temperature and humidity) [21]. Such variables can considerably influence the mushroom’s macronutrients and bioactive compound profiles. With the increasing consumer demand for healthier and more sustainable food alternatives [3], understanding the chemical variations among mushrooms becomes crucial for optimizing their commercial production and enhancing nutritional and therapeutic applications. Identifying these variations allows the selection of specific mushrooms for targeted dietary requirements and industrial applications [7].
This study aims to chemically characterize three PO fruiting bodies cultivated in the Iberian Peninsula by biological cultivation and industrial-scale cultivation, focusing on their specific biochemical profiles, emphasizing the polysaccharide fraction. The analysis includes a detailed analysis of polysaccharide composition (with a special focus on glucans), carbohydrate molecular weight (MW) distribution, free sugar content, protein MW distribution, as well as AAs, fatty acids, and mineral profiles. Moreover, structural characterization was carried out using nuclear magnetic resonance (NMR) spectroscopy and Fourier transform infrared (FTIR) spectroscopy. By providing a detailed comparative analysis of these chemical profiles and giving special focus on the polysaccharide fraction, this research contributes to a deeper understanding of specific nutritional differences in PO, offering valuable insights into dietary value and potential uses in the food and nutraceutical fields.
2. Materials and Methods
2.1. Chemicals
Ultrapure (UP) water was obtained using a Milli-Q UP purification system (Millipore, Bedford, MA, USA). VWR Scientific (VWR chemicals, Karlsruhe, Germany) and VWR Chemicals (Radnor, PA, USA) supplied sulfuric acid (≥95%), Kjeldahl tablets (catalyst with 0.3% CuSO4·5 H2O), petroleum ether (≥99.9%), and high-performance liquid chromatography (HPLC)-grade solvents (acetonitrile ≥ 99.9%, methanol ≥ 99.9%, isopropanol ≥ 99.8%, hexane ≥ 97%, acetic acid glacial ≥ 99.7%, and dimethylformamide DMF; ≥99.9%). Boric (≥99.5%), nitric (≥65%), hydrochloric (≥32%), trichloroacetic (≥99.5%), propionic (≥99.5%), and trifluoroacetic (≥99%) acids, along with sodium borohydride (98%), ammonium hydroxide, and dimethyl sulfoxide (≥99.7%), were purchased from Merck (Damdstadt, Germany). Sodium hydroxide was sourced from LabChem (Zelienople, PA, USA), and sodium methoxide (≥98%) from Acros Organics (Geel, Belgium). Sigma-Aldrich (St. Louis, MO, USA) provided iodoacetic acid (≥98%), acetic anhydride (≥99%), sodium nitrate (≥99%), sodium tetraphenylborate (≥99.5%), sodium azide (≥99.5%), dichloromethane (≥99.9%), sodium phosphate dibasic (≥99%), benzene-1,2-carboxaldehyde (OPA; ≥97%), iodomethane (≥99%), 2-mercaptoethanol (≥99%), deuterated methanol (≥99%), and all standards for sugars and AA identification and quantification.
The kit for glucans quantification (Yeast and Mushroom β-Glucan; Cat. No. K-YBGL) and sugar standards were acquired from Megaenzyme (Bray, Ireland). Additional reagents included Shodex Pullulan P-82 (5.9–708 kDa) from Shodex (Showa Denko K. K., Tokyo, Japan), minerals standard mix (UCP-3) from Inorganic Ventures (Christiansburg, VA, USA), and tritridecanoic standard (33-1300-13) from Larodan Research Grade Lipids (Solna, Sweden). Protein standards (6.5–669 kDa) were supplied by GE Healthcare (Chicago, IL, USA), while GenScript (Nanjing, China) provided a standard peptide (KGYGGVSLPEW; 99.7%; 1.2 kDa).
2.2. Processing of Fruiting Bodies of Pleurotus ostreatus (PO)
Three distinct PO fruiting bodies were obtained from different cultivation sources in the Iberian Peninsula in October 2023 and coded as follows:
- (a)
- POL: Biologically produced by a local small-scale producer (Penafiel, Porto, Portugal), using pine sawdust and alfalfa as substrates.
- (b)
- POC: Produced by an industrial-scale producer (category II) in Spain and commercially distributed by food retailers.
- (c)
- POA: Produced by an industrial-scale producer (category II) in Portugal and commercially distributed by food retailers.
All fruiting bodies (stems and caps) were processed identically: well-washed with abundant water, cut into uniform pieces, and dried in an air cabinet dryer. The drying conditions were 55 °C for 24 h with a constant air velocity of 1 m/s. Dried samples were milled using a stone miller (Combo mill Paula, Häussler, Deutschland, Germany) and subsequently sieved through an analytical sieve shaker system (model AS 200, Retsch GmbH, Haan, Germany) to obtain a uniform particle size distribution (250 and 500 µm). The powders were preserved in a desiccator away from light before analysis.
2.3. Mushrooms Proximate Composition, Energy Calculation, and Water Activity (aw)
The moisture, protein, ash, fat, and carbohydrates (proximate composition) were determined according to AOAC procedures [22]. A nitrogen-to-protein conversion factor of 4.38 was applied as recommended for mushrooms [23,24]. All determinations were carried out in triplicate (n = 3) and results expressed as g/100 g of dried weight (DW) or fresh weight (FW—in the case of humidity).
For energy calculation (kcal/100 g DW), the following equation [23] was used:
A HygroLab 2 device (Rotronic, Bassersdorf, Germany) was used for water activity (aw) determination. POL, POC, and POA samples were analyzed in triplicate (n = 3).
2.4. Carbohydrate Analysis
2.4.1. Total Monosaccharide Composition
Monosaccharide composition was determined as alditol acetates using gas chromatography (GC) coupled with flame ionization detection (FID), based on the method described by Blakeney et al. (1983) [25], with slight modifications described by Araújo-Rodrigues et al. (2025) [10]. POL, POC, and POA samples were analyzed in triplicate (n = 3), and results were expressed in g/100 g DM.
2.4.2. (1→3)(1→6)-β-glucans and α-glucans Content
Following the manufacturer’s instructions, glucan content in the three mushrooms was quantified using a Yeast and Mushroom β-Glucan assay kit. POL, POC, and POA samples were analyzed in triplicate (n = 3), and results were expressed in g/100 g DM.
2.4.3. Nuclear Magnetic Resonance (NMR) Spectroscopy
Carbohydrate structure was elucidated using 1H NMR (600.13 MHz) and 13C NMR (150.90 MHz), following the methodology described by Araújo-Rodrigues et al. (2025) [10]. All mushroom samples were analyzed in duplicate.
2.4.4. Free Sugars (FSs) Analysis
Free sugars (FSs) were extracted according to the method reported by Heleno et al. (2009) [26], with slight modifications described by Araújo-Rodrigues et al. (2025) [10]. The results were expressed as mg/100 g DW, and all mushroom samples were analyzed in triplicate (n = 3).
2.4.5. Carbohydrate Molecular Weight (MW) Distribution
The MW of carbohydrate fractions POL, POC, and POA was assessed using size exclusion chromatography (SEC) integrated with a high-performance liquid chromatography (HPLC) system, following the method described by Nakahara et al. (2020) [27], with some alterations described by Araújo-Rodrigues et al. (2025) [10]. Each mushroom carbohydrate fraction was analyzed in duplicate.
2.5. Protein Characterization
2.5.1. Free Amino Acids (FAAs) and Total Amino Acids (TAAs) Analysis
Free amino acids (FAA) and total amino acids (TAA) were determined based on the methods described by Kim et al. (2009) [28] and Oliveira et al. (2022) [29], respectively, with minor modifications described by Araújo-Rodrigues et al. (2025) [10]. Derivatization and chromatographic analysis followed the method of Pripi-Nicolau et al. (2000) [30]. Results were expressed as mg/100 g DW. All mushroom samples were analyzed in triplicate (n = 3) for FAAs and TAAs quantification.
2.5.2. Protein and Peptide Molecular Weight (MW) Distribution
The protein and peptide profiles of the POL, POC, and POA fractions were analyzed using fast protein liquid chromatography-gel filtration (FPLC), following the method described by Araújo-Rodrigues et al. (2025) [10]. Each mushroom sample was analyzed in duplicate.
2.6. Mineral Profile
The mineral profile of three mushroom samples was determined through acid digestion in a microwave system and inductively coupled plasma-optical emission spectrometry (ICP-OES) analysis, as described by Araújo-Rodrigues et al. (2025) [10]. All mushroom samples were analyzed in triplicate (n = 3), and results were expressed in mg/100 g DW.
2.7. Fatty Acids (FAs) Profile
Fatty Acids (FAs) Preparation
Fatty acid (FA) profiles were analyzed through GC-FID of FA methyl esters (FAMEs), according to Pimentel et al. (2015) [31]. The results were expressed as mg/100 g DW. POL, POC, and POA samples were analyzed in triplicate (n = 3).
2.8. Fourier Transform Infrared (FTIR) Spectroscopy Analysis
Mid-infrared spectra were recorded using a PerkinElmer Spectrum BX FTIR System spectrophotometer (USA) equipped with a DTGS detector, as described by Araújo-Rodrigues et al. (2025) [10]. Each mushroom sample was analyzed in duplicate.
2.9. Statistical Analysis
Statistical analyses were performed using SPSS software (version 28.0). The Shapiro–Wilk test assessed data normality (n < 50), while Levene’s test evaluated the homogeneity of variances across groups. All data met these assumptions, with p > 0.05 for both tests. Differences between mushroom samples (POL, POC, and POA) were assessed by one-way analysis of variance (ANOVA) with a significance level of p < 0.05. Post hoc multiple comparisons were performed using Tukey’s honest significant difference (HSD) test. Sample sizes for each analysis are specified in the corresponding materials and methods subsection and Figures and Table legends.
3. Results and Discussion
3.1. Proximate Composition
The centesimal composition of the selected PO samples (POL, POC, and POA) is presented in Table 1. Significant differences were found in water content (6.34–7.43% FW), although all mushrooms had water content below 8% FW. Drying and storage conditions are key factors in determining water content. However, since all mushroom samples in this study underwent the same drying technology (hot air drying), time (24 h), temperature (55 °C), and storage conditions (in a desiccator, protected from light, and under vacuum conditions), the observed differences may be attributed to variations in chemical composition. For instance, carbohydrate content can influence water retention post-drying. However, no considerable differences were found in aw, with values of approximately 0.33, indicating that POL, POC, and POA are stable and safe as dry products, since aw below 0.6 constrains microbial growth [32,33].

Table 1.
Proximate composition (1 g/100 g FW; 2 g/100 g DW; or 3 kcal/100 g DW) of POL, POC, and POA Pleurotus ostreatus species. Results are expressed as mean ± standard deviation based on three independent replicates (n = 3).
The results suggest a significantly lower carbohydrate content in the POL (66.28% DW) than in POC and POA (around 74.10% DW). Carbohydrates are the predominant macronutrient in mushrooms, with the literature values ranging from 37 to 86% DW [2,4,17,23,34,35,36,37,38]. Although the carbohydrate content of all samples is aligned with the literature data, POL exhibited a slightly lower carbohydrate content, possibly due to its significantly higher protein content (22.55% DW). In contrast, POC and POA contain approximately 16.00% DW of protein. From a nutritional perspective, mushrooms are recognized as good sources of protein compared to other non-animal protein sources [39], with values generally ranging from 19 to 39% DW [4,9,40]. In Pleurotus spp. literature data, protein content has been reported between 7 and 42% DW [17,34,35,36,41]. All mushrooms, especially POL, significantly contribute to the daily average requirement (AR) for protein consumption recommended by the European Food Safety Authority (EFSA) of 0.66 g/kg of body weight.
Ash content varied from 7.06 to 7.97% DW, with POL exhibiting a significantly higher value. Typically, mushroom ash content ranges from 4 to 15% DW [42]. The literature reports indicate that PO ash content varies from 4 to 10% DW [16,23,35,37,43], aligning with the present study. Concerning the fat content, a significantly higher content was found in POL (4.21% DW), with the POC and POA fat content values between 2.75 and 2.88% DW. According to the literature data, fat content in mushrooms typically varied from 0.1 to 8% DW [42]. Specifically, reports on PO species suggested a fat content of 0.5–5% DW [23,34,35,37,42], aligning with the present study results.
Generally, mushrooms have energy values below 400 kcal/100 g DW [42]. Some studies report PO energy values ranging from 326 to 387 kcal/100 g DW [23,35,36]. The energy values found in this study align with these reports. A significantly lower energy value was registered for POA (339.04 kcal/100 g DW), mainly due to the lower fat and protein contents. POL and POC had energy values of approximately 344.35 and 345.63 kcal/100 g DW.
Species and genetic diversity play a crucial role in the chemical composition of mushrooms. Within the same species, variations in substrate, cultivation, and harvest conditions significantly impact the chemical and bioactive profiles [4,9,24,37]. The observed compositional differences among POL, POC, and POA may be related to the differences in the substrate and cultivation methods. The industrially grown POC and POA exhibited markedly higher carbohydrate levels, whereas the biologically cultivated POL exhibited considerably more protein, fat, and ash. Such cultivation factors may directly influence carbohydrate distribution in both fruiting bodies and mycelia [21].
Small-scale mushroom producers usually produce between 10 and 100 kg of mushrooms per week, while medium- and large-scale producers produce higher amounts. In industrial-scale production, standardized and mechanized processes are generally applied, including the use of optimized substrates, strict control of environmental conditions, and automatic systems for irrigation and harvesting [44]. The controlled conditions include temperature, humidity, CO2, and light [20,44]. They are generally also grown on optimized lignocellulosic substrates (e.g., substrates rich in cellulose, hemicellulose, and lignin). These conditions and substrates provide abundant polysaccharide precursors and may lead to fast growth, favor carbohydrate accumulation, and yield carbohydrate-rich mushrooms [18]. In contrast, biologically cultivated mushrooms are often grown on diverse agro-waste materials (in this case, pine sawdust and alfalfa), with higher nitrogen-to-carbon ratios. This may result in slower growth but with higher nitrogen and lipid precursors, allowing more time for assimilation and consequent protein and lipid accumulation in the fruiting bodies [18,20], and increased ash content due to mineral uptake from organic waste substrates [18,19,20]. Less controlled environmental conditions may also trigger stress responses in POL that stimulate the production of certain proteins as adaptive mechanisms [45].
3.2. Carbohydrate Composition
3.2.1. Monosaccharide Composition
The main chemical characterization approaches of carbohydrates encompass monosaccharide composition analysis, MW analysis, and structure analysis by NMR spectroscopy [5]. The total monosaccharide composition of POL, POC, and POA is presented in Table 2. The most prevalent monosaccharide across all samples was Glc, with a significantly higher concentration in POC and POA (44.69–45.50% DW). POL exhibited a significantly higher concentration of galactose (Gal, 1.23% DW) and xylose (Xyl, 0.58% DW). Arabinose (Ara) content ranged from 0.24 to 0.31% DW, with POA showing significantly higher concentration compared to POC. No significant differences were found in the Gal concentration, with values ranging from 0.93 to 1.23% DW.
Table 2.
Total monosaccharide composition (g/100 g DW) of POL, POC, and POA Pleurotus ostreatus species. Results are expressed as mean ± standard deviation based on three independent replicates (n = 3).
The predominance of Glc monomers aligns with the expected presence of glucan-type structure, suggesting a considerable concentration of glucans in these samples [10,46]. However, the results suggested that the mushroom polysaccharides of the three mushrooms are heteropolysaccharides, suggesting a possible structural diversity due to the presence of different types and glycosidic bond sequences [5]. Most literature studies also suggest that polysaccharides present in PO are heteropolysaccharides [47,48]. Additionally, polysaccharides containing Man have also been described in several mushroom species [1]. The substrate and growing conditions generally applied in industrially cultivated mushrooms may provide abundant polysaccharide precursors. This may result in higher carbohydrate contents [18], aligning with higher content of total monosaccharides present in POC and POA.
3.2.2. Glucan Content
Table 3 presents the glucan composition of POC, POC, and POA. The results suggested that POA and POC have a significantly higher total glucan content (47.58 and 45.06% DW, respectively), while POL exhibited the lowest total glucan content (28.14% DW). Concerning (1→3)(1→6)-β-glucans, considerable differences were found in the three mushroom samples, with POL showing the lowest content (20.51% DW) and POA the highest content (34.30% DW). Significant differences were also found in the content of α-glucans and β-glucans with different linkages than (1→3)(1→6)-β-glucans, with values ranging from 7.63 (POL) to 15.81% DW (POC). These three mushrooms are good contributors to the adequate intake (AI) of dietary fiber for adults, recommended by the EFSA (25 g/day) [49]. The ratio of α/β-glucans is highest in POC (0.54), followed by POA (0.38) and POL (0.37), corroborating the relatively higher α-glucan content in POC.
Table 3.
Glucan composition (g/100 g DW) of POL, POC, and POA Pleurotus ostreatus species. Results are expressed as mean ± standard deviation based on three independent replicates (n = 3).
Sari et al. (2017) [50] screened the glucan content of 39 commercially or locally cultivated and wild-growing mushrooms, while McCleary and Draga (2016) [51] investigated 18 mushroom species, both studies including Pleurotus species. In these studies, β-glucans varied from 7.2 to 57.9% DW and α-glucans from 0.2 to 75.9% DW. Specifically, the reported values for PO species were 0.4–1.4% DW and 24.2–38.0% DW for α-glucans and β-glucans, respectively [50,51,52]. In the first study, local and wild production occurred in North Rhine-Westphalia in Germany. Specifically, PO, Pleurotus eryngii, P. citrinopileatus, P. pulmonarius, and P. djamor were grown by local producers. The last four species exhibited β-glucans contents between 15.4 and 21.7%. The total glucan concentrations found in POL (28.1% DW) were similar to those found by Sari and colleagues in these Pleurotus spp. species (18.3–25.6% DW) also produced by a local producer [50]. McCleary and Draga (2016) [51] studied mushrooms supplied by a Canadian company that sells organic mushrooms, with total glucan values for Pleurotus spp. between 32.2 and 39.8% DW, aligning with POL results [51]. These comparisons highlight the geographic impact on glucan content and composition. Additionally, this reinforces the importance of biological production in carbohydrate and glucan content, which may yield mushrooms with lower glucan and total carbohydrate concentration than industrial mushrooms.
Typically, (1→3)(1→6)-β-glucans are the most prevalent in mushrooms, aligning with the present study [28,46]. The mushroom β-glucans reported values are generally consistent with the present study, although α-glucan levels are slightly higher than PO. This variation might be explained by the higher concentrations of α-glucan typically found in mushroom caps and stems, coupled with the growing conditions and genetic parameters affecting glucan synthesis [20]. Generally, α-glucans comprise less than 10%, corresponding to approximately a quarter of total glucans. However, Sari et al. (2017) reported α-glucan values corresponding to approximately half of the total glucan concentration in some caps of the studied species [50]. In contrast, the quantification method used in this study is specifically designed for the quantification of (1→3)-β-glucans and (1→6)-β-glucans, which are the most common in yeast and mushrooms [28,46]. Enzymes used in the assay are the main reason for this selectivity. Specifically, exo-1,3-β-glucanase and β-glucosidase hydrolyze (1→3)-β- and (1→6)-β-glucosidic bonds present in yeast and mushroom β-glucans. Accordingly, α-glucans quantification includes other β-glucans with different linkages than (1→3)-β-glucans and (1→6)-β-glucans, such as (1→4)-β-glucans. Although less reported, (1→4)-β-glucans have also been identified in mushrooms [46].
The significant differences in these groups suggest structural variations in POL, POC, and POA. As extensively described in the literature, the α- and β-stereochemical differences result in different biological properties. While the biological potential of β-glucans has been well-established in recent decades, for example, their anti-inflammatory, antitumor, antiviral, and antidiabetic activities, the literature data on α-glucans mainly focuses on isolation and structural characterization. The biological data for α-glucans is scarcer and limited, although some studies suggest immunomodulatory and prebiotic activities [2,53].
Several works suggested the antioxidant and antiaging properties of polysaccharide extracts of PO, Pleurotus sajor-caju, P. eryngii, and other Pleurotus spp. [54,55,56]. Additionally, β-glucans extracted from Pleurotus spp. exhibited strong anti-inflammatory potential [57,58]. Hypoglycemic and antihyperglycemic effects were also associated with β-glucans isolated from Pleurotus spp. [59]. Moreover, numerous studies have reported the immunostimulant potential of mushroom β-glucans, including those extracted from Pleurotus spp., such as pleuran (isolated from PO). These immunomodulatory properties include cytokine production modulation, lymphocyte proliferation promotion, and macrophages’ phagocytic function [55,60]. Pleuran also exhibited antiviral activity, showing promising results in the treatment of herpes simplex virus type 1 and related symptoms and infections [61], and in flu and respiratory tract infections [62].
3.2.3. Structural Analysis by Nuclear Magnetic Resonance (NMR) Spectroscopy
The structural characteristics of the mushroom samples were further examined by NMR spectroscopy, with emphasis on α- and β-anomeric protons. Figure 1 displays the 1H and 13C HSQC spectra of POL, being the spectra from the other PO samples overlapped. The α-anomeric protons H-1 appeared as doublets in the 5.1–5.2 ppm, while the β-anomeric proton H-1 was observed between 4.2 and 4.6 ppm. These assignments were based on distinct chemical shifts and their correlations with the glucose C1 carbon signals in the HSQC spectra—specifically, 92–94 ppm for α-C1 and 96 ppm for C1—as well as coupling constants J = 3.8 and 7.9 Hz, respectively. The assignments were further validated through COSY spectral analysis [5,63].
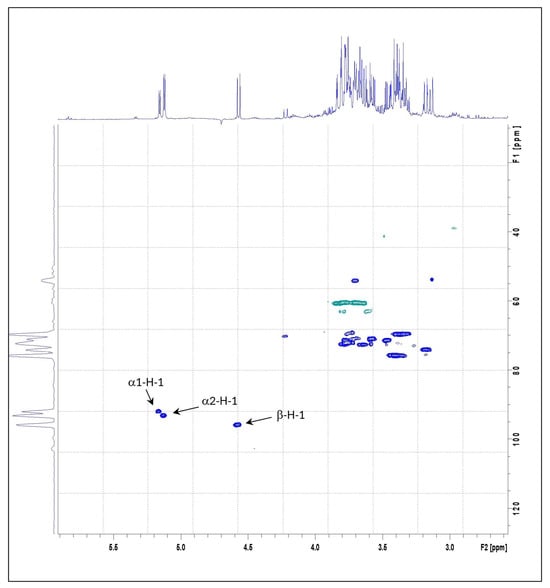
Figure 1.
Heteronuclear Single-Quantum Correlation Spectroscopy (HSQC) correlation spectrum of POL Pleurotus ostreatus species.
The 1H NMR spectra of the three samples revealed similar profiles in the anomeric region, displaying three prominent cross-peaks: one corresponding to a β-anomeric proton and two to α-anomeric protons. The relative abundance of α- and β-anomeric protons in each sample was quantified by integrating the corresponding 1H NMR signal areas (Table 4). Among the samples, POA exhibited the highest relative content of both α- (2.65) and β-anomeric (1.06) protons. In contrast, POC showed the lowest α-anomeric proton content (1.60), while POL exhibited the lowest β-anomeric proton content (0.91).
Table 4.
The relative composition of α- and β-anomeric protons of POL, POC, and POA Pleurotus ostreatus species.
The observed α/β anomeric proton ratios (Table 4) were higher (between 1.64 and 2.51) than the corresponding ratios obtained by the glucan quantification kit (Table 3). This may suggest that most of the α-anomeric protons detected by NMR may arise from branching points or terminal residues, rather than linear α-glucan chains. POC exhibited the lower α/β ratio anomeric proton ratio (1.64), but a considerably higher α-glucan content (15.81 g/100 g DW; Table 3). This suggests that in POC, a higher presence of α-glucans chains may be present compared to POL and POA. These findings highlight that the α- and β-glucans present in these mushroom samples may possess diverse and complex structural arrangements, which align with previous reports on the structural complexity of fungal glucans [2,5,64].
3.2.4. Free Sugars (FSs) Profile
Table 5 summarizes the FS composition of POL, POC, and POA. Total FS content varied significantly among the samples, ranging from 8.86 to 16.68% DW, with POL showing the lowest and POC the highest levels. Trehalose (Tre) was the most prevalent FS across all samples, with concentrations ranging from 4.78 to 14.88% DW. Consistent with previous findings, this FS is typically abundant in mushrooms, with typical concentrations ranging from 8 to 17% DW [3]. The concentration of Tre varies during development, primarily accumulating in the mushroom fruiting body [21]. Tre serves as a key stress-protective molecule against temperature, dehydration, nutrient limitation, and other environmental stressors [1,21]. Due to its sweetening, cryoprotective, and prebiotic potential, this high-value sugar has been extensively applied in functional food and nutraceuticals [3].
Table 5.
Free sugar (g/100 g DW) composition of POL, POC, and POA Pleurotus ostreatus species. Results are expressed as mean ± standard deviation based on three independent replicates (n = 3).
Reis et al. (2012) [23] also identified Tre as the most prevalent FS in PO, but reported a concentration of 40.81% DW. In this study, the mushroom samples were obtained in supermarkets in Bragança (Portugal). Although the authors did not give details about the production system, the higher carbohydrate content (in the case of PO, 85.87% DW) and Tre may suggest that the mushrooms studied result from production with optimized substrates rich in carbon containing cellulose, hemicellulose, and/or lignin (e.g., sawdust, rice and wheat straw, and sugarcane) [18].
Glc and sucrose (Suc) were also detected in all samples. POL exhibited the highest concentration of Glc (2.35% DW) and Suc (0.51% DW), followed by POA (with 1.85 and 0.18% DW of Glc and Suc, respectively), and POC (with 0.78 and 0.13% DW of Glc and Suc, respectively). The remaining sugars detected were only quantified in specific samples. Xyl was only detected in POC and POA (0.11 and 0.88% DW, respectively), while fructose (Fru) was only detected in POL (0.26% DW), and Gal in POC (0.78% DW).
Beyond Tre, Reis et al. (2012) also detected Fru (0.09% DW) and mannitol (4.99% DW) in PO species [23]. Although cultivation also probably occurred in the Iberian Peninsula, the differences in the FS profile may be related to the cultivation methods and substrate used. Kim et al. (2009) [28] reported the FS composition of PO and nine other mushroom species from Korea, also identifying the presence of Glc (1.42% DW) and Tre (0.30% DW) in PO. PO and the other edible species were obtained from supermarkets in Seoul, while the medicinal species were from a mushroom farm located in Gangwondo [28]. This comparison between Iberian and Korean cultivated mushrooms demonstrates significant regional differences, with Iberian mushrooms showing considerably higher Tre content. Beyond differences in chemical composition between medicinal and edible species, the cultivation methodology applied may also contribute to the higher FS composition found in edible mushrooms. Other authors also detected Glc, Xyl, Gal, Fru, but also Erythrose, which was not detected in the present study. In the reported study, PO was grown in Nigeria, and the substrate used was rice straw and sawdust, and similar drying processing conditions were used [36]. Although Glc was also the most prevalent FS, different growing geographic locations and variations on substrate may justify the differences in monosaccharide profiles.
The literature data shows a considerable variation in the FS profile and concentration, possibly due to different substrates, cultivation, harvest conditions, and geographic location [4,9,24,37].
3.2.5. Molecular Weight (MW) Distribution of Carbohydrates
The MW distribution of carbohydrates determined by HPLC-SEC from POL, POC, and POA is illustrated in Figure 2. The analysis revealed a predominant presence of low MW carbohydrates, ranging from 0.18 to 21 kDa, with the highest concentration observed between 0.18 and 6.1 kDa. This MW range mainly corresponds to monosaccharides, disaccharides, and oligosaccharides. The detected polysaccharides with higher MW (9.6–21 kDa) align with the characteristic MW profile of mushroom polysaccharides, including chitin, α-glucans, β-glucans, galactans, xylans, and mannans, typically ranging from 5 to 2000 kDa [2]. Specifically, β-glucans’ MW ranges from ten to thousands of kDa [5]. The MW of glycan-binding proteins usually ranges between 12 to 120 kDa [9], also in accordance with the MW found in the present study.
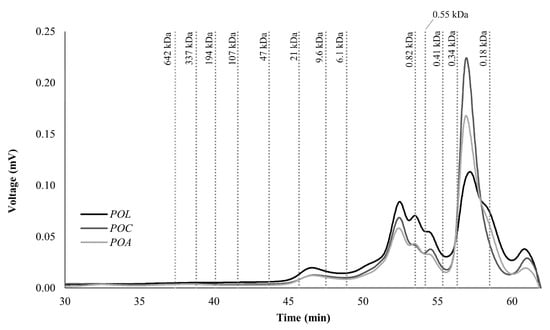
Figure 2.
Molecular weight (MW) distribution of polysaccharide profile by size exclusion chromatography (SEC) of POL, POC, and POA Pleurotus ostreatus species.
Zhang et al. (2012) isolated and characterized in vitro antioxidant properties of PO polysaccharides cultivated in China with an MW of 11 and 18 kDa [65]. Other authors also isolated polysaccharides with an MW between 11.8 and 48.6 kDa in PO grown in Henan Agricultural University in China [66]. Both polysaccharide MWs align with the present study. Other authors also report polysaccharides isolated from PO with higher MW. For example, Maity et al. (2011) isolated a heteropolysaccharide with 187 kDa from PO cultivated from a Jalpaiguri mushroom farm (India) [67]. Pleuran, a well-recognized β-glucan isolated from PO, typically also exhibits an MW between 600 and 700 kDa [2]. However, polysaccharides in this higher MW range were not detected in the present study, probably due to the absence of additional extraction steps or pre-treatments typically used in studies focused on mushroom polysaccharide isolation and characterization. This may result in insolubility and non-detection of high-MW polysaccharides under these experimental conditions. Additional extraction and purification steps were not applied in this study, as the focus was on characterizing the entire fruiting bodies and evaluating their nutritional value. Apart from variability in polysaccharide fraction, the variability of MW registered in the literature also results from differences in extraction and determination methodologies [46].
3.3. Protein Composition
3.3.1. Free Amino Acid (FAA) and Total Amino Acid (TAA) Profile
Proteins are the second most abundant macronutrient in mushrooms and play a vital role in human nutrition and health [2,9,24]. The profiles of FAAs and TAAs present in POL, POC, and POA are presented in Table 6. Mushrooms are recognized as a valuable source of essential AAs [2,9,24], particularly beneficial for vegetarian diets [7]. Of the nine essential AAs, histidine (His) was not detected in this study. Tryptophan (Trp) was only identified in FAA analysis, as it is susceptible to degradation during acid hydrolysis and could not be quantified in the TAA analysis. Similarly, asparagine (Asn) and glutamine (Gln) undergo deamination under acid conditions, converting to aspartic acid (Asp) and glutamic acid (Glu), respectively. Therefore, Asp and Glu concentrations in the TAA analysis reflect the combined content of Asp + Asn and Glu + Gln [68]. Notably, Asn was absent from the TAA profile, while Gln was undetected in both TAA and FAA analyses.
Table 6.
Total (TAAs) and free amino acids (FAAs) identified and quantified (mg/100 g DW) of POL, POC, and POA Pleurotus ostreatus species. Results are expressed as mean ± standard deviation based on three independent replicates (n = 3).
In the FAA analysis, POL exhibited the highest concentrations of essential AAs, including threonine (Thr; 7.76 mg/100 g DW), Trp (13.27 mg/100 g DW), isoleucine (Ile; 4.36 mg/100 g DW), leucine (Leu; 6.29 mg/100 g DW), and lysine (15.96 mg/100 g DW). POL contained more than twice the content of Lys and Trp than the other mushrooms, suggesting its potential as a rich dietary source of these essential AAs. As a precursor of neurotransmitters and vitamin B3, Trp plays an important role in brain function and insulin secretion [7]. Among the non-essential AAs, alanine (Ala), Glu, and serine (Ser) were the most abundant, with concentrations ranging from 5.84 to 15.01 mg/100 g DW in the three species. Effiong et al. (2023) [36] reported similar levels of these AAs in PO but found considerably higher Asp concentrations, which were the most prevalent FAA in their study. The different geographic location (Nigeria) and specific substrate used (rice straw and sawdust) may result in a significantly higher concentration of Asp [36]. Previous studies have identified Ile, Leu, and Thr as the dominant FAAs in Pleurotus spp. [69], along with Ala, Glu, and Ser in PO strains [28]. Yin et al. (2019) [69] studied six Pleurotus species, including PO, cultivated in Wuhan (China) under biological production with poplar sawdust (corresponding to approximately 80%) and rice bran (less than 20%) as a substrate. These conditions may favor their rich FAAs’ profile [69]. As previously discussed, Kim et al. (2009) [28] compared the carbohydrate and FAA profiles of edible and medicinal mushrooms produced in Korea. Although the differences in cultivation methods, this study highlights the differences in FAA composition between medicinal and edible mushrooms since edible mushrooms generally possess higher protein content [28].
Concerning the TAA profile, Glu and Ala were the most abundant AAs in the three mushrooms. Significant differences were found in Ala content, with POL exhibiting the highest content (5382.72 mg/100 g DW) and POC the lowest (665.30 mg/100 g DW), suggesting possible specific variations according to the cultivation methods. Glu concentrations ranged from 1242.10 to 1425.80 mg/100 g DW, with no significant differences between mushrooms. Previous studies on PO and other mushroom species have identified Asp and Glu as the most prevalent in PO [1], for instance, in mushrooms produced in Paraná state (Brazil) [7] and Nakhon Ratchasima (Thailand) [37]. The higher prevalence of these AAs even in different species and grown in distinct geographical areas may be related to their role as precursors in AA metabolism [7]. Glu is also involved in cell signaling, immunity, and antioxidant responses [70].
Among the essential AAs, Leu was the most abundant across all mushrooms, with concentrations ranging between 659.39 and 719.39 mg/100 g DW, but no significant differences were observed. This aligns with previous reports on Pleurotus spp. AA analysis [3], for example, in PO grown in Nigeria [35]. Other essential AAs, including phenylalanine (Phe), Ile, Lys, methionine (Met), and valine (Val), varied between 220.76 and 573.01 mg/100 g DW. These AAs play numerous vital roles in human health. For example, Leu, Val, and Ile are involved in metabolism and energy homeostasis [70]. While POL exhibited the highest concentration of essential AAs, Lys content was significantly higher in POC (573.01 mg/100 g DW), followed by POA (405.96 mg/100 g DW). Despite being detected in all mushrooms, Thr was present at considerably lower concentrations (11.97–16.30 mg/100 g DW) than other essential AAs.
POL demonstrated the highest FAA content (116.31 mg/100 g DW), compared to POC’s lowest concentration (59.20 mg/100 g DW). TAA content followed a similar pattern, with POL exhibiting a high concentration of TAA (11,955.52 mg/100 g DW), followed by POA and POC with values of 7390.47 mg/100 g DW and 6270.63 mg/100 g DW, respectively, with considerable differences between mushrooms. The literature indicates substantial variation in both FAA and TAA levels among Pleurotus spp. and other mushroom species, with edible mushrooms typically showing higher FAA concentrations than medicinal species [28]. Previous studies report contrasting values: Nigerian-grown PO contained 632 mg/100 g DW of FAA [36], while TAA in PO grown in Korea, Nigeria, Thailand, and Brazil ranged from 13 to 22 g/100 g DW [7,28,35,37]. The markedly lower FAA levels in Iberian cultivated mushrooms compared to Nigerian mushrooms suggest that geographical environmental differences between Europe and Africa, along with cultivation practices, directly influence AA metabolism and protein synthesis.
Although it is possible to identify a pattern in PO AA profiles, such as predominance of Glu, Ala, and Leu, these comparative studies highlight the distinct AA profiles between the Iberian Peninsula, African, American, and Asian cultivated mushrooms, highlighting how geographic conditions coupled with cultivation approaches influence nutritional composition. This study highlights significant variations in FAA and TAA content and composition among the three PO mushrooms, suggesting potential differences in AA metabolism. As previously discussed, the biological cultivation of POL with higher nitrogen precursors may result in higher protein synthesis [16,18]. From a nutritional perspective, POL possesses interesting AA content, exhibiting higher concentrations of essential AAs, except for Lys, which was more abundant in POC.
3.3.2. Molecular Weight (MW) Distribution of Protein and Peptides
The chromatograms of protein and peptide profiles (water-soluble fraction) obtained for POL, POC, and POA by FPLC are presented in Figure 3. The results suggest that POC and POA showed similar chromatographic profiles with different peak intensities. POL exhibited a distinct chromatographic profile compared with the other mushrooms, indicating cultivation-specific protein and peptide composition variation, as found in the AA composition. The chromatograms revealed the presence of multiple proteins and peptides in all mushrooms, ranging from approximately 75 kDa to 0.204 kDa. All mushrooms demonstrated a predominance of lower MW peptides (<1.2 kDa). Among the mushrooms, POL exhibited the highest peak intensities, which can be correlated with its higher protein content (Table 1).

Figure 3.
Molecular weight (MW) distribution chromatogram of protein and peptide profile by fast protein liquid chromatography (FPLC) of POL, POC, and POA Pleurotus ostreatus species.
Mushrooms possess diverse functional proteins and bioactive peptides, notably lectins and fungal immunomodulatory proteins (FIP) [1,4,9,71]. Additionally, protein-polysaccharide complexes and active enzymes such as peroxidases and laccases have been identified in these macrofungal [4]. The higher MW proteins found in Figure 3 (29–75 kDa), particularly with higher peak intensities in POC, may correspond to lectins, which have been previously identified in PO fruiting bodies with an approximate MW of 40 kDa and exhibiting antitumor properties [72]. The results suggest a possible residual presence of this protein group. The approximate MW of FIPs is typically 13 kDa [4]. Additionally, pleurostrin, an antifungal peptide with a MW between 9 and 15 kDa, was previously identified in PO [73,74]. Although with a relatively low intensity, this MW range was also detected, especially in POC. Proteins between 10 and 50 kDa were also isolated from PO cultivated in China [75]. The higher abundance of low MW peptides (<1.2 kDa) observed across the three mushrooms may suggest the presence of peptides with significant bioactive properties, such as antioxidant and antitumor activities [73,74,76]. A wide range of proteins and peptides were identified in PO cultivated in Mexico with sorghum substrate. The results indicated the presence of MW peptides between 12 and 35 kDa, suggesting possible bioactive properties [73]. As reviewed by Zhou et al. (2020), several antimicrobial peptides were isolated from different mushroom species, including from PO [74]. The specific differences in peptide profiles observed may contribute to variations in bioactivity between these PO mushrooms, with variations according to geographic and cultivation methodologies.
3.4. Mineral Composition
In Table 7, the results of mineral composition in POC, POC, and POA are presented. The results showed considerable differences in the total mineral concentration (3602.27–3777.01 mg/100 g DW), with POA showing significantly higher total mineral content than POL and POC. In the present study, 14 minerals were identified and quantified, including macrominerals and trace elements. K emerged as the most abundant mineral across all samples, followed by P and Mg. K concentrations ranged from 2787.25 to 3073.90 mg/100 g DW, with POA showing significantly higher levels. P and Mg exhibited notable variations among the three mushroom varieties, with POL demonstrating the highest values (678.00 and 138.24 mg/100 g DW, respectively) and POA the lowest (564.20 and 102.38 mg/100 g DW, respectively). Regarding other macrominerals, Ca and Na concentrations ranged from 0.93 to 10.72 and 17.92 to 23.95 mg/100 g DW, respectively, with POL containing the highest levels and POC the lowest in both cases.
Table 7.
Mineral composition (1 mg/100 g DW; or 2 µg/100 g DW) of POL, POC, and POA Pleurotus ostreatus species. Results are expressed as mean ± standard deviation based on three independent replicates (n = 3).
Minerals play numerous essential roles in human health, namely in growth and body function [36,77]. Mushrooms are typically a good source of minerals, with a higher accumulation of P and K in the fruiting bodies [24]. These macrofungi generally contain high K, P, and Mg content, moderate Ca content, and low Na values [8,36], in accordance with the profile of the present study. Concentrations between 466 and 4000 mg/100 g DW of K [42,78,79], 50 and 497 mg/100 g DW of P [42,79], and 9 and 340 of Mg [42,78,79] were reported in PO chemical characterization works, for example, cultivated in Nigeria and Bangladesh. These data align with the present study, except for P, where a considerably higher concentration was found in this study. These comparisons reveal a common pattern between globally produced PO. However, the higher P concentration found in these Iberian cultivated mushrooms compared to mushrooms cultivated in Africa and Asia may suggest specificities in mineral accumulation and metabolism.
An AI in adults of 550, 300–350, and 3500 mg/day of P, Mg, and K, respectively, is recommended by EFSA [36,49]. Accordingly, POL, POC, and POA are good contributors to the AI of P, Mg, and K. P is involved, for example, in cellular signaling and bone health, while K is involved in nervous and muscle function. Mg is key in protein synthesis and nerve transmission [77]. The Na/K ratio is an important parameter associated with cardiovascular health preservation. In all samples, the ratio was lower than 0.01. The EFSA recommends the safe and adequate intake of 2 g/day in adults of Na [36,49]. POL, POC, and POA represent a small contribution to the daily consumption of this mineral. Ca concentration in PO generally ranges from 0.01 to 50 mg/100 g [16,36,42], aligning with the present data and corroborating that mushrooms are not a good source of Ca since adults’ AR is 750–860 mg/day.
Among the trace elements, Zn and Fe were present in relatively high amounts, with concentrations ranging from 5.98 to 9.39 mg/100 g DW for Zn and 4.23 to 8.63 mg/100 g DW for Fe. Some reported values for Zn and Fe in PO between 0.27 and 27, and 0.96 and 65 mg/100 g DW, respectively [16]. The AR for Zn is between 6.2 and 10.2 mg/day. For Fe, it is 6 mg/day, indicating that the three mushroom samples significantly contribute to the daily AR of these minerals. Mn content varied between 0.70 and 0.84 mg/100 g DW without significant differences between mushrooms. Some reports for Mn content in PO cultivated in Bangladesh exhibited higher concentrations (0.5–3 mg/100 g DW) [78]. Comparing these Iberian cultivated mushrooms with Asian cultivated mushrooms, specific mineral accumulation and metabolism patterns are also suggested. These microelements are cofactors of antioxidant enzymes, considered essential antioxidant micronutrients. Cu is also a vital mineral, being a cofactor of several important enzymes [4,77], and its AI is between 1.3 and 1.6 mg/day in adults [49]. The content of Cu ranged from 0.93 and 1.13 mg/100 g DW, with a significantly lower concentration in POC. All mushrooms are also good contributors to the daily AI of Cu. Al and Co exhibited concentrations lower than 0.67 mg/100 g DW in all mushrooms. Se is an essential micronutrient with antioxidant and immunomodulatory properties [77] detected in concentrations between 0.04 and 0.10 mg/100 g DW in all mushrooms, with POL containing significantly higher concentrations. The daily AI of Se is 70 µg, with all mushrooms as good sources of Se, especially POL.
Regarding potentially toxic elements, in all mushrooms, the detected levels of Cd and Pb were below 20 µg/100 g DW. These values were lower than the Effiong et al. (2023) [36] report for PO (produced in Nigeria). Accordingly, these values are below the recommended daily allowance for these minerals, corroborating that these mushrooms are safe and do not contribute to heavy metal toxicity [36]. POL exhibited higher concentrations of most minerals (P, Mg, Ca, Fe, Se); however, POA had the highest overall mineral content, primarily due to its significantly elevated concentration of K, which was the highest among all mushrooms. The differences in growing conditions and metabolic requirements may result in specific mechanisms for mineral absorption in each mushroom [4,9,24,37].
3.5. Fatty Acid (FA) Composition
The FA profile of POL, POC, and POA is presented in Table 8. POL exhibited the highest content of total FAs identified and quantified (1917.28 mg/100 g DW) in accordance with centesimal characterization results (Table 1) but without significant differences compared with POA (1742.12 mg/100 g DW). The results indicate that POA possessed the lowest concentration of total FAs quantified, namely 1411.37 mg/100 g DW.
Table 8.
Fatty acid (FA; mg/100 g DW) composition of POL, POC, and POA Pleurotus ostreatus species. Results are expressed as mean ± standard deviation based on three independent replicates (n = 3).
Linoleic acid was the most prevalent FA in the three mushrooms, ranging from 819.95 to 1140.47 mg/100 g DW (with a significantly lower content in POA). The second most abundant FA was oleic acid, with a considerably higher prevalence in POL (305.40 mg/100 g DW). Palmitic acid concentrations varied between 200.46 and 253.39 mg/100 g DW, with POL exhibiting the highest concentration. The antihypercholesterolemic properties have been associated with oleic acid, an essential monounsaturated fatty acid (MUFA) [80,81]. Linoleic acid (omega-6) is an essential polyunsaturated fatty acid (PUFA) that plays important roles in brain, cardiovascular, and kidney functions [4,81]. EFSA established a daily AI of linoleic acid of 4% of total dietary energy [49], with all mushroom samples being a good source of this FA.
Palmitic, linoleic, and oleic acids are typically the most prevalent in mushrooms [4,17,23,24,80,81]. In accordance with the present study, the linoleic acid content in Pleurotus spp. generally corresponded to 4.3–78.3% of total FAs. Regarding oleic acid, some reported values for this genus ranged from 3.7 to 27.1% of total FAs, aligning with the present data [17,23,24,81]. Ogwok et al. (2017) [82] studied the FA profile of PO grown in soil and on cottonseed husks in Uganda. Although oleic and linoleic acids are among the most prevalent unsaturated FAs (UFAs), the most prevalent saturated FA (SFA) in PO grown in soil was tricosanoic acid, while in cottonseed it was lignoceric acid. This study suggests a distinct FA profile compared with the studied Iberian Peninsula mushrooms. Moreover, the use of cottonseed as substrate seems to promote a higher diversity of FAs than soil grown [82]. This comparative study corroborates the impact of different regions and cultivation methods. In contrast, Rodrigues et al. (2015) [24] studied Pleurotus spp. cultivated in Gandra (Portugal) under biological cultivation with organic substrate, and Reis et al. (2012) [23] compared different mushroom species obtained from Bragança supermarkets (Portugal). Although some differences in the FA profile were registered, palmitic, oleic, and linoleic acids were also the most prevalent in both studies. This probably results from the similar geographic locations of production. As reviewed by Sande et al. (2019) [81] and Enshasy et al. (2015) [17], the FA profile of mushrooms significantly varies according to the species, substrate, and geographic distribution.
POL had significantly higher levels of pentadecanoic acid (54.83 mg/100 g DW), stearic acid (44.67 mg/100 g DW), and behenic acid (15.83 mg/100 g DW). In comparison, POC and POA showed higher concentrations of α-eleostearic acid (21.64–21.91 mg/100 g DW). Beyond palmitic acid, pentanoic and stearic acid are generally the most prevalent SFAs [17]. Concerning omega-3, eicosapentaenoic acid concentrations varied between 10.98 and 20.80 mg/100 g DW, with POL exhibiting significantly lower values. Contrarily, the results suggest that docosahexaenoic acid was considerably higher in POL, with values between 2.84 and 5.31 mg/100 g DW in the three mushrooms. α-linolenic acid was significantly lower in POA (1.53 mg/100 g DW), without significant differences between the other mushrooms (2.18–2.19 mg/100 g DW). These values agreed with the literature data, where mushrooms are richer sources of omega-6 than omega-3, mainly due to the higher concentration of LA [17,80,82].
In POL, POC, and POA, the SFAs were more prevalent than MUFAs. However, PUFAs were the most prevalent group, with ratios of unsaturated fatty acids (UFAs) and SFAs higher than 3.66 in all mushrooms. These ratios were higher than those reported for PO cultivated in Nigeria and other edible and medicinal species cultivated in the USA [35,80]. This corroborated the interesting and valuable profile of POL, POC, and POA, which are particularly beneficial for cardiovascular health [49]. The results indicated a significantly higher ratio of UFA: SFA (4.70) and PUFA: SFA (3.93) in POC. POL was the species with the lower UFA: SFA (3.66) and PUFA: SFA (2.83) due to the considerably higher prevalence of SFA (410.28 mg/100 g DW).
The FA results suggested that all three mushrooms possess low FA concentrations compared to proteins, carbohydrates, and minerals, but are nutritionally valuable sources of essential FA (e.g., linoleic and oleic acids), with specific profiles that could be valuable for different nutritional requirements. The literature comparison suggests that the FA content and profile depend on the cultivation method, geographic location, and species.
3.6. Characterization by Fourier Transform Infrared (FTIR) Spectroscopy
Figure 4 presents the FTIR spectra of the three PO mushrooms (POL, POC, and POA) across the 4000–600 cm−1 wavenumber range. FTIR spectroscopy detects carbohydrates, proteins, and FAs through the vibration of atoms [5]. These spectra exhibited similar overall patterns while confirming the distinct composition of each mushroom sample. Characteristic absorption bands for mushroom components appeared in three key regions: 3500–3000 cm−1, 1800–1500 cm−1, and 1200–900 cm−1. The most notable spectral differences occurred within the 1200–900 cm−1 region, which corresponds to carbohydrate vibrations. Absorption peaks between 1077 and 1042 cm−1, attributed to polysaccharides [24], showed varying intensities among samples. POC and POA spectra demonstrated higher intensities in this carbohydrate region, corroborating their higher carbohydrate content as determined by proximate composition (Table 1). Specific wavenumber regions correspond to polysaccharide functional groups that define glycosidic bonds [5]. The band at 890 cm−1 indicates β-glycosides, while bands at 860–810 cm−1 represent α-glycosides [24]. POL exhibited reduced intensities in these regions, consistent with its lower β-glucans and α-glucans content.
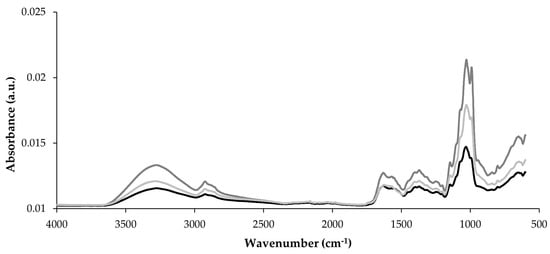
Figure 4.
Raw infrared spectra of the POL, POC, and POA Pleurotus ostreatus species, wavenumber range from 4000 to 600 cm−1. __ POL; __ POC; __ POA.
The band at approximately 3300 cm−1 corresponds to O–H and C-H stretching vibrations in polysaccharides [24,83], with POC and POA exhibiting higher intensities than POL. The 2900–2880 cm−1 region, associated with CH2 and CH3 stretching of FAs in the cell wall [24], also shows variation among mushrooms but is not correlated with fat content or FA profile. In the 1800–1500 cm−1 region, the bands at approximately 1650 cm−1 (amide I) and 1560 cm−1 (amide II) represent protein components [24]. Despite POL containing significantly higher protein content (Table 1), this exhibited similar intensities to POA in this region of the FTIR spectra and was lower than POC. This may suggest differences in protein structure among mushrooms and aligns with variations in protein and peptide profile (where POL exhibits a distinct profile compared with the other mushrooms), possibly affecting spectral properties.
The FTIR results confirmed that although POL, POC, and POA belong to the same species, they possess distinct chemical characteristics contributing to their unique nutritional profiles. This approach corroborated the specific nutritional differences in POL, POC, and POA.
4. Conclusions
The present study demonstrated the high nutritional value of three PO mushrooms and their distinct biochemical profiles. POL, POC, and POA are rich sources of glucans, especially (1→3)(1→6)-β-glucans. All species significantly contribute to the EFSA AI and AR daily recommendations of fiber, protein, and several minerals (K, P, Mg, Zn, Fe, Cu, and Se), suggesting numerous health benefits such as prebiotic potential. FA composition analysis revealed that all mushrooms are valuable linoleic and oleic acid sources, with favorable UFAs to SFAs and K to Na ratios, suggesting potential cardiovascular health benefits.
Compared with the literature data, these findings may suggest that these Iberian cultivated mushrooms have a distinct chemical profile compared to PO cultivated mushrooms from Europe, America, Asia, and Africa. Mushroom biochemical profiles were also strongly influenced by cultivation methods. The biologically cultivated POL mushroom demonstrated enhanced protein, fat, mineral content, and higher essential AA content. POL nutritional profile is particularly interesting as an alternative and valuable source of protein. In contrast, the industrial mushrooms, POC and POA, exhibited higher carbohydrate content, particularly Tre and (1→3)(1→6)-β-glucans. Beyond the wide range of health benefits reported for β-glucans, Tre possesses valuable cryoprotective properties advantageous for functional food formulations.
These findings underscore the potential application of these mushrooms in tailored functional foods and nutraceutical formulations, with specific characteristics for distinct nutritional requirements. In future research, other variations in cultivation parameters (e.g., substrate composition) could be evaluated to optimize desired nutritional profiles. The study of the gastrointestinal tract impact and consequent bioavailability will allow us to understand the optimal processing conditions that preserve the mushrooms’ beneficial properties. In vitro studies will also be crucial to identify bioactive properties, for instance, in vitro fecal fermentation to understand the potential of these mushrooms in gut microbiota modulation. In vivo studies will validate physiological activities and help in defining applications to POL, POC, and POA. Additionally, future work should include the development and sensory evaluation of functional foods incorporating these mushrooms, such as protein-enriched foods utilizing POL and functional products utilizing the POC and POA as a rich polysaccharide source. These specific investigations will further elucidate their health-promoting potential and optimize their applications in the food and pharmaceutical industries.
Author Contributions
H.A.-R.: investigation, methodology, data curation, formal analysis, writing—original draft preparation. M.A.: formal analysis, writing—review and editing. V.d.F.: methodology, formal analysis. F.K.T.: supervision, validation, writing—review and editing. J.B.R.: supervision. M.P.: conceptualization, supervision, validation, funding acquisition, writing—review and editing. All authors have read and agreed to the published version of the manuscript.
Funding
Funding for this work was obtained by National Funds from FCT—Fundação para a Ciência e a Tecnologia through project UIDB/50016/2020 and FCT individual PhD grant number 2020.05798.BD (H. Araújo-Rodrigues). This research has been also conducted within the framework of the TRANSCOLAB PLUS research project (0112_TRANSCOLAB_PLUS_2_P), entitled “Cross-border Collaborative Laboratory for the green transition of the Agri-Food and Agro-industrial sector”, co-financed by the European Regional Development Fund—ERDF—through the INTERREG VI—A Spain-Portugal Cooperation Program (POCTEP) 2021–2027.
Institutional Review Board Statement
Not applicable.
Data Availability Statement
Data are contained within the article.
Conflicts of Interest
The authors declare no conflicts of interest.
References
- Rathore, H.; Prasad, S.; Sharma, S. Mushroom nutraceuticals for improved nutrition and better human health: A review. PharmaNutrition 2017, 5, 35–46. [Google Scholar] [CrossRef]
- Araújo-Rodrigues, H.; Sousa, A.S.; Relvas, J.B.; Tavaria, F.K.; Pintado, M. An Overview on Mushroom Polysaccharides: Health-promoting Properties, Prebiotic and Gut Microbiota Modulation Effects and Structure-function Correlation. Carbohydr. Polym. 2024, 333, 121978. [Google Scholar] [CrossRef]
- You, S.W.; Hoskin, R.T.; Komarnytsky, S.; Moncada, M. Mushrooms as Functional and Nutritious Food Ingredients for Multiple Applications. ACS Food Sci. Technol. 2022, 2, 1184–1195. [Google Scholar] [CrossRef]
- Araújo-Rodrigues, H.; Sofia Sousa, A.; Pintado, M.E. Chapter 6. Macromolecules in Fungi with Pharmaceutical Potential. In Edible Fungi: Chemical Composition, Nutrition and Health Effects; Stojković, D., Barros, L., Eds.; Royal Society of Chemistry: Croydon, UK, 2022; pp. 232–272. [Google Scholar]
- Gong, P.; Wang, S.; Liu, M.; Chen, F.; Yang, W.; Chang, X.; Liu, N.; Zhao, Y.; Wang, J.; Chen, X. Extraction methods, chemical characterizations and biological activities of mushroom polysaccharides: A mini-review. Carbohydr. Res. 2020, 494, 108037. [Google Scholar] [CrossRef]
- Ghosh, K. A Review: Edible mushrooms as source of dietary fiber and its health effects. J. Phys. Sci. 2016, 21, 129–137. [Google Scholar]
- Bach, F.; Helm, C.V.; Bellettini, M.B.; Maciel, G.M.; Haminiuk, C.W.I. Edible mushrooms: A potential source of essential amino acids, glucans and minerals. Int. J. Food Sci. Technol. 2017, 52, 2382–2392. [Google Scholar] [CrossRef]
- Yadav, D.; Negi, P.S. Bioactive components of mushrooms: Processing effects and health benefits. Food Res. Int. 2021, 148, 110599. [Google Scholar] [CrossRef]
- Sousa, A.S.; Araújo-Rodrigues, H.; Pintado, M.E. The Health-promoting Potential of Edible Mushroom Proteins. Curr. Pharm. Des. 2023, 29, 804–823. [Google Scholar] [CrossRef]
- Araújo-Rodrigues, H.; Amorim, M.; Sousa, C.; Salsinha, A.S.; Marçal, S.; de Freitas, V.; Relvas, J.B.; Tavaria, F.K.; Pintado, M.E. Chemical Composition of Trametes versicolor, Hericium erinaceus, and Pleurotus ostreatus Mushroom Biomass: Deciphering Their Rich α-glucan Composition and Nutritional Value. J. Food Compos. Anal. 2025, 143, 107612. [Google Scholar] [CrossRef]
- Bijla, S.; Sharma, V.P. Status of mushroom production: Global and national scenario. Mushroom Res. 2023, 32, 91–98. [Google Scholar] [CrossRef]
- Gombafórum. The Status of European Mushroom Cultivation. Available online: https://www.gombaforum.hu/en/2025/economy/the-status-of-european-mushroom-cultivation/ (accessed on 8 March 2025).
- Ministry of Development and Technology, P. Poland Is the Largest Exporter of Mushrooms in Europe. Available online: https://www.trade.gov.pl/en/news/poland-is-the-largest-exporter-of-mushrooms-in-europe/ (accessed on 8 March 2025).
- IndustryARC. Portugal Mushrooms and Truffles Market (IMFBR 0308); IndustryARC: Hyderabad, India, 2025. [Google Scholar]
- IndustryARC. Spain Mushrooms and truffles Market (IMFBR 0115); IndustryARC: Hyderabad, India, 2025. [Google Scholar]
- Deepalakshmi, K.; Mirunalini, S. Pleurotus ostreatus: An oyster mushroom with nutritional and medicinal properties. J. Biochem. Technol. 2014, 5, 718–726. [Google Scholar]
- Enshasy, H.; Maftoun, P.; Johari, H.J.; Soltani, M.; Malik, R.; Othman, N. The Edible Mushroom Pleurotus spp.: I. Biodiversity and Nutritional Values. Int. J. Biotechnol. Wellness Ind. 2015, 4, 67–83. [Google Scholar] [CrossRef]
- Hoa, H.T.; Wang, C.-L.; Wang, C.-H. The effects of different substrates on the growth, yield, and nutritional composition of two oyster mushrooms (Pleurotus ostreatus and Pleurotus cystidiosus). Mycobiology 2015, 43, 423–434. [Google Scholar] [CrossRef]
- Karataş, A. Effects of different agro-industrial waste as substrates on proximate composition, metals, and mineral contents of oyster mushroom (Pleurotus ostreatus). Int. J. Food Sci. Technol. 2022, 57, 1429–1439. [Google Scholar] [CrossRef]
- Sánchez, C. Cultivation of Pleurotus ostreatus and other edible mushrooms. Appl. Microbiol. Biotechnol. 2010, 85, 1321–1337. [Google Scholar] [CrossRef] [PubMed]
- Zhou, S.; Ma, F.; Zhang, X.; Zhang, J. Carbohydrate changes during growth and fruiting in Pleurotus ostreatus. Fungal Biol. 2016, 120, 852–861. [Google Scholar] [CrossRef]
- AOAC. Official Methods of Analysis of the AOAC (Volume 1); Association of Official Analytical Chemists: Washington, DC, USA, 1990. [Google Scholar]
- Reis, F.S.; Barros, L.; Martins, A.; Ferreira, I.C.F.R. Chemical composition and nutritional value of the most widely appreciated cultivated mushrooms: An inter-species comparative study. Food Chem. Toxicol. 2012, 50, 191–197. [Google Scholar] [CrossRef]
- Rodrigues, D.M.F.; Freitas, A.C.; Rocha-Santos, T.A.P.; Vasconcelos, M.W.; Roriz, M.; Rodríguez-Alcalá, L.M.; Gomes, A.M.P.; Duarte, A.C. Chemical composition and nutritive value of Pleurotus citrinopileatus var cornucopiae, P. eryngii, P. salmoneo stramineus, Pholiota nameko and Hericium erinaceus. J. Food Sci. Technol. 2015, 52, 6927–6939. [Google Scholar] [CrossRef]
- Blakeney, A.B.; Harris, P.J.; Henry, R.J.; Stone, B.A. A simple and rapid preparation of alditol acetates for monosaccharide analysis. Carbohydr. Res. 1983, 113, 291–299. [Google Scholar] [CrossRef]
- Heleno, S.A.; Barros, L.; Sousa, M.J.; Martins, A.; Ferreira, I.C.F.R. Study and characterization of selected nutrients in wild mushrooms from Portugal by gas chromatography and high performance liquid chromatography. Microchem. J. 2009, 93, 195–199. [Google Scholar] [CrossRef]
- Nakahara, D.; Nan, C.; Mori, K.; Hanayama, M.; Kikuchi, H.; Hirai, S.; Egashira, Y. Effect of mushroom polysaccharides from Pleurotus eryngii on obesity and gut microbiota in mice fed a high-fat diet. Eur. J. Nutr. 2020, 59, 3231–3244. [Google Scholar] [CrossRef] [PubMed]
- Kim, M.-Y.; Chung, L.-M.; Lee, S.-J.; Ahn, J.-K.; Kim, E.-H.; Kim, M.-J.; Kim, S.-L.; Moon, H.-I.; Ro, H.-M.; Kang, E.-Y.; et al. Comparison of free amino acid, carbohydrates concentrations in Korean edible and medicinal mushrooms. Food Chem. 2009, 113, 386–393. [Google Scholar] [CrossRef]
- Oliveira, A.S.; Pereira, J.O.; Ferreira, C.; Faustino, M.; Durão, J.; Pintado, M.E.; Carvalho, A.P. Peptide-rich extracts from spent yeast waste streams as a source of bioactive compounds for the nutraceutical market. Innov. Food Sci. Emerg. Technol. 2022, 81, 103148. [Google Scholar] [CrossRef]
- Pripi-Nicolau, L.; De Revel, G.; Bertrand, A.; Maujean, A. Formation of Flavor Components by the Reaction of Amino Acid and Carbonyl Compounds in Mild Conditions. J. Agric. Food Chem. 2000, 48, 3761–3766. [Google Scholar] [CrossRef] [PubMed]
- Pimentel, L.L.; Fontes, A.L.; Gomes, A.M.; Rodríguez-Alcalá, L.M. Considerations about the in situ derivatization and fractionation of EFA and NEFA in biological and food samples. MethodsX 2015, 2, 475–484. [Google Scholar] [CrossRef]
- Maltini, E.; Torreggiani, D.; Venir, E.; Bertolo, G. Water activity and the preservation of plant foods. Food Chem. 2003, 82, 79–86. [Google Scholar] [CrossRef]
- Mathlouthi, M. Water content, water activity, water structure and the stability of foodstuffs. Food Control 2001, 12, 409–417. [Google Scholar] [CrossRef]
- Khan, M.A.; Tania, M. Nutritional and Medicinal Importance of Pleurotus Mushrooms: An Overview. Food Rev. Int. 2012, 28, 313–329. [Google Scholar] [CrossRef]
- Majesty, D.; Ijeoma, E.; Winner, K.; Prince, O. Nutritional, Anti-nutritional and Biochemical Studies on the Oyster Mushroom, Pleurotus ostreatus. EC Nutr. 2018, 14, 36–59. [Google Scholar]
- Effiong, M.E.; Umeokwochi, C.P.; Afolabi, I.S.; Chinedu, S.N. Assessing the nutritional quality of Pleurotus ostreatus (oyster mushroom). Front. Nutr. 2023, 10, 1279208. [Google Scholar] [CrossRef]
- Chirinang, P.; Intarapichet, K.-O. Amino acids and antioxidant properties of the oyster mushrooms, Pleurotus ostreatus and Pleurotus sajor-caju. Sci. Asia 2009, 35, 326–331. [Google Scholar] [CrossRef]
- Ma, J.; Piao, X.; Mahfuz, S.; Long, S.; Wang, J. The interaction among gut microbes, the intestinal barrier and short chain fatty acids. Anim. Nutr. 2022, 9, 159–174. [Google Scholar] [CrossRef] [PubMed]
- Corrêa, R.C.G.; Brugnari, T.; Bracht, A.; Peralta, R.M.; Ferreira, I.C.F.R. Biotechnological, nutritional and therapeutic uses of Pleurotus spp. (Oyster mushroom) related with its chemical composition: A review on the past decade findings. Trends Food Sci. Technol. 2016, 50, 103–117. [Google Scholar] [CrossRef]
- Mau, J.-L.; Lin, H.-C.; Chen, C.-C. Non-volatile components of several medicinal mushrooms. Food Res. Int. 2001, 34, 521–526. [Google Scholar] [CrossRef]
- Reis, F.S.; Martins, A.; Barros, L.; Ferreira, I.C.F.R. Antioxidant properties and phenolic profile of the most widely appreciated cultivated mushrooms: A comparative study between in vivo and in vitro samples. Food Chem. Toxicol. 2012, 50, 1201–1207. [Google Scholar] [CrossRef]
- Kalač, P. A review of chemical composition and nutritional value of wild-growing and cultivated mushrooms. J. Sci. Food Agric. 2013, 93, 209–218. [Google Scholar] [CrossRef]
- Alkin, M.; Söğüt, E.; Seydim, A.C. Determination of bioactive properties of different edible mushrooms from Turkey. J. Food Meas. Charact. 2021, 15, 3608–3617. [Google Scholar] [CrossRef]
- Balan, V.; Zhu, W.; Krishnamoorthy, H.; Benhaddou, D.; Mowrer, J.; Husain, H.; Eskandari, A. Challenges and opportunities in producing high-quality edible mushrooms from lignocellulosic biomass in a small scale. Appl. Microbiol. Biotechnol. 2022, 106, 1355–1374. [Google Scholar] [CrossRef]
- Liu, J.Y.; Chang, M.C.; Meng, J.L.; Feng, C.P.; Wang, Y. A Comparative Proteome Approach Reveals Metabolic Changes Associated with Flammulina velutipes Mycelia in Response to Cold and Light Stress. J. Agric. Food Chem. 2018, 66, 3716–3725. [Google Scholar] [CrossRef]
- Vetter, J. The Mushroom Glucans: Molecules of High Biological and Medicinal Importance. Foods 2023, 12, 1009. [Google Scholar] [CrossRef]
- Zhao, Q.; Liu, X.; Cui, L.; Ma, C. Extraction and bioactivities of the chemical composition from Pleurotus ostreatus: A review. J. Futur. Foods 2024, 4, 111–118. [Google Scholar] [CrossRef]
- Deveci, E.; Çayan, F.; Tel-Çayan, G.; Duru, M.E. Structural characterization and determination of biological activities for different polysaccharides extracted from tree mushroom species. J. Food Biochem. 2019, 43, e12965. [Google Scholar] [CrossRef]
- EFSA. Dietary Reference Values for the EU. Available online: https://multimedia.efsa.europa.eu/drvs/index.htm (accessed on 20 March 2025).
- Sari, M.; Prange, A.; Lelley, J.I.; Hambitzer, R. Screening of beta-glucan contents in commercially cultivated and wild growing mushrooms. Food Chem. 2017, 216, 45–51. [Google Scholar] [CrossRef] [PubMed]
- McCleary, B.V.; Draga, A. Measurement of β-Glucan in mushrooms and mycelial products. J. AOAC Int. 2016, 99, 364–373. [Google Scholar] [CrossRef] [PubMed]
- Rop, O.; Mlcek, J.; Jurikova, T. Beta-glucans in higher fungi and their health effects. Nutr. Rev. 2009, 67, 624–631. [Google Scholar] [CrossRef]
- Reddy Shetty, P.; Batchu, U.R.; Buddana, S.K.; Sambasiva Rao, K.R.S.; Penna, S. A comprehensive review on α-D-Glucans: Structural and functional diversity, derivatization and bioapplications. Carbohydr. Res. 2021, 503, 108297. [Google Scholar] [CrossRef]
- Muszyńska, B.; Grzywacz-Kisielewska, A.; Kała, K.; Gdula-Argasińska, J. Anti-inflammatory properties of edible mushrooms: A review. Food Chem. 2018, 243, 373–381. [Google Scholar] [CrossRef]
- Rodrigues Barbosa, J.; dos Santos Freitas, M.M.; da Silva Martins, L.H.; de Carvalho, R.N. Polysaccharides of mushroom Pleurotus spp.: New extraction techniques, biological activities and development of new technologies. Carbohydr. Polym. 2020, 229, 115550. [Google Scholar] [CrossRef]
- Xiao, H.; Chen, C.; Li, C.; Huang, Q.; Fu, X. Physicochemical characterization, antioxidant and hypoglycemic activities of selenized polysaccharides from Sargassum pallidum. Int. J. Biol. Macromol. 2019, 132, 308–315. [Google Scholar] [CrossRef]
- Bell, V.; Silva, C.R.P.G.; Guina, J.; Fernandes, T.H. Mushrooms as future generation healthy foods. Front. Nutr. 2022, 9, 1050099. [Google Scholar] [CrossRef]
- Nidhi, D. Mushroom Polysaccharides as a Potential Prebiotics. Int. J. Health Sci. Res. 2018, 2, 115–126. [Google Scholar]
- Govindan, S.; Shanmugam, J.; Rajendran, G.; Ramani, P.; Unni, D.; Venkatachalam, B.; Janardhanan, A.; Aswini, K.; Rajendran, R.L.; Gangadaran, P.; et al. Antidiabetic activity of polysaccharide from Hypsizygus ulmarius in streptozotocin-nicotinamide induced diabetic rats. Bioact. Carbohydr. Diet. Fibre 2023, 29, 100350. [Google Scholar] [CrossRef]
- Niego, A.G.; Rapior, S.; Thongklang, N.; Raspé, O.; Jaidee, W.; Lumyong, S.; Hyde, K.D. Macrofungi as a Nutraceutical Source: Promising Bioactive Compounds and Market Value. J. Fungi 2021, 7, 397. [Google Scholar] [CrossRef] [PubMed]
- Urbancikova, I.; Hudackova, D.; Majtan, J.; Rennerova, Z.; Banovcin, P.; Jesenak, M. Efficacy of Pleuran (β-Glucan from Pleurotus ostreatus) in the Management of Herpes Simplex Virus Type 1 Infection. Evidence-based Complement. Altern. Med. 2020, 2020, 8562309. [Google Scholar] [CrossRef] [PubMed]
- Jesenak, M.; Majtan, J.; Rennerova, Z.; Kyselovic, J.; Banovcin, P.; Hrubisko, M. Immunomodulatory effect of pleuran (β-glucan from Pleurotus ostreatus) in children with recurrent respiratory tract infections. Int. Immunopharmacol. 2013, 15, 395–399. [Google Scholar] [CrossRef] [PubMed]
- Li, Q.; Wang, W.; Zhu, Y.; Chen, Y.; Zhang, W.; Yu, P.; Mao, G.; Zhao, T.; Feng, W.; Yang, L.; et al. Structural elucidation and antioxidant activity a novel Se-polysaccharide from Se-enriched Grifola frondosa. Carbohydr. Polym. 2017, 161, 42–52. [Google Scholar] [CrossRef]
- Synytsya, A.; Novák, M. Structural diversity of fungal glucans. Carbohydr. Polym. 2013, 92, 792–809. [Google Scholar] [CrossRef]
- Zhang, Y.; Dai, L.; Kong, X.; Chen, L. Characterization and in vitro antioxidant activities of polysaccharides from Pleurotus ostreatus. Int. J. Biol. Macromol. 2012, 51, 259–265. [Google Scholar] [CrossRef]
- Wang, L.; Zhang, P.; Shen, J.; Qian, Y.; Liu, M.; Ruan, Y.; Wang, X.; Zhang, S.; Ma, B. Physicochemical properties and bioactivities of original and Se-enriched polysaccharides with different molecular weights extracted from Pleurotus ostreatus. Int. J. Biol. Macromol. 2019, 141, 150–160. [Google Scholar] [CrossRef]
- Maity, K.K.; Patra, S.; Dey, B.; Bhunia, S.K.; Mandal, S.; Das, D.; Majumdar, D.K.; Maiti, S.; Maiti, T.K.; Islam, S.S. A heteropolysaccharide from aqueous extract of an edible mushroom, Pleurotus ostreatus cultivar: Structural and biological studies. Carbohydr. Res. 2011, 346, 366–372. [Google Scholar] [CrossRef]
- Gardeli, C.; Mela, N.; Dedousi, M.; Kandyliari, A.; Kaparakou, E.; Diamantopoulou, P.; Pappas, C.; Mallouchos, A. The Influence of Substrate and Strain on Protein Quality of Pleurotus ostreatus. Appl. Sci. 2024, 14, 4040. [Google Scholar] [CrossRef]
- Yin, C.; Fan, X.; Fan, Z.; Shi, D.; Yao, F.; Gao, H. Comparison of non-volatile and volatile flavor compounds in six Pleurotus mushrooms. J. Sci. Food Agric. 2019, 99, 1691–1699. [Google Scholar] [CrossRef]
- Wu, G. Functional Amino Acids in Growth, Reproduction, and Health. Adv. Nutr. 2010, 1, 31–37. [Google Scholar] [CrossRef] [PubMed]
- González, A.; Cruz, M.; Losoya, C.; Nobre, C.; Loredo, A.; Rodríguez, R.; Contreras, J.; Belmares, R. Edible mushrooms as a novel protein source for functional foods. Food Funct. 2020, 11, 7400–7414. [Google Scholar] [CrossRef] [PubMed]
- Wang, H.; Gao, J.; Ng, T.B. A new lectin with highly potent antihepatoma and antisarcoma activities from the oyster mushroom Pleurotus ostreatus. Biochem. Biophys. Res. Commun. 2000, 275, 810–816. [Google Scholar] [CrossRef]
- González, A.; Nobre, C.; Simões, L.S.; Cruz, M.; Loredo, A.; Rodríguez-Jasso, R.M.; Contreras, J.; Texeira, J.; Belmares, R. Evaluation of functional and nutritional potential of a protein concentrate from Pleurotus ostreatus mushroom. Food Chem. 2021, 346, 128884. [Google Scholar] [CrossRef]
- Zhou, J.; Chen, M.; Wu, S.; Liao, X.; Wang, J.; Wu, Q.; Zhuang, M.; Ding, Y. A review on mushroom-derived bioactive peptides: Preparation and biological activities. Food Res. Int. 2020, 134, 109230. [Google Scholar] [CrossRef]
- Yang, Z.; Wang, J.; Wang, H.; Xie, H.; Zhang, Y.; Wang, M. Simultaneous extraction and purification of polysaccharides and proteins from Pleurotus ostreatus using an aqueous two-phase system. J. Food Sci. 2025, 90, e17674. [Google Scholar] [CrossRef]
- Li, H.; Gao, J.; Zhao, F.; Liu, X.; Ma, B. Bioactive Peptides from Edible Mushrooms—The Preparation, Mechanisms, Structure—Activity Relationships and Prospects. Foods 2023, 12, 2935. [Google Scholar] [CrossRef]
- Gharibzahedi, S.M.T.; Jafari, S.M. The importance of minerals in human nutrition: Bioavailability, food fortification, processing effects and nanoencapsulation. Trends Food Sci. Technol. 2017, 62, 119–132. [Google Scholar] [CrossRef]
- Khan, A. Comparative Study of the Nutritional Composition of Oyster Mushrooms Cultivated in Bangladesh. Bangladesh J. Mushroom 2008, 2, 9–14. [Google Scholar]
- Oluwafemi, G.I.; Fagbemi, T.N.; Seidu, K.T.; Fagbemi, T.N. Chemical Composition, Functional Properties and Protein Fractionation of Edible Oyster Mushroom (Pleurotus ostreatus). Ann. Food Sci. Technol. 2016, 17, 218–223. [Google Scholar]
- Abugri, D.A.; McElhenney, W.H. Fatty Acid Profiling in Selected Cultivated Edible and Wild Medicinal Mushrooms in Southern United States. J. Exp. Food Chem. 2016, 2, 1000108. [Google Scholar] [CrossRef]
- Sande, D.; de Oliveira, G.P.; Moura, M.A.F.E.; Martins, B.d.A.; Lima, M.T.N.S.; Takahashi, J.A. Edible mushrooms as a ubiquitous source of essential fatty acids. Food Res. Int. 2019, 125, 108524. [Google Scholar] [CrossRef] [PubMed]
- Ogwok, P.; Muyinda, R.; Nakisozi, H.; Bamuwamye, M. Fatty acid profile of wild edible and cultivated mushrooms (Pleurotus ostreatus, Amanita spp. and Termitomyces microcarpus). Nutr. Food Sci. 2017, 47, 357–368. [Google Scholar] [CrossRef]
- Zhang, Z.; Zhao, L.; Qu, H.; Zhou, H.; Yang, H.; Chen, H. Physicochemical characterization, adsorption function and prebiotic effect of chitin-glucan complex from mushroom Coprinus comatus. Int. J. Biol. Macromol. 2022, 206, 255–263. [Google Scholar] [CrossRef]

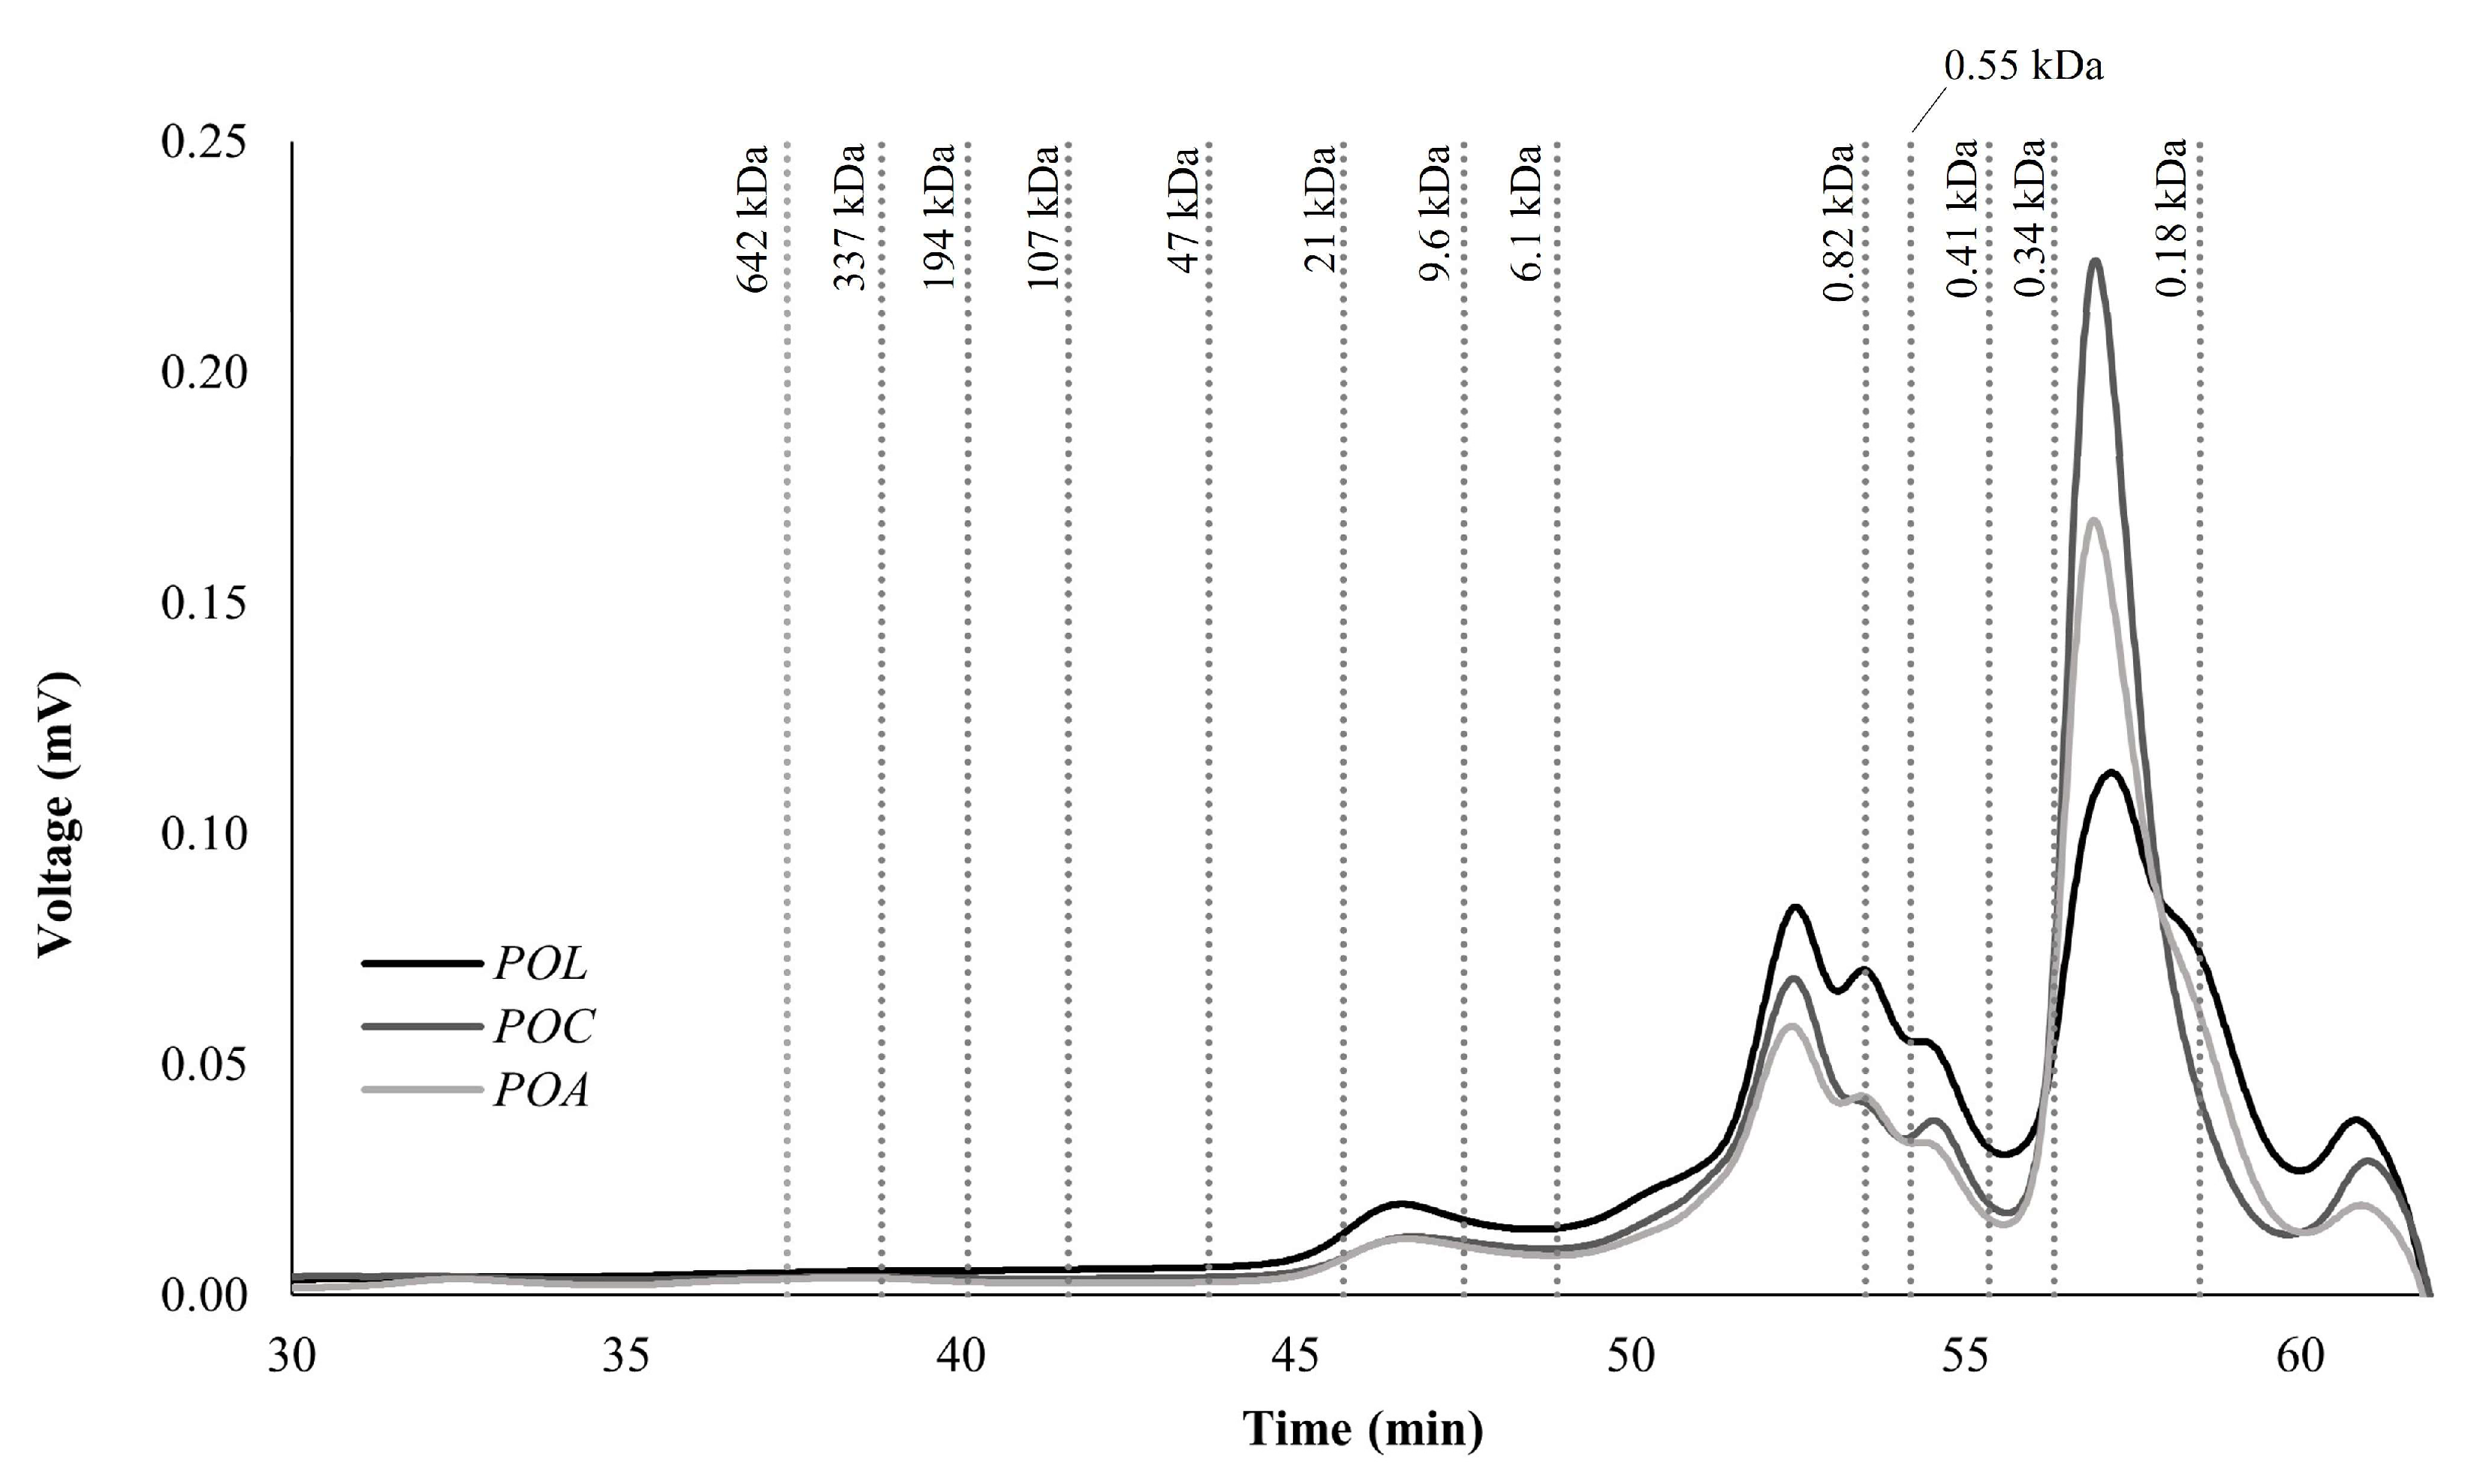
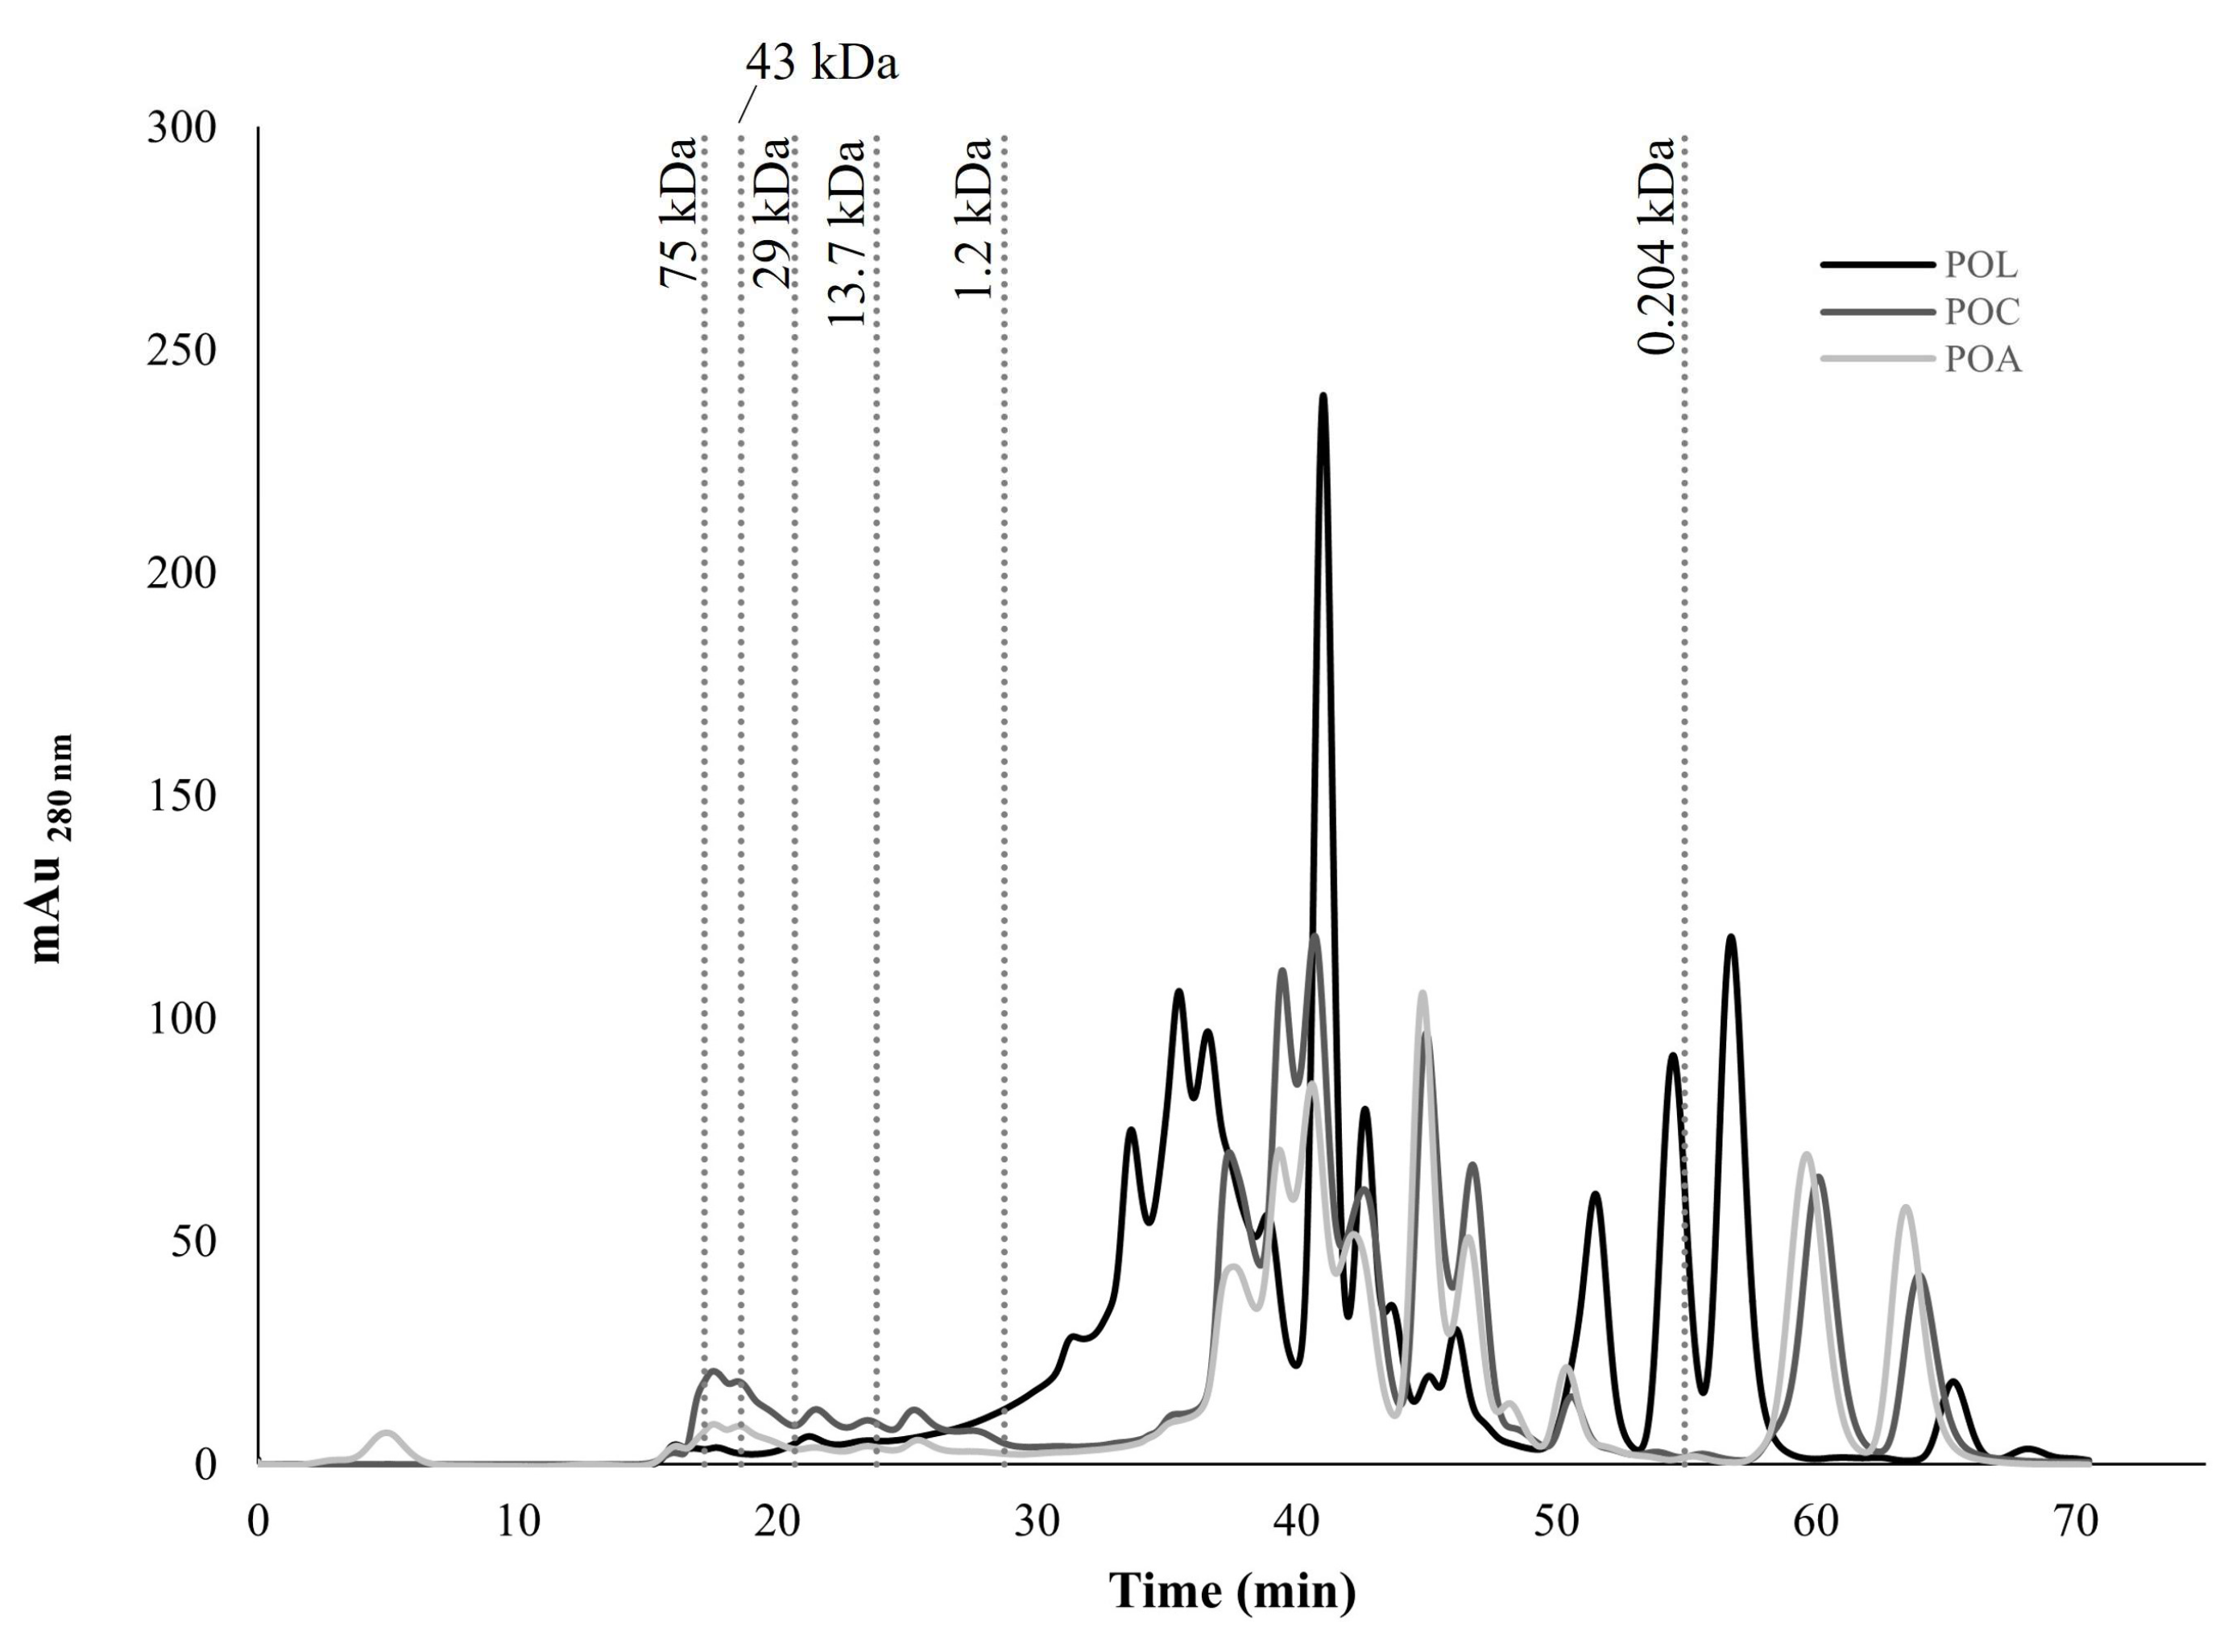
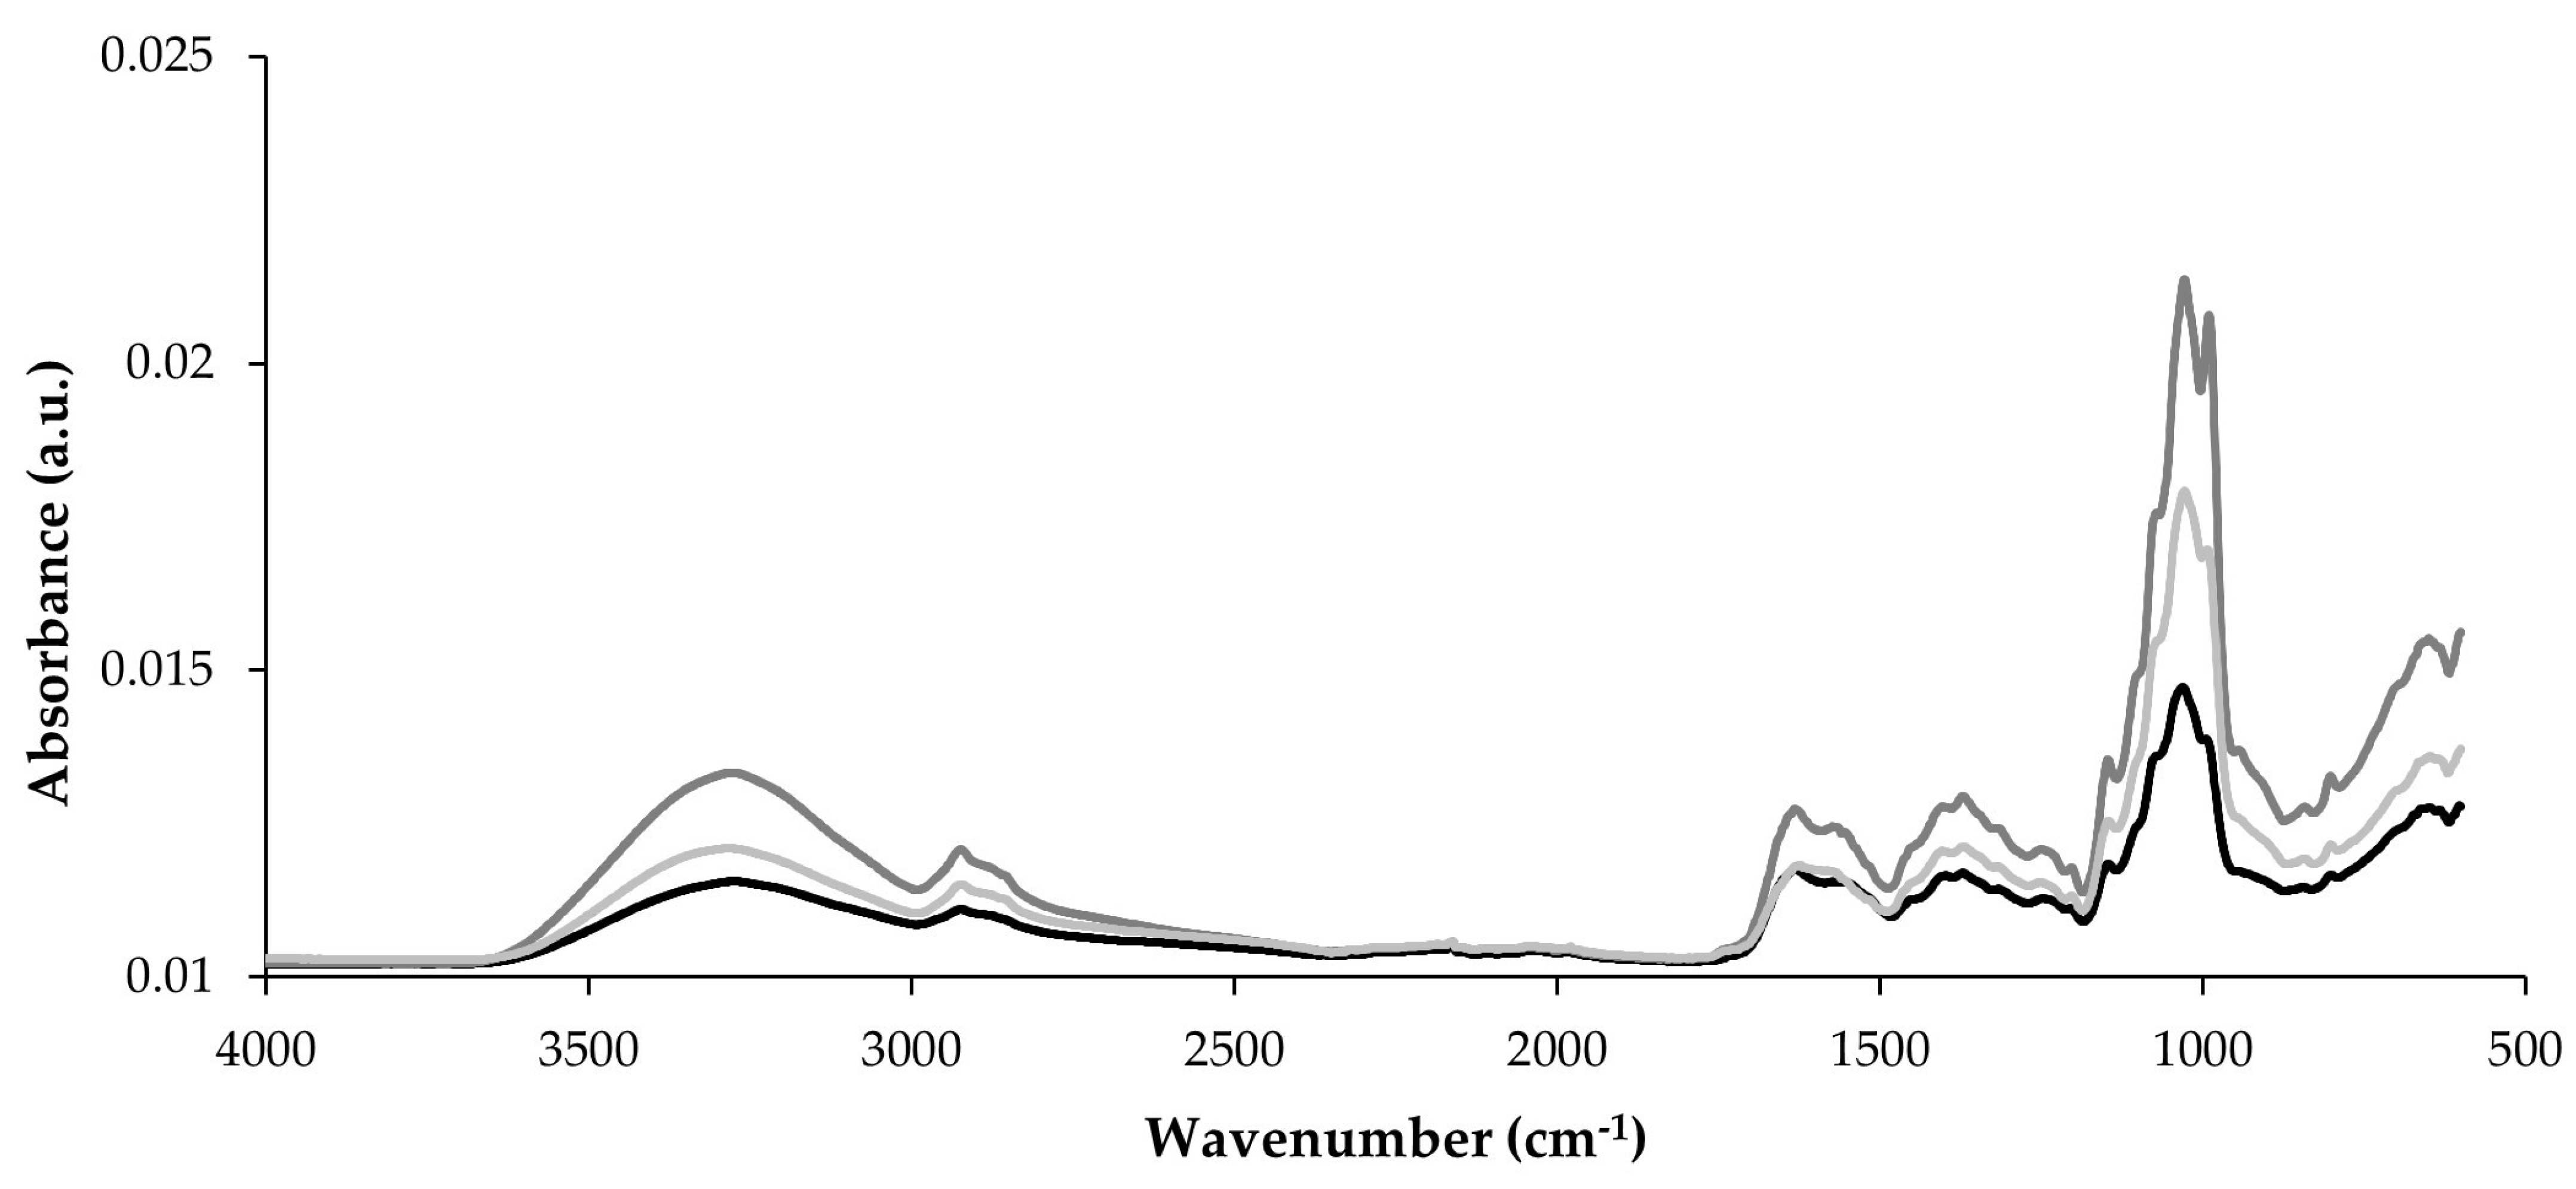
Disclaimer/Publisher’s Note: The statements, opinions and data contained in all publications are solely those of the individual author(s) and contributor(s) and not of MDPI and/or the editor(s). MDPI and/or the editor(s) disclaim responsibility for any injury to people or property resulting from any ideas, methods, instructions or products referred to in the content. |
© 2025 by the authors. Licensee MDPI, Basel, Switzerland. This article is an open access article distributed under the terms and conditions of the Creative Commons Attribution (CC BY) license (https://creativecommons.org/licenses/by/4.0/).