Article

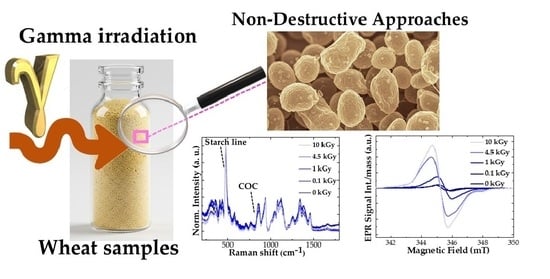
Gamma Irradiation for Agrifood: Non-Destructive Approaches to Study the Secondary Effects Produced in Italian Wheat Matrices

1
ENEA, Nuclear Department (NUC), C. R. Casaccia, Via Anguillarese 301, 00123 Rome, Italy
2
Department of Aerospace and Astronautical Engineering, Sapienza University of Rome, Via Eudossiana 18, 00184 Rome, Italy
3
ENEA, Nuclear Department (NUC), C. R. Frascati, Via Enrico Fermi, 45, 00044 Frascati, Italy
*
Author to whom correspondence should be addressed.
Polysaccharides 2025, 6(2), 39; https://doi.org/10.3390/polysaccharides6020039
Submission received: 10 March 2025 / Revised: 18 April 2025 / Accepted: 30 April 2025 / Published: 7 May 2025

Abstract

:
This work investigates the effects of gamma irradiation (0.1–10 kGy) on four Italian wheat matrices, such as durum, conventional soft, integrated soft, and biological soft wheat, by coupling Raman, FTIR-ATR and EPR spectroscopies to provide complementary insights into the structural, conformational, and radical-based transformations occurring in starch, the primary polysaccharide in wheat. As a general trend, gamma irradiation up to 10 kGy does not induce drastic degradation or depolymerization of wheat components. However, deeper investigations reveal that wheat composition is crucial in modulating the effects of gamma irradiation on structural and conformational rearrangements of starch units. Raman and FTIR-ATR spectroscopy analyses showed an increase in random coil fractions, with the most significant changes observed in durum wheat, plausibly attributed to its higher protein content. EPR analyses confirmed a dose-dependent increase in free radicals, with different recombination kinetics between wheat types influenced by their intrinsic composition and molecular organization. The proposed spectroscopic approaches allow for rapid and non-destructive analyses of molecular structure, chemical composition, and free radical content in irradiated wheat matrices with minimal sample preparation. These approaches can be extended in the development of screening methods for a wide range of polysaccharides in a variety of crops.

Graphical Abstract

1. Introduction

Wheat is one of the most economically significant crops worldwide due to its central role in human nutrition and food production. In the last decades, the exportation of wheat experienced significant growth, nearly doubling from 101 million tons in 2000 to 199 million tons by 2020 [1]. Projections for the 2030 marketing year indicate even higher exports, reaching an estimated 220 million tons [2]. Wheat is composed mostly of polysaccharides (mainly starch), proteins (primarily gluten), and lipids [3,4]. On the basis of the constituents’ amount, wheat grains are typically classified into two main types: soft wheat (Triticum aestivum), primarily used for making bread, cakes, and pastries due to its lower protein content and higher starch content; and durum wheat (Triticum durum), which has higher protein content and is commonly used in pasta production [5,6]. Both soft and durum wheat can be cultivated by using a variety of farming practices, including conventional, biological (organic), and integrated methods. The choice of farming practice depends on factors like environmental concerns, market demand, regulatory requirements, and the specific goals of the farmer. In conventional farming, soft and durum wheat are cultivated by using synthetic fertilizers, pesticides, and herbicides to maximize yield and minimize the impact of pests and diseases. On the other hand, biological (organic) wheat strictly adheres to natural processes and ecological principles, while integrated wheat employs a more flexible, mixed strategy that reduces but does not eliminate the use of synthetic inputs [7].
In this scenario, the constantly increasing worldwide demand for wheat and wheat-based products triggered both industry and research into various preservation methods to ensure food safety, extend shelf life, and maintain nutritional quality [8,9]. Among the possible approaches, gamma irradiation has, so far, demonstrated great potential to sterilize food and agricultural products [10,11,12]. Unlike conventional methods that may involve chemical treatments, fumigants, or thermal processes, gamma irradiation offers a clean, non-polluting alternative for improving food safety and shelf life [13]. Specifically, gamma irradiation involves the exposure of items to gamma rays, typically emitted by radioisotopes such as cobalt-60 or cesium-137, that deeply penetrate products, effectively destroying pathogens, insects, and microorganisms [14]. In addition, this approach can treat large quantities of products in a single batch without generating significant waste or requiring intensive energy consumption. Considering the remarkable demand and the sensitivity to microbial contamination, wheat is a perfect candidate for gamma irradiation treatment. Although it is widely acknowledged that gamma exposure is a winning strategy to remove biodeteriogens from organic matrices, the investigation of the effects produced on wheat chemical composition and structural properties after irradiation is still a pending milestone for the scientific community. In particular, one of the main concerns is whether gamma irradiation may induce side effects on the macromolecular structures of the wheat products, compromising the nutritional qualities.
Starch, being a major constituent of wheat, has been extensively studied in isolated and pure forms to evaluate the molecular, structural, and functional modifications induced by gamma exposure [15,16,17,18,19]. The pioneering study of Raffi et al. disclosed that irradiation can lead to depolymerization, fragmentation, and rearrangement of starch molecules due to the generation of free radicals and their subsequent reactions [20]. These changes are often dose-dependent: low doses primarily affect the amorphous regions of starch, while higher doses disrupt crystalline structures [21]. Key findings in the literature indicate that irradiation can alter the molecular weight distribution of polysaccharides, reduce viscosity, and enhance solubility [21]. In addition, gamma irradiation has been reported to promote the conversion of double-helical structures into random coil conformations, resulting in a reduction in crystallinity and an increase in the susceptibility of starch to enzymatic hydrolysis [22,23]. This has been particularly evident in isolated starch granules irradiated under controlled conditions, where the degree of alteration was directly correlated with the absorbed dose and the hydration state of the matrix.
Despite these insights into isolated starch systems, in recent years, many studies have focused on investigating the effects of gamma irradiation on complex, multi-component matrices such as wheat grains, where starch interacts with proteins, lipids, and other biomolecules [24,25,26,27]. The presence of these additional components introduces a layer of complexity, as they can modulate the radiation-induced changes through secondary interactions. For example, gluten and other proteins in wheat may contribute to the stabilization or destabilization of starch structures by forming networks or by generating reactive species that interact with neighboring molecules [28,29].
Current research progress on wheat irradiation mainly regards microbial load reduction and hygienic safety, often overlooking the secondary molecular effects on structural components such as starch and proteins [30,31,32]. Despite the widespread use of irradiation as a preservation method, there is a lack of systematic and integrated analyses that investigate the molecular-scale effects of irradiation. In particular, a limit given by the absence of rapid and non-invasive screening tools also limits the large-scale industrial applicability of this technology. Furthermore, a crucial challenge in the field of food irradiation is the low acceptance among consumers [33,34]. Studies that demonstrate the safety of irradiated foods at both the molecular and nutritional levels could play a key role in overcoming this barrier and promoting broader adoption.
In this context, this study aims to explore the effects induced by gamma radiation on the chemical composition, molecular structure, and radical content of the starch fraction in four different wheat matrices, such as soft wheat, durum wheat, integrated soft wheat, and biological soft wheat. For this purpose, a series of non-destructive spectroscopic techniques, namely, Fourier-Transform InfraRed (FTIR) spectroscopy, Raman spectroscopy, and Electron Paramagnetic Resonance (EPR) spectroscopy, were used. The gamma irradiation tests described in this paper were performed by using a cobalt-60 source at doses ranging from 0.1 kGy to 10 kGy at a dose rate of around 0.5 kGy/h. In agreement with the Food and Agriculture Organization (FAO), International Atomic Energy Agency (IAEA), and World Health Organization (WHO) guidelines, these irradiation conditions were selected by considering that doses up to 10 kGy are safe and effective for eliminating pathogens while maintaining the chemical integrity of cereal products [35,36].
This research is part of the METROFOOD-IT project.
We emphasize that gamma irradiation, in the dose range of 0.1–10 kGy, is a safe and effective method for treating wheat-based food samples without causing significant structural damage. The differences observed among the wheat matrices underline the role of their intrinsic composition in modulating the effects of gamma irradiation on the structural, conformational, and radical-based transformations occurring in starch.
The comprehensive analysis described in this paper is of paramount importance for the characterization of polysaccharide-based matrices, as it provides critical insights into their structural and chemical stability under irradiation. The novelty of our research lies in the combined use of non-destructive spectroscopic techniques (FTIR-ATR, Raman, and EPR) to investigate secondary molecular effects of gamma irradiation in various types of wheat (soft, durum, integrated, and biological). This integrated approach allows us to detect and compare changes in starch conformation, radical formation, and molecular stability without compromising the sample integrity. An additional innovative aspect of this work is that the combination of these spectroscopic techniques offers a straightforward yet effective analytical framework that can be easily implemented by operators and researchers for the characterization of complex food matrices rich in polysaccharides. These protocols require minimal sample preparation and are non-destructive, making them particularly suitable for routine quality assessment and safety monitoring in the agrifood sector.
These findings emphasize the potential of gamma irradiation as a reliable, non-destructive treatment for food preservation, laying the groundwork for innovative screening and preservation methods for a wide range of polysaccharide-rich crops.

2. Materials and Methods

Four types of wheat matrices, such as soft wheat (Triticum aestivum), durum wheat (Triticum durum), soft integrated wheat, and soft biological wheat, were processed via ball milling to achieve a fine, uniform powder. These milled wheat samples were used as received for further analysis without additional modifications. Each matrix differs in its chemical composition and agricultural origin. The specific details of the wheat samples, including names and descriptions, are summarized in Table 1.
Gamma irradiation tests were performed at the Calliope gamma irradiation facility, a pool-type irradiation facility equipped with a cobalt-60 radio-isotopic source array emitting two photons in coincidence with a mean energy of 1.25 MeV [14,37,38,39,40]. Wheat samples were irradiated at 0.1, 1, 4.5, and 10 kGy absorbed dose at a dose rate value of 0.5 kGy/h. All absorbed dose and dose rate values are referred to as water. The dose rate values were experimentally determined by the alanine–EPR system. The irradiation tests were performed in air at room temperature.
Optical microscope images and Raman spectra were acquired by means of a “Horiba XploRA Plus” spectrometer. The photos were acquired through a microscope at a 5X objective in transmittance mode. Raman spectra were recorded using a 785 nm laser excitation for 20 s with a 50 mW laser power and a diffraction grating of 1200 gr/mm at a 10X objective magnification. Prior to analysis, the Raman spectra were baseline-subtracted.
FTIR-ATR spectra were recorded using a Spectrum 100 Perkin-Elmer FT-IR spectrometer (PerkinElmer Scientifica Italia S.r.l.) equipped with a horizontal attenuated total reflectance (HATR) accessory, featuring a zinc selenide (ZnSe) crystal, in the range between 700 and 4000 cm−1 before and after irradiation. The wheat powders were carefully placed along the ZnSe crystal surface. A metal pressure plate was then positioned on top of the sample, applying a constant force of 75 N to ensure proper contact and reproducibility during the measurement. For each sample, three independent spectra were recorded, and the mean values of the analyzed peaks’ parameters were used. The analysis of each spectrum was carried out by subtracting the background (air) and applying baseline correction. The deconvolution of the FTIR-ATR spectra was carried out in the 1200–870 cm−1 region using seven Gaussian line functions, allowing for the determination of peak positions, amplitudes, and integrated intensity values.
EPR spectra were obtained using an EPR Bruker e-scan spectrometer operating in the X-band, with a frequency of 9.4 GHz, microwave power of 0.14 mW, and magnetic field in the range 3390–3580 G. The samples were positioned in a conventional quartz tube. All the spectra and the EPR data were normalized to the sample mass (approximately 100 mg). To investigate the EPR signal decay, each sample was analyzed immediately after the irradiation, and the measurements were repeated at regular intervals after the end of the irradiation.

3. Results and Discussion

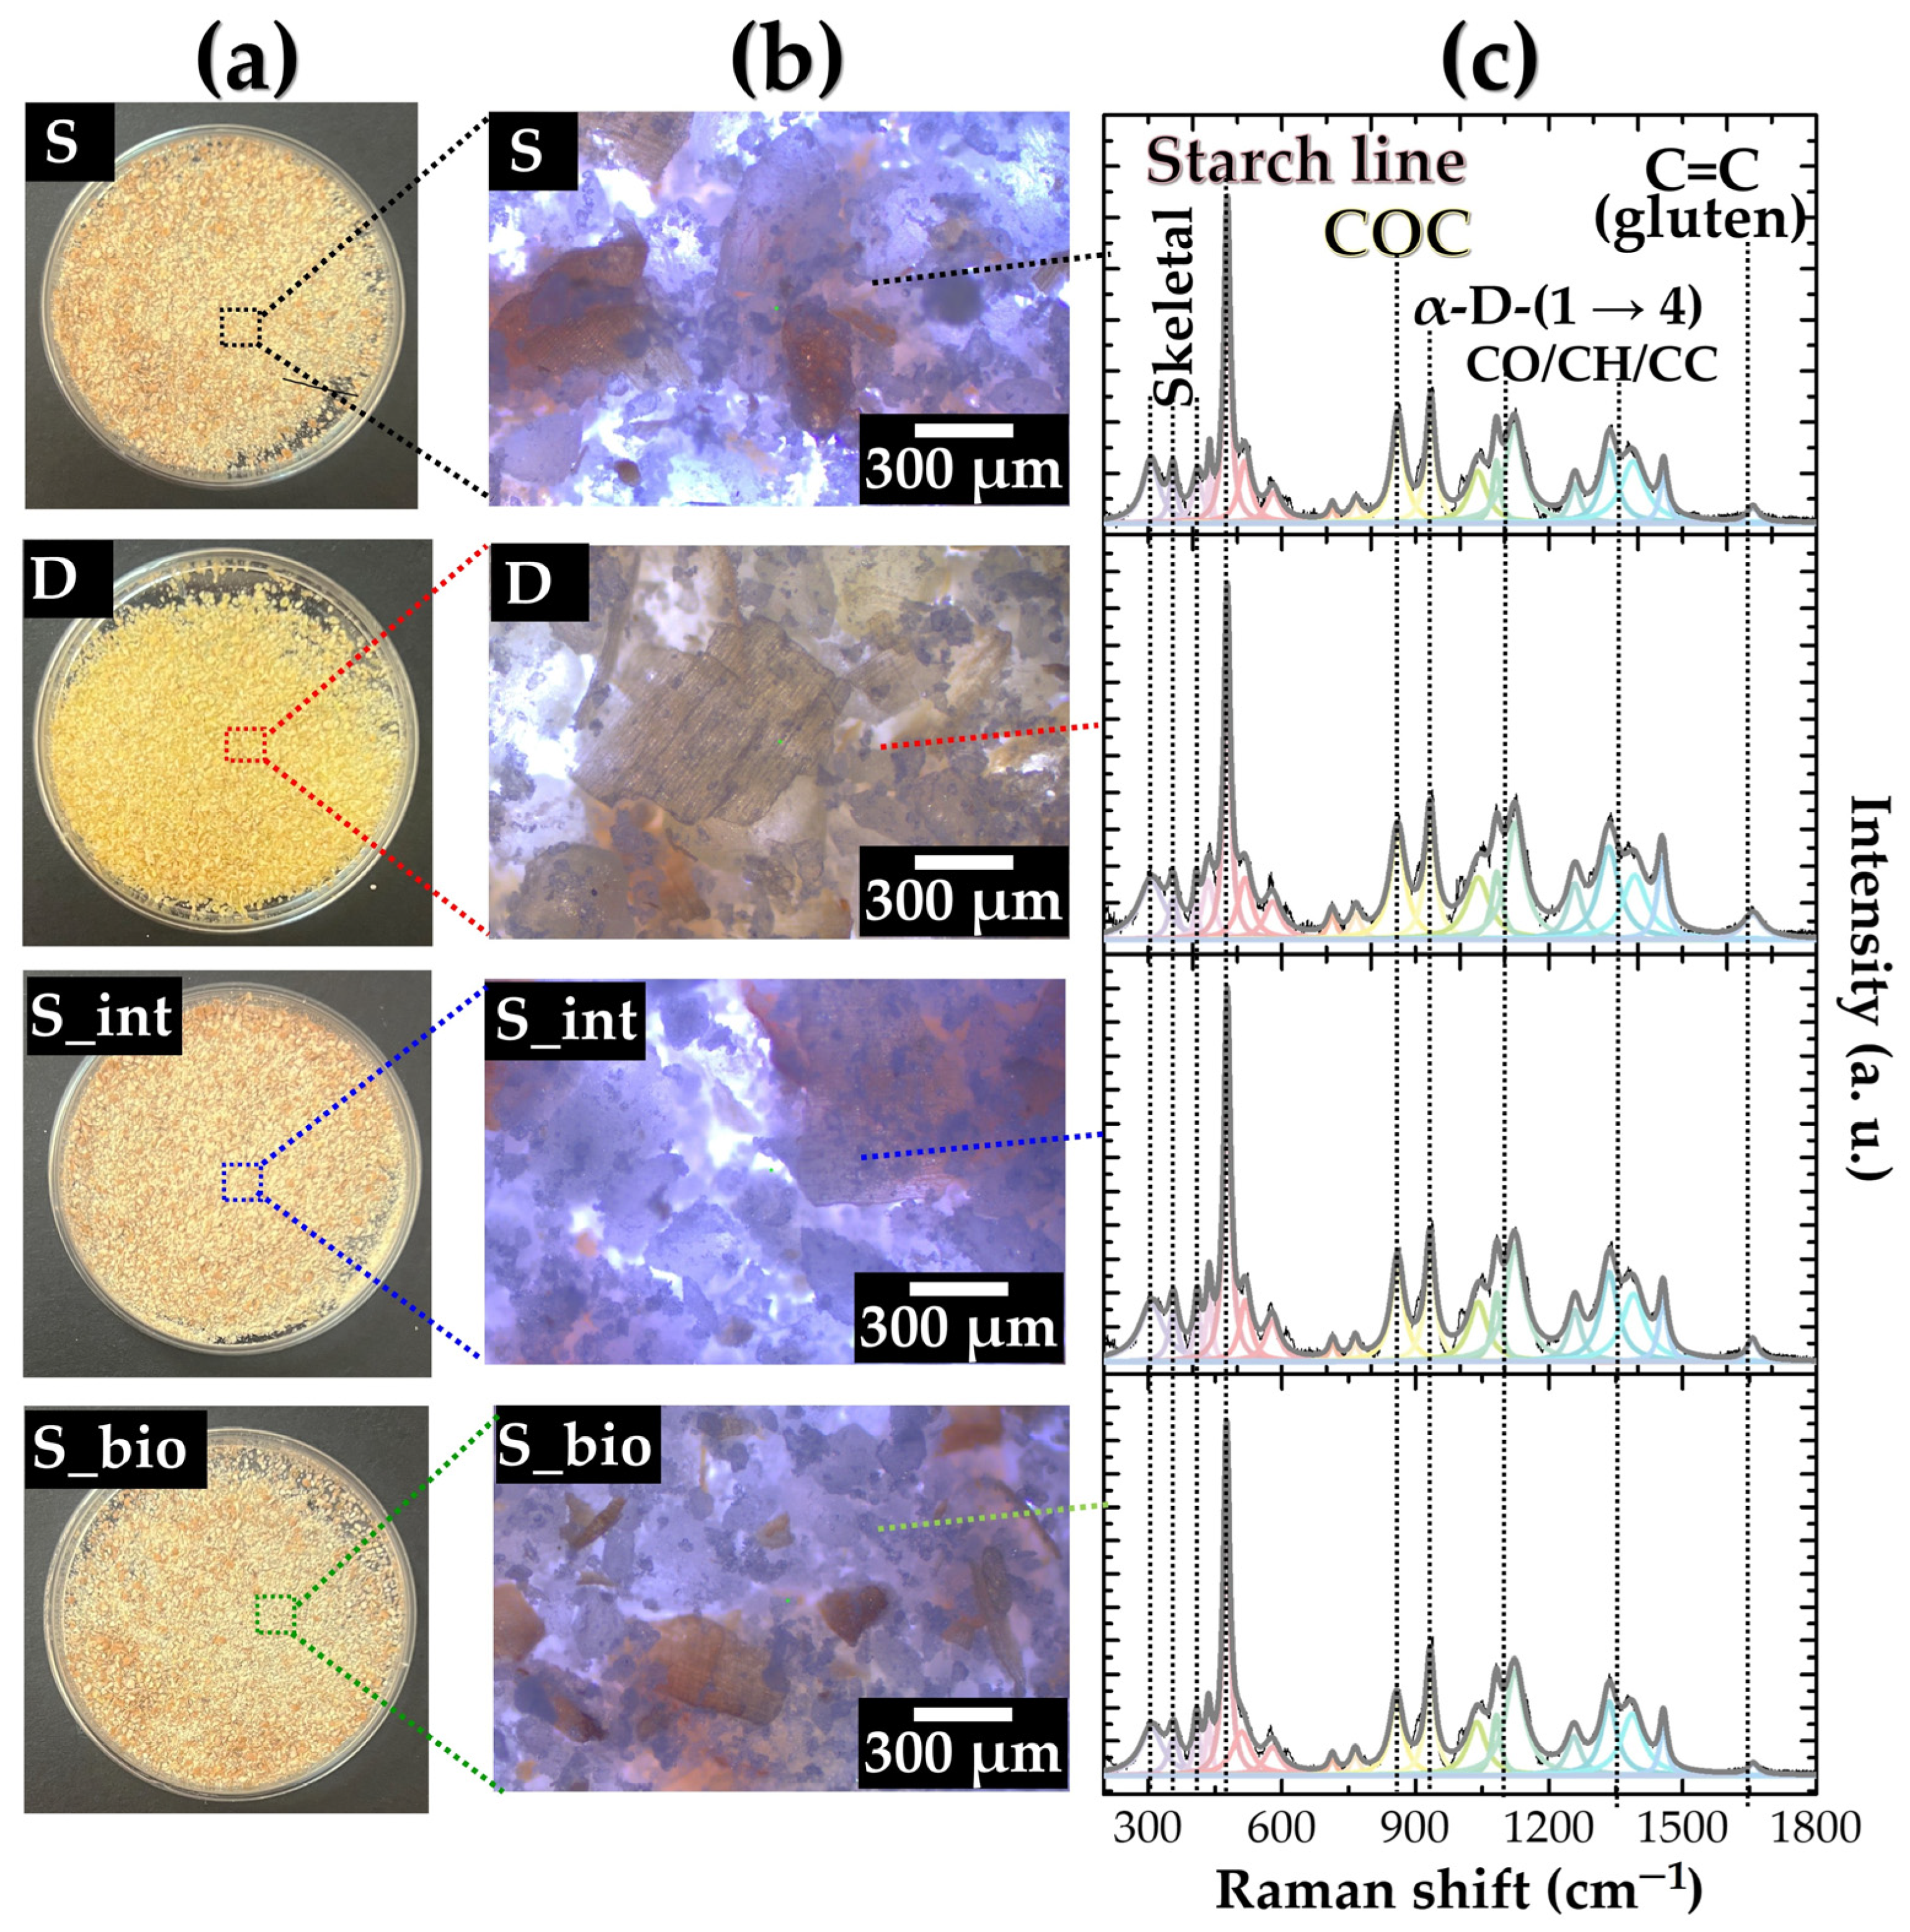
3.1. Wheat Samples Before Irradiation

The evaluation of morphological and molecular structural properties of the wheat matrix samples is accomplished through micro-Raman spectroscopy analysis. Representative pictures, optical microscope images, and deconvolved Raman spectra of S, D, S_int, and S_bio samples before irradiation are shown in Figure 1.
As shown in Figure 1a, the milled wheat samples exhibit distinct aspects and coloration. The milled durum wheat (D samples) has a characteristic yellow coloration due to its high content of carotenoid pigments [41,42]. Conventional Soft Wheat (S samples) exhibits a brownish hue, likely resulting from the presence of bran particles in the milled product. Similar brown coloration is shown by both integrated and biological soft wheat (S_int and S_bio samples), though slight variations may occur due to differences in farming practices and grain composition.
In more detail, from Figure 1b, it is possible to observe that the microscopic images of the four wheat matrices reveal globular and multilayered structural textures, respectively, attributable to endosperm and bran components of wheat grains. The different amounts of these textures can be likely due to differences in the composition and physical arrangement of components in the wheat grains [43]. The morphology of durum wheat exhibits a combination of dense globular starch granules interspersed with more rigid, layered structures indicative of protein-rich regions [44,45]. On the other hand, the microscope images of soft wheat matrices display a higher proportion of small, spherical starch granules, which is attributed to their higher starch content [46]. This occurrence, particularly notable for S_bio samples, can be tentatively imputable to the genetic variety of this wheat typology and to environmental factors such as soil quality, water availability, and climate conditions during growth.
Raman spectra of wheat samples are shown in Figure 1c. In perfect agreement with other works, the Raman spectra exhibit signals typical of amylose and amylopectin polysaccharides included within wheat and other starch-rich materials [47,48,49,50,51,52]. Key spectral regions include skeletal breathing modes below 500 cm−1, CC and CO symmetric stretching modes 950–1200 cm⁻1, and CH deformation modes between 1200 and 1500 cm−1. The most prominent band at 478 cm−1 (starch line) is attributed to ring stretching, while other signals peculiar to starch macromolecules are those at around 860 and 940 cm−1, respectively assigned to the bending modes of C–O–C at chain linkages and to α-D-glucose (1→4) linkage stretching vibrations [53,54,55]. Other notable signals appear at 1051, 1086, and 1131 cm−1, corresponding to glycosidic link stretching and bending. CH and CH2OH bending modes occur at 1267, 1339, 1378, and 1462 cm−1 [53,55]. The band at around 1650 cm−1 is assigned to C=C vibrations of gluten and protein content. This peak is particularly evident in D samples due to the high protein content of durum wheat [55,56].
On the basis of other studies [47,53], the relative area ( R a ) between the starch line and the COC band is a helpful parameter for the evaluation and comparison of the molecular structural order of the starch units contained within the investigated wheat matrices. In this context, the R a parameter was calculated as the ratio between the integrated intensity values of the starch line and the COC band according to Equation (1):
R a = I s t a r c h   l i n e I C O C
where I s t a r c h   l i n e and I C O C are the integrated intensity values of the starch line at 478 cm−1 and the COC band at 860 cm−1, respectively.
R a values of 1.8, 1.8, 1.9, and 2.2 were respectively derived for S, D, S_int, and S_bio samples before irradiation. Analogously to the morphological analysis, the slight difference among these values is plausibly due to the different nature and origin of the wheat matrices. In particular, the highest R a value disclosed for S_bio samples suggests the presence of entangled starch units with a remarkable molecular organization for this typology of wheat matrix.
To evaluate and compare the chemical compositions of the various wheat samples, FTIR-ATR spectra are shown in Figure 2, along with signals attribution.
The FTIR spectra of S, D, S_int, and S_bio samples show the signals typical of starch-containing products. Specifically, each spectrum of wheat exhibits six absorption frequency regions corresponding to O–H (3000–3700 cm−1) and C–H (2800–3000 cm−1) moieties stretching vibrations, amide bands (1550–1800 cm−1), modes of C–H/CO bonds (1200–1500 cm−1), the carbohydrate fingerprint area (grey box between 800 and 1200 cm−1) and the vibrations of pyranose rings in glycosidic units (<800 cm−1) [57,58,59,60,61,62,63,64]. To deeply investigate the chemical composition of the samples, a qualitative estimation and comparison of the protein content were achieved by analyzing the amide band region. Specifically, the protein index (PI) parameter was derived by the ratio between the absorbance of the amide II band and the CH peaks. In addition, the carbonyl (CI) and hydroxyl (OI) indices were derived for each wheat matrix (for details, see the Supplementary Materials) [64,65]. Corroborating the Raman spectroscopy analysis, Table S1 shows that D samples exhibit the highest PI, reasonably due to the bigger gluten content of durum wheat. On the other hand, the CI and OI values are strictly close for all the samples, suggesting a similar starting oxidation level.
Further information on the starch units’ organization is obtained through the analysis of the carbohydrate fingerprint region, which contains starch-related bands sensitive to changes in the assembly of starch molecules. Representative deconvolved FTIR-ATR spectra recorded between 1200 and 870 cm−1 for S, D, S_int, and S_bio samples are reported in Figure 3.
The absorption bands at 1150, 1100, and 1080 cm−1 are respectively associated with asymmetric stretching vibrations of the COC bond and the vibrational modes of CO and COH bonds, while the peak at about 930 cm−1 is attributed to the skeletal vibrations of the α-COC glycosidic bond [63,64]. The strong peak centered at 996 is due to COH bending vibrations (also in hydrogen bonds) and is particularly sensitive to water content in starch associated with the combination of bending and stretching vibrations of the glucosidic bonds. Finally, the absorption bands at 1040 and 1020 cm−1 are generally recognized to be sensitive to starch crosslinking and transition from helix to random coil [57,59]. In more detail, the band at around 1040 cm−1 is attributed to amilose and amilopectine units entangled in a double helical configuration (Helix band, Figure 3), while the signal at 1020 cm−1 is attributed to molecules arranged in amorphous domains (Random coil band, Figure 3). In this view, the ratio between the integrated intensity values of the random coil and helix bands ( R H = I R a n d o m   c o i l / I H e l i x ) reasonably provides an indication of the short-range crystalline order of the double helical structure in starch or starch-containing products [57,59]. R H values of 0.23, 0.16, 0.14, and 0.14 were respectively derived for S, D, S_int, and S_bio samples before irradiation. As a general trend, RH values lower than 0.25 suggest that double helix structures incorporated within the wheat matrices are densely packed. In particular, starch domains with moderate crystalline order are responsible for the remarkable swelling and hydration properties, which are crucial to evaluating starch quality [57,59]. Moreover, starches with more ordered structures tend to be digested more slowly, which results in a lower glycemic index [33,34]. However, it is interesting to note that soft wheat produced through conventional methods (S samples) exhibits a higher initial RH compared to the other types of wheat. Given that all wheat samples underwent the same milling and storage treatments, this difference likely stems from the native properties of conventionally cultivated soft wheat. Specifically, this type of wheat may have inherently less compact starch chains, which could lead to a higher proportion of random coil entities.

3.2. Wheat Samples After Irradiation

The aspect of S (grey box), D (red box), S_int (blue box), and S_bio samples (green box) of wheat samples after irradiation at absorbed doses of 0.1, 1, 4.5, and 10.0 kGy is shown in Figure 4.
As depicted in Figure 4, gamma irradiation up to 10 kGy produces no visible changes in the appearance or coloration of wheat samples, corroborating that gamma treatment, within these dose limits, is a non-destructive process for wheat matrices. This stability is consistent with findings in other starch-based products, where gamma irradiation at low to moderate doses primarily affects microorganisms while preserving the color and appearance of the treated materials.
Investigations on the side effects produced by gamma irradiation on the molecular structural properties of the wheat samples are accomplished through micro-Raman spectroscopy analysis. Representative spectra of S, D, S_int, and S_bio samples before and after irradiation at absorbed dose values of 0.1, 1, 4.5, and 10 kGy are shown in Figure S1 in the Supplementary Materials. At first glance, the Raman spectra of the wheat samples are rather indistinguishable before and after irradiation, even at 10 kGy. To better appreciate the effect of irradiation on the samples, Figure 5 presents the Raman spectroscopy data in terms of the R a parameter and the percentage variation in the R a “Δ( R a )%” calculated with respect to the R a value of the unirradiated samples.
As a general trend, Figure 5a shows that the R a parameter monotonically decreases as a function of the absorbed dose, corroborating the predicted relationship between dose and molecular changes. Notably, the most pronounced decrease in R a values occurs between 0 and 1 kGy, after which the decline becomes more gradual. This finding points out the dose-dependent nature of the structural alterations in wheat starch, particularly at lower irradiation doses.
To evaluate and compare the behavior of the investigated samples, Figure 5b shows the linear fitting curves of the Δ( R a )% as a function of the absorbed dose, expressed on a logarithm scale. The parameters derived from the fitting process for each wheat sample, which quantitatively describe this behavior, are summarized in Table 2.
The slope values reported in Table 2 reveal differences in the sensitivity of the various wheat types to gamma radiation. Durum wheat (D samples) exhibits the greatest absolute slope value, indicating a higher susceptibility to molecular structure degradation upon irradiation. This higher sensitivity can probably be attributed to the interplay between the macromolecules included within durum wheat matrices. As acknowledged, durum wheat exhibits a denser gluten protein network compared to soft wheat samples. This increased gluten level may induce the formation of reactive species associated with gluten or other proteins after irradiation. These intermediates can subsequently interact with nearby starch molecules, leading to their structural degradation or rearrangement.
In contrast, soft wheat varieties show a lower slope, suggesting a greater resistance to gamma irradiation. In particular, the lowest slope values were derived for soft biological wheat (S_bio samples). This resilience may likely be related to the lower protein content and higher starch-to-protein ratio in soft wheat compared to durum wheat. Additionally, biological farming practices can play a crucial role in producing wheat with a higher content of entangled starch units with a molecular organization that reduces the accessibility of reactive sites to the radiolytic species generated during exposure. As a result, the molecular integrity of starch in biological wheat is better preserved compared to less organized starch structures, which are more prone to bond breakage and depolymerization under the same conditions.
Information on the side effects produced by gamma radiation on the chemical composition and conformation of the wheat samples is obtained through FTIR-ATR spectroscopy analysis. Representative FTIR-ATR spectra of S, D, S_int, and S_bio samples after irradiation at absorbed dose values of 0.1, 1, 4.5, and 10 kGy are shown in Figure S2 of the Supplementary Materials. In more detail, Table S2 reports the CI and OI values derived for each typology of sample in each irradiation condition. In perfect agreement with other studies, both CI and OI parameter values increase as a function of the absorbed dose. This finding is an unavoidable consequence of the interaction between gamma rays and organic materials [14,15,16,24,64,65].
An in-depth investigation of the effects of irradiation on the conformational rearrangement of starch components is accomplished by analyzing the carbohydrate fingerprint region of irradiated samples. In Figure 6, the trends of the R H parameter and the percentage variation in R H , “Δ( R H )%” (calculated with respect to the R H value of the unirradiated samples), are shown as functions of the absorbed dose for each sample.
As a general observation, Figure 6a shows that R H increases after irradiation. The increase is particularly drastic between 0 and 0.1 kGy, whereas it becomes moderate in the dose range between 1 and 10 kGy. Analogously to Raman spectroscopy analysis, this suggests that the conformational changes induced by gamma rays in wheat matrices are dose-dependent, with the most significant effects occurring at lower doses. These observations can be better appreciated in Figure 6b, which shows R H variation as a function of the absorbed dose on a logarithmic scale. The fitting operation of the dose-response curves reveals distinct behaviors for each type of wheat. The fitting parameters are shown in Table 3.
As reported in Table 3, durum wheat (D sample) exhibits the greatest slope, indicating the most pronounced conformational changes in its starch structures. Analogously to the Raman analysis, FTIR results show that durum wheat exhibits the greatest conformational disruption, which can be tentatively attributed to its native chemical composition. In particular, the interactions between proteins and gamma rays not only degrade and depolymerize starch but also alter its conformational organization, transitioning from ordered double helices to less-organized random coil structures. Soft wheat varieties (conventional, integrated, and biological) exhibit more moderate and similar slope values, suggesting that their conformational changes progress in a comparable manner. This uniformity is likely due to the lower protein content in soft wheat, which may mitigate the extent of radical-induced starch degradation and conformational changes.
In view of the overall results, the combination of Raman and FTIR-ATR spectroscopy investigations clearly indicates that gamma irradiation at the investigated dose range does not cause dramatic or disruptive effects on the starch fraction in wheat. The absence of significant degradation or depolymerization suggests that the structural integrity of the starch is largely preserved under these conditions. This is a critical observation, as it demonstrates the resilience of wheat’s molecular framework to gamma exposure at the tested doses, making this technique suitable for applications where maintaining the material’s chemical and structural stability is essential. Considering that the reduction in the helical structure of starch is a key factor influencing its digestibility and functional properties in food applications, the results presented in this study are particularly encouraging from a nutritional standpoint, as more ordered starch structures are associated with slower enzymatic digestion and a lower glycemic index [33,34]. Therefore, these findings support the safe application of gamma irradiation as a preservation method for starchy foods, ensuring both food safety and the maintenance of desirable nutritional and functional characteristics. However, the coupling of Raman and FTIR-ATR spectroscopies also highlights how the cultivation method, the nature, and the intrinsic composition of wheat play a key role in the structural and conformational changes observed in starch units after irradiation. While the overall effects of irradiation are not severe, subtle differences in the starch’s response can be connected to the specific characteristics of each wheat type.
Further considerations on the effects of gamma irradiation on the wheat samples were derived from EPR analyses, which provide information on the radical species content. Figure 7 shows the EPR spectra for S, D, S_int, and S_bio samples before and after irradiation and the trend of the EPR signal area as a function of the absorbed dose values.
As shown in Figure 7a–d, the EPR signals’ intensity increases with the absorbed dose across all sample types, disclosing a direct relationship between irradiation dose and the concentration of radiation-induced free radicals within the wheat matrices. On the basis of other studies, the EPR peak positions indicate the organic nature of the radiation-induced radicals [20,21]. In particular, it is generally acknowledged that gamma irradiation induces free radicals at the C1 position on the glucose molecule of starch polysaccharides [20,66,67]. However, by considering the complex chemical composition of wheat matrices, the presence of organic radicals associated with proteins and other carbohydrates cannot be disregarded. In more detail, the comparison between the spectra in Figure 7a–d discloses a distinction in the EPR spectra profiles between soft and durum wheat samples. While the EPR spectra for soft wheat samples (S, S-int, and S_bio) are similar in shape, the spectrum profile for durum wheat (D) is slightly different in the relative intensities and signals’ fine structure. This discrepancy can plausibly be attributed to the higher protein content in durum wheat, which may lead to the formation of radical species and reactive intermediates in varying proportions during irradiation [68,69]. These observations are in agreement with the findings from FTIR and Raman spectroscopy, emphasizing the role of the native chemical composition of wheat in modulating the behavior of free radical formation in wheat samples after gamma irradiation.
Further information on the radical formation behavior is obtained from the dose-response curves in Figure 7e. The EPR signal area values, proportional to the number of radicals present in the samples, were derived by integrating twice the spectra reported in Figure 7a–d. As shown in Figure 7e, the signal area, normalized to the sample mass, exponentially increases as a function of the adsorbed dose (for details, see the Supplementary Materials) [70]. The highest exponential coefficient value disclosed for the D sample suggests that a higher number of free radicals is generated within the durum wheat matrices, plausibly due to the protein species content that offers sites available for the formation of radical species [68,69].
Additionally, insights into the post-irradiation stability of the wheat matrices were obtained by monitoring the time-dependent recombination behavior of free radicals through EPR spectroscopy analysis over time. Figure 8 shows the EPR spectra for the wheat samples at 0, 5, 7, 14, 21, and 120 days after irradiation at 10 kGy and the decay curves for S, D, S_int, and S_bio samples as a function of the time after irradiation.
As illustrated in Figure 8a–d, the intensity of the EPR signals decreases progressively over time after irradiation, indicating the recombination and transformation of radiation-induced free radicals. This trend aligns with the mechanisms proposed by Bertolini et al. [21], which suggest that the highly reactive radicals are gradually destroyed through reactions involving oxygen and water molecules infiltrating the starch granules. These reactions lead to an exponential decay of the radicals over time.
Figure 8e depicts the decay kinetics of the radiation-induced free radicals, showing distinct patterns of radical disappearance across the different wheat matrices. These differences reflect variations in the molecular arrangement of starch, particularly between its crystalline and amorphous regions. The fitting parameters for the decay curves are provided in the Supporting Information, offering quantitative insights into the kinetics of radical disappearance.
To better compare the behavior of each sample, the τ decay parameter, calculated as the time at which the radical population reaches 1/e of its initial value, is shown in the inset of Figure 8e. The derived τ values are 3.1, 2.4, 3.7, and 4.1 for S, D, S_int, and S_bio samples, respectively. These values highlight significant differences in the stability of radicals between durum wheat and the various types of soft wheat.
The τ value for durum wheat (2.4) is the lowest among all samples, suggesting that radicals in this matrix have the shortest lifespan. This behavior may be attributed to the higher protein content in durum wheat, particularly gluten. Glycoproteins within the matrix are likely to participate in radical recombination processes, reducing the lifetime of radiation-induced radicals. This finding is consistent with the above-described results (EPR, Raman, and FTIR analyses) that linked the high reactivity of proteins in durum wheat to structural changes in starch molecules induced by radicals. Among the soft wheat samples, the τ values vary significantly. Conventional soft wheat (S) exhibits the shortest radical lifetime (τ = 3.1), while biological soft wheat (S_bio) shows the longest (τ = 4.1). This trend is in agreement with the FTIR and Raman spectroscopy results, where S_bio demonstrated a higher degree of molecular organization in its starch units. Specifically, the greater prevalence of double-helical structures in S_bio starch appears to stabilize radicals, extending their lifetimes compared to the less ordered random-coil fractions found in S. These findings reinforce the idea that the intrinsic composition and molecular organization of wheat matrices play a crucial role in the formation, stability, and decay of radiation-induced radicals. The relatively short τ of durum wheat reflects the role of protein content in promoting radical recombination, while the longer τ of biological soft wheat suggests that its more organized starch structure resists degradation processes, stabilizing radicals for extended periods [68,69].
The coupling of EPR data with Raman and FTIR analyses provides a comprehensive understanding of how gamma radiation interacts with wheat components at a molecular level. By integrating these results, this study highlights the importance of wheat type and cultivation methods in determining the molecular effects of gamma exposure. These findings could have significant implications for optimizing irradiation treatments based on the specific characteristics of different wheat varieties.

4. Conclusions

This work provides compelling evidence that gamma irradiation, in the dose range of 0.1–10 kGy, is a safe and effective method for treating wheat-based food samples without causing significant damage to their molecular structures. By integrating complementary spectroscopic techniques such as FTIR-ATR, Raman, and EPR, we conducted a comprehensive investigation into the structural, conformational, and radical formation behaviors of four wheat matrices (soft, durum, soft integrated, and soft biological).
The Raman and FTIR-ATR analyses revealed that gamma irradiation induces minor structural and conformational changes, such as an increase in the random coil fraction of starch molecules. These changes, however, are not drastic and do not compromise the functional integrity of the wheat matrices. EPR spectroscopy demonstrated a direct relationship between absorbed dose and radical formation, with the molecular composition and intrinsic organization of the wheat samples modulating this behavior. Interestingly, the decay kinetics of radiation-induced radicals showed that recombination and neutralization processes effectively mitigate the radicals over time, with no evidence of severe post-irradiation degradation. Durum wheat displayed the fastest radical decay, likely due to its higher protein content, which promotes recombination, while soft biological wheat exhibited the highest radical stability, correlating with its more organized starch structure.
These findings highlight the significant role of the intrinsic composition of wheat in determining its response to gamma irradiation. The higher protein content of durum wheat makes it more reactive under irradiation, leading to greater structural and conformational changes in its starch molecules. On the other hand, soft wheat, regardless of cultivation method, appears to undergo less dramatic changes, likely due to its lower protein content and inherently less reactive molecular composition.
These results underscore the suitability of gamma irradiation as a non-destructive, reliable treatment for food matrices rich in polysaccharides. The methodologies and findings presented in this study can serve as a foundation for developing advanced screening and treatment approaches for a wide variety of polysaccharides in diverse crops, ensuring food safety and preservation while maintaining nutritional and structural integrity. In addition, understanding the interplay between molecular composition and irradiation effects is demonstrated to be crucial for tailoring gamma treatments to specific wheat types while minimizing unwanted structural degradation. Moreover, the dose range explored in this study (0.1–10 kGy), which complies with international food irradiation guidelines, may serve as a useful reference for future investigations aiming to define optimal irradiation parameters for industrial applications tailored to different wheat varieties and production needs.

Supplementary Materials

The following supporting information can be downloaded at https://www.mdpi.com/article/10.3390/polysaccharides6020039/s1, Table S1: Parameters derived by FTIR-ATR analysis for samples before irradiation. Figure S1: Representative spectra of S, D, S_int and S_bio samples before (0 kGy) and after irradiation at absorbed dose rate of 0.1, 1, 4.5 and 10 kGy along with main signals attribution. Figure S2: Representative FTIR-ATR spectra of S, D, S_int and S_bio samples before (0 kGy) and after irradiation at absorbed dose rate of 0.1, 1, 4.5 and 10 kGy along with main signals attribution. Table S2: Parameters derived by FTIR-ATR analysis for samples after irradiation. Table S3: Parameters derived by the dose-response curves. Table S4: Parameters derived by the dose-response curves.

Author Contributions

Conceptualization: R.C. and A.C.; methodology: R.C., I.D.S., J.S. and A.C.; software: R.C, L.L. and B.D.; validation: A.C., I.D.S. and J.S.; formal analysis: R.C.; investigation: R.C., L.L., B.D. and E.M.; resources, A.C.; data curation, R.C., L.L., B.D. and E.M.; writing—original draft preparation, R.C. and B.D.; writing—review and editing: R.C., A.C. and J.S.; visualization, R.C., A.C., I.D.S. and J.S.; supervision, A.C. All authors have read and agreed to the published version of the manuscript.

Funding

This research is part of METROFOOD-IT project, that has received funding from the European Union—NextGeneration-EU, PNRR—Mission 4 “Education and Research” Component 2: from research to business, Investment 3.1: Fund for the realization of an integrated system of research and innovation infrastructures, IR0000033 (D.M. Prot. n.120 del 21 giugno 2022) CUP I83C22001040006.

Institutional Review Board Statement

Not applicable.

Data Availability Statement

The authors confirm that the data supporting the findings of this study are available within this article and its Supplementary Materials.

Acknowledgments

The authors sincerely acknowledge Claudia Zoani and Alessandra Bernardini (Department for Sustainability, ENEA) for their invaluable support and for providing the samples used in this study.

Conflicts of Interest

The authors declare no conflicts of interest.

References

  1. Svanidze, M.; Ðuri’c, I.Ð.; Samoggia, A.; Ólafsdóttir, G. Global Wheat Market Dynamics: What Is the Role of the EU and the Black Sea Wheat Exporters? Agriculture 2021, 11, 799. [Google Scholar] [CrossRef]
  2. Dohlman, E.; Hansen, J.; Boussios, D. USDA Agricultural Projections to 2031; United States Department of Agriculture: Washington, DC, USA, 2022. [CrossRef]
  3. Rosicka-Kaczmarek, J.; Kwaśniewska-Karolak, I.; Nebesny, E.; Komisarczyk, A. The Functionality of Wheat Starch. In Starch in Food Structure, Function and Applications; Elsevier: Amsterdam, The Netherlands, 2018; pp. 325–352. [Google Scholar] [CrossRef]
  4. Cornell, H.J.; Hoveling, A.W. Wheat: Chemistry and Utilization; CRC Press: Boca Raton, FL, USA, 2020. [Google Scholar] [CrossRef]
  5. Finney, K.F.; Yamazaki, W.T.; Youngs, V.L.; Rubenthaler, G.L. Quality of Hard, Soft, and Durum Wheats. Wheat Wheat Improv. 2015, 13, 677–748. [Google Scholar] [CrossRef]
  6. Ficco, D.B.M.; Borrelli, G.M.; Giovanniello, V.; Platani, C.; De Vita, P. Production of Anthocyanin-Enriched Flours of Durum and Soft Pigmented Wheats by Air-Classification, as a Potential Ingredient for Functional Bread. J. Cereal Sci. 2018, 79, 118–126. [Google Scholar] [CrossRef]
  7. Sharma, R.C.; Akramkhanov, A.; Amanov, S.; Boboev, H. Integrated Wheat Crop Management Manual for Cold Winter Deserts; FAO: Rome, Italy, 2023. [Google Scholar] [CrossRef]
  8. Erenstein, O.; Jaleta, M.; Abdul Mottaleb, K.; Sonder, K.; Donovan, J.; Braun, H.J. Global Trends in Wheat Production, Consumption and Trade. In Wheat Improvement Food Security in a Changing Climate; Springer: Berlin/Heidelberg, Germany, 2022; pp. 47–66. [Google Scholar] [CrossRef]
  9. Lisboa, H.M.; Pasquali, M.B.; dos Anjos, A.I.; Sarinho, A.M.; de Melo, E.D.; Andrade, R.; Batista, L.; Lima, J.; Diniz, Y.; Barros, A. Innovative and Sustainable Food Preservation Techniques: Enhancing Food Quality, Safety, and Environmental Sustainability. Sustainability 2024, 16, 8223. [Google Scholar] [CrossRef]
  10. Hashim, M.S.; Yusop, S.M.; Rahman, I.A. The Impact of Gamma Irradiation on the Quality of Meat and Poultry: A Review on Its Immediate and Storage Effects. Appl. Food Res. 2024, 4, 100444. [Google Scholar] [CrossRef]
  11. Mshelia, R.D.-z.; Dibal, N.I.; Chiroma, S.M. Food Irradiation: An Effective but under-Utilized Technique for Food Preservations. J. Food Sci. Technol. 2023, 60, 2517–2525. [Google Scholar] [CrossRef]
  12. Handayani, M.; Permawati, H. Gamma Irradiation Technology to Preservation of Foodstuffs as an Effort to Maintain Quality and Acquaint the Significant Role of Nuclear on Food Production to Indonesia Society: A Review. Energy Procedia 2017, 127, 302–309. [Google Scholar] [CrossRef]
  13. Ben-Fadhel, Y.; Cingolani, M.C.; Li, L.; Chazot, G.; Salmieri, S.; Horak, C.; Lacroix, M. Effect of γ-Irradiation and the Use of Combined Treatments with Edible Bioactive Coating on Carrot Preservation. Food Packag. Shelf Life 2021, 28, 100635. [Google Scholar] [CrossRef]
  14. D’Orsi, B.; Carcione, R.; Di Sarcina, I.; Ferrara, G.; Oliviero, M.; Rinaldi, T.; Scifo, J.; Verna, A.; Cemmi, A. Gamma Irradiation for Cultural Heritage Conservation: Comparison of the Side Effects on New and Old Paper. J. Cult. Herit. 2024, 70, 335–344. [Google Scholar] [CrossRef]
  15. Sunder, M.; Mumbrekar, K.D.; Mazumder, N. Gamma Radiation as a Modifier of Starch—Physicochemical Perspective. Curr. Res. Food Sci. 2022, 5, 141–149. [Google Scholar] [CrossRef]
  16. Atrous, H.; Benbettaieb, N.; Hosni, F.; Danthine, S.; Blecker, C.; Attia, H.; Ghorbel, D. Effect of γ-Radiation on Free Radicals Formation, Structural Changes and Functional Properties of Wheat Starch. Int. J. Biol. Macromol. 2015, 80, 64–76. [Google Scholar] [CrossRef] [PubMed]
  17. Zhiguang, C.; Rui, Z.; Qi, Y.; Haixia, Z. The Effects of Gamma Irradiation Treatment on Starch Structure and Properties: A Review. Int. J. Food Sci. Technol. 2023, 58, 4519–4528. [Google Scholar] [CrossRef]
  18. Kang, I.J.; Byun, M.W.; Yook, H.S.; Bae, C.H.; Lee, H.S.; Kwon, J.H.; Chung, C.K. Production of Modified Starches by Gamma Irradiation. Radiat. Phys. Chem. 1999, 54, 425–430. [Google Scholar] [CrossRef]
  19. Zhu, F. Impact of γ-Irradiation on Structure, Physicochemical Properties, and Applications of Starch. Food Hydrocoll. 2016, 52, 201–212. [Google Scholar] [CrossRef]
  20. Raffi, J.J.; Agnel, J.P.; Thiery, C.J.; Frejaville, C.M.; Saint-Lébe, L.R. Study of Gamma-Irradiated Starches Derived from Different Foodstuffs: A Way for Extrapolating Wholesomeness Data. J. Agric. Food Chem. 1981, 29, 1227–1232. [Google Scholar] [CrossRef]
  21. Bertolini, A.C.; Mestres, C.; Colonna, P.; Raffi, J. Free Radical Formation in UV- and Gamma-Irradiated Cassava Starch. Carbohydr. Polym. 2001, 44, 269–271. [Google Scholar] [CrossRef]
  22. Sudheesh, C.; Sunooj, K.V.; George, J.; Kumar, S.; Vikas; Sajeevkumar, V.A. Impact of Γ− Irradiation on the Physico-Chemical, Rheological Properties and in Vitro Digestibility of Kithul (Caryota urens) Starch; a New Source of Nonconventional Stem Starch. Radiat. Phys. Chem. 2019, 162, 54–65. [Google Scholar] [CrossRef]
  23. Labelle, M.A.; Ispas-Szabo, P.; Mateescu, M.A. Structure-Functions Relationship of Modified Starches for Pharmaceutical and Biomedical Applications. Starch-Stärke 2020, 72, 2000002. [Google Scholar] [CrossRef]
  24. Bhat, N.A.; Wani, I.A.; Hamdani, A.M.; Masoodi, F.A. Effect of Gamma-Irradiation on the Thermal, Rheological and Antioxidant Properties of Three Wheat Cultivars Grown in Temperate Indian Climate. Radiat. Phys. Chem. 2020, 176, 108953. [Google Scholar] [CrossRef]
  25. Rigas, N.; Maharjan, P.; Partington, D.; McDonald, L.; Walker, C.; Bekes, F.; Florides, C.; Panozzo, J. Adverse Effects of High-Dose Gamma Irradiation on Wheat Quality and Processing Traits. Cereal Chem. 2023, 100, 945–953. [Google Scholar] [CrossRef]
  26. Chakraborty, S.; Mahapatra, S.; Hooi, A.; Ali, M.N.; Satdive, R. Determination of Median Lethal (LD50) and Growth Reduction (GR50) Dose of Gamma Irradiation for Induced Mutation in Wheat. Brazilian Arch. Biol. Technol. 2023, 66, e23220294. [Google Scholar] [CrossRef]
  27. Kiani, D.; Borzouei, A.; Ramezanpour, S.; Soltanloo, H.; Saadati, S. Application of Gamma Irradiation on Morphological, Biochemical, and Molecular Aspects of Wheat (Triticum aestivum L.) under Different Seed Moisture Contents. Sci. Rep. 2022, 12, 11082. [Google Scholar] [CrossRef] [PubMed]
  28. Scott, G.; Awika, J.M. Effect of Protein–Starch Interactions on Starch Retrogradation and Implications for Food Product Quality. Compr. Rev. Food Sci. Food Saf. 2023, 22, 2081–2111. [Google Scholar] [CrossRef] [PubMed]
  29. Yang, T.; Wang, P.; Zhou, Q.; Zhong, Y.; Wang, X.; Cai, J.; Huang, M.; Jiang, D. Effects of Different Gluten Proteins on Starch’s Structural and Physicochemical Properties during Heating and Their Molecular Interactions. Int. J. Mol. Sci. 2022, 23, 8523. [Google Scholar] [CrossRef]
  30. Zhang, H.; Zhang, B.; He, H.; Zhang, L.; Hu, X.; Wu, C. Fungicidal Effect of Strong Oxidative Free Radicals Against Fusarium Graminearum and Their Impact on Wheat Growth and Yield. Agriculture 2025, 15, 404. [Google Scholar] [CrossRef]
  31. Abdi, R.; Cao, W.; Zogheib, A.; Pukazhendhi, K.M.K.; Espinal-Ruiz, M.; Gammage, S.; Warriner, K.; Joye, I.J. Surface Disinfection of Wheat Kernels Using Gas Phase Hydroxyl-Radical Processes: Effect on Germination Characteristics, Microbial Load, and Functional Properties. J. Food Sci. 2024, 89, 1154–1166. [Google Scholar] [CrossRef]
  32. Boshevska, M.; Sandeva, I.; Cabo Verde, S.; Spasevska, H.; Jankuloski, Z. Effects of Different Irradiation Doses and Storage Period on Microbiological Characteristics of Wheat (Triticum aestivum L.). Food Control 2024, 158, 110201. [Google Scholar] [CrossRef]
  33. Melios, S.; Stramarkou, M.; Grasso, S. Innovations in Food: A Review on the Consumer Perception of Non-Thermal Processing Technologies. LWT 2025, 223, 117688. [Google Scholar] [CrossRef]
  34. Junaedi, I.; McNeill, L.S.; Hamlin, R.P. Developing Food Consumer Attitudes towards Ionizing Radiation and Genetic Modification. Nutrients 2024, 16, 3427. [Google Scholar] [CrossRef]
  35. Osman, A.M.A.; Hassan, A.B.; Osman, G.A.M.; Mohammed, N.; Rushdi, M.A.H.; Diab, E.E.; Babiker, E.E. Effects of Gamma Irradiation and/or Cooking on Nutritional Quality of Faba Bean (Vicia faba L.) Cultivars Seeds. J. Food Sci. Technol. 2014, 51, 1554–1560. [Google Scholar] [CrossRef]
  36. Bhat, S.A.; Singla, M.; Goraya, R.K.; Kumar, Y.; Jan, K.; Bashir, K. Dose-Dependent Effects of Gamma Irradiation on Microbiological, Antioxidant, and Functional Properties of Buckwheat, Cowpea, Oat, and Brown Rice Flour. J. Food Process. Preserv. 2024, 2024, 1196594. [Google Scholar] [CrossRef]
  37. Pagliarello, R.; Bennici, E.; Cemmi, A.; Di Sarcina, I.; Spelt, C.; Nardi, L.; Del Fiore, A.; De Rossi, P.; Paolini, F.; Koes, R.; et al. Designing a Novel Tomato Ideotype for Future Cultivation in Space Manned Missions. Front. Astron. Space Sci. 2023, 9, 1040633. [Google Scholar] [CrossRef]
  38. Massa, S.; Pagliarello, R.; Cemmi, A.; Di Sarcina, I.; Bombarely, A.; Demurtas, O.C.; Diretto, G.; Paolini, F.; Petzold, H.E.; Bliek, M.; et al. Modifying Anthocyanins Biosynthesis in Tomato Hairy Roots: A Test Bed for Plant Resistance to Ionizing Radiation and Antioxidant Properties in Space. Front. Plant Sci. 2022, 13, 830931. [Google Scholar] [CrossRef] [PubMed]
  39. Cemmi, A.; Di Sarcina, I.; D’Orsi, B. Gamma Radiation-Induced Effects on Paper Irradiated at Absorbed Doses Common for Cultural Heritage Preservation. Radiat. Phys. Chem. 2023, 202, 110452. [Google Scholar] [CrossRef]
  40. Baccaro, S.; Casieri, C.; Cemmi, A.; Chiarini, M.; D’Aiuto, V.; Tortora, M. Characterization of γ-Radiation Induced Polymerization in Ethyl Methacrylate and Methyl Acrylate Monomers Solutions. Radiat. Phys. Chem. 2017, 141, 131–137. [Google Scholar] [CrossRef]
  41. Wieser, H.; Koehler, P.; Scherf, K.A. Wheat-Based Food and Feed. In Wheat—An Exceptional Crop; Elsevier: Amsterdam, The Netherlands, 2020; pp. 61–102. [Google Scholar] [CrossRef]
  42. Boggini, G.; Namoune, H.; Abecassis, J.; Cuq, B. Other Traditional Durum-Derived Products. In Durum Wheat Chem. Chemistry and Technology, 2nd ed.; Elsevier: Amsterdam, The Netherlands, 2012; pp. 177–199. [Google Scholar] [CrossRef]
  43. Tian, X.; Wang, Z.; Yang, S.; Wang, X.; Li, L.; Sun, B.; Ma, S.; Zheng, S. Microstructure Observation of Multilayers Separated from Wheat Bran. Grain Oil Sci. Technol. 2021, 4, 165–173. [Google Scholar] [CrossRef]
  44. Dronzek, B.L.; Dexter, J.E.; Matsuo, R.R. A Scanning Electron Microscopy Study of Wheat Gluten. Can. Inst. Food Sci. Technol. J. 1980, 13, 162–166. [Google Scholar] [CrossRef]
  45. Zafar, T.A.; Aldughpassi, A.; Al-Mussallam, A.; Al-Othman, A. Microstructure of Whole Wheat versus White Flour and Wheat-Chickpea Flour Blends and Dough: Impact on the Glycemic Response of Pan Bread. Int. J. Food Sci. 2020, 2020, 8834960. [Google Scholar] [CrossRef]
  46. Hammami, R.; Barbar, R.; Laurent, M.; Cuq, B. Durum Wheat Couscous Grains: An Ethnic Mediterranean Food at the Interface of Traditional Domestic Preparation and Industrial Manufacturing. Foods 2022, 11, 902. [Google Scholar] [CrossRef]
  47. Zhao, J.; Zhang, Y.; Wu, Y.; Liu, L.; Ouyang, J. Physicochemical Properties and in Vitro Digestibility of Starch from Naturally Air-Dried Chestnut. Int. J. Biol. Macromol. 2018, 117, 1074–1080. [Google Scholar] [CrossRef]
  48. Cael, S.J.; Koenig, J.L.; Blackwell, J. Infrared and Raman Spectroscopy of Carbohydrates: Part III: Raman Spectra of the Polymorphic Forms of Amylose. Carbohydr. Res. 1973, 29, 123–134. [Google Scholar] [CrossRef] [PubMed]
  49. Fechner, P.M.; Wartewig, S.; Kleinebudde, P.; Neubert, R.H.H. Studies of the Retrogradation Process for Various Starch Gels Using Raman Spectroscopy. Carbohydr. Res. 2005, 340, 2563–2568. [Google Scholar] [CrossRef] [PubMed]
  50. Phillips, D.L.; Xing, J.; Liu, H.; Pan, D.H.; Corke, H. Potential Use of Raman Spectroscopy for Determination of Amylose Content in Maize Starch. Cereal Chem. 1999, 76, 821–823. [Google Scholar] [CrossRef]
  51. Wellner, N.; Georget, D.M.R.; Parker, M.L.; Morris, V.J. In Situ Raman Microscopy of Starch Granule Structures in Wild Type and Ae Mutant Maize Kernels. Starch-Stärke 2011, 63, 128–138. [Google Scholar] [CrossRef]
  52. Lohumi, S.; Lee, H.; Kim, M.S.; Qin, J.; Cho, B.K. Raman Hyperspectral Imaging and Spectral Similarity Analysis for Quantitative Detection of Multiple Adulterants in Wheat Flour. Biosyst. Eng. 2019, 181, 103–113. [Google Scholar] [CrossRef]
  53. Pezzotti, G.; Zhu, W.; Chikaguchi, H.; Marin, E.; Masumura, T.; Sato, Y.-i.; Nakazaki, T. Raman Spectroscopic Analysis of Polysaccharides in Popular Japanese Rice Cultivars. Food Chem. 2021, 354, 129434. [Google Scholar] [CrossRef]
  54. Wang, S.; Wang, J.; Zhang, W.; Li, C.; Yu, J.; Wang, S. Molecular Order and Functional Properties of Starches from Three Waxy Wheat Varieties Grown in China. Food Chem. 2015, 181, 43–50. [Google Scholar] [CrossRef]
  55. Gautam, S.; Morey, R.; Rau, N.; Scheuring, D.C.; Kurouski, D.; Vales, M.I. Raman Spectroscopy Detects Chemical Differences between Potato Tubers Produced under Normal and Heat Stress Growing Conditions. Front. Plant Sci. 2023, 14, 1105603. [Google Scholar] [CrossRef]
  56. Egging, V.; Nguyen, J.; Kurouski, D. Detection and Identification of Fungal Infections in Intact Wheat and Sorghum Grain Using a Hand-Held Raman Spectrometer. Anal. Chem. 2018, 90, 8616–8621. [Google Scholar] [CrossRef]
  57. Ispas-Szabo, P.; Ravenelle, F.; Hassan, I.; Preda, M.; Mateescu, M.A. Structure-Properties Relationship in Cross-Linked High-Amylose Starch for Use in Controlled Drug Release. Carbohydr. Res. 2000, 323, 163–175. [Google Scholar] [CrossRef]
  58. Lin, H.; Bean, S.R.; Tilley, M.; Peiris, K.H.S.; Brabec, D. Qualitative and Quantitative Analysis of Sorghum Grain Composition Including Protein and Tannins Using ATR-FTIR Spectroscopy. Food Anal. Methods 2021, 14, 268–279. [Google Scholar] [CrossRef]
  59. Bajer, D.; Kaczmarek, H.; Bajer, K. The Structure and Properties of Different Types of Starch Exposed to UV Radiation: A Comparative Study. Carbohydr. Polym. 2013, 98, 477–482. [Google Scholar] [CrossRef] [PubMed]
  60. Kizil, R.; Irudayaraj, J.; Seetharaman, K. Characterization of Irradiated Starches by Using FT-Raman and FTIR Spectroscopy. J. Agric. Food Chem. 2002, 50, 3912–3918. [Google Scholar] [CrossRef] [PubMed]
  61. Gunarathne, R.; Marikkar, N.; Yalegama, C.; Mendis, E. FTIR Spectral Analysis Combined with Chemometrics in Evaluation of Composite Mixtures of Coconut Testa Flour and Wheat Flour. J. Food Meas. Charact. 2022, 16, 1796–1806. [Google Scholar] [CrossRef]
  62. Bajer, D.; Janczak, K.; Bajer, K. Novel Starch/Chitosan/Aloe Vera Composites as Promising Biopackaging Materials. J. Polym. Environ. 2020, 28, 1021–1039. [Google Scholar] [CrossRef]
  63. Tew, W.Y.; Ying, C.; Wujun, Z.; Baocai, L.; Yoon, T.L.; Yam, M.F.; Jingying, C. Application of FT-IR Spectroscopy and Chemometric Technique for the Identification of Three Different Parts of Camellia Nitidissima and Discrimination of Its Authenticated Product. Front. Pharmacol. 2022, 13, 931203. [Google Scholar] [CrossRef]
  64. Demidov, S.V.; Rudneva, T.N.; Allayarova, U.Y.; Klimanova, E.N.; Allayarova, A.S.; Shitikova, A.V.; Chekalina, S.D.; Allayarov, S.R. Fourier Transform IR Spectroscopic Study of the Influence of a High Dose of Gamma Radiation on the Composition of Functional Groups in Potato Tubers. High Energy Chem. 2023, 57, 356–363. [Google Scholar] [CrossRef]
  65. Allayarov, S.R.; Rudneva, T.N.; Demidov, S.V.; Allayarova, U.Y.; Klimanova, E.N. A Study of the Influence of γ-Irradiation on the Composition of Functional Groups on the Surfaces of Oat Grain Shell, Kernel, and Seed Powder. High Energy Chem. 2022, 56, 429–436. [Google Scholar] [CrossRef]
  66. Raffi, J.J.; Agnel, J.P.L. Influence of the Physical Structure of Irradiated Starches on Their Electron Spin Resonance Spectra Kinetics. J. Phys. Chem. 1983, 87, 2369–2373. [Google Scholar] [CrossRef]
  67. Raffi, J.; Agnel, J.-P.; Boizot, C.; Thiéry, C.; Vincent, P. Glucose Oligomers as Models to Elucidate the Starch Radiolysis Mechanism. Starch-Stärke 1985, 37, 228–231. [Google Scholar] [CrossRef]
  68. Ukai, M.; Shimoyama, Y. Free Radicals in Irradiated Wheat Flour Detected by Electron Spin Resonance. Appl. Magn. Reson. 2005, 29, 315–324. [Google Scholar] [CrossRef]
  69. Vazirov, R.A.; Narkhova, A.A.; Vazirova, E.N.; Sokovnin, S.Y. Electron Paramagnetic Resonance Signal in Wheat Seeds Irradiated with Low-Energy Electron Beam. Radiat. Phys. Chem. 2023, 208, 110934. [Google Scholar] [CrossRef]
  70. Polat, M.; Korkmaz, M. The ESR Spectroscopic Features and Kinetics of the Radiation-Induced Free Radicals in Maize (Zea mays L.). Food Res. Int. 2004, 37, 293–300. [Google Scholar] [CrossRef]
Figure 1. Representative (a) pictures, (b) optical microscope images, and (c) deconvolved Raman spectra along with signal attribution for S, D, S_int, and S_bio samples before irradiation. A color palette was used in the figure to distinguish between the different signals. The main Raman peaks are highlighted with dashed lines to guide the reader’s interpretation.
Polysaccharides 06 00039 g001
Figure 2. FTIR-ATR spectra of S, D, S_int, and S_bio samples along with signal attribution.
Polysaccharides 06 00039 g002
Figure 3. Representative deconvolved FTIR-ATR spectra recorded between 1200 and 870 cm−1 along with signal attribution for S, D, S_int, and S_bio samples before irradiation. A color palette was used in the figure to distinguish between the different signals. The deconvolved FTIR-ATR peaks are highlighted with dashed lines to guide the reader’s interpretation.
Polysaccharides 06 00039 g003
Figure 4. From left to right: representative pictures for S (grey box), D (red box), S_int (blue box), and S_bio samples (green box) after irradiation at absorbed doses of 0.1, 1, 4.5, and 10 kGy.
Polysaccharides 06 00039 g004
Figure 5. (a) Trend of the R a parameter as a function of the absorbed dose values; (b) linear fitting of the percentage variation in the R a parameter “Δ( R a )%” as a function of the absorbed dose values. Note that the scale in (b) is expressed as a logarithmic function. The error bars were calculated as the standard deviation of the average values derived from the analysis of three independent spectra for each investigated condition.
Polysaccharides 06 00039 g005
Figure 6. (a) Trend of the R H parameter as a function of the absorbed dose values; (b) linear fitting of the percentage variation in the R H parameter “Δ( R H )%” as a function of the absorbed dose values. Note that the scale in (b) is expressed on a logarithmic scale. The error bars were calculated as the standard deviation of the average values derived from the analysis of three independent spectra for each investigated condition.
Polysaccharides 06 00039 g006
Figure 7. EPR spectra for (a) S, (b) D, (c) S_int, and (d) S_bio samples before and after irradiation; (e) trend of the EPR signal area as a function of the absorbed dose values.
Polysaccharides 06 00039 g007
Figure 8. EPR spectra for (a) S, (b) D, (c) S_int, and (d) S_bio samples at 0, 5, 7, 14, 21, and 120 days after irradiation at 10 kGy; (e) trend of the normalized EPR signals area for S, D, S_int, and S_bio samples as a function of the time after irradiation.
Polysaccharides 06 00039 g008
Table 1. Details of the wheat samples, including names and descriptions.
Sample NameCropTypologyVarietyOriginRegion
SM02SoftTaylorItalyPiemonte
DM05DurumColomboItalyPiemonte
S_intM26Soft integrated ItalyToscana
S_bioM31Soft bio ItalyToscana
Table 2. Parameters derived from the linear fitting operation of Raman spectroscopy data for each sample.
SampleSlopeInterceptR2
S−12.1−17.30.929
D−13.7−17.80.994
S_int−10.5−16.30.954
S_bio−9.0−15.10.948
Table 3. Parameters derived from the linear fitting operation of FTIR-ATR spectroscopy data for each sample.
SampleSlopeInterceptR2
S21500.926
D56880.978
S_int30870.990
S_bio27730.991
Disclaimer/Publisher’s Note: The statements, opinions and data contained in all publications are solely those of the individual author(s) and contributor(s) and not of MDPI and/or the editor(s). MDPI and/or the editor(s) disclaim responsibility for any injury to people or property resulting from any ideas, methods, instructions or products referred to in the content.

