Article

Modification of Epoxidized Soybean Oil for the Preparation of Amorphous, Nonretrogradable, and Hydrophobic Starch Films

by
Sara Dalle Vacche
1,2,*,
Leandro Hernan Esposito
1,
Daniele Bugnotti
3,
Emanuela Callone
3,
Sara Fernanda Orsini
4,
Massimiliano D’Arienzo
4,5,
Laura Cipolla
6,
Simona Petroni
6,
Alessandra Vitale
1,2,
Roberta Bongiovanni
1,2 and
Sandra Dirè
3,*
1
Department of Applied Science and Technology, Politecnico di Torino, 10129 Torino, Italy
2
INSTM-Politecnico di Torino Research Unit, 50121 Firenze, Italy
3
Department of Industrial Engineering, University of Trento, 38123 Trento, Italy
4
Department of Materials Science, University of Milano-Bicocca, 20125 Milano, Italy
5
INSTM-UniMIB Research Unit, 50121 Firenze, Italy
6
Department of Biotechnology and Biosciences, University of Milano-Bicocca, Piazza della Scienza 2, 20126 Milano, Italy
*
Authors to whom correspondence should be addressed.
Polysaccharides 2025, 6(2), 40; https://doi.org/10.3390/polysaccharides6020040
Submission received: 24 January 2025 / Revised: 15 April 2025 / Accepted: 3 May 2025 / Published: 7 May 2025

Abstract

:
Starch was plasticized with epoxidized soybean oil (ESO) modified by reaction with cinnamic acid (CA), and films were prepared using solvent casting from water/ethanol solutions. They exhibited good hydrophobicity, reduced water sensitivity, and showed the same transparency as glycerol-plasticized counterparts, but with less flexibility. Interestingly, modified ESO enhanced gelatinization and hindered retrogradation of the biopolymer. ESO was reacted with CA without the use of catalysts to obtain a β-hydroxyester; in order to optimize the synthesis process, different reaction conditions were explored, varying the stoichiometry and the heating cycles. Products were fully characterized by Fourier transform infrared (FTIR) spectroscopy, 1H and 13C nuclear magnetic resonance (NMR), and the different reactions following the opening of the oxirane ring were discussed. The properties of the novel starch-based films prepared with modified ESO highlight their use in food packaging, disposable devices, and agricultural mulching films.

Graphical Abstract

1. Introduction

Starch has great potential as an abundant, biodegradable, and cheap biomaterial; nevertheless, its properties strongly depend on its structure. Starch is a quite complex system. Native starch comes in the form of microscopic granules, where both crystalline and amorphous regions are formed by specific molecular arrangements of amylose and amylopectin. In crystalline domains, there is evidence of double helices among amylopectin chains, while in the amorphous region, the main interactions are between amylopectin branches and amylose. Each starch source is characterized by the unique ratio of these regions, as well as the granule sizes and the presence of other components [1].
The native semicrystalline structure of starch results in a high melting point, falling in the same range of temperatures as its thermal degradation, and poor solubility in water at room temperature [2]. Thus, the processing of starch usually involves the modification of its structure through gelatinization, one of the most important transitions that starch undergoes at high temperatures and in the presence of moisture or water [1]. Gelatinization involves the swelling of starch granules, which induces the loss of molecular ordering and enables the melting of starch crystallites at lower temperatures. In wet processing methods, such as film formation by casting, it enables starch solubilization. After processing, during its service life, gelatinized starch can undergo a spontaneous transition known as retrogradation [3], which involves the recrystallization of amylose and amylopectin, thereby restoring the native starch structure. Retrogradation affects the properties of the material and, thus, shortens its service life.
To make starch suitable for most applications [4], modifications are applied to prepare the so-called de-structured thermoplastic starch (TPS) [5]. The chemical modification of starch is extensively studied to tailor starch properties. Many strategies are employed, e.g., etherification, esterification, crosslinking, acetylation, and oxidation, which involve the replacement of the OH groups with a given functionality without changing the backbone chain [6,7,8,9]. Among physical modifications, the direct blending of starch with other polymers [10,11] and plasticizers has been successfully applied [12,13]. Typical plasticizers are sugars (glucose and sucrose) and polyols (glycerol). Among these, glycerol is by far the most utilized plasticizer for starch-based films, due to its stability, compatibility with hydrophilic starch, and low cost; however, glycerol-plasticized starch suffers from water and moisture sensitivity, and its mechanical resistance is not competitive with respect to common polymers [14]. In recent literature, several examples of blends of plasticized starch with other polymers have been proposed in order to improve both mechanical and wettability properties. Several other additives are described in the literature, including nanoparticles [15] and essential oils (rosemary, thyme, and cinnamon oils), to impart interesting functional properties to starch; terpenes and polyphenols, such as carvacrol, eugenol, cinnamic acid, and their derivatives, are typical examples of molecules giving antimicrobial and antioxidant properties to the biopolymer [12].
The use of alternative functional plasticizers may simplify the process, reducing the number of components in starch-based materials formulations, thus also responding to sustainability issues. To this aim, lipids are interesting, although they can be difficult to blend [16,17]. The formation of starch–lipid complexes reduces both the swelling and solubility of starch, retards its gelatinization and retrogradation, and imparts hydrophobicity to the final products. In order to impart higher mechanical properties and/or higher hydrophobicity and lower water sensitivity to glycerol-plasticized TPS, epoxidized soybean oil (ESO) has been proposed as an additive or as a hydrophobic coating on starch films [18,19,20]. Like many other epoxidized plant oils, ESO has gained attention as a raw product for designing sustainable polymeric materials; it comes from natural sources, can be obtained by green chemistry reactions, is non-toxic, abundant, and is commercially available at a low cost [21]. However, because hydrophobic ESO interacts weakly with hydrophilic starch, the loading level of ESO in starch is usually limited, preventing the successful direct preparation of thermoplastic starch and the associated improvement of mechanical and water resistance properties.
The chemical modification of ESO can produce various versatile and reactive molecules, which are exploited in many different fields, from tires to adhesives, and are suitable for the preparation of polymeric blends containing starch [22,23,24]. Coupling agents such as methylene diphenyl diisocyanate, polyethylenimine, maleic anhydride, fatty acids, citric acid, and tannic acid were used for ESO modification [25]. Among coupling agents, cinnamic acid (CA) is interesting because it is biobased, widely available, and potentially bioactive, offering antimicrobial properties [26], and it has been used to modify ESO via an esterification reaction catalyzed by triphenylphosphine [27].
In this work, we describe a facile method for the preparation of a functional plasticizer/additive for starch and its application in producing starch films via solvent casting. ESO was selected as the building block; we designed its modification by a one-pot sustainable approach based on a simple, catalyst-free ring-opening reaction of the oxirane groups with CA to produce a β-hydroxyester. The synthesis process was optimized by varying the reaction temperature and stoichiometry, and performing a thorough characterization of the reaction products. The optimized product was used to plasticize starch, obtaining hydrophobic films with an amorphous structure resistant to retrogradation.

2. Materials and Methods

2.1. Materials

Epoxidized soybean oil (ESO, trade name Kimasol DB), with an iodine value ≤ 3, was kindly supplied by Amik Plastificanti S.r.l. (Milano, Italy); trans-cinnamic acid (CA), MW = 148.16 g/mol, with a stated purity of 97%, was purchased from Sigma-Aldrich (Saint Louis, MO, USA) and was used as such without further purification. Yuca starch powder (starch) with MW = 1.19 × 10⁶ g/mol, determined by a Ubbelohde capillary viscometer at 25 °C, was supplied by Cimpa S.A.S. (Bogotá, Colombia). Glycerol (≥99.0%), ethanol, CH2Cl2, and NaHCO3 were purchased from Sigma-Aldrich (Saint Louis, MO, USA).

2.2. Synthesis of Soybean Oil Cinnamates

The ring-opening reaction of ESO epoxide units by CA was performed without any catalyst, varying both the stoichiometry and the process conditions as reported in Table 1. In a typical procedure, a selected amount of ESO and 1 g of CA were combined and subjected to sonication for 10 min (using a Branson ultrasonic bath, 40 kHz, 480 W). After that, the mixture was stirred continuously at 100 rpm and heated through different heating cycles, as explained in Table 1. To remove unreacted CA, the crude product was dissolved in 20 mL of CH2Cl2, and 20 mL of an aqueous solution of NaHCO3 was added. After continuous stirring overnight, the solution was transferred to a separatory funnel and 2 phases formed, that is, the upper aqueous phase with unreacted CA and the bottom one with modified ESO (ESO-CA) in CH2Cl2. The funnel was left untouched overnight; the following day, the lower organic layer was removed, and an additional 20 mL of aq. sodium bicarbonate was added. The process was repeated 4 times, the organic phases were collected, and the solvent was removed under vacuum.

2.3. Preparation of Starch-Based Film

Based on the characterization results (Section 3.2) of all samples shown in Table 1, 1ESO+1CA-h3 was selected for the preparation of starch films. As a reference, a film of pure starch and a film of starch plasticized with glycerol were prepared. Labels and compositions are indicated in Table 2. The procedure for film preparation was as follows: starch and glycerol were dissolved in a mixture of water/ethanol 80:20 or 70:30 as the volume ratio; the solution was heated at 90 °C for 30 min and sonicated for 10 min (using a Branson ultrasonic bath at 40 kHz, 480 W); then it was poured into a polystyrene Petri dish and dried in an oven for 48 h at 40 °C. For the preparation of starch-ESO-CA films, ESO-CA was first dissolved in ethanol, then it was added to the starch solution and mixed at room temperature in the desired ratios; the mixture was heated and sonicated, and the films were prepared as described above. All films were kept in a desiccator under a slight vacuum (T = 20 °C, R.H. = 29%, P = 0.1 atm).

2.4. Characterization of ESO Derivatives (Soybean Oil Cinnamates)

After removing the solvent, the FTIR spectra of ESO-CA samples were recorded with a Nicolet iS50 spectrometer (Thermo Fisher Scientific Inc., Waltham, MA, USA) within the range of 4000–400 cm−1. The resolution of the spectrometer was 4 cm−1. Samples were spread on a silicon wafer with a 10 µm wire wound bar and were analyzed in transmission mode.
The epoxide conversion ( α e p o x y ), i.e., the extent of the ring-opening reaction, was estimated according to the following:
α e p o x y = 1 A 860 A 3023 t A 860 A 3023 t 0
where   A 860 A 3023 t 0 is the initial normalized absorbance ratio of the epoxy band area (860–804 cm−1) to the CH stretching band area (3023–2773 cm−1), chosen as the reference band, and A 860 A 3023 t is the normalized absorbance ratio at reaction time t.
In the wavenumber range 1652 to 1852 cm−1, i.e., carbonyl vibrations, deconvoluted curves were determined by a Gauss–Newton iterative curve-fitting procedure, using Origin Pro 8.6 software. Individual contributions were calculated, and the conversion of CA ( α a c i d ), i.e., the percentage of reacted carboxylic groups, was determined according to the following:
α a c i d = 1 A 1684 A 1578 t A 1684 A 1578 t 0
where   A 1684 A 1578 t 0 a n d   A 1684 A 1578 t denote the ratio of the carbonyl band area, related to the carboxylic group of CA at 1684 cm−1, obtained from the FTIR deconvolution of the carbonyl region, and normalized by the aromatic band area at 1578 cm−1 (reference band), in the unreacted mixtures and at reaction time t, respectively.
13C and 1H nuclear magnetic resonance (NMR) spectra were recorded with a Bruker (Billerica, MA, USA) Avance 400WB, equipped with a BBO 5 mm probe. NMR spectra were acquired under the following conditions for 13C: 100.56 MHz, π/2 pulse length 7.2 μs, recycle delay 8 s, and 1024 scans, and a power-gated decoupling sequence; for 1H, we had the following conditions: 400.13 MHz, π/2 pulse length 9.6 μs, recycle delay 12 s, and 16 scans. Samples were dissolved in deuterated chloroform (CDCl3), which was used as an internal reference for the chemical shift. All integrations for quantitative analyses were performed using TopSpin 3.6.4.

2.5. Characterization of Starch-Based Films

X-ray diffraction (XRD) analyses were carried out on a Rigaku (Tokyo, Japan) DMAX III diffractometer equipped with a Cu source (λ = 1.54056 Å) and a graphite monochromator in the following conditions: 2θ range from 2° to 50°, steps of 0.05°, and a 3 s counting time. XRD analyses were performed on films prepared on the same day and stored under the same time and temperature conditions.
Contact angle measurements were performed with bidistilled water, using an FTA 1000C instrument (First Ten Angstroms, Inc., Newark, CA, USA) equipped with a video camera and image analyzer, at room temperature, with the sessile drop technique. At least three measurements were performed on each sample, and the values were averaged.
Diffuse reflectance spectra were acquired in absorption mode with a Shimadzu (Kyoto, Japan) UV2401PC UV–Vis spectrophotometer. BaSO4 was used for background and baseline correction.
Solid-state NMR spectra of the samples were recorded on a Bruker (Billerica, MA, USA) 400WB spectrometer equipped with a double-channel CPMAS probe under the following conditions: for 13C frequency, 100.48 MHz, cross-polarization pulse sequence with contact time 1.5 ms, decoupling length 5.6 μs, recycle delay 3 s, 2 k scans; single pulse with high-power decoupling 30° pulse, 6.8 μs pulse length, recycle delay 20 s, 1 k scans. Relaxation studies were performed to evaluate the proton relaxation time T1ρ(H) using a spin-lock pulse sequence with a variable spin-lock pulse in the 0.5–500 ms range (applying a 20 kHz frequency field for the spin-lock field B1) [28]. Samples were spun at 8 kHz under airflow. Adamantane was used as a secondary reference standard material.

3. Results and Discussion

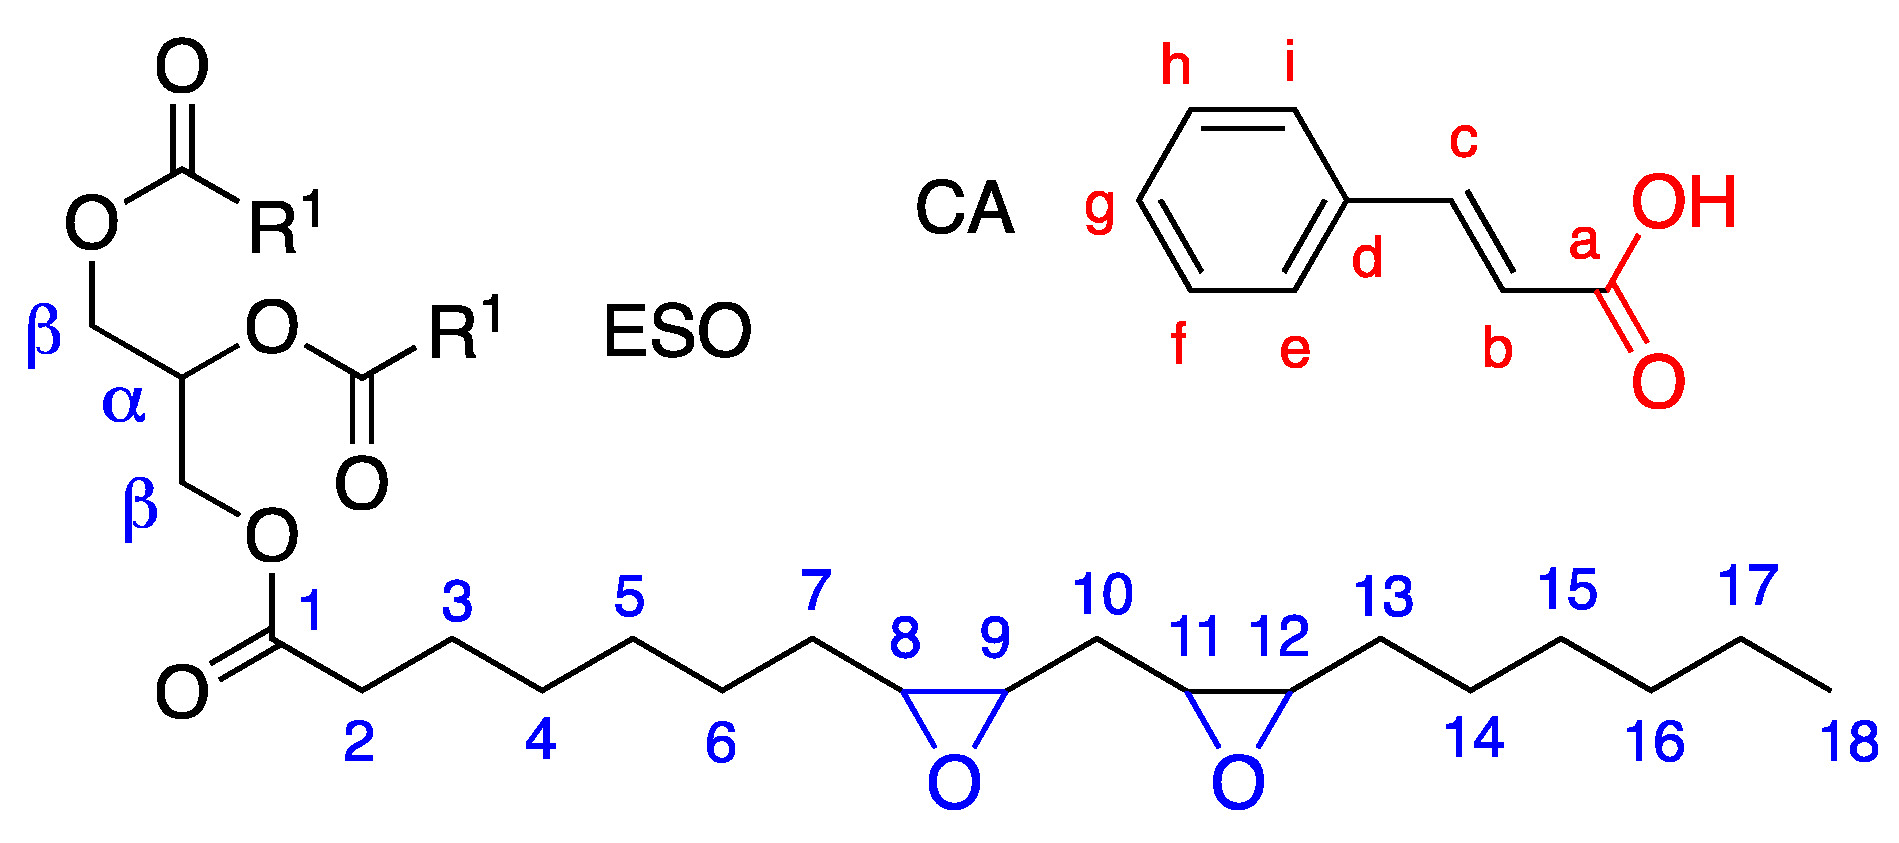
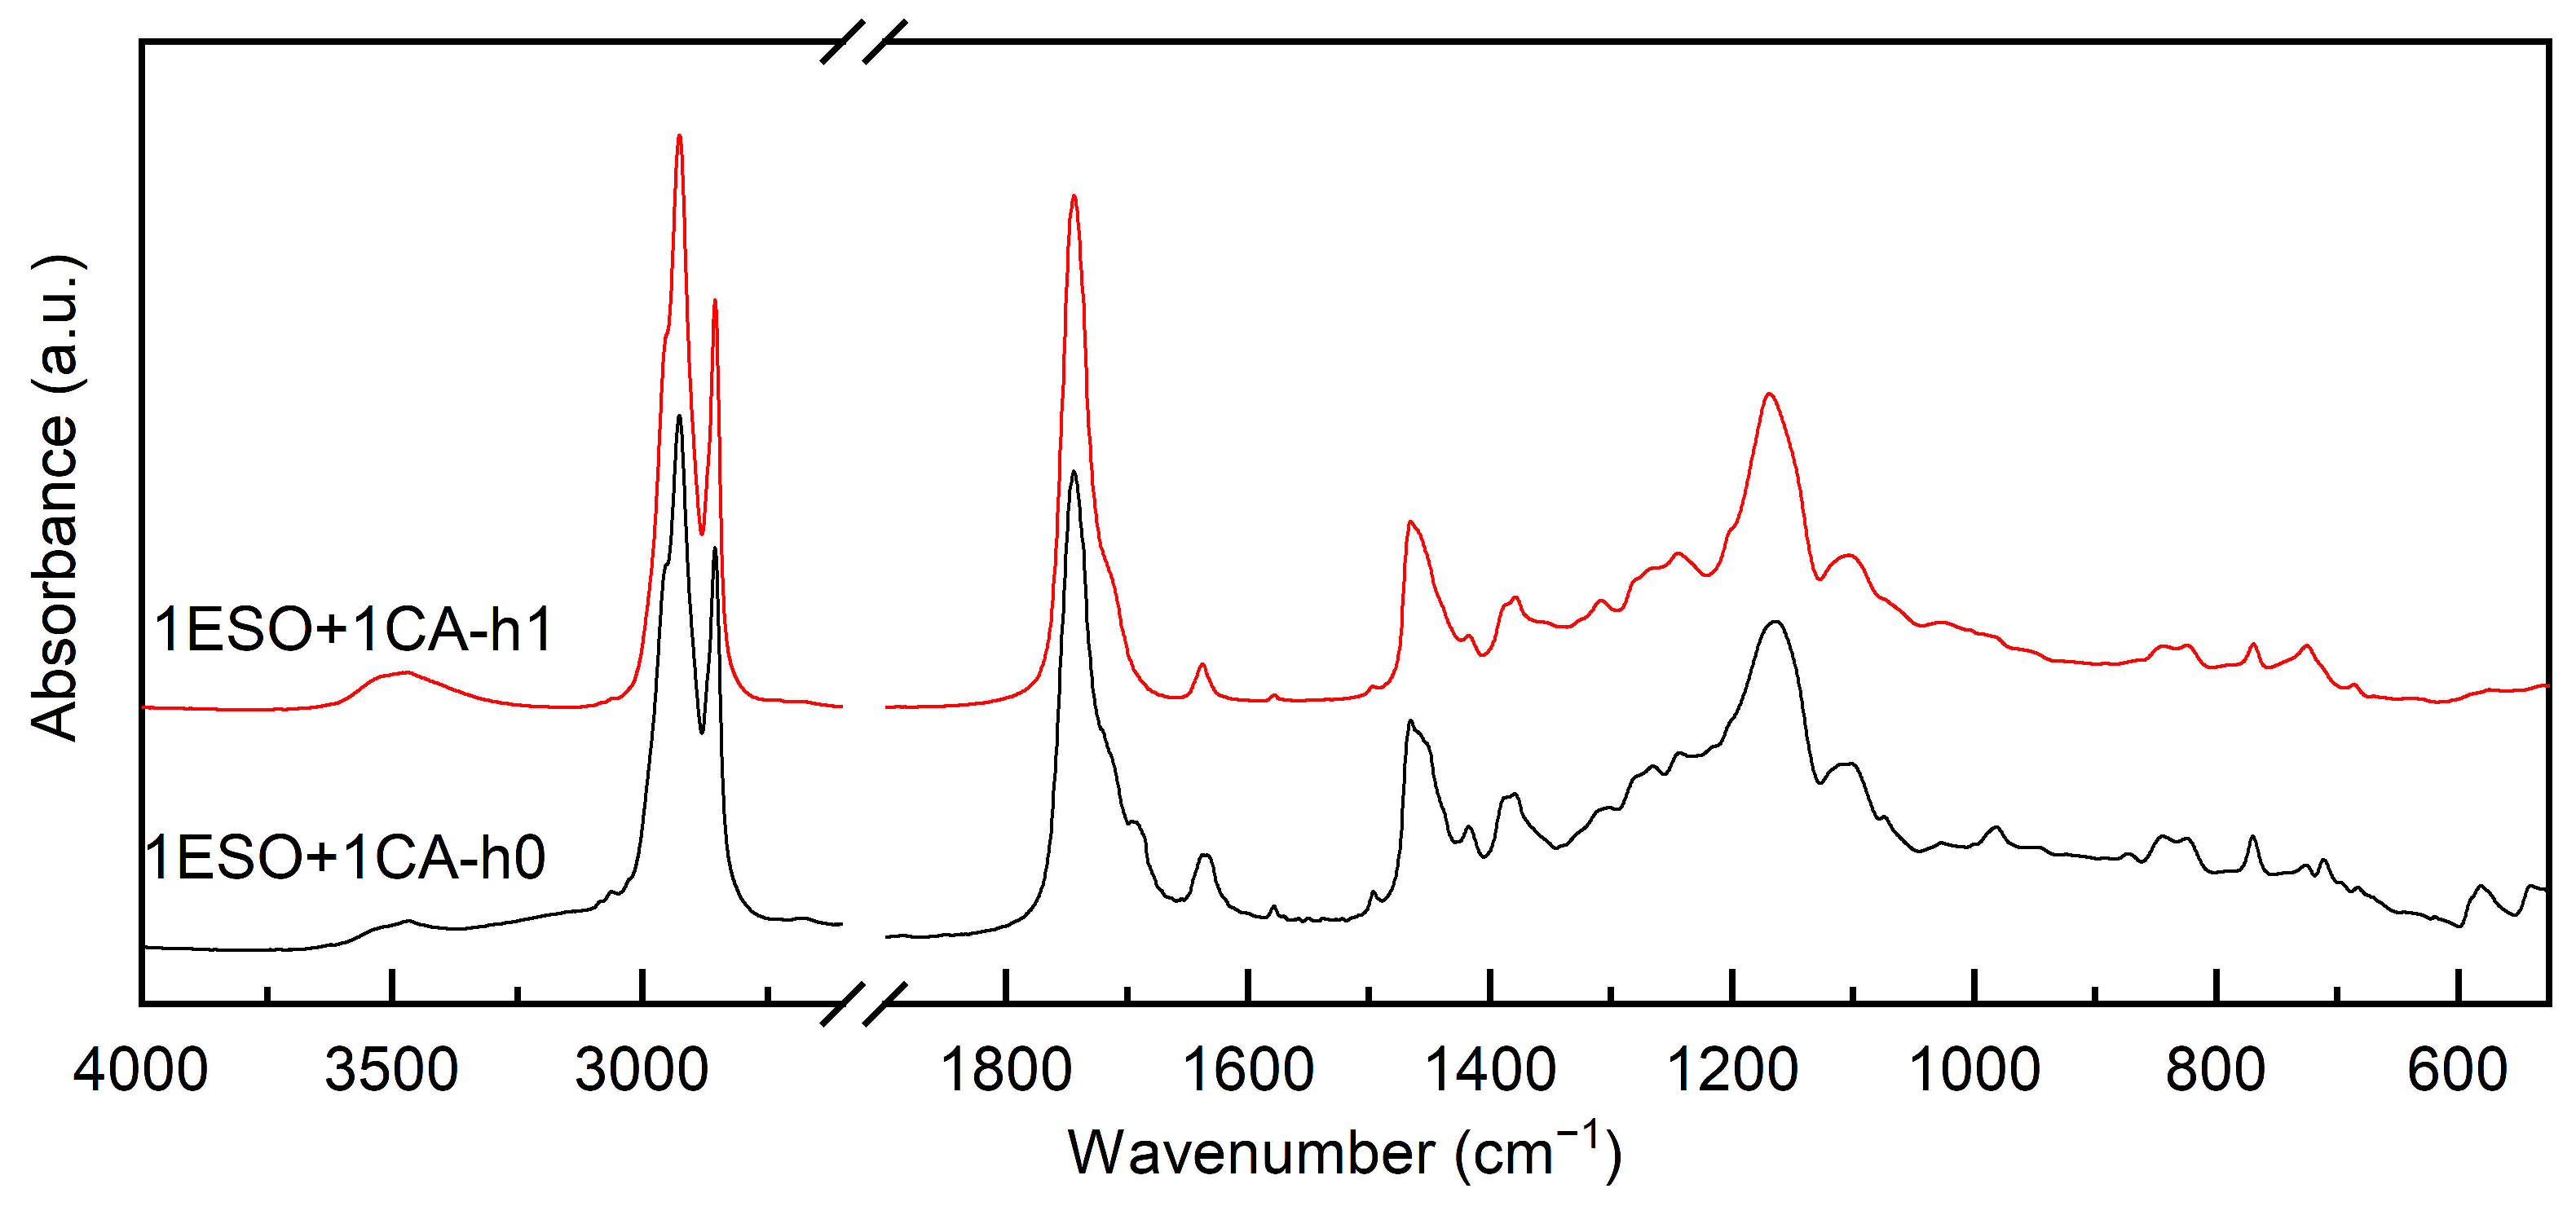
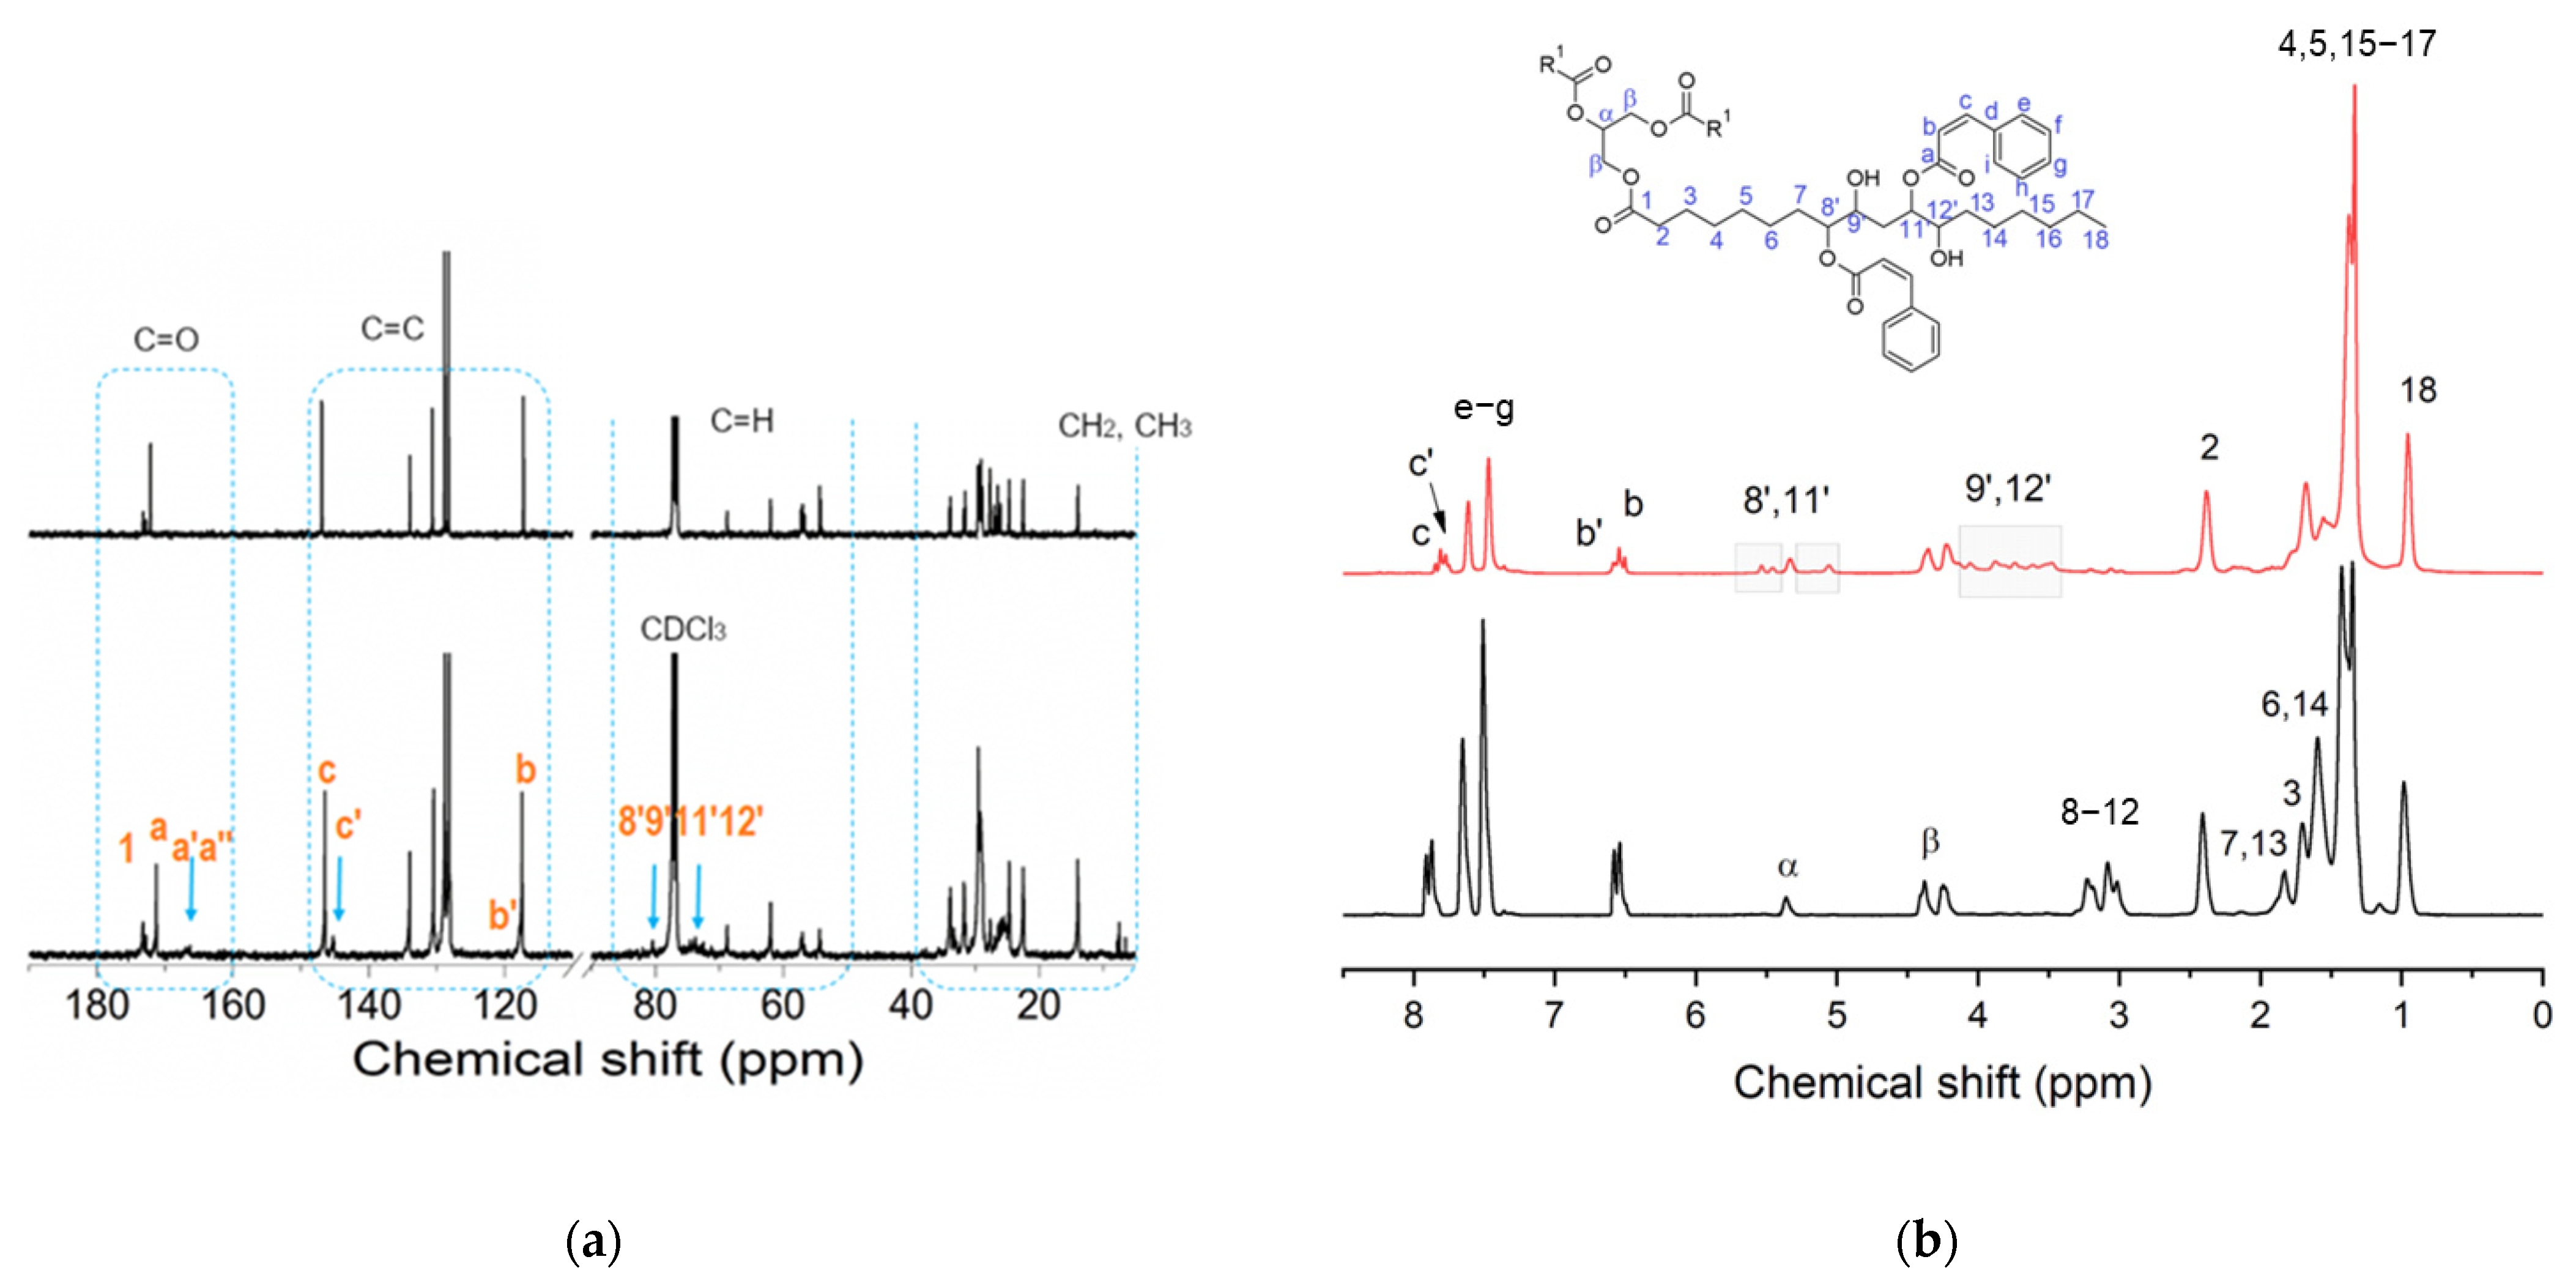
3.1. Modification of the Soybean-Epoxidized Oil by Addition of Cinnamic Acid: Effects of Thermal Cycles and Stoichiometry

Before performing the modification of epoxidized soybean oil (ESO) with cinnamic acid (CA), the products were fully characterized by 13C-NMR, 1H NMR, and FTIR. The 13C spectrum (Figure S1a, Supplementary Materials) shows the main carbon resonances of ESO (carbon labeling is reported in Scheme 1).
Carbonyls were clearly identified at 172 ppm, α and β carbons at 67 ppm and 62 ppm, respectively, epoxide methines in the 60–50 ppm region, all the methylene groups in the 35–20 ppm region, and methyls at 14 ppm. The signals of the double bonds naturally present in soybean oil, which are the reaction sites for the epoxidation, were not detected in the 120–135 ppm region.
From the area of the glycerol α-carbon at 68.8 ppm (Aα) and the area of the peaks related to the epoxy carbons at 54–57 ppm (AepoxyCH, i.e., peaks 8, 9, 11, 12), the number of epoxy groups (Nepoxy) per ESO molecule could be estimated by the following equation:
Nepoxy = AepoxyCH/2Aα
The number of epoxy rings per molecule, Nepoxy,0, in the unmodified ESO, was found to be equal to 4.60.
The initial Nepoxy,0 value (i.e., 4.60 epoxy rings per molecule) was also confirmed by the analysis of the 1H NMR spectrum (Figure S1b, Supplementary Materials). In this case, the Nepoxy could be estimated considering the area of the epoxy protons (AepoxyCH, i.e., peaks 8, 9, 11, 12) and the terminal methyl group (ACH3, i.e., peak 18), by the following equation:
Nepoxy = 9/2 (AepoxyCH/ACH3)
In the 1H NMR spectra (Figure S1b, Supplementary Materials), very small peaks were present (5.6–5.3 ppm), close to the α signal, which were due to olefinic protons, indicating a residual amount of non-epoxidized double bonds.
It is also possible to calculate the degree of epoxidation of ESO, i.e., the molar percentage of epoxidized double bonds, by the following:
E p o x y   m o l % = A e p o x y C H A e p o x y C H + A d o u b l e   b o n d s 100
where Adouble bonds denotes the integrated area of the signals of residual olefinic protons at 5.6–5.3 ppm. Only a residual 2% of olefinic double bonds remained in the material, while 98% were epoxidized.
The FTIR spectrum of ESO is reported in Figure S1c (Supplementary Materials) and shows the expected vibrations, namely, methylene stretching at 2920 and 2850 cm−1, the C=O stretching vibration of the aliphatic triglyceride esters at 1735 cm−1 (C=OESO ester ), the –CH2– and –CH3 bending vibrations at 1457 and 1378 cm−1, respectively, the C–O stretching vibrations of the ester groups at 1159–1265 cm−1, the CH2 rocking vibration at 734 cm−1, and the oxirane C−O twin bands at 823 and 844 cm−1. A broad band due to the OH stretching is also present at 3500 cm−1 and can be attributed to the presence of humidity.
The 1H and 13C NMR spectra of the trans-cinnamic acid are recorded as reference spectra (Figure S2a,b, Supplementary Materials). In the 13C NMR spectrum, the carbonyl at 172.8 and the double-bond carbons at 147 and 117 ppm are visible; in the proton NMR spectrum, the vinyl protons b, c are represented by the two doublets at about 6.6 and 7.9 ppm and the aromatic protons eg by the resonances in the region from 7.5 to 8 ppm.
In the FTIR spectrum (Figure S2c, Supplementary Materials), the main bands detected are the broad OH vibration at 3500 cm−1 related to the carboxylic group and humidity, the CH stretching at around 3000 cm−1, together with the OH stretching vibrations of acid dimers, and the splitting bands assigned to the stretching vibrations of the C=O bond in the carboxylic group at 1684 and 1629 cm−1.
The modification of ESO with cinnamic acid was then attempted and conducted without any catalyst, in different conditions, with FTIR and NMR spectroscopy used to evaluate the effects of stoichiometry and thermal cycles on the ring opening of the epoxide units. The reaction is presented in Scheme 2, where the formation of the β-hydroxyl ester is represented, while the different conditions used are detailed in Table 1.
At first, a 1:1 stoichiometric ratio between the epoxy groups of ESO and CA was chosen, and a mild thermal treatment was applied. The FTIR spectra shown in Figure 1 were recorded after mixing the two reagents overnight at room temperature (sample 1ESO+1CA-h0) and after heating for 1 h at 90 °C (sample 1ESO+1CA-h1).
After 1 h at 90 °C, the epoxy ring bands at 823 cm−1 and 844 cm−1 decreased in intensity, although they were still clearly visible, while the stretching vibrations of OH groups appeared at 3300–3600 cm−1. In agreement with the literature [29], a thermal treatment is required to start the reaction, but heating for 1 h at 90 °C gives a limited epoxide ring opening—the conversion can be estimated as 42% (using Equation (1)).
To evaluate the conversion of the acid, the FTIR band in the carbonyl peak region spanning from 1800 to 1660 cm−1 was examined. The band accounts for the carbonyls of unreacted CA, the new cinnamate ester groups formed by the reaction between CA and the ESO oxirane groups, and the triglyceride ester groups of ESO. Therefore, a profile fitting was attempted to quantify the different contributions, assuming that the band was made up of three components, namely, the C=Otriglyceride ester band at 1740 cm−1, the C=Ocinnamate ester band at approximately 1710 cm−1, and the C=OCA band at 1684 cm−1. The central position of each fitted curve was independently evaluated in accordance with the peak of the experimental FTIR curve, whereas the width and height of the fitting curves were left as free parameters. A typical fitting is reported in Figure 2 for the sample at t = 0 (a) and the sample after 1 h at 90 °C (b) (i.e., samples 1ESO+1CA-h0 and 1ESO+1CA-h1, respectively). The deconvoluted spectra fit the experimental measurements reasonably well, under the assumption that each contribution curve had a Gaussian representation; in fact, the determination coefficient R2 was always close to unity.
The conversion of the carboxylic acid was calculated using Equation (2) from the results of profile fitting; after 1 h of reaction at 90 °C, it was found to be 19%, i.e., half the epoxide conversion, meaning that there was a faster consumption of the epoxy groups of ESO with respect to the carboxylic groups of CA.
In a first attempt to enable a higher epoxy ring opening, the heating step at 90 °C was maintained for 6 h (sample 1ESO+1CA-h2). Relevant information on the 1ESO+1CA-h2 sample was gathered through NMR. In Figure 3a,b, 13C and 1H NMR spectra of 1ESO+1CA-h2 are compared with those recorded at t = 0 for sample 1ESO+1CA-h0. In the 1ESO+1CA-h0 spectrum (Figure 3a, top), ESO and CA resonance peaks (see Figures S1 and S2, Supplementary Materials, and their descriptions reported above) were simply overlapped, confirming that in these conditions the two components did not react. Instead, the 13C NMR spectrum of 1ESO+1CA-h2 (Figure 3a, bottom) showed relevant changes. In the region of the methine and β signals, the peaks due to epoxy ring carbons (8, 9, 11, 12) decreased in intensity, indicating the occurrence of the epoxy ring opening reaction, with an estimated conversion of 73%. New peaks appeared in the 85–70 ppm region, which could be assigned to the groups created by the reaction of ESO epoxy rings with CA (see also Figure S3a, Supplementary Materials), namely methines substituted with both cinnamic and hydroxyl groups. This confirms that the functionalization reaction takes place via esterification with the formation of the vicinal hydroxy ester, as shown in Scheme 2. In the CH2 region (40–20 ppm), new peaks were present at about 36, 33, 31 ppm, which could be attributed to the methylene carbons close to the opened epoxy rings. The signal at about 29 ppm changed in shape, and peaks in the 26–27 ppm region shifted upfield, indicating the spatial rearrangement of the fatty acid chains of ESO because of the reaction. It is worth noting that the peaks related to cinnamic acid were still clearly detectable in the region of 115–180 ppm. In the carbonyl region, three signals were attributable to the C=O of the cinnamic units, namely, the single intense peak at about 171 ppm (a) that presented an upfield shift of 1.2 ppm with respect to free acid (see Figure S1, Supplementary Materials), and two new weak signals (arrow mark) at 166.9 and 166.3 ppm (a′, a″), which could be assigned to the ESO cinnamate. The ester formation was estimated from the single intense peak at about 171 ppm; it was equal to 24%, i.e., much lower than the calculated epoxide conversion (73%). The same behavior of the carbonyl group, namely the appearance of a new doublet signal and the presence of a shifted single one, was shown by both the vinyl carbons (c, b) and the aromatic carbons (di), although to a lesser extent. The presence of different linkage sites in the ESO backbone, along with the formation of a mixture of regio- and stereoisomers, may explain the appearance of the doublet signals (namely 8′ and 11′ or 9′ and 12′).
The comparison of 1H NMR spectra (Figure 3b) pointed out the presence of new b′ and c′ signals, partially overlapping with the b and c resonances. In agreement with the results of 13C NMR, they indicated that the esterification of CA with the ESO backbone took place, and that unreacted CA units were still present. Other new resonances appeared near the glycerol α carbon (5.6–5.4 and 5.2–4.9 ppm, labeled as 8′, 11′) and next to the β carbons (from 4.1 to 3.4 ppm, labeled as 9′, 12′). They are due to protons of the methine groups bonded to cinnamic ester units and hydroxyl groups, respectively, thus corroborating the formation of the β-hydroxy ester (Scheme 2).
The epoxide ring opening and cinnamate formation (73% and 24%, respectively) indicated better reactivity of the system compared to milder heating, but a large amount of unreacted acid remained. Similar results were observed in the FTIR analysis, suggesting the need for careful tuning of the heating cycle.
Therefore, different short steps at increasing temperatures were tested to tailor the ESO functionalization reaction, while keeping a 1:1 ratio between the epoxy groups of ESO and cinnamic acid. Additional samples, as follows, were prepared: ESO+1CA-h3 with a heating cycle made of two steps, namely the first one of 1 h at 90 °C, followed by a second one of 2 h at 180 °C; 1ESO+1CA-h4 with a heating cycle made of three steps, i.e., 1 h at 90 °C + 3 h at 120 °C + 2 h at 180 °C. The FTIR spectra in Figure 4a and the NMR spectra in Figure 4b,c, compare the different samples.
The comparison of the FTIR spectra highlighted that the CA bands were rather weak in samples 1ESO+1CA-h0 and 1ESO+1CA-h2, suggesting that the low-temperature single-step process probably did not enable a complete homogenization of the mixture. In fact, both the low solubility of the acid in the epoxidized oil and the high melting point of the acid may result in a phase separation, which was, however, difficult to perceive given the specimens’ appearance.
FTIR spectra (Figure 4a) confirmed that the reaction between ESO and CA occurred in all thermally treated samples, as evidenced by the decrease in both the ESO oxirane band and the CA carbonyl band (estimated through deconvolution). In the NMR spectra, signals of cinnamate esters in the 90–70 ppm region, and changes in CH2 signals in the range 40–20 ppm can be observed. The presence of cinnamic acid doublets (a′, a′′) is reported above. The effectiveness of the reaction, in terms of the epoxy ring opening and cinnamate formation, together with the residual epoxy group amount, is reported in Table 3.
The results show that by heating at 90 °C for a time up to 6 h (1ESO+1CA-h2), a relevant amount of unreacted epoxy rings turned out to be unreacted, suggesting that ring-opening reaction with CA was not favored. Instead, performing steps at higher temperature after the first step at 90 °C for 1 h, namely, heating further for 2 h at 180 °C (sample 1ESO+1CA-h3) or for 3 h at 120 °C and 2 h at 180 °C (1ESO+1CA-h4), assured the complete disappearance of the oxirane groups, as estimated by NMR. Accordingly, the FTIR data provide an epoxy group conversion of 99% for both 1ESO+1CA-h3 and 1ESO+1CA-h4.
Considering the ester formation, yields of 42% and 27% were estimated by NMR for samples 1ESO+1CA-h3 and 1ESO+1CA-h4, respectively. These results indicate that a higher temperature is required to enhance the ester formation. However, the introduction of an intermediate step at 120 °C did not further promote the esterification reaction depicted in Scheme 2. These findings were confirmed by FTIR analyses, which estimated the CA conversion (by deconvoluting the carbonyl band) to be 49% for 1ESO+1CA-h3, with an epoxide conversion of 99%.
Side reactions of the oxirane ring may explain the observed results related to epoxide conversion and cinnamate ester formation. The literature findings [22,29,30,31,32,33] are summarized in Scheme 3. In the uncatalyzed reaction of epoxy groups with an acid, the esterification of the β-hydroxy ester to a completely esterified product can take place (reaction path c), while it is usually suppressed under base-catalyzed conditions. Water possibly formed in reaction c can also lead to the hydrolysis of the epoxy group, as in reaction d. An additional reaction involves the hydroxyl groups obtained in reaction a, with other epoxy groups, leading to the ether formation [34]. As shown in reaction b, this happens in the presence of an excess of epoxy groups and is promoted by an acid catalyst.
Another possible side reaction is the oligomerization of ESO under acidic conditions: in fact, low molecular weight products produced by the ESO ring-opening have been reported [27,34]. As ESO contains multiple oxiranes, crosslinked homopolymers can be formed.
Considering that etherification (reaction b) and oligomerization (including crosslinking, reaction e) consume oxirane groups without involving cinnamic acid, the occurrence of such side reactions can be evaluated through both FTIR and NMR spectra. In the FTIR spectra of the ESO-CA samples, no evidence of the presence of ether groups was found, and oligomerization products could not be detected. The presence of several peaks in the 85–70 ppm region of the 13C spectra and the related methine peaks in the 3.5–4 ppm and 5–5.5 ppm ranges of the 1H spectra could be due to the presence of either different regio- and stereoisomers or homopolymerized ESO (Figures S3a,b, Supplementary Materials). Nevertheless, in our conditions, the formation of crosslinked polyether-containing homopolymers can be excluded as the obtained products are soluble.
As mentioned before, the second key parameter for controlling the reaction products is the molar ratio between the two reagents. Nonstoichiometric ESO:CA ratios, namely 2:1 and 3:1, were evaluated, and the two-step heating cycle—1 h at 90 °C followed by 2 h at 180 °C—was applied, as it ensured the best oxirane conversion. As previously reported, epoxide and cinnamic acid conversions were estimated from the FTIR spectra (Figure 5a) by analyzing the oxirane band and deconvoluting the carbonyl band. The calculated conversion values (Figure 6) show that the epoxide conversion (black squares) remains quantitative when the CA content is reduced to half; it drops further with decreasing CA content. At the same time, the reacted CA (red dots) is nearly unchanged and seems independent of the initial stoichiometry.
Examining the carbonyl signals and the methine regions in the related NMR spectra (Figure 5b,c), the epoxy conversion and the ester formation were found in agreement with the FTIR results; the calculated values are summarized in Table 4.
As a further check, a reaction with a large excess of the carboxylic acid (3:1 equivalent with respect to the oxirane unit) was performed (sample 1ESO+3CA-h3). As before, the epoxy conversion was quantitative, but the ester formation was still very low (Table 4). This suggested that, in addition to reacting with the epoxide to form cinnamates, CA also acted as an acid catalyst for the epoxy ring opening.
Based on the data presented in Table 3 and Table 4, it can be concluded that under the adopted uncatalyzed conditions, the most efficient process for modifying ESO by esterification of the epoxy groups, while maximizing the ester formation, requires a 1:1 stoichiometry and a two-step thermal cycle at 90 °C and 180 °C for 1 and 2 h, respectively.

3.2. ESO Cinnamates as Additives for Starch-Based Film Production

As reported in Section 3.1, sample 1ESO+1CA-h3 was selected as a starch additive for film production. Before use, the sample was purified to remove the unreacted CA. The purified product was characterized by 13C NMR, 1H NMR, and FTIR spectroscopy (Figure 7), confirming the structure of the hydroxyester and the absence of unreacted acid.
The 13C NMR spectrum of the 1ESO+1CA-h3 product after the purification procedure indicated that its functionalization degree was 1.14, i.e., 1.14 cinnamic ester groups per ESO molecule.
The effectiveness of the synthesized 1ESO+1CA-h3 as a plasticizer for starch was then evaluated. The characterization of the starch used in this work was previously reported in [8]. Starch films containing either glycerol or 1ESO+1CA-h3 were prepared by the solvent casting technique (see details in Section 3.1). When 1ESO+1CA-h3 was employed, it was dissolved in ethanol and then mixed with the starch solution. After the gelatinization, solutions were cast into Petri dishes and dried to constant weight, yielding films with a thickness of about 200 μm.
The starch film modified with 40% w/w of 1ESO+1CA-h3 (Y40ESOCA film) was visually compared (Figure 8) with the one plasticized with 40% w/w glycerol (YG film). Both films were transparent according to their diffuse reflectance spectra (Figure S4, Supplementary Materials). Their surfaces were smooth, with no visual defects such as cracks; they both appeared homogeneous, indicating that the incorporation of 1ESO+1CA-h3 into the starch matrix did not give phase separation. However, the film with the new additive exhibited lower flexibility than the films plasticized with glycerol; this was tested simply by rolling the film around rods of different sections.
Differential scanning calorimetry (Figure S5) experiments highlighted that 1ESO+1CA-h3 effectively acted as a plasticizer and also induced lower water uptake in the starch-based films.
Another interesting feature of the Y40ESOCA film was evidenced by measuring the static contact angle with water; the average value was found slightly higher than 90° (i.e., 92°), which is the lower threshold for hydrophobicity. Thus, the 1ESO+1CA-h3 additive imparted water repellency, while films from pristine starch (Y) and from starch containing glycerol (YG) were hydrophilic, with a contact angle around 54°. Accordingly, film YG was readily damaged by water droplets during wettability measurements.
The films were characterized by X-ray diffraction [35]. In Figure 9a, the XRD pattern of Y20ESO-CA film is compared with those of the films made of pure starch (film Y) and containing starch and glycerol (film YG). Pure starch film Y appeared partially crystalline, showing crystalline reflections compatible with the presence of B-type (peaks at 2θ angles: 5.65°, 16.7°, and 21.75°), V-type (2θ: 19°), and A-type (2θ: 11.35° and 15°) starch polymorphs. The simultaneous presence of these reflections is often referred to as a C-type crystalline structure. Therefore, after the gelatinization process used to solubilize starch in an aqueous solvent to form films by casting, the starch molecules retrograded, i.e., they reorganized into ordered structures. In the YG sample, the main reflections were due to B-type crystals (2θ angles 5.25° and 17.1°), while the peak at 19.6° was attributable to V-type crystals. These findings highlight that gelatinized starch returned to a semicrystalline state in the presence of glycerol. As previously reported [15], the amorphous halo of YG had a different position with respect to Y; this can be explained by the presence of strong starch–glycerol interactions. Interestingly, the XRD pattern of the Y20ESO-CA sample exhibited the characteristic amorphous halo of starch, centered around 20°, with no reflections indicative of crystalline regions. This is a significant finding, as it suggests that the novel synthesized additive inhibits retrogradation by preventing starch chains from organizing into ordered structures, thereby suppressing starch crystallization. Similar results were observed for the Y40ESO-CA sample, which contained the highest amount of the additive 1ESO+1CA-h3.
Figure 9b shows the 13C CPMAS NMR spectra of the starch films. The shape of the C1 resonance is well recognized as an extremely sensitive probe of the starch crystallinity [15,36]. In both Y and YG films, it revealed crystalline features, in agreement with XRD results. On the contrary, the sample Y20ESO-CA showed the typical C1 resonance line shape of an amorphous starch [15], as already pointed out by XRD analysis. Moreover, some ESO resonances were visible; signals in the range of 40–20 ppm are, in fact, related to the CH2 backbone of ESO, while the peak at 14.6 ppm can be assigned to its CH3 terminal groups. Unfortunately, resonances of α and β carbons of the ESO additive overlapped with the starch C2, C3, C5, and C6 signals. Also, the resonances of the bonds in the methine region were not detectable due to the overlapping of C4 and C2, C3, and C5 peaks of starch. It was possible to demonstrate that sample Y40ESO-CA had twice the amount of 1ESO-1CA-h3 with respect to Y20ESO-CA), comparing the integrated peak areas of starch (107–55 ppm range) and ESO (37–12 ppm) resonances. Resonances of cinnamate groups were not detectable due to their limited quantities.
Additionally, NMR relaxation experiments were carried out to assess the effect of starch plasticization with the addition of 1ESO-1CA-h3 through the evaluation of the proton T relaxation time (T1ρ(H)). This parameter is indicative of the rate of spin diffusion, which is influenced by the strength of dipole–dipole interactions. Consequently, the spin diffusion rate among 1H spins offers insights into domain sizes in polymer blends and sheds light on the molecular motion at the spin-locking frequency across different phases of a homopolymer. Variations in domain size affect relaxation behavior, with larger domains (packed structures with strong dipolar interactions) leading to longer relaxation times. In addition, the increased mobility of chain protons can enhance relaxation, resulting in shorter proton T times. These factors can produce opposing effects [37,38,39]. In summary, T1ρ(H) relaxation times are particularly sensitive to variations in the degree of crystallinity, domain size, molecular conformation, and moisture content. All sample data could be fitted with a single exponential decay curve, meaning that the materials were homogenous at the nm scale. As shown in Table 5, T1ρ(H) for pure starch (film Y) had a value of 4.6; the addition of glycerol reduced the T1ρ(H) of the film by half, as expected, due to the plasticizing effect of the additive, which increased starch chain mobility. In contrast, the addition of 1ESO+1CA-h3 did not produce such a pronounced effect. Nevertheless, T1ρ(H) values decreased with increasing amounts of the modified ESO.

4. Conclusions

Innovative starch films were prepared using a derivative of soybean oil as a functional plasticizer that can replace glycerol. The proposed additive (labeled 1ESO+1CA-h3) was obtained by reacting epoxidized soybean oil with cinnamic acid without using any catalyst and optimizing both the process and the achieved substitution degree.
The chemical modification of ESO allowed its incorporation of up to 40% by weight into starch films; this enabled the plasticization of starch and the obtainment of self-standing, flexible films, without the addition of other plasticizers or reinforcing additives. The starch films plasticized with 1ESO+1CA-h3 were homogeneous and presented similar transparency to the reference containing glycerol. Remarkably, the new plasticizer was more effective than glycerol in preventing starch retrogradation; as shown by XRD, the starch films containing the novel additive retained an amorphous structure, while the starch films plasticized with glycerol exhibited partial recrystallization. The NMR relaxation time (T1ρ(H)) of the innovative films was smaller than that of unplasticized starch, while the mobility imparted was limited compared to the use of glycerol. Interestingly, the measured static contact angle was 92°, denoting hydrophobicity, while pristine starch and starch containing glycerol were hydrophilic and readily damaged by water. The obtained properties, combined with simple processing, make this material interesting for use in packaging, disposable devices, and agricultural mulch films.

Supplementary Materials

The following supporting information can be downloaded at https://www.mdpi.com/article/10.3390/polysaccharides6020040/s1, Figure S1: (a) 13C NMR (b) 1H NMR in CDCl3 and (c) FTIR spectra of the ESO sample; Figure S2: 13C NMR and 1H NMR spectra (top) and FTIR spectrum of trans-cinnamic acid (bottom); Figure S3a: DEPT spectra of 13C NMR of samples. Positive peaks are CH2, negative peaks are CH or CH3 groups, and Cq is not detected. The area in the box represents new CH peaks; Figure S3b: 2D HSQC NMR—overlapped spectra of 1ESO+1CA-h0 (red cross-peaks) and 1ESO+1CA-h3 (blue cross-peaks). In the CH2 region, it is possible to observe the new blue cross-peaks, indicating chain rearrangement as a consequence of the reaction. The region of new bonds in the middle includes CA linkages and homopolymerization links (peaks 8′, 12′ at 5–6 ppm) as well as CH-OH at about 4 ppm (peaks 9′, 12′). In the CA region, the new peaks b′ and c′ of the linked CA are clearly visible; Figure S4: (a) UV-VIS absorption spectrum of 1ESO+1CA-h3 and diffuse reflectance spectra of (b) cinnamic acid and (c) starch-based films; Figure S5: DSC thermograms of Y, YG, Y20ESO-CA: (a) first heating cycle and (b) second cooling cycle.

Author Contributions

Conceptualization, S.D.V., A.V., L.C., M.D., R.B., and S.D.; data curation, E.C., S.F.O., and S.P.; investigation, L.H.E., S.D.V., D.B., E.C., S.F.O., S.P., and A.V.; validation: E.C. and S.D.V.; formal analysis, L.H.E., S.D.V., D.B., E.C., S.F.O., and S.P.; methodology, S.D.V., A.V., E.C., R.B., and S.D.; writing—original draft preparation, L.H.E., D.B. and, S.D.V.; writing—review and editing, S.D.V., E.C., R.B., M.D., A.V., S.D., and L.C.; supervision, M.D., R.B., S.D., L.C., S.D.V., and A.V.; resources, M.D., L.C., R.B., and S.D.; funding acquisition, M.D., R.B., and S.D. All authors have read and agreed to the published version of the manuscript.

Funding

This research was funded by the Cariplo Foundation in the frame of the BIO-STAR-PACK project (2020-0993).

Institutional Review Board Statement

Not applicable.

Data Availability Statement

The datasets presented in this article are not readily available because the data are part of an ongoing study. Requests to access the datasets should be directed to the corresponding authors: Dr. Sara Dalle Vacche (sara.dallevacche@polito.it) and Prof. Sandra Dirè (sandra.dire@unitn.it).

Conflicts of Interest

The authors declare no conflicts of interest. The funders had no role in the design of the study; in the collection, analyses, or interpretation of data; in the writing of the manuscript; or in the decision to publish the results.

Abbreviations

The following abbreviations are used in this manuscript:
ESOepoxidized soybean oil
CAcinnamic acid
MWmolar mass
NMRnuclear magnetic resonance
FTIRFourier transform infrared
XRDX-ray diffraction

References

  1. Ratnayake, W.S.; Jackson, D.S. Chapter 5 Starch Gelatinization. In Advances in Food and Nutrition Research; Academic Press: Cambridge, MA, USA, 2008; Volume 55, pp. 221–268. [Google Scholar]
  2. Xie, F.; Liu, P.; Yu, L. Processing of Plasticized Starch-Based Materials. In Starch Polymers; Elsevier: Amsterdam, The Netherlands, 2014; pp. 257–289. ISBN 978-0-444-53730-0. [Google Scholar]
  3. Li, C. Unraveling the Complexities of Starch Retrogradation: Insights from Kinetics, Molecular Interactions, and Influences of Food Ingredients. Food Rev. Int. 2024, 40, 3159–3182. [Google Scholar] [CrossRef]
  4. Adewale, P.; Yancheshmeh, M.S.; Lam, E. Starch Modification for Non-Food, Industrial Applications: Market Intelligence and Critical Review. Carbohydr. Polym. 2022, 291, 119590. [Google Scholar] [CrossRef] [PubMed]
  5. Carvalho, A.J.F. Chapter 15—Starch: Major Sources, Properties and Applications as Thermoplastic Materials. In Monomers, Polymers and Composites from Renewable Resources; Belgacem, M.N., Gandini, A., Eds.; Elsevier: Amsterdam, The Netherlands, 2008; pp. 321–342. ISBN 978-0-08-045316-3. [Google Scholar]
  6. Haq, F.; Yu, H.; Wang, L.; Teng, L.; Haroon, M.; Khan, R.U.; Mehmood, S.; Bilal-Ul-Amin; Ullah, R.S.; Khan, A.; et al. Advances in Chemical Modifications of Starches and Their Applications. Carbohydr. Res. 2019, 476, 12–35. [Google Scholar] [CrossRef]
  7. Otache, M.A.; Duru, R.U.; Achugasim, O.; Abayeh, O.J. Advances in the Modification of Starch via Esterification for Enhanced Properties. J. Polym. Environ. 2021, 29, 1365–1379. [Google Scholar] [CrossRef]
  8. Petroni, S.; Fernanda Orsini, S.; Bugnotti, D.; Callone, E.; Dirè, S.; Zoia, L.; Bongiovanni, R.; Vacche, S.D.; Vitale, A.; Raimondo, L.; et al. Photocrosslinkable Starch Cinnamyl Ethers as Bioinspired Bio-Based Polymers. J. Mater. Chem. B 2025, 13, 943–954. [Google Scholar] [CrossRef] [PubMed]
  9. Liu, H.; Guo, L.; Tao, S.; Huang, Z.; Qi, H. Freely Moldable Modified Starch as a Sustainable and Recyclable Plastic. Biomacromolecules 2021, 22, 2676–2683. [Google Scholar] [CrossRef]
  10. Nguyen, M.T.P.; Escribà-Gelonch, M.; Hessel, V.; Coad, B.R. A Review of the Current and Future Prospects for Producing Bioplastic Films Made from Starch and Chitosan. ACS Sustain. Chem. Eng. 2024, 12, 1750–1768. [Google Scholar] [CrossRef]
  11. Koh, J.J.; Zhang, X.; He, C. Fully Biodegradable Poly(Lactic Acid)/Starch Blends: A Review of Toughening Strategies. Int. J. Biol. Macromol. 2018, 109, 99–113. [Google Scholar] [CrossRef]
  12. Muñoz-Gimena, P.F.; Oliver-Cuenca, V.; Peponi, L.; López, D. A Review on Reinforcements and Additives in Starch-Based Composites for Food Packaging. Polymers 2023, 15, 2972. [Google Scholar] [CrossRef]
  13. Singh, G.P.; Bangar, S.P.; Yang, T.; Trif, M.; Kumar, V.; Kumar, D. Effect on the Properties of Edible Starch-Based Films by the Incorporation of Additives: A Review. Polymers 2022, 14, 1987. [Google Scholar] [CrossRef]
  14. Wang, S.; Zhang, P.; Li, Y.; Li, J.; Li, X.; Yang, J.; Ji, M.; Li, F.; Zhang, C. Recent Advances and Future Challenges of the Starch-Based Bio-Composites for Engineering Applications. Carbohydr. Polym. 2023, 307, 120627. [Google Scholar] [CrossRef]
  15. Bugnotti, D.; Dalle Vacche, S.; Esposito, L.H.; Callone, E.; Orsini, S.F.; Ceccato, R.; D’Arienzo, M.; Bongiovanni, R.; Dirè, S.; Vitale, A. Structure of Starch–Sepiolite Bio-Nanocomposites: Effect of Processing and Matrix–Filler Interactions. Polymers 2023, 15, 1207. [Google Scholar] [CrossRef] [PubMed]
  16. Lin, Z.; Cheng, H.; He, K.; McClements, D.J.; Jin, Z.; Xu, Z.; Meng, M.; Peng, X.; Chen, L. Recent Progress in the Hydrophobic Modification of Starch-Based Films. Food Hydrocoll. 2024, 151, 109860. [Google Scholar] [CrossRef]
  17. Terrié, C.; Mahieu, A.; Lequart, V.; Martin, P.; Leblanc, N.; Joly, N. Towards the Hydrophobization of Thermoplastic Starch Using Fatty Acid Starch Ester as Additive. Molecules 2022, 27, 6739. [Google Scholar] [CrossRef] [PubMed]
  18. Belhassen, R.; Vilaseca, F.; Mutjé, P.; Boufi, S. Thermoplasticized Starch Modified by Reactive Blending with Epoxidized Soybean Oil. Ind. Crops Prod. 2014, 53, 261–267. [Google Scholar] [CrossRef]
  19. Meng, L.; Li, S.; Yang, W.; Simons, R.; Yu, L.; Liu, H.; Chen, L. Improvement of Interfacial Interaction between Hydrophilic Starch Film and Hydrophobic Biodegradable Coating. ACS Sustain. Chem. Eng. 2019, 7, 9506–9514. [Google Scholar] [CrossRef]
  20. Li, C.; Ju, B.; Zhang, S. Fully Bio-Based Hydroxy Ester Vitrimer Synthesized by Crosslinking Epoxidized Soybean Oil with Doubly Esterified Starch. Carbohydr. Polym. 2023, 302, 120442. [Google Scholar] [CrossRef]
  21. Qian, Z.; Liu, S.; Du, G.; Wang, S.; Shen, Y.; Zhou, X.; Jiang, S.; Niu, H.; Duan, Z.; Li, T. Versatile Epoxidized Soybean Oil-Based Resin with Excellent Adhesion and Film-Forming Property. ACS Sustain. Chem. Eng. 2023, 11, 5315–5324. [Google Scholar] [CrossRef]
  22. Moser, B.R.; Cermak, S.C.; Doll, K.M.; Kenar, J.A.; Sharma, B.K. A Review of Fatty Epoxide Ring Opening Reactions: Chemistry, Recent Advances, and Applications. J. Am. Oil Chem. Soc. 2022, 99, 801–842. [Google Scholar] [CrossRef]
  23. Yang, J.; Dong, X.; Wang, J.; Ching, Y.C.; Liu, J.; Li, C.; Baikeli, Y.; Li, Z.; Mohammed Al-Hada, N.; Xu, S. Synthesis and Properties of Bioplastics from Corn Starch and Citric Acid-Epoxidized Soybean Oil Oligomers. J. Mater. Res. Technol. 2022, 20, 373–380. [Google Scholar] [CrossRef]
  24. Yang, J.; Xu, S.; Ching, Y.C.; Wang, R.; Al-Hada, N.M.; Li, C.; Lv, D.; Zhang, Z. Facile Synthesis of Cassava Starch-Based Bioplastics Modified by Citric Acid-Epoxidized Soybean Oil Oligomers. J. Appl. Polym. Sci. 2023, 140, e54334. [Google Scholar] [CrossRef]
  25. Qi, M.; Xu, Y.-J.; Rao, W.-H.; Luo, X.; Chen, L.; Wang, Y.-Z. Epoxidized Soybean Oil Cured with Tannic Acid for Fully Bio-Based Epoxy Resin. RSC Adv. 2018, 8, 26948–26958. [Google Scholar] [CrossRef]
  26. Annuur, R.M.; Triana, D.; Ernawati, T.; Murai, Y.; Aswad, M.; Hashimoto, M.; Tachrim, Z.P. A Review of Cinnamic Acid’s Skeleton Modification: Features for Antibacterial-Agent-Guided Derivatives. Molecules 2024, 29, 3929. [Google Scholar] [CrossRef] [PubMed]
  27. Ding, L.; Chen, Y.F.; Zhong, Z.; Lu, F.; Du, Y.; Liu, L.; Huang, Y. Preparation of the Flexible Soybean Oil-Based Material via [2 + 2] Cycloaddition Photo-Polymerization. J. Appl. Polym. Sci. 2021, 138, 49925. [Google Scholar] [CrossRef]
  28. D’Arienzo, M.; Diré, S.; Masneri, V.; Rovera, D.; Di Credico, B.; Callone, E.; Mascotto, S.; Pegoretti, A.; Ziarelli, F.; Scotti, R. Tailoring the Dielectric and Mechanical Properties of Polybutadiene Nanocomposites by Using Designed Ladder-like Polysilsesquioxanes. ACS Appl. Nano Mater. 2018, 1, 3817–3828. [Google Scholar] [CrossRef]
  29. Tran, T.-N.; Mauro, C.D.; Graillot, A.; Mija, A. Chemical Reactivity and the Influence of Initiators on the Epoxidized Vegetable Oil/Dicarboxylic Acid System. Macromolecules 2020, 53, 2526–2538. [Google Scholar] [CrossRef]
  30. Blank, W.J.; He, Z.A.; Picci, M. Catalysis of the Epoxy-Carboxyl Reaction. J. Coat. Technol. 2002, 74, 33–41. [Google Scholar] [CrossRef]
  31. Jang, K.-S.; Eom, Y.-S.; Choi, K.-S.; Bae, H.-C. Crosslinkable Deoxidizing Hybrid Adhesive of Epoxy–Diacid for Electrical Interconnections in Semiconductor Packaging. Polym. Int. 2018, 67, 1241–1247. [Google Scholar] [CrossRef]
  32. Supanchaiyamat, N.; Shuttleworth, P.S.; Hunt, A.J.; Clark, J.H.; Matharu, A.S. Thermosetting Resin Based on Epoxidised Linseed Oil and Bio-Derived Crosslinker. Green Chem. 2012, 14, 1759–1765. [Google Scholar] [CrossRef]
  33. Schuchardt, U.; Sercheli, R.; Vargas, R.M. Transesterification of Vegetable Oils: A Review. J. Braz. Chem. Soc. 1998, 9, 199–210. [Google Scholar] [CrossRef]
  34. Ahn, B.-J.K.; Kraft, S.; Sun, X.S. Solvent-Free Acid-Catalyzed Ring-Opening of Epoxidized Oleochemicals Using Stearates/Stearic Acid, and Its Applications. J. Agric. Food Chem. 2012, 60, 2179–2189. [Google Scholar] [CrossRef] [PubMed]
  35. Warren, F.J.; Gidley, M.J.; Flanagan, B.M. Infrared Spectroscopy as a Tool to Characterise Starch Ordered Structure—A Joint FTIR–ATR, NMR, XRD and DSC Study. Carbohydr. Polym. 2016, 139, 35–42. [Google Scholar] [CrossRef] [PubMed]
  36. Šoltýs, A.; Hronský, V.; Šmídová, N.; Olčák, D.; Ivanič, F.; Chodák, I. Solid-State 1H and 13C NMR of Corn Starch Plasticized with Glycerol and Urea. Eur. Polym. J. 2019, 117, 19–27. [Google Scholar] [CrossRef]
  37. Smits, A.L.M.; Ruhnau, F.C.; Vliegenthart, J.F.G.; van Soest, J.J.G. Ageing of Starch Based Systems as Observed with FT-IR and Solid State NMR Spectroscopy. Starch-Stärke 1998, 50, 478–483. [Google Scholar] [CrossRef]
  38. Voelkel, R. High-Resolution Solid-State 13C-NMR Spectroscopy of Polymers [New Analytical Methods (37)]. Angew. Chem. Int. Ed. Engl. 1988, 27, 1468–1483. [Google Scholar] [CrossRef]
  39. Dirè, S.; Callone, E.; Ceccato, R.; Parrino, F.; Di Credico, B.; Mostoni, S.; Scotti, R.; D’Arienzo, M. Structural Effects of TiO2 Nanoparticles in Photocurable Ladder-like Polysilsesquioxane Nanocomposites. J. Sol-Gel Sci. Technol. 2023, 114, 1–13. [Google Scholar] [CrossRef]
Scheme 1. Molecular structures and atom labeling of epoxidized soybean oil ESO (R1 indicates the epoxidized fatty acid chain) and cinnamic acid (CA).
Polysaccharides 06 00040 sch001
Scheme 2. Esterification reaction of epoxidized soybean oil (ESO) with cinnamic acid (CA) to soybean oil cinnamates.
Polysaccharides 06 00040 sch002
Figure 1. FTIR of samples 1ESO+1CA-h0 and 1ESO+1CA-h1. The 2700–1900 cm−1 region of the spectrum is not reported in the figure, as no relevant signals were present.
Polysaccharides 06 00040 g001
Figure 2. Deconvolution of the FTIR carbonyl band for (a) 1ESO+1CA-h0 and (b) 1ESO+1CA-h1.
Polysaccharides 06 00040 g002
Figure 3. (a) 13C NMR and (b) 1H NMR spectra of the sample 1ESO+1CA-h2 (bottom) and sample 1ESO+1CA-h0 (mixture without any heating) (top) in CDCl3. In (b), a representative scheme of esterified ESO with C labeling is shown.
Polysaccharides 06 00040 g003
Figure 4. (a) FTIR spectra, (b) 13C NMR spectra, (c) 1H NMR spectra of samples 1ESO+1CA-h1, 1ESO+1CA-h2, 1ESO+1CA-h3, 1ESO+1CA-h4. For the FTIR spectra, the 2700–1900 cm−1 region of the spectrum is not reported in the figure, as no relevant signals were present.
Polysaccharides 06 00040 g004
Scheme 3. Reactions of ESO with CA in uncatalyzed conditions.
Polysaccharides 06 00040 sch003
Figure 5. (a) FTIR, (b) 13C NMR, and (c) 1H NMR spectra of samples 1ESO+1CA-h3, 2ESO+1CA-h3, 3ESO+1CA-h3. For the FTIR spectra, the 2700–1900 cm−1 region of the spectrum was not reported in the figure, as no relevant signals were present.
Polysaccharides 06 00040 g005
Figure 6. FTIR conversion of epoxy groups and cinnamic acid as a function of ESO excess.
Polysaccharides 06 00040 g006
Figure 7. (a) 13C NMR, (b) 1H NMR, and (c) FTIR spectra of sample 1ESO+1CA-h3 before (unwashed) and after (washed) purification in the NaHCO3(aq)/CH2Cl2 solution. The inset in (b) shows the overlapped 1H NMR spectra, highlighting the disappearance of free unreacted CA removed by the purification procedure. For the FTIR spectra, the 2700–1900 cm−1 region of the spectrum was not reported in the figure, as no relevant signals were present.
Polysaccharides 06 00040 g007aPolysaccharides 06 00040 g007b
Figure 8. Films: (a) YG and (b) Y40ESO-CA.
Polysaccharides 06 00040 g008
Figure 9. (a) XRD patterns and (b) 13C CPMAS NMR spectra of starch-based films (the carbon labeling of starch is reported in the inset).
Polysaccharides 06 00040 g009
Table 1. ESO-CA samples and preparation conditions.
Sample g of ESO per 1 g of CAEpoxy:Acid EquivalentsProcess Conditions
Stoichiometric conditions
1ESO+1CA-h01.621:1Mixing for 24 h at room T
1ESO+1CA-h11.621:1Heating for 1 h at 90 °C
1ESO+1CA-h21.621:1Heating for 6 h at 90 °C
1ESO+1CA-h31.621:1Heating for 1 h at 90 °C + 2 h at 180 °C
1ESO+1CA-h41.621:1Heating for 1 h at 90 °C + 3 h 120 °C + 2 h at 180 °C
Non-stoichiometric conditions
2ESO+1CA-h33.252:1Heating for 1 h 90 °C + 2 h at 180 °C
3ESO+1CA-h34.873:1Heating for 1 h 90 °C + 2 h at 180 °C
1ESO+3CA-h30.541:3Heating for 1 h 90 °C + 2 h at 180 °C
Table 2. Starch-based films, labels, and composition (% w/w with respect to the starch content).
Film LabelComposition
YYuca starch
YGYuca starch + glycerol (40% w/w)
Y20ESO-CAYuca starch + 1ESO+1CA-h3 (20% w/w)
Y40ESO-CAYuca starch + 1ESO+1CA-h3 (40% w/w)
Table 3. Chemical characterization of the functionalized ESO (reactions with 1:1 stoichiometry) by 13C-NMR.
Sample Residual Nepoxy (±0.02) aEpoxide Conversion b Ester Formation c
1ESO+1CA-h04.600%
1ESO+1CA-h1n.a.42% d19% e
1ESO+1CA-h21.2073% 24%
1ESO+1CA-h30100%42%
1ESO+1CA-h40100%27%
a Data calculated through Equation (3); initial amount of epoxy groups per ESO molecule Nepoxy,0 = 4.60 ± 0.02; b epoxide conversion = 100 (1 − Nepoxy,t/Nepoxy,0) where Nepoxy,t is the value calculated for every sample by Equation (3); c calculated from peaks a, a′, a′′ comparison; d data obtained by FTIR (Equation (1)) e CA conversion obtained through FTIR (Equation (2)).
Table 4. Chemical characterization of the functionalized ESO with different epoxy:acid equivalent ratios.
Sample Residual Nepoxy aEpoxide Conversion by 13C-NMR bEpoxide Conversion by FTIR cCA Conversion by FTIR dEster Formation by 13C-NMR e
1ESO+1CA-h30100%99%49%42%
2ESO+1CA-h30.2894%96%47%69%
3ESO+1CA-h32.0954%74%53%53%
1ESO+3CA-h30100%99%25%14%
a Data calculated through Equation (3); initial amount of epoxy groups per ESO molecule Nepoxy,0 = 4.60 ± 0.02; b epoxide conversion = 100 (1 − Nepoxy,t/Nepoxy,0) where Nepoxy,t is the residual epoxy value calculated for every sample by Equation (3); c data calculated through Equation (1); d data calculated through Equation (2); e calculated from peak a, a′, a′′ comparison.
Table 5. T1ρ(H) relaxation times of the C4 hydrogen site.
SampleT1ρ(H) (ms)
Y4.6 ± 0.1
YG2.2 ± 0.1
Y20ESO-CINNII4.5 ± 0.1
Y40ESO-CINNII4.3 ± 0.1
Disclaimer/Publisher’s Note: The statements, opinions and data contained in all publications are solely those of the individual author(s) and contributor(s) and not of MDPI and/or the editor(s). MDPI and/or the editor(s) disclaim responsibility for any injury to people or property resulting from any ideas, methods, instructions or products referred to in the content.

