1. Introduction
Natural fibers sourced from plants, such as curaua, flax, hemp, and jute, are gaining attention as viable alternatives to traditional synthetic fibers. The appeal lies not only in their biodegradability but also in their low environmental impact throughout the production process. Also, specific properties (e.g., mechanical resistance divided by the density) can achieve values as high as some metal and synthetic fibers [
1,
2,
3]. However, the low thermal stability of natural fibers limits their use in applications where the temperature exceeds the degradation of hemicellulose (the first of the three main components that first degrades). As such, knowledge of the degradation process of natural process, as well as the degradation of each individual component, is of crucial interest in the academic and industrial fields since structural modifications can be performed in the fibers, aiming to improve their performance [
4,
5,
6,
7].
Natural fibers consist of chemically distinct components that vary depending on the biomass source: 0.2–10.5% of pectin, waxes, and other components; 9.9–23.0% of hemicellulose; 31.0–91.0% cellulose; and 6.0–35.0% of lignin [
8,
9,
10,
11]. Also, fibers comprise the following two walls: the primary wall (which contains hemicellulose, pectin, and proteins) and the secondary wall (which contains the same constituents but is richer in cellulose and has lignin). The primary wall is more flexible than the secondary wall, which is stiffer and responsible for the mechanical response of the fiber [
12].
Figure 1 shows the schematic representation of the composition and structural hierarchy of a plant fiber.
The three main components (cellulose, hemicellulose, and lignin) have distinct H/C atomic ratios and O/C atomic ratios, which allows the use of these components in different applications. Lignin has an H/C atomic ratio of 1.0, with cellulose at 1.6 and hemicellulose at 1.7. The O/C atomic ratio of lignin is 0.35, while cellulose is 0.8, and hemicellulose is 1.0. The higher value of hemicellulose allows for its more efficient application as a biofuel [
12]. In spite of this wide variation in properties, it has been demonstrated that cellulose is responsible for activation energy values, while hemicellulose and lignin affect the reaction order more directly (the relationship between the concentrations of species and the rate of a reaction) [
7,
8]. Since lignin is a complex component that degrades in a wide temperature range (160 °C–900 °C), many reaction mechanisms can be attributed to lignin. In spite of the fact that cellulose plays a major role in the activation of energy value, all components interact, so pyrolysis kinetics can be related to the composition and not to the individual values of its components. Ornaghi et al. [
8] studied the effects of water, oil, cellulose, hemicellulose, and lignin separately and claimed that hemicellulose (water-soluble) can accelerate the degradation process since hemicellulose increases the amount of water and lowers the thermal stability of the fiber. In this sense, it would be interesting to remove the highest amount of hemicellulose possible to minimize this drawback, but since hemicellulose contributes to strengthening the cell wall by interacting with cellulose and lignin, a new “problem” can be created. Depending on the amount of these components, a single degradation step can be observed in spite of multiple degradation steps and reactions occurring. In general, the appropriate pyrolysis kinetic model ranges from autocatalytic to distributed reactivity [
7,
12]. Autocatalytic models are sigmoid for isothermal conditions and narrower than a first-order reaction in ramped heating. Distributed reactivity models initially decay like the sum of exponential for isothermal conditions and are broader than a first-order reaction for ramped heating. In the case of biomass, the reaction might best be described as the combination of sigmoid land-distributed reactivity models. But isoconversional analysis can provide guidance for model fitting [
13,
14]. The main drawback of these models is that neither model considers the sequential degradation of char-forming materials. Since the major portion of hemicellulose degrades first (compared to cellulose and lignin), the hemicellulose-char formed contributes to the further degradation of cellulose and lignin. Put simply, the further degradation of hemicellulose and cellulose forms respective chars that can also contribute to the further degradation of lignin [
8,
15].
According to Yao et al. [
16], the activation energy of ten types of fibers lies in the range (160–170 kJ·mol
−1) at a temperature range of 215–310 °C. The authors used Kissinger, Friedman, Flynn–Wall–Ozawa, and modified Coats–Redfern methods to determine this parameter. Poletto et al. [
17], using the same kinetic methods, evaluated the activation energy of four different plant fibers and obtained an average activation energy of 126–199 kJ·mol
−1. Ornaghi Jr. et al. [
18] studied the mechanisms involved in the thermal degradation of lignocellulosic fibers and stated that the activation energy of the isolated cellulose is similar to the values found for the respective fibers containing lignin and hemicellulose. Hence, the interaction among the components did not change the activation energy values considerably but could alter the reactivity of the components and the reaction mechanism. Monticeli et al. [
19] studied the kinetic parameters of vegetable fibers using an artificial neural network (ANN) for prediction and compared the results with the isoconversional methods. The results obtained using ANN showed similar values compared to the traditional isoconversional methods employed by the authors, indicating that ANN is an excellent tool for predicting TGA curves and, consequently, the kinetic parameters. Neither of the aforementioned studies verified the kinetic parameters using the Friedman and Vyazovkin methods to determine the activation energy and pre-exponential factor dependence with conversion degree. Furthermore, the model fitting was performed using linear and nonlinear regression to further employ the lifetime prediction of the fibers. Briefly, there is a vast range of studies in the literature about the thermal degradation kinetics of natural fibers, but very few follow the ICTAC (International Confederation for Thermal Analysis and Calorimetry) recommendations. This causes a wide range of results for similar materials studied. Even considering the differences in the fibers and apparatus used to perform the tests, the lack of a standard method (such as ICTAC) gives this broad range of results. One common error found is for the kinetic triplet parameters (activation energy, pre-exponential factor, and reaction mechanism). Considering that the paper presents all these parameters (which considerably reduces the number of papers eligible), in many cases, only the average values are presented and not their dependence on the conversion degree, which is crucial for understanding and determining the lifetime prediction, for example. In addition, the reaction mechanism also has different and divergent approaches since some authors follow the thermal degradation curve to determine the number of degradation steps while others follow the activation energy vs. conversion degree (which is correct). It is well known that natural fibers have three main components: cellulose, hemicellulose, and lignin, which degrade at different temperature ranges. If the thermogravimetric curve (or its derivative) is considered, it can be assumed to be two or three degradation steps, but if the activation energy vs. conversion degree is considered, it can be considered only one degradation step (taking into account the conversion degree between 0.2 and 0.8). This initial analysis can lead to wrong assumptions about the kinetic analysis. The reason for this is that the main contributor to the activation energy is cellulose, while hemicellulose and lignin play a major role in the reaction order, as first demonstrated. Finally, there is an enormous effort from ICTAC to standardize these methods and promote more solid and reliable information in the literature about thermal degradation kinetics [
15,
19].
The objective of this study is to determine the kinetic parameters of four different natural fibers using the free software (Version 01.07.20) developed by Muravyev [
20], where the isoconversional methods of Friedman and Vyazovkin are employed as well as the kinetic triplet (activation energy, pre-exponential factor and most probable reaction mechanism). The dependence of the activation energy and pre-exponential factor on the conversion degree is discussed, as are the linear and nonlinear regression models and kinetic prediction.
2. Materials and Methods
Jute and kenaf fibers were supplied by Tapetes São Carlos Technology (São Carlos/SP, Brazil) as sheets. Curaua fiber was obtained from CEAPAC (a support center for community action projects) in Santarém/PA, Brazil. Ramie (roving format) was purchased from Sisalsul Fibras Naturais (São Paulo/SP, Brazil). The characteristics of the fibers studied are presented in
Table 1 [
5]. All sheets received were oven-dried at 135 °C for 2 h and cut into small pieces of around 10 mg for TG analysis. It is noteworthy to mention that the variation in some properties is directly related to the variation in the components presented in the fibers.
The chemical composition of the fibers was determined, and all samples were determined in triplicate. The natural fibers were chemically analyzed following the NREL protocol (National Renewable Energy Laboratory) [
21] to determine the percentages of lignin, cellulose, hemicellulose, ash, and extractive.
Thermogravimetric analysis was performed using the TA instrument model TGA-50 Shimadzu under a N
2 atmosphere. The analyses (approx. 10 mg samples) were conducted from 25 to 900 °C at four different heating rates (5, 10, 20 and 40 °C min
−1). The thermal kinetic study was performed according to ICTAC recommendations [
15].
The thermal decomposition of most polymers is an endothermic process, and it is accompanied by mass loss (due to low molecular weight species or gas, for example) and changes in the heat transfer phenomena. These changes are recorded by TGA as a function of time or temperature and can be converted to the degree of conversion (α) according to Equation (1):
where α is the conversion degree,
is the sample mass at time t,
is the initial sample mass, and
is the final sample mass.
The higher the heating rate (β), the larger the temperature gradient in the sample, and an excessively fast reaction rate causes a considerable self-cooling or self-heating effect due to the enthalpy of the reaction. To avoid such complications caused by heat transfer phenomena, such as mass changes, proper heating rates may be used (preferentially lower heating rates) [
15].
The thermal degradation kinetic behavior was studied using the isoconversional differential Friedman method (Equation (2)) [
22] and the advanced integral Vyazovkin method (Equations (3) and (4)) [
23]:
where α is the conversion degree, t is the time,
is the frequency factor (pre-exponential),
is the activation energy,
is the absolute temperature,
R is the universal gas constant, and
is the differential conversion temperature.
The Vyazovkin method is a nonlinear isoconversional method that avoids approximations of the temperature integral. Equation (3) is the general kinetic equation that governs both isothermal and nonisothermal conditions.
Equation (3) can be directly used to find the Arrhenius parameters of the process if the experimental method measures a physical value proportional to the reaction rate. Otherwise, if the physical value is proportional to the extent of conversion (the mass loss related to the releasing of a gas, for example), the experimental data need to be numerically differentiated (which considerably lowers the signal-to-noise ratio in experimental data) to estimate Arrhenius parameters. The integration of Equation (3) gives Equation (4):
where
is the integral form of the reaction model (power law or Mampel, for example) and
is the variation in temperature during the experiment. Integral methods are more universal than differential ones because they are more tolerant to experimental noise.
It is only possible to determine
if Equation (4) is integrated. For a linear heating rate program,
leads to the integral,
, with no analytical solution (Equation (5)):
where
is the heating rate. Equation (5) is resolved using various approximations. However, when integrating Equation (4), a significant issue needs to be solved: the variation in the temperature inside the reaction system is not considered. Hence, there will be erroneous values when determining the kinetic parameters since the described temperature will be different from the actual temperature. As such, if the temperature integral in Equation (5) is replaced with Doyle’s approximation, a linear equation against Tα,i-1 can be achieved (Equation (6)):
where
i is an ordinal number representing experiments performed at different heating rates (
;
is a given conversion at
.
For a given conversion at different heating rates, Equation (7) can be obtained as follows:
If
is cancelled, the equation above can be represented by a minimum value condition (Equations (8) and (9)). Equation (9) is used for any arbitrary variation in temperature, imposing no restrictions on the form of T(t), allowing the fact that any variation in the temperature inside the reaction system can be experimentally measured as a function of time [
24].
Also, the kinetic parameters using the Kissinger method were investigated, as shown by Equation (10) [
25]. The Kissinger method considers only the peak temperature, not the whole conversion of the degree to temperature.
where
is the maximum use temperature for a given lifetime
.
is a function whose values depend on
at
. The lifetime prediction was estimated based on Equation (11). The principle is based on selecting a determined conversion rate (0% in our case, only differing the temperature—180 °C and 200 °C).
All calculations were performed with the help of a free open source, thermokinetic software (THINKS—Version 01.07.20) [
20].
3. Results and Discussion
The chemical composition of the fibers is presented in
Table 2:
Considering the standard deviation of the components in
Table 2, it can be stated that all fibers had a similar chemical composition.
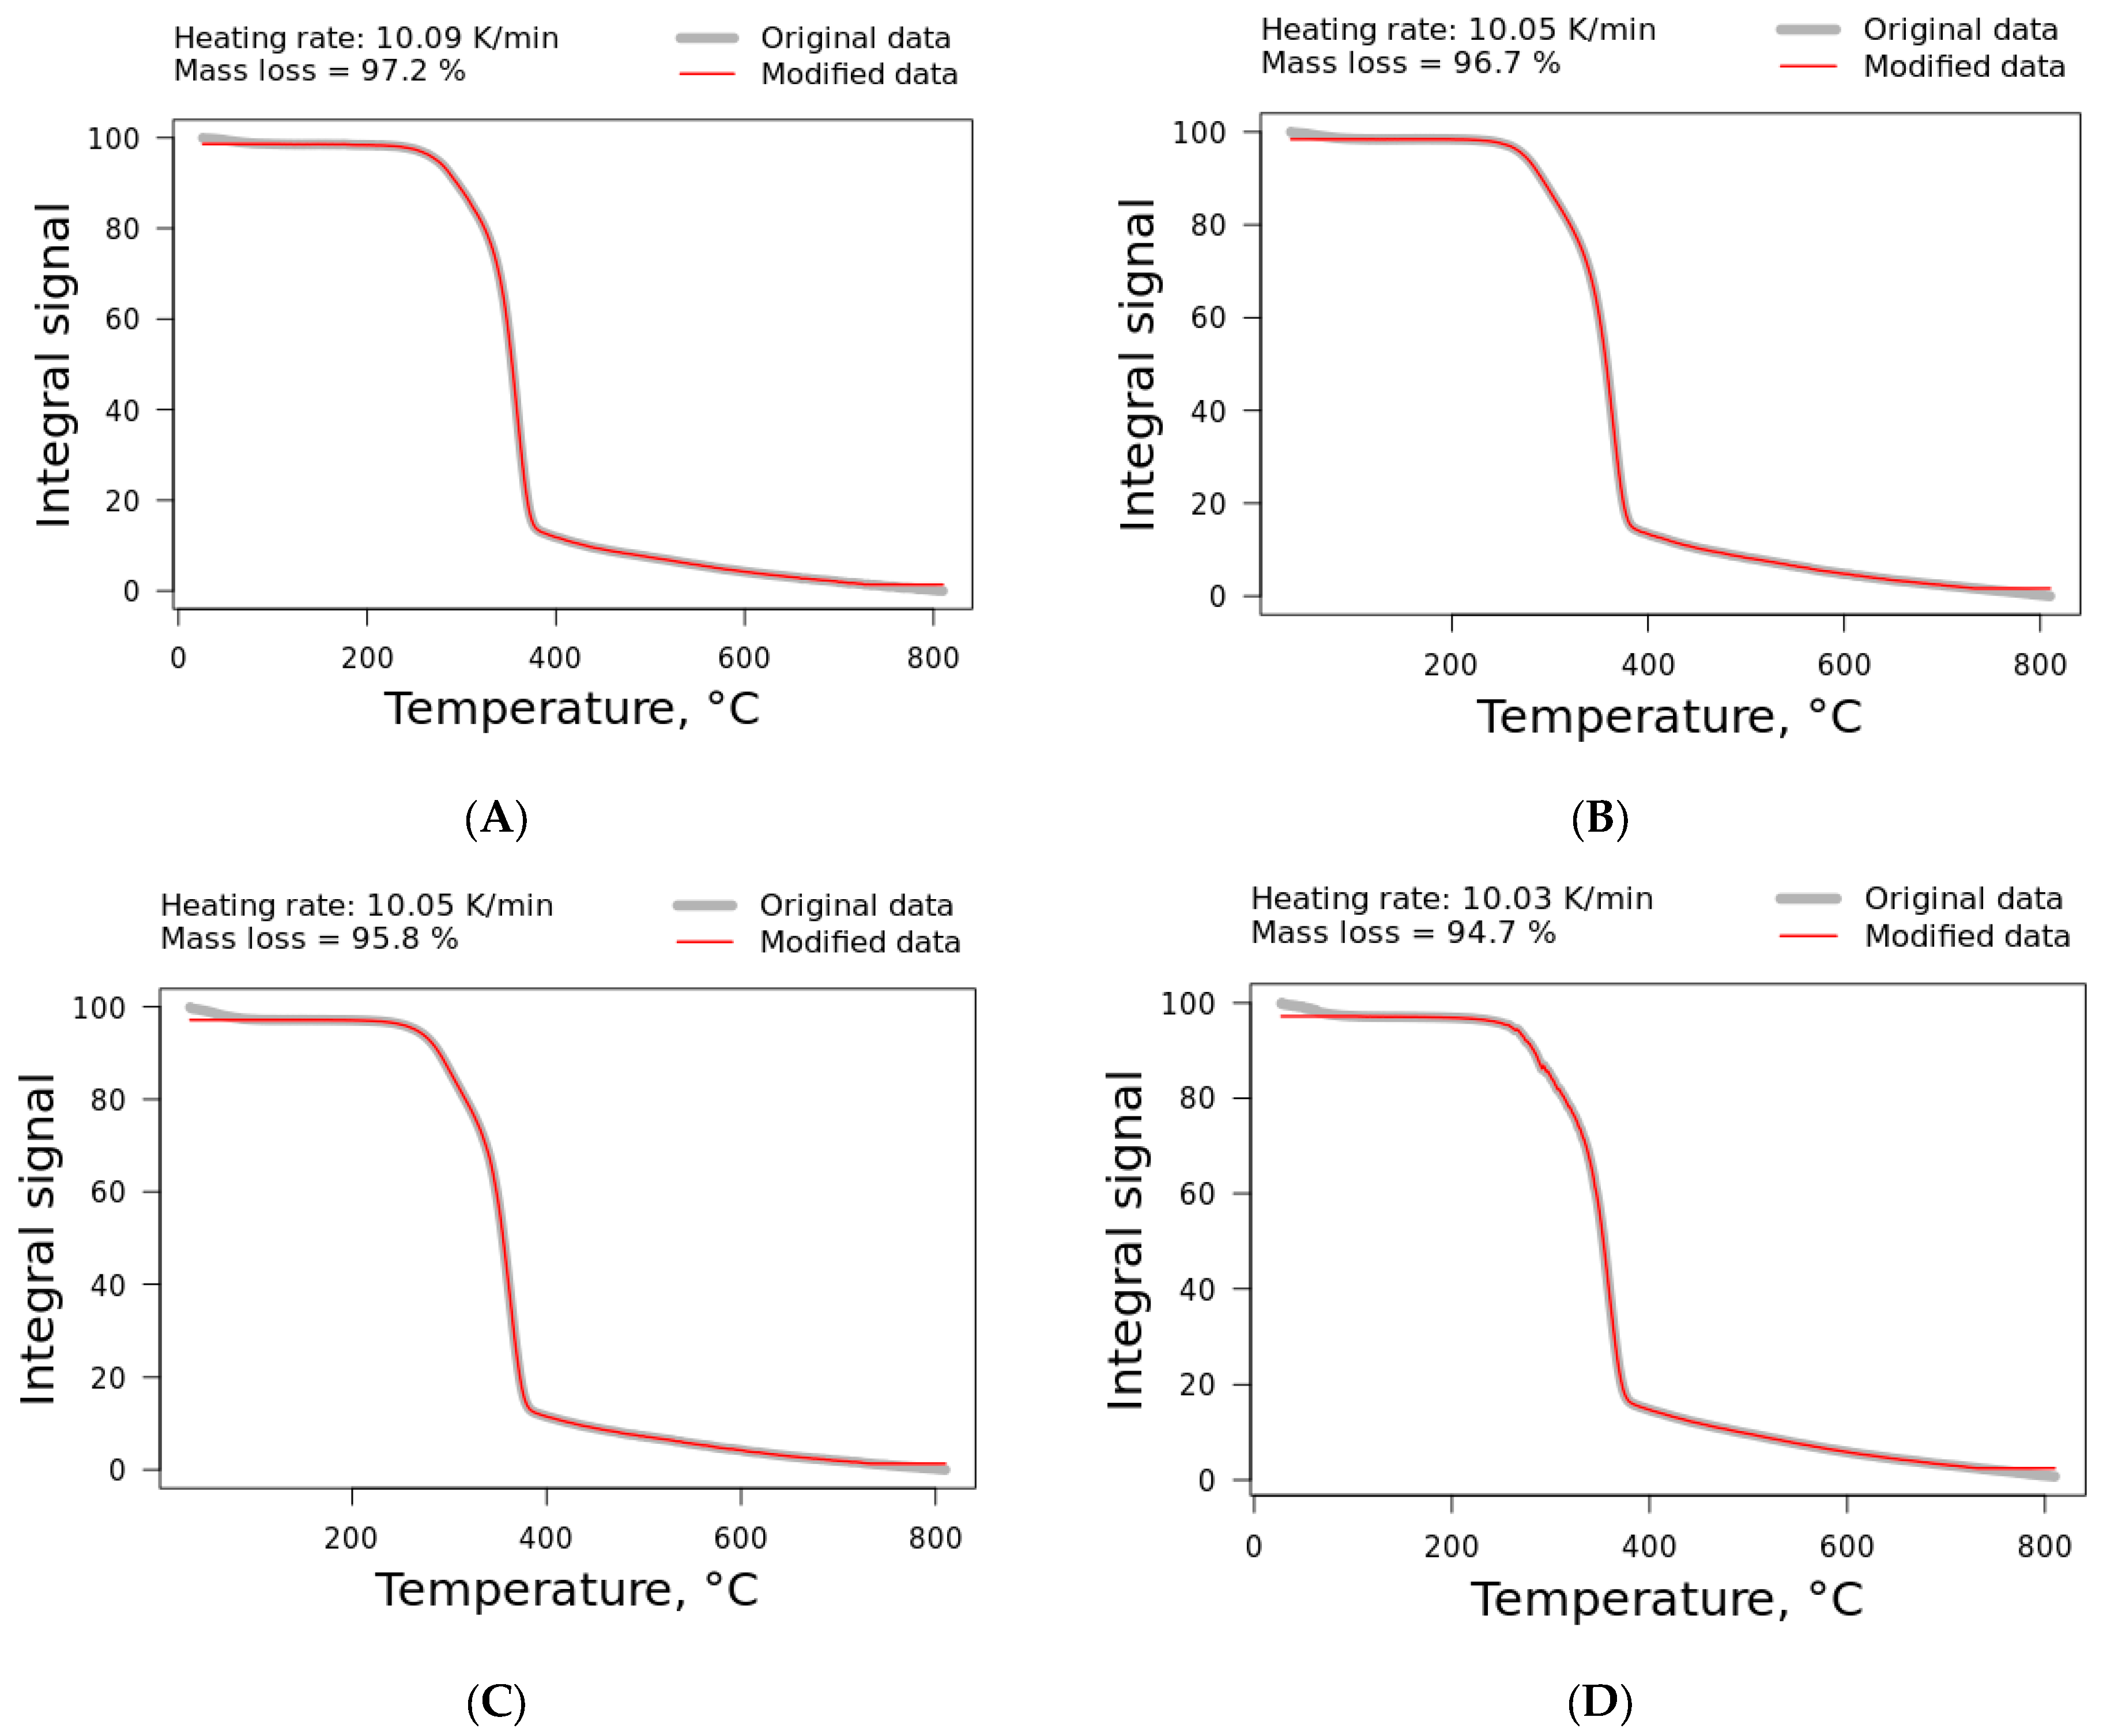
The thermogravimetric (TG) curves of the plant fibers are shown at the heating rate of 10 °C·min
−1 in
Figure 2.
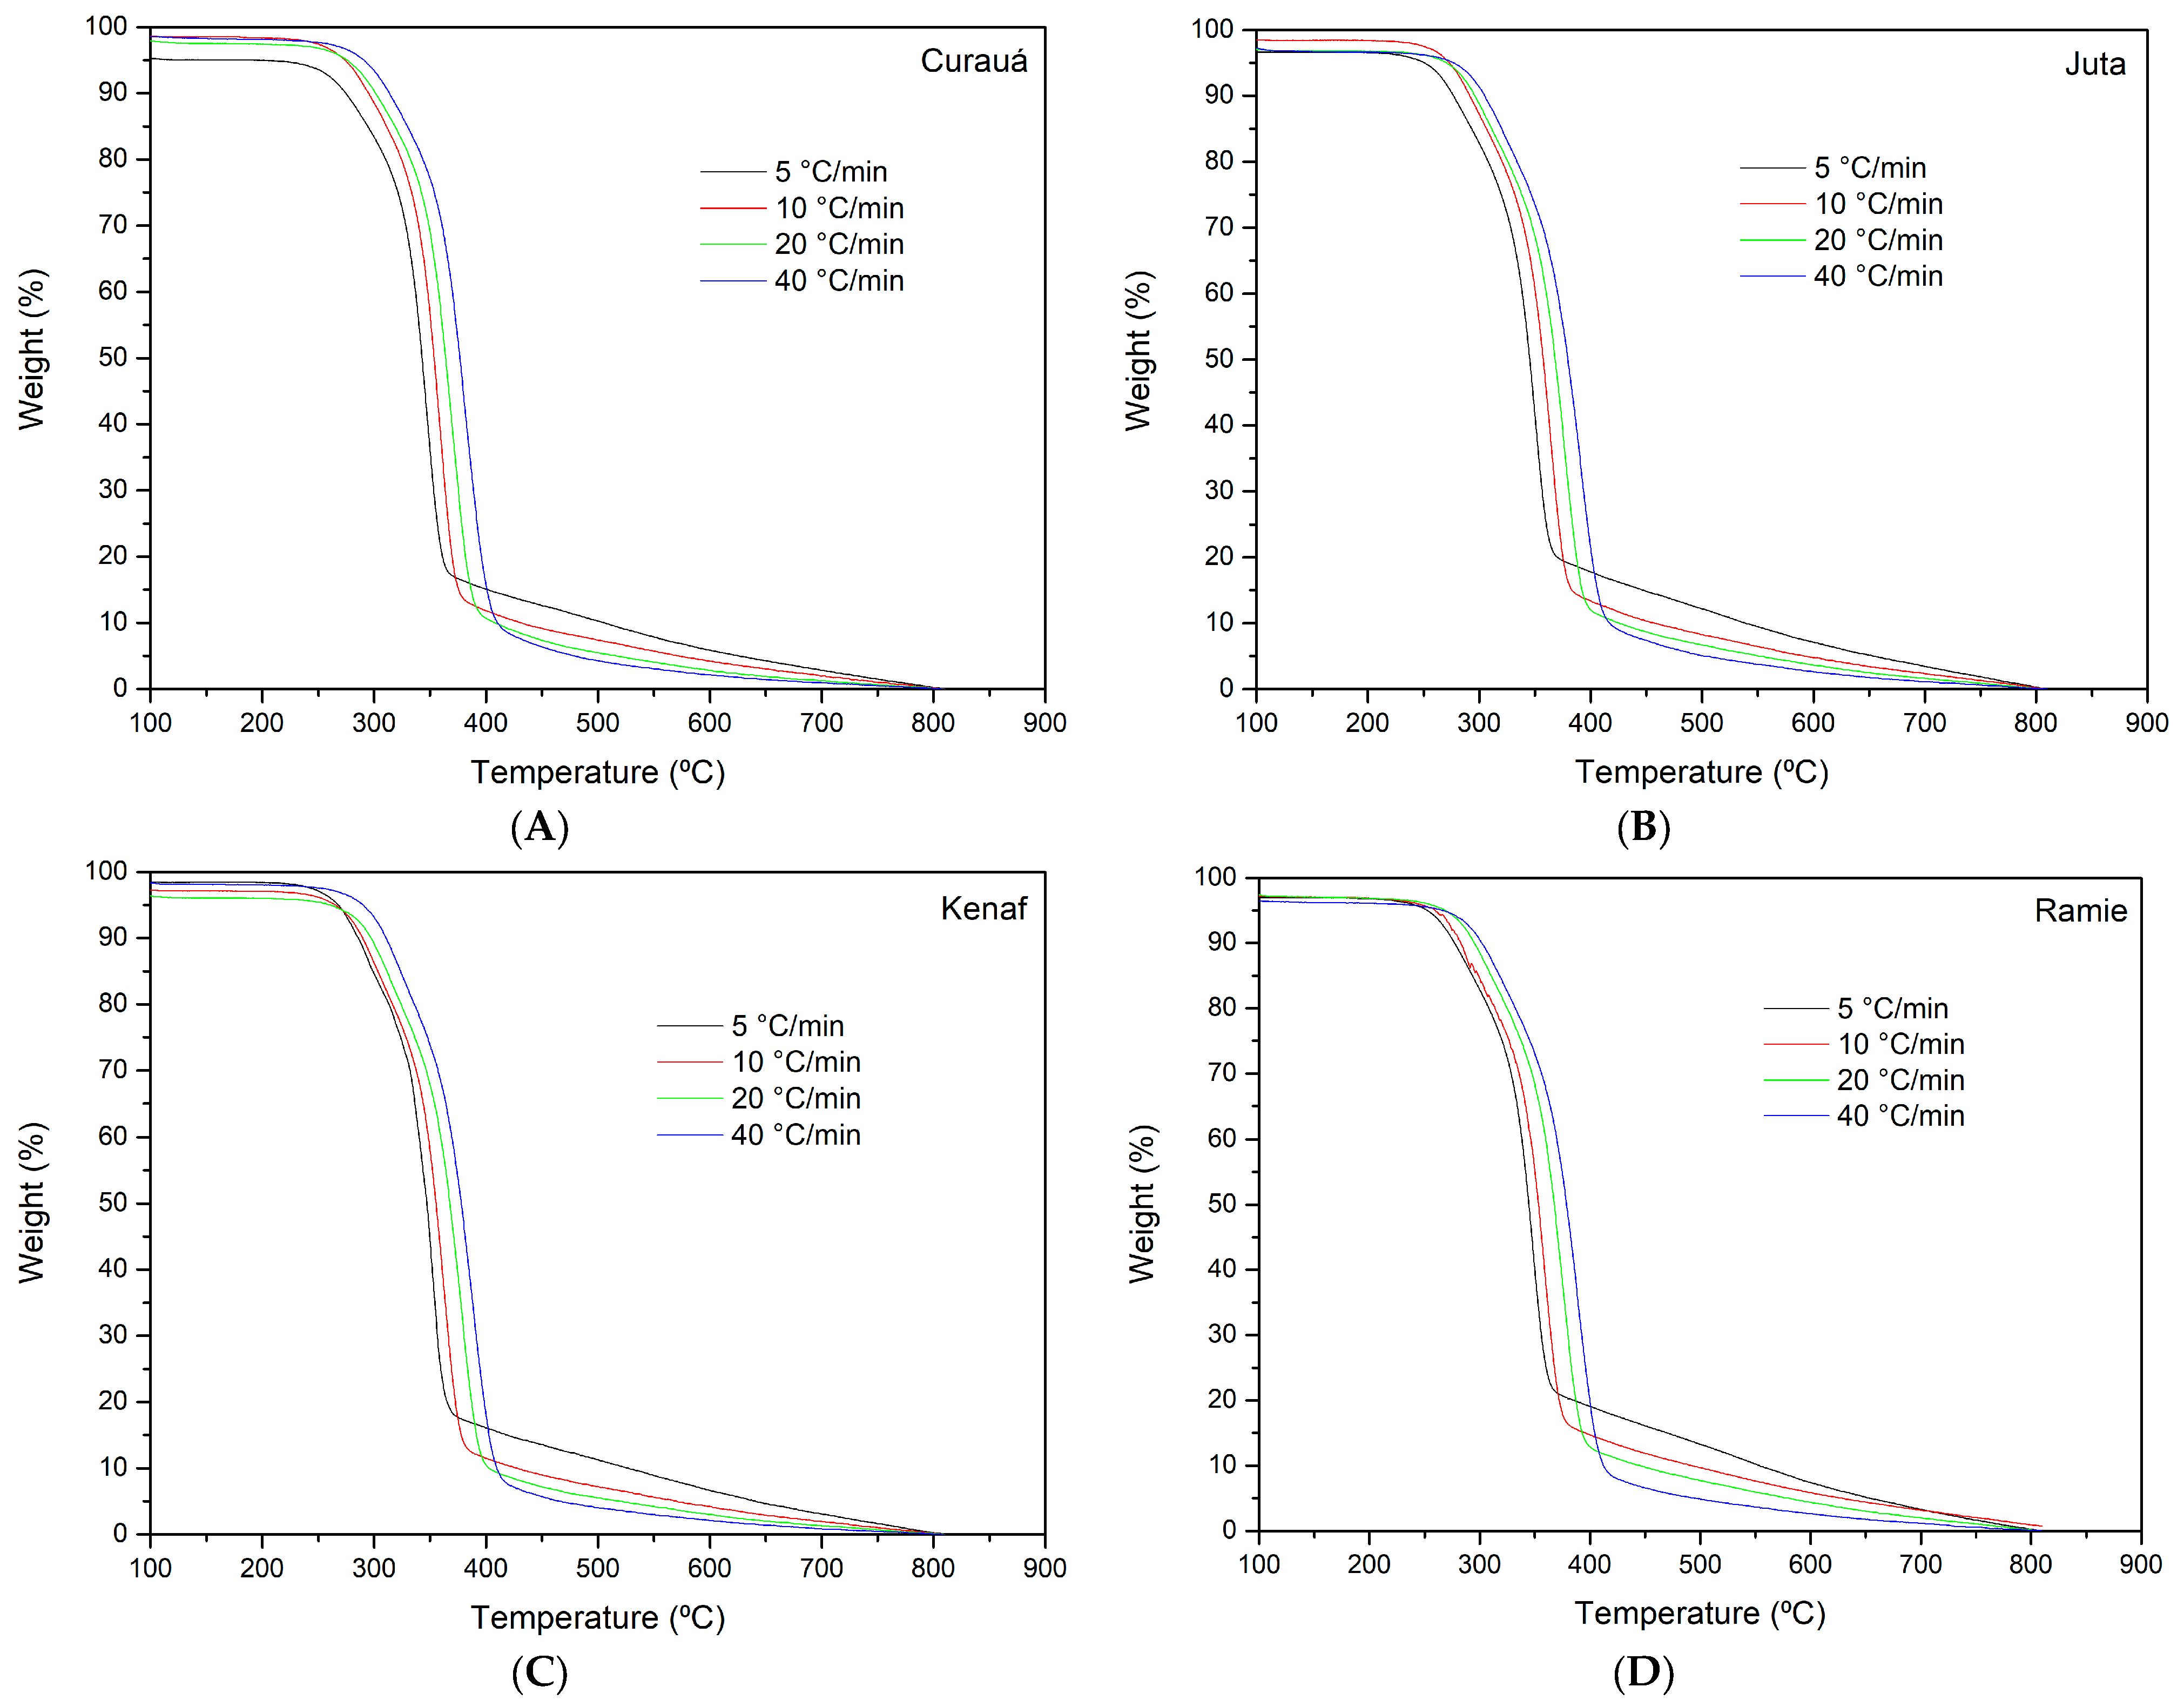
It can be observed that the same curve behavior was obtained for all different heating rates. The only difference was that the main transition temperature shifted to higher temperatures with the heating rate. The first mass loss (around 100 °C) could be attributed to the evaporation of intrinsic water and the sublimation of low-molecular-mass compounds, followed by a plateau until approximately 100 °C. The second mass loss occurred in a narrow temperature range (220–315 °C), and it is mainly attributed to the degradation of hemicellulose (the first shoulder, as visualized in the DTG curve in
Figure 3) and cellulose (the main peak).
More than 60% of the plant fiber is degraded in this temperature range. Since hemicellulose is the main component responsible for the humidity content and has lower thermal stability than cellulose, it would be expected that plant fibers with a lower hemicellulose content have higher thermal stability. The final “tail” is attributed to the higher molecular weight compounds of lignin, which did not degrade at the temperature range studied. It is important to mention two important issues: (i) when “hemicellulose degradation” is mentioned, it is implied that cellulose and lignin are also degrading but at a lower rate and amount, and (ii) hemicellulose degradation generates char and gases, which can alter the degradation kinetics and speed up the degradation of the remaining components. The influence of char and gases in the degradation of plant fibers is still not widely understood [
4,
5,
10,
15]. In summary, the pyrolysis kinetics of biomass and fossil fuels are a complex set of sequential and competing reactions, where the yield of char depends on the competition between the evaporation of primary products and retrograde reactions, leading to additional char and light gases. If varied thermal histories during pyrolysis do not give the same char yield, one must include a transport-based mechanism in the kinetics analysis to derive reliable kinetic parameters, particularly for the last stages of the reaction, when char formation is dominant. Distributed reactivity models are also required for proper kinetic modeling, and a sigmoid reaction model is required for cellulose and the central reaction of some biomass materials. A parallel reaction model with three or four pseudo-components is needed for biomass and many fossil fuels, except when a discrete distribution activation energy model works, which is the most common model for kerogen pyrolysis [
10,
12].
The conversion and the DTG as functions of temperature are visualized in
Figure 3, where the conversion rate is shown for curaua fiber. The same behavior was noted for the other fibers, which are not presented here to save space. The format of the curve for nonisothermal conditions is always sigmoid since the reaction rate is slow at low temperatures, accelerates with increasing temperature, and decreases when the majority of the material is degraded. This can be described by the Avrami–Erofeev and Sestak–Berggren models as the most probable reaction mechanisms [
25,
26]. For these models, it is considered that the processes in the initial and final stages demonstrate accelerating and decelerating behavior, with the process rate reaching its maximum at some intermediate value.
The TG curves for all heating rates are presented in
Figure 4. Similar behavior was observed for all fibers, indicating that the similarities in the chemical composition resulted in similar thermal behavior.
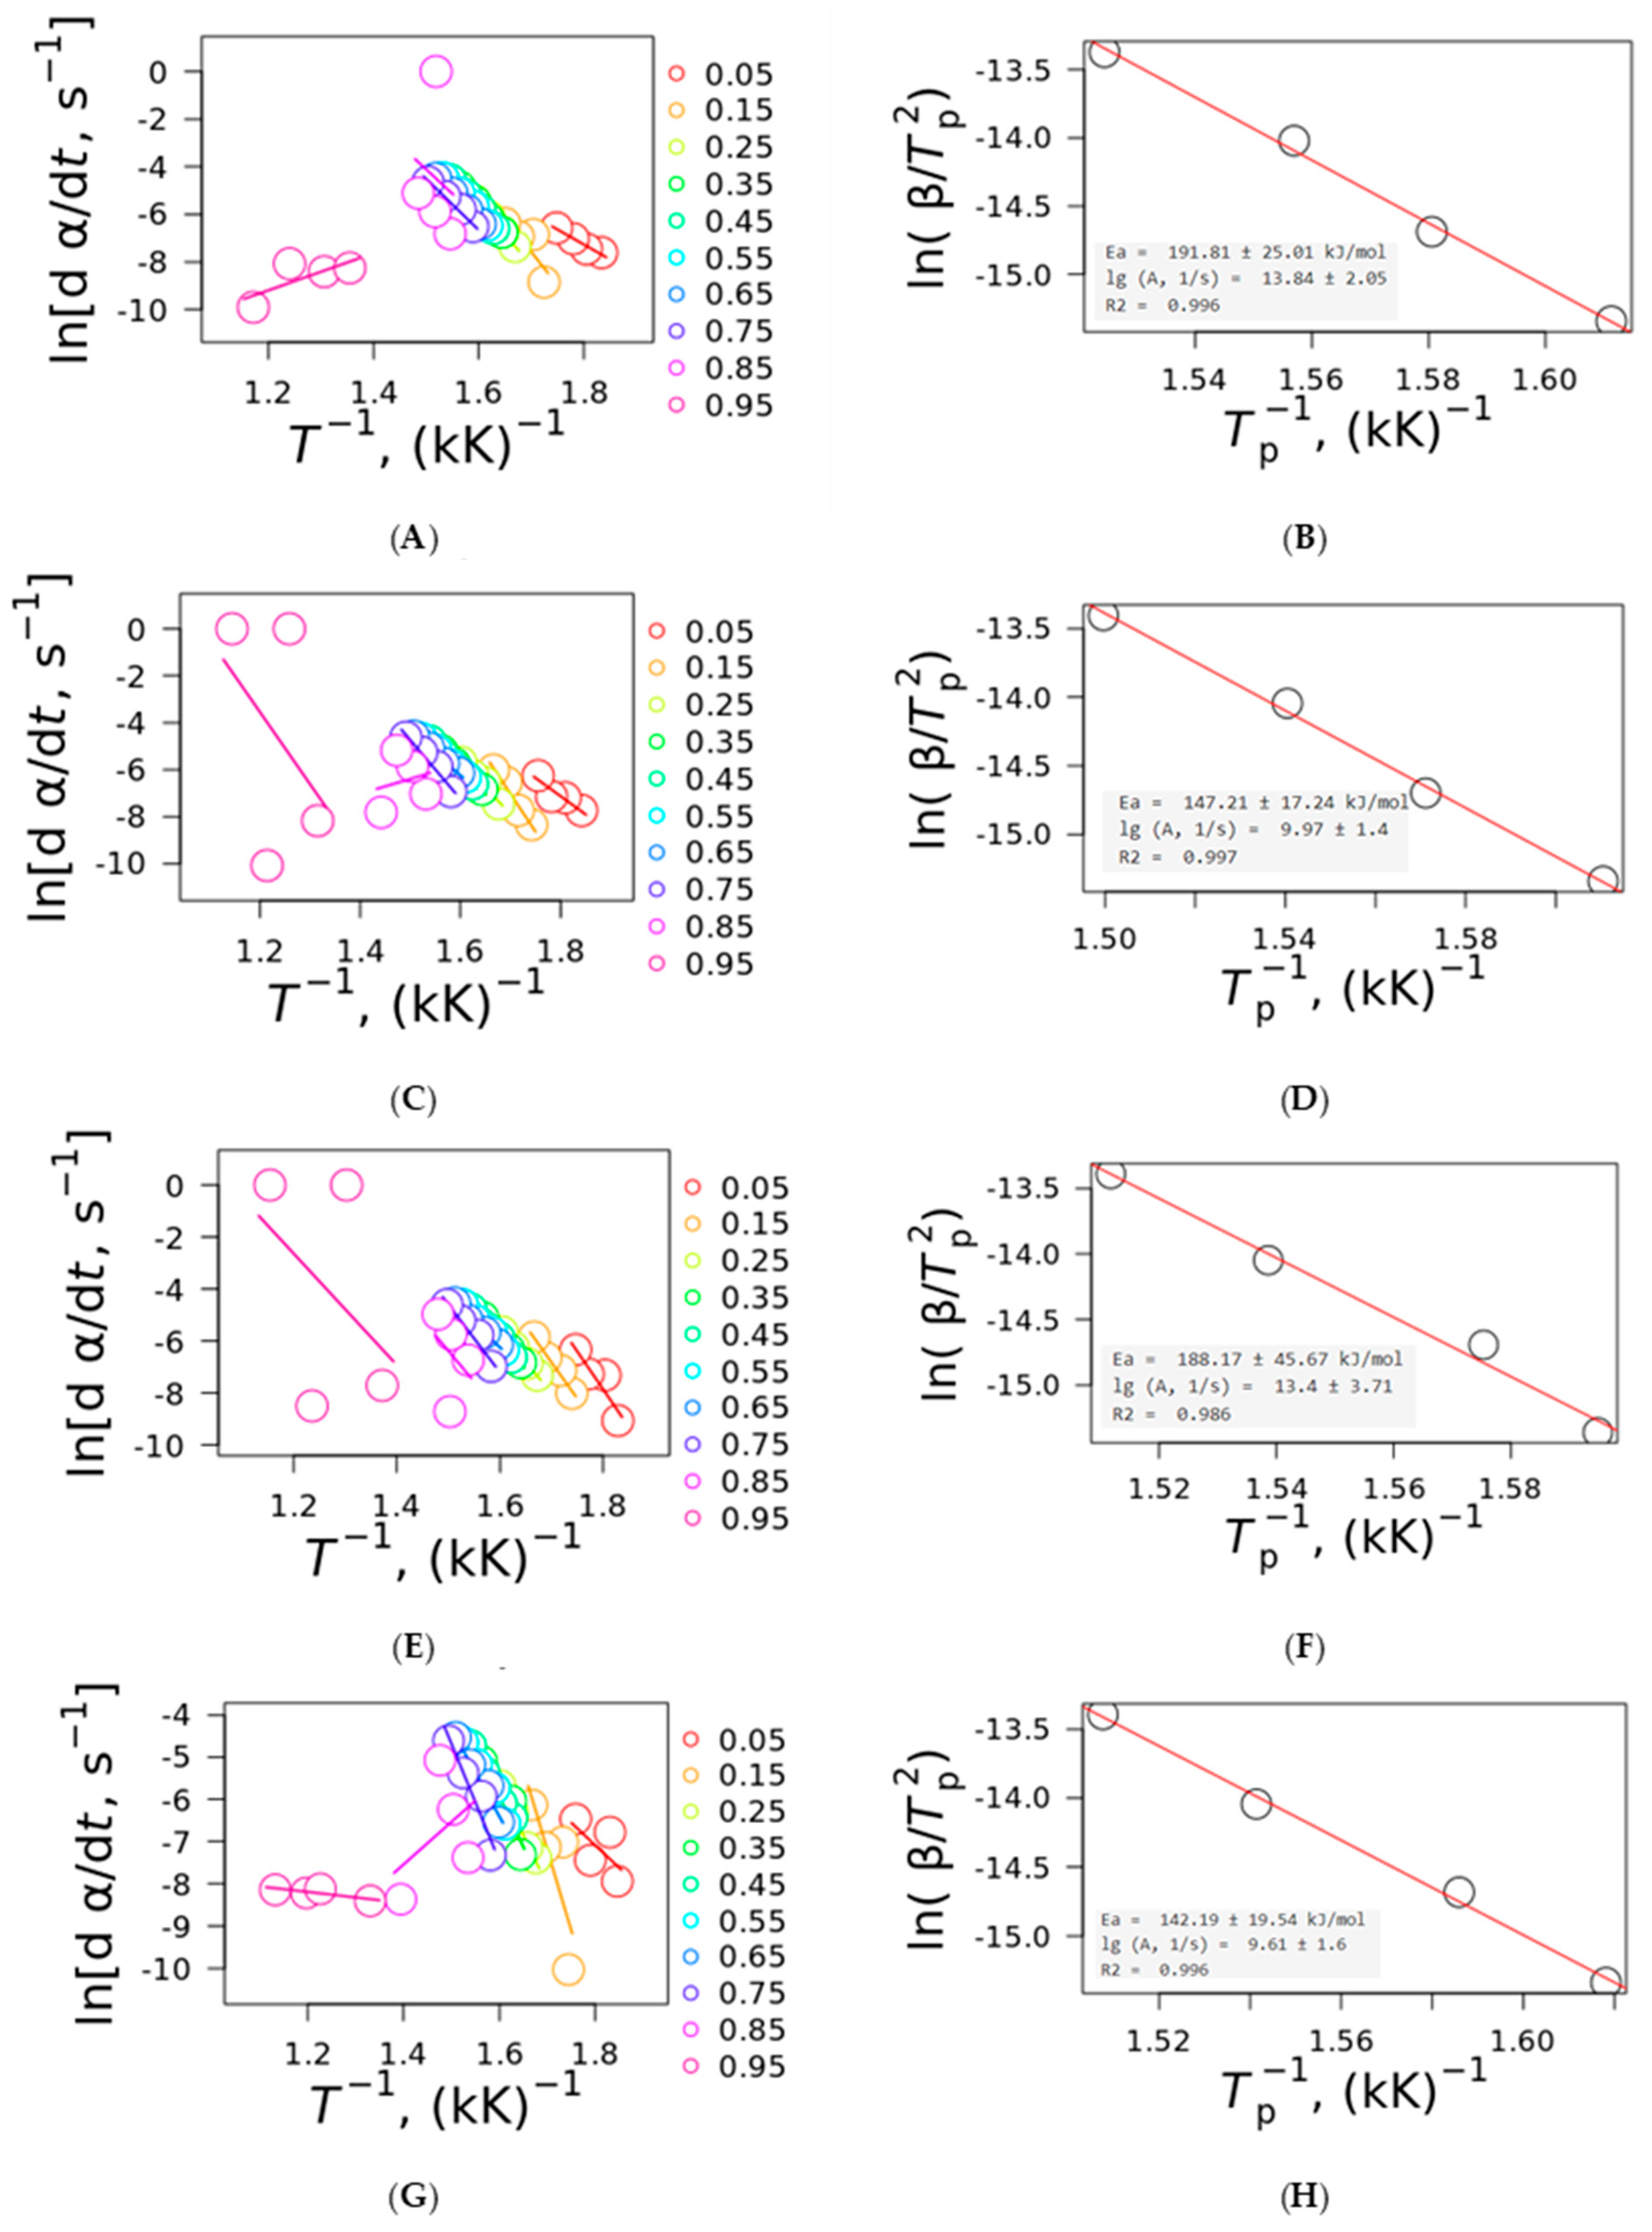
The Friedman and Kissinger plots for all plant fibers are shown in
Figure 5. It can be observed that for conversion rates higher than 0.85, for the Friedman and Vyazovkin plots, the behavior was different compared to the other heating rates, indicating that at higher conversion rates, the kinetic behavior must not be considered. The reason for this is that at α > 0.8 (approximately the sum of the pyrolysis process), the kinetic equations greatly deviate from the kinetic equation models; this is because the sum of the degradation of hemicellulose and cellulose with portions of lignin, allied with the mass loss associated with the sublimation of low-molecular-mass compounds and the evaporation of intrinsic water (the last two are the reason for the anomalous effect at α < 0.2, also called the initiation period), are calculated with the respective hemicellulose and cellulose chars, avoiding the determination of the kinetic parameters for these two extremes. Hence, the analysis of the kinetic parameters must be carried out at a conversion range between 0.2 and 0.8 [
10,
16], where it is noted that the activation energy depends on the plant fiber pyrolysis and not on sublimation, evaporation, or other non-pyrolytic processes, for example.
The proximity and slope of the curves for α = 0.2–0.8 are similar among the plant fibers, indicating similar activation energies and pre-exponential factors (as noted in
Figure 5). This is also evidence that a single-step mechanism plays a major role in the thermal degradation kinetics of the plant fibers in spite of the three main components being mixed at a microscopic scale, which can react with each other during pyrolysis. Kissinger plots presented E
a values ranging from 191.81 kJ·mol
−1 for curaua fiber to 142.19 kJ·mol
−1 for ramie, while the pre-exponential factor presented values ranging from 13.84 s
−1 for curaua fiber to 9.61 s
−1 for ramie fiber. An increase in the pre-exponential factor was noted as the activation energy increased, indicating a possible compensation effect [
27,
28], where an increase in one parameter leads to a linear increase in the other as a result of a mathematical artifact of the Arrhenius-based equations.
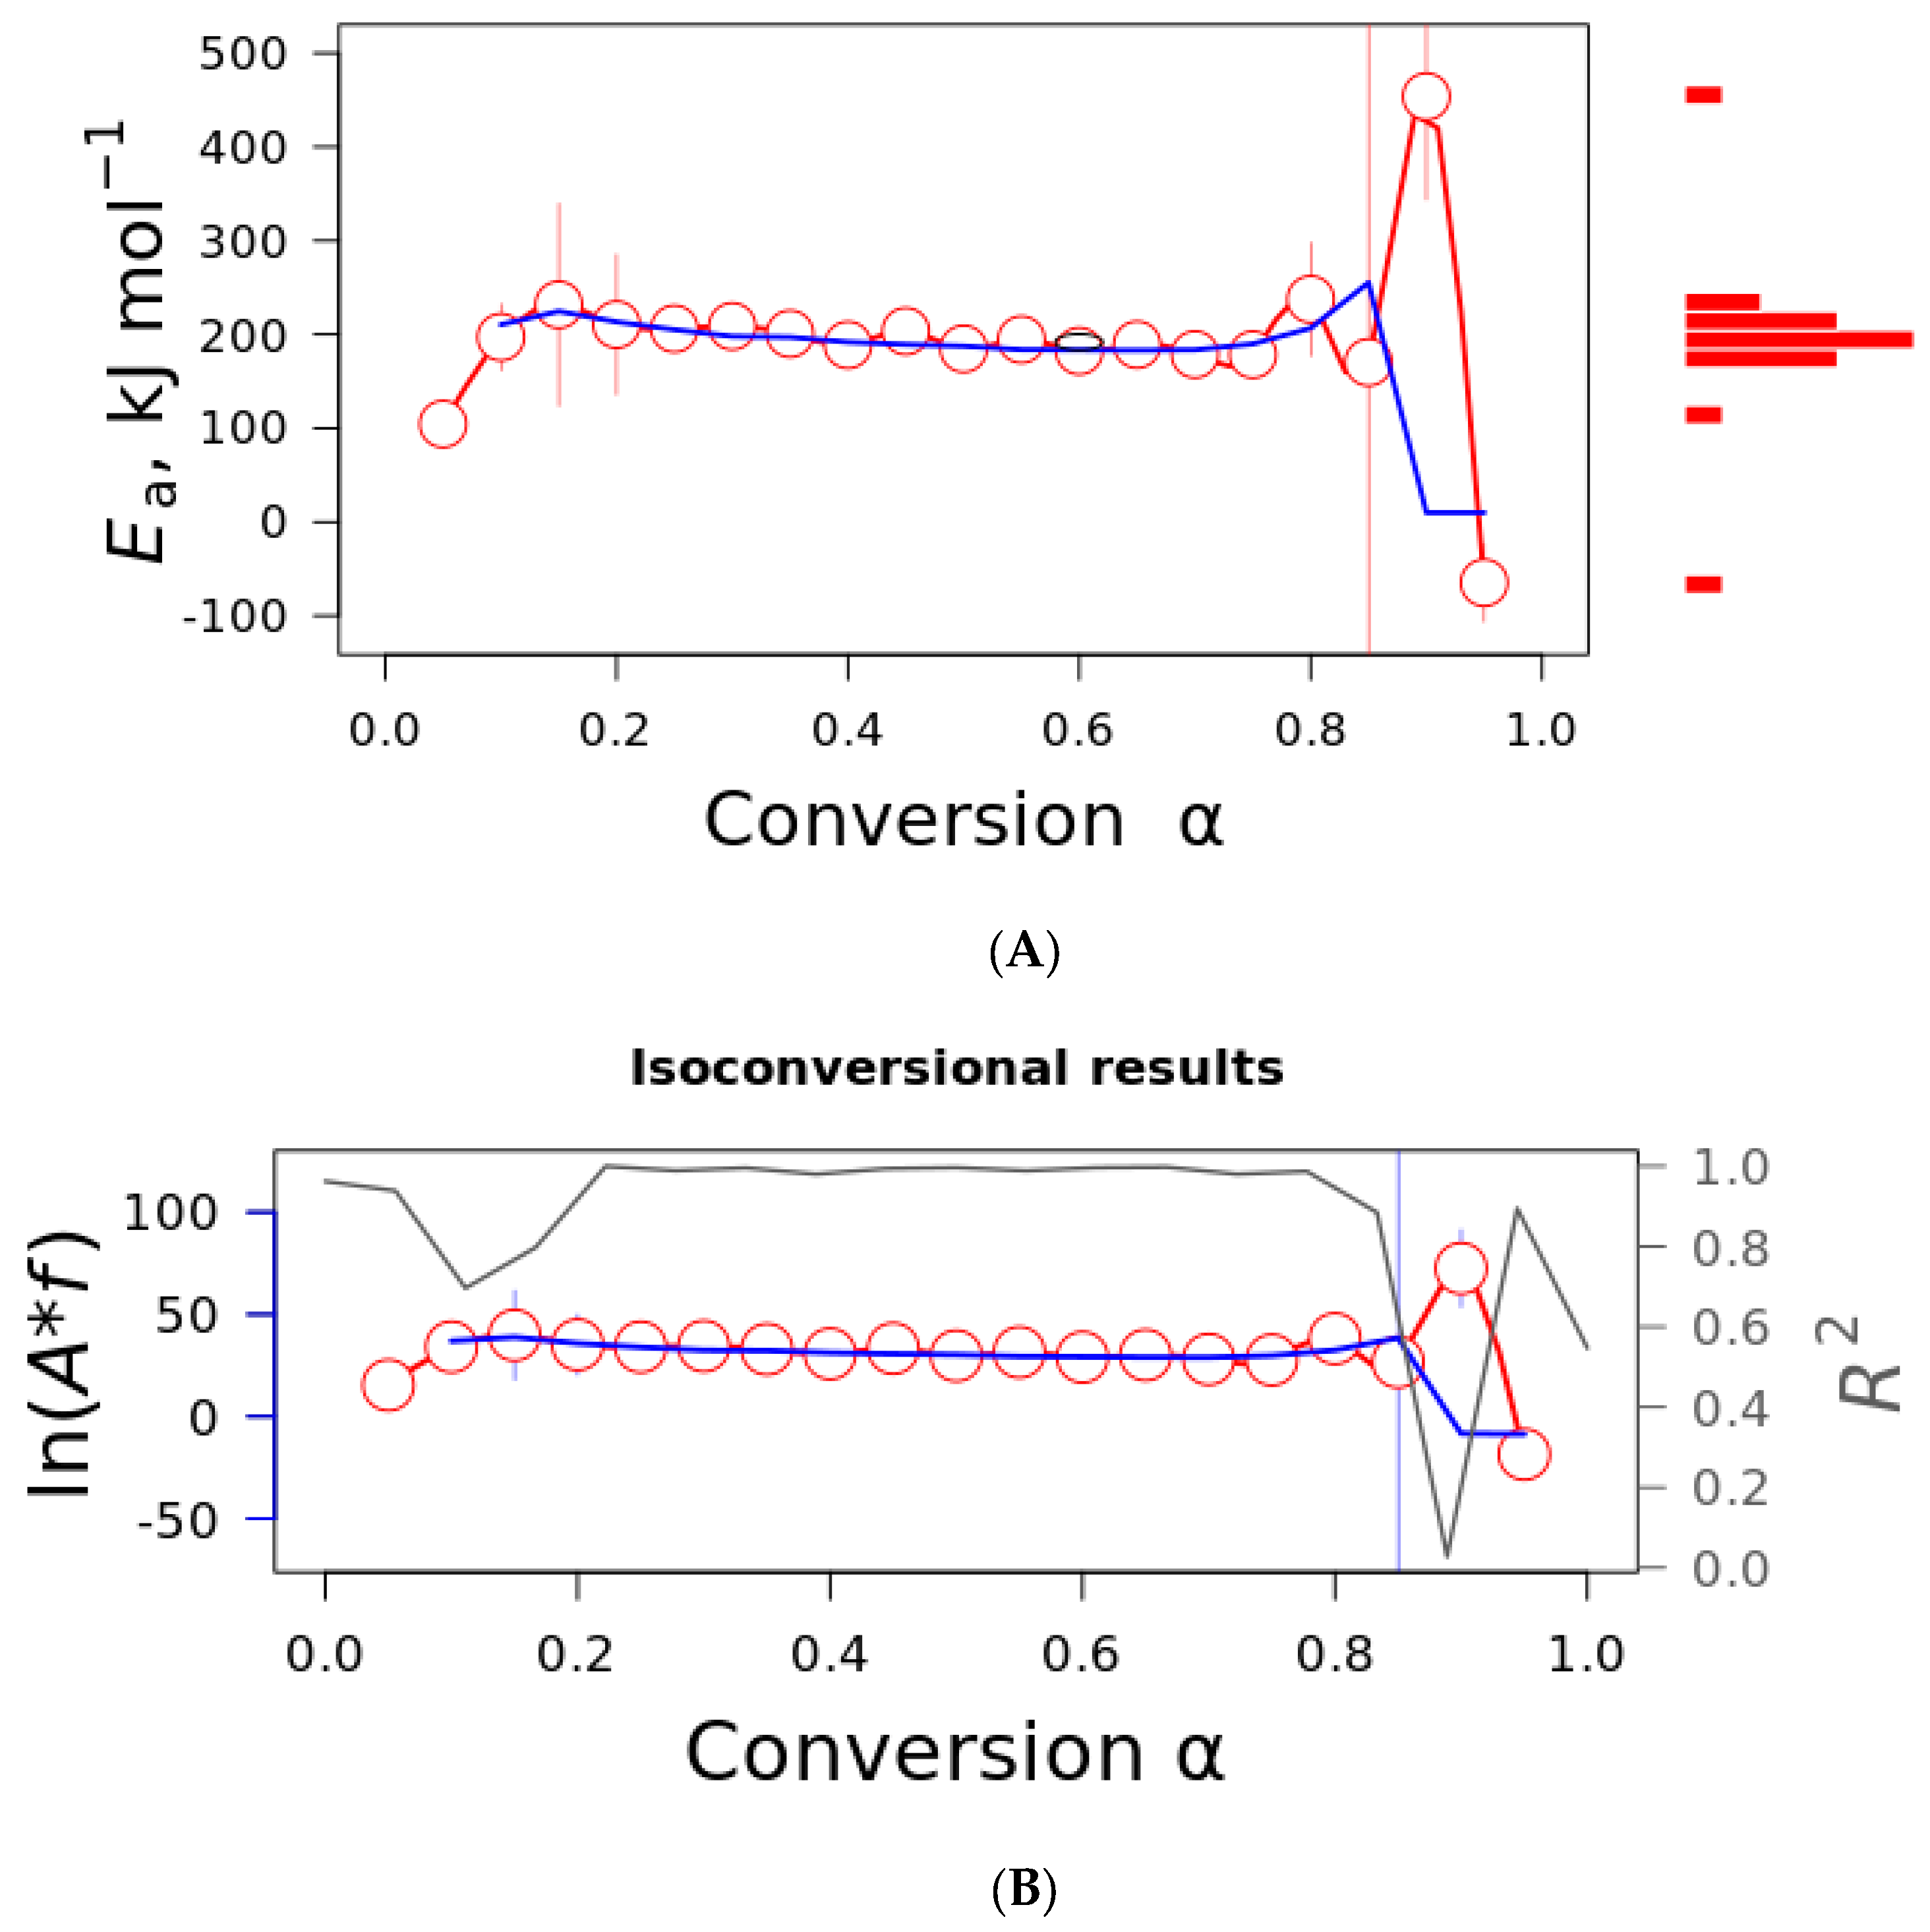
The isoconversional plot representing the activation energy and the pre-exponential factor using the Friedman (red line) and Vyazovkin (blue line) models is presented in
Figure 6. As visualized in
Figure 5, both parameters are constant in the conversion range α = 0.2–0.8. Only the curves for curaua fiber are presented to save space. The other fibers presented similar results. The activation energy presented values in the order of 200 kJ·mol
−1, and similar results were obtained for the individual cellulose component [
18]. The pre-exponential factor also presented constant values in the same conversion range (40 s
−1). It was observed that the values were quite similar in the conversion range α = 0.2–0.8.
For both parameters (activation energy and pre-exponential), a dependence of parameters can be noted with the conversion degree in the conversion range α of 0.2 to 0.8 (also visualized by the R
2). The linearity of both parameters is indicative of a single-step mechanism that can be associated with cellulose compounds, as demonstrated by Ornaghi Jr. et al. [
18]. In the study, the authors determined the kinetic parameters of isolated cellulose, hemicellulose, lignin, extractive, and the respective chars and claimed that the activation energy of the plant fibers had similar values to the cellulose component, i.e., cellulose plays a major role in the activation energy values.
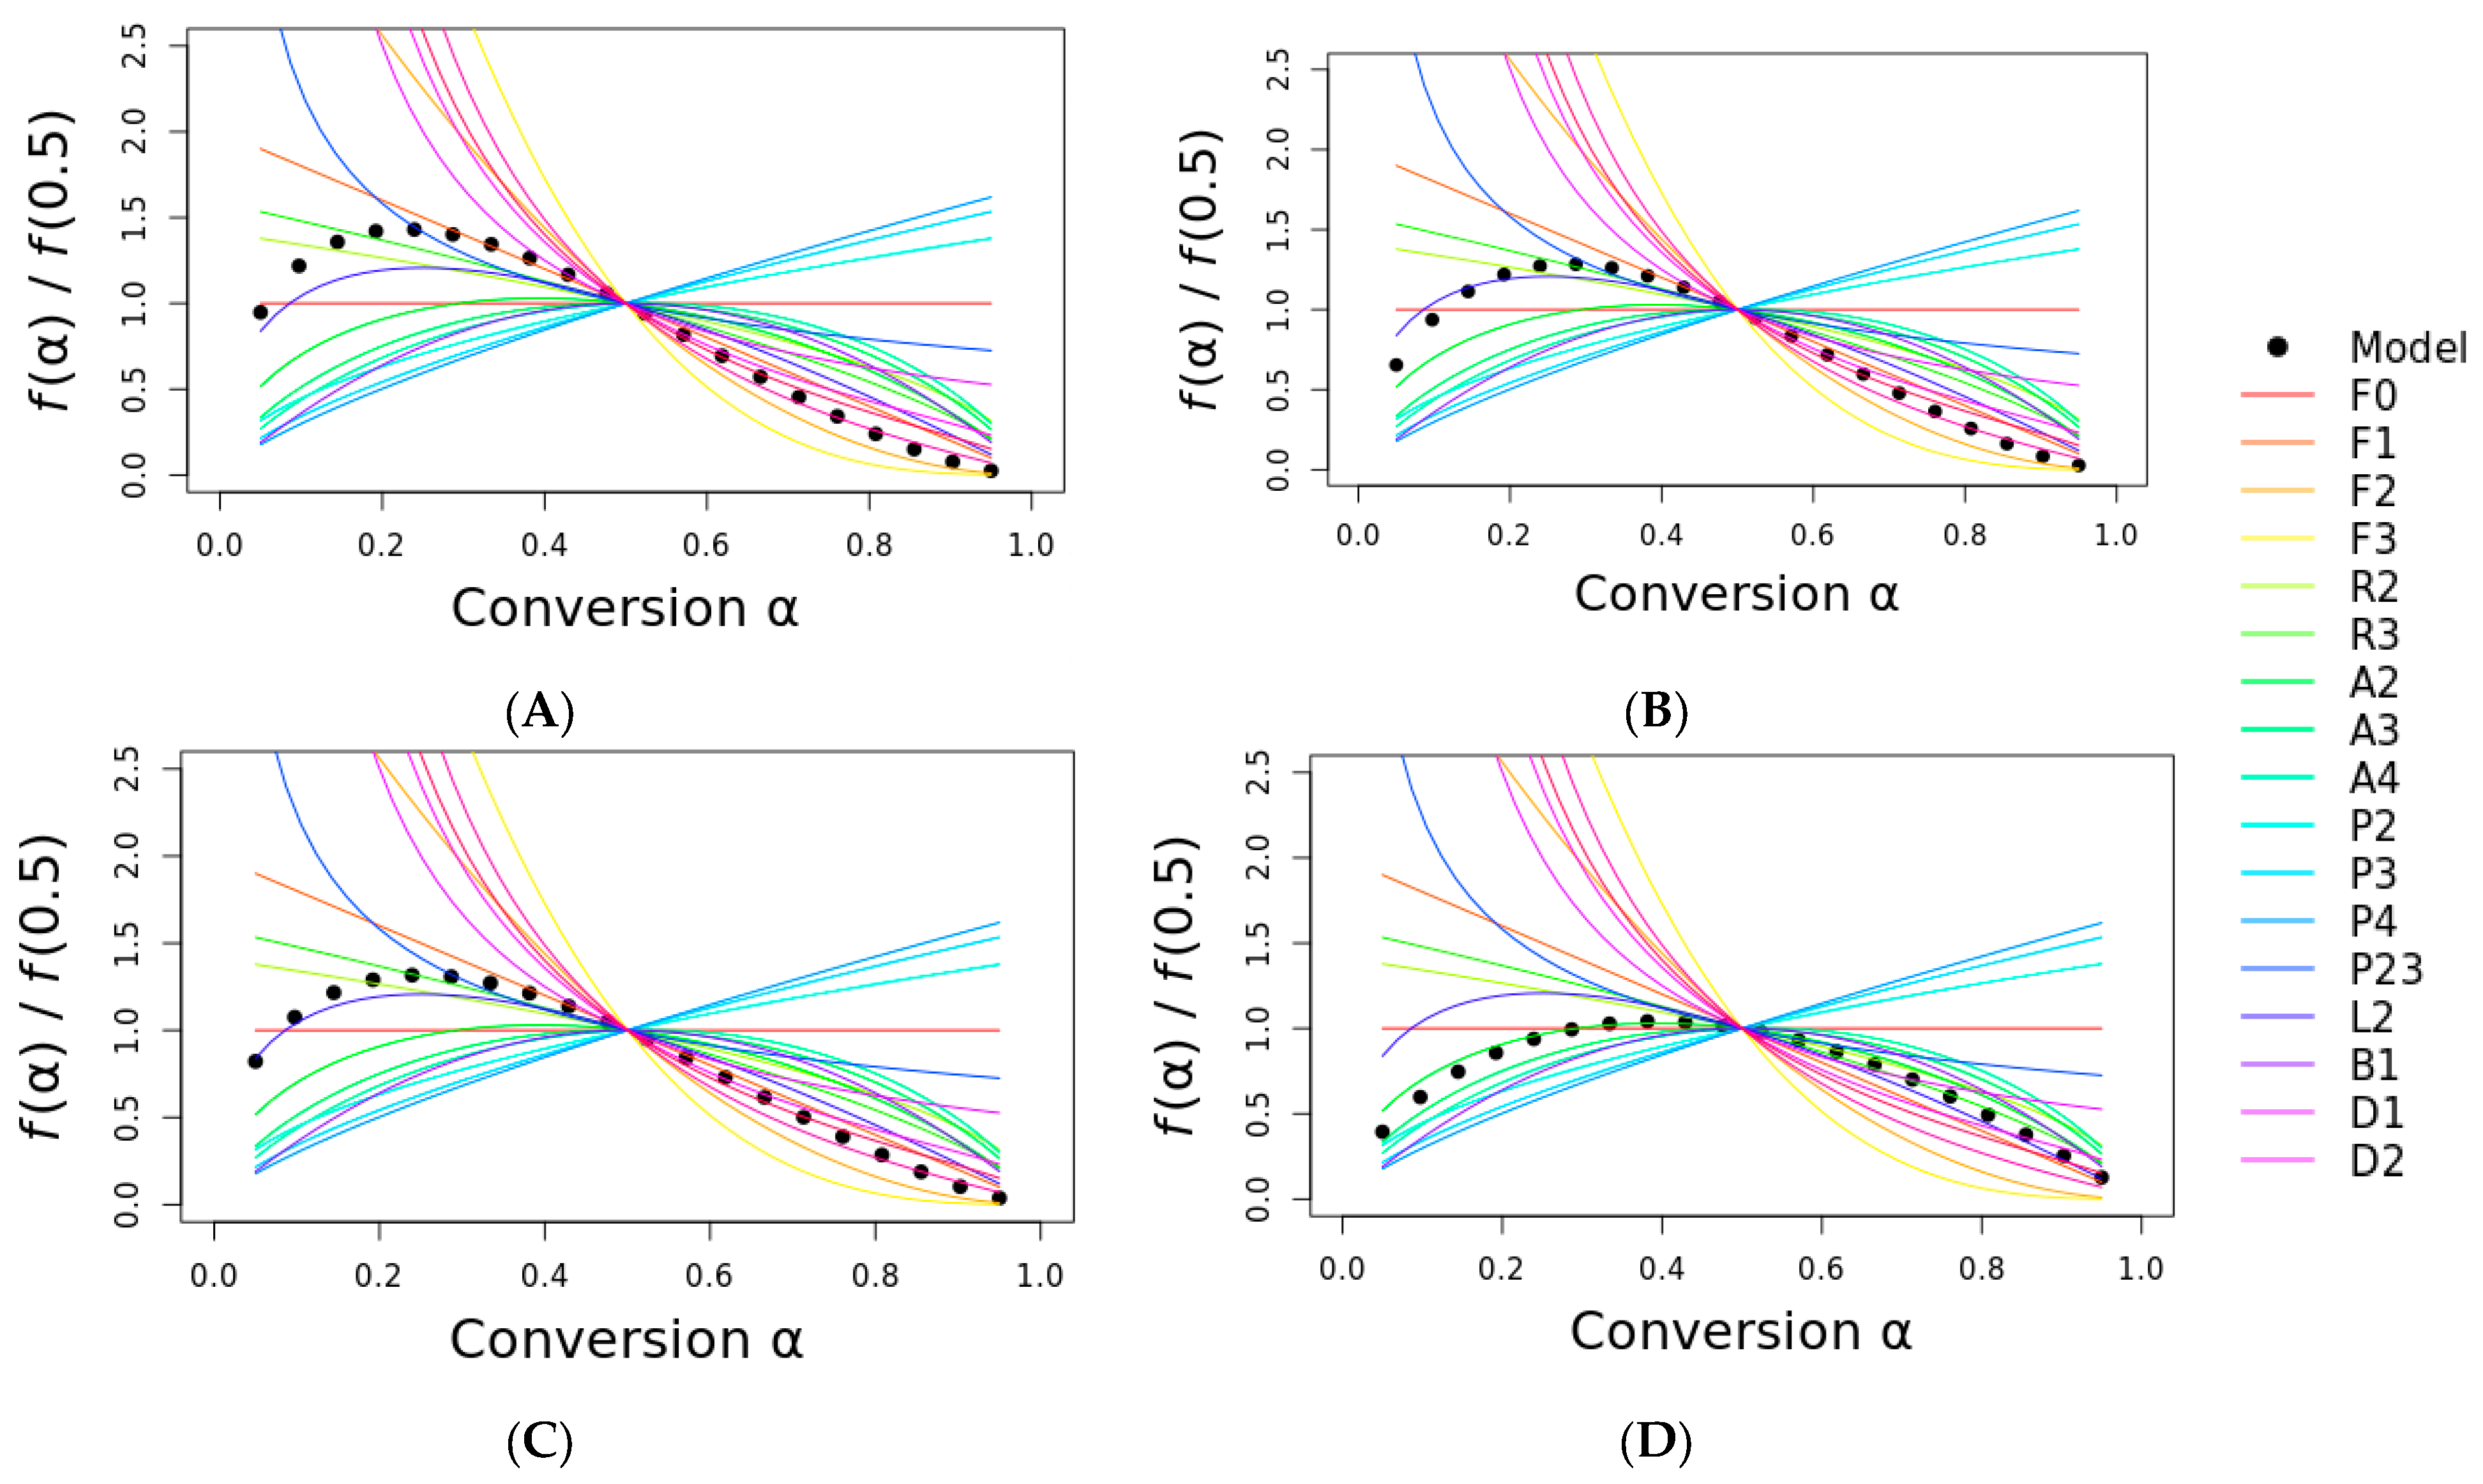
Since both the Ea and A do not vary with α, the existence of a single-step mechanism over the conversion range was considered. The single-step mechanism was used by linear regression using some selected models to plot and determine the most probable reaction mechanism. The dots represent the experimental curve of curaua fiber, while the solid lines represent the theoretical models.
Figure 7 shows the masterplot of some reaction models (indicated by the color lines) with the experimental curves (represented by the black circles). It is noteworthy to mention that the most probable reaction mechanism was very difficult to determine, and it could drastically vary depending on the conversion degree range studied. The reason for this is that many reaction models follow similar mathematical approaches; hence, similar curves are expected. However, there is no definitive answer regarding the most probable reaction mechanism just by comparing the curves, though this approach can be useful because it can eliminate many inadequate models. The remaining models have to be carefully considered using phenomenological and physical approaches. To clarify, hypothetically, if a geometrical contraction model curve is similar to our curves, it must be discarded because it physically makes no sense for a natural fiber to follow this type of mechanism.
The most probable reaction mechanism can be divided into before and after 0.5, and it can be selected by both the proximity and similarity of the curve format. After α < 0.5, the curve was similar to the L2 mechanism, i.e., the autocatalytic mechanism for most plant fibers. This mechanism is also cited in the literature for these types of materials [
4,
9,
10,
15]. For α > 0.5, many mechanisms can be selected: F2, D2, D3, and D4, indicating that the diffusion and second-order reaction took place. These differences in the final conversion degree can be attributed to the complex structure of the three major components of the fibers, i.e., while cellulose plays the major role in the activation energy of the plant fibers (and seems to influence the reaction mechanism up to α = 0.5), cellulose, hemicellulose, and lignin seem to directly influence the reaction mechanism of the plant fibers. Also, due to the complex pyrolysis process of the fibers, it is expected to have a wide range of possibilities regarding the reaction mechanisms as the degradation proceeds. In the case of ramie fiber, the most probable reaction mechanism in α up to 0.5 was the Kolmogorov–Johnson–Mehl–Avrami nucleation growth model.
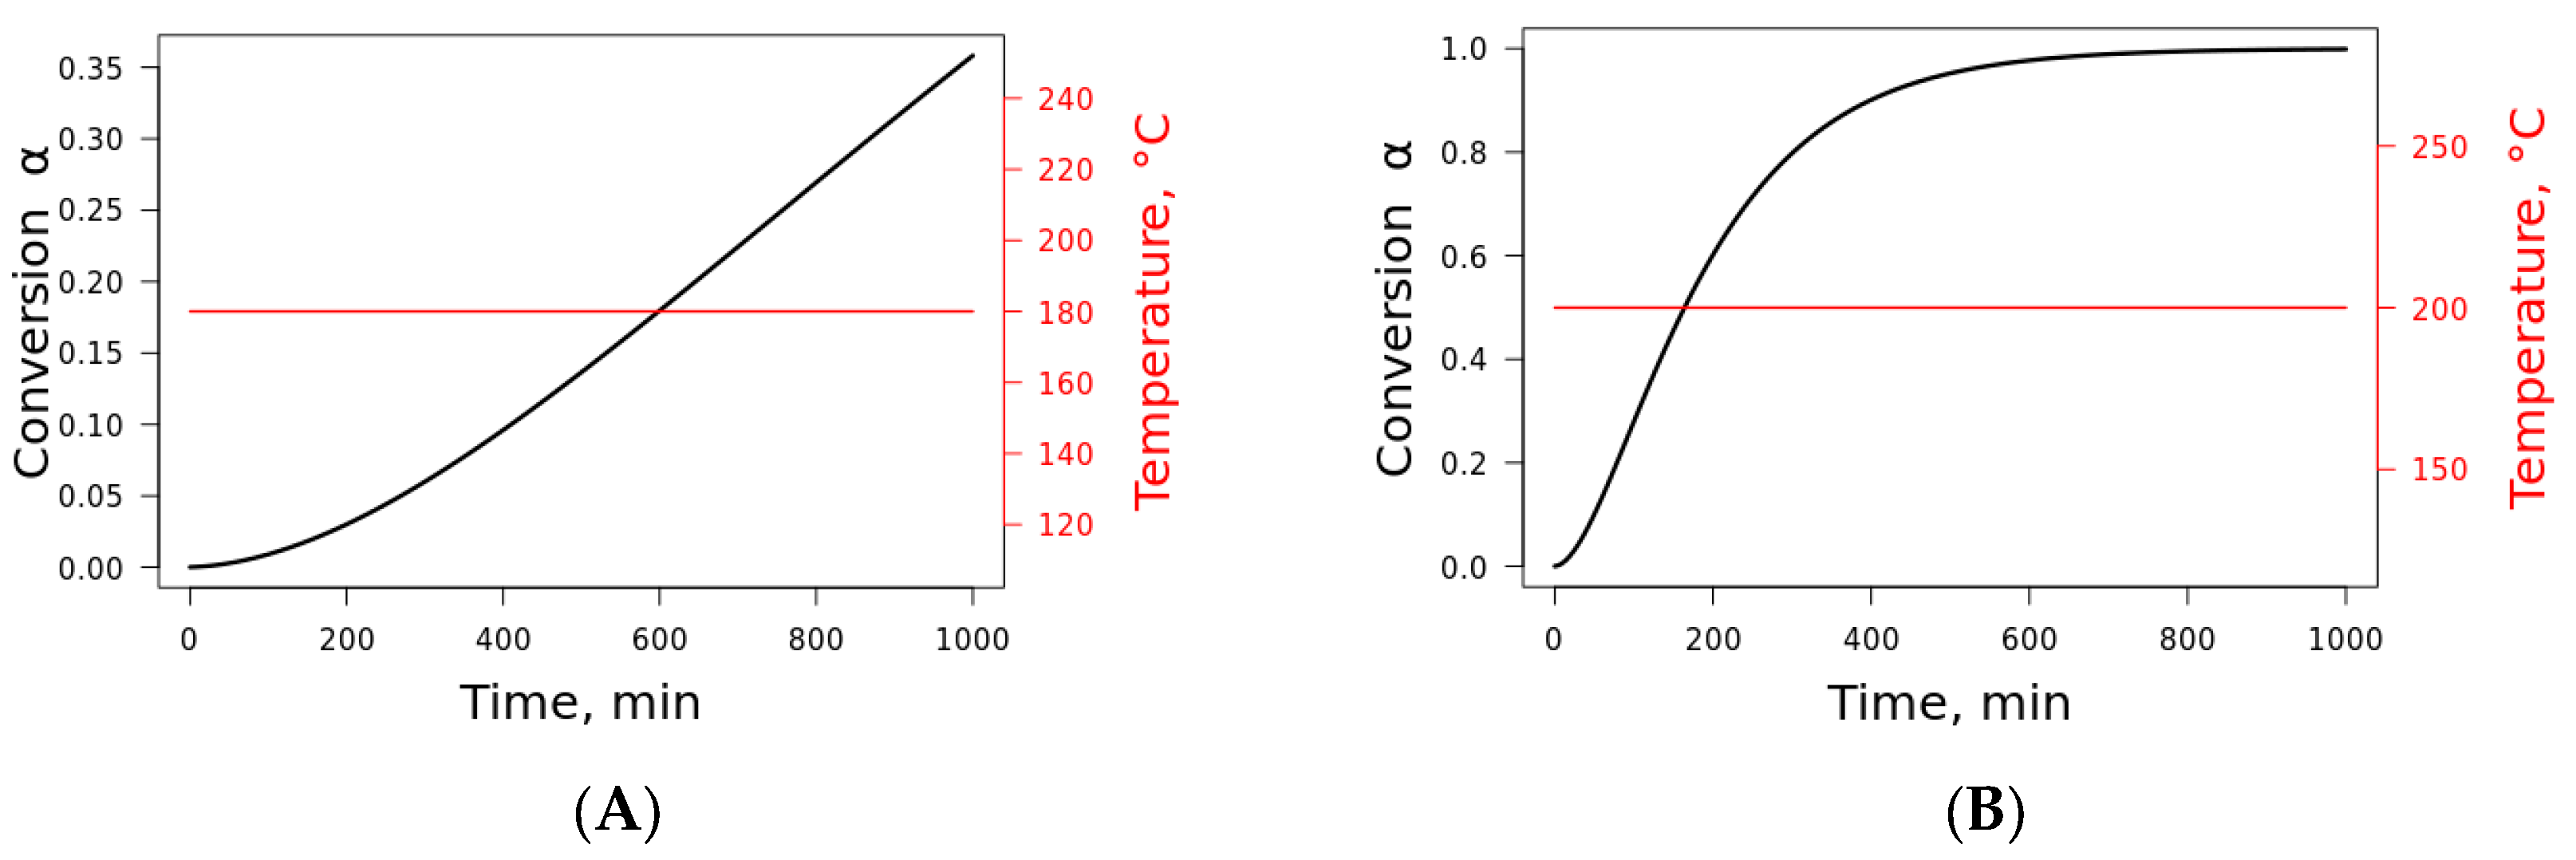
Finally, with the determination of the kinetic triplet, the lifetime prediction (
Figure 8) of the plant fibers can be determined. Since similar values were obtained for the plant fibers, the lifetime prediction was presented at two distinct isothermal temperatures for jute fiber at a 0% conversion degree. These conditions were chosen because the fibers are highly used as a reinforcement in composite materials where the structural integrity of the composite has to be maintained, as well as thermal behavior under certain applications. Hence, it is plausible that the fiber has to maintain its total integrity (at the 0% conversion degree) for the application temperature (temperatures located on the thermal stability plateau). This temperature cannot exceed the use temperature. It is noteworthy to mention that the lifetime prediction is highly dependent on the Arrhenius parameters. Once the activation energy, pre-exponential factor, number of degradation steps, kinetic model for the model fitting (parallel reaction, consecutive reaction, etc.), reaction order, and so on are assumed, the curves at certain conversion degrees and temperatures are given. Here, we preferred to assume that these parameters were the same for all fibers. Blanco [
29] studied the lifetime prediction of polymers and stated that there are discrepancies in the lifetime prediction at low and high temperatures, even when using well-established kinetics models, due to differences in the induction period, mainly at high temperatures. Bazzo et al. [
30] studied
Caesalpinia ferrea as a potential biomass for the production of biochar. The authors estimated the lifetime prediction of the fiber using nonisothermal conditions in TGA and using the Arrhenius kinetic parameters. The results were compared with the isothermal conditions, and the results obtained were satisfactory.

