
Article

Effect of Supplementing Physical Rehabilitation with Electrostimulation in People with Obesity: A Randomized Controlled Trial

1
SMR Nutrition Adulte, Fondation Ildys, Presqu’île de Perharidy, 29680 Roscoff, France
2
Delegation à la Recherche Clinique et à l’Innovation (DRCI), Groupement des Hôpitaux de L’institut Catholique de Lille, 59462 Lomme, France
*
Author to whom correspondence should be addressed.
Obesities 2026, 6(4), 55; https://doi.org/10.3390/obesities6040055
Submission received: 2 June 2026 / Revised: 3 July 2026 / Accepted: 8 July 2026 / Published: 17 July 2026

Abstract

Background: Regular physical activity is recommended for obesity management, but adherence remains difficult for many patients. Neuromuscular electrical stimulation (EMS) has been proposed as an adjunctive intervention. Methods: In this prospective, single-center, randomized controlled trial, adults with severe or morbid obesity (BMI ≥ 35 kg/m2) enrolled in a three-week inpatient rehabilitation program were randomized 1:1 to rehabilitation program alone (control group) or rehabilitation supplemented with EMS (5 sessions/week, 20 min/session, 75 Hz). Outcomes assessed at admission and discharge included body composition, lipid and glucose metabolism, continuous glucose monitoring, physical capacity, quality of life, adherence, and safety. Results: Both groups showed significant improvements in BMI, waist circumference, body composition, lipid and carbohydrate profiles, and physical performance assessed by the 6 min walk test, without significant between-group differences. BMI decreased by −0.9 kg/m2 in controls and −1.2 kg/m2 in the EMS group (both p < 0.001). Waist circumference also decreased significantly in both groups. EMS showed a potential effect on continuous glucose monitoring parameters, but this was no longer significant after adjustment for diabetes status. Conclusions: Adding EMS to inpatient rehabilitation did not provide additional benefits for weight loss or body composition.)

1. Introduction

Overweight and obesity are defined as abnormal or excessive fat accumulation and are considered major risk factors for many non-communicable diseases such as type II diabetes, cardiovascular disease, joint problems and certain cancers [1,2,3]. Obesity also has a considerable impact on an individual’s psychological state and generates considerable medical and social costs [4,5]. Prescribing regular physical activity is one of the recommendations for treating obesity; however, implementing this recommendation is often challenging for affected individuals. Three factors contribute to this challenge. First, the prescribed activities are often poorly matched to the individual’s preferences. Second, despite their efforts, individuals do not see concrete results in terms of weight loss. Third, a lack of objective criteria to achieve limits self-management. These factors contribute to a sense of failure, which discourages continued engagement. In addition, people with obesity may have concomitant orthopedic disorders and cardiovascular contraindications, and their excessive weight may push them into a sedentary lifestyle. Therefore, recommendations on physical activity as part of the overall management of obesity are not always applicable.
Neuromuscular electrical stimulation (EMS) involves inducing muscle contractions via electrodes placed on the skin and could be a valuable adjunctive tool in the management of obesity. EMS is most commonly used for muscle strengthening in athletes, but it is also used clinically to treat muscle spasms, prevent or delay muscle atrophy, and provide localized pain relief [6,7]. The benefits of EMS for obesity have been little evaluated. One study evaluated the effect of EMS on waist circumference in adults with abdominal obesity. The 12-week program moderately reduced waist circumference with no side effects [8]. Another study suggested that EMS combined with physical activity could reduce body fat [9]. However, other studies found only small effects and that EMS alone does not improve body composition [10,11]. Despite this, some evidence suggests that EMS could improve glucose metabolism in individuals with obesity and type 2 diabetes, including postprandial and fasting blood glucose levels, HbA1c, and insulin secretion levels, indicating reduced insulin resistance [12]. The aim of this study was to evaluate the effects of EMS as a supplement to a rehabilitation program on body composition, lipid and carbohydrate profiles, physical ability and quality of life in adults with severe or morbid obesity during a 3-week inpatient physical rehabilitation and nutritional education program.

2. Materials and Methods

2.1. Design

We conducted a prospective, randomized, controlled, single-center study. Participants were enrolled between May 2021 and June 2023 from the center of Perharidy, Fondation Ildys, Roscoff, France. The study was approved by the French national ethics committee (No. 2020-A00484-35 CPP Sud Est). The study complied with the MR001 reference methodology of the French Data Protection Authority (CNIL). Informed consent was obtained prior to any protocol procedure. The study was registered on ClinicalTrials.gov (NCT04643899) and is reported according to the CONSORT guidelines.

2.2. Sample

2.2.1. Recruitment

Potentially eligible individuals were identified from pre-admission records for inpatient physical and nutritional rehabilitation. In the month prior to their admission, and no less than 10 days before, they received an information letter followed by a telephone call from a clinical research nurse at the investigation center who presented the study to them verbally and answered their questions, without any request for consent. During the medical consultation conducted at admission to the rehabilitation program, the investigating physician presented the study and answered any questions.

2.2.2. Inclusion Criteria

Participants had to be aged between 18 and 70 years on the date of signing the consent form, with morbid or severe obesity (BMI > 35) and admitted for a 3-week physical rehabilitation and nutritional education program. We excluded individuals with epilepsy, peripheral arterial disease, abdominal or inguinal hernia, cardiac arrhythmia, skin lesions or infections at the EMS electrode placement sites, implanted electronic devices (pacemaker or defibrillator) or those who were pregnant.

2.3. Intervention

After signing informed consent, participants were randomly assigned by an electronic system in a 1:1 ratio to either the control or intervention group and stratified according to diabetes status. The control group underwent usual care, which included 5 sessions/week of hydrotherapy, 5 to 10 sessions/week of adapted physical activities (the number and type depended on the capabilities and preferences of each participant), 5 sessions/week of Nordic walking and tailored nutrition counseling. The EMS group also underwent the usual care program and, in addition, had 5 20 min sessions/week (total 14 sessions) of EMS. The EMS sessions consisted of 2 min of warm-up, 15 min of work at 75 Hz, followed by 3 min of recovery. The Compex Pro Rehab® device, (Enovis Corporation, Mouguerre, France) was used with 4 large Dura-Stick Plus® electrodes (5 × 10 cm) (Enovis Corporation, France) applied to the thighs. The participant could increase the intensity of the stimulation to the highest tolerable level, with the aim of inducing muscle contraction; the intensity levels were recorded by the physiotherapist during the sessions. The intensity varied between participants and also across sessions for a given participant.

2.4. Variables Evaluated

The number and type of adverse effects were collected throughout the stay. In the EMS group, tolerance to stimulation was evaluated by rating pain on a visual analog scale from 0 to 10, as well as the maximum muscle stimulation intensity during each session.
Adherence to the standard physical rehabilitation program was evaluated in both groups by comparing the number of sessions completed to the number initially planned.
Body composition (fat mass, lean mass and basal metabolic rate) was measured at the beginning and end of the study using bioelectrical impedance analysis (Bodystat Quadscan 4000©, Bodystat Ltd., Sulby, Isle of Man, British Isles). Additional assessments included body weight and BMI, biceps and triceps skinfold thickness (JIMCO, Skinfold Caliper©, GIMA S.p.A, Gessate, Italy), and waist and cervical circumferences.
Biochemical analyses were performed at the start and end of the program, including the lipid profile (total cholesterol, HDL, LDL and triglycerides), glycemic profile (HbA1c and fasting blood glucose), and levels of creatine phosphokinase (CPK) and lactate.
The 6 min walk test (6MWT) was administered at the beginning and end of the program, following the guidelines of the American Thoracic Society and the European Respiratory Society [13].
Quadriceps strength and the endurance time of a submaximal contraction [14] were measured using a MICROFET 2 TM© dynamometer (Hoggan Scientific, Salt Lake City, UT, USA).
The Quality of Life Obesity and Dietetic (QOLOD) self-report questionnaire [15] was administered at the beginning and end of the program to evaluate quality of life.
Participants underwent continuous glucose monitoring using a FreeStyle® device (Abbott France, Rungis, France) during the 3-week rehabilitation program. We assessed the percentage of time spent within the target range, the percentage of time spent above and below the target range, the mean blood glucose level, and the number of hypoglycaemic episodes. Target values were defined according to frailty status based on the French Health Authority guidelines: 3.9–9.9 mmol/L for robust individuals (without frailty criteria) and 4.4–11 mmol/L for those with one or more frailty criteria [16].

2.5. Sample Size

This study was a pilot, “proof-of-concept” study. Insufficient data were available in the literature to estimate the effect of the experimental intervention (muscle electrostimulation) in the target population (adults with obesity). Given the number of potentially eligible individuals, we set the sample size at 30 participants per group.

2.6. Statistical Analysis

We conducted a descriptive analysis of the data, presenting means and standard deviations for quantitative data with a normal distribution, medians and interquartile ranges for quantitative data without a normal distribution, and counts and frequencies for qualitative variables.
Baseline comparability of the two groups was assessed using Student’s t-test for normally distributed quantitative data or the Mann–Whitney–Wilcoxon test otherwise; for qualitative data, the Chi-squared test or Fisher’s exact test was used according to Cochran’s rule.
Change from program start to end was calculated for each group and compared between groups using bivariate analysis: Student’s t-test for normally distributed quantitative data or the Mann–Whitney-Wilcoxon test otherwise; and the Chi-squared test or Fisher’s exact test for qualitative data, according to Cochran’s rule.
A sensitivity analysis adjusting for baseline values and accounting for group allocation and stratification (diabetes) was performed using multiple regression models.
The percentage of time outwith the glycemic target range was analyzed using a mixed linear model (β-regression), with fixed effects for group (intervention) and diabetes stratum, and a random effect for the participant. p-values were estimated using permutation tests due to violations of normality and homoscedasticity assumptions in the model residuals.
A significance threshold of 5% was applied to all analyses. Statistical analyses were performed using R software (version 4.0.5). The statistical analysis was conducted by the Biostatistics Unit of the Clinical Research and Innovation Delegation at GHICL.

3. Results

3.1. Sample

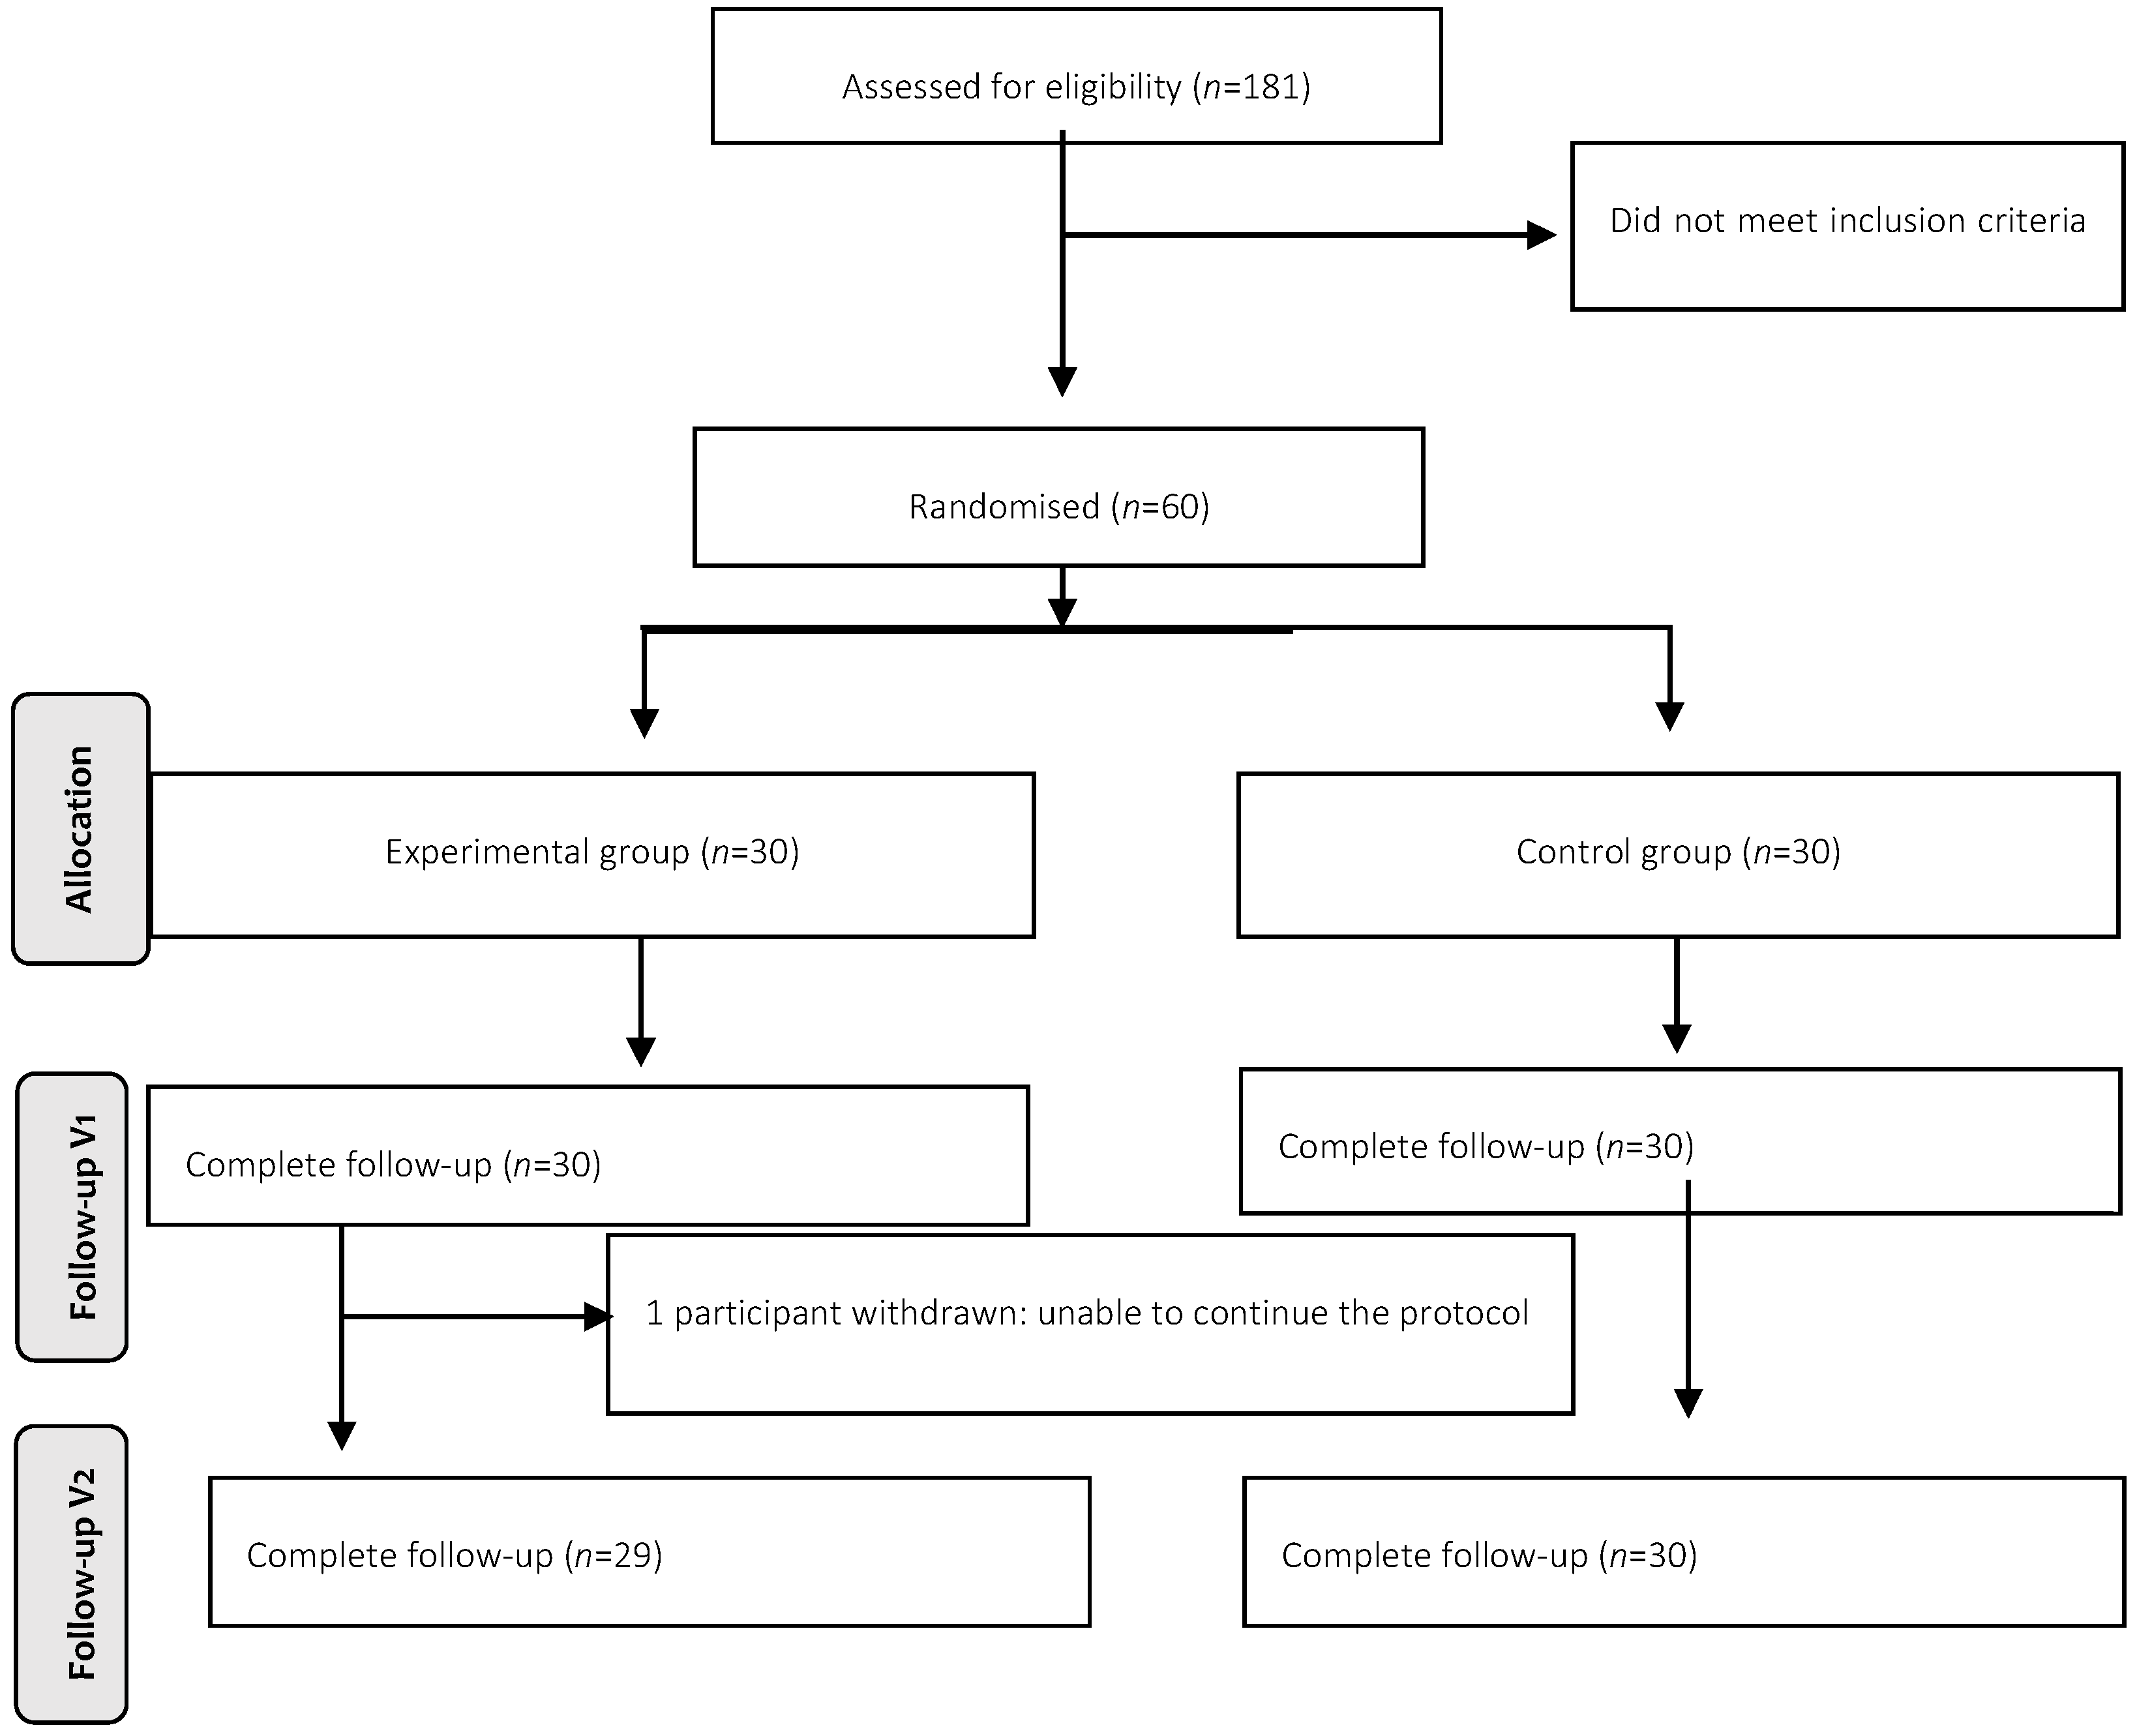
The CONSORT participant flow diagram is shown in Figure 1. Of 181 potentially eligible individuals, 60 fulfilled the inclusion criteria and were randomized and considered in the intention-to-treat population: 30 in the control and 30 in the interventional group. One participant in the intervention group was withdrawn from the study by the investigator’s decision prior to its completion and therefore did not attend all scheduled visits.
The control and intervention groups did not differ in terms of sex ratio, age or baseline comorbidities (Table 1).

3.2. Tolerance and Adherence to the Program

Nine AEs occurred in nine distinct patients, with no significant difference in frequency between the groups (Table 2). Only one adverse event, ‘digestive discomfort during the EMS session’, was considered as severe in the EMS group. No AE was considered to be related to the intervention according to the investigators.
Adherence to the physical activity program was excellent (95 à 100%) in both groups, with no between-group difference in the ratio of completed/planned sessions (Table 3). EMS sessions were generally well tolerated with low pain ratings (median VAS 0.3 [0; 2.23]) for median intensities of 66.9 mA [40.6; 82.6] (Table 4). Only three participants failed to achieve muscle contraction during one session each. An increase in creatine phosphokinase (CPK) and lactate could indicate muscle damage; however, no increase was observed from admission to discharge.

3.3. Body Composition and Anthropometric Variables

The BMI decreased by −0.9 kg/m2 [−1.4; −0.7] in the control group and by −1.2 kg/m2 [−1.8; −0.5] in the EMS group. The waist circumference decreased by −3.1 ± 4.4 cm in the control group and −3.2 ± 5.5 cm in the EMS group. The fat mass decreased by −2.4 kg [−4.3; −1.3] in the control group and −2.5 kg [−5.1; −1] in the EMS group. The basal metabolism also decreased. No between-group differences were found for any variable (Table 5 and Table 6).

3.4. Lipid Profile and Glucose Metabolism

At the end of the program, significant improvements were found in the lipid profile (reduction in triglycerides, total cholesterol, and LDL cholesterol) and glucose metabolism markers (significant decrease in HbA1c and fasting blood glucose) in both groups, with no between-group differences (Table 7).
Subgroup analysis of the participants with diabetes found a decrease in Hb1ac in both groups between admission and discharge (control group −0.3% [−0.6; −0.2], p = 0.004; EMS group −0.5% [−0.6; −0.2], p = 0.002), with no between-group difference. Fasting glucose levels decreased significantly only in the EMS group (EMS group −0.9 mmol/L [−1.4; −0.3], p = 0.033) but not in the control group −1 [−2.1; −0.1] p = 0.109) (Table 7); however, the between-group comparison remained non-significant (p = 0.37).
When analyzing the time spent within the target range and continuous glucose levels using the Freestyle® continuous monitoring system, bivariate analysis revealed a significant association between the intervention variable and mean blood glucose (p = 0.005, Wilcoxon signed-rank test) in the overall sample. The mean ± SD glucose level decreased by 0.44 ± 0.22 mmol/L more in the EMS than the control group; however, a higher number of hypoglycaemic episodes occurred in the EMS group (Table 8). However, after adjustment for the diabetes stratum using an interaction-based ANOVA model, the effect of the EMS on mean glucose levels was no longer statistically significant (p = 0.08). In the diabetes subgroup, the time spent in the target range and the mean glucose did not differ between the groups (Table 8).

3.5. Physical Ability

Distance walked on the 6MWT increased from the start to the end of the program in both groups: +55 m [20; 87] in the control group (p < 0.001) and +35 m [22.8; 60] in the EMS group (p < 0.001), with no between-group difference in change (p = 0.16). No desaturation or change in heart rate occurred.
Right and left quadriceps strength increased only in the EMS group at the end of the program; however, the difference was only significant for the left limb (left +6.6 Nm [−5.8; 42.5] p = 0.049) (right +8 Nm [−18.5; 30.5] p = 0.34). The endurance of the submaximal contraction only improved in the control group (+8 s on the right and the left, but it was only significant on the left). No between-group differences were found (Table 9).

3.6. Quality of Life

None of the sub-dimensions of the QOLOD (physical, psychosocial, sex life or comfort with food and diet experience) improved in either group from the start to the end of the program (Table 10).

4. Discussion

This study found no benefit of supplementing physical rehabilitation with EMS during a 3-week inpatient physical rehabilitation program for individuals with severe or morbid obesity, as measured by BMI, body composition, the lipid profile, or fasting blood glucose.
However, the rehabilitation program itself, which included physical activity and nutrition education, had a major positive impact on all participants. Significant reductions were observed in BMI and waist circumference, along with an improved fat/lean mass distribution, lipid profile, and glycemic profile, and improved physical ability as measured by the 6MWT, which may have caused a ceiling effect. There may have been a limited scope for detecting additional benefits from EMS. In our population with severe to morbid obesity (median BMI 42.6 kg/m2 [38.2–45.7]), adding five 20 min EMS sessions per week did not confer further benefit over standard care. The only effect of the EMS was an improvement in the mean glucose measurement in the participants. However, this effect was no longer statistically significant after adjustment for diabetes status.
Some evidence suggests that EMS could aid weight loss by creating a calorie deficit. A study of nine overweight individuals found that 60 min of EMS corresponded to a physical activity level of 4 ± 0.8 METS, resulting in an energy expenditure ranging from 200 à 600 kcal/h [17]. This is comparable to the energy used during a 20 min walk at 5 km/h.
Several studies have previously evaluated body composition using dual-energy X-ray absorptiometry (DEXA) or bioelectrical impedance analysis before and after EMS programs in individuals with overweight or obesity. Most reported no significant changes in BMI or body composition compared to control groups [8,10], individuals with diabetes [11,18] or healthy individuals [19]. Only 1 study found an improvement in body composition with a reduction in fat mass and an increase in lean mass in non-overweight individuals when EMS was combined with resistance exercise [9]. Other studies found slight reductions in fat mass percentage after 8 weeks (6 sessions per week) in men with diabetes [20,21] with or without a change in total weight. In the present study of individuals with obesity with or without diabetes, neither the decrease in BMI nor the change in body composition was affected by the additional EMS.
It is well established that during physical exercise, muscle contraction through endurance and resistance efforts effectively improves insulin sensitivity [22]. In vitro studies in isolated rat muscles have shown that muscle contraction induced by electrical stimulation increases glucose uptake [23]. It has been suggested that the increase in glucose uptake during involuntary muscle contraction induced by electrical stimulation is partly attributable to the preferential activation of type II glycolytic fibers, independent of insulin [24]. Therefore, as an alternative therapeutic approach, the potential of EMS to improve glycemic control through induced muscle contractions is particularly promising for individuals who are less likely or unable to engage in regular physical activity, or who are insulin resistant. A recent meta-analysis [12] clearly highlights the benefits of EMS in reducing fasting blood glucose, improving insulin sensitivity [25] and improving glycemic control [26], especially in people with metabolic syndrome, type 2 diabetes, or obesity [19,20]. However, none of these studies included a control group that participated in a comprehensive care program with inpatient physical rehabilitation and nutritional education. Our 3-week program improved fasting blood glucose and HbA1c levels, but these variables were not significantly enhanced by the addition of EMS. Nonetheless, a distinct effect of EMS was observed on average blood glucose levels, monitored continuously using the Freestyle® Holter device, in the overall sample (diabetic and non-diabetic), although this improvement was not statistically significant within the diabetic subgroup.
The absence of a specific EMS effect in our study was not due to poor adherence or a lack of efficacy in inducing muscle contractions, as both parameters were closely monitored. EMS sessions were well tolerated across all participants, with no adverse effects imputable to EMS, reported regardless of sex—contrasting with Maffiuletti’s findings, which highlighted reduced tolerance to neuromuscular electrical stimulation in individuals with obesity, especially women [27].
We found no improvement in quality of life at the end of the program in either group in any of the domains evaluated (physical, psychosocial, sex life and comfort with food and diet experience) over the 3-week period, despite using the QOLOD questionnaire that is specific for people with obesity and overweight [15]. A recent meta-analysis examining the impact of physical exercise on quality of life and psychological outcomes found general improvements in most physical components, vitality, and mental health [28]. However, aspects such as body image and life satisfaction were rarely assessed. Notably, most of the included studies used the SF-36 questionnaire and involved physical exercise interventions that were significantly longer than ours, ranging from 8 to76 weeks. Improvement in quality of life, as measured by the QOLOD questionnaire, may be correlated with the stage of behavioral change [29]. A 3-week inpatient stay may not be sufficient to capture such changes. For instance, the item “impact on sexual life” cannot be meaningfully assessed in a hospital setting. It would have been more appropriate to evaluate quality of life after a follow-up period, as the true challenge lies in ensuring that individuals commit to an exercise program and adhere to long-term changes in dietary habits.

Limitations

Beyond the relatively small sample size, the main limitation of this study is the short follow-up period of only three weeks. Indeed, our comparison is essentially based on just 15 sessions of EMS versus standard care. A longer outpatient study conducted in real-life conditions might better highlight more significant differences.

5. Conclusions

In individuals with severe to morbid obesity, this study found that supplementing a 3-week inpatient physical rehabilitation and nutritional education program with EMS sessions did not enhance outcomes, aside from a modest improvement in glycemic control; however, the difference observed in the continuous glucose monitoring parameters was no longer statistically significant after adjustment for diabetes status.

Author Contributions

Conceptualization, L.S. and M.-A.S.; methodology, C.P.; formal analysis, C.P.; investigation, M.G. (Mélodie Garot) and M.G. (Madeline Gate); writing—original draft preparation, L.S., M.-A.S. and M.B.; writing—review and editing, L.S. and M.B.; supervision, M.B. All authors have read and agreed to the published version of the manuscript.

Funding

This research received no external funding.

Institutional Review Board Statement

The study was conducted in accordance with the Declaration of Helsinki, and approved by French national ethics committee No. 2020-A00484-35 CPP Sud Est (Approval date: 11 March 2020). The study complied with the MR001 reference methodology of the French Data Protection Authority (CNIL). The study was registered on ClinicalTrials.gov (NCT04643899) and is reported according to the CONSORT guidelines.

Informed Consent Statement

Informed consent was obtained prior to any protocol procedure from all subjects involved in the study.

Data Availability Statement

Data available upon request to the corresponding author.

Conflicts of Interest

Authors Lena Seite, Mélodie Garot, Madeline Gate, Marion Buyse and Marie-André Salaun are employed by the SMR Nutrition Adulte. The remaining authors declare that the research was conducted in the absence of any commercial or financial relationships that could be construed as a potential conflict of interest.

References

  1. Apovian, C.M. Obesity: Definition, comorbidities, causes, and burden. Am. J. Manag. Care 2016, 22, s176–s185. [Google Scholar] [CrossRef] [Scilit] [PubMed]
  2. Ebbert, J.O.; Elrashidi, M.Y.; Jensen, M.D. Managing overweight and obesity in adults to reduce cardiovascular disease risk. Curr. Atheroscler. Rep. 2014, 16, 445. [Google Scholar] [CrossRef] [Scilit] [PubMed]
  3. Sarma, S.; Sockalingam, S.; Dash, S. Obesity as a multisystem disease: Trends in obesity rates and obesity-related complications. Diabetes Obes. Metab. 2021, 23, 3–16. [Google Scholar] [CrossRef] [Scilit] [PubMed]
  4. Nagi, M.A.; Ahmed, H.; Rezq, M.A.A.; Sangroongruangsri, S.; Chaikledkaew, U.; Almalki, Z.; Thavorncharoensap, M. Economic costs of obesity: A systematic review. Int. J. Obes. 2024, 48, 33–43. [Google Scholar] [CrossRef] [Scilit] [PubMed]
  5. Locatelli, L.; Boulanouar, L.; Pataky, Z.; Golay, A. Quand le poids influence la santé mentale… et réciproquement [When Weight Influences Mental Health… and Reciprocally]. Rev. Med. Suisse 2017, 13, 642–646. [Google Scholar] [CrossRef] [Scilit] [PubMed]
  6. Lake, D.A. Neuromuscular electrical stimulation. An overview and its application in the treatment of sports injuries. Sports Med. 1992, 13, 320–336. [Google Scholar] [CrossRef] [Scilit] [PubMed]
  7. Sheffler, L.R.; Chae, J. Neuromuscular electrical stimulation in neurorehabilitation. Muscle Nerve 2007, 35, 562–590. [Google Scholar] [CrossRef] [Scilit] [PubMed]
  8. Choi, E.J.; Kim, Y.J.; Lee, S.Y. Effects of Electrical Muscle Stimulation on Waist Circumstance in Adults with Adbominal Obesity: A Randomized, Double-blind, Sham-Controlled Trial. JNMA J. Nepal Med. Assoc. 2018, 56, 904–911. [Google Scholar] [CrossRef] [Scilit] [PubMed]
  9. Lee, M.-C.; Ho, C.-S.; Hsu, Y.-J.; Wu, M.-F.; Huang, C.-C. Effect of 8-week frequency-specific electrical muscle stimulation combined with resistance exercise training on muscle mass, strength, and body composition in men and women: A feasibility and safety study. PeerJ 2023, 11, e16303. [Google Scholar] [CrossRef] [Scilit] [PubMed]
  10. Galvan, M.J.; Sanchez, M.J.; McAinch, A.J.; Covington, J.D.; Boyle, J.B.; Bajpeyi, S. Four weeks of electrical stimulation improves glucose tolerance in a sedentary overweight or obese Hispanic population. Endocr. Connect. 2022, 11, e210533. [Google Scholar] [CrossRef] [Scilit] [PubMed]
  11. Poole, R.B.; Harrold, C.P.; Burridge, J.H.; Byrne, C.D.; Holt, R.I.G. Electrical muscle stimulation acutely mimics exercise in neurologically intact individuals but has limited clinical benefits in patients with type 2 diabetes. Diabetes Obes. Metab. 2005, 7, 344–351. [Google Scholar] [CrossRef] [Scilit] [PubMed]
  12. Sanchez, M.J.; Mossayebi, A.; Sigaroodi, S.; Apaflo, J.N.; Galvan, M.J.; Min, K.; Agullo, F.J.; Wagler, A.; Bajpeyi, S. Effects of neuromuscular electrical stimulation on glycemic control: A systematic review and meta-analysis. Front. Endocrinol. 2023, 14, 1222532. [Google Scholar] [CrossRef] [Scilit] [PubMed]
  13. ATS Committee on Proficiency Standards for Clinical Pulmonary Function Laboratories. ATS statement: Guidelines for the six-minute walk test. Am. J. Respir. Crit. Care Med. 2002, 166, 111–117. [Google Scholar] [CrossRef] [Scilit] [PubMed]
  14. Bachasson, D.; Villiot-Danger, E.; Verges, S.; Hayot, M.; Perez, T.; Chambellan, A.; Wuyam, B. Maximal isometric voluntary quadriceps strength assessment in COPD. Rev. Mal. Respir. 2014, 31, 765–770. [Google Scholar] [CrossRef] [Scilit] [PubMed]
  15. Ziegler, O.; Filipecki, J.; Girod, I.; Guillemin, F. Development and validation of a French obesity-specific quality of life questionnaire: Quality of Life, Obesity and Dietetics (QOLOD) rating scale. Diabetes Metab. 2005, 31, 273–283. [Google Scholar] [CrossRef] [Scilit] [PubMed]
  16. HAS. Stratégie Thérapeutique du Patient Vivant avec un Diabète de Type 2. 2024. Available online: https://www.has-sante.fr/upload/docs/application/pdf/2024-06/strategie_therapeutique_du_patient_vivant_avec_un_diabete_de_type_2_-_recommandations.pdf (accessed on 10 October 2025).
  17. Grosset, J.-F.; Crowe, L.; De Vito, G.; O’Shea, D.; Caulfield, B. Comparative effect of a 1 h session of electrical muscle stimulation and walking activity on energy expenditure and substrate oxidation in obese subjects. Appl. Physiol. Nutr. Metab. 2013, 38, 57–65. [Google Scholar] [CrossRef] [Scilit] [PubMed]
  18. van Buuren, F.; Horstkotte, D.; Mellwig, K.P.; Fründ, A.; Vlachojannis, M.; Bogunovic, N.; Dimitriadis, Z.; Vortherms, J.; Humphrey, R.; Niebauer, J. Electrical Myostimulation (EMS) Improves Glucose Metabolism and Oxygen Uptake in Type 2 Diabetes Mellitus Patients—Results from the EMS Study. Diabetes Technol. Ther. 2015, 17, 413–419. [Google Scholar] [CrossRef] [Scilit] [PubMed]
  19. Porcari, J.P.; McLean, K.P.; Foster, C.; Kernozek, T.; Crenshaw, B.; Swenson, C. Effects of electrical muscle stimulation on body composition, muscle strength, and physical appearance. J. Strength Cond. Res. 2002, 16, 165–172. [Google Scholar] [CrossRef] [Scilit] [PubMed]
  20. Giggins, O.M.; Crowe, L.; Coughlan, G.F.; Caulfield, B. Neuromuscular electrical stimulation exercise: A potential alternative to conventional exercise in the management of type 2 diabetes. Br. J. Diabetes 2017, 17, 46–51. [Google Scholar] [CrossRef] [Scilit]
  21. Miyamoto, T.; Iwakura, T.; Matsuoka, N.; Iwamoto, M.; Takenaka, M.; Akamatsu, Y.; Moritani, T. Impact of prolonged neuromuscular electrical stimulation on metabolic profile and cognition-related blood parameters in type 2 diabetes: A randomized controlled cross-over trial. Diabetes Res. Clin. Pract. 2018, 142, 37–45. [Google Scholar] [CrossRef] [Scilit] [PubMed]
  22. Hansen, P.A.; Nolte, L.A.; Chen, M.M.; Holloszy, J.O. Increased GLUT-4 translocation mediates enhanced insulin sensitivity of muscle glucose transport after exercise. J. Appl. Physiol. 1998, 85, 1218–1222. [Google Scholar] [CrossRef] [Scilit] [PubMed]
  23. Nikolić, N.; Bakke, S.S.; Kase, E.T.; Rudberg, I.; Flo Halle, I.; Rustan, A.C.; Thoresen, G.H.; Aas, V. Electrical pulse stimulation of cultured human skeletal muscle cells as an in vitro model of exercise. PLoS ONE 2012, 7, e33203. [Google Scholar] [CrossRef] [Scilit] [PubMed]
  24. Roy, D.; Jóhannsson, E.; Bonen, A.; Marette, A. Electrical stimulation induces fiber type-specific translocation of GLUT-4 to T tubules in skeletal muscle. Am. J. Physiol. 1997, 273, E688–E694. [Google Scholar] [CrossRef] [Scilit] [PubMed]
  25. Joubert, M.; Metayer, L.; Prevost, G.; Morera, J.; Rod, A.; Cailleux, A.; Parienti, J.-J.; Reznik, Y. Neuromuscular electrostimulation and insulin sensitivity in patients with type 2 diabetes: The ELECTRODIAB pilot study. Acta Diabetol. 2015, 52, 285–291. [Google Scholar] [CrossRef] [Scilit] [PubMed]
  26. Miyamoto, T.; Fukuda, K.; Kimura, T.; Matsubara, Y.; Tsuda, K.; Moritani, T. Effect of percutaneous electrical muscle stimulation on postprandial hyperglycemia in type 2 diabetes. Diabetes Res. Clin. Pract. 2012, 96, 306–312. [Google Scholar] [CrossRef] [Scilit] [PubMed]
  27. Maffiuletti, N.A.; Morelli, A.; Martin, A.; Duclay, J.; Billot, M.; Jubeau, M.; Agosti, F.; Sartorio, A. Effect of gender and obesity on electrical current thresholds. Muscle Nerve 2011, 44, 202–207. [Google Scholar] [CrossRef] [Scilit] [PubMed]
  28. Carraça, E.V.; Encantado, J.; Battista, F.; Beaulieu, K.; Blundell, J.E.; Busetto, L.; van Baak, M.; Dicker, D.; Ermolao, A.; Farpour-Lambert, N.; et al. Effect of exercise training on psychological outcomes in adults with overweight or obesity: A systematic review and meta-analysis. Obes. Rev. 2021, 22, e13261. [Google Scholar] [CrossRef] [Scilit] [PubMed]
  29. Romain, A.J.; Bernard, P.; Attalin, V.; Gernigon, C.; Ninot, G.; Avignon, A. Health-related quality of life and stages of behavioural change for exercise in overweight/obese individuals. Diabetes Metab. 2012, 38, 352–358. [Google Scholar] [CrossRef] [Scilit] [PubMed]
Figure 1. CONSORT participant flow diagram.
Obesities 06 00055 g001
Table 1. Sample characteristics at inclusion (n = 60).
Control Group (n = 30)EMS Group (n = 30)p-Value
SexFemale15 (50%)19 (63.3%)0.43
Male15 (50%)11 (36.7%)
Age (years), mean ± SD48.3 ± 15.246.1 ± 15.20.59
Sleep apnoea13 (43.3%)17 (56.7%)0.44
Arthropathy3 (10%)3 (10%)1
Asthma4 (13.3%)2 (6.7%)0.67
Gallstones3 (10%)2 (6.7%)1
Cancer0 (0%)2 (6.7%)0.49
Bariatric surgery3 (10%)2 (6.7%)1
NASH-related cirrhosis2 (6.7%)2 (6.7%)1
Depression11 (36.7%)12 (40%)1
Diabetes12 (40%)13 (43.3%)1
Dyslipidaemia13 (43.3%)11 (36.7%)0.79
Cardio-vascular event5 (16.7%)5 (16.7%)1
Hypertension14 (46.7%)13 (43.3%)1
Urinary incontinence2 (6.7%)1 (3.3%)1
Gastro-oesophageal reflux7 (23.3%)9 (30%)0.77
Table 2. Description of adverse events during the study.
Control Group (n = 30)EMS Group (n = 29)p-Value
Number of participants with at least 1 adverse event 3 (10%)6 (20%)0.47
Number of adverse events 36
Severity of adverse eventsMild0 (0%)1 (16.7%)1
Moderate3 (100%)4 (66.7%)
Severe0 (0%)1 (16.7%)
Table 3. Adherence to the program.
Control Group (n = 30)EMS Group (n = 29)p-Value
Adapted physical
activity
Ratio sessions
competed/planned (%)
95.4 [82.6; 100]94.8 [82; 99.1]0.88
Balnéotherapy
activity
Ratio sessions
competed/planned (%)
100 [83.3; 100]100 [87.7; 100]0.86
Nordic walkingRatio sessions
competed/planned (%)
100 [100; 100]100 [100; 100]1
Table 4. EMS tolerance variables and creatine phosphokinase and lactate levels at the start (V1) and end (V2) of the rehabilitation program.
Number of ParticipantsMedian [Q1, Q3]MinMax
Pain (visual analog scale)290.3 [0; 2.23]07
Maximum stimulation intensity (mA)2966.9 [40.6; 82.6]11.5180.36
V1V2p-Value
Creatine phosphokinase (UI/L)112 [65; 186]108 [64.2; 199.2]0.072
Lactates (mmol/L)1.1 [0.8; 1.7]1.3 [0.9; 1.6]0.871
Table 5. Anthropometric evaluation between admission (V1) and discharge (V2).
Control Group (n = 30)EMS Group (n = 29)
V1V2V2-V1Within-Group
Difference (p-Value)
V1V2V2-V1Within-Group
Difference
(p-Value)
Between Group Difference
(p-Value)
BMI43 [38.2; 45.2]42.2 [37.5; 44.1]−0.9 [−1.4; −0.7]<0.00142.2 [39; 45.7]41.6 [37.5; 45.2]−1.2 [−1.8; −0.5]<0.0010.87
Bicipial skinfold (mm)28 [25; 35]33 [25.2; 35]5 [−1.7; 10]0.06530 [25; 37]30 [25; 32.5]0 [−5.7; 6.5]10.38
Tricipial skinfold (mm)35 [30; 45]35 [32.7; 40]−2 [−5; 15]0.55235 [30; 50]35 [25; 45.2]0 [−6.5; 10]0.3460.18
Waist circumference (cm)132.7 ± 14.1129.9 ± 14.2−3.1 ± 4.40.002131.6 ± 13.7128.1 ± 11.6−3.2 ± 5.50.0120.95
Neck circumference (cm)44 [41; 48]44.2 [39.8; 47.1]1 [−0.6; 2]0.15743.5 [41; 46]43.5 [40; 46]−1 [−0.4; 1.4]0.0610.81
Table 6. Body composition evolution between admission (V1) and discharge (V2).
Control Group (n = 30)EMS Group (n = 29)
V1V2V2-V1Intra
Group
Difference
V1V2V2-V1Intra
Group
Difference
Between Group
Difference
Body fat (%)45.3 [39; 49.7]44.4 [37.2; 48.4]−1.1 [−2; −0.3]0.01746.4 [43; 52.4]46.5 [40.4; 51.1]−0.9 [−2; 0.1]0.0190.79
Body fat (Kg)54.7 [43.9; 64]51.5 [39.8; 61.5]−2.4 [−4.3; −1.3]<0.00152.4 [47.6; 63.9]53.3 [46.5; 61.6]−2.5 [−5.1; −1]<0.0010.99
Lean mass (%)54.6 [50.3; 60.9]55.6 [51.5; 62.8]1.1 [0.3; 2]0.00753.5 [47.6; 56.9]53.5 [48.9; 59.6]0.9 [−0.1; 2]0.0190.74
Lean mass (Kg)65.7 [55.9; 76.8]63.9 [55.7; 76.8]−0.4 [−1.4; 1]0.50162.8 [55.3; 76.1]65.5 [53; 76.1]−0.8 [−1.7; 0.2]0.0200.31
Total body water (%)40.9 [36.8; 45.6]41.9 [37.4; 46.7]0.8 [−0.1; 1.6]0.09139.9 [36.2; 44.4]40.5 [37; 45.1]0.7 [−0.5; 1.4]0.1110.72
Total body water (Kg)48.8 [41.9; 58.2]48.7 [40.6; 57.9]−0.2 [−1.5; 1.8]0.81946.6 [40.8; 55.2]46.4 [40.5; 55.1]−0.9 [−1.6; 0.1]0.0440.32
Dry lean mass (Kg)16.2 [14.1; 18.7]16.3 [14.2; 18.7]0.1 [−0.1; 0.3]0.23516.3 [11.8; 19.1]16.6 [12.1; 19.2]0.1 [−0.1; 0.2]0.5870.68
Basal metabolic rate (kcal/day)2009 [1798; 2316]1978 [1777; 2242]−28.5 [−51.8; −18.8]<0.0011924 [1732; 2318]1906 [1715; 2277]−29 [−58; −18]<0.0010.85
Table 7. Lipid and glycemic profiles: Admission (V1) vs. Discharge (V2).
Control Group (n = 30)EMS Group (n = 29)p-Value
V1V2V2-V1Intra
Group
Difference
V1V2V2-V1Intra
Group
Difference
Between Group
Difference
Triglycerides (mmol/L)1.6 [1.1; 2]1.3 [1.1; 1.7]−0.16 [−0.57; 0.06]0.0071.5 [1.4; 1.9]1.3 [1.1; 1.8]−0.2 [−0.4; −0.03]0.0020.64
Total cholesterol (mmol/L)4.5 [4.2; 5.3]3.9 [3.3; 4.3]−0.6 [−0.9; −0.3]<0.0015.1 [4.1; 5.8]4.1 [3.3; 4.8]−0.9 [−1.1; −0.5]<0.0010.26
HDL (mmol/L)1.1 [1; 1.4]1 [0.9; 1.2]−0.1 [−0.2; 0]<0.0011.1 [1; 1.3]1 [0.9; 1.2]−0.1 [−0.2; 0]0.0070.31
LDL (mmol/L)2.6 [2.2; 3.0]2.1 [1.6; 2.7]−0.5 [−0.7; −0.04]<0.0013.0 [2.4; 3.7]2.5 [1.5; 2.9]−0.6 [−0.9; −0.3]<0.0010.62
HbA1C (%)5.9 [5.5; 6.8]5.7 [5.4; 6.5]−0.2 [−0.3; −0.1]<0.0015.6 [5.1; 6.8]5.6 [5.2; 6.6]−0.2 [−0.4; 0]0.0020.39
Fasting blood glucose (mmol/L)5.8 [5.1; 6.6]5.1 [4.6; 5.8]−0.3 [−1; 0]0.0035.5 [4.7; 6.1]4.8 [4.3; 5.3]−0.3 [−0.9; 0]0.0050.21
Subgroup with diabetes—control (n = 12)Subgroup with diabetes—EMS (n = 13)
HbA1C (%)6.8 [6.3; 7.6]6.7 [6.1; 7.1]−0.3 [−0.6; −0.2]0.0047.5 [6.1; 8]6.8 [6; 7.4]−0.5 [−0.6; −0.2]0.0020.47
Fasting blood glucose (mmol/L)7.1 [5.9; 7.8]5.6 [5.3; 6.6]−1 [−2.1; −0.1]0.1096.2 [5.1; 7.7]5 [4.7; 6.6]−0.9 [−1.4; −0.3]0.0330.37
Table 8. Participants underwent continuous glucose monitoring using a FreeStyle® device during the 3-week rehabilitation program. The percentage of time spent within the target range, the percentage of time spent above and below the target range, blood glucose level (medians and interquartile ranges), and the number of hypoglycaemic episodes were recorded during the 3-week period. Target values were defined according to frailty status based on the French Health Authority guidelines: 3.9–9.9 mmol/L for robust individuals (without frailty criteria) and 4.4–11 mmol/L for those with one or more frailty criteria [15]. * Wilcoxon signed-rank test. Top part: Continuous Glucose Monitoring—Global population. Bottom part: Continuous Glucose monitoring- Diabetic patients (n = 25).
Control Group (n = 30)EMS Group (n = 29)p-Value *
Recordings above the target range (%)4.5 [1.1; 7.9]2 [0.3; 4.3]0.11
Recordings within the target range (%)62.7 [44.3; 78.5]60 [21; 69.7]0.1
Recordings below the target range (%)32.3 [12.8; 51]38.7 [19; 76]0.07
Mean glucose level (mmol/L)5.39 [5.06; 5.94]4.95 [4.84; 5.17]0.0055 *
Number of hypoglycaemic episodes4 12 0.039 *
Subgroup with diabetes-control (n = 12)Subgroup with diabetes-EMS (n = 13)p-Value *
Recordings above the target range (%)5.8 [2.8; 16]4 [1.8; 21.9]0.665
Recordings within the target range (%)62.7 [50.1; 71.9]63.3 [55.1; 69.9]0.91
Recordings below the target range (%)28.2 [8.4; 37.1] 27 [8.2; 41.4]0.68
Mean glucose level (mmol/L)5.88 [5.44; 6.32]4.95 [4.95; 6.6]0.128
Number of hypoglycaemic episodes4 12 0.156
Table 9. Physical capacity outcome from admission (V1) to discharge (V2).
Control Group (n = 30)p-ValueEMS Group (n = 29) p-Value
V1V2V2-V1Intra
Group
Difference
V1V2V2-V1Intra
Group
Difference
Between Group
Difference
Quadriceps Strength
Endurance right (s)47.5
[38.2; 70]
52
[49; 65]
8
[−9; 22]
0.19848.9
[39.2; 59]
50
[36.5; 73.5]
−4.8
[−21.5; 11.5]
0.4560.18
Endurance left (s)51.5
[35.2; 66]
51
[44.8; 71.5]
8.2
[11; 20.5]
0.04543.5
[38.2; 59]
48.5
[36.2; 61.5]
−1.7
[−23.2; 89]
0.7310.25
Strength right (N/m)143.5
[105.5; 166.5]
147
[122; 184]
1
[−15; 20]
0.697132.5
[104.5; 188.5]
144.2
[97; 214.5]
8
[−18.5; 30.5]
0.3400.58
Strenght left (N/m)139.5
[103.5; 180.5]
145
[110; 181]
0
[−20.8; 18]
0.882126
[81.5; 173.8]
147
[105.5; 212]
6.6
[−5.8; 42.5]
0.0490.069
6 min walk test
6 min walk distance (m)470
[421.2; 528]
514
[468; 575]
55
[20; 87]
<0.001445.5
[424.8; 544.2]
525.5
[441.5; 595.5]
35
[22.8; 60]
<0.0010.16
Table 10. Change in quality of life from the start (V1) to the end of the program (V2)—intention-to-treat population (n = 60).
Control Group (n = 30) EMS Group (n = 29)
QOLOD DimensionV1V2V2-V1Intra
Group
Difference
V1V2V2-V1Intra
Group
Difference
Between
Group
Difference
Physical impact45.5 [27.3; 60.8]47.7 [28.4; 70.4]1.1 [−10.8; 25]0.61735.2 [25.6; 56.2]45.5 [17; 71.6]−2.3 [−7.9; 13.6]0.7410.73
Psychosocial impact44.3 [31.8; 61.9]48.9 [19.9; 85.2]2.3 [−3.4; 20.4]0.16240.9 [25; 61.4]52.3 [20.4; 81.8]−2.3 [−7.4; 14.2]0.4130.38
Sexual life68.8 [31.2; 75]75 [21.9; 89.1]6.2 [−6.2; 12.5]0.35728.1 [0; 82.8]40.6 [0; 68.8]0 [−4.7; 0]0.8870.33
Food related well-being40 [31.2; 50]30 [22.5; 52.5]−5 [−16.2; 16.2]0.52342.5 [30; 55]45 [12.5; 65]−5 [−10; 7.5]0.4190.91
Diet experience55 [20; 71.2]60 [35; 80]0 [−12.5; 25]0.18550 [28.7; 66.2]60 [32.5; 77.5]0 [−5; 8.8]0.6240.67
Disclaimer/Publisher’s Note: The statements, opinions and data contained in all publications are solely those of the individual author(s) and contributor(s) and not of MDPI and/or the editor(s). MDPI and/or the editor(s) disclaim responsibility for any injury to people or property resulting from any ideas, methods, instructions or products referred to in the content.