1. Introduction
School feeding programs are policy instruments widely used to improve children’s nutritional status by providing food in the school environment. Peru’s National School Feeding Program, Qali Warma, was designed to address caloric deficits among students attending public schools, primarily at the preschool and primary levels but also at the secondary level in indigenous communities in the Amazon. In Peru, children may attend public preschool (nivel inicial) from age three, and attendance becomes compulsory at age four under national education law, so that in 2014–2018 an estimated 88% of 3-to-5-year-old children went to preschool, making this age group a natural target for school-based food interventions. By design, such programs can strengthen nutritional intake during the school day and support children’s development and learning. At the same time, international experience suggests that food-based interventions may generate unintended changes in weight outcomes, including overweight and obesity, depending on how the foods offered align with nutritional requirements, how they affect total caloric intake and diet quality, and how households adjust behaviors in response to the in-kind transfer. If school meals supplement rather than replace food already provided at home, total energy intake may rise even when the intervention is well-intentioned, a behavioral response that is especially relevant for young children, whose diets are largely shaped by caregivers’ decisions and constraints [
1,
2,
3].
This concern has become more salient as overweight and obesity have gained prominence as public health problems worldwide. Global evidence documents sustained increases in childhood overweight and obesity over the last two decades [
4]. In Peru, coexistence of undernutrition and excess weight, the double burden of malnutrition, has been well documented. Analyzing pooled ENDES data from 1996 to 2016, Pomati et al. (2021) found that double burden prevalence among Peruvian children reached 7% in 2016, representing over 200,000 affected children, with an increasing share attributable to maternal overweight coexisting with child undernutrition [
5]. Santos et al. (2021) further document that obesity has increased most rapidly in rural areas of Peru, where Qali Warma coverage is highest [
6]. In this evolving nutritional landscape, interventions historically justified by undernutrition risks must also be evaluated through the lens of excess weight. Early monitoring of weight status across diverse child populations and multicomponent interventions during the preschool years have been identified as key strategies through which to prevent excess weight gain [
7,
8].
Despite the policy relevance of this question, evidence on the effects of school feeding programs on childhood overweight and obesity remains limited and inconclusive. The most comprehensive recent synthesis, a Cochrane systematic review covering 40 studies and over 91,000 students, concludes that there may be little to no association between school feeding and overweight or obesity but rates the certainty of evidence as very low, based on only two studies measuring this outcome with heterogeneous approaches [
9]. Systematic reviews focused on low- and middle-income countries find significant improvements in weight-for-age but do not specifically examine adverse weight outcomes [
10]. In high-income countries, universal school meal programs have generally not been associated with higher BMI, and several studies report modest protective associations [
11]. In Latin America, a scoping review identified only nine eligible studies with inconclusive results, highlighting a notable disconnect between science and policymaking in the region [
12]. Crucially, none of these reviews examine how the nutritional composition and delivery format of meals, including whether they involve ultra-processed products, modulate weight outcomes, a gap that is particularly consequential in contexts like Peru, where program modalities differ markedly in food type and meal frequency.
A key feature of Qali Warma during the study period (2014–2018) is that it was not implemented as a single uniform intervention. The program operated under two distinct delivery modalities. The ration modality (modalidad raciones) delivered ready-to-eat, industrially manufactured products requiring no preparation: a breakfast consisting of an industrial beverage (enriched milk or milk with cereals) and a solid component (sweet breads, cookies, cereal bars, or bread with dairy, fruit, or egg). This modality was assigned to urban schools in poverty quintiles 3–5 with easy road access, where School Feeding Committees (CAEs) have limited cooking capacity. The product modality (modalidad productos) delivered primary-processed or minimally processed ingredients—including cereals, Andean grains (quinoa), legumes, dried meat, and canned fish—to CAEs for local preparation, drawing on eight alimentary regions defined by Qali Warma to reflect local culinary traditions. This modality served schools in poverty quintiles 1–2, indigenous Amazonian communities, and schools in quintiles 3–5 with difficult road access. Crucially, only the product modality could deliver both breakfast and lunch; the ration modality provided breakfast only. Lunch was assigned exclusively to schools in the two poorest quintiles. These differences involve meaningfully distinct food types: the solid components of the ration modality—i.e., sweet breads, cookies, and cereal bars—are consistent with the definition of ultra-processed food (NOVA Group 4) [
13], whose sustained consumption has been linked to weight gain and adverse metabolic outcomes in children, including in Latin American preschoolers of similar age [
14,
15]. By contrast, the product modality relies primarily on minimally processed ingredients (NOVA Groups 1–2). These operational differences generate meaningful variation in potential effects on weight outcomes.
Two complementary conceptual frameworks clarify the mechanisms through which school feeding may affect children’s weight. From an economics of nutrition perspective, school meals act as an in-kind transfer that relaxes household budget constraints and may alter food consumption patterns, with potentially unintended consequences if total energy intake rises or if the nutritional composition of provided foods shifts dietary quality unfavorably [
1,
2]. From a socio-ecological perspective, Bronfenbrenner’s framework emphasizes that children’s health behaviors are shaped by nested environments (individual, family, school, and community), and the effect of institutional food provision cannot be understood independently of household practices and local food environments [
16,
17]. Together, these frameworks predict that program effects on weight will be heterogeneous across delivery formats and household contexts, motivating a modality-specific analysis.
Against this backdrop, this study contributes to the evidence base on school feeding and childhood obesity by estimating the effects of exposure to Qali Warma, including its specific delivery modalities and service configurations, on the probability of obesity and excess weight among children aged 36–59 months in Peru. Using pooled cross-sectional data from the Demographic and Health Survey (ENDES) spanning 2014 to 2018 and a selection-on-observables identification strategy based on machine-learning generalized boosted model (GBM) propensity score weighting, we estimate average treatment effects on the treated (ATTs) and examine distributional patterns via quantile regression on the continuous weight-for-height z-score. The study explicitly distinguishes between receipt of rations versus products for preparation and between breakfast-only versus breakfast-plus-lunch configurations to identify which program designs are most consistent with obesity prevention in early childhood.
The remainder of the paper is organized as follows.
Section 2 describes the data sources, study population, outcome measures, and empirical strategy.
Section 3 presents the main results, including balance diagnostics, Probit estimates for obesity and excess weight, and distributional analyses.
Section 4 discusses the findings and their policy implications.
Section 5 presents the conclusions.
2. Materials and Methods
2.1. Study Design and Data Sources
This study implements a quasi-experimental pooled cross-sectional evaluation of the effect of exposure to Peru’s national school feeding program, Qali Warma, on weight-related outcomes among preschool-age children. The empirical setting is non-experimental: participation in social programs is not randomly assigned, and households and locations that receive the program may differ systematically from those that do not. The core methodological problem is therefore selection into treatment, and the analysis constructs an approximately comparable counterfactual group by balancing observed characteristics and targeting the average treatment effect on the treated (ATT).
The analysis uses pooled repeated cross-sectional microdata from the Demographic and Health Survey (DHS/ENDES) for the years 2014 to 2018. Unlike panel surveys, ENDES does not follow the same individual across rounds; a longitudinal design is not feasible because no nationally representative database tracking the same children over multiple years exists in Peru for this age group. Administrative information from Qali Warma is incorporated to identify program participation and to characterize operational features of delivery. In particular, the administrative data allow the analysis to distinguish between (i) rations versus products to be prepared and (ii) breakfast-only versus breakfast plus lunch. These program dimensions are consequential because they can change the intensity of exposure, the composition and preparation of foods, and the potential for household behavioral adjustments that may affect total intake.
The analytic sample comprises children aged 36 to 59 months enrolled in and attending public preschools (nivel inicial) observed in ENDES from 2014 to 2018. This age group is selected to focus on early childhood nutritional status while maintaining comparability in measurement and healthcare contact patterns. Both beneficiaries and the comparison group are drawn from the same institutional setting, i.e., public preschools, ensuring that treatment and control observations share a common baseline context. Children are included if they can be linked to the relevant definition of program exposure and have the non-missing anthropometric information required to construct weight outcomes. The sample selection process is illustrated in
Figure S3 (Supplementary Materials). The analysis pools all years (2014–2018) to increase precision and to study an overall period in which the program was operating with meaningful variation in implementation features. The full analytic sample includes 20,117 observations. Specifications that incorporate ethnicity as an additional control variable use a reduced sample of 18,959 children, as the ethnicity (defined as mother’s mother tongue) variable has missing values for a subset of respondents, a limitation common to this variable in ENDES. Because the proportion of missing observations is small and their distribution does not appear systematically related to treatment status, this reduction is not expected to introduce meaningful bias in the preferred specifications.
Because ENDES is repeated cross-sectionally, the same child is not followed over time. Identification does not rely on within-child changes but on cross-sectional comparisons between beneficiaries and non-beneficiaries after reweighting and regression adjustment. The causal interpretation relies on a selection-on-observables (conditional independence) assumption, which is conditional on the observed covariates used for weighting and adjustment, and treatment assignment is independent of potential outcomes. Identification also requires overlap (common support). Under these assumptions, the estimated contrasts can be interpreted as ATT effects; confounding remaining unobserved or exposure misclassification would bias estimates.
2.2. Outcomes: Obesity, Overweight, and Excess Weight
Weight outcomes are defined following World Health Organization (WHO) standards using the weight-for-height z-score [
18]. Three binary outcomes are constructed:
- −
Obesity: weight-for-height greater than 3 standard deviations above the reference value.
- −
Overweight: weight-for-height between 2 and 3 standard deviations above the reference value.
- −
Excess weight: weight-for-height greater than 2 standard deviations above the reference value (overweight or obesity).
Because these outcomes are binary, the main specifications are estimated using Probit models, and effects are reported as marginal effects to facilitate interpretation in probability units. In addition, the analysis evaluates whether program exposure is associated with changes across the distribution of nutritional status by treating the weight-for-height z-score as a continuous outcome. This is implemented using OLS as a mean effect model and quantile regression at selected quantiles. The rationale for this is that impacts may arise in specific segments of the distribution even when binary thresholds show limited movement, and quantile methods provide a direct way to test this heterogeneity.
2.3. Treatment Definition, Exposure Intensity, and Program Modality
Treatment status is defined at the individual level. Let be an indicator that equals 1 if child is a beneficiary of Qali Warma and 0 otherwise. In addition to the binary treatment indicator, the empirical strategy incorporates two key refinements.
- −
Exposure intensity: The analysis uses a frequency measure , defined as the number of months a child is registered as a beneficiary. This allows the estimation to differentiate short from sustained exposure and to test for nonlinear relationships by including and . It is important to note that administrative registration is a proxy for program exposure rather than a direct measure of actual food consumption. In the products for preparation modality, food is prepared and distributed by the School Feeding Committees (CAEs), and individual-level consumption may differ from what administrative records indicate, in part due to documented food-sharing practices within households. This implies that the estimates should be interpreted as intent-to-treat effects with respect to actual dietary intake.
- −
Operational heterogeneity (modality): Program delivery is not uniform. The analysis distinguishes between rations and products to be prepared and between breakfast-only and breakfast plus lunch. These features are used to estimate heterogeneous effects by modality rather than converging to a single average “program effect”.
2.4. Covariates and the Construction of Comparable Groups
Because the design is quasi-experimental, credible inference requires treated and comparison groups to be similar in observed characteristics that jointly predict program participation and outcomes. The initial set of covariates is informed by variables used in Peru’s SISFOH household welfare index for social program targeting. These include household assets and housing conditions (for example, indicators related to basic services, cooking fuel, and dwelling materials) as well as household composition measures such as household size (see
Supplementary Materials). Importantly, the weight-for-height z-score and its constituent components (weight and height) are not included as covariates in any specification, avoiding overadjustment of the outcome variable.
A central empirical challenge is that treated and untreated children may differ on multiple dimensions simultaneously, and these differences may be nonlinear and involve interactions. This motivates the use of machine learning for propensity score estimation, since it can improve balance by flexibly modeling treatment assignment without requiring the researcher to correctly specify functional forms ex ante [
19].
This flexibility matters in practice; conventional parametric propensity score models can leave substantial imbalance if the true assignment mechanism is complex. Moreover, balance is the objective, not predictive accuracy per se. Methods that directly search for weighting solutions that improve balance across many covariates can be preferable when selection is driven by nonlinear combinations of household conditions and local context.
To balance treated and untreated groups, propensity scores are estimated using a generalized boosted model (GBM), following Ridgeway et al. [
20] and implemented in the TWANG toolkit. Prior evidence suggests that estimating propensity scores with flexible machine-learning methods can improve matching or weighting performance by capturing nonlinearities and interactions that are difficult to model parametrically [
21]. GBM is an iterative algorithm that fits many shallow regression trees and combines them to approximate the propensity score function. In each iteration, the algorithm updates the estimate to reduce loss, allowing the final model to capture nonlinearities and interactions that would be difficult to pre-specify in a parametric model.
Once propensity scores are estimated, observations are reweighted to create a weighted comparison group whose covariate distribution matches that of treated children as closely as possible. The practical goal is to approximate the distribution that untreated children would have had if they were comparable to treated children in terms of observed covariates.
In addition to covariate-by-covariate diagnostics, overlap (common support) is evaluated by inspecting propensity-score distributions across groups. Overlap is essential: even perfect balance is not meaningful if treated observations have propensity scores that are far outside the range of controls. Overlap diagnostics indicate whether the weighted comparison group provides credible counterfactual support for treated children.
2.5. Empirical Strategy and Model Specifications
After constructing weights that yield comparable treated and control groups, the study estimates regression-based models. The baseline specification is
where
denotes obesity, overweight, or excess weight for child
;
equals 1 if child
receives program
and 0 otherwise;
is the mean outcome in the untreated group; and
captures the estimated ATT effect of beneficiary status under the identifying assumptions described above.
The main specification extends the baseline to incorporate exposure intensity, other-program participation, supply-side constraints, and covariates:
where
is the frequency of receipt (months),
indicates receipt of another social program
,
captures supply of health facilities per capita at the provincial level, and
denotes covariates used in balancing. This specification is presented as a doubly robust approach in the sense that it combines reweighting for balance with regression adjustment, reducing sensitivity to residual imbalance and improving precision.
To examine heterogeneity by modality in a way that is interpretable within geographic areas, the following specification is estimated:
where
when delivery is exclusively through products to be prepared within district
(restricting to districts where this is the sole modality), and
when delivery is exclusively through rations under the same restriction. Under this design, the interaction terms allow estimated effects to differ by delivery modality while keeping the local policy environment more comparable.
For binary outcomes, Probit models are used and marginal effects are reported to express results as changes in predicted probabilities. Robust standard errors are used, and preferred specifications include fixed effects for year and department. These fixed effects help absorb time shocks common to all departments and persistent differences across departments that could otherwise confound comparisons.
The inclusion of supply-side measures (health facility availability per capita) follows the motivation that constraints on health-service access and local capacity can shape nutritional outcomes and may vary across locations, thereby affecting both outcomes and the interpretation of program effects, as emphasized in related work (Cerna et al. [
22]).
2.6. Robustness
Robustness checks assess whether the findings are sensitive to how treated and untreated children are made comparable, since no single reweighting method is always best. We therefore complement GBM/TWANG weighting with two alternative approaches. First, propensity score matching pairs treated children with untreated children that have similar propensity scores. Its main strength is transparency and the “closest comparator” interpretation, but it can drop observations, reduce precision, and be sensitive to matching choices, and it may deliver limited balance if the propensity score model is restrictive. Second, entropy balancing constructs weights for the comparison group so that selected covariate moments, typically means, match those of the treated group by design. This approach often achieves excellent mean balance with stable weights and does not rely on specifying a propensity score model. Consistency of estimates across GBM/TWANG weighting, matching, and entropy balancing strengthens credibility under selection on observables, while any discrepancies help diagnose sensitivity to how the counterfactual is constructed.
2.7. Sensitivity to Unobserved Confounding
All approaches above assume that, conditional on observed covariates (and the weighting/matching procedure), remaining differences between treated and comparison groups are not driven by unobserved factors that simultaneously affect treatment and outcomes. To assess how sensitive conclusions are to violations of this assumption, this study implements Rosenbaum bounds as described by Rosenbaum [
23]. This sensitivity analysis quantifies how strong unobserved selection would need to be to overturn inference, thereby providing an explicit robustness check for the selection-on-observables framework.
3. Results
This section first presents the balance diagnostics, documenting that the machine learning-based weighting approach achieves a substantial improvement in comparability between beneficiaries and non-beneficiaries. It then presents the main Probit estimates for obesity and excess weight. In each case, the sequence follows the empirical strategy described in the Methods section: first are estimates with a single indicator for whether the child received Qali Warma before specifications adding treatment duration, followed by specifications differentiating Qali Warma modalities, and finally specifications including additional controls. In the modality specifications, joint significance tests are reported to assess whether the modality indicators are collectively informative. All estimates include year and department fixed effects. Additional estimations without fixed effects, with expanded sets of controls, and with multiplicative terms were explored by the research team; the specifications shown here capture the central findings in a parsimonious and transparent way. Finally, the section reports quantile regression estimates for the continuous weight-for-height z-score to assess whether effects emerge at points of the distribution beyond the conventional cutoffs defining excess weight and obesity.
The analytic sample includes 18,959 children aged 36 to 59 months observed in ENDES from 2014 to 2018. In the pooled sample, 86.2% are classified as beneficiaries of the school feeding program. The prevalence of obesity, defined as weight-for-height z-score greater than 3 standard deviations, is 1.8%, while the prevalence of excess weight, defined as weight-for-height z-score greater than 2 standard deviations, is 5.2%. Among beneficiaries, mean exposure intensity is 17.7 months. These descriptive patterns underscore the need for careful construction of an appropriate comparison group, given that participation is not randomly assigned, and they also highlight that the outcomes of interest are relatively rare at these ages, increasing the importance of transparent balance and robustness diagnostics.
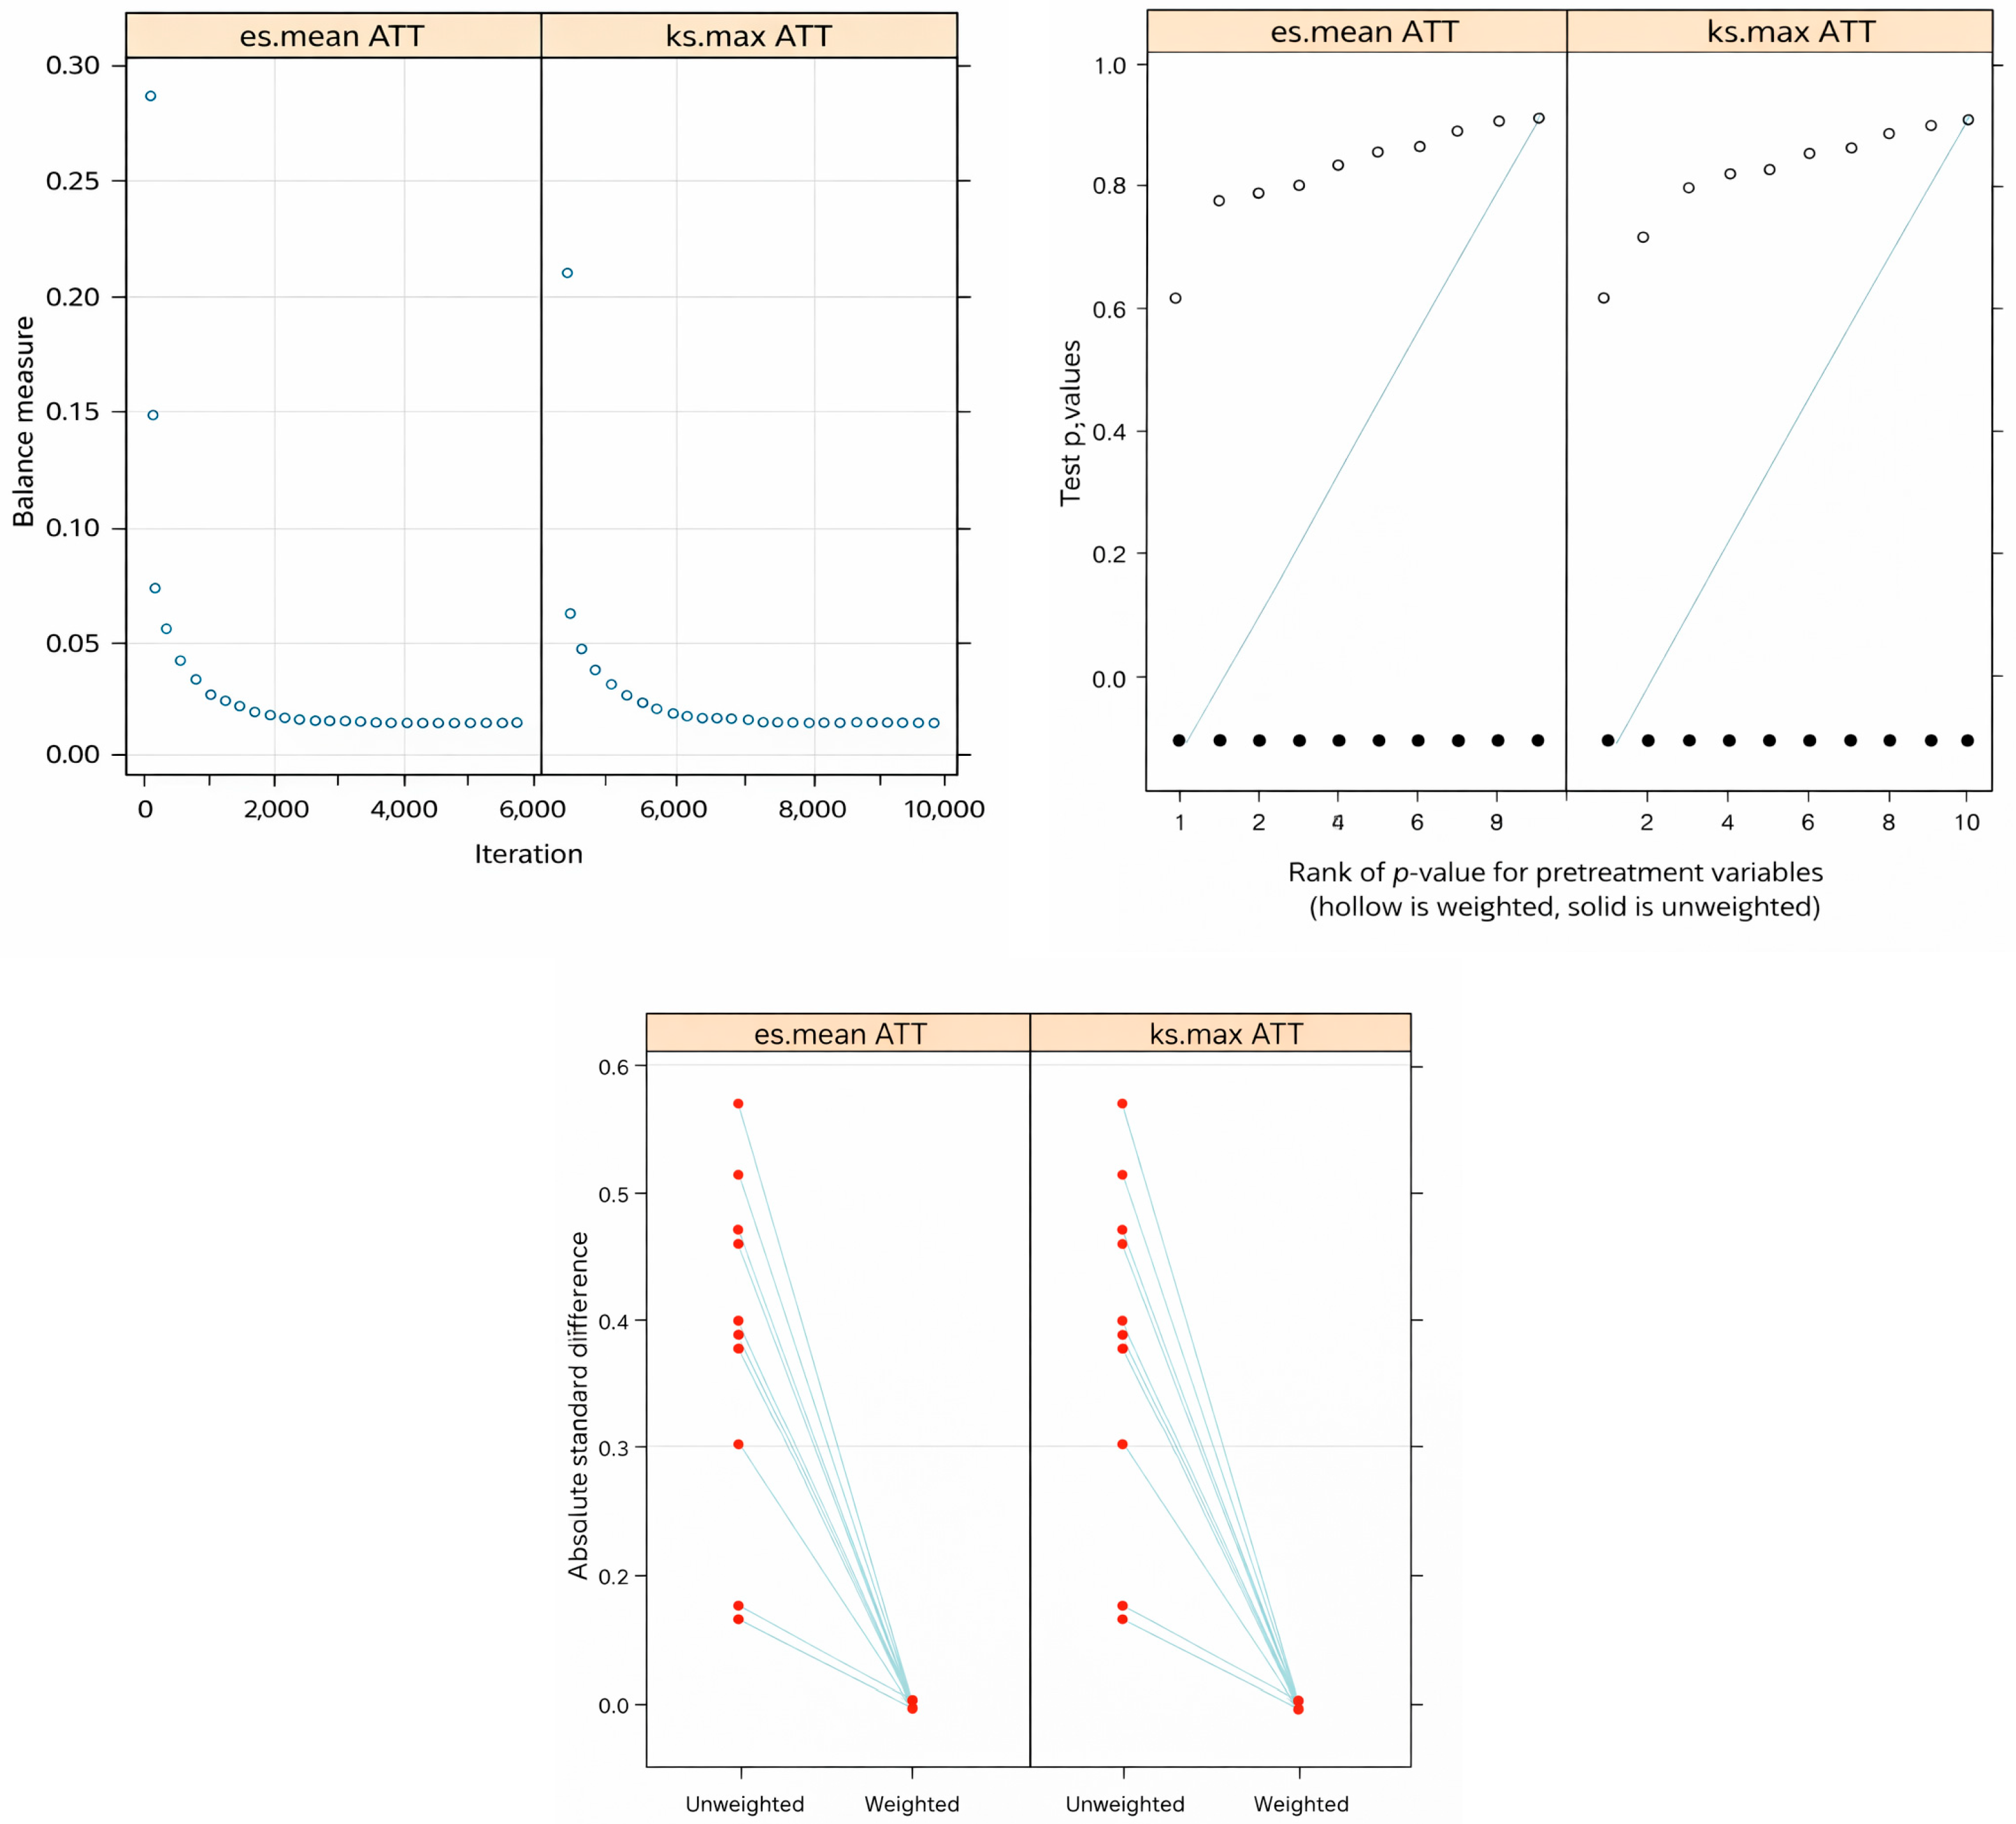
Balance results are summarized in
Figure 1, which reports three complementary diagnostics from the selected generalized boosted model weighting solution targeting the average treatment effect on the treated. The first plot, shown on the left, displays the evolution of balance criteria across boosting iterations, documenting convergence of the algorithm as it optimizes summary measures of mean and distributional balance. The pre-weighting sample is clearly imbalanced across many covariates, but after weighting, the set of covariates achieves substantially improved balance. The second plot, shown on the right, summarizes rank-based balance testing; before weighting, multiple covariates show evidence of imbalance at conventional significance thresholds, whereas after weighting, the distribution of
p-values shifts markedly upward, consistent with improved comparability between treated children and the weighted comparison group. The third plot shows the distribution of estimated propensity scores for treated and control observations and illustrates improved overlap after weighting, supporting the common-support assumption required for comparisons conditional on observables.
Table 1 reports marginal effects from Probit models for obesity and excess weight estimated using the machine learning-based weights and including year and department fixed effects. Columns (1) to (4) correspond to obesity, and columns (5) to (8) correspond to excess weight. When Qali Warma is modeled without distinguishing modalities, the beneficiary indicator is not statistically significant for obesity. Specifically, the marginal effect of receiving Qali Warma is 0.001 (SE 0.002) in column (1) and −0.001 (SE 0.002) in column (2) when treatment duration is added, providing no evidence of an average effect on obesity in pooled specifications. Introducing treatment duration yields a small linear term of 0.001 (SE 0.000) and a quadratic term that is effectively zero within reported precision for obesity (column (2)), reinforcing that pooled beneficiary status and duration do not generate a clear obesity signal without accounting for program heterogeneity.
When the analysis differentiates modalities, results indicate meaningful heterogeneity. Without additional controls (column (3)), the set of modality indicators is jointly significant (F = 5.500, p < 0.001), and the modality “breakfast plus lunch delivered as products to be prepared” is associated with a reduction of −0.010 (SE 0.002, p < 0.01) in obesity. This magnitude is substantively important given the low baseline prevalence of obesity (mean outcome 0.018). In the fully controlled specification (column (4), N = 18,959), the joint test for modalities is no longer statistically significant at conventional levels (F = 1.575, p = 0.178), but the coefficient for “breakfast plus lunch delivered as products to be prepared” remains negative and statistically significant, with an estimated marginal effect of −0.004 (SE 0.002, p < 0.1). This is the central result for obesity: relative to the relevant baseline, the configuration that provides both breakfast and lunch through products to be prepared is consistently associated with a lower probability of obesity. Notably, this configuration corresponds to product delivery rather than rations, a pattern that is consistent with the positive signs observed for some breakfast-only configurations involving rations. Across columns (3) and (4), the remaining breakfast-only modality indicators have small, positive marginal effects on obesity that are not statistically significant within reported precision.
Columns (5) to (8) present the corresponding Probit results for excess weight. In pooled specifications without modality differentiation, receiving Qali Warma is associated with a higher probability of excess weight in column (5): the marginal effect is 0.008 (SE 0.004, p < 0.05). When treatment duration is incorporated (column (6)), the beneficiary indicator becomes statistically indistinguishable from zero (−0.000, SE 0.005), while the linear duration term is positive and statistically significant in the pooled model (0.001, SE 0.001, p < 0.05), suggesting that excess weight risk increases with time in receipt when heterogeneity is not modeled. This pooled pattern provides motivation for the modality analysis, as it may aggregate configurations with opposing effects.
When modalities are introduced without additional controls (column (7)), the modality indicators are jointly significant (F = 6.422, p < 0.001). The configuration “breakfast plus lunch delivered as products to be prepared” is associated with a statistically significant reduction of −0.018 (SE 0.006, p < 0.01) in excess weight. In contrast, the breakfast-only modality coefficients are positive but not individually statistically significant in this specification: 0.005 (SE 0.007) for “breakfast-only, rations-only”, 0.001 (SE 0.005) for “breakfast-only, products-only”, and 0.011 (SE 0.007) for “breakfast-only, mixed rations/products”. Although these individual estimates are imprecise, their pattern is informative: the point estimates are larger for configurations involving rations (alone or mixed) than for products only, consistent with the descriptive interpretation that rations may be more likely to contribute to higher excess weight risk under some household behavioral responses. Once controls are added (column (8)), the joint test for modalities is not statistically significant (F = 0.518, p = 0.722), and no modality coefficient remains statistically distinguishable from zero at conventional levels; nevertheless, the signs preserve the same qualitative structure observed in column (7), with positive point estimates for breakfast-only modalities and a negative point estimate for breakfast plus lunch.
Overall, the evidence for excess weight is less conclusive than for obesity, but it consistently suggests that the “breakfast plus lunch delivered as products to be prepared” configuration is the modality most aligned with reductions in adverse weight outcomes. In contrast, breakfast-only configurations tend to show null or positive point estimates, with more pronounced upward shifts concentrated in delivery formats that involve ready-to-eat rations.
To examine whether program exposure affects the weight-for-height distribution beyond the obesity and excess weight cutoffs,
Table 2 reports estimates for the continuous weight-for-height z-score using OLS and quantile regression at the 0.2, 0.4, 0.6, and 0.8 quantiles. Across specifications, treatment duration is positively associated with the z-score: the linear effect of months in Qali Warma is 0.010 (SE 0.003,
p < 0.01) in OLS and remains positive and statistically significant across quantiles, including 0.009 (SE 0.003,
p < 0.01) at the 0.8 quantile. The quadratic term is small and negative, indicating mild concavity in duration effects, with statistical significance in some specifications. These results imply that, on average, longer exposure is associated with higher weight-for-height z-scores, a pattern that can be benign or beneficial for children below healthy weight thresholds. Given that approximately 95% of beneficiary children in the analytic sample do not have excess weight, distributional results at higher quantiles are particularly relevant for overweight and obesity concerns.
At the upper tail (0.8 quantile), modality estimates indicate that breakfast-only delivery involving rations is associated with higher z-scores: “breakfast-only, rations-only” is 0.118 (SE 0.052, p < 0.05) and “breakfast-only, mixed rations/products” is 0.096 (SE 0.042, p < 0.05). In contrast, the “breakfast plus lunch delivered as products to be prepared” modality is near zero at the 0.8 quantile (0.001, SE 0.034) while being negative at lower quantiles and in OLS (for example, −0.079, SE 0.029, p < 0.01 at the 0.6 quantile). Taken together, the quantile results are consistent with the Probit patterns: rations-based breakfast-only modalities are the configurations most aligned with upward shifts in the upper part of the weight-for-height distribution, whereas the breakfast plus lunch with products to be prepared configuration does not show the same upward pressure at the upper tail and is the configuration most consistently associated with a lower probability of obesity.
A plausible interpretation is that breakfast-only configurations involving ready-to-eat rations may increase exposure to industrially processed and potentially ultra-processed foods, which has been linked to weight gain and adverse metabolic profiles in the literature [
14,
24,
25].
Across robustness checks, the substantive pattern is consistent: effects differ meaningfully by modality, and the configuration that includes breakfast plus lunch delivered through products to be prepared is the most consistently protective with respect to obesity and, in less saturated specifications, excess weight. In the matched analyses, obesity results indicate that breakfast-only modalities that include rations (either rations alone or rations combined with products) are associated with higher obesity incidence, whereas the breakfast plus lunch modality delivered through products to be prepared does not show this increase. Even when additional controls attenuate overall joint significance, the breakfast-only with rations modalities remain positively signed, reinforcing the interpretation that breakfast-only delivery, especially with rations, is the configuration most consistently associated with adverse weight outcomes, while adding lunch through products to be prepared appears preferable for obesity.
For excess weight, the matched results show a statistically significant reduction for the breakfast plus lunch configuration when controls are excluded, but this evidence becomes statistically fragile once the full control set is included. The interpretation is that excess weight findings are less stable to specification choice than obesity findings, yet the most consistently favorable pattern again points to breakfast plus lunch delivered through products to be prepared. Entropy-balancing results align closely with the main estimates: the breakfast plus lunch and products to be prepared configuration remains the one most consistently associated with reductions in obesity and, in parsimonious models, reductions in excess weight. This convergence supports the view that the central modality-specific conclusion is not driven by a single adjustment procedure.
Sensitivity analysis reinforces this asymmetry across outcomes. The obesity inference is robust to moderate hidden bias (remaining robust up to Γ = 2), whereas excess weight inference is notably more sensitive, with relatively small unobserved selection capable of changing conclusions. Overall, obesity results are the more stable and policy-informative findings, and they consistently highlight modality design as consequential.
4. Discussion
The results indicate that program heterogeneity is not a secondary detail but a central empirical and policy-relevant feature. When delivery configurations are distinguished, a consistent pattern emerges: the modality that provides breakfast plus lunch through products to be prepared is associated with a lower probability of obesity, whereas breakfast-only configurations do not display comparable protective effects and, in distribution-sensitive analyses, configurations involving rations are more strongly related to upward shifts in the upper tail of the weight-for-height distribution.
A substantive implication is that aggregating heterogeneous delivery regimes into a single “program effect” risks obscuring mechanisms that matter for nutritional outcomes. The program can affect child weight through multiple pathways that operate differently across modalities. First, service intensity differs across configurations. Breakfast plus lunch represents a stronger replacement or supplementation of the child’s dietary intake during the school day than breakfast alone, which may alter how households adjust meals at home. Second, food format differs. Delivery through products to be prepared implies different preparation processes, portioning, and potentially different composition and consumption patterns than ready-to-eat rations. One consistent interpretation of the observed patterns is that some breakfast-only configurations may more easily add to, rather than replace, food consumed at home, particularly if children already eat breakfast at home before receiving the school meal, thereby increasing total energy intake. Conversely, the breakfast plus lunch configuration delivered through products to be prepared may be more likely to substitute for household-provided meals or align intake over the course of the day, which is consistent with the absence of a right-tail increase and the lower obesity probability observed for this configuration. Because delivery modalities are partly geographically structured, department fixed effects and rich covariates mitigate but may not fully eliminate confounding by place.
The distinction between ready-to-eat rations and products to be prepared also matters for the degree of industrial processing. Breakfast-only delivery involving rations may increase exposure to ultra-processed foods relative to modalities based on locally prepared ingredients. The solid components of ration-based breakfasts, sweet breads, cookies, and cereal bars, qualify as ultra-processed under the NOVA classification (Group 4) [
13]. A longitudinal study of Latin American preschoolers of comparable age (mean approximately 48 months) found a statistically significant positive association between ultra-processed food consumption and obesity incidence (RR: 1.10; 95% CI: 1.02–1.18) [
15], directly supporting the channel through which ration-based modalities may elevate obesity risk in the study population. A systematic review of 10 studies in children and adolescents further reports that sustained consumption of ultra-processed foods is associated with increased BMI, waist circumference, and fat mass, with effects more consistently detected in longitudinal studies [
14]. Evidence from human trials additionally links ultra-processed diets to lower satiety, faster eating rates, and greater weight gain and worsening biochemical markers [
24], and a dose–response association has been reported between ultra-processed food consumption and diabetes risk [
25]. While the present data do not measure food processing directly, the stronger upper-tail shifts observed for ration-based breakfast-only configurations are consistent with this channel. Beyond the immediate nutritional content of individual meals, the policy implications extend to the food environment more broadly. Sustained delivery of ultra-processed rations to young children may normalize industrially manufactured foods in household and school setting, potentially shaping long-term dietary preferences and generating dependency on these products, particularly in rural and peri-urban communities where Qali Warma represents a substantial share of children’s daily food intake. This calls for a food-based rather than purely nutrient-centric approach to program design: school feeding systems that promote fresh and minimally processed foods, as the products for preparation modality already operationalizes, are more consistent with an adequate and healthy diet and with the double-duty goal of addressing both undernutrition and excess weight simultaneously.
The quantile regression results complement the binary outcome evidence by highlighting that the policy concern for obesity is concentrated in the upper tail of the distribution. Estimates at the 0.8 quantile indicate larger positive shifts for breakfast-only configurations involving rations, whereas the breakfast plus lunch configuration with products to be prepared does not exhibit a comparable right-tail increase. Taken together, the distributional and threshold-based results reinforce the same interpretation: modality and operational intensity are central for understanding weight-related outcomes.
Robustness and sensitivity analyses further clarify where conclusions are most secure. Alternative counterfactual constructions corroborate the substantive message that effects differ across configurations. Rosenbaum bounds indicate that obesity findings are comparatively robust to moderate hidden bias: the protective association for the breakfast plus lunch through products modality remains statistically significant up to a hidden bias parameter of Γ = 2.0, suggesting that an unobserved confounder would need to at least double the odds of treatment to overturn this conclusion. By contrast, the excess weight estimates are considerably more sensitive to unobserved selection, losing significance at Γ = 1.1, a very modest departure from the selection-on-observables assumption. This asymmetry in robustness implies that the primary policy-relevant conclusion should be framed around obesity, where the evidence is most consistent and least vulnerable to hidden confounding, while excess weight findings should be interpreted as suggestive and directionally consistent but not conclusive.
Some limitations of this study should be acknowledged. First, the selection-on-observables assumption requires that all relevant confounders are captured in the observed covariate set; unobserved factors such as parental health literacy, household dietary preferences, and community food environments may not be fully accounted for, and the Rosenbaum bounds reported in the
Supplementary Materials provide a quantitative assessment of sensitivity to such confounding. It is worth noting, however, that since both beneficiaries and the comparison group are drawn from the same institutional setting, i.e., children enrolled in and attending public preschools, variables such as parental health literacy or household dietary preferences are unlikely to systematically determine program participation in this context, which attenuates their confounding potential for treatment assignment. Second, program exposure is measured through administrative registration records rather than direct observation of food consumption; children registered as beneficiaries may not have consumed program meals consistently, and food-sharing practices documented in similar programs imply that individual-level intake may differ from what records indicate. Third, modality assignment is identified at the district level from administrative data, which may not perfectly capture the modality received by individual children. Fourth, because ENDES is cross-sectional, the study cannot track weight trajectories over time or establish the long-term effects of sustained program exposure.
These findings remain relevant despite the fact that Qali Warma has since been reorganized under a different name and institutional structure. Evaluating the earlier implementation remains valuable because it provides evidence on how concrete operational design choices within a large-scale school feeding system relate to weight-related outcomes. In periods of reform, evidence on which configurations are most compatible with obesity prevention is directly applicable to policy, even if governance structures or administrative labels change. Program redesigns that expand the products for preparation modality and prioritize fresh and minimally processed ingredients over industrially manufactured rations represent a policy direction that the present evidence supports.