Article

Cycling for Weight Loss May Clear Carbohydrates Rather Than Fat, Irrespective of Normal or Mildly Reduced Normobaric Oxygen

by
Victor V. A. M. Schreurs
1,2,*,
Tjieu Maas
1,3,
Joost J. G. C. van den Borne
4 and
Jaap Keijer
2
1
Research Group Sports, Nutrition and Lifestyle, Faculty Health and Social Studies, HAN University of Applied Sciences, 6525 EN Nijmegen, The Netherlands
2
Human and Animal Physiology, Wageningen University, 6700 AH Wageningen, The Netherlands
3
Expert Team Sports and Exercise Nutrition, Institute of Sports and Exercise Studies (ISES), HAN University of Applied Sciences, 6525 AJ Nijmegen, The Netherlands
4
Research Group Healthy Farming, HAS University of Applied Sciences, 5223 DE ‘s Hertogenbosch, The Netherlands
*
Author to whom correspondence should be addressed.
Obesities 2022, 2(2), 205-214; https://doi.org/10.3390/obesities2020016
Submission received: 21 February 2022 / Revised: 30 March 2022 / Accepted: 5 April 2022 / Published: 12 April 2022

Abstract

:
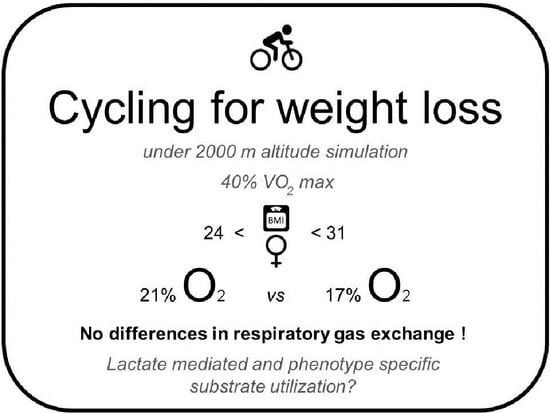
A single-center randomized, controlled cross-over exercise intervention in 20 women willing to reduce weight (20–40 y, BMI: 27.4 ± 2.1), with the aim to examine potential benefits for weight loss under normal (N-Ox: 20.9%) and mildly reduced (R-Ox: 17.0%) normobaric oxygen in an “Altitude Simulation Chamber”. O2 consumption (VO2), CO2 production (VCO2), blood oxygen saturation (SaO2), blood glucose and lactate (mM) were studied before, during and after cycling for 22 min at a mean personalized workload of 54.2 ± 11.7 watts, about 40% of VO2max. Despite lower absolute SaO2 values and a greater decline from rest to exercise under R-Ox (time x treatment interaction p < 0.01), VO2 did not differ from N-Ox (time x treatment interaction p = 0.178). Average net VO2, 13.8 mL O2 per watt, reflected fairly normal aerobic cycling, irrespective of O2 regime. The Respiratory Exchange Ratio (RER; VO2/VCO2), 0.83 at rest, increased for both treatments to a ratio close to or beyond unity during and directly after exercise (treatment effect p = 0.407). The tendency of cycling for weight loss to clear carbohydrates rather than fat, irrespective of normal or mildly reduced normobaric oxygen, is discussed as a lactate-mediated and phenotype-specific consequence of apparent anaerobic glycolysis with adverse perspectives for weight loss and metabolic health.

Graphical Abstract

1. Introduction

To improve quality of life and to decrease health care costs related to being overweight and obesity, the World Health Organization (WHO) advocates avoiding unhealthy weight gain (>5 kg) in adult life and maintaining cardio-respiratory fitness by moderate intense physical activity for at least 30 min per day. People who are overweight should normalize their BMI by reducing total energy intake and conducting more physical activity [1,2]. A higher level of physical activity can be accomplished by increasing ‘Activities of Daily Living’ or by introducing extra bouts of exercise [3,4]. The former is often hard to reconcile with sedentary occupations and preferences for inactive recreation, whereas the latter is often faced with reduced compliance and high dropout rates [4]. In theory, each additional bout of 30 min of moderate intense aerobic exercise per day is energetically equivalent to about 20 MJ per month or a potential loss of only 0.5 kg of body fat. Moreover, some weight loss-oriented studies have even reported that the effects of regular aerobic exercise on net body fat oxidation might be negligible in subjects who are overweight [5,6,7]. In general, exercise interventions running at low gross efficiency of energy metabolism (power output/power input), reached by a high O2 consumption (VO2) and a low Respiratory Exchange Ratio (RER: VCO2/VO2), can be expected to be most effective to maximize oxidation of body fat [8,9].
As a sea level alternative for “Ascent to altitude (2000 m) as a weight loss method” reviewed by Palmer and Clegg [10], we explored potential benefits of mildly reduced normobaric oxygen (R-Ox: 17.0% O2) in our “Altitude Simulation Chamber”. Since individuals willing to reduce weight by exercise would in practice be the ones to most likely benefit, we tested the effects on respiratory gas exchange in 20 overnight-fasted, low-active female volunteers of 20–40 years of age.
The review of Palmer and Clegg mentions that benefits are dose dependent, gender and genetic background specific and warns of adverse effects if exposure is extreme [10].
Therefore, we applied a personalized sub-maximal workload to give room for a substantial increase in O2 consumption during sustained exercise without approaching VO2max and discussed our results with the perspective to improve strategies for weight loss and metabolic health in practice.

2. Materials and Methods

2.1. Subjects, Inclusion and Exclusion Criteria

Twenty low-active women, 20–40 years old and willing to reduce weight by exercise, were recruited from respondents to an advertisement in regional newspapers. The subjects were self-reported healthy, non-smoking women, with an activity level below the Dutch Fitnorm, i.e., less than 3-times weekly intense physical activity for 20 min. Medical screening, by the institutional sport physician, included an interview, measurement of body weight and height, routine analysis of fasting blood values and a check for glycosuria. The cardio-respiratory fitness of subjects was assessed by ECG and provided maximal O2 consumption (VO2max) and heart rate (HRmax) during cycling under N-Ox. Exclusion criteria were being diagnosed for anemia, type 1 or type 2 diabetes, hypertension, heart disease and medication that could alter energy metabolism or a medical history expected to interfere with the outcome of the study. After inclusion and written consent, the 20 subjects were randomized by the alphabetical order of their initials and familiarized with all procedures, including the ventilated hood system as used during the experimental cycling protocol. This study was approved by the Regional Medical Ethics Committee Arnhem—Nijmegen (CMO nr: 2009/341; ABR nr: NL 29211.091.09) and registered as clinical trial: https://doi.org/10.1186/ISRCTN11842323 accessed on 20 February 2022.

2.2. Experimental Cycling Protocol

Subjects arrived, after an overnight fast, at Seneca, Expert Centre for Sports, Work and Health of HAN University of Applied Sciences (Campus Nijmegen) between 7:30 and 9.30 am to perform a 50 min cycling protocol in our “Altitude Simulation Chamber” (2.4 × 3.8 × 2.7 m; ~25 m3), installed by b-Cat (Tiel, The Netherlands). This chamber was equipped with an upright bike ergometer combined with a “ventilated hood system” for open-circuit respiratory gas exchange of the cyclists (see: 2.5. ‘Facilities and equipment’ for technical details).
The protocol (Figure 1) started with 10 min of rest on the bike ergometer. During a warm up of 8 min, workload (broken line) was gradually increased to reach a personalized workload (see: 2.4. ‘Personalized cycling workload’ for practical details), followed by continuous cycling for 22 min at this personalized intensity. After the period of cycling (dotted line), subjects recovered for 10 min in the same upright position as prior to exercise. Data of respiratory gas exchange were collected to characterize 4 specific phases of 5 min within the 50 min cycling protocol (solid lines): phase 1: rest (min 5–10); phase 2: cycling ‘4–9 min’ (min 22–27); phase 3: cycling ‘17–22 min’ (min 35–40); and phase 4: recovery (min 40–45). Secondary outcome measures were collected at min 6, 26, 39 and 46 (▼) and assumed to represent the phases 1 to 4, respectively. The cycling protocol was performed at two occasions within a period of 2 weeks, in a randomized order, once under normal (N-Ox: 20.9% O2) and once under mildly reduced (R-Ox: 17.0% O2) normobaric oxygen. Subjects were instructed to maintain their habitual lifestyle between both occasions.

2.3. Measurements

O2 consumption (VO2: mL/min) and CO2 production (VCO2: mL/min) were measured continuously and derived from differences in content of O2 and CO2 between air samples drawn from the inlet (ambient air in the chamber) and outlet (ambient air in the chamber modified by respiration) of a “ventilated hood” (see: 2.5. ‘Facilities and equipment’ for technical details). Data collected at 20 sec intervals were used to calculate mean values during each of the 4 specific phases of 5 min within the cycling protocol mentioned above. Secondary outcome measures were collected at min 6, 26, 39 and 46 (▼) and assumed to represent the phases 1 to 4, respectively. Blood oxygen saturation (SaO2: %) and heart rate (HR: min−1) were monitored by reflectance finger pulse-oximetry using the PulseOx 7500 (SPO Medical, Simi Valley CA, USA). Glucose and lactate concentrations (mM) were measured simultaneously in a single 10 μL sample of fingertip capillary blood using a Biosen C-line analyzer (EKF Diagnostics, Sopachem, Ochten, The Netherlands).

2.4. Personalized Cycling Workload

Mild reduction in oxygen availability is commonly well tolerated at physical rest, for instance during long distance air flights [11]. A screening protocol under R-Ox was used to determine a personalized workload for each subject and to check whether our subjects tolerated R-Ox during cycling. Subjects maintained a pedaling rate of personal preference. A starting workload of 25 watts was stepwise increased by 15 watts every 4 min. Heart rate (HR) and blood oxygen saturation (SaO2) were monitored and subjects rated their perceived exertion (RPE value) on a Borg scale from 6 to 20 [12]. The maximal workload was set at 130 watts, but the protocol was stopped at a lower workload when subjects passed safety values for HR (>80% HRmax) or SaO2 (<90%) or when they wanted to stop because of perceived exertion. The personalized workload during the experimental cycling protocol (see above) was arbitrarily set at 3 steps, or 45 watts, below the outcome of the screening, to give room for a substantial increase in O2 consumption during sustained exercise without approaching VO2max.

2.5. Facilities and Equipment

Ambient normobaric conditions in the “Altitude Simulation Chamber” (2.4 × 3.8 × 2.7 m; ~25 m3) were controlled at either normal (N-Ox: 20.9% O2) or mildly reduced (R-Ox: 17.0% O2) normobaric oxygen at a temperature of 20 °C.
An upright bike ergometer (Technogym Benelux, Capelle aan den IJssel, The Netherlands) was combined with a ventilated hood system for open-circuit respiratory gas exchange [13,14,15]. The hood, a free-hanging helmet of transparent polycarbonate with an inner volume of approximately 10 L, was actively ventilated with ambient air from the chamber with a precisely measured flow of about 250 L/min, corrected for STPD conditions (i.e., standard temperature (273 K) and pressure (1013 hPa), dry air). Separate sampling lines (~500 mL/min) drawn from the inlet (ambient air in the chamber) and outlet (ambient air in the chamber modified by respiration) of the ventilated hood passed through a dual gas cooler (APC 501, M&C Indumation, Oosterhout, The Netherlands) to dry the gasses at a dew temperature of 4.1 °C ensuring a low and constant humidity during paramagnetic O2 analysis. Thereafter, a precision flow of 200 mL/min was split off from each of the two sampling lines and directed to a Servomex 4100, equipped as a dual channel gas analyzer (Servomex, Zoetermeer, The Netherlands). In both channels, a paramagnetic O2 transducer (0–100%) was serially connected to an infrared CO2 transducer (0–2.5%). Active ventilation of the hood did not cause discomfort for the subjects but resulted in smaller differences in content for O2 and CO2 between sampling lines caused by respiration. Small differences, down to 0.01%, could be measured accurately by calibrating the entire analogue output range of the transducers (20 mA, being converted to 10 mV) for a linear measuring range of only 1.00%. A TracerDAQ data logger (Peekel Instruments BV, Rotterdam, The Netherlands) collected data at 20 sec intervals.
O2 consumption (VO2: mL/min) and CO2 production (VCO2: mL/min) were calculated by multiplying the STPD-corrected airflow through the hood (~250 L/min) by the mean difference in content for O2 and CO2 (<1.00%) between the inlet and outlet of the hood. VO2 and VCO2 measured at the same time optimize accuracy of ‘real-time’ changes in metabolism regarding metabolic costs (VO2) and substrate utilization reflected by the Respiratory Exchange Ratio (RER: VCO2/VO2) before, during and after cycling, assuming a stable bicarbonate pool [15,16].

2.6. Statistical Analysis

SaO2, O2 consumption, RER, blood glucose and lactate concentrations were analyzed by two-way repeated measures ANOVA with time (successive 4 phases, i.e., phase 1: rest, phase 2: cycling ‘4–9 min’, phase 3: cycling ‘17–22 min’, phase 4: recovery) and treatment (N-Ox and R-Ox) as within-subject factors. When applicable, pairwise comparisons with Bonferroni correction were applied to locate differences between each of the four phases. Statistical analyses were considered significant for p-values < 0.05. All statistical calculations were performed using the IBM SPSS Statistics software, version 25.
Phenotypic characteristics are in means ± SD, while other results are means ± SEM.

3. Results

3.1. Subjects and General Aspects

The study was performed as intended with 20 subjects, but 2 of them were excluded from the analysis for practical reasons. One subject showed fever at the time of the 2nd measurement and data from another subject were not properly stored. Results for the remaining 18 female subjects, without missing values, are shown in Table 1 (General characteristics) and Table 2 (Experimental data). Individual values of Table 1 and Table 2 are available as Supplementary Tables S1 and S2, respectively. For all subjects, the screening protocol under R-Ox was stopped for no other reason than reaching the safety value for HR (>80% HRmax) and on that occasion they reported a mean RPEmax of 14.1 ± 2.5. Final workloads of the screening for individual subjects ranged between 85 and 115 watts and resulted in a mean personalized workload of 54.2 ± 11.7 watts during the experimental cycling protocol.

3.2. Blood Oxygen Saturation

Table 2 presents blood oxygen saturation (SaO2) for each of the four phases of the experimental protocol. Over the four consecutive phases, SaO2 values under R-Ox were lower than under N-Ox (treatment effect p < 0.001). Moreover, the significant time × treatment effects (p < 0.001), indicated a greater decline in SaO2 from rest to exercise in the R-Ox condition as opposed to N-Ox. Under both conditions, SaO2 values during recovery (phase 4) did not differ from their respective values at rest prior to exercise (phase 1).

3.3. Oxygen Consumption

O2 consumption is presented in Table 2. Over the four consecutive phases, O2 consumption was not different between O2 regimes (treatment effect p = 0.313), nor did it differ between treatment over time (time × treatment interaction, p = 0.178). O2 consumption averaged 248 ± 14 mL/min at rest and 994 ± 19 mL/min during exercise, approximately 40% of the mean VO2max during the medical screening under N-Ox (Table 1). At the end of the cycling period (min 39), we noticed: HR 119 ± 10 and RPE 10.5 ± 2.3 as an average for both O2 regimes. O2 consumption during recovery (256 ± 7 mL/min) did not differ from the value at rest prior to exercise.

3.4. Respiratory Exchange Ratio (RER)

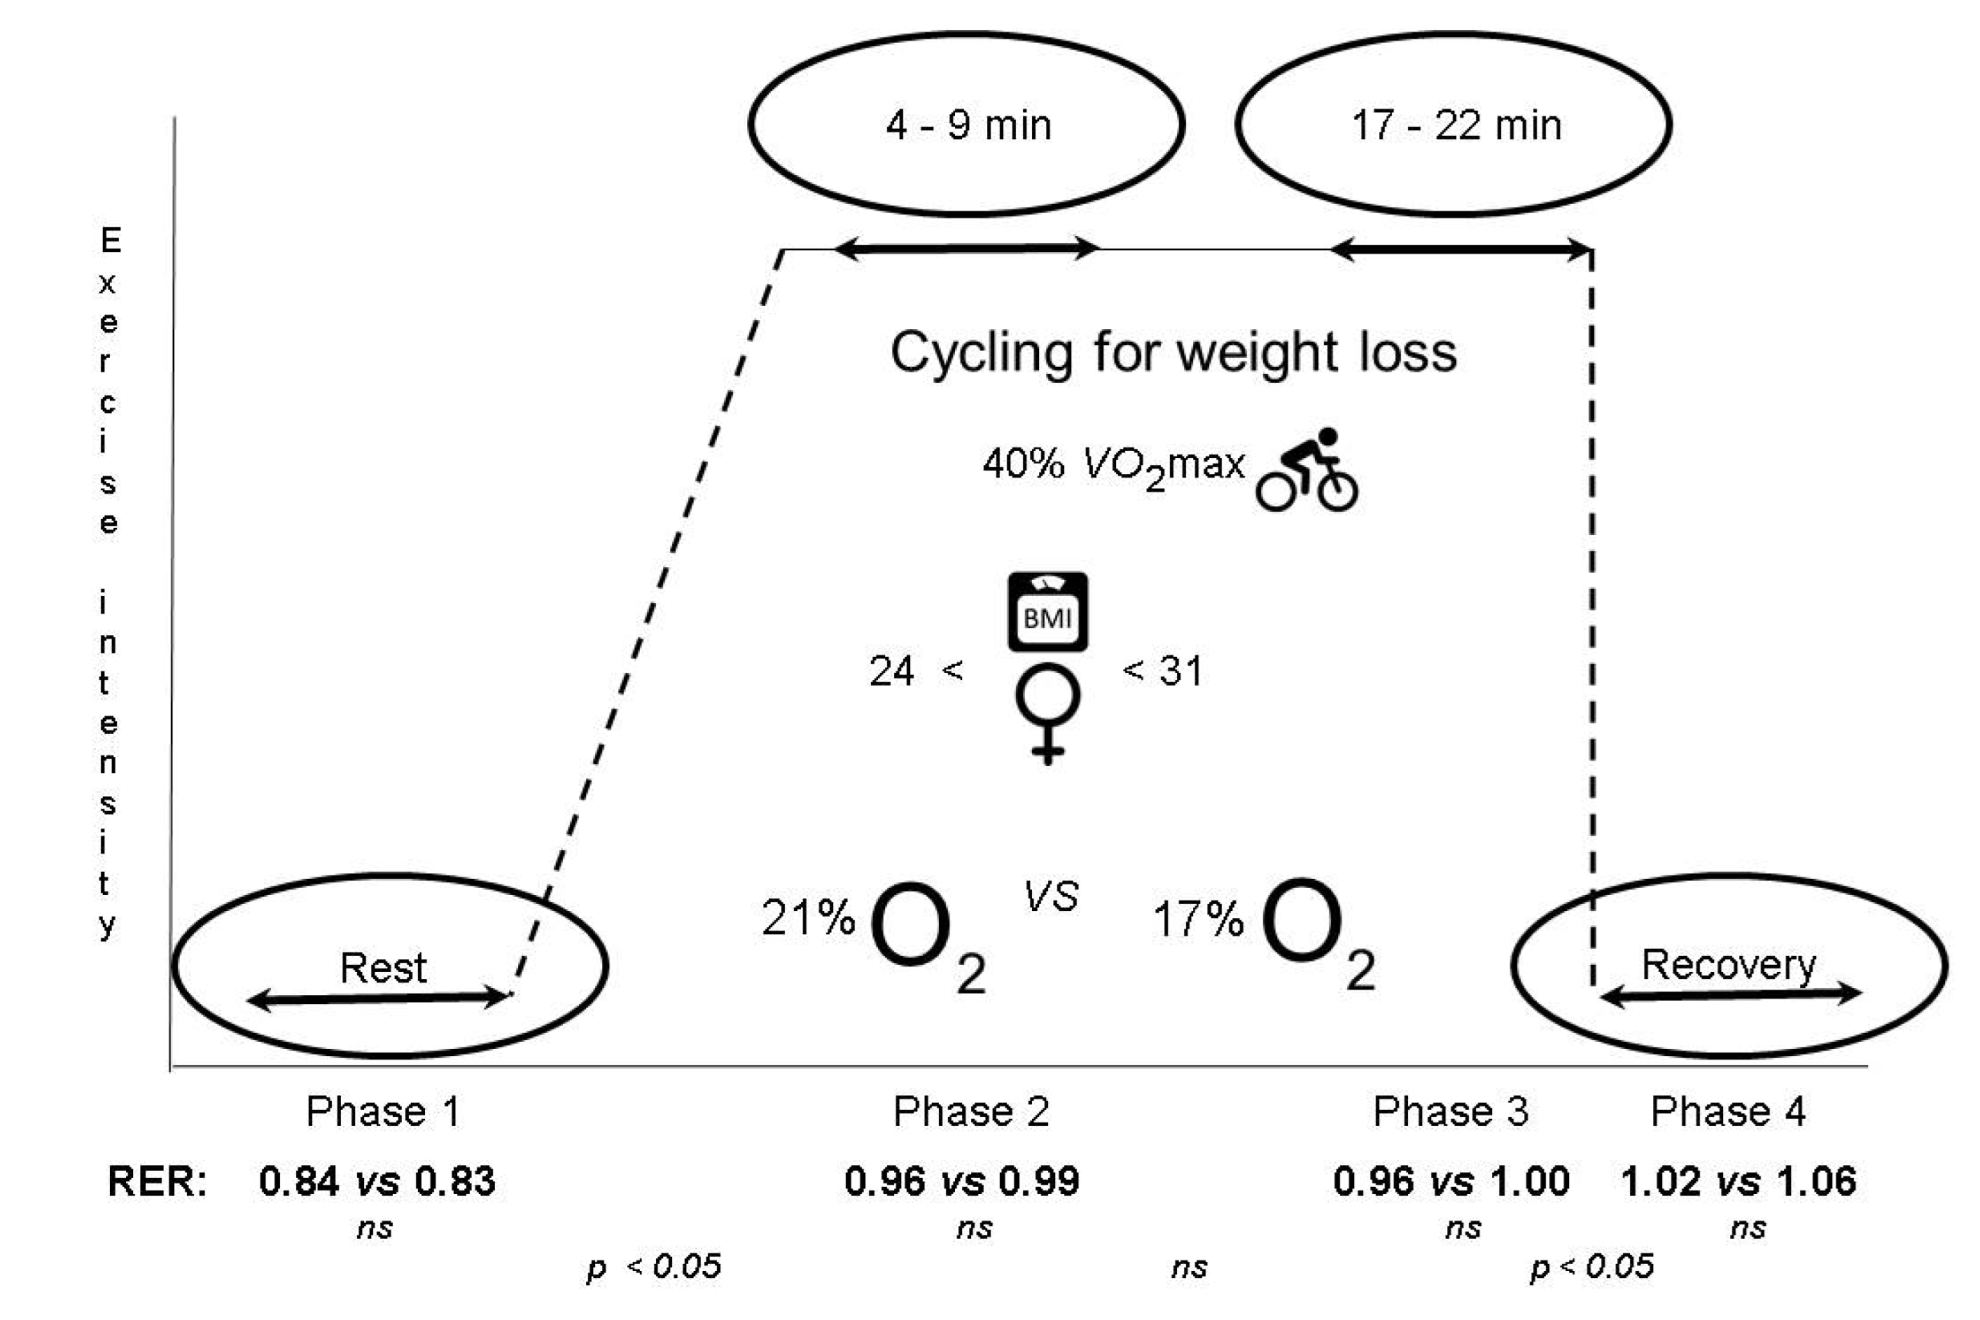
RER values are presented in Table 2 and summarized in Figure 2. The fasting RER value at rest prior to exercise (phase 1) was not affected by R-Ox and averaged 0.83 ± 0.01. Compared with the resting values, RER increased (p < 0.001) to about unity during cycling (phase 2 and 3), and increased even further during recovery, but change over time did not differ between treatments (time × treatment interaction, p = 0.407).
Figure 2. RER values during cycling for weight loss (see text above).
Obesities 02 00016 g002
Table 2. Metabolic responses during a cycling protocol under normal (N-Ox: 20.9% O2) and mildly reduced (R-Ox: 17.0% O2) normobaric oxygen for SaO2, O2 consumption, RER, glucose and lactate in overweight women. Subjects were instructed to maintain their habitual lifestyle between both occasions. Values are presented as means ± SEM, (n = 18).
Treatmentp-Value
PhaseN-OxR-Ox TimeTreatmentTime × Treatment
SaO2 (%)
1—Rest98.1 ± 0.195.4 ± 0.4<0.001 a,b,e,f<0.001<0.001
2—Cycling (4–9 min)97.1 ± 0.393.8 ± 0.4
3—Cycling (17–22 min)97.8 ± 0.293.8 ± 0.4
4—Recovery98.2 ± 0.196.4 ± 0.3
O2 (mL/min)
1—Rest239 ± 6257 ± 28<0.001 a,b,e,f0.3130.178
2—Cycling (4–9 min)1011 ± 34974 ± 37
3—Cycling (17–22 min)1010 ± 41982 ± 37
4—Recovery261 ± 8250 ± 11
RER (VCO2/VO2)
1—Rest0.84 ± 0.02 0.83 ± 0.02<0.001 a,b,c,e0.2910.407
2—Cycling (4–9 min)0.96 ± 0.010.99 ± 0.04
3—Cycling (17–22 min)0.96 ± 0.011.00 ± 0.04
4—Recovery1.02 ± 0.021.06 ± 0.03
Glucose (mM)
1—Rest4.8 ± 0.15.0 ± 0.20.0320.2050.450
2—Cycling (4–9 min)4.5 ± 0.14.7 ± 0.1
3—Cycling (17–22 min)4.6 ± 0.24.5 ± 0.1
4—Recovery4.5 ± 0.14.7 ± 0.1
Lactate (mM)
1—Rest 1.7 ± 0.21.8 ± 0.30.0520.9620.833
2—Cycling (4–9 min)2.0 ± 0.32.1 ± 0.2
3—Cycling (17–22 min)2.4 ± 0.32.5 ± 0.5
4—Recovery2.0 ± 0.41.8 ± 0.2
Significance values obtained from post hoc analyses: a phase 1 vs. phase 2, p < 0.05; b phase 1 vs. phase 3, p < 0.05; c phase 1 vs. phase 4, p < 0.05; d phase 2 vs. phase 3, p < 0.05; e phase 2 vs. phase 4, p < 0.05; f phase 3 vs. phase 4, p < 0.05.

3.5. Blood Glucose and Lactate

Blood values for glucose and lactate are also presented in Table 2. Values were not affected by R-Ox. Overnight fasting values at rest (phase 1) averaged 4.9 ± 0.1 mM for glucose and 1.7 ± 0.2 mM for lactate, with marginal differences between phases. Blood glucose during exercise and subsequent recovery was lower than the resting value (p = 0.032).

4. Discussion

Women willing to reduce weight by voluntary exercise (20–40 y, BMI: 27.4 ± 2.1) were studied in our “Altitude Simulation Chamber” with the aim to examine potential benefits for weight loss by comparing O2 consumption (VO2) and CO2 production (VCO2) during a single bout of personalized cycling intensity (~40% VO2max) at sea level (0 m) and at simulated 2000 m altitude, i.e., under normal (N-Ox: 20.9%) and mildly reduced (R-Ox: 17.0%) normobaric oxygen, respectively. In line with the review “Ascent to altitude (2000 m) as weight loss method” by Palmer and Clegg [10], we expected a rise in VO2 and a low Respiratory Exchange Ratio (RER: VO2/VCO2) to cover metabolic consequences of R-Ox, in particular a higher recycling of lactate to glucose (Cori cycle). However, in spite of lower absolute SaO2 values and a greater decline from rest to exercise under R-Ox, VO2 and RER reacted equally to N-Ox and R-Ox. For sea level and 2000 m altitude oxygen conditions average net whole body VO2, 13.8 mL O2 per watt, reflected almost full aerobic rather than substantial glycolytic, muscle ATP production during cycling at about 40% of VO2max. Moreover, RER values of 0.83 at rest, not uncommon in women who are overweight [7,17,18], increased equally under both O2 regimes to values close to and beyond unity during and directly after cycling.
Literature reports a wide range of RER values during low to moderate intense aerobic exercise, which suggests phenotype-specific utilization of substrates, as formerly specifically addressed for physiological performance at high altitude [19,20]. Exercise RER values of 0.96 as measured in our subjects at sea level were markedly higher than in other phenotypes; obese women [17], sedentary males [21] and endurance-trained cyclists [22]. Likewise, independent of body fat, distinct pre-diabetic phenotypes may shift substrate oxidation towards less carbohydrate use during exercise [18,23]. Our results agree most with other weight loss-oriented studies saying that effects of regular aerobic exercise on net oxidation of body fat might be negligible in subjects who are slightly overweight [5,6,7].
The observed ‘real-time’ rise in RER induced by cycling is attributed to a rise in oxidative decarboxylation of glucogenic pyruvate to ketogenic acetyl-CoA under control of the key enzyme pyruvate dehydrogenase (PDH) [24]. However, high RER values, well known during strenuous exercise [22] and high-altitude hypoxia [25], are not normally mandatory during intensities of aerobic exercise under N-Ox as in this study [26]. We therefore consider the high RER values in our study as a phenotype-specific flaring of glucogenic substrates, indicating that in our subjects, metabolic flexibility in fuel selection was already impaired under normoxia at sea level [27].
Prior to their exercise, our subjects showed overnight fasting normoglycemia, a RER of 0.83 and lactate levels close to 2 mM, the threshold of hyperlactatemia. This metabolic profile resembles a state of on-going post-exercise recovery and stresses that residual lactate remains to be cleared belatedly. As lactate is hardly cleared by excretion via urine or sweat, avoidance and prevention of hyperlactatemia and lactate-associated acidosis relies on the cross talk between metabolic production and clearance of lactate [15,28,29].
Recent fundamental tracer studies in mice reveal that the majority of glucose enters TCA cycle oxidation via circulating lactate [30]. Applied to humans, this means that a majority of lactate is not produced in response to anaerobic conditions of tissues (Lactate—Type A), but instead by glycolysis under aerobic conditions (Lactate—type B) [31]. This implies that the share of carbohydrate oxidation in aerobic ATP production is better reconsidered as a ‘lactate-based concept’ in which the actual lactate pool in the body (Type A + Type B) is preferably cleared by TCA cycle oxidation and final expiration as CO2 (ketogenic clearance). As far as the liver is able to fulfil an O2 debt equivalent to 6 ATP per mol, the recycling of lactate to glucose (Cori cycle) may act as an additional but temporal and non-oxidative way of lactate clearance (glucogenic clearance). Glucogenic clearance requires ATP to regain glycolytic capacity which is functional to withstand hypoglycemia during periods of high glycolytic activity as anaerobic exercise [24,32]. However, the urge to regain glucose or glycolytic capacity at physical rest in non-diabetic obesity and type 2 diabetes is questionable [33,34,35], and likely stresses a shortage of PDH activity to support ketogenic clearance in these patients.
In other phenotypes, persistent conditions of lactate accumulation may gradually suppress glycolysis and insulin sensitivity of tissues [36,37] heading to a state of hyperinsulinemia [38,39], whereas mRNA and protein levels for pyruvate dehydrogenase may enhance PDH capacity [40]. All these defense responses against hyperlactatemia aim to favor TCA cycle oxidation of lactate-derived acetyl-CoA and expiration as CO2 (RER = 1.00). However, when the amount of PDH-generated acetyl-CoA is not fully balanced by ATP demands for basal metabolism and voluntary physical activity, TCA cycle oxidation and expiration as CO2 may be suspended via a shunt to liponeogenesis (RER > 1.00) [41].
Conclusions of our study are confined by the following limitations. Although our study was calculated to have sufficient power to draw conclusions about assumed changes in energy metabolism, we realize that the pool of participants was relatively small and rather homogenous to allow for generalizations. Furthermore, potential metabolic fates of nutrients in fuel selection (expiration as CO2 or deposition by liponeogenesis) were mainly based on the literature, but should be confirmed and quantified by subject-related tracer studies. In future studies, these limitations should be addressed and responses should be examined for both genders and for different ages and genetic backgrounds, while also sub-clinical phenotype-specific differences in lactate metabolism between individuals, caused by dietary intake [42,43,44], inflammation [32,45], metabolic stress [46] or otherwise [19,30] could be addressed for their impact on inter-individual aspects of exercise capacity, fatigue and weight management. Further insights into metabolic responses could be provided by the sampling of blood at different time points during the study followed by the profiling of circulating metabolites and hormones [47], which will also give improved insight in inter-individual differences. Additionally, the variation in the level of altitude simulation and in personalized sub-maximal workload should be explored for their combined impact on substrate selection during exercise.
In summary, VO2 and RER did not respond to R-Ox in our subjects. Instead, our data clearly suggest that women willing to reduce weight may tend to flare glucogenic substrates before, during and after cycling at about 40% VO2max, by expiration as CO2 and likely in part by liponeogenesis irrespective of normal or mildly reduced normobaric oxygen conditions.
Therefore, we hypothesize that weight loss attempts by exercise could benefit from a ‘pro-active lifestyle for weight loss’ by proper control over lactate responses to dietary intake [42,43,44] supported by regular ‘Activities of Daily Living’ as a general scavenger for circulating lactate of any origin, similar to ‘active cooling down’ after exercise [26]. The lower the drive to expire lactate as CO2, the higher the share of body fat oxidation in aerobic ATP production during exercise of low to moderate intensity under N-Ox, which might also enhance sensitivity for glycolytic muscle ATP production under R-Ox in an “Altitude Simulation Chamber” [10]. Obvious phenotype-specific characteristics of individuals should be respected by providing personalized weight loss strategies.

Supplementary Materials

The following supporting information can be downloaded at: https://www.mdpi.com/article/10.3390/obesities2020016/s1, Table S1 (Individual values Table 1; General characteristics) and Table S2 (Individual values Table 2; Experimental data).

Author Contributions

Conceptualization, V.V.A.M.S., T.M. and J.J.G.C.v.d.B.; Formal Analysis, T.M., J.J.G.C.v.d.B. and V.V.A.M.S.; Funding Acquisition, V.V.A.M.S. and J.K.; Investigation, T.M. and V.V.A.M.S.; Methodology, V.V.A.M.S., J.J.G.C.v.d.B. and T.M.; Supervision, V.V.A.M.S.; Visualization, V.V.A.M.S. and J.K.; Writing—Original Draft, V.V.A.M.S.; Writing—Review and Editing, T.M., J.K. and J.J.G.C.v.d.B. All authors interpreted the results and contributed to writing. All authors have read and agreed to the published version of the manuscript.

Funding

This research was funded the Dutch Ministry of Economic Affairs (PIDON grant 07096).

Institutional Review Board Statement

This study was approved by the Regional Medical Ethics Committee Arnhem—Nijmegen (CMO nr: 2009/341; ABR nr: NL 29211.091.09) and registered as clinical trial (https://doi.org/10.1186/ISRCTN11842323 accessed on 20 February 2022).

Informed Consent Statement

Written informed consent was obtained from all subjects involved in the study.

Data Availability Statement

Raw data generated and analyzed during the current study will be made available from the corresponding author upon reasonable requests for inspection or research purposes for a period of 2 years after publication.

Acknowledgments

The dedicated practical assistance of Heleen van der Wilt (HAN) and Linda Faber (HAN) is highly acknowledged. We express our gratitude to Jan—Willem van Dijk (HAN) for statistical support and comments. We are also very grateful to Frank Stöteler, director HAN—Faculty Health and Social Studies (2007–2013), for his interest and broad support.

Conflicts of Interest

The authors declare no conflict of interest. The funders had no role in the design of the study; in the collection, analyses, or interpretation of data; in the writing of the manuscript, or in the decision to publish the results.

References

  1. WHO. Diet, Nutrition and the Prevention of Chronic Diseases; WHO Technical Report Series; WHO: Geneva Switzerland, 2003; Volume 916, Available online: http://apps.who.int/iris/bitstream/handle/10665/42665/WHO_TRS_916.pdf;jsessionid=F7DDF915029799B7E07FCFDB1432CB28?sequence=1 (accessed on 20 February 2022).
  2. WHO. Obesity and Overweight; WHO Fact Sheet; WHO: Geneva, Swizterland, 2011; Volume 311, Available online: https://www.who.int/news-room/fact-sheets/detail/obesity-and-overweight (accessed on 20 February 2022).
  3. Houmard, J.A.; Tanner, C.J.; Slentz, C.A.; Duscha, B.D.; McCartney, J.S.; E Kraus, W. Effect of the volume and intensity of exercise training on insulin sensitivity. J. Appl. Physiol. 2004, 96, 101–106. [Google Scholar] [CrossRef] [PubMed] [Green Version]
  4. Bajpey, S.; Tanner, C.J.; Slentz, C.A.; Duscha, B.D.; McCartney, J.S.; Hickner, R.C.; Kraus, W.E.; Houmard, J.A. Effect of exercise intensity and volume on persistence of insulin sensitivity during training cessation. J. Appl. Physiol. 2009, 106, 1079–1085. [Google Scholar] [CrossRef] [PubMed] [Green Version]
  5. Wu, T.; Gao, X.; Chen, M.; van Dam, R.M. Long term effectiveness of diet-plus-exercise interventions vs. diet-only interventions for weight loss: A meta-analysis. Obes. Rev. 2009, 10, 313–323. [Google Scholar] [CrossRef] [PubMed]
  6. Boutcher, S.H. High-intensity intermittent exercise and fat loss. J. Obes. 2011, 2011, 868305. [Google Scholar] [CrossRef] [Green Version]
  7. Faghihnia, N.; Siri-Tarino, P.W.; Krauss, R.M.; Brooks, G.A. Energy substrate partitioning and efficiency in individuals with atherogenic lipoprotein phenotype. Obesity 2011, 19, 1360–1365. [Google Scholar] [CrossRef] [Green Version]
  8. Barwell, N.D.; Malkova, D.; Leggate, M.; Gill, J.M.R. Individual responsiveness to exercise-induced fat loss is associated with change in resting substrate utilization. Metab. Clin. Exp. 2009, 58, 1320–1328. [Google Scholar] [CrossRef]
  9. Jobson, S.A.; Hopker, J.G.; Korff, T.; Passfield, L. Gross efficiency and cycling performance: A brief review. J. Sci. Cycl. 2012, 1, 3–8. [Google Scholar]
  10. Palmer, B.F.; Clegg, D.J. Ascent to altitude as a weight loss method: The good and bad of hypoxia inducible factor activation. Obesity 2014, 22, 311–317. [Google Scholar] [CrossRef]
  11. Johnson, A.O.C. Chronic obstructive pulmonary disease• 11: Fitness to fly with COPD. Thorax 2003, 58, 729–732. [Google Scholar] [CrossRef] [Green Version]
  12. Borg, G.A. Psychophysical bases of perceived exertion. Med. Sci. Sports Exerc. 1982, 14, 377–381. [Google Scholar] [CrossRef]
  13. Jéquier, E. Indirect calorimetry: A method to assess energy and substrate balances. In Current Topics in Diabetes Research; Belfiore, F., Brgman, R.N., Molinatti, G.M., Eds.; Karger: Basel, Switzerland, 1993; Volume 12, pp. 32–38. [Google Scholar]
  14. Elia, M.; Livesey, G. Theory and validity of indirect calorimetry during net lipid synthesis. Am. J. Clin. Nutr. 1988, 47, 591–607. [Google Scholar] [CrossRef] [Green Version]
  15. Jeukendrup, A.E.; Wallis, G.A. Measurement of substrate oxidation during exercise by means of gas exchange measurements. Int. J. Sports Med. 2005, 26 (Suppl. S1), S28–S37. [Google Scholar] [CrossRef]
  16. Bakker, J.; Nijsten, M.W.; Jansen, T.C. Clinical use of lactate monitoring in critically ill patients. Ann. Intensive Care 2013, 3, 12. [Google Scholar] [CrossRef] [Green Version]
  17. Van Aggel-Leijsen, D.P.; Saris, W.; Wagenmakers, A.J.; Hul, G.B.; van Beek, M.A. The effect of low-intensity exercise training on fat metabolism of obese women. Obes. Res. 2001, 9, 86–96. [Google Scholar] [CrossRef]
  18. Braun, B.; Sharoff, C.; Chipkin, S.R.; Beaudoin, F. Effects of insulin resistance on substrate utilization during exercise in overweight. J. Appl. Physiol. 2004, 97, 991–997. [Google Scholar] [CrossRef] [Green Version]
  19. Braun, B.; Mawson, J.T.; Muza, S.R.; Dominick, S.B.; Brooks, G.A.; Horning, M.A.; Rock, P.B.; Moore, L.G.; Mazzeo, R.S.; Ezeji-Okoye, S.C.; et al. Women at altitude: Carbohydrate utilization during exercise at 4300 m. J. Appl. Physiol. 2000, 88, 246–256. [Google Scholar] [CrossRef]
  20. Hochachka, P.W.; Beatty, C.L.; Burelle, Y.; Trump, M.E.; McKenzie, D.C.; Matheson, G.O. The lactate paradox in human high-altitude physiological performance. News Physiol. Sci. 2002, 17, 122–126. [Google Scholar] [CrossRef] [Green Version]
  21. Katayama, K.; Goto, K.; Ishida, K.; Ogita, F. Substrate utilization during exercise and recovery at moderate altitude. Metabolism 2010, 59, 959–966. [Google Scholar] [CrossRef]
  22. Romijn, J.A.; Coyle, E.F.; Sidossis, S.; Gastaldelli, A.; Horowitz, J.F.; Endert, E.; Wolfe, R.R. Regulation of endogenous fat and carbohydrate metabolism in relation to exercise intensity and duration. Am. J. Physiol. 1993, 265, E380–E391. [Google Scholar] [CrossRef] [Green Version]
  23. Malin, S.K.; Viskochil, R.; Oliver, C.; Braun, B. Mild fasting hyperglycemia shifts fuel reliance toward fat during exercise in adults with impaired glucose tolerance. J. Appl. Physiol. 2013, 115, 78–83. [Google Scholar] [CrossRef] [Green Version]
  24. Bender, D.A. Introduction to Nutrition and Metabolism, 4th ed.; Taylor & Francis Group: London, UK, 2008; ISBN 1-4200-4312-9. [Google Scholar]
  25. Braun, B. Effects of high altitude on substrate use and metabolic economy: Cause and effect? Med. Sci. Sports Exerc. 2008, 40, 1495–1500. [Google Scholar] [CrossRef] [PubMed]
  26. McArdle, W.D.; Katch, F.I.; Katch, V.L. Exercise Physiology, Energy, Nutrition & Human Performance, 6th ed.; Lippincott Williams & Wilkins: Baltimore, MD, USA, 2007; ISBN 0-7817-4990-5. [Google Scholar]
  27. Goodpaster, B.H.; Sparks, L.M. Metabolic flexibility in health and disease. Cell Metab. 2017, 25, 1027–1036. [Google Scholar] [CrossRef] [PubMed] [Green Version]
  28. Nichol, A.D.; Egi, M.; Pettila, V.; Bellomo, R.; French, C.; Hart, G.; Cooper, D.J.; Stachowski, E.; Reade, M.C.; Bailey, M.; et al. Relative hyperlactemia and hospital mortality in critically ill patients: A retrospective multi-centre study. Crit. Care 2010, 14, R25. Available online: http://ccforum.com/content/14/1/R25 (accessed on 20 February 2022). [CrossRef] [PubMed] [Green Version]
  29. Shapiro, N.I.; Howell, M.D.; Talmor, D.; Nathanson, L.A.; Lisbon, A.; Wolfe, R.E.; Weiss, J.W. Serum lactate as a predictor of mortality in emergency department patients with infection. Ann. Emerg. Med. 2005, 45, 524–528. [Google Scholar] [CrossRef]
  30. Hui, S.; Ghergurovich, J.; Morscher, R.; Jang, C.; Teng, X.; Lu, W.; Esparza, L.A.; Reya, T.; Zhan, L.; Guo, J.Y.; et al. Glucose feeds the TCA cycle via circulating lactate. Nature 2017, 551, 115–118. [Google Scholar] [CrossRef] [Green Version]
  31. Redant, S.; Hussein, H.; Mugisha, A.; Attou, R.; De Bels, D.; Honore, P.M.; De Laet, C.C. Differentiating hyperlactatemia type A from B: How does the lactate/pyruvate ratio help? J. Transl. Int. Med. 2019, 7, 43–45. [Google Scholar] [CrossRef] [Green Version]
  32. Leverve, X. Metabolic and nutritional consequences of chronic hypoxia. Clin. Nutr. 1998, 17, 241–251. [Google Scholar] [CrossRef]
  33. Le Stunff, C.; Bougnères, P.F. Alterations of plasma lactate and glucose metabolism in obese children. Am. J. Physiol. 1996, 271, E814–E820. [Google Scholar] [CrossRef]
  34. Basu, R.; Schwenk, W.F.; Rizza, R.A. Both fasting glucose production and disappearance are abnormal in people with “mild” and “severe” type 2 diabetes. Am. J. Physiol. 2004, 287, E55–E62. [Google Scholar] [CrossRef]
  35. Consoli, A.; Nurjhan, N.; Reilly, J.J.; Bier, D.M.; E Gerich, J. Mechanism of increased gluconeogenesis in noninsulin-dependent diabetes mellitus. J. Clin. Investig. 1999, 86, 2038–2045. [Google Scholar] [CrossRef]
  36. Choi, C.S.; Kim, Y.B.; Lee, F.N.; Zabolotny, J.M.; Kahn, B.B.; Youn, J.H. Lactate induces insulin resistance in skeletal muscle by suppressing glycolysis and impairing insulin signaling. Am. J. Physiol. Endocrinol. Metab. 2002, 283, 233–240. [Google Scholar] [CrossRef] [Green Version]
  37. Vettor, R.; Lombardi, A.M.; Fabris, R.; Pagano, C.; Cusin, I.; Rohner-Jeanrenaud, F.; Federspil, G.; Jeanrenaud, B. Lactate infusion in anesthetized rats produces insulin resistance in heart and skeletal muscles. Metabolism 1997, 46, 684–690. [Google Scholar] [CrossRef]
  38. Feneberg, R.; Sparber, M.; Veldhuis, J.D.; Mehls, O.; Ritz, E.; Schaefer, F. Synchronous fluctuations of blood insulin and lactate concentrations in humans. J. Clin. Endocrinol. Metab. 1999, 84, 220–227. [Google Scholar] [CrossRef]
  39. Dankner, R.; Chetrit, A.; Shanik, M.H.; Raz, I.; Roth, J. Basal-state hyperinsulinemia in healthy normoglycemic adults is predictive of type 2 diabetes over 24-year follow-up. Diabetes Care 2009, 32, 1464–1466. [Google Scholar] [CrossRef] [Green Version]
  40. Lombardi, A.M.; Fabris, R.; Bassetto, F.; Serra, R.; Leturque, A.; Federspil, G.; Girard, J.; Vettor, R. Hyperlactemia reduces muscle glucose uptake and GLUT-4 mRNA while increasing (E1α)PDH gene expression in rat. Am. J. Physiol. 1999, 276, E922–E929. [Google Scholar] [CrossRef]
  41. Trayhurn, P. Hypoxia and adipose tissue function and dysfunction in obesity. Physiol. Rev. 2013, 93, 1–21. [Google Scholar] [CrossRef] [Green Version]
  42. DiGirolamo, M.; Newby, F.D.; Lovejoy, J. Lactate production in adipose tissue: A regulated function with extra-adipose implications. FASEB J. 1992, 6, 2405–2412. [Google Scholar] [CrossRef]
  43. Woerle, H.J.; Meyer, C.; Dostou, J.M.; Gosmanov, N.R.; Islam, N.; Popa, E.; Wittlin, S.D.; Welle, S.L.; Gerich, J.E. Pathways for glucose disposal after meal ingestion in humans. Am. J. Physiol. 2003, 284, E716–E725. [Google Scholar] [CrossRef] [Green Version]
  44. Alemany, M. Utilization of dietary glucose in the metabolic syndrome. Nutr. Metab. 2011, 8, 74. [Google Scholar] [CrossRef] [Green Version]
  45. Gaber, T.; Strehl, C.; Buttgereit, F. Metabolic regulation of inflammation. Nat. Rev. Rheumatol. 2017, 13, 267–279. [Google Scholar] [CrossRef]
  46. Preiser, J.C.; Ichai, C.; Orban, J.C.; Groeneveld, A.B.J. Metabolic response to the stress of critically illness. Br. J. Anaest. 2014, 113, 945–954. [Google Scholar] [CrossRef] [PubMed] [Green Version]
  47. Janssen, J.J.E.; Lagerwaard, B.; Porbahaie, M.; Nieuwenhuizen, A.G.; Savelkoul, H.F.J.; van Neerven, R.J.J.; Keijer, J.; de Boer, V.C.J. Extracellular flux analyses reveal differences in mitochondrial PBMC metabolism between high-fit and low-fit females. Am. J. Physiol.—Endocrinol. Metab. 2022, 322, E141–E153. [Google Scholar] [CrossRef] [PubMed]
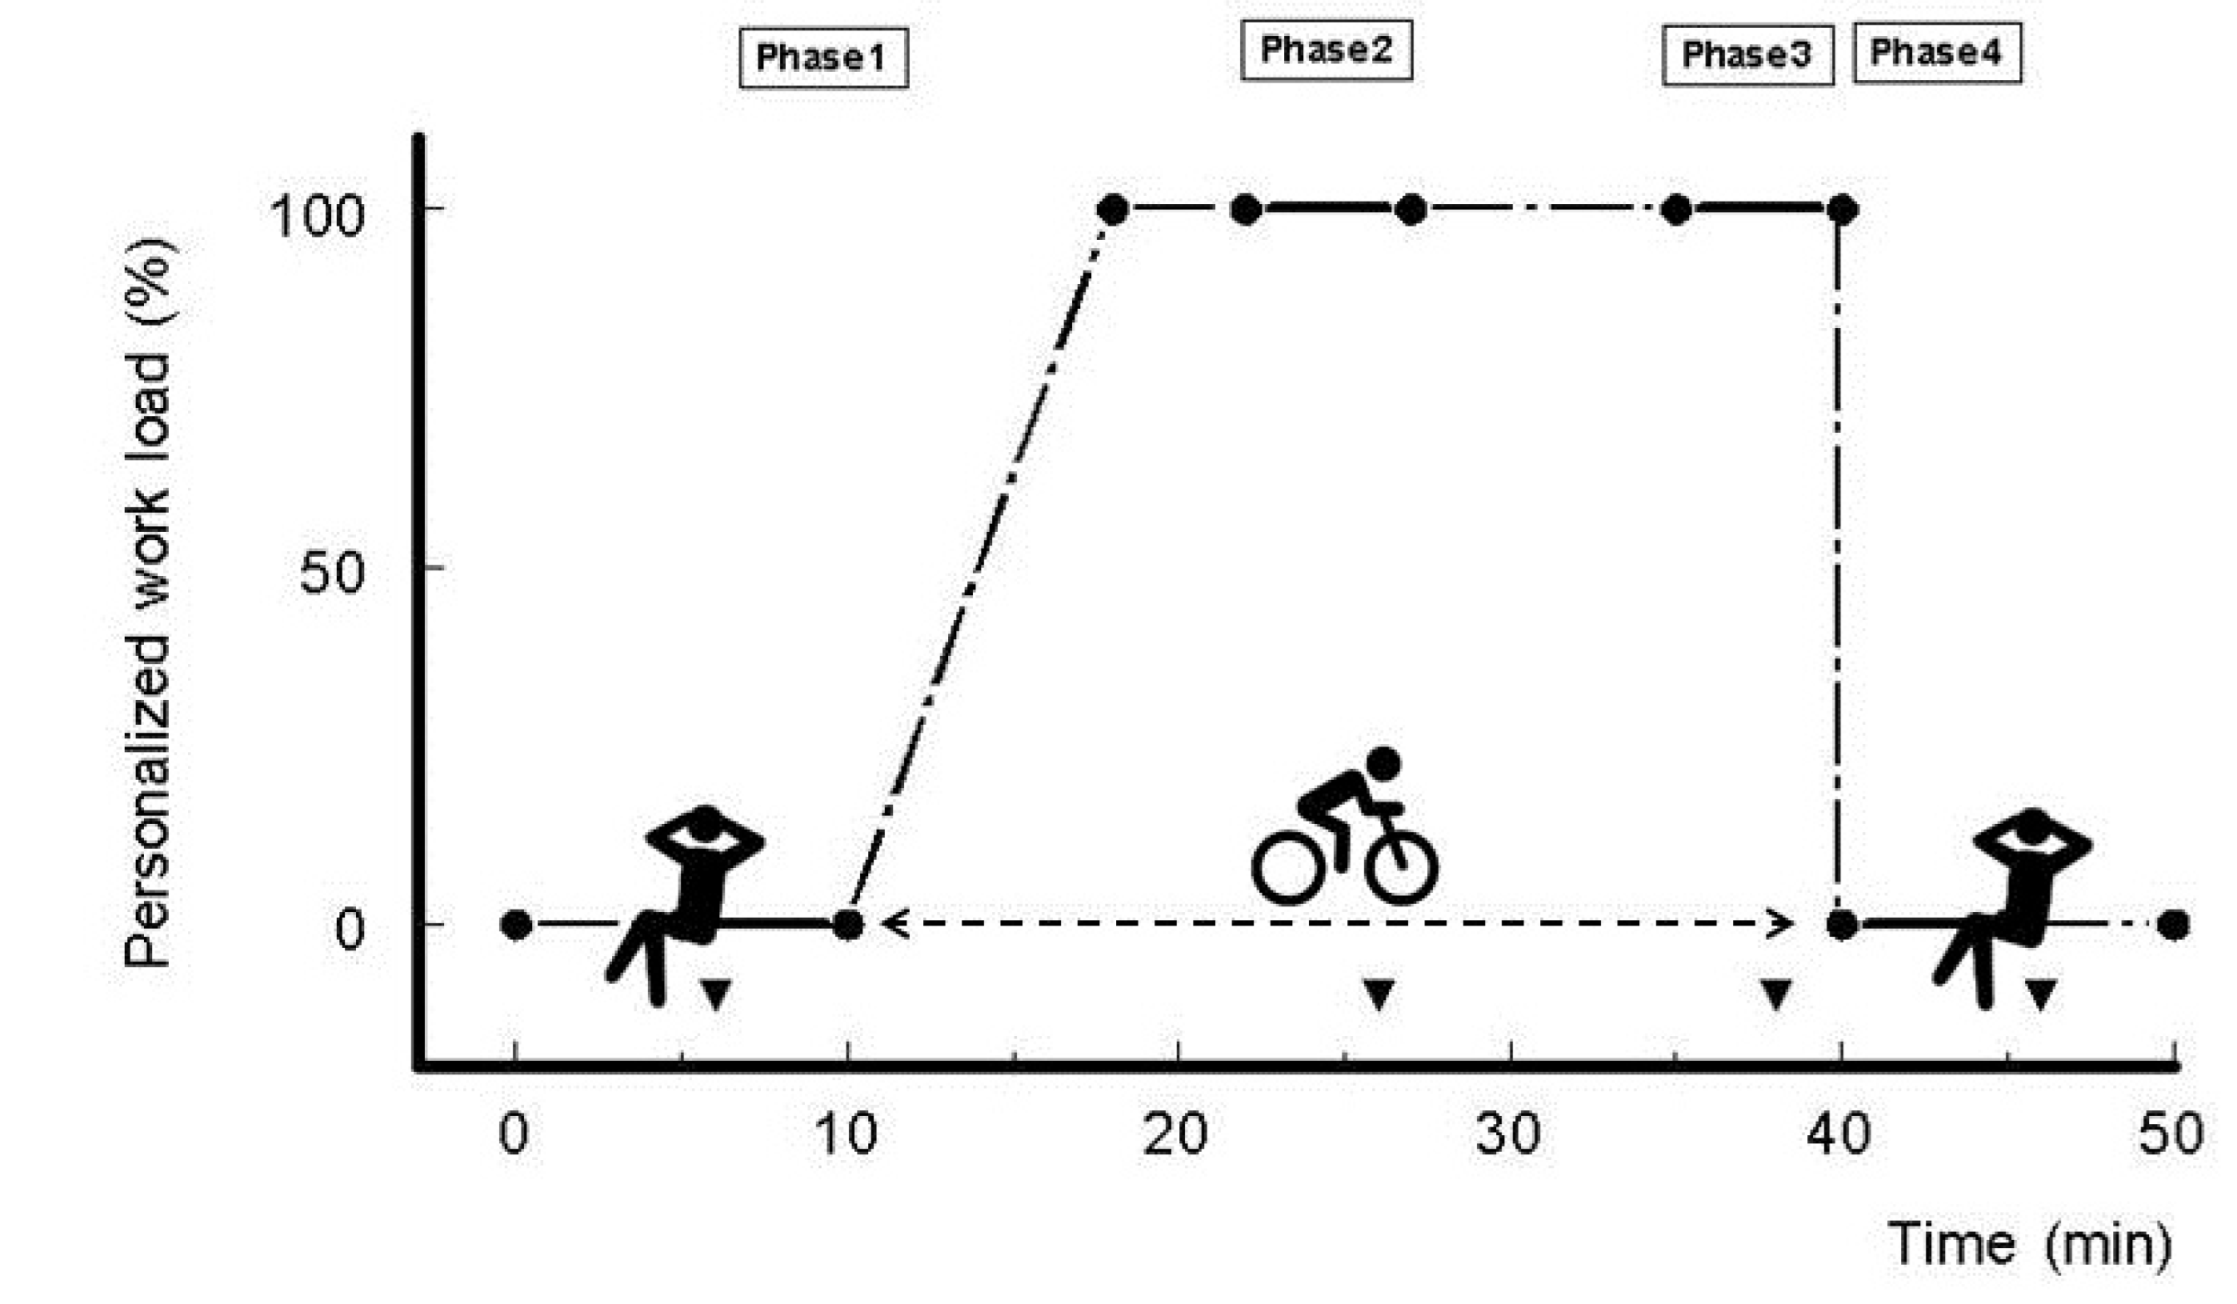
Figure 1. Experimental cycling protocol (see corresponding text for details).
Obesities 02 00016 g001
Table 1. General characteristics of female subjects (n = 18).
Mean ± SDRange
Age (years)29.3 ± 6.520–40
Height (cm)167 ± 4.9157–175
Body mass (kg)76.8 ± 7.265.4–89.0
BMI (kg·m−2)27.4 ± 2.124.0–31.2
VO2max (mL·kg−1·min−1)
HRmax
RPEmax (screening)
33.9 ± 5.6
185 ± 9.6
14.1 ± 2.5
22.6–43.4
162–203
10–20
Personalized workload (watt)54.2 ± 11.740–70
Publisher’s Note: MDPI stays neutral with regard to jurisdictional claims in published maps and institutional affiliations.