Article

Trends in the Prevalence of Overweight and Obesity and Associated Socioeconomic and Household Environmental Factors among Women in Nepal: Findings from the Nepal Demographic and Health Surveys

1
Department of Architecture and Urban Planning, Institute of Engineering, Tribhuvan University, Lalitpur 44600, Nepal
2
Philanthropy Nepal (Paropakari Nepal) Research Collaboration, Auburn, NSW 2144, Australia
3
East West College of Pharmacy, Rajiv Gandhi University of Health Sciences, Bengaluru 560091, India
4
Department of Pediatrics, Nepal Medical College Teaching Hospital, Jorpati, Kathmandu 44600, Nepal
5
School of Health Sciences, Western Sydney University, Penrith, NSW 2751, Australia
6
School of Medicine, Western Sydney University, Campbelltown, NSW 2560, Australia
*
Author to whom correspondence should be addressed.
Obesities 2021, 1(2), 113-135; https://doi.org/10.3390/Obesities1020011
Submission received: 26 June 2021 / Revised: 20 August 2021 / Accepted: 23 August 2021 / Published: 2 September 2021

Abstract

:
This study aimed to examine the trends in the prevalence of overweight and obesity and to determine the associated socioeconomic and household environmental factors among women in Nepal. Using nationally representative data from the 1996, 2001, 2006, 2011, and 2016 cross-sectional Nepal Demographic and Health Surveys (NDHSs) (n = 33,507), the prevalence of overweight–obesity (body mass index (BMI) ≥ 25 kg/m2) and obesity (BMI ≥ 30 kg/m2) among women aged 15–49 years were examined. From the latest NDHS 2016, non-pregnant women with recorded anthropometric measurements (n = 6165) were included in the final analyses. Multivariate logistic regression models were used to determine the socioeconomic and household environmental factors associated with BMI ≥ 25 and BMI ≥ 30. Between 1996 and 2016, the prevalence of overweight–obesity increased from 1.8% to 19.7%, while the prevalence of obesity increased from 0.2% to 4.1%. Age, marital status, wealth index, province of residence, type of cooking fuel, and household possessions—refrigerator and bicycle were significantly associated with having overweight–obesity and obesity. Similarly, educational status, religion, type of toilet facility, and household possessions—television and mobile phone were significantly associated with having overweight–obesity. Given the alarming increase in the prevalence of overweight and obesity among Nepalese women, there is an urgent need for interventions addressing these critical socioeconomic and household environmental factors.

1. Introduction

Obesity is a global public health issue, with the worldwide obesity rates having tripled in the last four decades and continuously escalating in pandemic proportions [1]. The global prevalence of overweight–obesity (body mass index (BMI) ≥ 25 kg/m2) and obesity (BMI ≥ 30 kg/m2) among adults aged 18 years and over were 39% and 13%, respectively in 2016 [2]. Overweight and obesity are major risk factors for several non-communicable diseases (NCDs) including cardiovascular and kidney diseases, type 2 diabetes, some cancers, musculoskeletal disorders, and other chronic diseases [3,4]. High BMI is the fourth leading cause of risk-attributable mortality [5], with a reduced life expectancy of 5–20 years, depending on the severity of the condition and presence of comorbidities [1].
The prevalence of overweight and obesity is reported to be higher among women as compared to men across the globe, in both developed and developing countries [1,4]. This trend can be observed in the global prevalence of overweight–obesity (40% women vs. 39% men) and obesity (15% women vs. 11% men) [2]. Research suggests a sex-specific vulnerability of obesity and its associated complications in women as compared to men [6,7]. One of the evolutionary origins of this vulnerability could be explained by the fact that women are physiologically adapted to store more fat and have greater adipose stores and higher total percentage body fat than men [7]. Women of reproductive age are even more susceptible to having overweight or obesity, which could be attributed to general weight gain in childbearing years, gestational weight gain and retention, and adverse lifestyle risk factors during pregnancy and in the postpartum period [8]. Apart from the increased risk of chronic NCDs in women including multiple gynaecological cancers (e.g., ovarian, cervical, and breast cancer), obesity has wide-ranging effects on their reproductive health [9]. Obesity is associated with increased risk of infertility, polycystic ovarian syndrome, and pregnancy-related complications including miscarriage, stillbirth, caesarean section, and birth defects [9,10]. Moreover, maternal obesity during pregnancy has a long-lasting impact on the offspring such as increased risk of hyperglycaemia, hyperlipidaemia, and obesity [10]. Therefore, identification of the presence of overweight and obesity among women of reproductive age is essential for timely prediction of complications, and such that interventions can be tailored simultaneously.
The prevalence of overweight and obesity is increasing more alarmingly in low- and middle- income countries (LMICs) [11], with 77% of the global NCD-related deaths occurring in LMICs [12]. The NCD Risk Factor Collaboration [13] reported an accelerated increase in BMI in southeast Asian and south Asian countries including Nepal. Both overweight and obesity rates have been increasing even in south Asian countries with historically high levels of undernutrition such as Nepal, Bangladesh, and India [14]. Southeast Asia also recorded the highest increase in NCD deaths, with many deaths occurring prematurely, before the age of 70 years [15]. The ever-rising rates of overweight and obesity and the simultaneous rise in obesity-related NCDs threaten the progress towards achieving the Sustainable Development Goals (SDGs) by 2030, particularly Goal 3, which includes a target of a one-third reduction of premature mortality from NCDs by 2030 [16].
Along with the rapidly increasing population in Nepal, from 15 million in 1981 to nearly 29 million in 2016 [17,18], the prevalence of overweight and obesity are also steadily on the rise. The Nepal Demographic and Health Survey (NDHS) 2016 report [19] highlighted that among men and women aged 15–49 years, women had a higher prevalence of both overweight or obesity (BMI ≥ 25; 22% vs. 17%) and obesity (BMI ≥ 30; 5% vs. 3%). Identifying the underlying causes of overweight and obesity among women in Nepal is therefore pivotal to developing strategies to reduce the prevalence rates as well as the health burden due to the associated NCDs. Using the NDHS 2016 data, a few prior studies [20,21,22,23] have explored the factors associated with overweight and obesity among adults in Nepal. However, only one study [21] focused on women while exploring the association between the frequency of television watching and overweight and obesity, whereas only one study of Nepalese adults [20] used the World Health Organisation (WHO) cut-off of BMI [24]. No studies have explored the trends in its prevalence among women across the NDHS survey years, and most prior studies have explored limited potential sociodemographic factors associated with overweight and obesity.
Overweight and obesity are complex conditions of multifactorial origin, resulting from an interplay between heterogenic factors, which derive from an individual’s eating patterns, physical activity, and energy expenditure determinants [1]. Obesity is intrinsically influenced by a combination of biological, genetic, social, environmental, and behavioural determinants [25]. Both lifestyle and environmental factors act in a synergistic manner fuelling the obesity epidemic in developing countries, which is highly influenced by the progressive socioeconomic development taking place in LMICs [26]. Research suggests that weight and ultimately health are influenced by both individual-specific characteristics and aggregate-level socioeconomic and environmental factors, and the household environment where one resides is more important for health outcomes than individual factors [27]. As overweight and obesity often result from complex interactions, reducing this burden requires multifaceted approaches that combine individual-level interventions with those undertaken at a societal and environmental scale [1]. In the context of Nepalese women, a thorough and comprehensive investigation of a wide range of socioeconomic and household environmental determinants is warranted to identify the factors independently associated with having overweight and obesity. Identifying the key modifiable socioeconomic and household environmental factors, as well as women who are at a high-risk of having overweight and obesity, may help guide the timely development of promising and feasible public health intervention strategies to address the growing overweight and obesity pandemic.
Therefore, the aims of this study were to examine the trends in the prevalence of overweight and obesity and to determine the associated socioeconomic and household environmental factors among women in Nepal.

2. Methods

2.1. Study Design

Using the nationally representative data from the 1996, 2001, 2006, 2011, and 2016 NDHSs [28], and based on the WHO cut-off of BMI [24], the trends in the prevalence of overweight–obesity (BMI ≥ 25) and obesity (BMI ≥ 30) were examined among non-pregnant Nepalese women of reproductive age (15–49 years). Furthermore, based on the latest NDHS 2016, the socioeconomic and household environmental factors associated with BMI ≥ 25 and BMI ≥ 30 were investigated.

2.2. Data Sources

This study is a secondary analysis of the open-access datasets of the 1996, 2001, 2006, 2011, and 2016 NDHSs [28]. NDHS is a nationally representative population-based cross-sectional survey conducted about every five years as a part of the Demographic and Health Surveys (DHS) Program [29]. Funded by the United States Agency for International Development (USAID) and implemented by the Inner City Fund (ICF) International, the DHS Program has provided technical assistance to conduct DHS in over 90 low- and middle- income countries globally [30]. The NDHSs are conducted by New ERA under the leadership of the Ministry of Health, Nepal [19,31,32,33,34].

2.3. Sampling Design

The NDHSs used a two-stage or three-stage stratified cluster sampling design. All districts of Nepal were covered, which were then stratified into rural and urban areas. In the first stage, wards or sub-wards were selected as the primary sampling units (PSUs) using a probability proportional to size method. In the final stages, households were selected either from the sample PSUs or from a sample enumeration area (EA) which was selected from each PSU. A detailed methodology of each NDHS can be found in the individual NDHS reports [19,31,32,33,34].

2.4. Data Collection

The NDHSs used a woman’s questionnaire to collect information from woman aged 15–49 years. An adapted version of the standard DHS woman’s questionnaire was used so that it reflected the sociodemographic characteristics relevant to Nepal. The household questionnaire was used to collect information on household characteristics, while the biomarker questionnaire was used to record anthropometric measurements. Firstly, trained field staff interviewed the households, followed by individual interviews with the eligible women in that household. Trained female field staff recorded the height and weight measurements at the study participants’ homes using standard DHS procedures [19,31,32,33,34].

2.5. Sample Size

The 1996, 2001, 2006, 2011, and 2016 NDHSs include 8429, 8726, 10,793, 12,674, and 12,862 women, yielding a response rate of 98.2%, 98.2%, 98.4%, 98.1%, and 98.3%, respectively. The 1996 and 2001 NDHSs included ever-married women aged 15–49 years, while the 2006, 2011, and 2016 NDHSs include all women aged 15–49 years. Height and weight were recorded for all interviewed women in the NDHSs, apart from the 1996 NDHS which collected anthropometric measurements only in women with children aged three years or below [19,31,32,33,34]. In this study, women who were pregnant at the time of the survey and those with missing values for height and/or weight measurements were excluded. After applying the exclusion criteria, a total sample of 33,507 women aged 15–49 years were included in this study, which were extracted from the 1996 (n = 3420), 2001 (n = 7959), 2006 (n = 10,116), 2011 (n = 5847), and 2016 (n = 6165) NDHSs.

2.6. Outcome Variables

The outcome variables of this study were overweight–obesity and obesity. BMI was calculated as weight in kilograms divided by the square of height in meters (kg/m2). BMI was then categorised according to the World Health Organisation (WHO) BMI classification [24]: underweight (<18.5 kg/m2), normal weight (18.5 to <25 kg/m2), overweight (25 to <30 kg/m2), and obese (≥30 kg/m2). BMI ≥ 25 was used to determine the prevalence of overweight–obesity, while BMI ≥ 30 was used to determine the prevalence of obesity.

2.7. Explanatory Variables

Based on the review of existing literature and available data contained in the NDHS datasets, the socioeconomic and household environmental characteristics that could have a potential association with overweight and obesity were examined.

2.7.1. Socioeconomic Factors

For individual-level factors, age, educational status, and employment status were included. Age was categorised into three groups, namely 15–24 years, 25–34 years, and 35–49 years. Educational status was classified as no formal education, primary, secondary, and higher education. Employment status was categorised as not currently employed and currently employed. Household-level factors included marital status, number of household members, wealth index, and religion. Marital status was categorised into three groups—never married, married/living with a partner, and widowed/divorced/separated. Number of household members were categorised into two groups (≤5 and >5). Wealth index was categorised into five groups (poorest, poorer, middle, richer, and richest) as per the DHS categorisation. In brief, households were scored on the basis of housing characteristics such as the source of drinking water, toilet facilities, and flooring materials, as well as the number and kinds of consumer goods they own including television, bicycle, and car. Principal component analysis was used to derive these scores. National wealth quintiles were then compiled, the household score was assigned to each household member, each person in the household population was ranked by their score, and the distribution was divided into five equal categories, each comprising 20% of the population [19]. Similarly, religion was categorised as Hindu, Buddhist, Muslim, or other.

2.7.2. Household Environmental Factors

Environmental factors based on the geographical location, such as the place and province of residence, and ecological zone were considered. Place of residence included urban and rural, while province of residence comprised of seven categories, from Province 1 to Province 7. Ecological zone was categorised as mountain, hill, and terai. Other factors included were household facilities (source of drinking water, type of toilet facility, cooking fuel, and access to electricity); housing characteristics (main floor, wall, and roof materials); and household possessions (refrigerator, television, mobile phone, bicycle, and motorised vehicle). Based on the categorisation indicated in the NDHS 2016 report [19], both source of drinking water and type of toilet facility were categorised as unimproved and improved; cooking fuel was classified as solid fuel and clean fuel; and access to electricity was classified as ‘no’ and ‘yes’. The main floor, wall, and roof materials were also categorised as unimproved and improved. The five household possessions—refrigerator, television, mobile phone, bicycle, and motorised vehicle (motorcycle/scooter and car/truck) were categorised as ‘no’ and ‘yes’. Table 1 outlines the development of categories for explanatory variables based on the available categories in the NDHS datasets.

2.8. Statistical Analysis

The Statistical Package for Social Sciences, Version 25 (SPSS for MacOS, SPSS Inc., Chicago, IL, USA), was used for data analysis. Firstly, from the 1996, 2001, 2006, 2011, and 2016 NDHSs, the prevalence of overweight–obesity (BMI ≥ 25) and obesity (BMI ≥ 30) were calculated and reported as percentages. Secondly, from the NDHS 2016, the socioeconomic and household environmental factors associated with BMI ≥ 25 and BMI ≥ 30 were investigated. Descriptive statistics were calculated to determine the characteristics of the study participants and the prevalence of overweight–obesity and obesity in relation to the socioeconomic and household environmental factors, which were reported in the form of frequency (n), percentages (%), and mean ± standard deviations.
Univariate logistic regression analysis followed by multivariate logistic regression analysis were performed to determine the factors associated with overweight–obesity (BMI ≥ 25) and obesity (BMI ≥ 30). From the univariate model, variables that were significant at p < 0.2 were included in the multivariate model. Then, using a backward stepwise procedure, the model was reduced, whilst assessing the model fitness to prevent dropping of non-significant variables that affect the model fitness. The Hosmer–Lemeshow statistic was used to assess the goodness-of-fit of the model against the outcomes [35]. The final model consists of variables, which when excluded, cause a significant change in deviance (p < 0.05), compared with the corresponding X2 test statistic on the relevant degrees of freedom. The unadjusted crude odds ratio (COR) and adjusted odds ratio (AOR) with a 95% confidence interval (95% CI) were also reported.

2.9. Ethical Considerations

The data used in this study were extracted from the NDHS datasets [28], which are publicly available with all personal identifier information removed. Permission to access the datasets was granted through registering with the DHS program website and submitting an application outlining the intended use of the datasets. Informed consent was obtained from the study participants before data collection. The data collection tools and procedures for NDHSs were approved by the independent review boards of New ERA and ICF Macro International. The ethical approval of all NDHSs were obtained from the ethical review board of Nepal Health Research Council and human research ethics committee of ICF Macro International [19,31,32,33,34].

3. Results

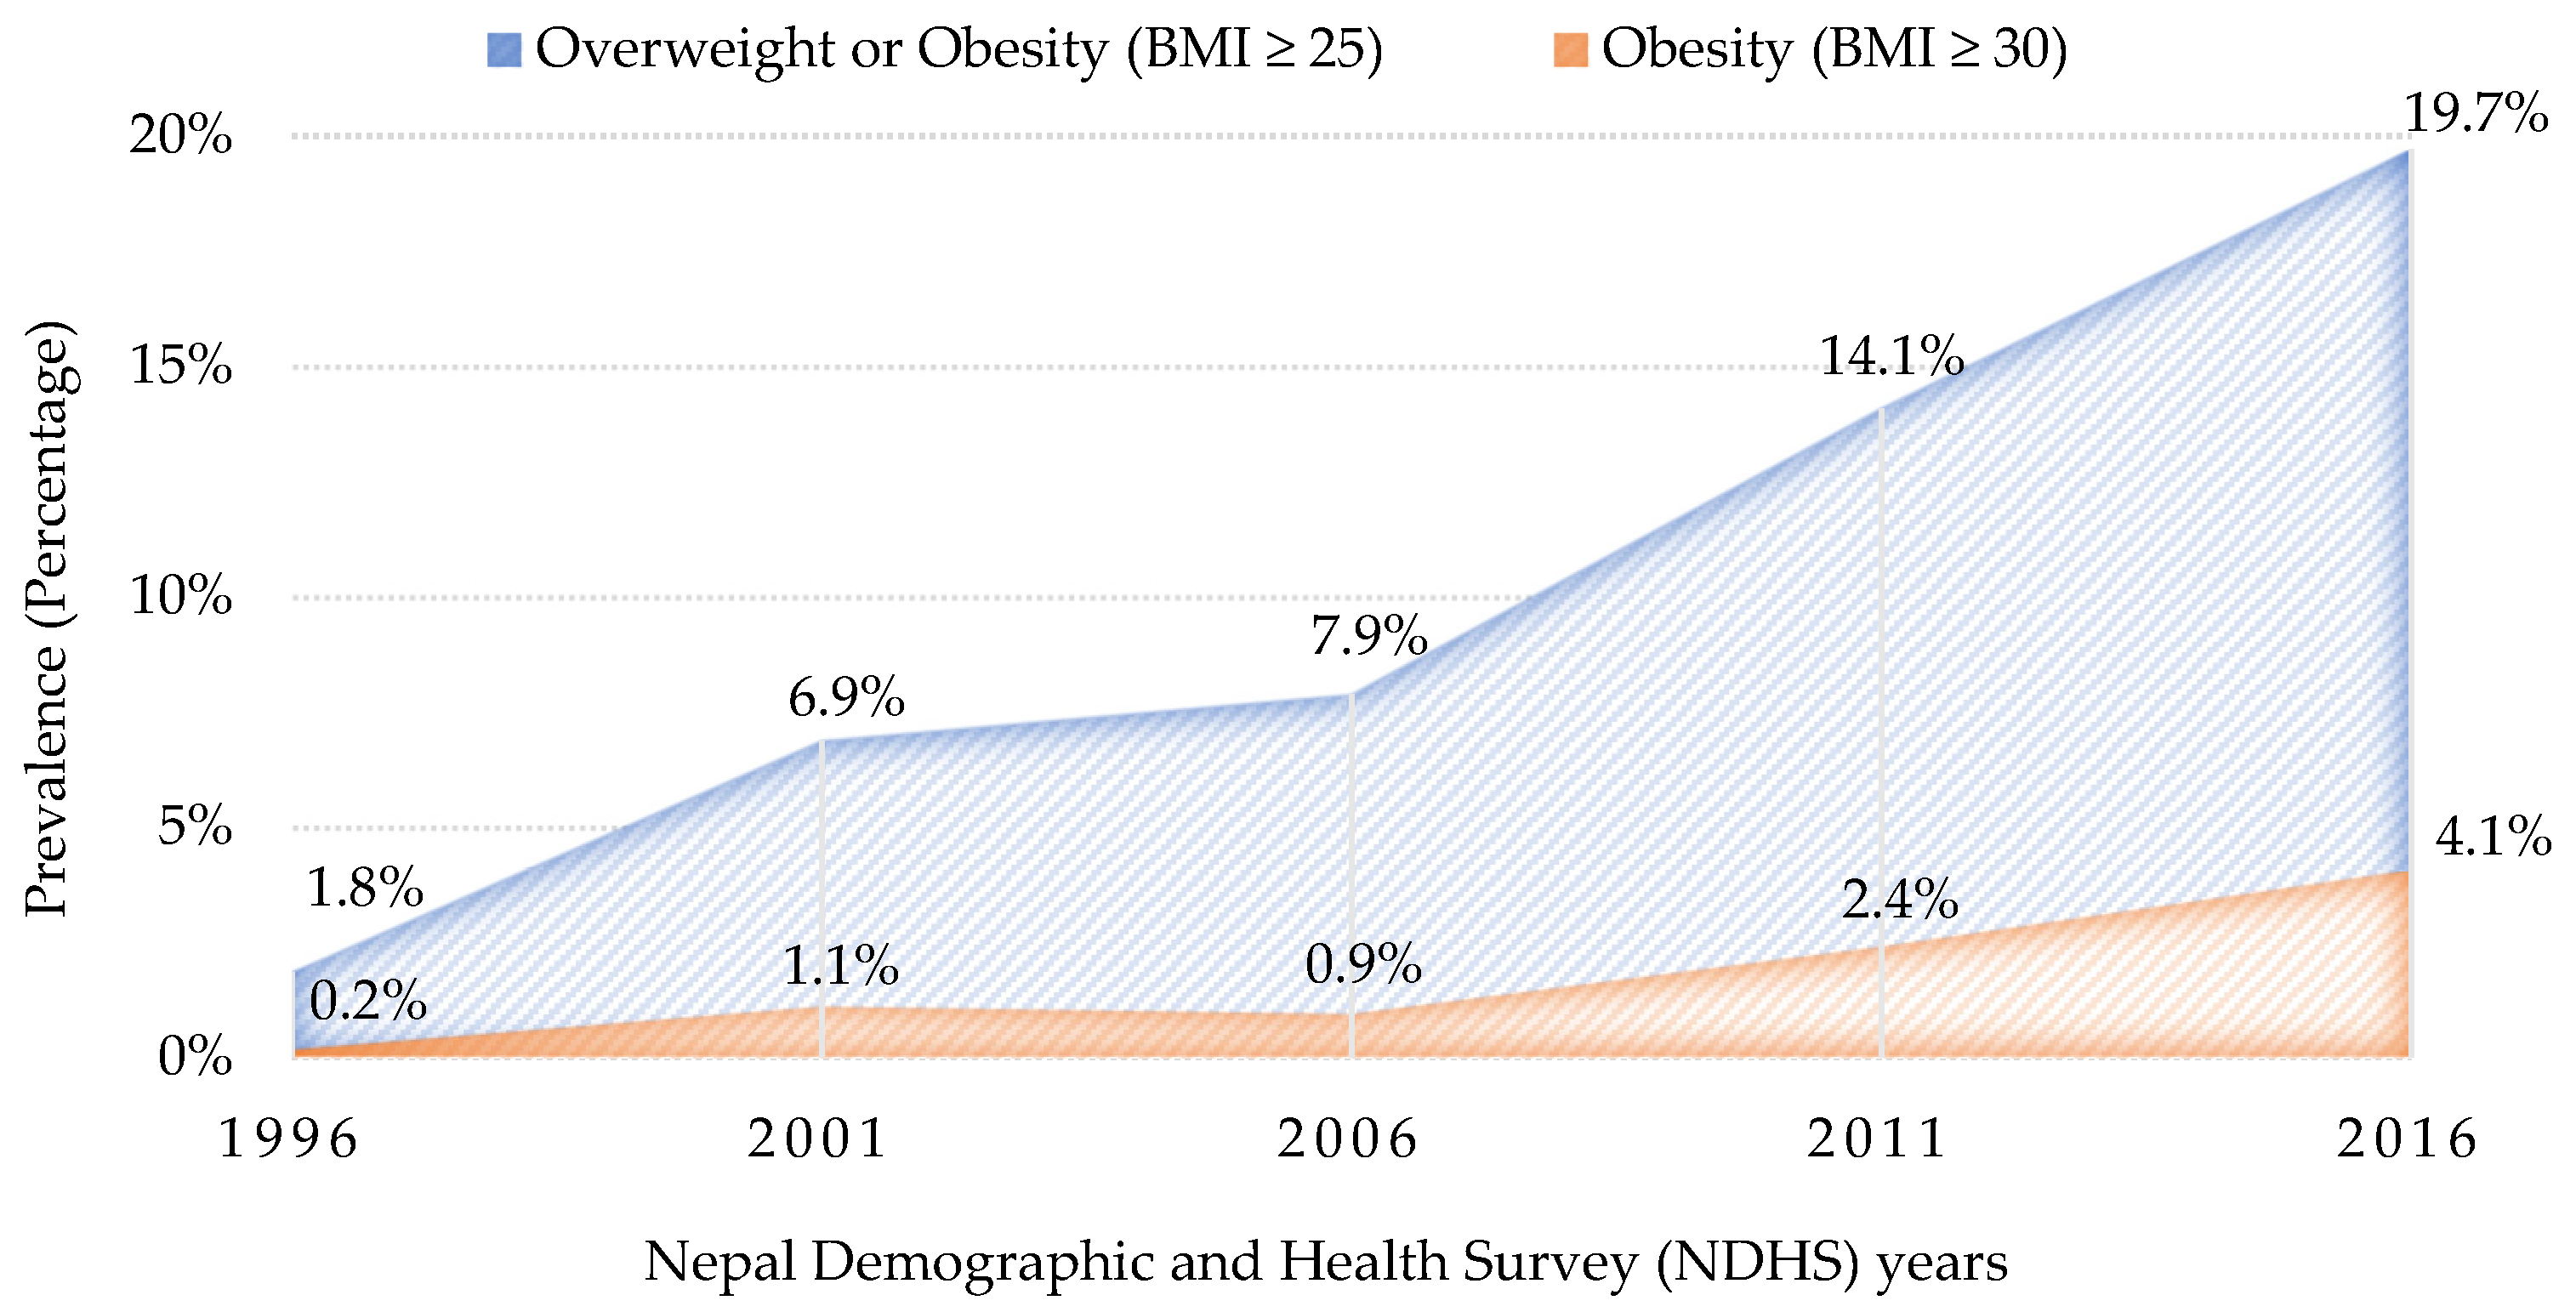
3.1. Trends in the Prevalence of Overweight and Obesity

As shown in Figure 1, an increasing trend in the prevalence of overweight and obesity was observed among women in Nepal over the NDHS survey years 1996–2016. Conversely, the prevalence of both underweight and normal weight decreased between 1996 and 2016. The prevalence of overweight–obesity (BMI ≥ 25) was 1.8%, 6.9%, 7.9%, 14.1%, and 19.7% in 1996, 2001, 2006, 2011, and 2016, respectively, whereas the prevalence of obesity (BMI ≥ 30) was 0.2%, 1.1%, 0.9%, 2.4%, and 4.1% in 1996, 2001, 2006, 2011, and 2016, respectively. Over the 20-year period, there was over ten-fold increase in the prevalence of BMI ≥ 25 and over twenty-fold increase in the prevalence of BMI ≥ 30. A gradual increase in the prevalence of both BMI ≥ 25 and BMI ≥ 30 was observed since 2006, with the latest 2016 NDHS demonstrating that almost 1 in 5 women (19.7%) were affected by overweight or obesity, while 1 in 25 women (4.1%) were affected by obesity in Nepal.

3.2. Characteristics of the Study Participants from NDHS 2016

From the latest NDHS 2016 dataset (n = 12,862), after excluding women who were pregnant at the time of the survey (n = 636) and those with missing values for height and weight measurements (n = 6061), data were extracted for all eligible women (n = 6165) aged 15–49 years and included in the final model. The characteristics of the study population along with the prevalence of overweight–obesity and obesity in relation to the socioeconomic and household environmental factors are presented in Table 2. Of the total sample (n = 6165), 19.7% (n = 1215) had overweight–obesity (BMI ≥ 25), while 4.1% (n = 250) had obesity (BMI ≥ 30). The average weight, height, and BMI of the total sample population were 50.7 ± 9.6 kg, 151.7 ± 5.6 cm, and 22.0 ± 3.9 kg/m2, respectively.

3.2.1. Socioeconomic Factors

The sample was roughly equally distributed among the three age groups, yet the prevalence of both overweight–obesity (50.1%) and obesity (59.6%) were higher among women aged 35–49. The majority of women had either secondary education (36.1%) or no formal education (34.5%), while the lowest prevalence of overweight–obesity (15.8%) and obesity (16.0%) was observed among those with higher education. The majority of the survey participants were currently employed (59.5%), hence the prevalence of both BMI ≥ 25 and BMI ≥ 30 were higher among those employed. The majority of the sample were married or lived with a partner (75.7%), and most of them had overweight–obesity (91.4%) and obesity (92.0%). Most women (61.0%) had less than or equal to five household members, and the majority of them had both BMI ≥ 25 and BMI ≥ 30. The study population was nearly equally distributed across the given spectrum of wealth index. Those in the poorest category were least affected, with only 9.0% having overweight–obesity and 3.6% having obesity; those in the richest category were most affected, with 37.0% having overweight–obesity and 54.4% having obesity. The majority of the participants were Hindu (87.1%), hence the prevalence of both BMI ≥ 25 and BMI ≥ 30 were higher among Hindus.

3.2.2. Household Environmental Factors

The majority of the participants resided in urban areas (64.6%) and the highest prevalence of both overweight–obesity (73.5%) and obesity (82.4%) were observed among urban residents. The study population distribution across the seven provinces ranged from 12.7% to 16.0%, yet the highest prevalence of both BMI ≥ 25 (21.3%) and BMI ≥ 30 (27.6%) were observed among those residing in Province 3. Most participants lived in terai and hill ecological zones, and over half of those living in hill had both BMI ≥ 25 and BMI ≥ 30. Most participants had improved sources of drinking water (90%) and types of toilet facility (83.5%), with most of them having both BMI ≥ 25 and BMI ≥ 30. The majority used solid fuel for cooking (68.1%), yet the prevalence of both overweight–obesity (50.7%) and obesity (67.2%) were higher among those who used clean fuel for cooking. Most participants had access to electricity (86.0%), with most of them having both BMI ≥ 25 and BMI ≥ 30. The largest proportion of the sample lived in houses with unimproved floor material (61.9%), unimproved wall material (52.8%), and improved roof material (85.3%), yet the highest prevalence of both BMI ≥ 25 and BMI ≥ 30 were observed among those living in houses with improved floor, wall, and roof materials. Most participants did not own a refrigerator (81.3%), bicycle (57.1%), and motorised vehicle (77.6%), yet most of them had both BMI ≥ 25 and BMI ≥ 30. Alternatively, the majority of the sample owned a television (50.3%) and mobile phone (71.7%), and most of them had both BMI ≥ 25 and BMI ≥ 30.

3.3. Socioeconomic and Household Environmental Factors Associated with Overweight–Obesity (BMI ≥ 25) and Obesity (BMI ≥ 30)

In the univariate analysis (Table 3), having overweight–obesity (BMI ≥ 25) and obesity (BMI ≥ 30) were associated with several potential socioeconomic and household environmental factors. Variables that were significant at p < 0.20 were age, educational status, marital status, number of household members, wealth index, religion, place of residence, province of residence, ecological zone, source of drinking water, type of toilet facility, cooking fuel, access to electricity, main floor material, main wall material, main roof material, refrigerator, television, mobile phone, bicycle, and motorised vehicle.
In the multivariate analysis (Table 4), age, marital status, wealth index, province of residence, cooking fuel, refrigerator, and bicycle were significantly associated with having both overweight–obesity (BMI ≥ 25) and obesity (BMI ≥ 30). As compared to women who were younger (aged 15–24 years), those who were older (aged 35–49 years) were over four times more likely to have overweight–obesity (adjusted odds ratio (AOR) = 4.72) and obesity (AOR = 4.41). Women who were married or were living with a partner had more than three times higher odds of having BMI ≥ 25 (AOR = 3.48) and BMI ≥ 30 (AOR = 3.06) as compared to those who were never married. Compared to women with the poorest wealth index, those with the richest wealth index were over four times more likely to have BMI ≥ 25 (AOR = 4.36) and over ten times more likely to have BMI ≥ 30 (AOR = 10.52). Women residing in Province 7 had 70% lower odds of having overweight–obesity (AOR = 0.30) and 75% lower odds of having obesity (AOR = 0.25) compared to women residing in Province 1. In comparison with women who used solid fuel for cooking, those who used clean fuel for cooking had 44% higher odds of having overweight–obesity (AOR = 1.44) and 66% higher odds of having obesity (AOR = 1.66). Compared to women who did not own a refrigerator, those who owned one had 27% and 44% higher odds of having BMI ≥ 25 (AOR = 1.27) and BMI ≥ 30 (AOR = 1.44), respectively. In comparison with women who did not own a bicycle, those who owned a bicycle had 24% and 34% lower odds of having overweight–obesity (AOR = 0.76) and obesity (AOR = 0.66), respectively.
On the other hand, educational status, religion, type of toilet facility, television, and mobile phone were significantly associated with having overweight–obesity (BMI ≥ 25). Compared to women who did not have any formal education, those who had primary education had 43% higher odds of having BMI ≥ 25 (AOR = 1.43). Similarly, Buddhist women had 41% higher odds of having BMI ≥ 25 (AOR = 1.41) compared to Hindu women. Women with an improved toilet facility were 40% more likely to have overweight–obesity (AOR = 1.40) compared to those with an unimproved toilet facility. Women who owned a television were 26% more likely to have BMI ≥ 25 (AOR = 1.26), and women who owned a mobile phone were 51% more likely to have BMI ≥ 25 (AOR = 1.51), as compared to those who did not own a television and mobile phone, respectively.

4. Discussion

4.1. Summary of Key Findings

Firstly, the present study examined the trends in the prevalence of overweight–obesity (BMI ≥ 25) and obesity (BMI ≥ 30) among non-pregnant Nepalese women of reproductive age (15–49 years) using the nationally representative data from the 1996, 2001, 2006, 2011, and 2016 NDHSs. Over the 20-year period, there was over ten-fold increase in the prevalence of BMI ≥ 25 and over twenty-fold increase in the prevalence of BMI ≥ 30. Furthermore, this study is one of the first to comprehensively explore a wide range of socioeconomic and household environmental factors associated with BMI ≥ 25 and BMI ≥ 30 among women in Nepal based on the latest NDHS 2016. Age, marital status, wealth index, province of residence, cooking fuel, refrigerator, and bicycle were significantly associated with having both overweight–obesity and obesity, whereas educational status, religion, type of toilet facility, television, and mobile phone were significantly associated with having overweight–obesity. This study has identified several critical socioeconomic and household environmental risk factors of having overweight and obesity among Nepalese women, which need to be addressed immediately and integrated into multi-faceted obesity prevention and mitigation strategies and national public health interventions.

4.2. Trends in the Prevalence of Overweight and Obesity

From the NDHS 2016, the current study demonstrated that almost one in five women (19.7%) were affected by overweight or obesity, while one in twenty-five women (4.1%) were affected by obesity in Nepal. The prevalence rates of overweight–obesity and obesity were slightly lower than the 22% and 5% presented in the NDHS 2016 report [19], and the 24.9% and 5.6% reported by a prior study [20] that was based on NDHS 2016 and used the WHO cut-off of BMI. It is worth noting that the variations could be attributed to the differences in the exclusion criteria. Similarly, the prevalence rates reported in this study were also comparable with those reported for other neighbouring south Asian countries including Pakistan, Bangladesh, and India [36,37,38], which were also based on a nationally representative sample of adult women. Research suggests that low skeletal muscle mass, excess abdominal adiposity, and increased hepatic fat are typically observed among south Asians, which are associated with high risk of development of NCDs such as type 2 diabetes, cardiovascular diseases, and other associated comorbidities [39,40,41]. Even among south Asians, the prevalence of overweight, obesity, and abdominal obesity have been reported to be higher among women than men, which puts them at increased risk of these NCDs as well as several pregnancy-related complications [9,39,42]. Addressing the increasing prevalence of overweight and obesity among Nepalese women of reproductive age, in particular, should be given utmost priority as these are contributing significantly to the growing burden of NCDs, which are further threatening Nepal’s progress towards achieving the Sustainable Development Goals, especially those targeted at reducing premature mortality from NCDs by one-third by 2030 [16,43].
This study also identified an alarmingly increasing trend of overweight and obesity among women in Nepal, as evidenced by the over ten-fold increase in the prevalence of overweight or obesity and over twenty-fold increase in the prevalence of obesity alone over the 20-year period between 1996 and 2016. This finding supports the large body of evidence on the increasing trends of overweight and obesity among women in south Asian countries including Bangladesh and India [37,38,44], as well as most of the LMICs and globally [4,45,46], which further highlights the urgency of the obesity pandemic among women. The complex interplay between a diverse range of factors could be attributed to the escalating prevalence of overweight and obesity in south Asian and LMICs. Along with the increased quality of life, the socioeconomic development in south Asian countries has led to the advancement of both agricultural and technical sectors, which has also contributed to the improvement in the accessibility and availability of energy-dense foods [47]. South Asian meals typically consist of an excess carbohydrate-based diet such as rice, breads, and sweets, including the Nepalese diet, which relies heavily on energy-dense staple foods that are rich in starch with only small quantities of bioavailable protein and micronutrients [47,48]. Further, urbanisation and increased income levels in South Asian and LMICs may have led to a nutrition transition from traditional diets to energy-dense, high-calorie, and nutrient-poor diets, and increased consumption of foods that are high in sugar, saturated fats, and refined carbohydrates, processed foods, and sugar-sweetened beverages, all of which contribute to weight gain [14,39]. Similarly, obesity among south Asian women may be linked with inaccurate views and beliefs about diet, such as associating the consumption of clarified butter (ghee) with physical strength, as well as poor lifestyle practices including imbalanced diets, sedentary behaviour, and reduced physical activity, especially in the postpartum period when additive weight gain occurs [39,49]. Moreover, the socioeconomic development may have led to a decline in physical activity levels, attributed by the shifts from manual labour to sedentary jobs, the mechanisation of domestic work due to modern technology and conveniences, and the rise in motorised transportation that has reduced the use of active transportation such as walking and cycling, resulting in leisure time for sedentary activities such as watching television [14,50]. Even in the context of Nepal, a sedentary lifestyle is estimated to be prevalent in over 90% of urban women residing in Kathmandu, the capital city of Nepal [51]. Among south Asian women, social and cultural issues often limit physical activity such as traditional beliefs about obesity being a sign of good health, as well as security and cultural concerns about outdoor physical exercise [39,52]. Although diet and physical activity directly contribute to overweight and obesity, socioeconomic and household environmental factors are strongly associated with dietary patterns and physical activity levels among women, further elucidating the association of overweight and obesity with these socioeconomic and household environmental factors [47,51].

4.3. Socioeconomic Factors Associated with Overweight and Obesity

In the present study, among the socioeconomic factors, age, marital status, and wealth index were independently associated with the likelihood of having both overweight–obesity (BMI ≥ 25) and obesity (BMI ≥ 30), while educational status and religion were associated with having overweight–obesity. In this study, older women (35–49 years; 25–34 years) had higher odds of having overweight and obesity as compared to younger women (15–24 years). Similarly, women who were married/living with a partner and widowed/divorced/separated were more likely to have overweight and obesity than those who were never married. Both of these findings, that younger and never-married women are less likely to have overweight and obesity, validate the results of prior studies conducted in Nepal and neighbouring south Asian countries [53,54,55]. These findings could be attributed to gestational weight gain among older and married women, which can be sustained throughout their lives if they are unable to achieve a substantial weight loss in the postpartum period [53,56]. The higher prevalence of overweight and obesity among women who were married or living with a partner could also be linked with the weight gain due to the use of hormonal contraceptives [57]. On the other hand, age may also be associated with other socioeconomic and household environmental determinants of overweight and obesity. For instance, older women are more likely to be married, and both were found to be independent predictors of overweight and obesity in this study. Increase in age has also been found to be associated with increase in both income and BMI [58]. Similarly, in this study, along with increased age, higher wealth index was found to be positively associated with overweight and obesity. Another plausible explanation could be the changes in body composition with increased age, particularly those associated with decline in fat-free mass and subsequent rise in fat mass which begins to occur when an individual crosses 30 years of age [55,59]. Increase in age has also been identified as an essential risk factor for both overweight or obesity and other NCDs [53]. These findings further support the need to prioritise older and married women when designing interventions to prevent overweight and obesity among Nepalese women.
In this study, women with formal education (primary, secondary, or higher) were more likely to have overweight or obesity as compared to women with no formal education. Research suggests that educated women are more likely to have sedentary occupations that require lower levels of physical activity than manual labour-intensive occupations [37,55]. In terms of the relationship between educational attainment and obesity, a systematic review [60] indicated that a positive association was more common in lower-income countries, while a negative association was often observed in higher-income countries. Prior studies from Bangladesh and India [55,61,62] also reported an increase in the likelihood of having overweight and obesity with the increase in educational attainment among women. However, in this study, as compared to women with no formal education, the highest odds of having overweight or obesity were observed among those with primary education, followed by secondary and higher education. A plausible explanation for this finding could be the obesity-preventing health behaviours among women with higher education levels [60]. The influence of education on obesity may change with time depending on the socioeconomic development of a country, and in transitional societies, higher educational level may act as a protective factor for obesity, while higher income levels may still act as a risk factor for obesity [63].
Indeed, this study also found a positive association between higher wealth index and both overweight–obesity and obesity. As compared to women with the poorest wealth index, the odds of having overweight and obesity escalated with increasing wealth index, with the highest odds observed among those with the richest wealth index. Prior research from Nepal and other south Asian studies [23,37,53,64] also reported a similar pattern and suggest a high burden of overweight and obesity among higher socioeconomic groups. In developing countries, people with higher wealth status generally have sedentary lifestyles and occupations, which could contribute to an increase in body weight [26,53]. Moreover, increase in income is associated with greater purchasing ability and higher consumption of energy-dense food products, and diets high in saturated fat, cholesterol, refined carbohydrates, and sugar [53,55,65]. Therefore, dietary factors may also be one of the essential contributors to the increased prevalence of overweight and obesity among women with higher wealth index. This finding is further supported by the nutrition transition theory, which indicates that the rise in socioeconomic status in developing countries is resulting in a rapid shift in dietary and physical activity patterns, ultimately leading to higher prevalence of overweight and obesity [66].
Similarly, this study revealed a significant association between religion and overweight or obesity, as reported in a few previous studies [65,67,68]. Traditional cultural beliefs, dietary patterns, and physical activity levels may have mediated this relationship to some extent [67]. For instance, Hinduism and Buddhism encourage vegetarianism, while Islam prohibits pork and alcohol consumption [67,69]. Particularly among south Asian women, cultural and religious norms have also been identified as a barrier to physical activity [67,70]. Religion may act as a contributing factor to overweight and obesity in many ways: religious and cultural ceremonies may involve high consumption of energy-dense foods as a celebratory good; practising religion from home through religious television and radio programs and books or magazines referred to as ‘religious media practice’ provides easy access to foods and beverages while practicing religion; religious organisations may also provide a safe haven for people with obesity who are seeking protection from social stigma [67,68]. Further investigation, particularly qualitative research, is warranted to determine the possible explanations for the finding from this study that Hindu women had a lower likelihood of having overweight or obesity compared to those who were Buddhist, Muslim, or followed other religions.

4.4. Household Environmental Factors Associated with Overweight and Obesity

In the current study, among the household environmental factors, province of residence, cooking fuel, refrigerator, and bicycle were independently associated with the likelihood of having both overweight–obesity (BMI ≥ 25) and obesity (BMI ≥ 30), while type of toilet facility, television, and mobile phone were associated with having overweight–obesity. In this study, lower odds of overweight and obesity were observed among those residing in Province 7, Province 2, and Province 6, while comparatively higher odds were seen among residents of Province 1, Province 3, and Province 4. A prior study [23] examining the geographic variation in overweight and obesity in Nepal also reported similar findings. The authors suggest a higher prevalence of overweight and obesity in provinces with higher affluence and lower prevalence among poorer provinces, resulting in geographic disparities [23]. In terms of human development index (HDI), the most developed provinces are Province 1, 3, and 4 (HDI: 0.507; 0.506; 0.493), while the least developed are Province 6, 7, and 2 (HDI: 0.390; 0.416; 0.422) [23]. Therefore, the comparatively higher odds of overweight and obesity among women residing in Province 1, Province 3, and Province 4 could be linked with higher socioeconomic status as well as residing in an urban region. In terms of environmental factors, only the province of residence influenced the likelihood of having overweight and obesity, while living in an urban or rural residence, or in a particular ecological zone were not statistically significant in this study. However, prior studies conducted in Nepal and other south Asian countries [53,54,71] have found increased odds of overweight and obesity among urban residents compared to their rural counterparts and have linked the association with increased accessibility and the consumption of energy-dense foods and sedentary lifestyles.
In this study, toilet facility and cooking fuel were identified as the two household facilities significantly associated with overweight and obesity. Women with an improved toilet facility were more likely to have overweight or obesity compared to those with an unimproved toilet facility. An improved toilet facility hygienically prevents human contact with human excreta and involves safer excreta disposal, lower waiting times, and physically closer sanitation facilities, which could be a few of the plausible explanations for this finding [72]. Alternatively, an improved facility or poor sanitation may predispose individuals to undernutrition, diarrhoeal diseases, acute respiratory infections, parasitic infections, and helminth infections, which could have a considerable impact on their nutritional status [72,73]. Substantial improvements in sanitation facilities have been observed in Nepal, with households using improved toilet facilities having almost doubled from 38% in 2011 to 62% in 2016, which has also reduced the transmission of communicable diseases including typhoid and cholera [19]. Nonetheless, continued efforts to increase the access to improved toilet facilities is warranted as improved sanitation is one of the indispensable components of a healthy community which is positively associated with the nutritional status [73]. On the other hand, in this study, women who used clean fuel for cooking had higher odds of having both overweight–obesity and obesity compared to those who used solid fuel. This finding could be linked to indoor air pollution caused by indoor burning of solid fuels for cooking purposes [74]. Exposure to various health-damaging pollutants and chemicals contained in the biomass smoke is associated with adverse health outcomes including bronchitis, pneumonia, lung cancer, chronic obstructive pulmonary disease, stroke, and ischemic heart disease [75,76]. A recent study [77] found a direct association between household fuel types and nutritional status; use of high polluting biomass fuels among women was associated with a 0.66 kg/m2 decrease in BMI and 10% higher risk of underweight. Approximately two-thirds of households in Nepal use solid fuel for cooking, and its use is even more predominant in rural areas, with 88% of rural households reliant on solid fuels [19]. Women in these households of Nepal begin cooking from an early age due to cultural reasons and may be exposed to high levels of household air pollution, and therefore, interventions to accelerate the transition from solid fuels to clean fuels should be given utmost priority to reduce the health burden among women [77,78].
In the current study, among the household possessions, women with a refrigerator and without a bicycle were more likely to have both overweight–obesity and obesity, while those with a television and a mobile phone were more likely to have overweight or obesity. A prior study conducted in Thailand [79] also observed a significantly higher risk of obesity among women with a refrigerator, washing machine, or microwave oven. Modern technology and food market has facilitated easy access to an endless choice of global cuisines with minimum energy expenditure to acquire them, by visiting a supermarket or food outlet, or simply walking to a refrigerator [80]. Refrigerators also provide greater capacity for storage of perishable foods as well as ultra-processed foods such as sugar-sweetened beverages, sweets and ice-cream, and frozen dishes [81,82]. The consumption of ultra-processed foods with poor quality of dietary nutrients has been associated with the development of obesity and other diet-related NCDs, and therefore, dietary guidelines should discourage its consumption, while policies should focus on food taxation and food marketing surveillance [81]. Similar to the findings of this study, a recent study conducted in Nepal [83] also found a significant association between bicycle use and overweight and obesity. Modification of the increasingly obesogenic environment in Nepal is increasingly important, which can be achieved to some extent by discouraging sedentary lifestyles and actively promoting active transport through an integrated network of bicycle lanes and footpaths [51]. Similarly, the association between watching television at least once a week and overweight and obesity among women of reproductive age residing in urban areas of Nepal has been previously reported [21]. Watching television predisposes an individual towards a sedentary lifestyle, while the advertisements for obesogenic foods further promote the purchase and consumption of these energy-dense foods [21,84]. With advertisements for junk foods accounting for 25% of the advertisements in Nepalese and Indian television, it is essential for public health promotions programs to target Nepalese women, through the platform of television itself, to discourage consumption of these unhealthy foods and raise awareness about the adverse effects of a sedentary lifestyle attributed to watching television [21]. On the other hand, prior studies indicating an association between mobile phone use and weight status are limited [85,86]. However, a recent study [87] suggests that using smartphones, tablets, computers, and videogames is associated with various obesity risk factors such as daily sugar-sweetened beverage consumption, and inadequate physical activity and sleep. On a more positive note, research also suggests that mobile applications can be used as an effective self-regulating tool for weight loss and should be integrated within weight loss strategies [88]. Mobile phone interventions, through text messages and other multimedia materials, delivering frequent reminders and recommendations for physical activity and nutritional goals have been found to promote weight loss among individuals with overweight and obesity [89]. Therefore, with most individuals owning a mobile phone in the current era, these can be used as an effective and efficient tool to tackle the overweight and obesity pandemic.

4.5. Strengths and Limitations

The present study has a number of strengths worth reporting. Firstly, as this study was based on the NDHSs, large nationally representative samples of women across Nepal including those from both urban and rural areas were included, which enabled the study findings to be generalisable to the target population. Secondly, all NDHSs followed standardised DHS procedures for data collection to minimise the chances of measurement error including the use of calibrated measurement tools, trained field staff, and validated questionnaires, which confirms the internal and external validity of the study findings. Thirdly, this study utilised the WHO cut-off of BMI as used in the NDHS reports, which strengthens our evidence base. Finally, to the best of our knowledge, this study is one of the first to comprehensively explore a wide range of socioeconomic and household environmental factors associated with overweight and obesity among women in Nepal based on the nationally representative sample of NDHS. Along with the identification of women at high-risk of the burden and recognition of potentially modifiable risk factors, this study may guide the development of comprehensive and multifaceted intervention strategies to prevent and mitigate the incidence and burden of overweight and obesity among women in Nepal.
The findings of this study should be considered in the light of some limitations. Firstly, as this study was a secondary analysis of the cross-sectional data of NDHS, identification of causal relationship between the investigated factors and overweight and obesity were not possible. Secondly, there may be a possibility of social desirability bias, where the participants may have provided the interviewers with positive or socially desirable answers. Thirdly, this study was limited by the available variables contained in the NDHS dataset. Therefore, other key predictors of overweight and obesity such as physical activity level, total energy intake, dietary habits, and alcohol consumption among others could not be included and investigated in this study. Finally, when the predictor variables are correlated, such as many of the socioeconomic indicators used in this study, the conclusions of the stepwise procedure can be affected by random variation. This indicates that the variables excluded from the final model do not necessarily have no association with having overweight or obesity. Nonetheless, this study provides a novel insight into the underlying social, economic, household, and environmental determinants of overweight and obesity among women in Nepal.

5. Conclusions

The rates of overweight or obesity (BMI ≥ 25) and obesity (BMI ≥ 30) increased alarmingly among Nepalese women between 1996 and 2016. Among the socioeconomic factors, the study findings suggest that women who were older, married, and with higher wealth index were at increased risk of having both BMI ≥ 25 and BMI ≥ 30, while women with formal education and who practised a religion other than Hinduism were more likely to have BMI ≥ 25. Similarly, among the investigated household environmental factors, women who resided in Province 1, 3, and 4, who used clean fuel for cooking, owned a refrigerator, and did not own a bicycle were more likely to have both BMI ≥ 25 and BMI ≥ 30, while women who had an improved toilet facility, owned a television, and possessed a mobile phone had high odds of having BMI ≥ 25. Although an unimproved toilet facility and solid cooking fuel were negatively associated with overweight and obesity, the risk of adverse health outcomes substantially outweigh the risks associated with overweight and obesity. Despite the study findings, therefore, continued efforts to increase access to improved toilet facilities and accelerate the transition from solid fuels to clean fuels is warranted. Nonetheless, the ever-rising rates of overweight and obesity among women in Nepal and the simultaneous rise in obesity-related NCDs is threatening Nepal’s progress towards achieving the Sustainable Development Goals. Therefore, the several critical socioeconomic and household environmental risk factors of having overweight and obesity among Nepalese women presented in this study need to be addressed immediately and integrated into multi-faced obesity prevention and mitigation strategies and national public health interventions.

Author Contributions

Conceptualisation, K.R. and R.C. (Ritesh Chimoriya); data analysis, K.R., P.G. and R.C. (Ritesh Chimoriya); writing—original draft preparation, K.R. and R.C. (Romila Chimoriya); writing—review and editing, K.R. and R.C. (Ritesh Chimoriya); supervision, R.C. (Ritesh Chimoriya). All authors have read and agreed to the published version of the manuscript.

Funding

The research conducted in this study received no external funding.

Institutional Review Board Statement

The DHS Program obtained ethical approval of all NDHSs from the Ethical Review Board of Nepal Health Research Council and Human Research Ethics Committee of Inner City Fund (ICF) Macro International. Approval to use the NDHSs datasets for this registered research paper was granted by the DHS Program on 3 June 2021 (Authorisation Letter 156469).

Informed Consent Statement

The DHS Program obtained informed consent from the participants.

Data Availability Statement

Restrictions apply to the availability of the data used in this study. The data were obtained from the DHS Program website and are available at https://dhsprogram.com/data/available-datasets.cfm (accessed on 20 August 2021) with the permission of DHS Program.

Acknowledgments

The authors acknowledge the DHS Program for their permission to access and use the NDHSs datasets for this study. We would also like to extend our appreciation to all members of Philanthropy Nepal (Paropakari Nepal) Research Collaboration for their continued support.

Conflicts of Interest

The authors declare no conflict of interest.

References

  1. Blüher, M. Obesity: Global epidemiology and pathogenesis. Nat. Rev. Endocrinol. 2019, 15, 288–298. [Google Scholar] [CrossRef]
  2. World Health Organization. Obesity and Overweight; WHO: Geneva, Switzerland, 2020; Available online: https://www.who.int/news-room/fact-sheets/detail/obesity-and-overweight (accessed on 13 October 2020).
  3. Dai, H.; Alsalhe, T.A.; Chalghaf, N.; Riccò, M.; Bragazzi, N.L.; Wu, J. The global burden of disease attributable to high body mass index in 195 countries and territories, 1990–2017: An analysis of the Global Burden of Disease Study. PLoS Med. 2020, 17, e1003198. [Google Scholar] [CrossRef] [PubMed]
  4. NCD Risk Factor Collaboration. Trends in adult body-mass index in 200 countries from 1975 to 2014: A pooled analysis of 1698 population-based measurement studies with 19.2 million participants. Lancet 2016, 387, 1377–1396. [Google Scholar] [CrossRef] [Green Version]
  5. Stanaway, J.D.; Afshin, A.; Gakidou, E.; Lim, S.S.; Abate, D.; Abate, K.H.; Abbafati, C.; Abbasi, N.; Abbastabar, H.; Abd-Allah, F.; et al. Global, regional, and national comparative risk assessment of 84 behavioural, environmental and occupational, and metabolic risks or clusters of risks for 195 countries and territories, 1990–2017: A systematic analysis for the Global Burden of Disease Study 2017. Lancet 2018, 392, 1923–1994. [Google Scholar] [CrossRef] [Green Version]
  6. Kanter, R.; Caballero, B. Global Gender Disparities in Obesity: A Review. Adv. Nutr. 2012, 3, 491–498. [Google Scholar] [CrossRef]
  7. Power, M.L.; Schulkin, J. Sex differences in fat storage, fat metabolism, and the health risks from obesity: Possible evolutionary origins. Br. J. Nutr. 2008, 99, 931–940. [Google Scholar] [CrossRef] [PubMed]
  8. Tuoyire, D.A.; Kumi-Kyereme, A.; Doku, D.T. Socio-demographic trends in overweight and obesity among parous and nulliparous women in Ghana. BMC Obes. 2016, 3, 44. [Google Scholar] [CrossRef] [Green Version]
  9. Kulie, T.; Slattengren, A.; Redmer, J.; Counts, H.; Eglash, A.; Schrager, S. Obesity and Women’s Health: An Evidence-Based Review. J. Am. Board Fam. Med. 2011, 24, 75–85. [Google Scholar] [CrossRef]
  10. Cardozo, E.R.; Dune, T.J.; Neff, L.M.; Brocks, M.E.; Ekpo, G.E.; Barnes, R.B.; Marsh, E.E. Knowledge of Obesity and Its Impact on Reproductive Health Outcomes Among Urban Women. J. Community Health 2012, 38, 261–267. [Google Scholar] [CrossRef]
  11. Swinburn, B.A.; Sacks, G.; Hall, K.D.; McPherson, K.; Finegood, D.T.; Moodie, M.; Gortmaker, S.L. The global obesity pandemic: Shaped by global drivers and local environments. Lancet 2011, 378, 804–814. [Google Scholar] [CrossRef]
  12. World Health Organization. Noncommunicable Diseases; WHO: Geneva, Switzerland, 2021; Available online: https://www.who.int/news-room/fact-sheets/detail/noncommunicable-diseases (accessed on 12 May 2021).
  13. Abarca-Gómez, L.; Abdeen, Z.A.; Hamid, Z.A.; Abu-Rmeileh, N.M.; Acosta-Cazares, B.; Acuin, C.; Adams, R.J.; Aekplakorn, W.; Afsana, K.; Aguilar-Salinas, C.A.; et al. Worldwide trends in body-mass index, underweight, overweight, and obesity from 1975 to 2016: A pooled analysis of 2416 population-based measurement studies in 128.9 million children, adolescents, and adults. Lancet 2017, 390, 2627–2642. [Google Scholar] [CrossRef] [Green Version]
  14. Ford, N.D.; Patel, S.A.; Narayan, K.V. Obesity in Low- and Middle-Income Countries: Burden, Drivers, and Emerging Challenges. Annu. Rev. Public Health 2017, 38, 145–164. [Google Scholar] [CrossRef] [Green Version]
  15. World Health Organization. Global Status Report on Noncommunicable Diseases; WHO: Geneva, Switzerland, 2014; Available online: https://apps.who.int/iris/bitstream/handle/10665/148114/9789241564854_eng.pdf (accessed on 14 May 2021).
  16. United Nations. Transforming Our World: The 2030 Agenda for Sustainable Development; United Nations: New York, NY, USA, 2015; Available online: https://sdgs.un.org/sites/default/files/publications/21252030%20Agenda%20for%20Sustainable%20Development%20web.pdf (accessed on 14 May 2021).
  17. Central Bureau of Statistics Nepal. National Population and Housing Census 2011: Population Projection 2011–2031; National Planning Commission Secretariat; CBS: Kathmandu, Nepal, 2014. Available online: https://cbs.gov.np/wp-content/upLoads/2018/12/PopulationProjection2011-2031.pdf (accessed on 13 April 2021).
  18. Central Bureau of Statistics Nepal. Population Monograph of Nepal; National Planning Commission Secretariat; CBS: Kathmandu, Nepal, 2014; Available online: https://nepal.unfpa.org/sites/default/files/pub-pdf/PopulationMonograph2014Volume1.pdf (accessed on 13 April 2021).
  19. Ministry of Health Nepal; New ERA; ICF. Nepal Demographic and Health Survey 2016; ICF: Kathmandu, Nepal, 2017.
  20. Al Kibria, G.M. Prevalence and factors affecting underweight, overweight and obesity using Asian and World Health Organization cutoffs among adults in Nepal: Analysis of the Demographic and Health Survey 2016. Obes. Res. Clin. Pract. 2019, 13, 129–136. [Google Scholar] [CrossRef]
  21. Das Gupta, R.; Haider, S.S.; Hashan, M.R.; Hasan, M.; Sutradhar, I.; Sajal, I.H.; Joshi, H.; Haider, M.R.; Sarker, M. Association between the frequency of television watching and overweight and obesity among women of reproductive age in Nepal: Analysis of data from the Nepal Demographic and Health Survey 2016. PLoS ONE 2020, 15, e0228862. [Google Scholar] [CrossRef] [Green Version]
  22. Rawal, L.B.; Kanda, K.; Mahumud, R.; Joshi, D.; Mehata, S.; Shrestha, N.; Poudel, P.; Karki, S.; Renzaho, A. Prevalence of underweight, overweight and obesity and their associated risk factors in Nepalese adults: Data from a Nationwide Survey, 2016. PLoS ONE 2018, 13, e0205912. [Google Scholar] [CrossRef] [PubMed]
  23. Shrestha, N.; Mishra, S.R.; Ghimire, S.; Gyawali, B.; Pradhan, P.M.S.; Schwarz, D. Application of single-level and multi-level modeling approach to examine geographic and socioeconomic variation in underweight, overweight and obesity in Nepal: Findings from NDHS 2016. Sci. Rep. 2020, 10, 2406. [Google Scholar] [CrossRef] [PubMed] [Green Version]
  24. World Health Organization. Physical status: The use and interpretation of anthropometry. Report of a WHO Expert Committee. World Health Organ. Tech. Rep. Ser. 1995, 854, 1–452. [Google Scholar]
  25. Lee, A.; Cardel, M.; Donahoo, W.T. Social and Environmental Factors Influencing Obesity. In Endotext; Feingold, K.R., Anawalt, B., Boyce, A., Chrousos, G., de Herder, W.W., Dhatariya, K., Dungan, K., Grossman, A., Hershman, J.M., Hofland, J., et al., Eds.; MDText.com, Inc.: South Dartmouth, MA, USA, 2000. [Google Scholar]
  26. Bhurosy, T.; Jeewon, R. Overweight and Obesity Epidemic in Developing Countries: A Problem with Diet, Physical Activity, or Socioeconomic Status? Sci. World J. 2014, 2014, 964236. [Google Scholar] [CrossRef] [PubMed] [Green Version]
  27. Amarasinghe, A.; D’Souza, G. Individual, Social, Economic, and Environmental Model: A Paradigm Shift for Obesity Prevention. ISRN Public Health 2012, 2012, 571803. [Google Scholar] [CrossRef] [Green Version]
  28. DHS Program. The Demographic and Health Surveys (DHS) Program; ICF: Rockville, MD, USA, 2020; Available online: https://dhsprogram.com/data/available-datasets.cfm (accessed on 28 September 2020).
  29. DHS Program. Demographic and Health Survey (DHS); ICF: Rockville, MD, USA, 2020; Available online: https://dhsprogram.com/Methodology/Survey-Types/DHS.cfm (accessed on 13 September 2020).
  30. DHS Program. Team and Partners; ICF: Rockville, MD, USA, 2020; Available online: https://dhsprogram.com/Who-We-Are/About-Us.cfm (accessed on 13 October 2020).
  31. Ministry of Health and Population Nepal; New ERA; ICF International. Nepal Demographic and Health Survey 2011; ICF International: Kathmandu, Nepal, 2012.
  32. Ministry of Health and Population Nepal; New ERA; Macro International. Nepal Demographic and Health Survey 2006; Macro International: Kathmandu, Nepal, 2007.
  33. Ministry of Health Nepal; New ERA; ORC Macro. Nepal Demographic and Health Survey 2001; ORC Macro: Calverton, MD, USA, 2002.
  34. Pradhan, A.; Aryal, R.H.; Regmi, G.; Ban, B.; Govindasamy, P. Nepal Family Health Survey 1996; Macro International: Kathmandu, Nepal, 1997. [Google Scholar]
  35. Hosmer, D.W., Jr.; Lemeshow, S.; Sturdivant, R.X. Applied Logistic Regression, 3rd ed.; John Wiley & Sons: Hoboken, NJ, USA, 2013. [Google Scholar]
  36. Asif, M.; Aslam, M.; Altaf, S.; Atif, S.; Majid, A. Prevalence and Sociodemographic Factors of Overweight and Obesity among Pakistani Adults. J. Obes. Metab. Syndr. 2020, 29, 58–66. [Google Scholar] [CrossRef] [Green Version]
  37. Chowdhury, M.A.B.; Adnan, M.; Hassan, Z. Trends, prevalence and risk factors of overweight and obesity among women of reproductive age in Bangladesh: A pooled analysis of five national cross-sectional surveys. BMJ Open 2018, 8, e018468. [Google Scholar] [CrossRef]
  38. Harding, K.L.; Aguayo, V.M.; Webb, P. Trends and Correlates of Overweight among Pre-School Age Children, Adolescent Girls, and Adult Women in South Asia: An Analysis of Data from Twelve National Surveys in Six Countries over Twenty Years. Nutrients 2019, 11, 1899. [Google Scholar] [CrossRef] [Green Version]
  39. Misra, A.; Jayawardena, R.; Anoop, S. Obesity in South Asia: Phenotype, Morbidities, and Mitigation. Curr. Obes. Rep. 2019, 8, 43–52. [Google Scholar] [CrossRef]
  40. Misra, A.; Soares, M.J.; Mohan, V.; Anoop, S.; Abhishek, V.; Vaidya, R.; Pradeepa, R. Body fat, metabolic syndrome and hyperglycemia in South Asians. J. Diabetes Complicat. 2018, 32, 1068–1075. [Google Scholar] [CrossRef]
  41. Ntuk, U.E.; Celis-Morales, C.A.; Mackay, D.F.; Sattar, N.; Pell, J.P.; Gill, J.M.R. Association between grip strength and diabetes prevalence in black, South-Asian, and white European ethnic groups: A cross-sectional analysis of 418 656 participants in the UK Biobank study. Diabet. Med. 2017, 34, 1120–1128. [Google Scholar] [CrossRef] [PubMed] [Green Version]
  42. Misra, A.; Khurana, L. Obesity-related non-communicable diseases: South Asians vs. White Caucasians. Int. J. Obes. 2010, 35, 167–187. [Google Scholar] [CrossRef] [PubMed] [Green Version]
  43. Mishra, S.R.; Kallestrup, P.; Neupane, D. Country in Focus: Confronting the challenge of NCDs in Nepal. Lancet Diabetes Endocrinol. 2016, 4, 979–980. [Google Scholar] [CrossRef]
  44. Luhar, S.; Mallinson, P.A.C.; Clarke, L.; Kinra, S. Trends in the socioeconomic patterning of overweight/obesity in India: A repeated cross-sectional study using nationally representative data. BMJ Open 2018, 8, e023935. [Google Scholar] [CrossRef] [Green Version]
  45. Amugsi, D.A.; Dimbuene, Z.T.; Mberu, B.; Muthuri, S.; Ezeh, A.C. Prevalence and time trends in overweight and obesity among urban women: An analysis of demographic and health surveys data from 24 African countries, 1991–2014. BMJ Open 2017, 7, e017344. [Google Scholar] [CrossRef] [Green Version]
  46. Ng, M.; Fleming, T.; Robinson, M.; Thomson, B.; Graetz, N.; Margono, C.; Mullany, E.C.; Biryukov, S.; Abbafati, C.; Abera, S.F.; et al. Global, regional, and national prevalence of overweight and obesity in children and adults during 1980–2013: A systematic analysis for the Global Burden of Disease Study 2013. Lancet 2014, 384, 766–781. [Google Scholar] [CrossRef] [Green Version]
  47. Jayawardena, R.; Byrne, N.; Soares, M.; Katulanda, P.; Hills, A.P. Prevalence, Trends and Associated Socio-Economic Factors of Obesity in South Asia. Obes. Facts 2013, 6, 405–414. [Google Scholar] [CrossRef] [PubMed] [Green Version]
  48. Kumar, A.; Thapa, G.; Mishra, A.K.; Joshi, P.K. Assessing food and nutrition security in Nepal: Evidence from diet diversity and food expenditure patterns. Food Secur. 2020, 12, 327–354. [Google Scholar] [CrossRef]
  49. Agrawal, S.; Agrawal, P.; Gupta, K.; Mishra, V. Awareness on causes, consequences and preventive measures of obesity among urban married women in India. Int. J. Med. Public Health 2013, 3, 293–302. [Google Scholar] [CrossRef] [PubMed] [Green Version]
  50. Popkin, B.M. Technology, transport, globalization and the nutrition transition food policy. Food Policy 2006, 31, 554–569. [Google Scholar] [CrossRef]
  51. Vaidya, A.; Shakya, S.; Krettek, A. Obesity Prevalence in Nepal: Public Health Challenges in a Low-Income Nation during an Alarming Worldwide Trend. Int. J. Environ. Res. Public Health 2010, 7, 2726–2744. [Google Scholar] [CrossRef]
  52. Jayawardena, R.; Byrne, N.M.; Soares, M.J.; Katulanda, P.; Hills, A.P. Body weight perception and weight loss practices among Sri Lankan adults. Obes. Res. Clin. Pract. 2014, 8, e192–e200. [Google Scholar] [CrossRef]
  53. Al Kibria, G.M.; Swasey, K.; Hasan, Z.; Sharmeen, A.; Day, B. Prevalence and factors associated with underweight, overweight and obesity among women of reproductive age in India. Glob. Health Res. Policy 2019, 4, 24. [Google Scholar] [CrossRef] [Green Version]
  54. Sutradhar, I.; Akter, T.; Hasan, M.; Das Gupta, R.; Joshi, H.; Haider, M.R.; Sarker, M. Nationally representative surveys show gradual shifting of overweight and obesity towards poor and less-educated women of reproductive age in Nepal. J. Biosoc. Sci. 2020, 53, 214–232. [Google Scholar] [CrossRef]
  55. Tanwi, T.S.; Chakrabarty, S.; Hasanuzzaman, S.; Saltmarsh, S.; Winn, S. Socioeconomic correlates of overweight and obesity among ever-married urban women in Bangladesh. BMC Public Health 2019, 19, 842. [Google Scholar] [CrossRef] [Green Version]
  56. Kominiarek, M.A.; Peaceman, A.M. Gestational weight gain. Am. J. Obstet. Gynecol. 2017, 217, 642–651. [Google Scholar] [CrossRef]
  57. Marston, C.; Arjyal, A.; Maskey, S.; Regmi, S.; Baral, S. Using qualitative evaluation components to help understand context: Case study of a family planning intervention with female community health volunteers (FCHVs) in Nepal. BMC Health Serv. Res. 2020, 20, 685. [Google Scholar] [CrossRef]
  58. Bilger, M.; Kruger, E.J.; Finkelstein, E.A. Measuring Socioeconomic Inequality in Obesity: Looking Beyond the Obesity Threshold. Health Econ. 2016, 26, 1052–1066. [Google Scholar] [CrossRef] [PubMed]
  59. Villareal, D.T.; Apovian, C.; Kushner, R.F.; Klein, S. Obesity in Older Adults: Technical Review and Position Statement of the American Society for Nutrition and NAASO, The Obesity Society. Obes. Res. 2005, 13, 1849–1863. [Google Scholar] [CrossRef] [PubMed]
  60. Cohen, A.K.; Rai, M.; Rehkopf, D.H.; Abrams, B. Educational attainment and obesity: A systematic review. Obes. Rev. 2013, 14, 989–1005. [Google Scholar] [CrossRef] [PubMed] [Green Version]
  61. Gouda, J.; Prusty, R.K. Overweight and Obesity among Women by Economic Stratum in Urban India. J. Health Popul. Nutr. 2014, 32, 79–88. [Google Scholar] [PubMed]
  62. Sarma, H.; Saquib, N.; Hasan, M.; Saquib, J.; Rahman, A.S.; Khan, J.R.; Uddin, J.; Cullen, M.R.; Ahmed, T. Determinants of overweight or obesity among ever-married adult women in Bangladesh. BMC Obes. 2016, 3, 13. [Google Scholar] [CrossRef] [PubMed] [Green Version]
  63. Kain, J.; Vio, F.; Albala, C. Obesity trends and determinant factors in Latin America. Cad. Saude Publica 2003, 19, S77–S86. [Google Scholar] [CrossRef]
  64. Bishwajit, G. Household wealth status and overweight and obesity among adult women in Bangladesh and Nepal. Obes. Sci. Pract. 2017, 3, 185–192. [Google Scholar] [CrossRef]
  65. Mangemba, N.T.; Sebastian, M.S. Societal risk factors for overweight and obesity in women in Zimbabwe: A cross-sectional study. BMC Public Health 2020, 20, 103. [Google Scholar] [CrossRef] [PubMed]
  66. Popkin, B.M.; Gordon-Larsen, P. The nutrition transition: Worldwide obesity dynamics and their determinants. Int. J. Obes. 2004, 28, S2–S9. [Google Scholar] [CrossRef] [PubMed] [Green Version]
  67. Bharmal, N.H.; McCarthy, W.J.; Gadgil, M.D.; Kandula, N.R.; Kanaya, A.M. The Association of Religious Affiliation with Overweight/Obesity Among South Asians: The Mediators of Atherosclerosis in South Asians Living in America (MASALA) Study. J. Relig. Health 2016, 57, 33–46. [Google Scholar] [CrossRef] [PubMed] [Green Version]
  68. Cline, K.M.C.; Ferraro, K.F. Does Religion Increase the Prevalence and Incidence of Obesity in Adulthood? J. Sci. Study Relig. 2006, 45, 269–281. [Google Scholar] [CrossRef]
  69. Tan, M.-M.; Chan, C.K.Y.; Reidpath, D.D. Religiosity and Spirituality and the Intake of Fruit, Vegetable, and Fat: A Systematic Review. Evid. Based Complement. Altern. Med. 2013, 2013, 146214. [Google Scholar] [CrossRef] [PubMed]
  70. Dave, S.S.; Craft, L.L.; Mehta, P.; Naval, S.; Kumar, S.; Kandula, N.R. Life Stage Influences on U.S. South Asian Women’s Physical Activity. Am. J. Health Promot. 2015, 29, e100–e108. [Google Scholar] [CrossRef] [PubMed]
  71. Biswas, T.; Garnett, S.P.; Pervin, S.; Rawal, L.B. The prevalence of underweight, overweight and obesity in Bangladeshi adults: Data from a national survey. PLoS ONE 2017, 12, e0177395. [Google Scholar] [CrossRef]
  72. Van Minh, H.; Hung, N.V. Economic Aspects of Sanitation in Developing Countries. Environ. Health Insights 2011, 5, EHI.S8199. [Google Scholar] [CrossRef] [PubMed]
  73. Morakinyo, O.M.; Adebowale, A.S.; Obembe, T.A.; Oloruntoba, E.O. Association between household environmental conditions and nutritional status of women of childbearing age in Nigeria. PLoS ONE 2020, 15, e0243356. [Google Scholar] [CrossRef]
  74. Rana, K.; Shrestha, V.; Chimoriya, R. The Effect of Housing on Health and Challenges of Demographic Changes. Glob. J. Sci. Front. Res. 2020, 20, 75–82. [Google Scholar]
  75. Ghimire, S.; Mishra, S.R.; Sharma, A.; Siweya, A.; Shrestha, N.; Adhikari, B. Geographic and socio-economic variation in markers of indoor air pollution in Nepal: Evidence from nationally-representative data. BMC Public Health 2019, 19, 195. [Google Scholar] [CrossRef]
  76. Harrison, R.M.; Thornton, C.A.; Lawrence, R.G.; Mark, D.; Kinnersley, R.P.; Ayres, J.G. Personal exposure monitoring of particulate matter, nitrogen dioxide, and carbon monoxide, including susceptible groups. Occup. Environ. Med. 2002, 59, 671–679. [Google Scholar] [CrossRef]
  77. Li, J.; Xu, X.; Li, D.; Liu, Q.; Xue, H. Association between household fuel types and undernutrition status of adults and children under 5 years in 14 low and middle income countries. Environ. Res. Lett. 2021, 16, 054079. [Google Scholar] [CrossRef]
  78. Neupane, M.; Basnyat, B.; Fischer, R.; Froeschl, G.; Wolbers, M.; Rehfuess, E.A. Sustained use of biogas fuel and blood pressure among women in rural Nepal. Environ. Res. 2014, 136, 343–351. [Google Scholar] [CrossRef] [Green Version]
  79. Banks, E.; Lim, L.; Seubsman, S.-A.; Bain, C.; Sleigh, A. Relationship of obesity to physical activity, domestic activities, and sedentary behaviours: Cross-Sectional findings from a national cohort of over 70,000 Thai adults. BMC Public Health 2011, 11, 762. [Google Scholar] [CrossRef] [PubMed] [Green Version]
  80. Eknoyan, G. A History of Obesity, or How What Was Good Became Ugly and Then Bad. Adv. Chronic Kidney Dis. 2006, 13, 421–427. [Google Scholar] [CrossRef]
  81. Chen, X.; Zhang, Z.; Yang, H.; Qiu, P.; Wang, H.; Wang, F.; Zhao, Q.; Fang, J.; Nie, J. Consumption of ultra-processed foods and health outcomes: A systematic review of epidemiological studies. Nutr. J. 2020, 19, 86. [Google Scholar] [CrossRef] [PubMed]
  82. Emery, C.F.; Olson, K.L.; Lee, V.S.; Habash, D.L.; Nasar, J.L.; Bodine, A. Home environment and psychosocial predictors of obesity status among community-residing men and women. Int. J. Obes. 2015, 39, 1401–1407. [Google Scholar] [CrossRef] [PubMed] [Green Version]
  83. Adhikari, S.; Sigdel, D. Prevalence of Overweight and Obesity and Its Associated Factors among Adult People at Chitwan, Nepal. IOSR J. Nurs. Health Sci. 2020, 9, 30–41. [Google Scholar] [CrossRef]
  84. Chen, C.-Y.; Pereira, M.A.; Kim, K.H.; Erickson, D.; Jacobs, D.R., Jr.; Zgibor, J.C.; Chung, T.; Sidney, S.; Iribarren, C.; Fabio, A. Fifteen-Year prospective analysis of television viewing and adiposity in african American and caucasian men and women: The CARDIA study. Sage Open 2015, 5, 2158244015600480. [Google Scholar] [CrossRef]
  85. Lajunen, H.-R.; Keski-Rahkonen, A.; Pulkkinen, L.; Rose, R.J.; Rissanen, A.; Kaprio, J. Are computer and cell phone use associated with body mass index and overweight? A population study among twin adolescents. BMC Public Health 2007, 7, 24. [Google Scholar] [CrossRef] [PubMed] [Green Version]
  86. Al-Agha, A.E.; Nizar, F.S.; Nahhas, A. The association between body mass index and duration spent on electronic devices in children and adolescents in Western Saudi Arabia. Saudi Med. J. 2016, 37, 436–439. [Google Scholar] [CrossRef]
  87. Kenney, E.L.; Gortmaker, S.L. United States Adolescents’ Television, Computer, Videogame, Smartphone, and Tablet Use: Associations with Sugary Drinks, Sleep, Physical Activity, and Obesity. J. Pediatr. 2017, 182, 144–149. [Google Scholar] [CrossRef] [PubMed] [Green Version]
  88. Wang, E.; Abrahamson, K.; Liu, P.J.; Ahmed, A. Can Mobile Technology Improve Weight Loss in Overweight Adults? A Systematic Review. West. J. Nurs. Res. 2019, 42, 747–759. [Google Scholar] [CrossRef] [PubMed]
  89. Liu, F.; Kong, X.; Cao, J.; Chen, S.; Li, C.; Huang, J.; Gu, D.; Kelly, T.N. Mobile Phone Intervention and Weight Loss Among Overweight and Obese Adults: A Meta-Analysis of Randomized Controlled Trials. Am. J. Epidemiol. 2015, 181, 337–348. [Google Scholar] [CrossRef] [Green Version]
Figure 1. Prevalence of overweight or obesity (BMI ≥ 25) and obesity (BMI ≥ 30) among Nepalese women by Nepal Demographic and Health Survey (NDHS) years 1996–2016.
Obesities 01 00011 g001
Table 1. Categorisation of explanatory variables based on the available categories in the NDHS datasets.
CategoriesSub-CategoriesAvailable DHS Categories
Source of drinking
water
Unimprovedunprotected dug well/spring; tanker truck/cart with small tank; surface water; other
Improvedpiped into dwelling/yard/plot; piped to neighbour; public tap/standpipe; tube well or borehole; protected dug well; protected spring; rainwater; bottled water
Type of toilet facilityUnimprovedflush/pour flush not to sewer/septic tank/pit latrine; pit latrine without slab/open pit; other; no facility/bush/field
Improvedflush/pour flush to piped sewer system/septic tank/pit latrine; ventilated improved pit (VIP) latrine; pit latrine with slab; composting toilet
Cooking fuelSolid fuelwood; straw/shrubs/grass; animal dung; agricultural crop; coal/ignite; charcoal; other
Clean fuelelectricity; LPG; natural gas; biogas; kerosene
Main floor materialUnimprovedearth/sand; dung; wood planks; palm/bamboo; other
Improvedparquet or polished wood; vinyl or asphalt strips; ceramic tiles; cement; carpet
Main wall
material
Unimprovedno wall; cane/palm/trunks; mud/sand; bamboo with mud; stone with mud; plywood; cardboard; reused wood; metal/galvanized sheet; other
Improvedcement; stone with lime/cement; bricks; cement blocks; wood planks/shingles
Main roof
material
Unimprovedno roof; thatch/palm leaf; mud; rustic mat; palm/bamboo; wood planks; cardboard; other
Improvedgalvanized sheet/metal; wood; calamine/cement fibre; ceramic tiles; cement; roofing shingles
Table 2. Characteristics of the study participants and the prevalence of overweight–obesity and obesity in relation to the socioeconomic and household environmental factors.
Variable
n (%) or Mean ± SD
All Participants
(n = 6165)
Participants with Overweight–Obesity (BMI ≥ 25) (n = 1215)Participants with Obesity (BMI ≥ 30) (n = 250)
Weight (kg)50.7 ± 9.664.9 ± 7.974.7 ± 8.3
Height (cm)151.7 ± 5.6151.6 ± 5.5151.1 ± 6.0
BMI (kg/m2)22.0 ± 3.928.2 ± 2.832.6 ± 2.6
Socioeconomic factors
Individual-level factors
Age (years)
15–242331 (37.8%)150 (12.3%)24 (9.6%)
25–341834 (29.7%)456 (37.5%)77 (30.8%)
35–492000 (32.4%)609 (50.1%)149 (59.6%)
Educational status
No formal education2126 (34.5%)375 (30.9%)65 (26.0%)
Primary965 (15.7%)244 (20.0%)57 (22.8%)
Secondary2223 (36.1%)404 (33.3%)88 (35.2%)
Higher851 (13.8%)192 (15.8%)40 (16.0%)
Employment status
Not currently employed2498 (40.5%)480 (39.5%)110 (44.0%)
Currently employed3667 (59.5%)735 (60.5%)140 (56.0%)
Household-level factors
Marital status
Never married1323 (21.5%)64 (5.3%)11 (4.4%)
Married/living with a partner4671 (75.7%)1111 (91.4%)230 (92.0%)
Widowed/divorced/separated171 (2.8%)40 (3.3%)9 (3.6%)
Number of household members
≤53763 (61.0%)855 (70.4%)190 (76.0%)
>52402 (31.0%)360 (29.6%)60 (24.0%)
Wealth index
Poorest1310 (21.2%)109 (9.0%)9 (3.6%)
Poorer1250 (20.3%)187 (15.4%)24 (9.6%)
Middle1251 (20.3%)186 (15.3%)26 (10.4%)
Richer1276 (20.7%)283 (23.3%)55 (22.0%)
Richest1078 (17.5%)450 (37.0%)136 (54.4%)
Religion
Hindu5369 (87.1%)1022 (84.1%)207 (82.8%)
Buddhist296 (4.8%)90 (7.4%)21 (8.4%)
Muslim267 (4.3%)41 (3.4%)9 (3.6%)
Other233 (3.8%)62 (5.1%)13 (5.2%)
Household environmental factors
Environmental factors
Place of residence
Urban3984 (64.6%)893 (73.5%)206 (82.4%)
Rural2181 (35.4%)322 (26.5%)44 (17.6%)
Province of residence
Province 1878 (14.2%)242 (19.9%)48 (19.2%)
Province 2984 (16.0%)113 (9.3%)19 (7.6%)
Province 3822 (13.3%)259 (21.3%)69 (27.6%)
Province 4783 (12.7%)235 (19.3%)54 (21.6%)
Province 5962 (15.6%)182 (15.0%)33 (13.2%)
Province 6862 (14.0%)110 (9.1%)17 (6.8%)
Province 7874 (14.2%)74 (6.1%)10 (4.0%)
Ecological zone
Mountain441 (7.2%)67 (5.5%)12 (4.8%)
Hill2823 (45.7%)625 (51.4%)136 (54.4%)
Terai2901 (47.1%)523 (43.0%)102 (40.8%)
Household facilities
Source of drinking water
Unimproved344 (5.6%)41 (3.4%)7 (2.8%)
Improved5549 (90%)1132 (93.2%)235 (94.0%)
Type of toilet facility
Unimproved747 (12.1%)67 (5.5%)7 (2.8%)
Improved5146 (83.5%)1106 (91.0%)235 (94.0%)
Cooking fuel
Solid fuel4201 (68.1%)557 (45.8%)74 (29.6%)
Clean fuel1690 (27.4%)616 (50.7%)168 (67.2%)
Access to electricity
No592 (9.6%)39 (3.2%)5 (2.0%)
Yes5301 (86.0%)1134 (93.3%)237 (94.8%)
Housing characteristics
Main floor material
Unimproved3815 (61.9%)498 (41.0%)63 (25.2%)
Improved2078 (33.7%)675 (55.6%)179 (71.6%)
Main wall material
Unimproved3255 (52.8%)427 (35.1%)57 (22.8%)
Improved2638 (42.8%)746 (61.4%)185 (74.0%)
Main roof material
Unimproved635 (10.3%)63 (5.2%)7 (2.8%)
Improved5258 (85.3%)1110 (91.4%)235 (94.0%)
Household possessions
Refrigerator
No5013 (81.3%)817 (67.2%)134 (53.6%)
Yes880 (14.3%)356 (29.3%)108 (43.2%)
Television
No2793 (45.3%)313 (25.8%)46 (18.4%)
Yes3100 (50.3%)860 (70.8%)196 (78.4%)
Mobile phone
No1747 (28.3%)188 (15.5%)31 (12.4%)
Yes4418 (71.7%)1027 (84.5%)219 (87.6%)
Bicycle
No3522 (57.1%)731 (60.2%)155 (62.0%)
Yes2371 (38.5%)442 (36.4%)87 (34.8%)
Motorised vehicle
No4782 (77.6%)834 (68.6%)143 (57.2%)
Yes1111 (18.0%)339 (27.9%)99 (39.6%)
The total of the categories might not always add up to the total number of participants due to missing data for some items. BMI: body mass index. n: sample size. SD: standard deviation.
Table 3. Unadjusted association of socioeconomic and household environmental factors with the risk of having overweight–obesity (BMI ≥ 25) and obesity (BMI ≥ 30).
VariableOverweight–Obesity (BMI ≥ 25)Obesity (BMI ≥ 30)
COR (95% CI)p-ValueCOR (95% CI)p-Value
Socioeconomic factors
Individual-level factors
Age (years)
15–24ref ref
25–344.81 (3.95–5.86)<0.0014.21 (2.65–6.69)<0.001
35–496.37 (5.26–7.07)<0.0017.73 (5.01–11.96)<0.001
Educational status
No formal educationref ref
Primary1.58 (1.32–1.90)<0.0011.99 (1.38–2.87)<0.001
Secondary1.04 (0.89–1.21)0.6461.30 (0.94–1.81)0.108
Higher1.36 (1.12–1.65)0.0021.56 (1.05–2.34)0.029
Employment status
Not currently employedref ref
Currently employed1.05 (0.93–1.20)0.4220.86 (0.67–1.11)0.253
Household-level factors
Marital status
Never marriedref ref
Married/living with a partner6.14 (4.73–7.96)<0.0016.17 (3.36–11.35)<0.001
Widowed/divorced/separated6.01 (3.89–9.27)<0.0016.62 (2.71–16.23)<0.001
Number of household members
≤5ref ref
>51.67 (1.46–1.91)<0.0010.48 (0.36–0.64)<0.001
Wealth index
Poorestref ref
Poorer1.94 (1.51–2.49)<0.0012.83 (1.31–6.11)0.008
Middle1.92 (1.50–2.47)<0.0013.07 (1.43–6.57)0.004
Richer3.14 (2.48–3.98)<0.0016.51 (3.20–13.23)<0.001
Richest7.90 (6.27–9.94)<0.00120.87 (10.58–41.19)<0.001
Religion
Hinduref ref
Buddhist1.86 (1.44–2.40)<0.0011.90 (1.19–3.02)0.007
Muslim0.77 (0.55–1.08)0.1350.87 (0.44–1.71)0.687
Other1.54 (1.14–2.08)0.0041.47 (0.82–2.62)0.187
Household environmental factors
Environmental factors
Place of residence
Urbanref ref
Rural0.60 (0.52–0.69)<0.0010.38 (0.27–0.53)<0.001
Province of residence
Province 1ref ref
Province 20.34 (0.27–0.44)<0.0010.34 (0.20–0.58)<0.001
Province 31.21 (0.98–1.49)0.0751.58 (1.08–2.32)0.018
Province 41.13 (0.91–1.39)0.2711.28 (0.86–1.91)0.227
Province 50.61 (0.49–0.76)<0.0010.61 (0.39–0.97)0.035
Province 60.38 (0.30–0.49)<0.0010.35 (0.20–0.61)<0.001
Province 70.24 (0.18–0.32)<0.0010.20 (0.10–0.40)<0.001
Ecological zone
Mountainref ref
Hill1.59 (1.21–2.09)<0.0011.81 (0.99–3.29)0.052
Terai1.23 (0.93–1.62)0.1461.30 (0.71–2.39)0.393
Household facilities
Source of drinking water
Unimprovedref ref
Improved1.89 (1.36–2.64)<0.0012.12 (0.99–4.55)0.051
Type of toilet facility
Unimprovedref ref
Improved2.79 (2.14–3.60)<0.0015.06 (2.38–10.77)<0.001
Cooking fuel
Solid fuelref ref
Clean fuel3.57 (3.28–4.29)<0.0016.16 (4.65–8.14)<0.001
Access to electricity
Noref ref
Yes3.86 (2.77–5.37)<0.0015.49 (2.26–13.38)<0.001
Housing characteristics
Main floor material
Unimprovedref ref
Improved3.21 (2.81–3.66)<0.0015.61 (4.19–7.52)<0.001
Main wall material
Unimprovedref ref
Improved2.61 (2.29–2.98)<0.0014.23 (3.13–5.72)<0.001
Main roof material
Unimprovedref ref
Improved2.43 (1.86–3.18)<0.0014.19 (1.97–8.94)<0.001
Household possessions
Refrigerator
Noref ref
Yes3.49 (2.99–4.07)<0.0015.09 (3.91–6.64)<0.001
Television
Noref ref
Yes3.04 (2.64–3.50)<0.0014.03 (2.91–5.58)<0.001
Mobile phone
Noref ref
Yes2.51 (2.12–2.96)<0.0012.89 (1.97–4.22)<0.001
Bicycle
Noref ref
Yes0.88 (0.77–1.00)0.0460.83 (0.63–1.08)0.166
Motorised vehicle
Noref ref
Yes2.08 (1.79–2.41)<0.0013.17 (2.43–4.14)<0.001
BMI: body mass index. COR: crude odds ratio. 95% CI: 95% confidence interval. ref: reference category.
Table 4. Socioeconomic and household environmental factors independently associated with the risk of having overweight–obesity (BMI ≥ 25) and obesity (BMI ≥ 30).
Variable *Overweight–Obesity (BMI ≥ 25)Obesity (BMI ≥ 30)
AOR (95% CI)p-ValueAOR (95% CI)p-Value
Socioeconomic factors
Individual-level factors
Age (years)
15–24ref ref
25–343.00 (2.37–3.82)<0.0012.21 (1.29–3.79)0.004
35–494.72 (3.67–6.10)<0.0014.41 (2.62–7.43)<0.001
Educational status
No formal educationref
Primary1.43 (1.15–1.77)0.001
Secondary1.21 (0.97–1.50)0.096
Higher1.08 (0.81–1.43)0.615
Household-level factors
Marital status
Never marriedref ref
Married/living with a partner3.48 (2.52–4.81)<0.0013.06 (1.50–6.24)0.002
Widowed/divorced/separated2.76 (1.64–4.65)<0.0012.85 (1.04–7.79)0.042
Wealth index
Poorestref ref
Poorer1.87 (1.41–2.47)<0.0012.83 (1.28–6.21)0.010
Middle1.91 (1.40–2.62)<0.0013.59 (1.62–7.96)0.003
Richer2.49 (1.76–3.52)<0.0015.78 (2.60–12.82)<0.001
Richest4.36 (2.83–6.71)<0.00110.52 (4.37–25.28)<0.001
Religion
Hinduref
Buddhist1.41 (1.03–1.94)0.032
Muslim1.10 (0.74–1.64)0.637
Other1.33 (0.93–1.89)0.121
Household environmental factors
Environmental factors
Province of residence
Province 1ref ref
Province 20.38 (0.28–0.51)<0.0010.40 (0.23–0.71)0.002
Province 30.92 (0.71–1.13)0.5331.00 (0.65–1.54)0.997
Province 40.89 (0.69–1.16)0.3941.00 (0.64–1.56)0.990
Province 50.55 (0.43–0.71)<0.0010.60 (0.37–0.96)0.032
Province 60.53 (0.39–0.71)<0.0010.57 (0.31–1.02)0.056
Province 70.30 (0.22–0.41)<0.0010.25 (0.12–0.53)<0.001
Household facilities
Type of toilet facility
Unimprovedref
Improved1.40 (1.04–1.87)0.026
Cooking fuel
Solid fuelref ref
Clean fuel1.44 (1.15–1.81)0.0021.66 (1.06–2.60)0.026
Household possessions
Refrigerator
Noref ref
Yes1.27 (1.01–1.61)0.0421.44 (1.01–2.07)0.047
Television
Noref
Yes1.26 (1.04–1.54)0.021
Mobile phone
Noref
Yes1.51 (1.24–1.84)<0.001
Bicycle
Noref ref
Yes0.76 (0.63–0.91)0.0040.66 (0.48–0.91)0.012
* The final model consists of variables which, when excluded, cause a significant change in deviance (p < 0.05), compared with the corresponding X2 test statistic on the relevant degrees of freedom. BMI: body mass index. AOR: adjusted odds ratio. 95% CI: 95% confidence interval. ref: reference category.
Publisher’s Note: MDPI stays neutral with regard to jurisdictional claims in published maps and institutional affiliations.

