
Obesity and Ideal Cardiovascular Health: Results from the My Research Legacy Study


Abstract
1. Introduction
2. Materials and Methods
2.1. Study Cohort
2.2. Overweight, Obesity, and Ideal Cardiovascular Health
2.3. Statistical Analysis
3. Results
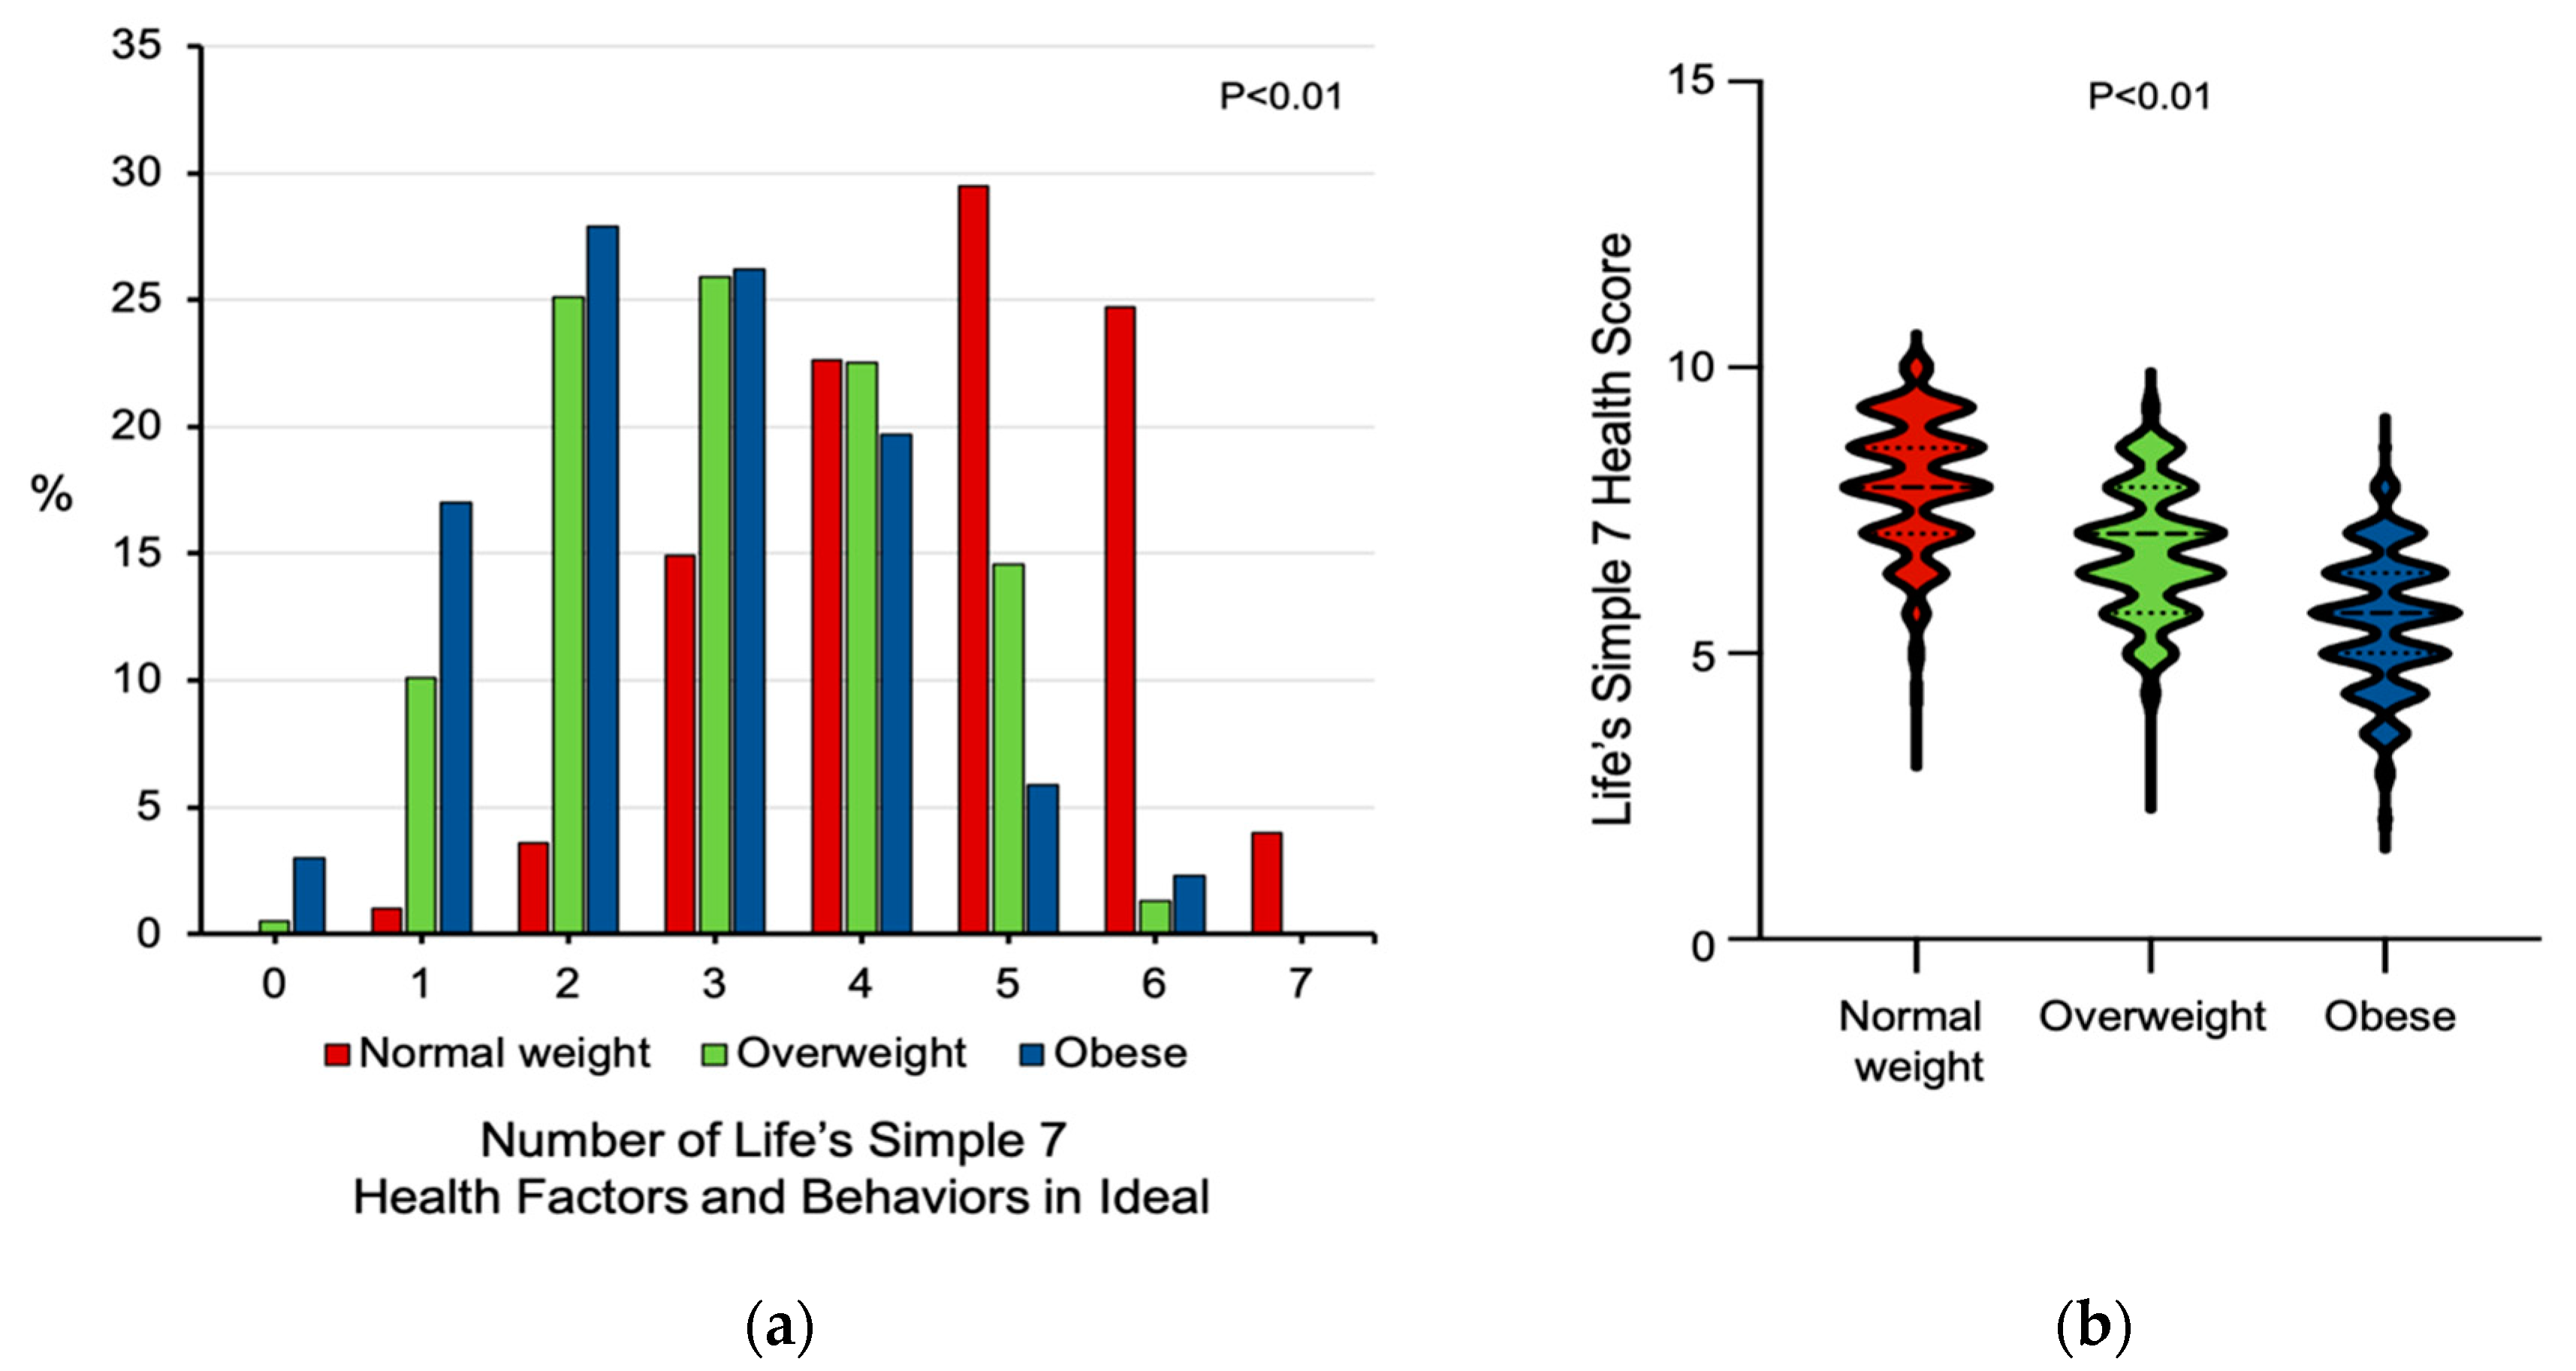
3.1. Differences in Ideal Cardiovascular Health Data among Normal-Weight, Overweight, and Obese Participants
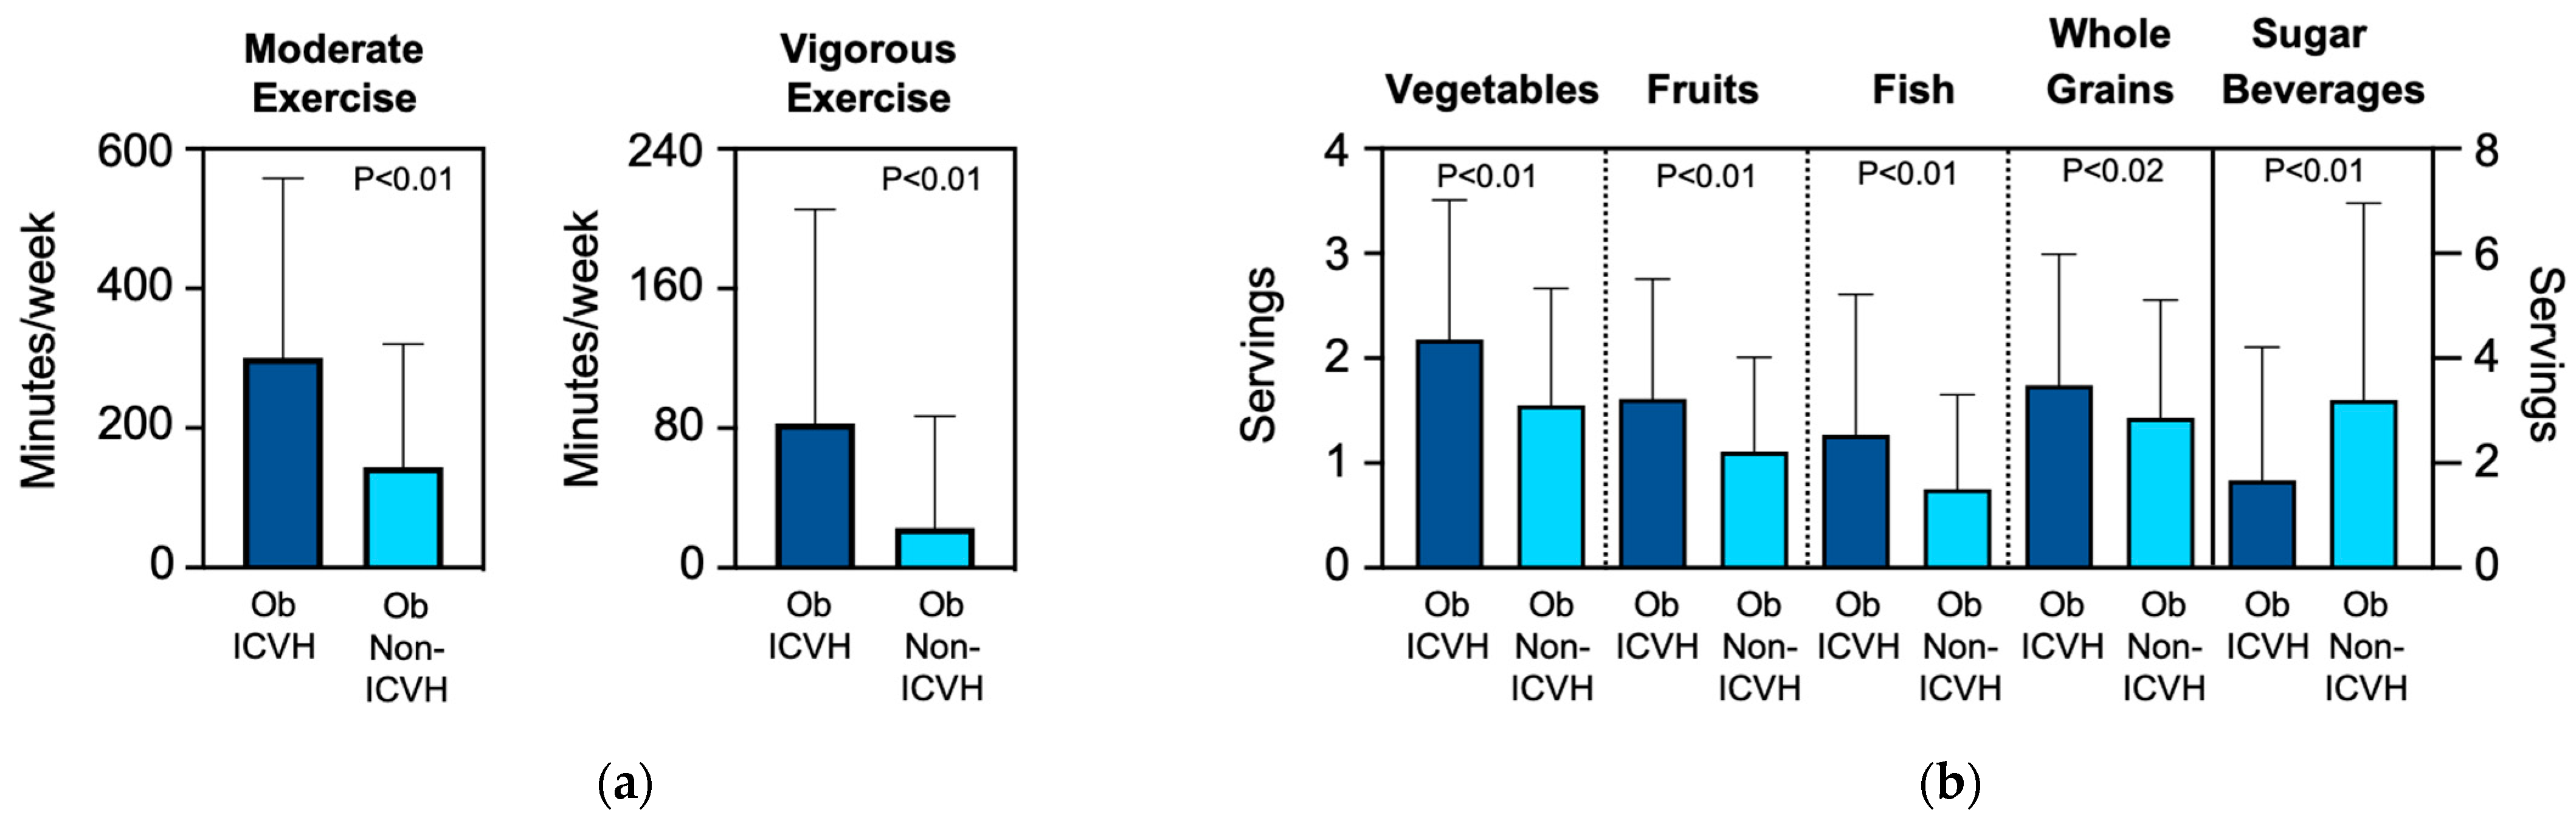
3.2. Ideal Cardiovascular Health in Obese Participants
3.3. Digital Health Data and Life’s Simple 7 Health Score
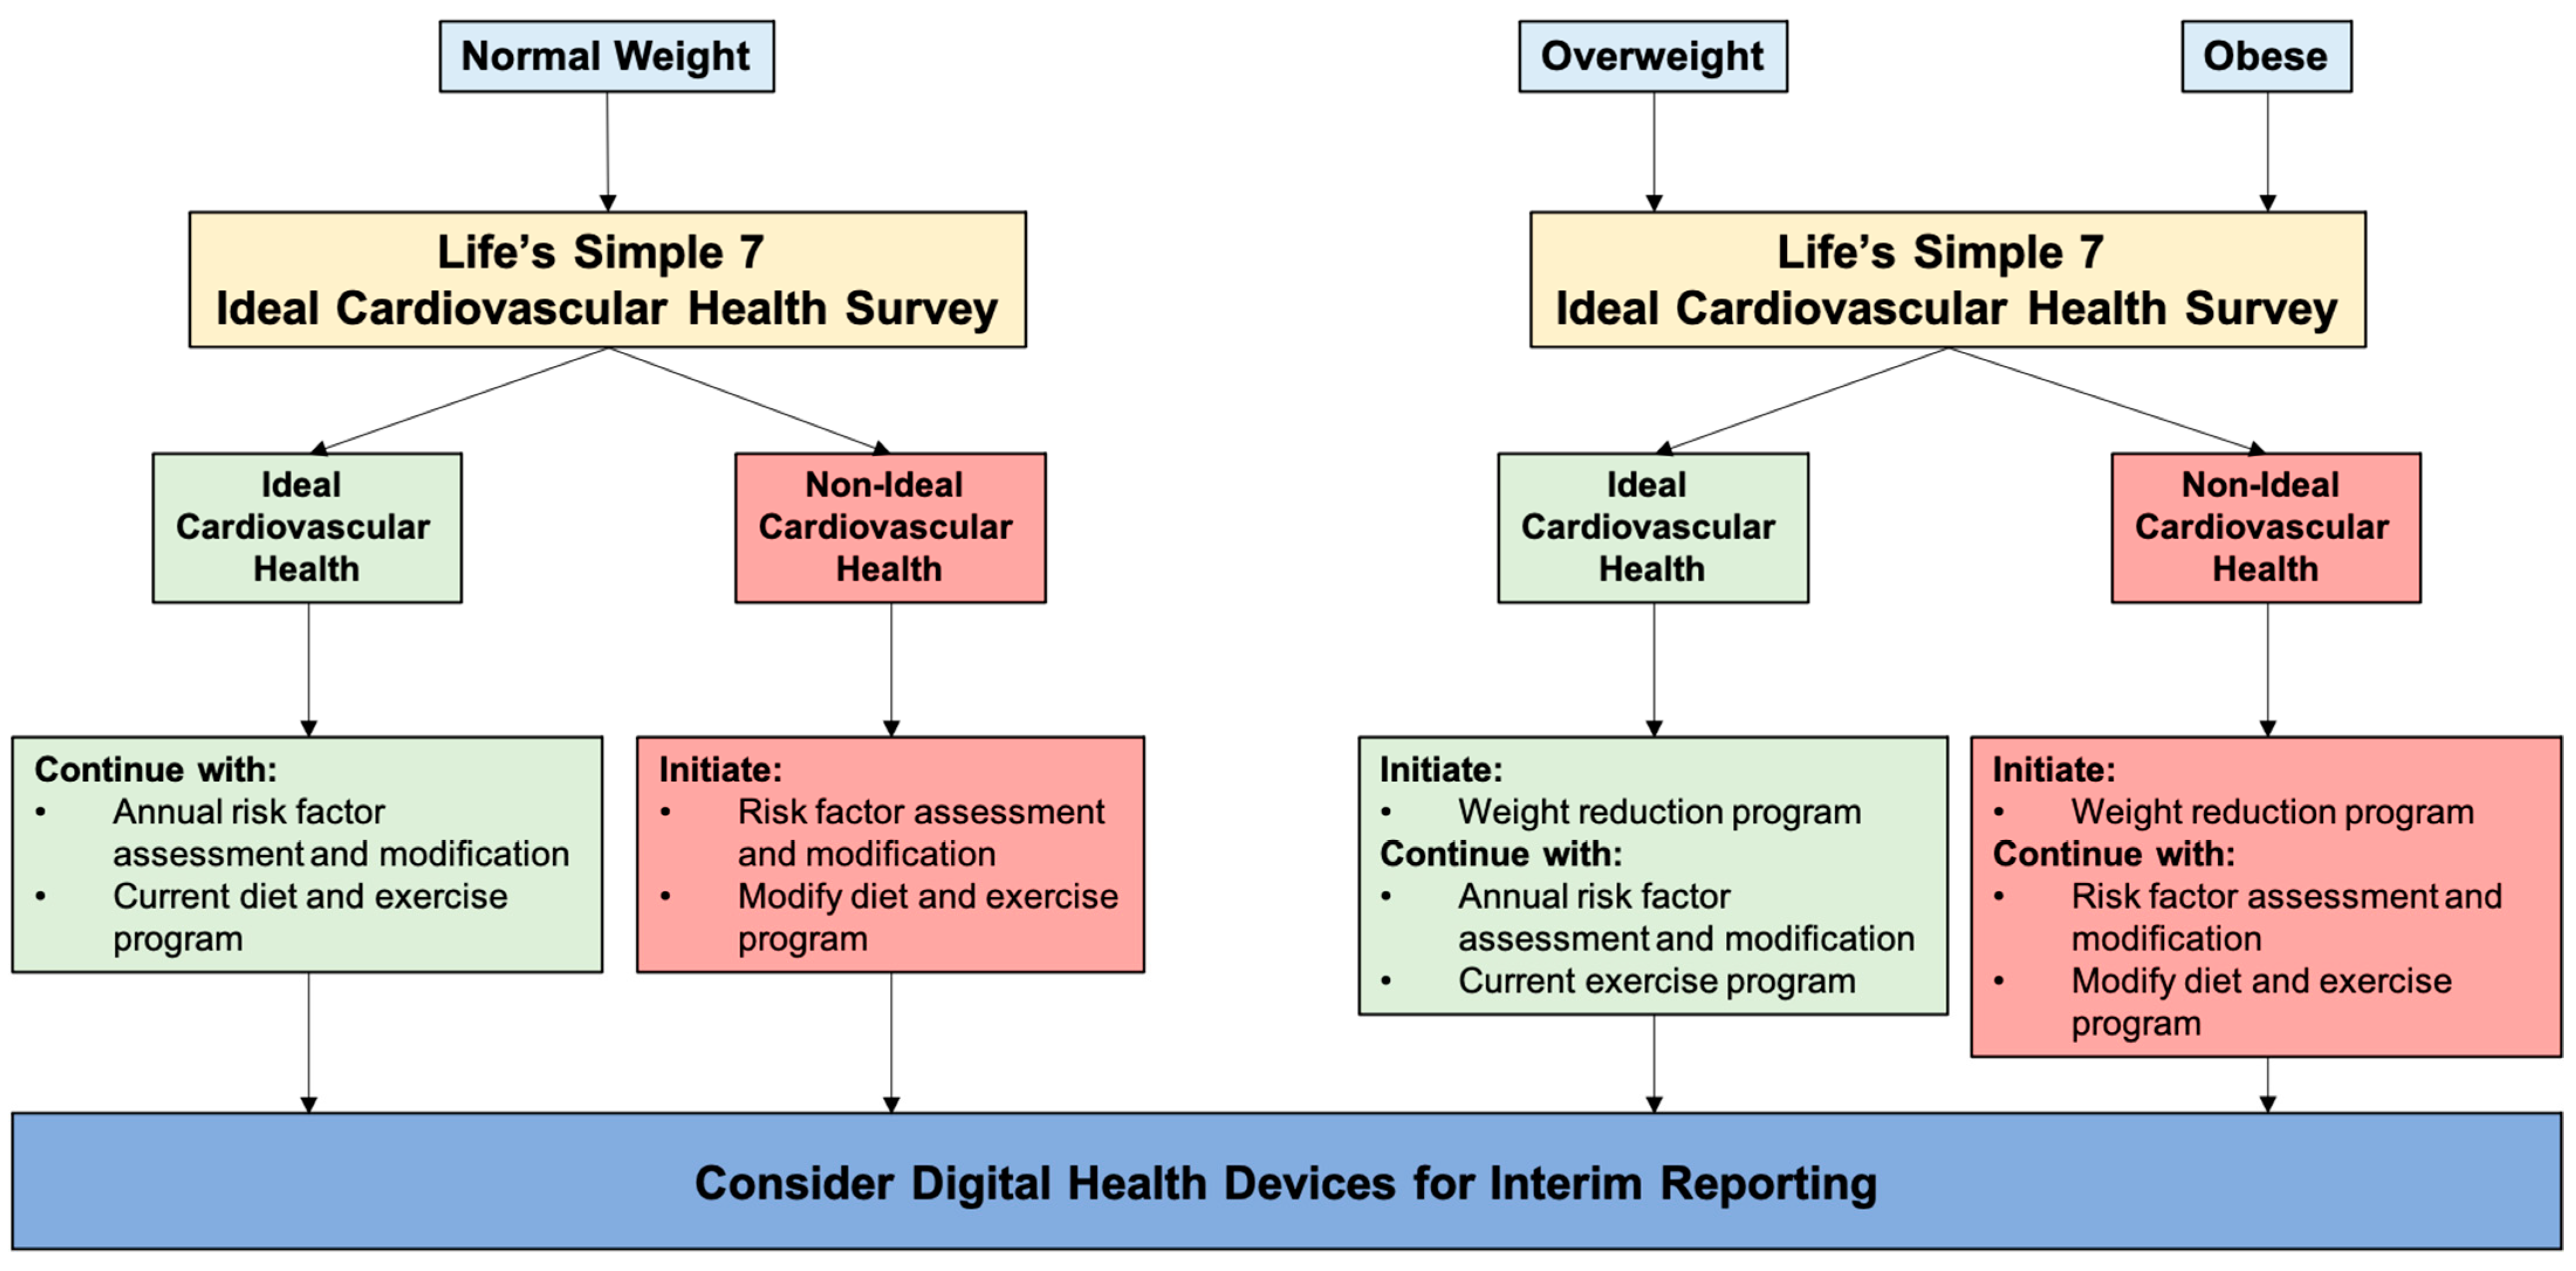
4. Discussion
Author Contributions
Funding
Institutional Review Board Statement
Informed Consent Statement
Data Availability Statement
Conflicts of Interest
References
- Klein, S. Clinical Implications of Obesity with Specific Focus on Cardiovascular Disease. Circulation 2004, 110, 2952–2967. [Google Scholar] [CrossRef]
- Poirier, P.; Giles, T.D.; Bray, G.A.; Hong, Y.; Stern, J.S.; Pi-Sunyer, F.X.; Eckel, R.H. Obesity and Cardiovascular Disease. Arter. Thromb. Vasc. Biol. 2006, 26, 968–976. [Google Scholar] [CrossRef] [PubMed]
- Virani, S.S.; Alonso, A.; Benjamin, E.J.; Bittencourt, M.S.; Callaway, C.W.; Carson, A.P.; Chamberlain, A.M.; Chang, A.R.; Cheng, S.; Delling, F.N.; et al. Heart Disease and Stroke Statistics—2020 Update: A Report from the American Heart Association. Circulation 2020, 141, e139–e596. [Google Scholar] [CrossRef] [PubMed]
- Centers for Disease Control and Prevention. Overweight & Obesity. 2020. Available online: www.cdc.gov (accessed on 1 March 2021).
- Hales, C.M.; Fryar, C.D.; Carroll, M.D.; Freedman, D.S.; Ogden, C.L. Trends in Obesity and Severe Obesity Prevalence in US Youth and Adults by Sex and Age, 2007–2008 to 2015–2016. JAMA 2018, 319, 1723–1725. [Google Scholar] [CrossRef]
- Centers for Disease Control and Prevention. Adult Obesity Facts. 2020. Available online: https://www.cdc.gov/obesity/data/adult.html (accessed on 1 March 2021).
- Flegal, K.M.; Kruszon-Moran, D.; Carroll, M.D.; Fryar, C.D.; Ogden, C.L. Trends in Obesity Among Adults in the United States, 2005 to 2014. JAMA 2016, 315, 2284–2291. [Google Scholar] [CrossRef]
- Khan, S.S.; Ning, H.; Wilkins, J.T.; Allen, N.; Carnethon, M.; Berry, J.D.; Sweis, R.N.; Lloyd-Jones, D.M. Association of Body Mass Index with Lifetime Risk of Cardiovascular Disease and Compression of Morbidity. JAMA Cardiol. 2018, 3, 280–287. [Google Scholar] [CrossRef]
- Eckel, N.; Meidtner, K.; Kalle-Uhlmann, T.; Stefan, N.; Schulze, M.B. Metabolically healthy obesity and cardiovascular events: A systematic review and meta-analysis. Eur. J. Prev. Cardiol. 2016, 23, 956–966. [Google Scholar] [CrossRef]
- Flegal, K.M.; Kit, B.K.; Orpana, H.; Graubard, B.I. Association of All-Cause Mortality with Overweight and Obesity Using Standard Body Mass Index Categories. JAMA 2013, 309, 71–82. [Google Scholar] [CrossRef]
- Banack, H.R.; Stokes, A. The ‘obesity paradox’ may not be a paradox at all. Int. J. Obes. 2017, 41, 1162–1163. [Google Scholar] [CrossRef] [PubMed]
- Wells, J.C.K. Commentary: The paradox of body mass index in obesity assessment: Not a good index of adiposity, but not a bad index of cardio-metabolic risk. Int. J. Epidemiol. 2014, 43, 672–674. [Google Scholar] [CrossRef] [PubMed]
- Lajous, M.; Bijon, A.; Fagherazzi, G.; Boutron-Ruault, M.-C.; Balkau, B.; Clavel-Chapelon, F.; Hernán, M.A. Body Mass Index, Diabetes, and Mortality in French Women. Epidemiology 2014, 25, 10–14. [Google Scholar] [CrossRef]
- Hernán, M.A.; Hernández-Díaz, S.; Robins, J.M. A Structural Approach to Selection Bias. Epidemiology 2004, 15, 615–625. [Google Scholar] [CrossRef] [PubMed]
- Stokes, A.; Preston, S.H. Smoking and reverse causation create an obesity paradox in cardiovascular disease. Obesity 2015, 23, 2485–2490. [Google Scholar] [CrossRef] [PubMed]
- Ortega, F.B.; Lavie, C.J.; Blair, S.N. Obesity and Cardiovascular Disease. Circ. Res. 2016, 118, 1752–1770. [Google Scholar] [CrossRef] [PubMed]
- Wei, M.; Kampert, J.B.; Barlow, C.E.; Nichaman, M.Z.; Gibbons, L.W.; Paffenbarger, J.R.S.; Blair, S.N. Relationship Between Low Cardiorespiratory Fitness and Mortality in Normal-Weight, Overweight, and Obese Men. JAMA 1999, 282, 1547–1553. [Google Scholar] [CrossRef] [PubMed]
- Lee, C.D.; Blair, S.N.; Jackson, A.S. Cardiorespiratory fitness, body composition, and all-cause and cardiovascular disease mortality in men. Am. J. Clin. Nutr. 1999, 69, 373–380. [Google Scholar] [CrossRef] [PubMed]
- Lyerly, G.W.; Sui, X.; Lavie, C.J.; Church, T.S.; Hand, G.A.; Blair, S.N. The Association Between Cardiorespiratory Fitness and Risk of All-Cause Mortality Among Women with Impaired Fasting Glucose or Undiagnosed Diabetes Mellitus. Mayo Clin. Proc. 2009, 84, 780–786. [Google Scholar] [CrossRef] [PubMed]
- Farrell, S.W.; Fitzgerald, S.J.; Mcauley, P.A.; Barlow, C.E. Cardiorespiratory Fitness, Adiposity, and All-Cause Mortality in Women. Med. Sci. Sports Exerc. 2010, 42, 2006–2012. [Google Scholar] [CrossRef]
- Angell, S.Y.; McConnell, M.V.; Anderson, C.A.; Bibbins-Domingo, K.; Boyle, D.S.; Capewell, S.; Ezzati, M.; De Ferranti, S.; Gaskin, D.J.; Goetzel, R.Z.; et al. The American Heart Association 2030 Impact Goal: A Presidential Advisory from the American Heart Association. Circulation 2020, 141, e120–e138. [Google Scholar] [CrossRef] [PubMed]
- Sanchez, E. Life’s Simple 7: Vital but Not Easy. J. Am. Hearth Assoc. 2018, 7, e009324. [Google Scholar] [CrossRef] [PubMed]
- Lloyd-Jones, D.M.; Hong, Y.; Labarthe, D.; Mozaffarian, D.; Appel, L.J.; Van Horn, L.; Greenlund, K.; Daniels, S.; Nichol, G.; Tomaselli, G.F.; et al. American heart association strategic planning task force and statistics committee defining and setting national goals for cardiovascular health promotion and disease reduction: The American heart association’s strategic impact goal through 2020 and beyond. Circulation 2010, 121, 586–613. [Google Scholar] [CrossRef] [PubMed]
- Leopold, J.; Davis, R.; Antman, E. Data from Digital Health Devices Informs Ideal Cardiovascular Health. J. Pers. Med. 2021, 11, 189. [Google Scholar] [CrossRef] [PubMed]
- Hales, C.M.; Carroll, M.D.; Fryar, C.D.; Ogden, C.L. Prevalence of Obesity among Adults and Youth: United States, 2015–2016; NCHS Data Brief; National Center for Health Statistics: Hyattsville, MD, USA, 2017; pp. 1–8. [Google Scholar]
- World Health Organization. Obesity and Overweight. Available online: www.who.int (accessed on 1 March 2021).
- Piché, M.-E.; Poirier, P.; Lemieux, I.; Després, J.-P. Overview of Epidemiology and Contribution of Obesity and Body Fat Distribution to Cardiovascular Disease: An Update. Prog. Cardiovasc. Dis. 2018, 61, 103–113. [Google Scholar] [CrossRef]
- Church, T.S.; LaMonte, M.J.; Barlow, C.E.; Blair, S.N. Cardiorespiratory Fitness and Body Mass Index as Predictors of Cardiovascular Disease Mortality among Men with Diabetes. Arch. Intern. Med. 2005, 165, 2114–2120. [Google Scholar] [CrossRef] [PubMed]
- McAuley, P.A.; Sui, X.; Church, T.S.; Hardin, J.W.; Myers, J.N.; Blair, S.N. The Joint Effects of Cardiorespiratory Fitness and Adiposity on Mortality Risk in Men with Hypertension. Am. J. Hypertens. 2009, 22, 1062–1069. [Google Scholar] [CrossRef] [PubMed]
- Tarp, J.; Grøntved, A.; Sanchez-Lastra, M.A.; Dalene, K.E.; Ding, D.; Ekelund, U. Fitness, Fatness, and Mortality in Men and Women from the UK Biobank: Prospective Cohort Study. J. Am. Hearth Assoc. 2021, 10, e019605. [Google Scholar] [CrossRef]
- Ross, L.M.; Barber, J.L.; McLain, A.C.; Weaver, R.G.; Sui, X.; Blair, S.N.; Sarzynski, M.A. The Association of Cardiorespiratory Fitness and Ideal Cardiovascular Health in the Aerobics Center Longitudinal Study. J. Phys. Act. Health 2019, 16, 968–975. [Google Scholar] [CrossRef] [PubMed]
- Elagizi, A.; Kachur, S.; Lavie, C.J.; Carbone, S.; Pandey, A.; Ortega, F.B.; Milani, R.V. An Overview and Update on Obesity and the Obesity Paradox in Cardiovascular Diseases. Prog. Cardiovasc. Dis. 2018, 61, 142–150. [Google Scholar] [CrossRef] [PubMed]
- Abdullah, A.; Wolfe, R.; Stoelwinder, J.U.; De Courten, M.; Stevenson, C.; Walls, H.L.; Peeters, A. The number of years lived with obesity and the risk of all-cause and cause-specific mortality. Int. J. Epidemiol. 2011, 40, 985–996. [Google Scholar] [CrossRef]
- Dowd, J.B.; Zajacova, A. Long-Term Obesity and Cardiovascular, Inflammatory, and Metabolic Risk in U.S. Adults. Am. J. Prev. Med. 2014, 46, 578–584. [Google Scholar] [CrossRef]
- Tanamas, S.K.; Wong, E.; Backholer, K.; Abdullah, A.; Wolfe, R.; Barendregt, J.; Peeters, A. Duration of obesity and incident hypertension in adults from the Framingham Heart Study. J. Hypertens. 2015, 33, 542–545. [Google Scholar] [CrossRef] [PubMed]
- Egan, B.M.; Li, J.; Sutherland, S.E.; Jones, D.W.; Ferdinand, K.C.; Hong, Y.; Sanchez, E. Sociodemographic Determinants of Life’s Simple 7: Implications for Achieving Cardiovascular Health and Health Equity Goals. Ethn. Dis. 2020, 30, 637–650. [Google Scholar] [CrossRef] [PubMed]
- Fawcett, E.; van Velthoven, M.H.; Meinert, E. Long-Term Weight Management Using Wearable Technology in Overweight and Obese Adults: Systematic Review. JMIR mHealth uHealth 2020, 8, e13461. [Google Scholar] [CrossRef] [PubMed]
- Ryan, D.H.; Yockey, S.R. Weight Loss and Improvement in Comorbidity: Differences at 5%, 10%, 15%, and over. Curr. Obes. Rep. 2017, 6, 187–194. [Google Scholar] [CrossRef]


| Normal Weight (n = 523) | Overweight (n = 378) | Obese (n = 660) | p Value | |
|---|---|---|---|---|
| Age (years) | 42.7 ± 14.0 | 44.8 ± 13.6 | 45.1 ± 11.8 | <0.01 |
| Gender (% female) | 82.6 | 74.3 | 81.5 | <0.01 |
| Race and Ethnicity (no.) | <0.01 | |||
| Asian | 17 | 17 | 8 | |
| Black | 12 | 10 | 38 | |
| Hispanic | 16 | 22 | 30 | |
| White | 458 | 322 | 557 | |
| Other | 20 | 7 | 27 | |
| Region (no.) | <0.01 | |||
| Northeast | 74 | 61 | 92 | |
| South | 199 | 148 | 275 | |
| Midwest | 120 | 77 | 181 | |
| West | 130 | 92 | 112 | |
| Diagnosed with Cardiovascular Disease (%) | 29.3 | 36.0 | 42.0 | <0.01 |
| Diabetes mellitus (%) | 1.5 | 6.9 | 19.2 | <0.01 |
| Hypertension (%) | 34.2 | 47.9 | 63.3 | <0.01 |
| Hypercholesterolemia (%) | 13.8 | 22.5 | 24.9 | <0.01 |
| Medications (%) | <0.01 | |||
| Diabetes mellitus | 1.5 | 5.3 | 16.5 | |
| Hypertension | 16.6 | 29.9 | 46.5 | |
| Hypercholesterolemia | 17.4 | 17.4 | 24.9 | |
| Smoking status (%) | <0.01 | |||
| Current | 5.5 | 5.3 | 8.9 | |
| Quit ≤ 1 year | 2.9 | 4.0 | 4.4 | |
| Quit > 1 year | 18.4 | 23.0 | 28.2 | |
| Never | 73.2 | 67.7 | 58.5 | |
| Clinical Data | ||||
| Weight (kg) | 62.7 ± 9.0 | 77.9 ± 9.6 | 104.8 ± 21.9 | <0.01 |
| BMI (kg/m2) | 22.2 ± 1.9 | 27.3 ± 1.4 | 37.6 ± 6.8 | <0.01 |
| Systolic blood pressure (mmHg) * | 113.5 ± 11.4 | 118.5 ± 12.1 | 121.4 ± 13.0 | <0.01 |
| Diastolic blood pressure (mmHg) * | 70.7 ± 8.0 | 73.6 ± 8.1 | 75.3 ± 8.9 | <0.01 |
| Total cholesterol (mmol/L) * | 186.0 ± 29.9 | 189.7 ± 31.6 | 190.2 ± 27.1 | <0.04 |
| Blood glucose (mmol/L) * | 94.9 ± 12.0 | 99.3 ± 14.6 | 102.7 ± 22.7 | <0.01 |
| Diet | ||||
| Vegetables/day (cups) | 2.1 ± 1.4 | 2.0 ± 1.3 | 1.6 ± 1.2 | <0.01 |
| Fruit/day (cups) | 1.5 ± 1.1 | 1.4 ± 1.2 | 1.2 ± 1.0 | <0.01 |
| Fish (servings/week) | 1.0 ± 1.1 | 1.0 ± 1.0 | 0.8 ± 1.0 | <0.01 |
| Whole grains (servings/day) | 1.7 ± 1.2 | 1.6 ± 1.2 | 1.5 ± 1.1 | <0.01 |
| Sugar-sweetened beverages (servings/week) | 1.9 ± 3.0 | 2.2 ± 3.2 | 3.0 ± 3.6 | <0.01 |
| Avoid prepackaged foods (%) | 62.7 | 56.4 | 41.5 | <0.01 |
| Avoid eating out (%) | 40.3 | 37.6 | 35.5 | 0.23 |
| Avoid salt at home (%) | 52.8 | 56.4 | 59.9 | 0.05 |
| Exercise | ||||
| Moderate exercise (min/week) | 237.2 ± 224.1 | 219.9 ± 219.9 | 168.6 ± 199.2 | <0.01 |
| Vigorous exercise (min/week) | 102.7 ± 137.4 | 79.6 ± 123.9 | 32.2 ± 79.1 | <0.01 |
| Life’s Simple 7 | ||||
| Smoking score (%) | <0.05 | |||
| Poor | 5.5 | 5.3 | 8.9 | |
| Intermediate | 2.9 | 4.0 | 4.4 | |
| Ideal | 91.6 | 90.7 | 86.7 | |
| Activity score (%) | <0.01 | |||
| Poor | 1.2 | 0.5 | 3.3 | |
| Intermediate | 23.7 | 30.2 | 53.0 | |
| Ideal | 75.1 | 69.3 | 43.7 | |
| Diet score (%) | <0.01 | |||
| Poor | 36.0 | 41.5 | 52.3 | |
| Intermediate | 51.8 | 48.7 | 42.4 | |
| Ideal | 12.2 | 9.8 | 5.3 | |
| Weight score (%) | <0.01 | |||
| Poor | 0 | 0 | 100.0 | |
| Intermediate | 0 | 100 | 0.0 | |
| Ideal | 100 | 0 | 0.0 | |
| Blood glucose score (%) | <0.01 | |||
| Poor | 0.2 | 3.2 | 7.1 | |
| Intermediate | 29.3 | 40.0 | 38.5 | |
| Ideal | 70.5 | 56.8 | 54.4 | |
| Cholesterol score (%) | <0.01 | |||
| Poor | 3.2 | 3.7 | 1.4 | |
| Intermediate | 40.0 | 52.9 | 55.9 | |
| Ideal | 56.8 | 43.4 | 42.7 | |
| Blood pressure score (%) | <0.01 | |||
| Poor | 3.3 | 4.5 | 9.4 | |
| Intermediate | 37.7 | 56.9 | 61.8 | |
| Ideal | 59.0 | 38.6 | 28.8 |
| Obese Ideal Cardiovascular Health (n = 103) | Obese Non-Ideal Cardiovascular Health (n = 557) | p Value | |
|---|---|---|---|
| Age (years) | 38.3 ± 11.1 | 46.3 ± 11.5 | <0.01 |
| Gender (% female) | 85.4 | 80.8 | 0.26 |
| Race and Ethnicity (no.) | 0.36 | ||
| Asian | 1 | 7 | |
| Black | 8 | 30 | |
| Hispanic | 7 | 23 | |
| White | 81 | 476 | |
| Other | 6 | 21 | |
| Region (no.) | 0.67 | ||
| Northeast | 18 | 74 | |
| South | 42 | 233 | |
| Midwest | 28 | 153 | |
| West | 15 | 97 | |
| Diagnosed with Cardiovascular Disease (%) | 32.0 | 43.8 | <0.03 |
| Diabetes mellitus (%) | 1.0 | 22.6 | <0.01 |
| Hypertension (%) | 31.1 | 69.3 | <0.01 |
| Hypercholesterolemia (%) | 17.5 | 65.7 | <0.01 |
| Medications (%) | <0.01 | ||
| Diabetes mellitus | 1.0 | 19.4 | |
| Hypertension | 20.4 | 51.4 | |
| Hypercholesterolemia | 3.9 | 28.7 | |
| Smoking status (%) | <0.01 | ||
| Current | 0.0 | 10.6 | |
| Quit ≤ 1 year | 0.0 | 5.2 | |
| Quit > 1 year | 35.0 | 26.9 | |
| Never | 65.0 | 57.3 | |
| CLINICAL DATA | |||
| Weight (kg) | 97.6 ± 17.1 | 106.2 ± 22.4 | <0.01 |
| BMI (kg/m2) | 35.6 ± 5.0 | 37.9 ± 7.1 | <0.01 |
| Systolic blood pressure (mmHg) * | 113.3 ± 9.6 | 122.9 ± 13.0 | <0.01 |
| Diastolic blood pressure (mmHg) * | 71.2 ± 6.2 | 76.1 ± 9.2 | <0.01 |
| Total cholesterol (mmol/L) * | 180.5 ± 21.4 | 191.9 ± 27.3 | <0.01 |
| Blood glucose (mmol/L) * | 94.1 ± 6.0 | 104.3 ± 24.2 | <0.01 |
| Normal Weight (n = 108) | Overweight (n = 81) | Obese (n = 103) | p Value | |
|---|---|---|---|---|
| Weight (kg) | 63.4 ± 9.2 | 78.2 ± 10.0 | 101.3 ± 27.4 | <0.01 |
| Delta reported vs. measured weight (kg) | −0.8 ± 3.9 | 0.0 ± 2.8 | −0.7 ± 5.7 | 0.47 |
| BMI (kg/m2) | 22.4 ± 2.2 | 27.2 ± 1.9 | 36.2 ± 5.7 | <0.01 |
| Delta reported vs. measured BMI (kg/m2) | −0.3 ± 1.4 | 0.0 ± 1.0 | −0.3 ± 2.0 | 0.42 |
| Healthy Weight Score (%) | <0.01 | |||
| Poor | 0.0 | 7.4 | 93.2 | |
| Intermediate | 11.1 | 85.2 | 6.8 | |
| Ideal | 88.9 | 7.4 | 0.0 | |
| Normal Weight (n = 128) | Overweight (n = 103) | Obese (n = 124) | p Value | |
| Moderate exercise (min/week) | 157.3 ± 206.6 | 135.8 ± 170.8 | 112.2 ± 138.3 | 0.12 |
| Delta reported vs. measured moderate exercise (min/week) | 90.1 ± 288.4 | 75.9 ± 244.4 | 72.5 ± 216.8 | 0.84 |
| Vigorous exercise (min/week) | 184.6 ± 234.0 | 167.9 ± 218.0 | 140.9 ± 233.4 | 0.31 |
| Delta reported vs. measured vigorous exercise (min/week) | −66.0 ± 236.2 | −66.0 ± 192.0 | −97.1 ± 239.1 | 0.46 |
| Physical Activity Score (%) | 0.12 | |||
| Poor | 0.0 | 0.0 | 0.0 | |
| Intermediate | 35.2 | 35.9 | 46.8 | |
| Ideal | 64.8 | 64.1 | 53.2 | |
| Normal Weight (n = 99) | Overweight (n = 79) | Obese (n = 94) | p Value | |
| Recalculated LS7 Health Score | 7.9 ± 1.0 | 7.1 ± 1.2 | 6.0 ± 1.0 | <0.01 |
| Normal Weight (n = 137) | Overweight (n = 107) | Obese (n = 131) | p Value | |
| Steps per day | 8593.0 ± 5186.2 | 8069.6 ± 4463.9 | 6756.0 ± 4145.0 | <0.01 |
Publisher’s Note: MDPI stays neutral with regard to jurisdictional claims in published maps and institutional affiliations. |
© 2021 by the authors. Licensee MDPI, Basel, Switzerland. This article is an open access article distributed under the terms and conditions of the Creative Commons Attribution (CC BY) license (https://creativecommons.org/licenses/by/4.0/).
Share and Cite
Leopold, J.A.; Antman, E.M. Obesity and Ideal Cardiovascular Health: Results from the My Research Legacy Study. Obesities 2021, 1, 36-48. https://doi.org/10.3390/Obesities1010004
Leopold JA, Antman EM. Obesity and Ideal Cardiovascular Health: Results from the My Research Legacy Study. Obesities. 2021; 1(1):36-48. https://doi.org/10.3390/Obesities1010004
Chicago/Turabian StyleLeopold, Jane A., and Elliott M. Antman. 2021. "Obesity and Ideal Cardiovascular Health: Results from the My Research Legacy Study" Obesities 1, no. 1: 36-48. https://doi.org/10.3390/Obesities1010004
APA StyleLeopold, J. A., & Antman, E. M. (2021). Obesity and Ideal Cardiovascular Health: Results from the My Research Legacy Study. Obesities, 1(1), 36-48. https://doi.org/10.3390/Obesities1010004