Article

Decarbonizing Jordan’s Transport Sector Pathway: A Scenario-Based Integration of Hydrogen Fuel Cell Buses into a Bus Rapid Transit Project


1
Mechanical & Maintenance Engineering Department, German Jordanian University, Amman 11180, Jordan
2
Mechatronics Engineering Department, German Jordanian University, Amman 11180, Jordan
3
Hydrogen and Green Energy Hub, German Jordanian University, Amman 11180, Jordan
*
Author to whom correspondence should be addressed.
Hydrogen 2026, 7(3), 99; https://doi.org/10.3390/hydrogen7030099
Submission received: 9 June 2026 / Revised: 13 July 2026 / Accepted: 14 July 2026 / Published: 16 July 2026

Abstract

Hydrogen Fuel Cell Electric Buses (FCEBs) are a promising solution for decarbonizing public transport. Their operational feasibility in developing countries depends on hydrogen-supply costs and infrastructure readiness. The Ministry of Energy has reported a 400% increase in imported natural-gas costs due to current geopolitical tensions between the United States and Iran, exposing the strategic vulnerability of relying on imported diesel for public transport. This study assesses the operational hydrogen demand, fuel-cost implications, and avoided diesel tailpipe carbon dioxide (CO2) emissions associated with gradually integrating FCEBs into Jordan’s Bus Rapid Transit (BRT) project. The baseline system consists of 64 diesel buses covering about 11 million kilometers annually, consuming around 3 million liters of diesel and emitting roughly 8108.3 tons of CO2. Fleet transition scenarios are assessed for 2030, 2035, and 2040, with FCEB-integration ratios of 10%, 15%, and 25%. Under the reference assumption of equivalent-duty replacement, avoided diesel tailpipe CO2 emissions increase with the diesel service displaced by FCEBs, reaching 25.7% at the highest penetration level. At the $6/kg reference hydrogen-price input, FCEB integration results in higher operational fuel costs than diesel-only operation. Under the constant diesel-price reference, mixed-fleet operation becomes cost-competitive at hydrogen prices of $1/kg and $2/kg, with operational fuel-cost savings of up to 16.97%. Within the operational fuel-cost boundary of this study, mixed-fleet competitiveness is influenced by both the assumed hydrogen fuel price and diesel-price trajectory. The results support gradual deployment, subject to the greenhouse-gas intensity of the hydrogen-production and delivery pathway and the readiness of hydrogen supply and depot infrastructure.

1. Introduction

The transportation sector is a fundamental pillar of the global economy as it accounts for approximately 7% of the global Gross Domestic Product (GDP) and employs nearly 193 million people around the world [1]. However, the sector has heavily relied on fossil fuels and Internal Combustion Engines (ICEs) since the second half of the 19th century, posing several economic and environmental challenges [2]. These concerns have been further intensified by the declining fossil fuel reserves and the continuously growing demand for transportation services [3]. Furthermore, the combustion of hydrocarbon fuels in ICEs releases Greenhouse Gases (GHGs), volatile organic compounds, and fine particulate matter. These pollutants collectively contribute to air pollution and long-term environmental damage [4,5]. In 2024, the transportation sector was responsible for roughly 23.3% of global CO2 emissions, thereby constituting the second-largest source of carbon emissions globally [6].
To effectively address these issues, transitional approaches toward low-carbon transportation systems have become essential. Various solutions have been proposed, including the electrification of transport, the use of alternative fuels, and the adoption of more efficient technologies [7,8]. While these offer significant emissions-reduction potential, several operational limitations remain, including the energy density, range, charging time, and infrastructure readiness [9,10,11]. These limitations underscore the necessity for complementary technologies, particularly in heavy-duty and high-demand transport applications such as shipping, aviation, heavy-duty trucking, and long-haul transportation [12].
In this context, GH2 has emerged as a promising solution for the decarbonization of the transportation sector [13]. GH2 is a clean energy carrier that is produced via water electrolysis powered by Renewable Energy Sources (RESs), such as solar, wind, or hydropower. Since its production fully relies on RESs, GH2 is considered an environmentally friendly alternative fuel that can be utilized in hard-to-abate transportation modes [14,15]. However, the overall greenhouse-gas performance of GH2 depends on the hydrogen-production and delivery pathway, including the electricity supply, compression, storage, transport, and dispensing. These upstream emissions are outside the boundary of the present operational assessment.
To date, the deployment of hydrogen-based transportation solutions remains limited in developing and emerging economies due to the lack of technological readiness, the high cost of hydrogen production, and the limited regulatory and policy support, among many other limitations [16,17]. In Jordan, the transportation sector is among the largest energy-consuming sectors and significantly contributes to GHG emissions [18]. Therefore, the country has begun investing in modern public transportation systems in recent years, including the Bus Rapid Transit (BRT) project, which represents a backbone for public transportation in Amman and offers an opportunity to explore the integration of low-carbon mobility technologies [19].
While global research has focused on investigating hydrogen mobility and fuel cell transportation technologies [20,21,22,23], limited research has examined their potential role within Jordan’s transportation sector, despite the country’s abundant renewable energy sources that could enable large-scale GH2 production and utilization [24,25,26,27,28,29]. However, findings from international studies on hydrogen mobility and Fuel Cell Electric Buses (FCEBs) cannot be directly transferred to the Jordanian BRT system. The Jordanian case combines high daily bus utilization, centralized depot operations, heavy dependance on imported fuels, and an emerging hydrogen infrastructure context. These create a distinct operational and energy security context for FCEB deployment. Moreover, the implications of phased FCEB integration for the hydrogen demand, operational fuel costs, and tailpipe CO2 emissions in Jordanian BRT system remain largely unexplored. Although Battery Electric Buses (BEBs) and other low-carbon propulsion technologies can contribute to public transport decarbonization, they are not assessed as competing alternatives in this study. The present work focuses exclusively on FCEBs as a selected hydrogen-based transition pathway relative to the existing diesel BRT fleet. Therefore, this study assesses the operational implications of gradually integrating Fuel Cell Electric Buses (FCEBs) into Jordan’s BRT system. A scenario-based approach is employed to quantify hydrogen demands, operational fuel costs, and avoided diesel tailpipe CO2 emissions relative to the existing diesel BRT fleet.

2. Green Hydrogen as an Alternative Fuel for Transportation

Alternative fuels are secondary energy carriers or energy sources that partially substitute for fossil fuels and have the potential to enhance the technical and environmental performance of energy-related applications [30]. Alternative fuels are produced from various primary energy sources and raw materials, including bio-alcohols, biodiesel, liquefied petroleum gas, biomethane, hydrogen, and electricity generated from fuel cells [31]. Various mobility technologies have been developed to utilize these types of fuels over the last few decades. These include thermal engines [32], electric motors [33,34], fuel cells [35], and hybrid powertrains [36]. Among these fuels examined to date, GH2 is attracting significant attention in the energy field as a viable fuel for transportation [37]. For instance, a case study in Austria assessed a FCEB fleet supplied with hydrogen produced from wind energy, illustrating the potential to integrate renewable electricity, electrolysis, and public bus operation, while identifying investment costs as a major barrier to near-term competitiveness [38]. A separate study in China applied well-to-wheel and total-cost-of-ownership models to renewable hydrogen fuel cell vehicles, highlighting the potential of green hydrogen for road transport while emphasizing the importance of hydrogen cost, vehicle capital cost, and supportive policy mechanisms [39]. This global interest stems from hydrogen’s numerous advantages, such as its high energy density, which enables longer driving ranges for heavy-duty and long-haul transport [40]. For instance, the heating value of hydrogen is 4, 2.8, and 2.4 times higher than that of coal, gasoline, and methane, respectively [41]. Also, GH2 offers fast refueling times comparable to conventional fuels [42]. Additionally, it overcomes weight constraints and limitations, which are key challenges for battery-powered transportation technologies [43]. Hydrogen fuel-cell technologies produce no tailpipe CO2 emissions during operation. Their net greenhouse-gas benefit, however, depends on the hydrogen-production and delivery pathway [44].
Hydrogen-fueled vehicles should be viable on both economic and technological grounds to compete with other vehicles [45]. To date, the leading and most popular vehicle technologies are Internal Combustion Engines (ICEs, also known as thermal engines) and Battery Electric Vehicles (BEVs). Meanwhile, Hybrid Electric Vehicles (HEVs), Plug-in Hybrid Electric Vehicles (PHEVs), and hydrogen Fuel Cell Electric Vehicles (FCEVs) are gaining traction recently [46]. In a study conducted across urban bus routes in Spain, Saudi Arabia, and India, Tripathi et al. [47] compared conventional diesel buses with Battery Electric Buses (BEBs) and Fuel Cell Electric Buses (FCEBs) using a life-cycle environmental and cost assessment for the years 2021, 2030, and 2050. The results showed that both BEBs and FCEBs involved high life-cycle cost impacts under current conditions, while the environmental performance of BEBs improved as the share of renewable electricity increased. The study further highlighted that the relative economic and environmental performance of diesel, battery-electric, and fuel-cell buses depends strongly on the regional availability and cost of clean electricity and hydrogen [47].
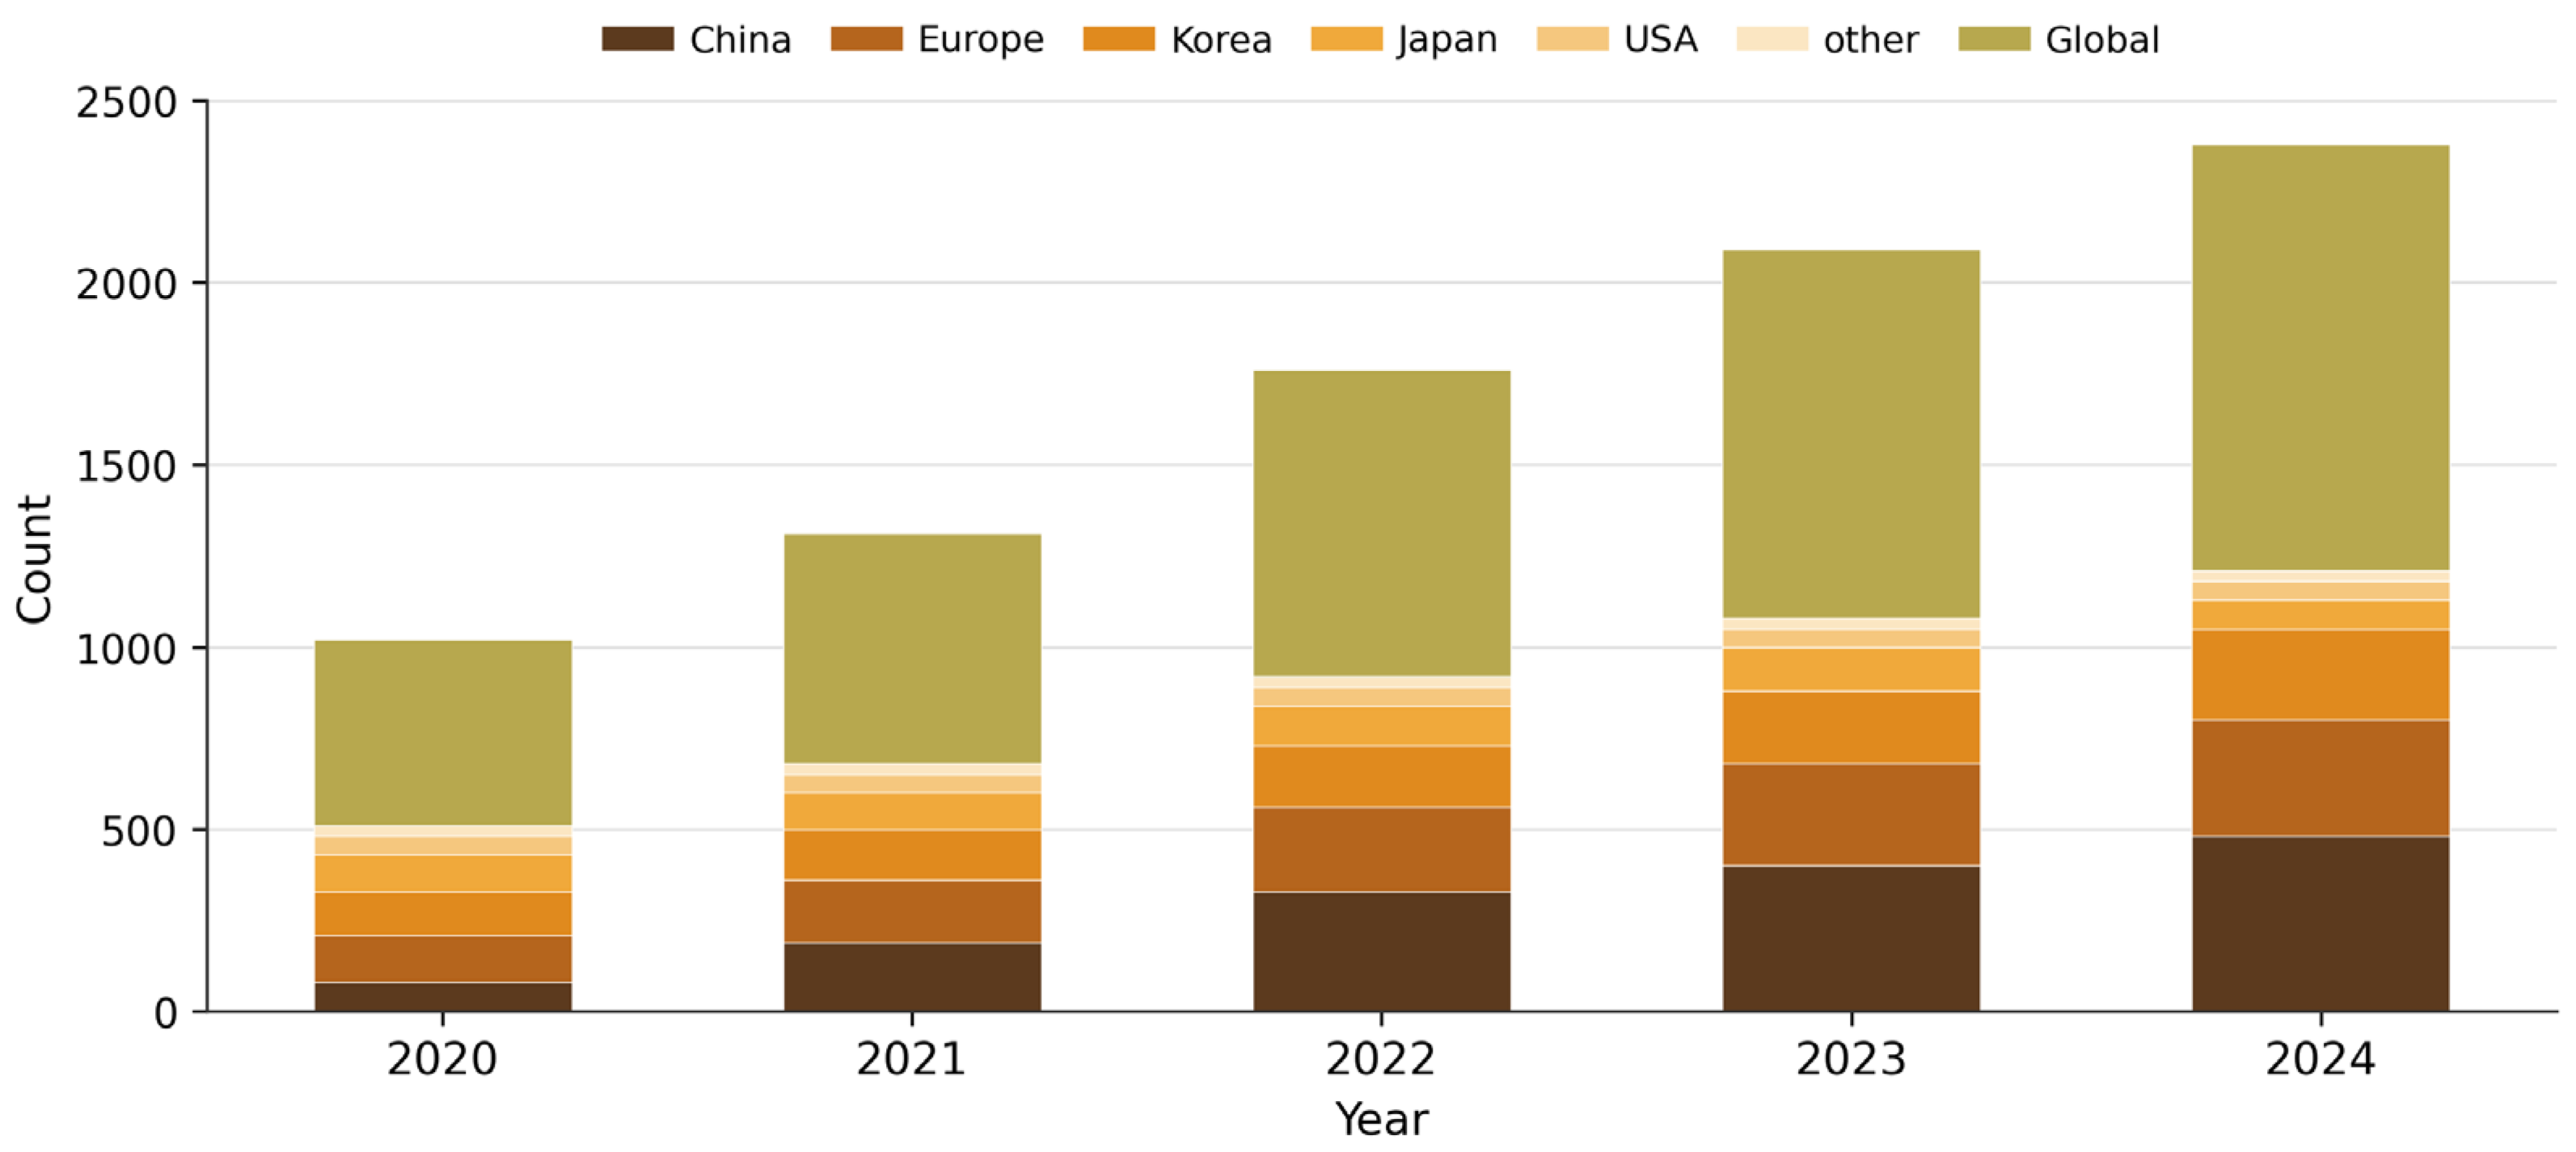
High costs and a lack of infrastructure are identified as the primary challenges for FCEVs. Higher vehicle and hydrogen-refueling infrastructure costs remain important barriers to large-scale FCEV deployment. Comparative studies generally find that FCEBs currently have higher total costs than BEBs under many operating conditions. However, the magnitude of this difference depends on the fleet size, route characteristics, charging or refueling configuration, vehicle price, hydrogen cost, and local energy conditions. Cost projections indicate that FCEB competitiveness could improve as vehicle and hydrogen costs decline and hydrogen infrastructure is deployed at scale [48,49,50]. As for now, there is still a shortage of hydrogen fueling stations. In 2019, Japan, Germany, and the United States had 100, 60, and 42 hydrogen refueling stations, respectively. Other countries remain significantly behind in developing such infrastructure [51]. Figure 1 illustrates the number of hydrogen refueling stations by region for the period 2020–2024, with around a 48% growth rate in China [52].
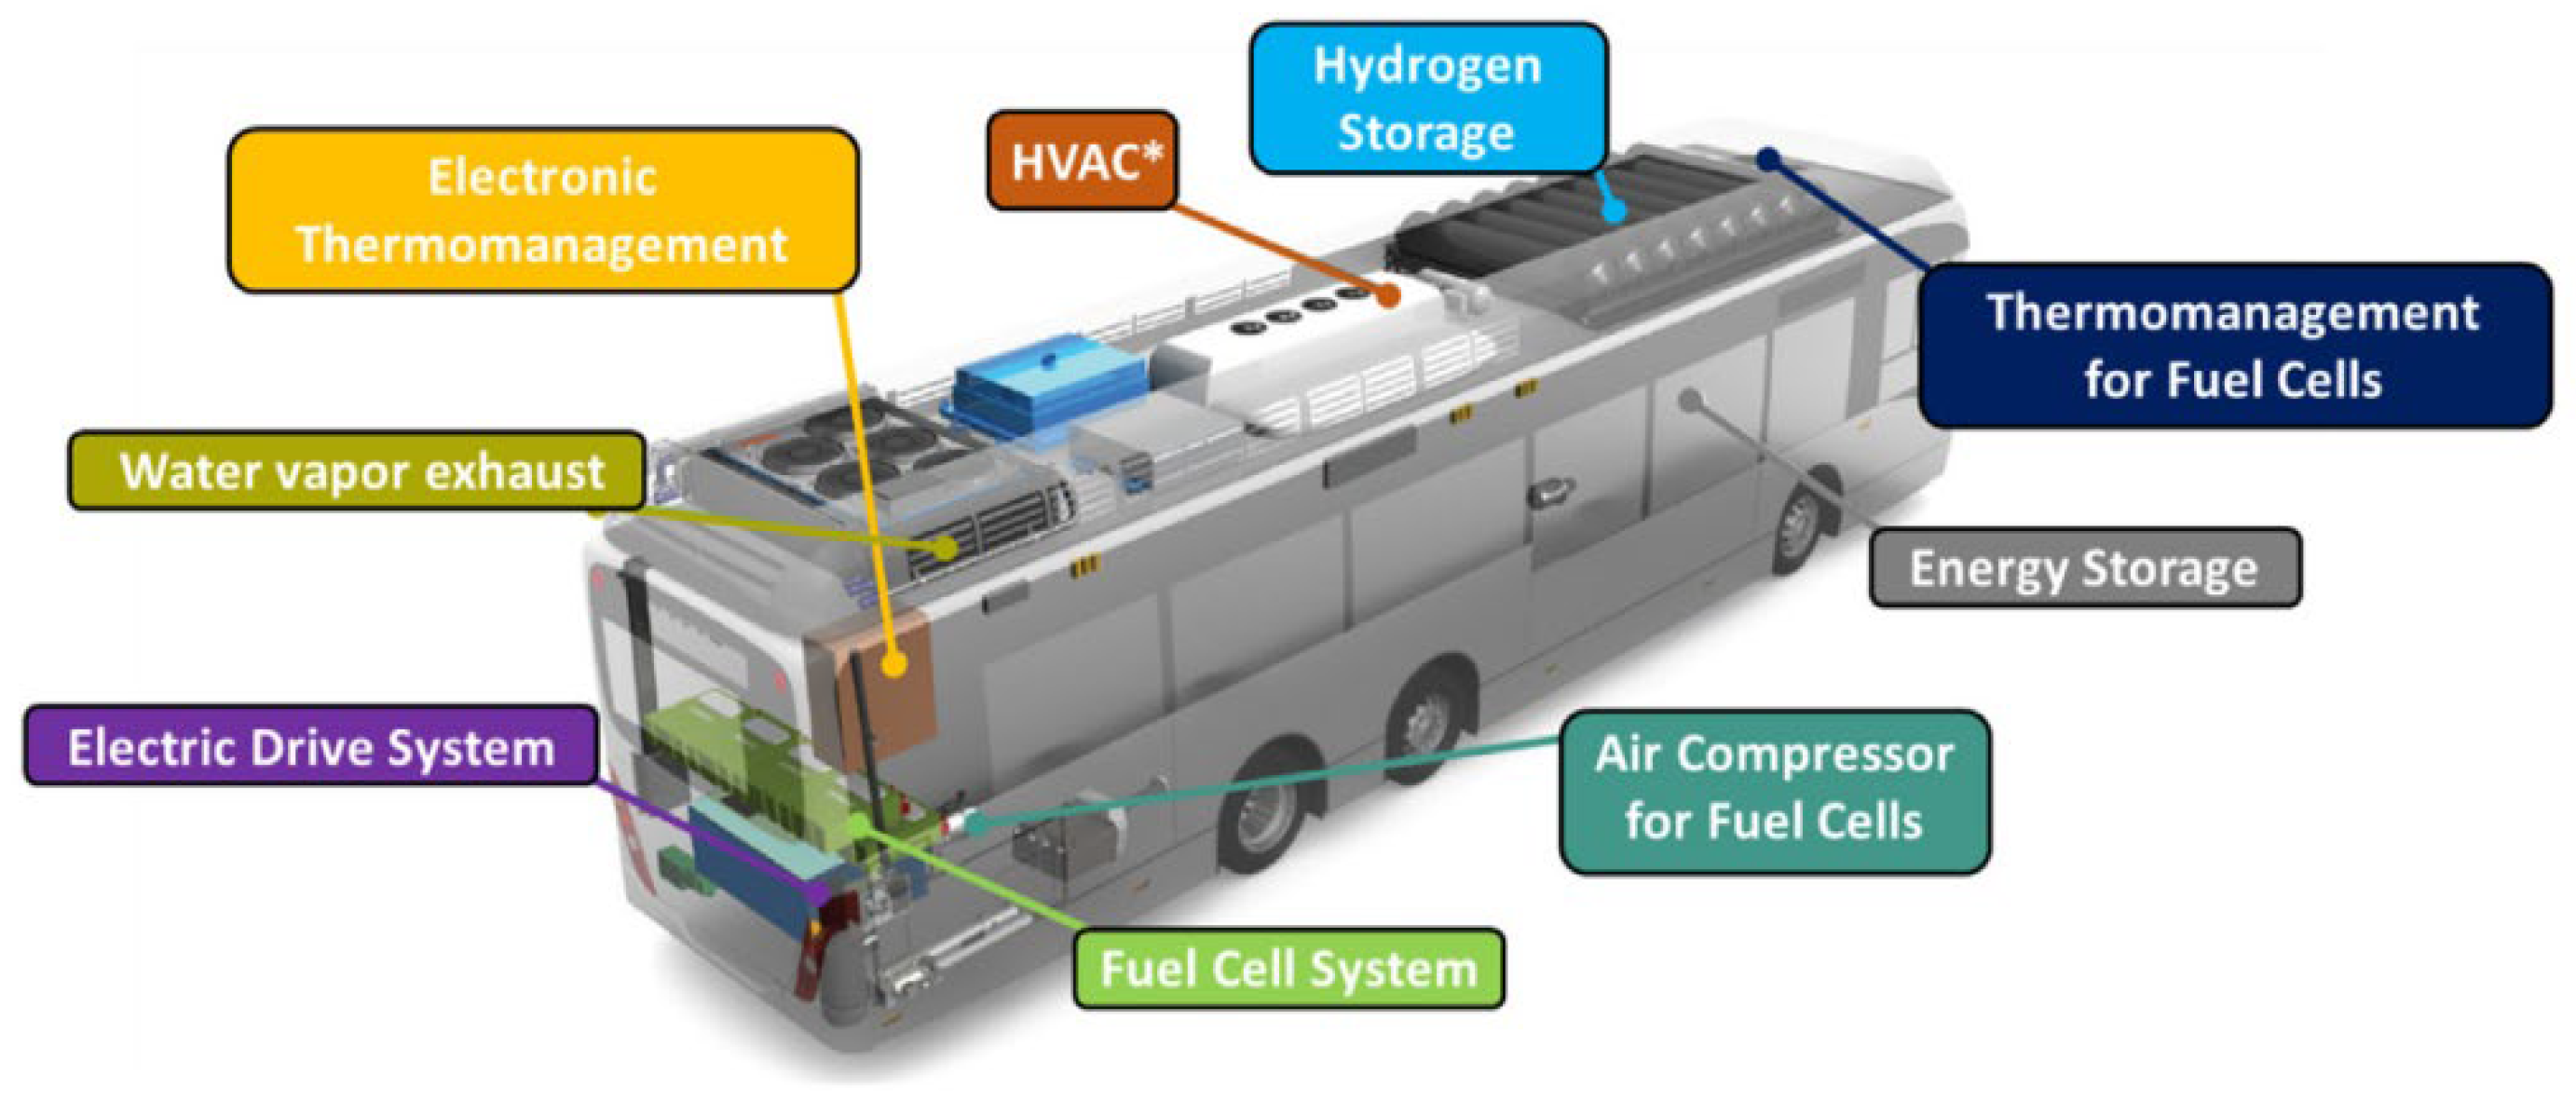
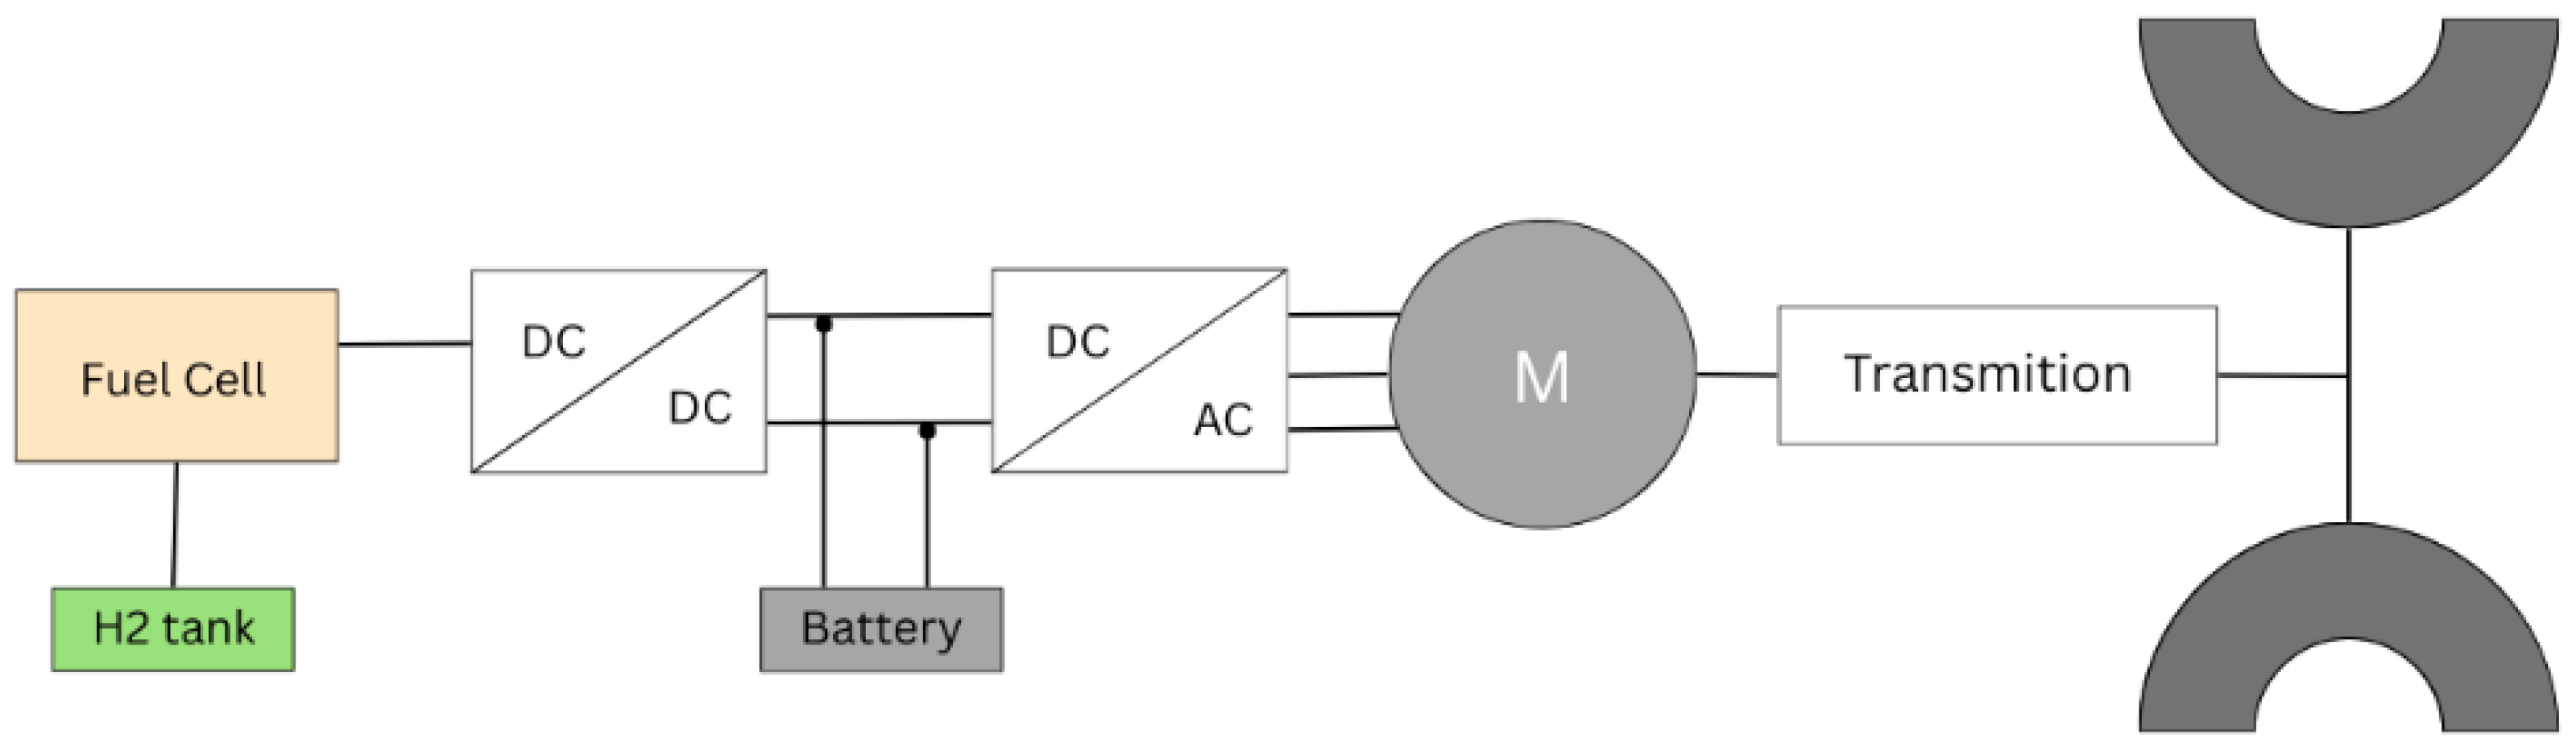
Numerous initiatives have been undertaken to use FCEVs in transportation networks, including cars, buses, and shipping trucks. This heavy-duty sector is essential, as it accounts for 25% of total overall energy use [53]. Regarding FCEB structure, the H2 tank is typically located at the top of the vehicle with an average capacity of around 40 kg of H2 at 350 bar, as depicted in the schematic diagram in Figure 2 [41]. It is used as a primary energy source and converts it into electricity through a fuel cell system to drive an electric motor [54]. The standard FCEB consists of a hydrogen storage tank, a fuel cell stack, energy storage (such as batteries for peak power and regenerative braking), air compression, thermal management systems, Heating Ventilation and Air Conditioning (HVAC), and water vapor exhaust. This design enables zero tailpipe CO2 emissions during operation; however, zero tailpipe emissions do not by themselves establish zero fuel-cycle greenhouse-gas emissions. In 2021, Europe had 150 operational FCEBs in duty and 87 in the United States [55,56]. On the other hand, 4 FCEBs in Cologne, Germany, operated an average of 250 to 300 km per day, while 13 FCEBs in California accumulated 52,102 h of operation. By the middle of 2020, South Korea operated 15 FCEBs and plans to fund the acquisition of 630 additional buses by the end of 2025 [56,57,58,59]. The configuration of FCEBs highlighted in this work is depicted in Figure 3 [60]. The system includes a series of hybrid designs in which hydrogen gas is stored in specific tanks and then delivered to a PEMFC that serves as the primary energy source. To meet transitory power needs, enable regenerative braking, and provide load leveling, the battery serves as an additional power source. As a result, it increases overall system efficiency and extends the fuel cell’s lifespan. Electric power is then transmitted to the electric motor (M) via a DC-to-AC inverter, followed by a mechanical gearbox that spins the wheels. This configuration ensures zero tailpipe emissions during operation and offers operational flexibility in urban BRT driving conditions.
Despite the immense potential of GH2 to support the decarbonization of the transportation sector, it still faces technological limitations. This includes higher costs compared to other types of fuels, limited mobile storage capacity, and complex infrastructure requirements [61,62]. Also, several obstacles must be addressed to effectively use GH2 as a replacement fuel in public transport, especially the development and implementation of infrastructure for the hydrogen value chain, as mentioned in recent literature [62]. It also examines consumer acceptance of FCEVs and their competitiveness as a sustainable fuel compared to other options on the market. The production, transportation, storage, and distribution of GH2 are included in the implementation of its infrastructure, which is a challenging task at this stage of the energy transition vision. The infrastructure can be developed based on the raw material type, production process, and energy requirements for transportation, storage, and refueling stations [63]. Regarding GH2 infrastructure development in Jordan, the latest study by the Ministry of Energy and Mineral Resources (MEMR) indicates significant infrastructure challenges and obstacles to advancing this sector. The country’s strategy relies on establishing a Common Use Infrastructure (CUI) in the Aqaba Special Economic Zone. These initiatives come in parallel collaboration with encompassing energy transmission grids, a water desalination plant, and the Aqaba port expansion, leading to positioning the country as a regional hub of GH2, hence attracting external investments and promoting the adoption of FCEVs in the transportation sector [64]. The safety considerations and precautionary measures should be highlighted when using FCEVs that utilize GH2 in public transport. However, comparing its safety with that of traditional fuels, such as diesel and gasoline, remains complex [65]. Research indicates that simulations of hydrogen leaks in vehicles show that the risk of explosion due to dispersion is minimal. Hence, it can be considered a safe fuel [66,67]. Additional studies demonstrate that hydrogen fuel poses no greater risk than standard fuels during car accidents or faults [68,69]. However, hydrogen fuel presents several safety challenges during storage and use, attributable to its low ignition energy and broad flammability range in air. Recently published studies are investigating the safety of hydrogen fuel for road transportation across vehicle types, since implementing safety measures is crucial to ensuring the reliability of hydrogen systems and protecting users [68,70]. These include the durability of hydrogen components, minimal ignition, flammability range, and leakage rates. The design of hydrogen systems and the assessment of associated dangers are equally challenging, presenting difficulties for high-pressure hydrogen storage, collisions, and flame propagation [71]. Mechanisms are being developed and investigated to identify potential malfunctions in hydrogen system components and to evaluate the consequences of these failures [72,73]. Thus, data collection is essential for formulating standards and regulations. Therefore, it is credible to say that these safety concerns are currently being addressed, which will facilitate the commercialization of FCEVs [74,75].

3. Jordan Transportation Sector

The transportation sector in Jordan is governed by the Ministry of Transport (MoT), established in 1965. The MoT launched a strategy plan for 2024–2028 to create a comprehensive, sustainable, and adaptable transport system that promotes Jordan as a regional transport center [76]. The Jordanian transportation sector contributes to the national GDP range from 5.2% to 5.9% from 2012 to 2018 [76]. Regarding the kingdom’s economic modernization vision, the MoT plan aims to enhance economic growth, improve the quality of life, develop transportation infrastructure, reduce traffic, particularly in the capital, Amman, and mitigate environmental impacts. Reducing reliance on private vehicles, promoting Electric Vehicles (EVs), whether BEVs or FCEVs, building rail connections, and promoting non-motorized transportation, such as walking and cycling, are essential to achieve these goals [77].
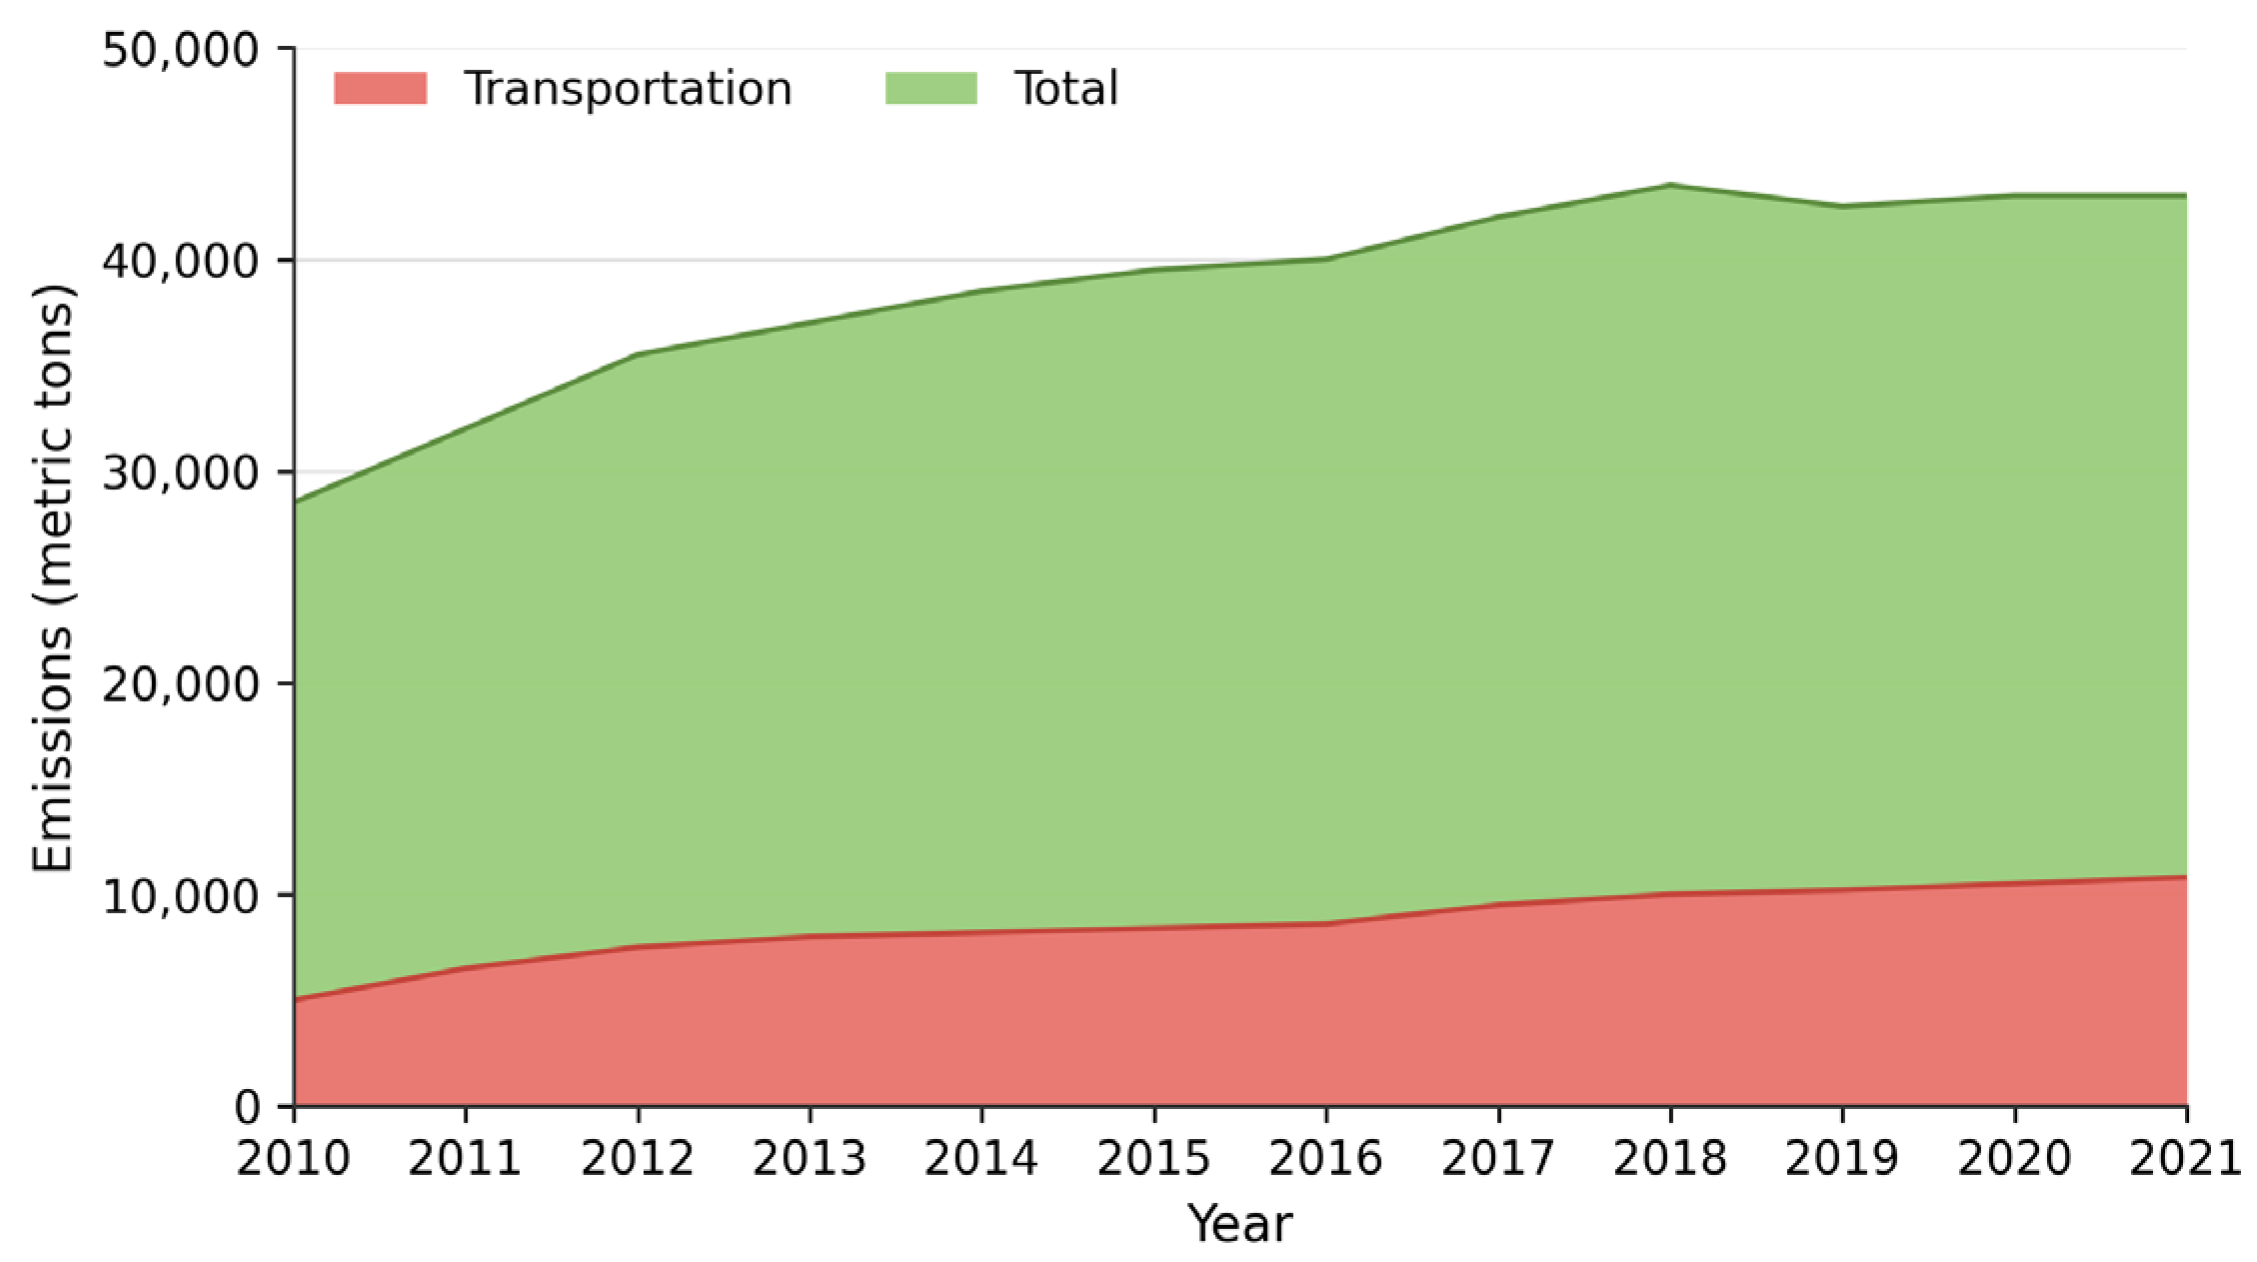
Jordan has become increasingly focused on environmental sustainability, aiming to reduce GHG emissions by 30% in 2030 [78]. The public transport sector in Jordan faces significant challenges. This includes low reliability and service quality, as well as substantial contributions to road traffic. These challenges result in an annual economic burden of over 300 million Jordanian Dinars (JD) for Jordan [76]. Since 2014, GHG emissions from the public transportation sector have increased significantly. As of 2021, the transportation sector accounted for 10.975 million metric tons (Mt) of carbon dioxide equivalent, or over 34% of the national total, as depicted in Figure 4, exceeding the global average of 25% [78]. According to the National GHG inventory study conducted by the Ministry of Environment (MoE), 96% of transport sector emissions are from road transport, due to the lack of functioning railways in the country. Meanwhile, small passenger cars account for around 55%, buses 23%, and shipping vehicles 18%. By comparison with global metrics, road passenger vehicles account for 45% of GHGs, road freight vehicles for 29%, aviation for about 12%, shipping for 11%, and rail for the remaining 3% [79]. Since most of Jordan’s transport emissions come from road vehicles, which account for about 96% of all transport emissions, this is the area where most efforts will need to be made to reach the emissions reduction target and support Jordan’s national strategy for a greener future.
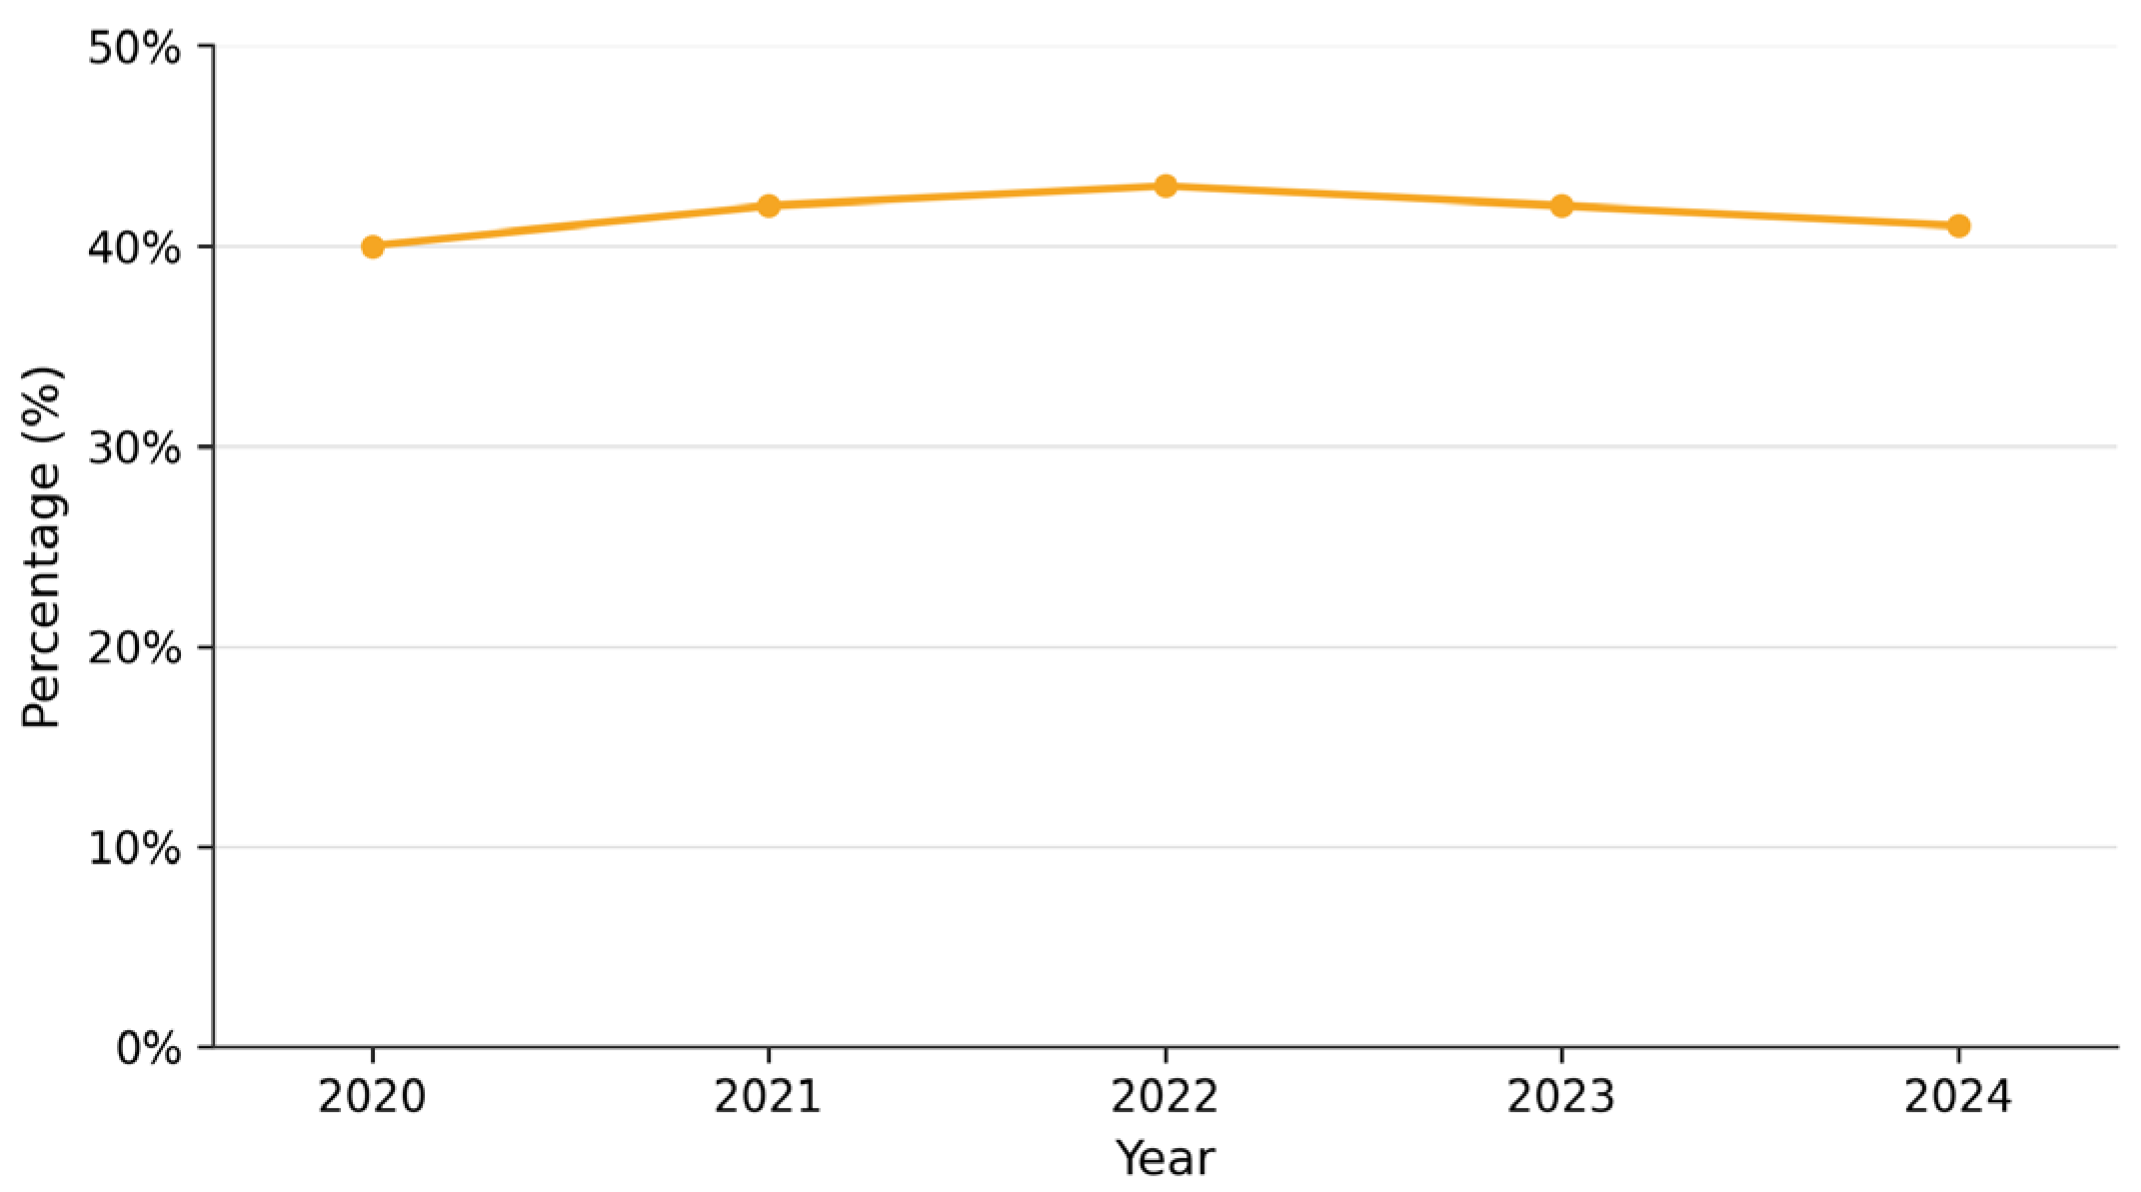
A sectoral distribution of energy consumption from the total energy demand is conducted by MEMR. In 2024, the transport sector accounted for 42% of total final energy demand, as shown in Figure 5 [80]. It is important to note that energy intensity in Jordan’s transport sector is considered high, with 0.06 kg of fuel per km for each person and 0.03 kg/km/ton for goods [80]. The specific load of small vehicles in Jordan is 1.3 passengers/vehicle, which is considered low due to the lack of an efficient public transport system within cities. This high intensity indicates low energy efficiency when compared to international benchmarks. According to the International Energy Agency (IEA), energy intensity in the transport sectors of many EU countries is lower, where the share of final energy consumption is around 30–32% [81]. Thus, the establishment of new projects such as the BRT between Amman and Zarqa governorates, which began operating in 2024, and the increase in demand for hybrid and electric cars will certainly improve the value of the above indicators, in addition to reducing energy consumption in the transport sector, thereby reducing carbon emissions [82].
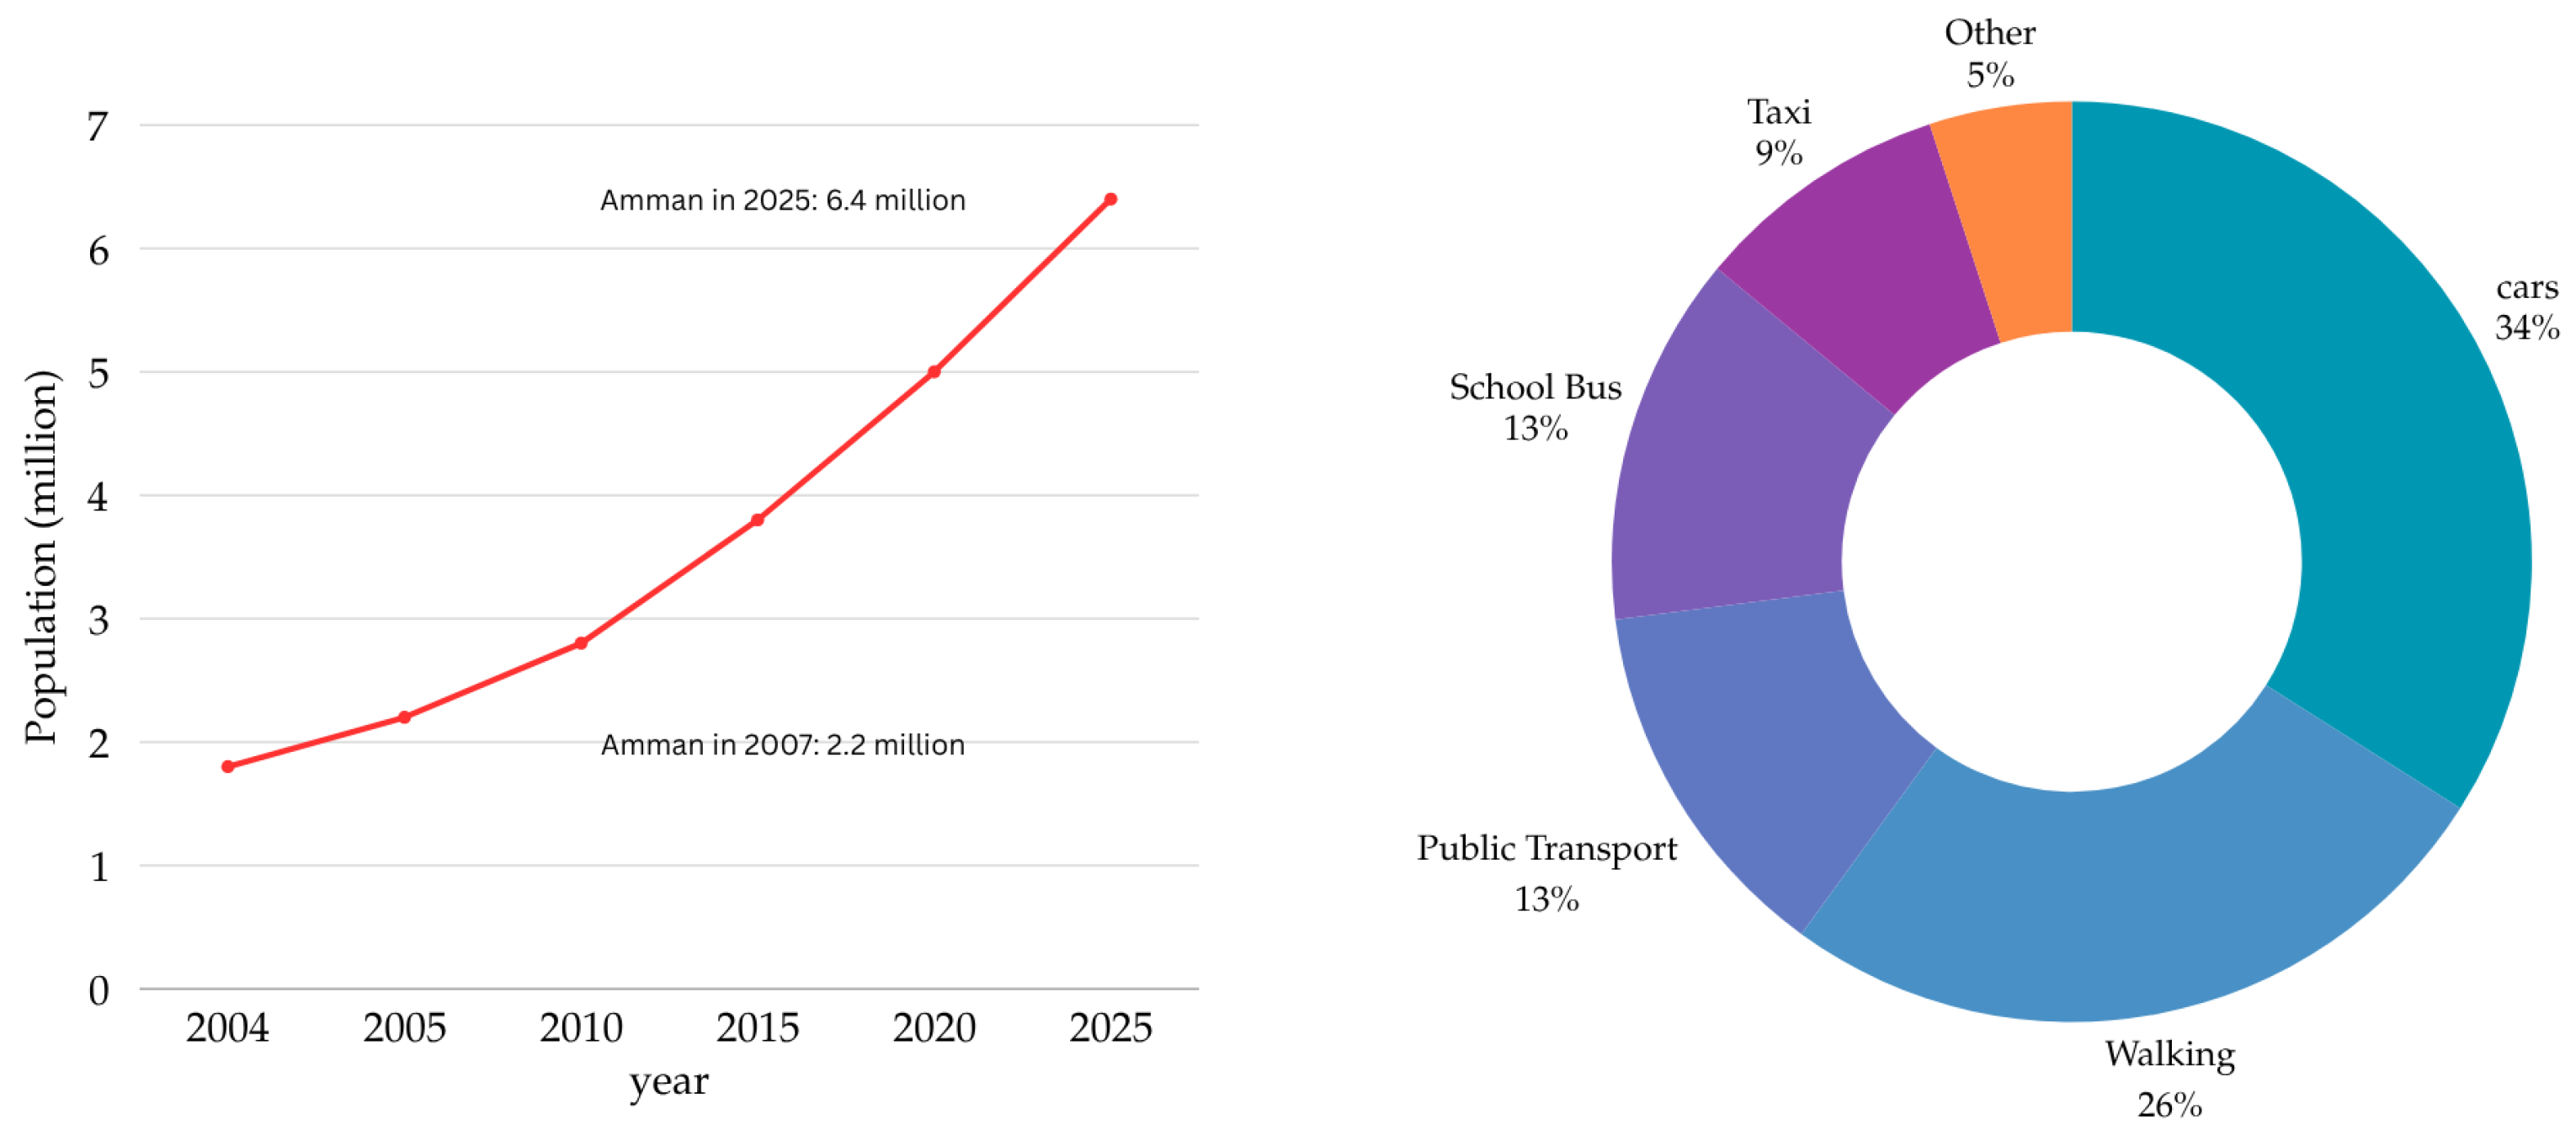
The capital city of Amman has witnessed rapid growth over the past decade, reflected by the population growth, new built-up areas, and the concentration of most headquarters there. This growth has been accompanied by increased traffic in the city, as evidenced by rising vehicle numbers, traffic volumes, and public transport users, which has negatively affected citizens’ ability to move around smoothly. Moreover, the costs and adverse effects of traffic jams have become a common phenomenon on the streets of Amman. Analytical studies conducted by the Greater Amman Municipality (GAM) indicate that the average number of daily trips in Amman is approximately 2 per person, placing heavy pressure on the roads. According to Figure 6, public transport services in Amman governorate account for a modest share of total daily trips. It is about 13%, divided between buses (5%) and mini buses (8%) [82]. In contrast, private vehicles account for the largest share of citizens’ daily travel, at 34%, with an annual increase of 8–10% [82]. This increasing reliance on private cars is the result of inefficient public transport services, which in turn has led to citizens’ reluctance to use them and a decline in operators’ revenues. This situation has had a negative impact on the financial burdens of citizens, especially middle-income families, as transportation costs, including the purchase and operation of vehicles and fuel, have risen, with citizens spending about 25% of their monthly income to cover these costs.

4. Regional Energy Crisis and Implications for Jordan’s Energy Security

The recent escalation of regional geopolitical tensions in the Middle East between the United States and Iran along Strait of Hormuz conflicts has triggered severe disruptions across regional energy markets. The direct consequences for the net energy-importing economies are illustrated in Table 1 [83]. Jordan, which depends on imports for over 90% of its primary energy supply, has been exposed to sharp cost shocks throughout this period [80]. According to a recent statement from MEMR, the import price of liquefied natural gas (LNG) increased from approximately $7 per million British thermal unit (MMBtu) before the crisis to nearly $28/MMBtu, which is exceeding 400% [83]. MEMR also indicated that the national treasury is absorbing an additional daily financial burden of 2.5 to 3 million Jordanian Dinars (JD), equivalent to roughly 1.3 to 1.5 billion USD on an annual basis [83]. As an operational response, fuel oil has been redeployed at the Aqaba thermal power plant and diesel fuel has been drawn upon to cover peak electricity demand.
The implication of this disruption is particularly critical for the transportation sector, which remains almost entirely dependent on imported diesel and gasoline. Three transmission channels can be identified through which the regional crisis propagates into transport operations. First, rising international diesel prices translate into higher operating costs for the public transport sector, including the BRT system examined in this study. Second, the displacement of LNG by diesel in domestic power generation increases the overall electricity cost accordingly. Third, a strategic exposure effect persists as long as decarbonization pathways rely on imported fuel. These three channels operate at the same time and explain why fuel price stability cannot be assumed in any credible techno-economic assessment of Jordan’s transport transition. Domestically produced GH2 could reduce exposure to imported transport-fuel markets, subject to the cost, reliability, electricity source, and infrastructure requirements of the hydrogen-supply pathway. From a methodological standpoint, a constant diesel-price assumption alone is insufficient for examining the fuel-cost implications of Jordan’s transport transition. Section 7 therefore applies a constant-price reference together with annual diesel-price escalation sensitivities of 2%, 4%, and 6%. The 4% case is treated as the central geopolitical-stress sensitivity, while the 2% and 6% cases provide lower and higher deterministic bounds. These cases are not forecasts of future diesel prices and do not simulate short-term geopolitical shocks or monthly price volatility.

5. Methodology

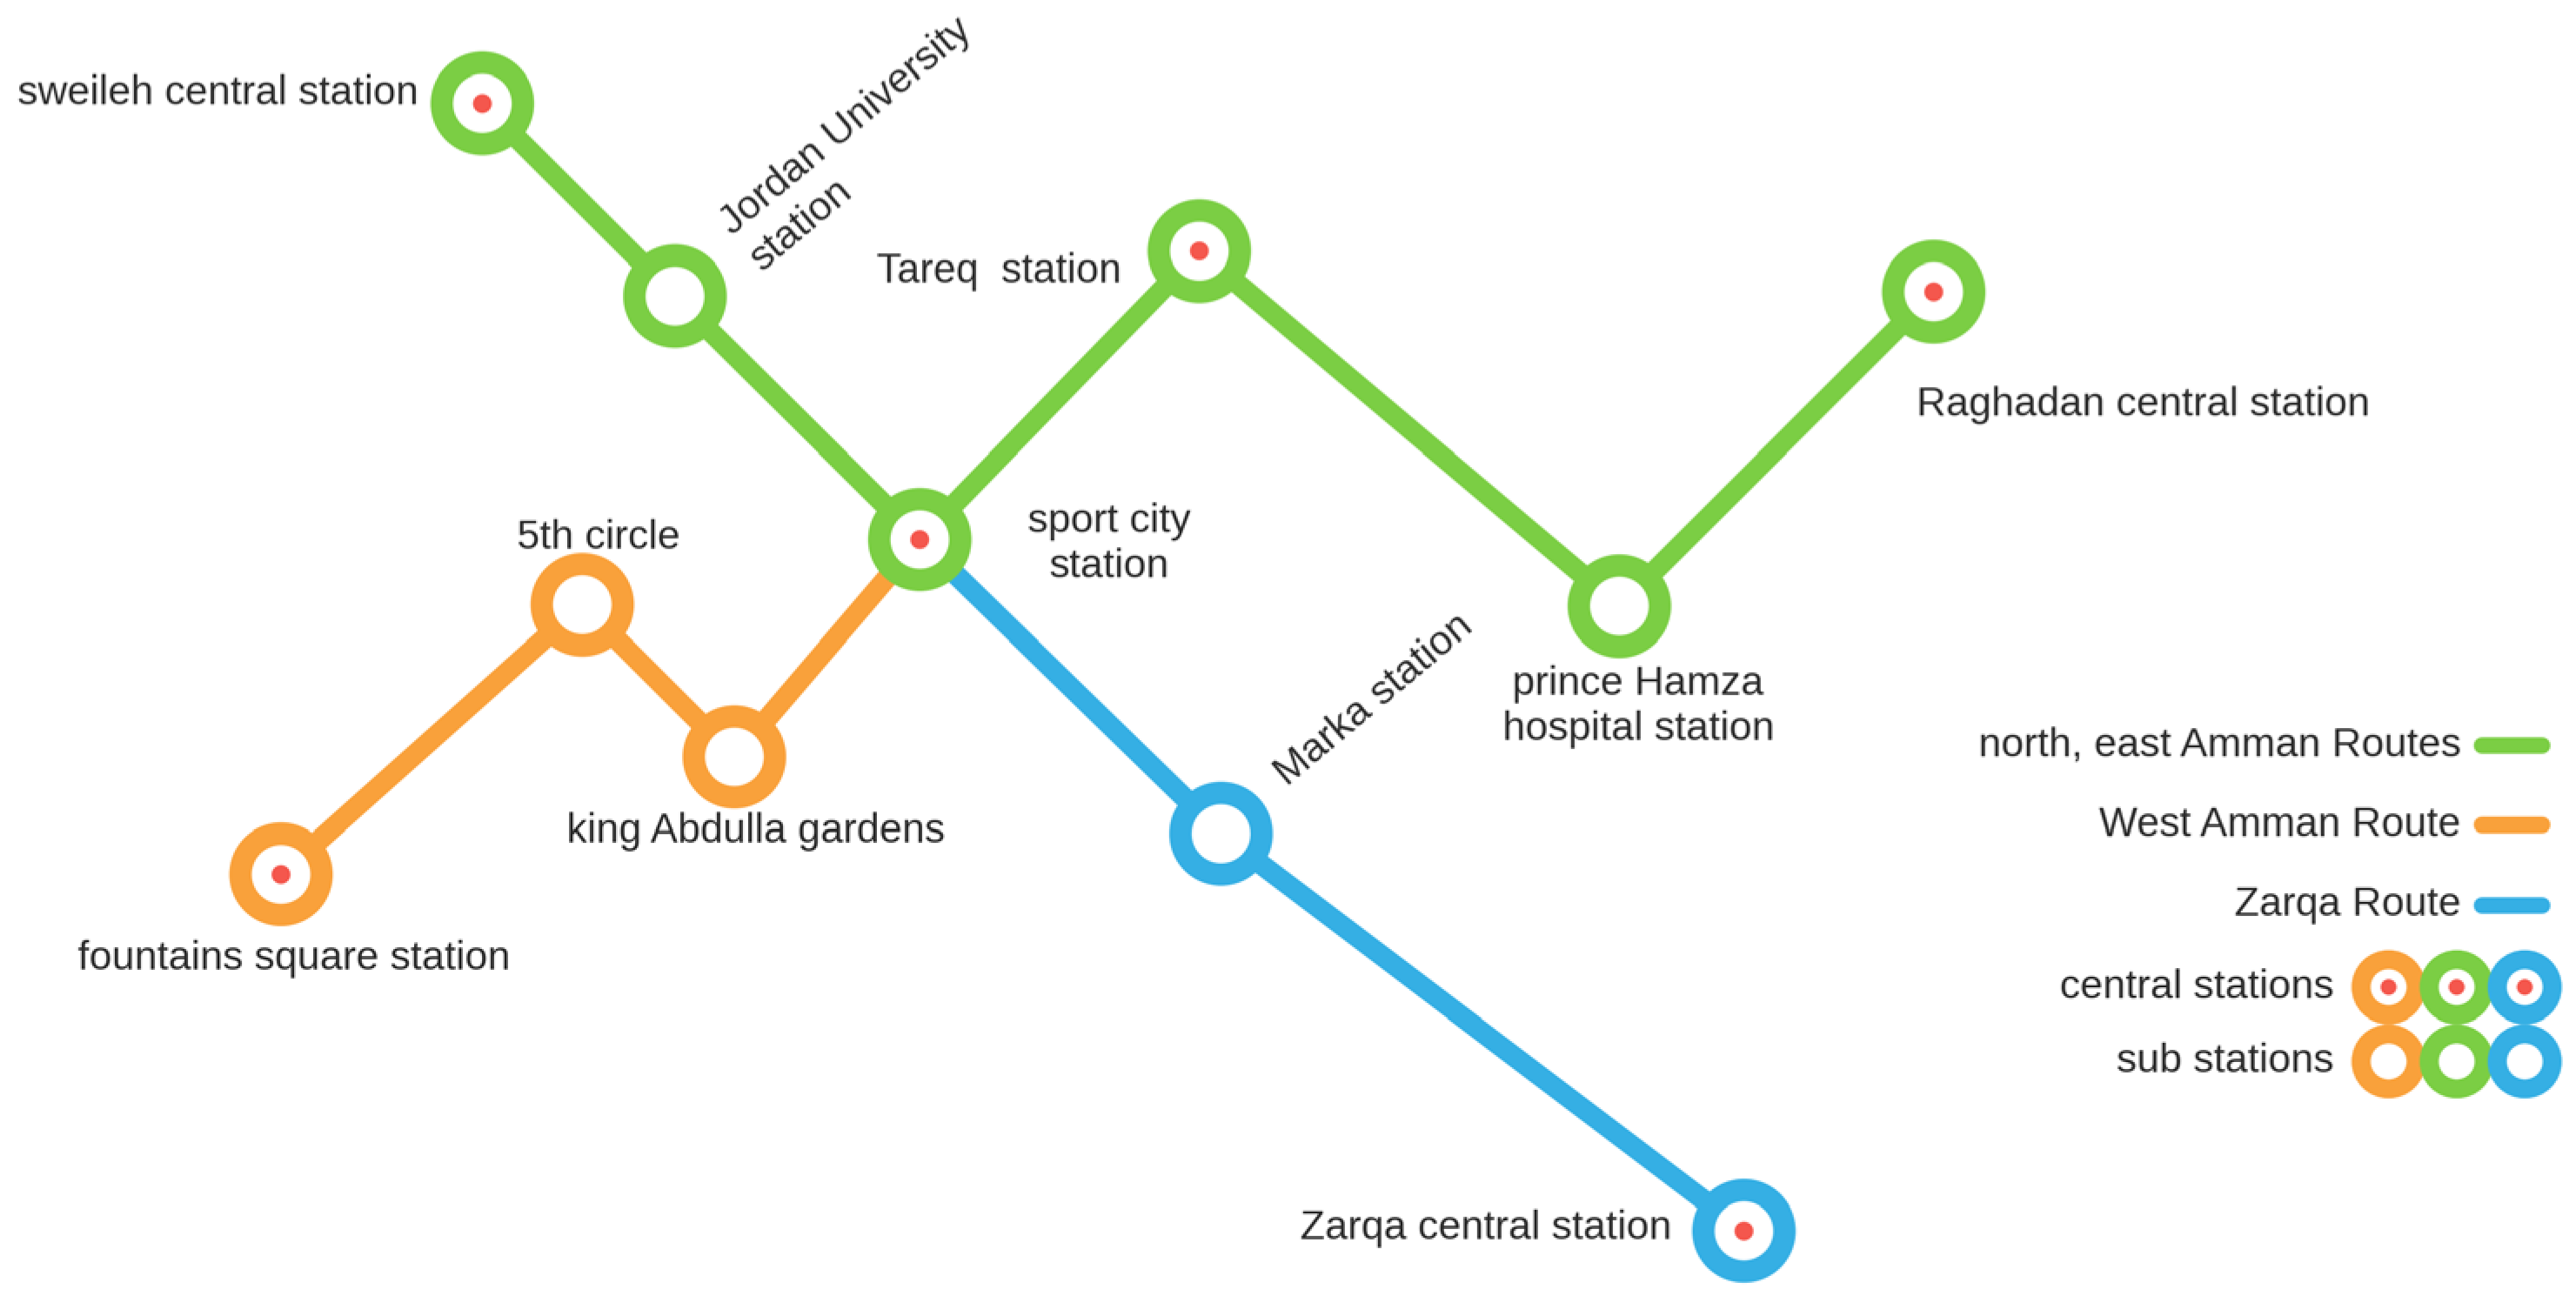
This study employs a case-study-based, quantitative, and scenario-driven methodology to assess the operational implications of integrating hydrogen FCEBs into the current BRT system between Amman and Zarqa governorates, as depicted in Figure 7, which serves approximately 60,000 passengers daily [82]. The analysis quantifies the hydrogen demand, operational fuel costs, and avoided diesel tailpipe CO2 emissions across selected FCEB fleet-penetration scenarios using hydrogen- and diesel-price assumptions. The study data were collected from the GAM. The analysis is not designed as a comparative technology-selection exercise between FCEBs, BEBs, and other propulsion technologies. FCEBs are treated as the selected intervention, and the assessed scenarios compare their phased integration with the existing diesel BRT baseline.
The Amman-Zarqa route was selected because of its high passenger demand and centralized fleet management. The route is 32 km long and links Swaileh Station in Amman with Zarqa Central Station. The BRT operates daily in both directions from 6:00 AM to 12:00 AM, except on Fridays, when it operates from 8:00 AM to 12:00 AM. The current BRT fleet consists of 64 diesel buses. The diesel-bus fleet uses King Long XMQ6127 buses, each with a 300 L fuel-tank capacity, operating under predetermined time slots [84].
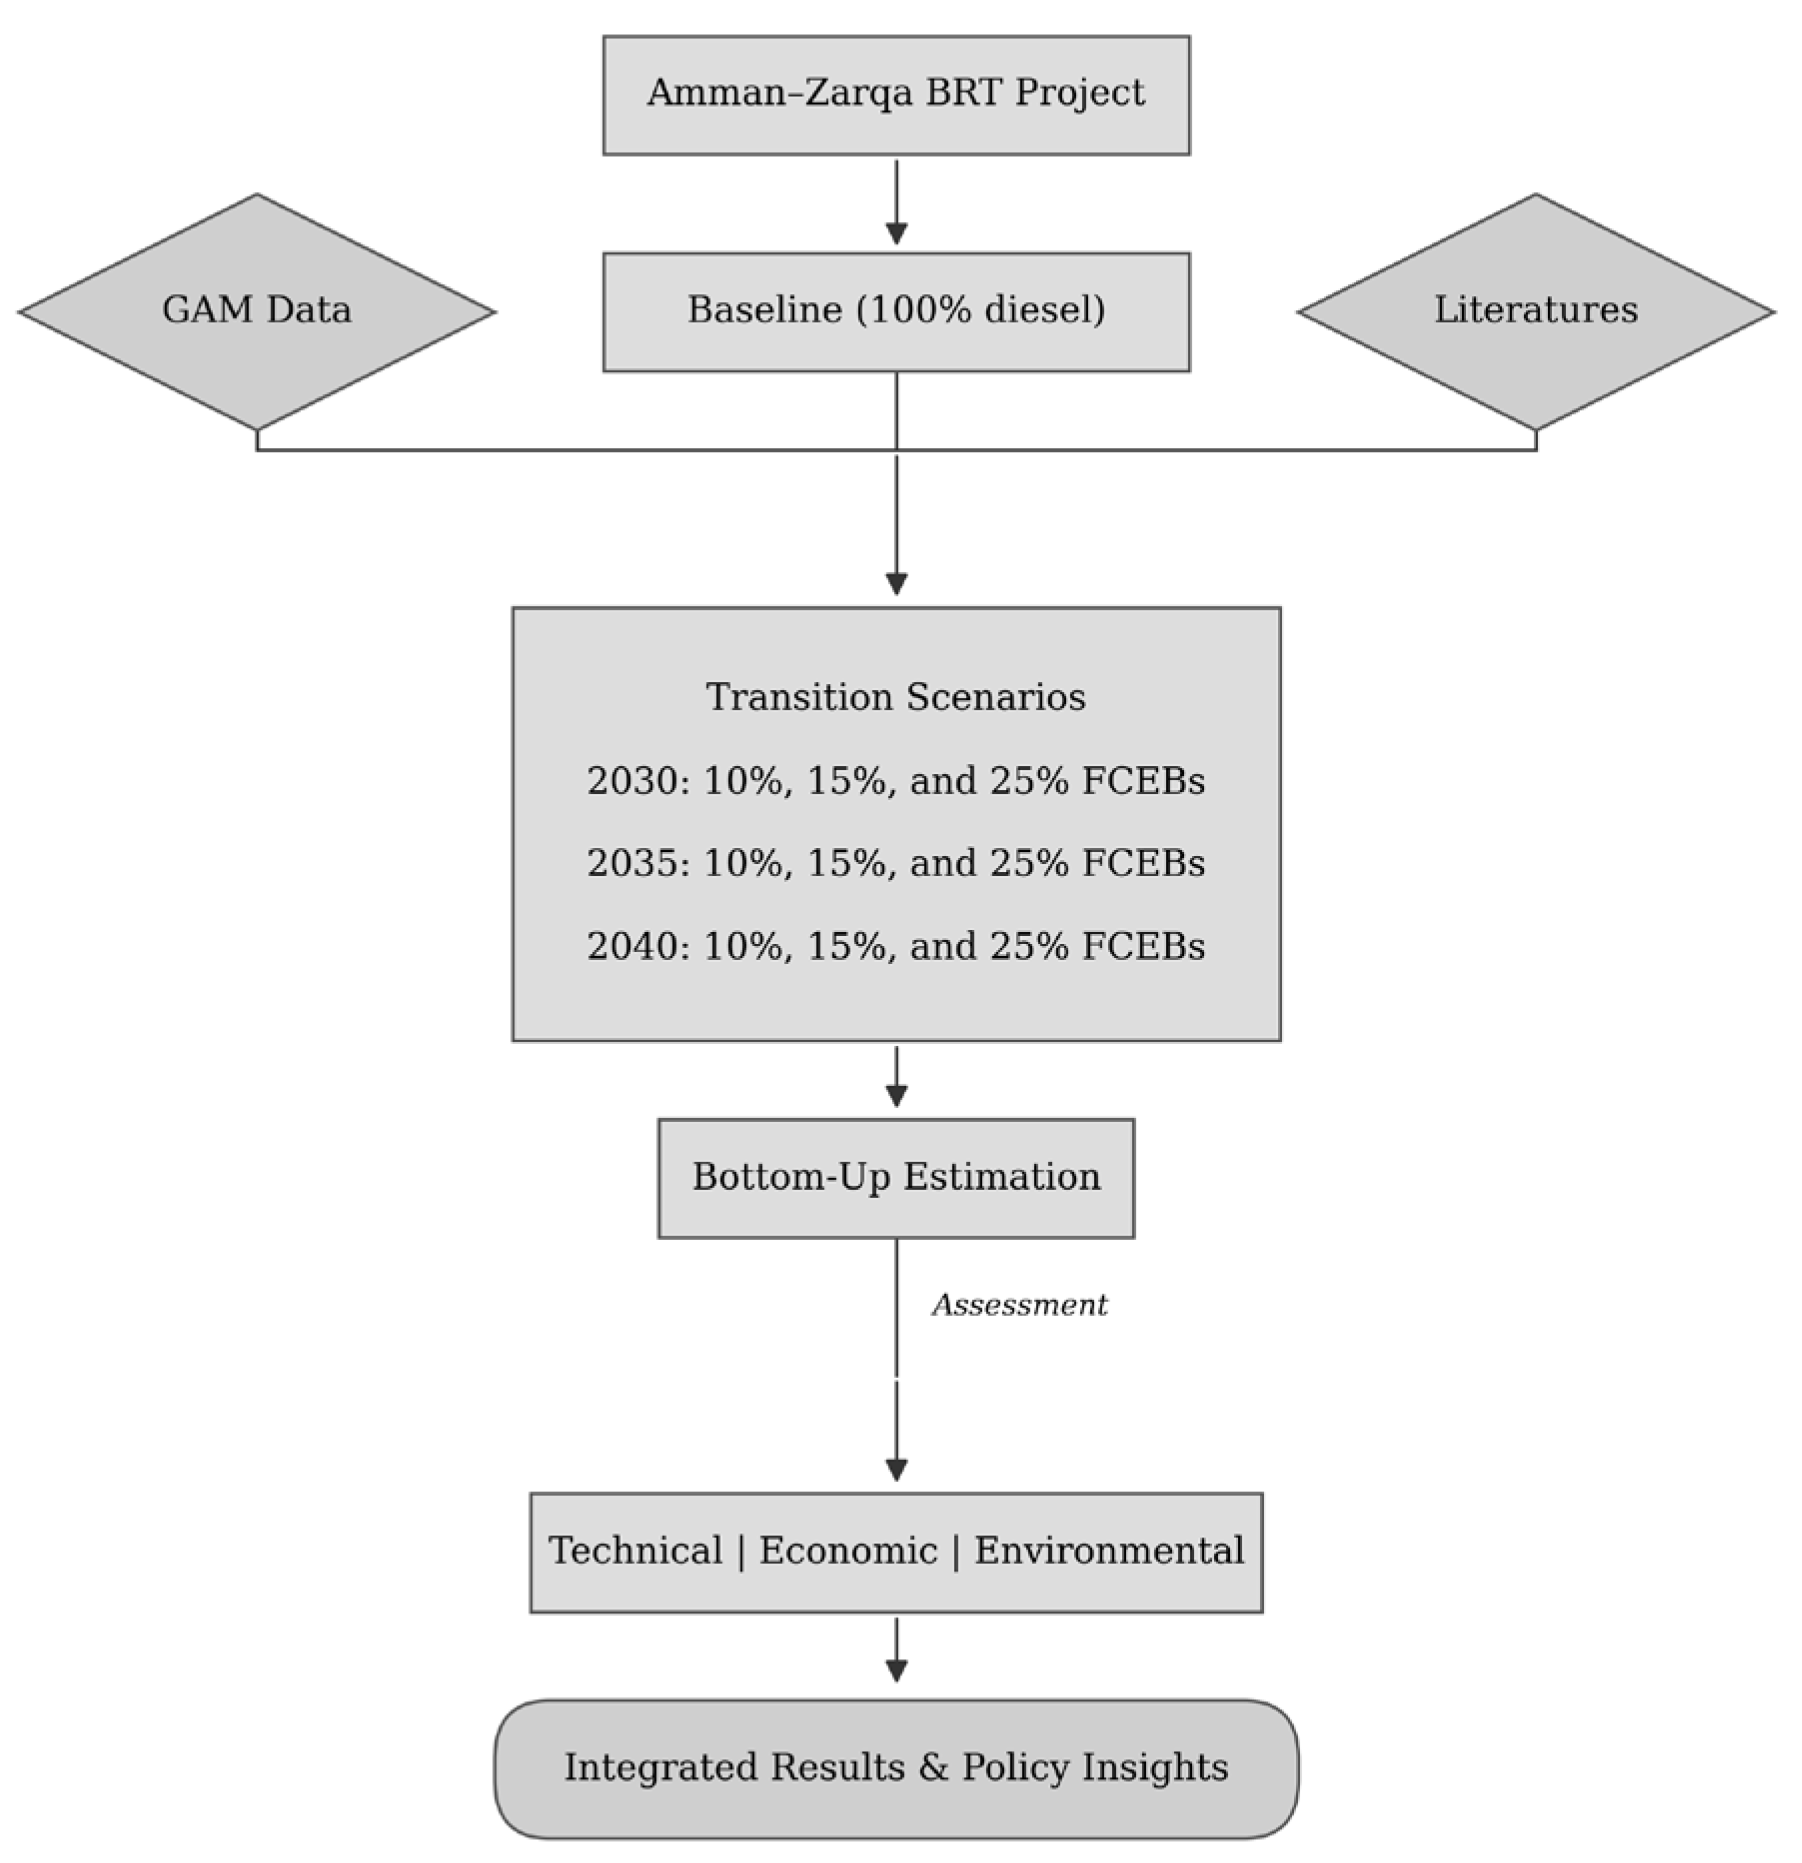
The conducted methodology used in the study reflects the existing diesel-powered BRT system. Figure 8 summarize the methodology approach. The GAM operational data have been collected to define essential operational parameters. It includes the fleet size, route length, and daily service configuration. The parameters are integrated with conventional fuel consumption and emissions factors to estimate daily diesel consumption and carbon dioxide. The baseline system is the reference for all future comparisons. The study presents a series of fleet-transition scenarios that use FCEBs along current diesel buses rather than replacing the entire fleet. This mixed-fleet strategy indicates a practical limitation in the total capital investment and infrastructure implementation. Three fleet-integration ratios (10%, 15%, and 25%) are considered for each year (2030, 2035, and 2040). These penetration levels are selected to represent realistic and progressive adoption pathways under techno-economic and policy constraints. Ten percent reflects an initial deployment phase. It aligns with early market entry and pilot-scale implementation with considering infrastructure readiness limitations. The second scenario, with a ratio of 15%, represents a moderate transition stage in which technological improvements are assumed, along with a drop in costs and infrastructure development. Consequently, the third scenario with a ratio of 25% acts as optimistic scenario in which an advanced adoption level is assumed. These scenarios enable a structured assessment of gradual fleet decarbonization and accounting for technical maturity, market readiness, and policy support in the Jordanian context. The selected penetration levels are treated as reference planning milestones rather than a prescribed deployment schedule. In practice, FCEB adoption may follow non-regular pathways, including delayed deployment, while the hydrogen supply and depot infrastructure are established, or accelerated deployment if technology performance improves and hydrogen costs decline. For planning purposes, the total BRT fleet is assumed to increase by one bus per year. This is an illustrative reference assumption rather than a forecast of future passenger demand or fleet expansion. Within each reference penetration scenario, each FCEB is assumed to replace an equivalent amount of diesel-bus service in terms of annual vehicle-kilometers. Accordingly, the reference results assume equal assigned duty-cycle distance and full planned service delivery for the FCEBs and the diesel buses that they replace. Under these reference conditions, hydrogen demand and avoided diesel tailpipe CO2 emissions vary with the equivalent diesel service displaced, rather than with the nominal FCEB fleet share alone. Traffic conditions, seasonal demand, route optimization, passenger loading, HVAC demand, and changes in service frequency are not dynamically modeled. Their potential effects are examined through the operational sensitivity cases described in Section 7.3.
Hydrogen demand is estimated using an incremental operational approach based on FCEB vehicle-kilometers and a reference hydrogen-consumption rate. In the reference scenarios, each FCEB is assigned the same daily distance as the diesel-bus service it replaces, and hydrogen consumption is calculated using a reference rate of 0.09 kgH2/km. Total daily hydrogen demand is calculated by multiplying the per-bus hydrogen demand by the number of FCEBs operating on the corridor. A depot-based hydrogen refueling method has been suggested due to the presence of a fixed depot and clear structure. Depot-based overnight refueling is considered as a preliminary operational assumption because the corridor has centralized fleet management. Its feasibility depends on station storage, compression, dispensing capacity, refueling throughput, available depot time windows, and supply reliability. No depot engineering design, storage-sizing calculation, compressor-sizing calculation, dispenser-throughput calculation, or refueling schedule is developed in the present study. The comparative assessment of diesel and FCEBs is performed across the following areas: operational functionality (evaluating hydrogen’s demand), economic aspects (fuel costs), and environmental impact (calculating the reduction in carbon emissions resulting from a partial fleet replacement, assuming zero operational tailpipe emissions for FCEBs). The analysis relies on deterministic bottom-up calculations as follows:

5.1. Operational Distance

5.1.1. The Annual Distance Traveled by a Single Bus Is Calculated as

D b u s , y e a r = D b u s , d a y × N d a y s
where D b u s , y e a r is the annual distance traveled by a single bus on an annual basis in kilometers per year (km/year), D b u s , d a y   is the distance traveled by each bus daily in kilometers per day (km/day), and N d a y s   is the number of operational days for the buses’ fleet.

5.1.2. The Total Annual Distance Traveled by the BRT Fleet Is

D f l e e t , y e a r = D b u s , y e a r     × N b u s e s
where D f l e e t , y e a r is the annual distance collectively traveled by the buses’ fleet in kilometers per year (km/year) and N b u s e s is the number of buses within the fleet.

5.2. Baseline Diesel Consumption

5.2.1. The Average Diesel Consumption per Kilometer Is Calculated as

F d i e s e l = F b u s ,   d a y     D b u s , d a y    
where F d i e s e l   is the average diesel consumption for each bus in liters per kilometer (L/km) and F b u s ,   d a y   is the diesel consumed by each bus in a single bus day (L/day).

5.2.2. The Total Annual Diesel Consumption of the Fleet in the Baseline Scenario Is Given by

F f l e e t , y e a r = F b u s ,   d a y × N b u s e s × N d a y s
where F f l e e t , y e a r   is the annual diesel consumption of the fleet in the baseline scenario in liters per year (L/year).

5.3. Baseline Diesel Tailpipe CO2 Emissions

5.3.1. The Direct-Combustion Diesel Tailpipe Emission Factor Is Derived from the Operational Data as

E F d i e s e l = E b u s ,   d a y     F b u s ,   d a y    
where E F d i e s e l is the diesel emission factor in kilograms of CO2 per liter (kgCO2/L) and E b u s , d a y represents the emissions resulting from each bus per day in kilograms of CO2 per day (kgCO2/day).

5.3.2. The Total Annual Diesel Tailpipe CO2 Emissions in the Baseline Scenario Are Calculated as Follows:

E f l e e t , y e a r , b a s e l i n e   = F f l e e t , y e a r × E F d i e s e l    
where E f l e e t , y e a r , b a s e l i n e   is the total emissions resulting from the entire fleet on an annual basis (kgCO2/year).

5.3.3. The Total Annual Diesel Tailpipe CO2 Emissions in the Transition Scenarios Are Calculated as

E f l e e t , y e a r , s c e n a r i o = ( 1 p ) × E f l e e t , y e a r , b a s e l i n e    
where E f l e e t , y e a r , s c e n a r i o     represents the total emissions resulting from the entire fleet annually under different penetration scenarios (kgCO2/year) and p   represents the FCEB penetration ratio (%).

5.4. Fleet Transition Scenarios

5.4.1. The Number of FCEBs Introduced in Each Scenario Is Calculated as

N F C E B s = p × N b u s e s
where N F C E B s is the number of FCEBs introduced in each scenario.

5.4.2. The Remaining Number of Diesel Buses Is Calculated as

N d i e s e l = N b u s e s N F C E B s  
where N d i e s e l is the number of diesel buses not to be substituted with FCEBs.

5.5. Hydrogen Consumption Rate

5.5.1. The Daily Hydrogen Consumption per FCEB Is Calculated as

H 2 , b u s , d a y = D b u s , d a y × H 2   r a t e
where H 2 ,   b u s , d a y is hydrogen’s consumption per FCEB on a daily basis in kilograms per day (kgH2/day) and H 2   r a t e is the rate of hydrogen’s consumption (kgH2/km).

5.5.2. The Total Daily Hydrogen Demand for the Fleet Is Calculated as

H 2 , f l e e t , d a y = H 2 , b u s , d a y × N F C E B s  
where H 2 ,   f l e e t , d a y is hydrogen’s consumption for all FCEBs on a daily basis (kgH2/day).

5.5.3. The Annual Hydrogen Demand Is Then Calculated as

H 2 , f l e e t , y e a r = H 2 , f l e e t , d a y     × N d a y s    
where H 2 ,   f l e e t , y e a r is hydrogen’s consumption for all FCEBs annually (kgH2/year).

5.5.4. Operational Utilization and Sensitivity Assumptions

The reference scenarios assume that each FCEB delivers the same annual vehicle-kilometers as the diesel-bus service it replaces. To examine partial route allocation, varying duty cycles, seasonal service changes, and differences in service availability, an operational-utilization factor, U , is introduced. The factor represents the ratio between the annual vehicle-kilometers delivered by an FCEB and the annual vehicle-kilometers of the equivalent diesel-bus service in the reference case.
A value of U = 1.00 represents equivalent full-duty replacement. Values below 1.00 represent partial route or duty-cycle allocation, lower service intensity, or reduced service availability. Values below U = 1.00 may also represent reduced FCEB availability caused by maintenance downtime, fuel-cell degradation, or stack replacement; these mechanisms are not modeled separately. Values above 1.00 represent an increased annual operating distance relative to the reference case. The operational sensitivity analysis applies alternative values of U while retaining the same fleet-penetration milestones.
Hydrogen demand is affected by both the operational-utilization factor and the hydrogen-consumption rate. Avoided diesel tailpipe CO2 emissions are affected by the equivalent diesel service displaced. Therefore, proportionality among the FCEB share, hydrogen demand, and avoided diesel tailpipe CO2 emissions applies only under the reference condition of U = 1.00 and a fixed hydrogen-consumption rate.
L F C E B , s a d j = U s × L F C E B , s r e f
where L F C E B , s a d j is the adjusted annual FCEB service distance for sensitivity case s , L F C E B , s r e f is the annual FCEB service distance in the reference case, and U s is the operational-utilization factor. The adjusted service distance is used in Equation (13) to calculate hydrogen demand under each operational sensitivity case.

5.6. Avoided Diesel Tailpipe CO2 Emission Reduction

5.6.1. The Total Annual Diesel Tailpipe CO2 Emissions Under Each Transition Scenario Are Calculated as

E f l e e t , s c e n a r i o = F d i e s e l , s c e n a r i o   × E F d i e s e l    
where E f l e e t , s c e n a r i o represents annual emissions resulting from each scenario in kg of CO2 per year (kgCO2/year) and F d i e s e l , s c e n a r i o   is the diesel fuel consumed by the fleet under each scenario on an annual basis (L/year).

5.6.2. The Avoided Diesel Tailpipe Emissions Relative to the Baseline Is Calculated as

Δ C O 2 = E f l e e t , b a s e l i n e E f l e e t , s c e n a r i o
% Δ C O 2 = Δ C O 2 E f l e e t , b a s e l i n e × 100

5.6.3. Operational Sensitivity Adjustment for Avoided Tailpipe Emissions

For the operational sensitivity analysis, avoided diesel tailpipe CO2 emissions are adjusted according to the equivalent diesel service displaced by FCEBs:
Δ E t a i l p i p e , s a d j = U s ×   Δ E t a i l p i p e , s r e f
where Δ E t a i l p i p e , s a d j is the avoided diesel tailpipe CO2 emissions in sensitivity case s , U s is the operational-utilization factor, and Δ E t a i l p i p e , s r e f is the corresponding avoided diesel tailpipe CO2 emissions in the reference case. Equation (17) is applied only in the operational sensitivity analysis and does not modify the reference-case results presented in the following section.

5.7. Fuel Cost Calculation

5.7.1. The Diesel Fuel Cost per Kilometer Is Calculated as

C d i e s e l , k m = C d i e s e l , d a y D b u s ,   d a y
where C d i e s e l , k m is the specific cost of fuel per kilometer ($/km) and C d i e s e l , d a y is the cost of diesel consumed by each bus on a daily basis ($/day).

5.7.2. The Hydrogen Fuel Cost per Kilometer Is Calculated as

C H 2 , k m = H 2 , b u s , d a y × P H 2         D b u s ,   d a y
where C H 2 , k m is the specific cost of hydrogen per kilometer ($/km) and P H 2 is unit price of hydrogen per kilogram ($/kgH2).

5.7.3. The Annual Diesel Cost per (Scenario) Is Calculated as

C d i e s e l , y e a r = F d i e s e l , s c e n a r i o × P d i e s e l
where C d i e s e l , y e a r is the total cost of diesel consumed by the fleet on an annual basis ($/year) and P d i e s e l is the unit price of diesel per liter ($/L).

5.7.4. Annual Hydrogen Cost (Scenario)

C H 2   , y e a r = H 2 , f l e e t , y e a r × P H 2
where C H 2   , y e a r is the total cost of hydrogen consumed by the fleet annually ($/year).
Accordingly, the equations translate fuel consumption quantities into cost metrics per km and on an annual basis for each evaluated scenario. This data-driven approach facilitates an estimate evaluation of GH2 integration into the Amman–Zarqa BRT system as part of supporting energy-transition initiatives in the country, utilizing real fleet and route data from the GAM. The methodology is built to facilitate preliminary planning and decision-making for transitions to low-carbon public transport.

6. Results and Discussion

This section outlines the outcomes of integrating FCEBs into the Amman-Zarqa BRT corridor from a techno-economic and environmental point of view. Initially, the baseline calculations were conducted based on data obtained from the GAM, manufacturers’ specifications, and literature. Thereafter, a set of scenarios was assessed considering 10%, 15%, and 25% penetration rates of FCEBs into the Amman-Zarqa corridor for the years 2030, 2035, and 2040.

6.1. BRT Baseline Calculations

The baseline operational measures are illustrated in Table 2 [82]. It presents essential operational, economic, and environmental parameters based on GAM data with applying equations from Equation (1) to Equation (7). The system is managed by a fleet of 64 diesel buses, with a centralized depot-based structure located at the main stations. The selected route covers an average of 480 km daily, with a total fleet mileage of 11 million km per year across 365 operating days. This high occupancy is reflected in the system’s fuel consumption. Each bus uses roughly 130 liters (L) of diesel daily and has an average fuel intensity of 0.271 L/km. Hence, the fleet’s annual diesel consumption is approximately 3 ML [82].
The annual baseline CO2 is around 8100 tons. This metric is calculated using a generic direct-combustion diesel emission factor of 2.67 kg CO2/L for diesel fuel [85]. The engine type is Cummins manufacturer ISL 8.9, which is designed to meet the Euro 5 emissions standard [86]. To that end, these indicators encourage us to evaluate the potential for transitioning to the low-carbon public transport sector through the gradual implementation of FCEBs. The estimation approach for the hydrogen consumption rate is calculated based on previous studies in the literature on urban FCEBs. Recent applied projects and operational studies of this type of bus in Europe reveal typical consumption rates between 0.08 and 0.1 kg of hydrogen per km under urban driving conditions. These measures primarily depend on bus size, occupancy, area topology, and operational intensity [87].
Based on the reported urban-FCEB range of 0.08–0.10 kgH2/km, a reference value of 0.09 kgH2/km is adopted for the baseline scenarios. This value is used as a planning assumption rather than as a site-specific validation of FCEB performance under Amman-Zarqa traffic conditions, seasonal demands, passenger loading, HVAC demands, route topology, altitude, or maintenance conditions. The influence of alternative consumption values is examined in the operational sensitivity analysis in Section 7.3. The selected XMQ6127AGFCEV specifications are used as preliminary planning inputs because the vehicle is commercially available and its reported range and refueling characteristics are relevant to BRT operation. However, these specifications do not establish route-specific suitability for the Amman-Zarqa corridor. The manufacturer-reported range is up to 800 km per refueling cycle, with a refueling duration of approximately 20 min [88]. These values provide a preliminary indication of potential night-time refueling but do not demonstrate depot-wide refueling feasibility. Lastly, the specific fuel cost of diesel is set at $1.034/L based on GAM data [82]. Route-specific validation under Amman-Zarqa climate, altitude, passenger loading, HVAC demand, maintenance conditions, and operating duty cycles is required before deployment.

6.2. Hydrogen Demand for FCEBs Under Implementation Scenarios

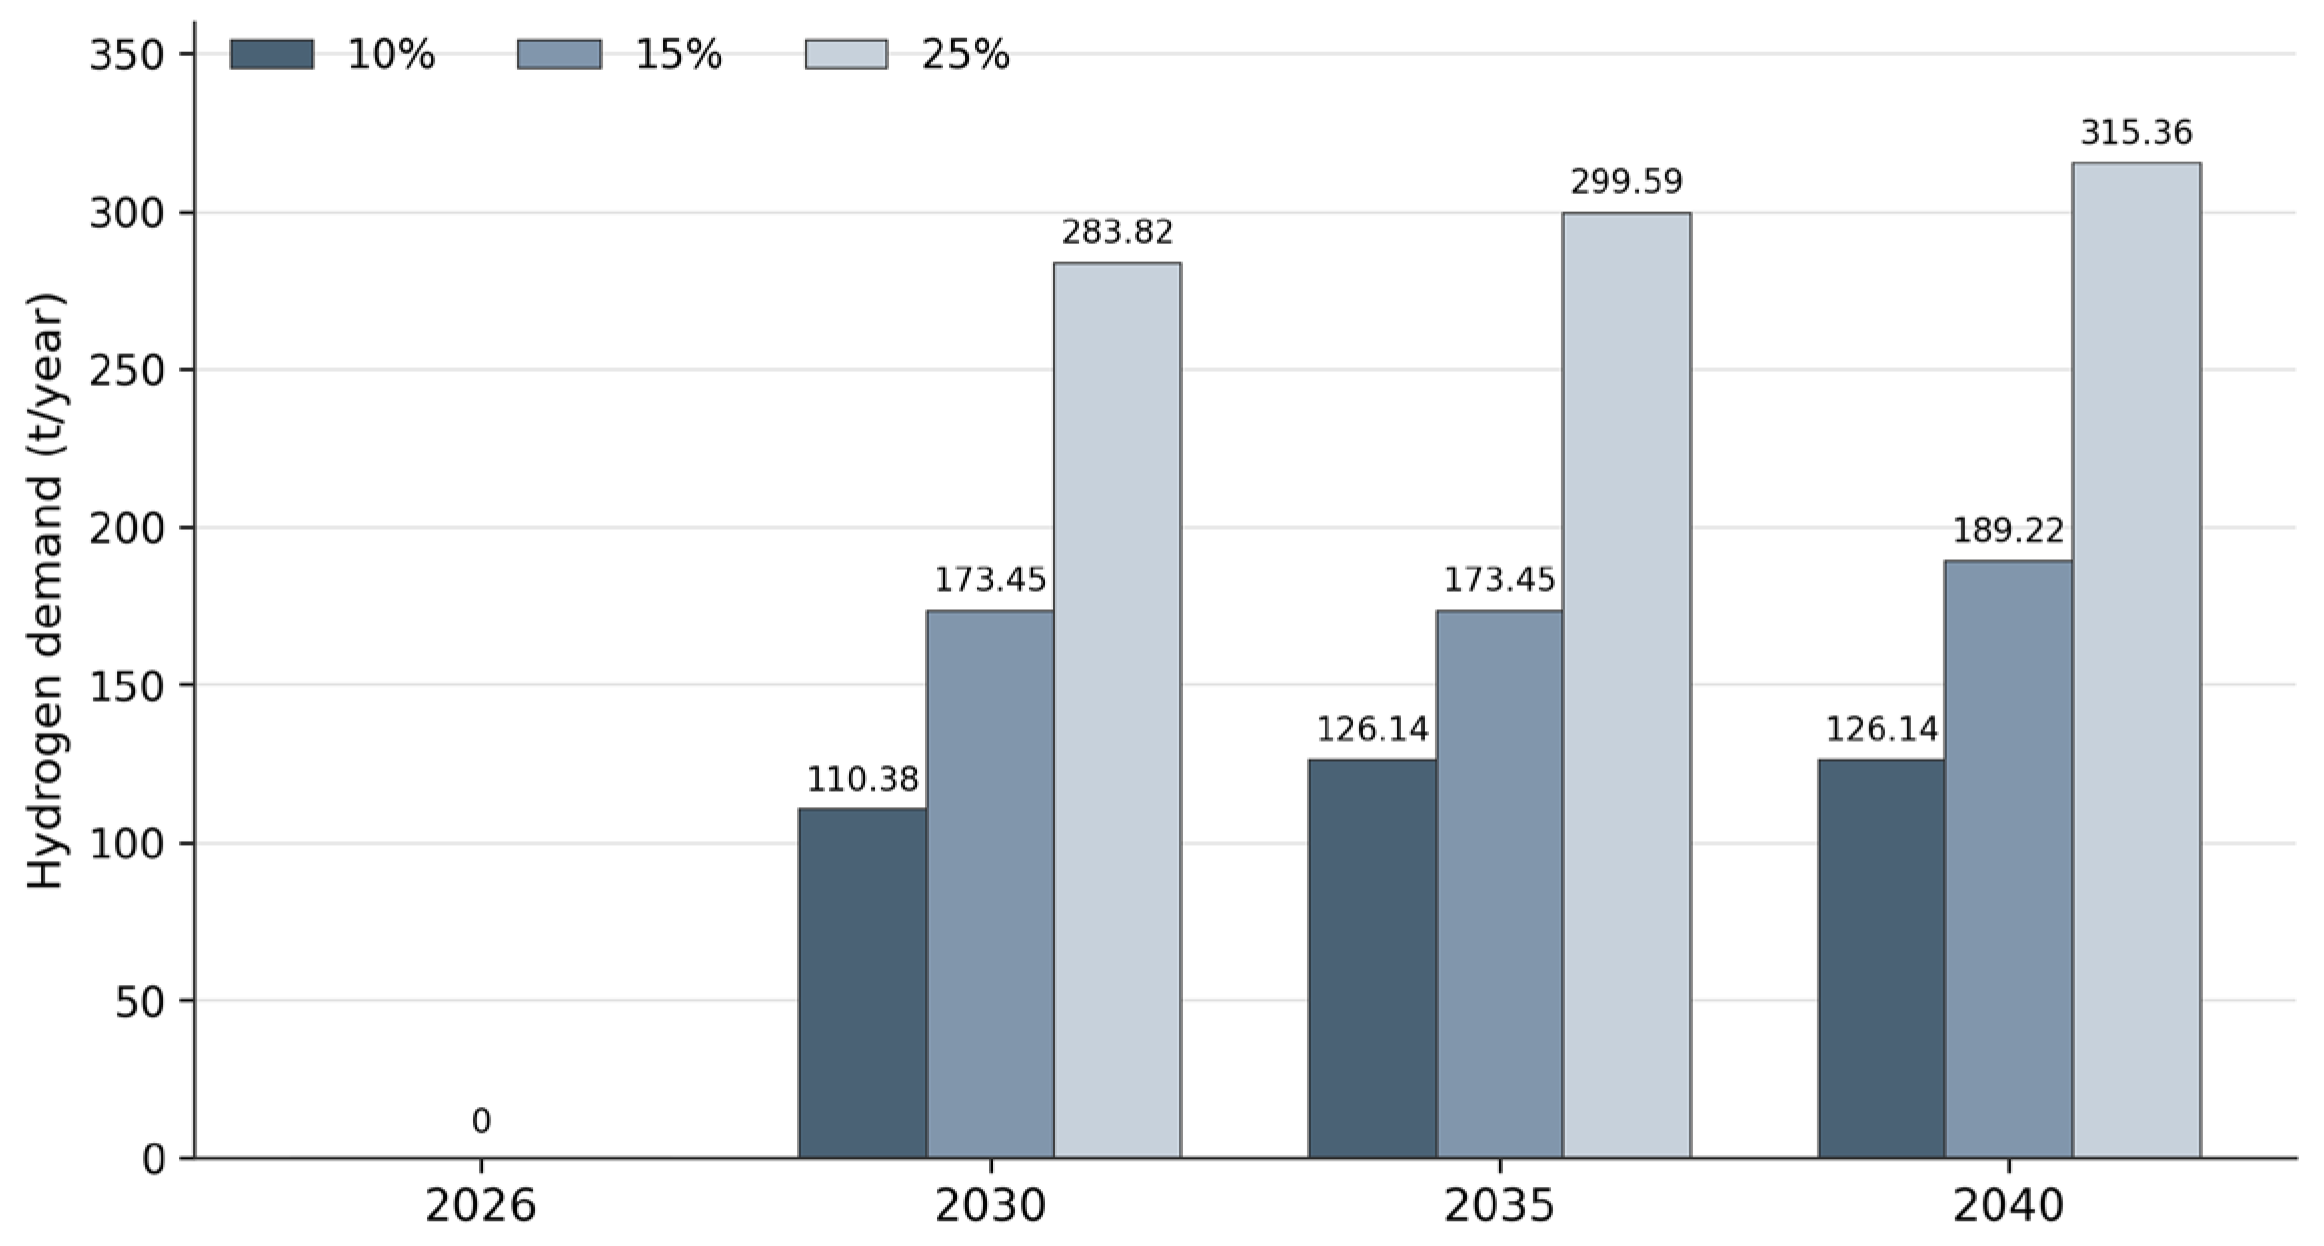
This section demonstrates the results of hydrogen demand estimation for the gradual integration of FCEBs in the BRT system fleet. The daily and annual hydrogen demand for each scenario is listed in Table 3 upon applying equations (Equations (8)–(12)). Under the reference assumption that each FCEB delivers equivalent annual vehicle-kilometers at a fixed hydrogen-consumption rate of 0.09 kgH2/km, hydrogen demand increases in proportion to the equivalent diesel service displaced. This relationship is conditional on the reference operating profile and does not represent a general forecast under changing traffic, seasonal demand, route allocation, passenger loading, or FCEB availability. The number of FCEBs is rounded to the nearest total fleet size based on the integration ratio for each year. Moderate H2 demand at low penetration levels (10% by 2030) indicates that initial deployment may be facilitated by a small-scale supply chain that transports H2 by specialized trucks from the Aqaba Hub to the Amman refueling station [11]. Hence, the increased demand underscores the need to expand refueling capacity, storage systems, and logistical planning. This delivery arrangement is used only as an operational supply assumption. Its upstream greenhouse-gas emissions, logistics costs, delivery losses, and detailed infrastructure requirements are not quantified in the present study. The study also does not quantify the required truck fleet, delivery frequency, supply-chain scalability, or transport losses. Where a liquid-hydrogen delivery mode is selected, boil-off would require a separate assessment; where compressed gaseous hydrogen is selected, loading, unloading, venting, and compression losses would require separate assessment.

6.3. Avoided Diesel Tailpipe CO2 Emissions Under FCEB Integration

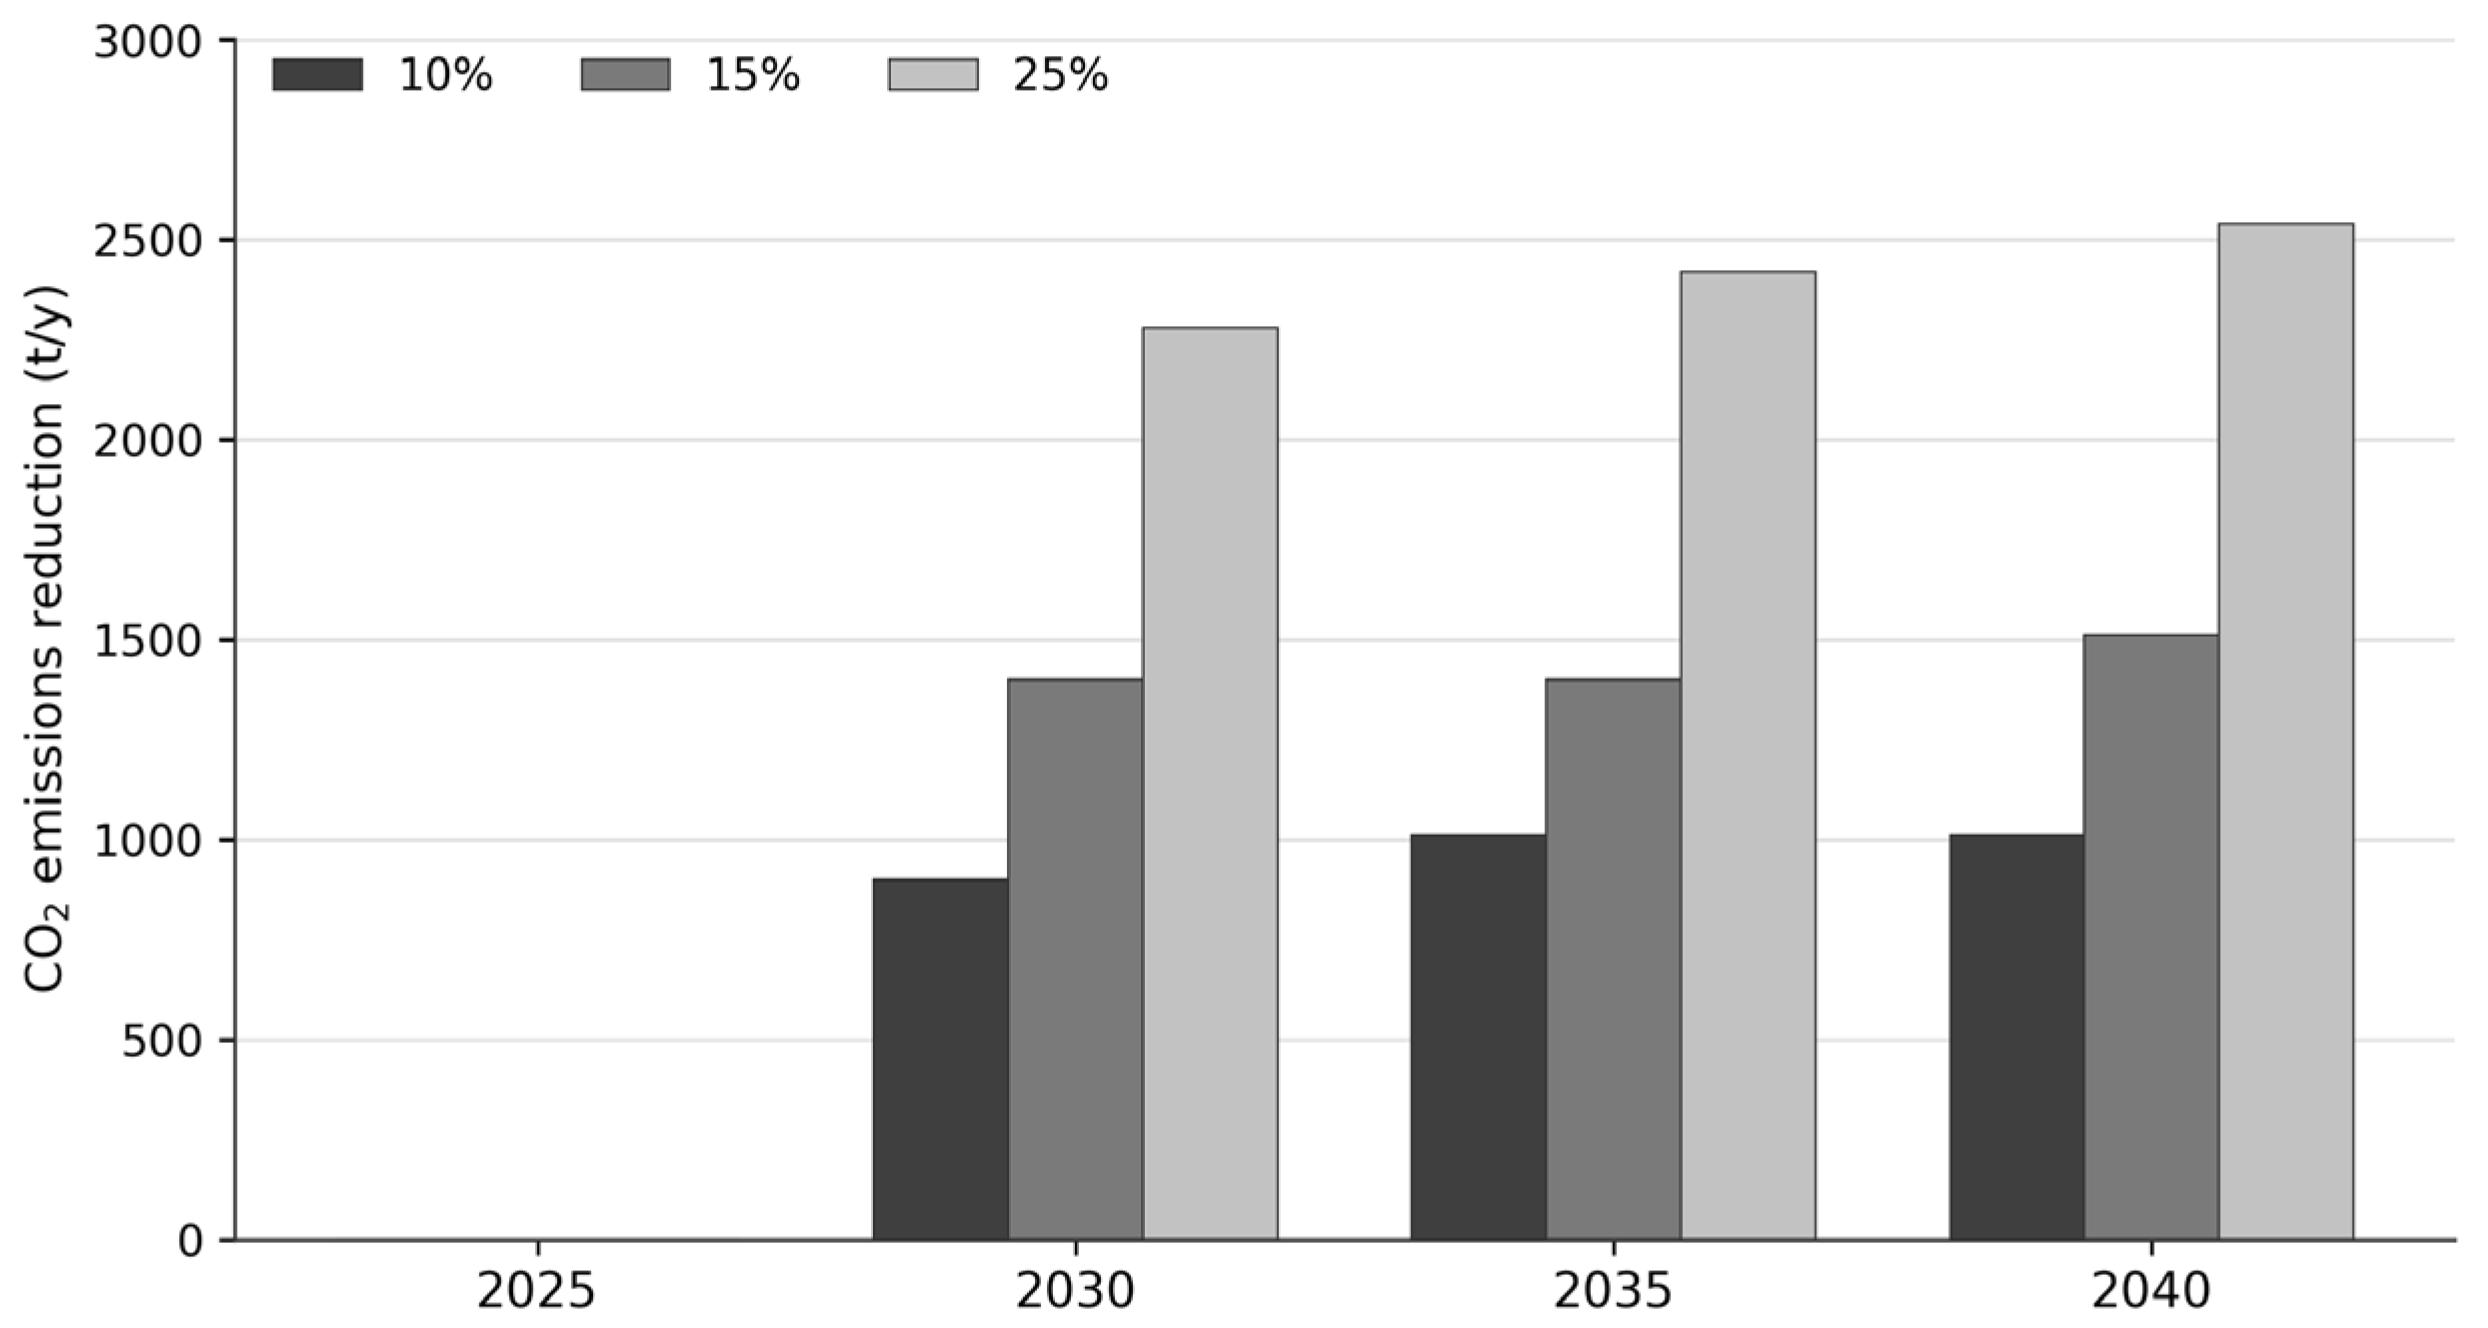
This section quantifies avoided diesel tailpipe CO2 emissions associated with the gradual integration of FCEBs into the BRT system using Equations (14)–(16). The calculation relies on fleet fuel consumption, a fixed direct-combustion diesel emission factor, and the reference operating profile. In the reference case, each FCEB is assumed to deliver equivalent annual vehicle-kilometers to the diesel-bus service it replaces and to have zero tailpipe CO2 emissions during operation.
Accordingly, Table 4 shows that avoided diesel tailpipe CO2 emissions increase in proportion to the equivalent diesel service displaced under these fixed reference conditions. This relationship does not mean that nominal FCEB fleet share alone determines avoided emissions under all real-world operating conditions. Changes in route allocation, service intensity, traffic conditions, seasonal demand, passenger loading, HVAC demand, energy use, vehicle availability, or maintenance downtime may alter the diesel service actually displaced and, consequently, the resulting hydrogen demand and avoided diesel tailpipe CO2 emissions. The operational sensitivity analysis in Section 7.3 examines the influence of alternative hydrogen-consumption rates and FCEB operational-utilization levels.
The values in Table 4 represent avoided diesel tailpipe CO2 emissions only and do not represent well-to-wheel or full life-cycle greenhouse-gas reductions. Within this stated assessment boundary, the results provide reference planning estimates for a phased FCEB transition. Detailed validation of operational performance, hydrogen supply, infrastructure capacity, and fleet availability remains necessary before deployment.

6.4. Economic Implications of FCEB Gradual Integration into the BRT System

The economic implications of FCEBs within the baseline BRT system are presented in this section, with an emphasis on operational energy costs. The fuel cost indicators for each scenario are summarized in Table 5 and were found by applying equations (Equations (18)–(21)). Under current operating conditions, each diesel bus consumes roughly 130 L/day over 480 km/day. It translates to an average operating cost of $0.28/km. According to FCEBs, the fuel costs delivered to the refueling station are assumed based on recent research [11]. For the reference operational fuel-cost case, an assumed hydrogen fuel-price input of $6/kg is adopted based on the Jordan-related estimate reported in [11]. This value is used as a scenario input rather than as a project-specific calculation of the Levelized Cost of Hydrogen. The model does not separately quantify hydrogen-production, compression, transport from Aqaba to Amman, storage, dispensing, taxes, or supplier-margin components. Therefore, the value should not be interpreted as a detailed delivered-hydrogen price for a fully engineered supply chain. At the reference hydrogen-consumption rate of 0.09 kgH2/km, each FCEB requires 43.2 kgH2/day. The annual hydrogen fuel cost is calculated by multiplying annual hydrogen consumption by the assumed hydrogen fuel price. The introduced FCEB share reallocates a portion of operational fuel expenditure from diesel to hydrogen. Because vehicle and refueling-infrastructure CAPEX, maintenance, financing, stack replacement, and total cost of ownership are excluded, this result does not establish investment risk, payback, or overall project viability.

6.5. Policy Implications

This study offers a thorough evaluation of the trade-offs related to hydrogen adoption in the urban public transport. From a technical perspective, the centralized BRT corridor and depot structure provide a defined reference basis for estimating hydrogen demand and considering phased refueling-infrastructure expansion. As depicted in Figure 9, H2 demand increases gradually under the proposed deployment strategy. This may enable phased expansion of refueling infrastructure and supply arrangements, subject to confirmation of depot storage, compression, dispensing capacity, available refueling windows, service allocation, and vehicle availability. In the 2040, 25% FCEB reference case, the estimated hydrogen demand is 864 kgH2/day. This value is a planning demand indicator, not a station design. Before advancing beyond pilot deployment, a depot-specific engineering and supply-chain assessment should confirm storage inventory, compressor capacity, dispenser number and filling rate, available refueling window, delivery frequency, safety separation, supply reliability, and operational redundancy.
Under the equivalent-duty reference assumptions, Figure 10 illustrates that avoided diesel tailpipe CO2 emissions increase with the diesel service displaced by FCEBs. This relationship is conditional on the fixed reference operating profile and should not be interpreted as a general relationship between nominal FCEB fleet share and total system-wide emissions. Changes in service allocation, traffic conditions, passenger loading, energy use, or vehicle availability may alter the diesel service displaced and the associated tailpipe-emission outcome.
Consequently, the reference scenarios support a staged, policy-backed transition. The 10% and 15% FCEB shares may serve as initial pilot benchmarks rather than a fixed adoption schedule. Deployment may be delayed by infrastructure and supply constraints or accelerated by lower hydrogen costs and improved vehicle performance. Technology improvements in fuel-cell efficiency, hydrogen consumption, durability, refueling, and vehicle availability could reduce the future hydrogen demand and operating costs. The scenarios should therefore be updated as operational data become available. A phased infrastructure approach is required, beginning with hydrogen delivery, depot storage, compression and dispensing equipment, safety procedures, and trained personnel. Higher FCEB penetration should follow only after a depot-specific engineering and supply-chain assessment verifies refueling capacity, storage inventory, compressor and dispensing throughput, delivery frequency, safety requirements, supply reliability, and operational redundancy.

7. Sensitivity Analysis

This section evaluates the sensitivity of the FCEB integration results to selected economic and operational assumptions. It comprises three analyses: hydrogen-price sensitivity under constant diesel pricing, diesel-price sensitivity under alternative geopolitical-stress trajectories, and operational sensitivity of hydrogen demand and avoided diesel tailpipe CO2 emissions. The first two analyses evaluate operational fuel-cost outcomes, whereas the third examines the effect of alternative hydrogen-consumption rates and FCEB service-delivery levels on the physical demand and tailpipe-emission results.

7.1. Hydrogen Price Sensitivity with Constant Diesel Pricing

Section 6.4 applies a static reference hydrogen fuel-price input of $6/kg. This section evaluates an illustrative hydrogen-price sensitivity pathway using $4/kg, $2/kg, and $1/kg for the 2030, 2035, and 2040 milestone scenarios, respectively. These values are not presented as forecasts of future hydrogen prices in Jordan. They also do not model electricity-price volatility, production outages, delivery disruptions, or geopolitical risks affecting hydrogen cost and supply reliability. Instead, they represent moderate, low-cost, and exploratory low-cost cases used to examine the sensitivity of operational fuel-cost outcomes to hydrogen-price variation.
The assumed decline in the hydrogen price reflects the expected effects of technological advancement, economies of scale, and the expansion of hydrogen-production applications [89]. The $4/kg case represents a moderate reduction from the reference input, the $2/kg case represents a low-cost sensitivity case, and the $1/kg case represents an exploratory long-term low-cost case. The latter should not be interpreted as a guaranteed 2040 price for Jordan or as a fully delivered depot price. The diesel price is held constant at $1.034/L in this subsection to isolate the effect of the hydrogen-price input [90].
The hydrogen price used in this analysis is an operational fuel-cost input. It is not a calculated Levelized Cost of Hydrogen value and does not separately model hydrogen production, compression, transport, storage, dispensing, hydrogen-supply reliability, electricity-price volatility, detailed delivery logistics, or depot-infrastructure capacity. These issues require separate supply-chain, infrastructure, and total-cost-of-ownership assessments. The following equations calculate the annual operational fuel cost of the mixed fleet and enable comparison with the diesel-only reference under the same diesel-price assumption.
One-way   variable     P H 2   { 1 ,   2 ,   4   }   $ / k g
C H 2 = C H 2   b a s e l i n e × P 6
C t o t a l = C D + C H 2
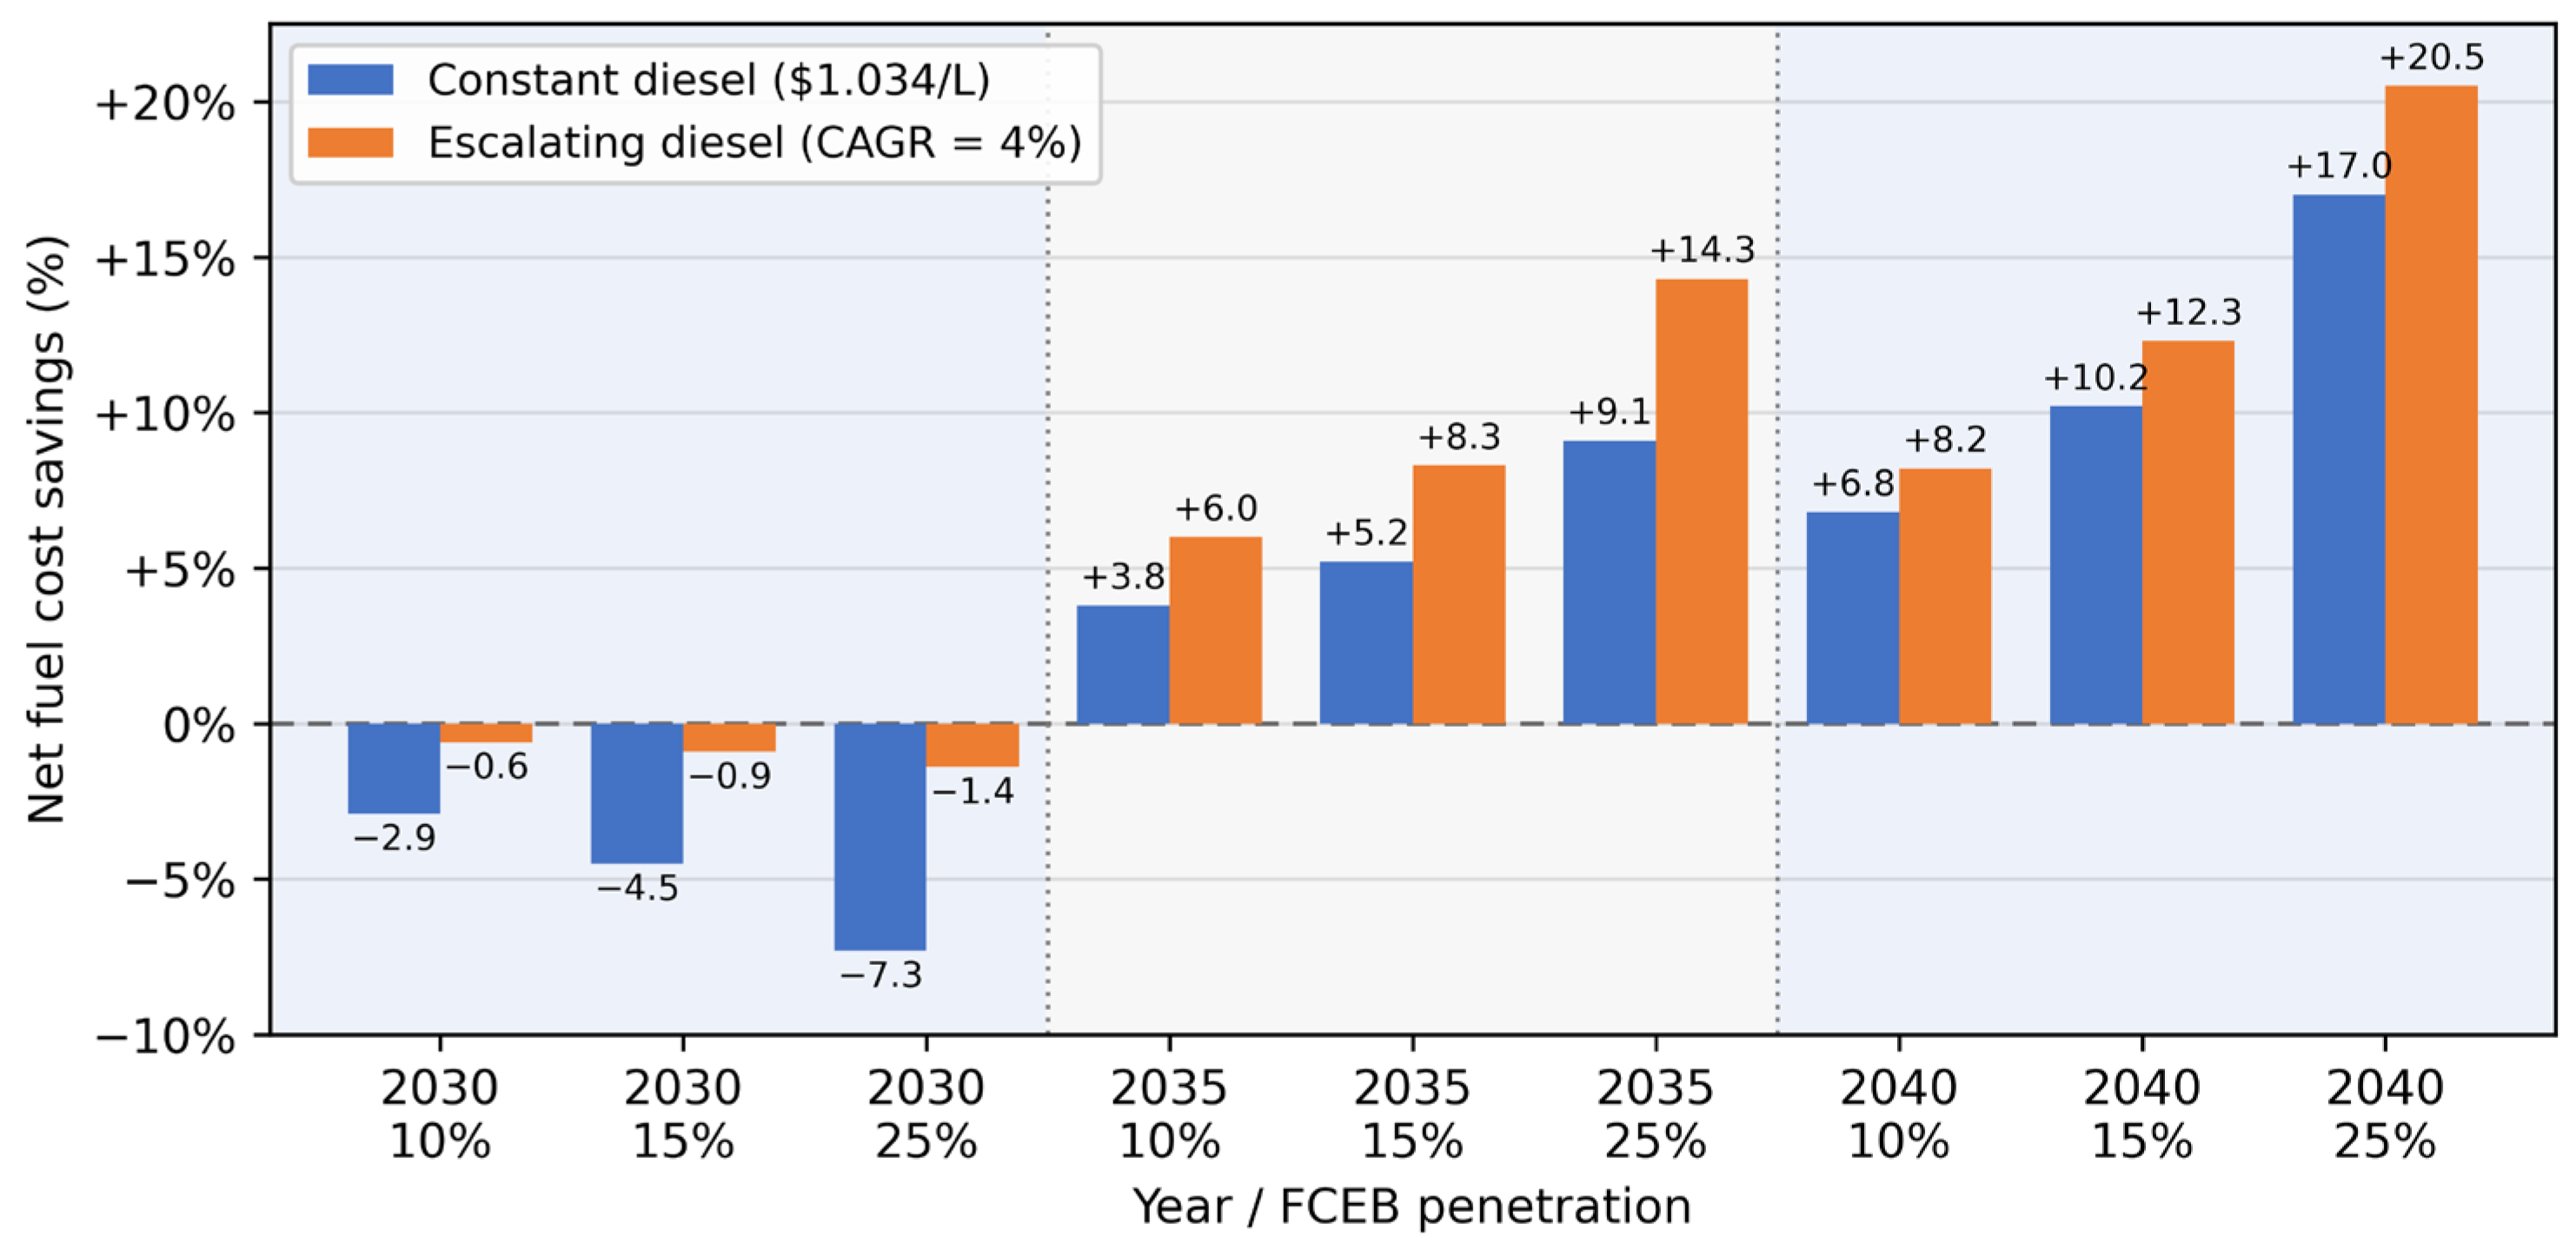
Under the constant-diesel-price cases that illustrated in Table 6, the mixed fleet has higher operational fuel costs in 2030 at an assumed hydrogen price of $4/kgH2. At $2/kgH2 in 2035, the mixed fleet becomes less costly than the diesel-only reference, with operational fuel-cost savings ranging from 3.81% to 9.06%. At $1/kgH2 in 2040, the savings increase to a maximum of 16.97%. Within the operational fuel-cost boundary of the model, the assumed hydrogen fuel price is a primary driver of the cost outcome. These results do not establish overall economic viability because vehicle and refueling-infrastructure CAPEX, maintenance, financing, stack replacement, and total cost of ownership are excluded.

7.2. Diesel-Price Sensitivity Under Alternative Geopolitical-Stress Trajectories

The constant diesel-price reference in Section 7.1 does not capture the fuel-price volatility discussed in Section 4. Therefore, this subsection examines the effect of diesel-price escalation on operational fuel-cost outcomes while retaining the hydrogen-price assumptions used in Section 7.1. The reference values and diesel-price escalation sensitivity cases used in this analysis are summarized in Table 7.
The central diesel-price trajectory applies a 4% annual escalation rate to all milestone scenarios in Table 8, Panel A. In addition, the fixed 2040, 25% FCEB reference case is examined under lower and higher annual escalation rates of 2% and 6%, respectively, in Table 8, Panel B. These cases assess the consequences of slower and faster diesel-price growth around the central 4% geopolitical-stress sensitivity. They are deterministic sensitivity cases, not forecasts of future diesel prices, and they do not simulate monthly volatility, supply interruptions, or short-term geopolitical shocks. The diesel-price sensitivity should therefore not be interpreted as evidence that hydrogen cost or supply reliability is unaffected by geopolitical or market disruption.
C t o t a l = C D + C H 2
For the central trajectory in Table 8, Panel A, the annual diesel-price growth rate is set at 4%. For the fixed 2040, 25% FCEB sensitivity case in Panel B, the annual growth rate is set at 2%, 4%, and 6%. The constant diesel-price case in Section 7.1 represents the 0% annual growth reference.
Table 8, Panel A compares the central 4% annual diesel-price escalation trajectory with the constant diesel-price reference in Table 6. At 25% FCEB penetration, the operational fuel-cost differential in 2030 decreases from −7.32% under the constant diesel-price reference to −1.44% under the 4% escalation trajectory. In 2035, the operational fuel-cost saving increases from 9.06% to 14.34%, while in 2040 it increases from 16.97% to 20.54%, as shown in Figure 11. These results indicate that the operational fuel-cost competitiveness of the FCEB scenarios improves under the central upward diesel-price trajectory.
Table 8, Panel B examines slower and faster diesel-price escalation for the fixed 2040, 25% FCEB reference case. Under the 2% lower escalation sensitivity, the operational fuel-cost saving is 19.03%. Under the 4% central sensitivity, the saving is 20.54%, while under the 6% higher sensitivity, it increases to 21.65%. Therefore, within the tested range, higher diesel-price escalation increases the operational fuel-cost advantage of the mixed fleet, whereas lower escalation reduces, but does not eliminate, that advantage.
These findings are conditional on the assumed hydrogen price, fleet configuration, annual service distance, and excluded cost categories. They do not simulate short-term market shocks, fuel-supply interruptions, or monthly diesel-price volatility.

7.3. Operational Sensitivity of Hydrogen Demand and Avoided Diesel Tailpipe CO2 Emissions

The preceding sensitivity analyses examine alternative hydrogen-price inputs and diesel-price escalation sensitivity cases. The reference fleet-transition scenarios also assume equivalent full-duty replacement, a fixed annual service distance, and a hydrogen-consumption rate of 0.09 kgH2/km. To examine the influence of operational variability, bounded deterministic sensitivity cases are applied for hydrogen-consumption rate and FCEB operational utilization.
The analysis does not simulate traffic conditions, seasonal demand, route optimization, passenger loading, HVAC operation, vehicle degradation, maintenance downtime, or service disruption individually. Instead, these factors are represented through alternative hydrogen-consumption rates and FCEB service-delivery levels. The cases are illustrative planning sensitivities, not operational forecasts or dispatch recommendations.
The 2040 scenario with 25% FCEB penetration is used as the representative high-penetration case. Under the reference condition of U = 1.00 , it includes 20 FCEBs, a daily hydrogen demand of 864 kgH2/day, an annual hydrogen demand of 315.36 tH2/year, and avoided diesel tailpipe CO2 emissions of 2533.8 tCO2/year.
As shown in Table 9, the hydrogen-consumption rate directly affects hydrogen demand and associated hydrogen fuel-cost outcomes. Avoided diesel tailpipe CO2 emissions remain unchanged because the equivalent diesel service displaced is held constant at U = 1.00 . The tested range corresponds to the urban-FCEB consumption range adopted in Section 6.1.
Table 10 demonstrates that the nominal FCEB fleet share is not, by itself, sufficient to determine hydrogen demand or avoided diesel tailpipe CO2 emissions. The outcomes depend on the annual FCEB service actually delivered relative to the diesel service displaced. Reduced-U cases can represent partial duty allocation or lower FCEB availability associated with maintenance downtime, fuel-cell degradation, or stack replacement. They are service-delivery sensitivities, not a reliability model or a prediction of stack-replacement schedules. The U = 0.50 and U = 0.75 cases are illustrative partial-duty scenarios rather than forecasts of future BRT operation. Similarly, the U = 1.10 case is a higher-service stress case and does not establish the physical feasibility of operating the selected buses at that level. Detailed route scheduling, vehicle-performance validation, and depot-refuelling assessment are required before such service levels can be implemented.
Table 9 and Table 10 report physical operational outcomes only. The corresponding hydrogen fuel-cost effects can be calculated through Equation (21) using the hydrogen-price assumptions examined in Section 7.1 and Section 7.2.

7.4. Operational Fuel-Cost Break-Even Hydrogen Price

The price pathway in Section 7.1 combines changes in the year, fleet size, and FCEB penetration. To isolate the influence of hydrogen price, an operational fuel-cost break-even calculation is applied to the 2040, 25% FCEB reference case. This case includes 20 FCEBs, an annual hydrogen demand of 315.36 tH2/year, and equivalent-duty replacement of diesel-bus service.
The operational break-even hydrogen price is defined as the price at which the annual fuel cost of the mixed diesel-FCEB fleet equals the annual fuel cost of the all-diesel reference fleet:
P H 2 , B E =   C D i e s e l , a l l     C D i e s e l , r e m a i n i n g Q H 2
where P H 2 , B E is the operational fuel-cost break-even hydrogen price, C D i e s e l , a l l is the annual fuel cost of the all-diesel fleet, C D i e s e l , r e m a i n i n g is the annual fuel cost of the remaining diesel buses in the mixed-fleet scenario, and Q H 2 is annual hydrogen demand.
Under the reference 2040, 25% FCEB scenario, the operational break-even hydrogen price is approximately $3.11/kgH2. This threshold is calculated under the constant diesel-price reference of $1.034/L and is conditional on the annual service distance, hydrogen-consumption rate, and the equivalent-duty replacement assumption. Under the diesel-price escalation sensitivity cases examined in Section 7.2, the operational fuel-cost break-even hydrogen price would differ. It reflects operational fuel costs only and does not establish project-level economic feasibility, payback, or total cost of ownership. The operational fuel-cost sensitivity to hydrogen price for the 2040, 25% FCEB reference case is summarized in Table 11.
The results show that $4/kgH2 and $6/kgH2 remain above the operational fuel-cost break-even threshold, whereas $2/kgH2 and $1/kgH2 produce operational fuel-cost savings under the reference assumptions. The result does not include vehicle CAPEX, refueling infrastructure, maintenance, stack replacement, financing, or residual value.

8. Conclusions and Future Work

This study evaluates the gradual integration of FCEBs into Jordan’s BRT project through a scenario-based assessment of fuel costs and avoided diesel tailpipe emissions. The baseline diesel fleet emits 8108 tCO2 annually at the tailpipe. Under the reference assumption of equivalent annual mileage, duty-cycle allocation, and planned service delivery, replacing 25% of the fleet with FCEBs avoids 2533.8 tCO2 per year of diesel tailpipe emissions. This result is proportional to the equivalent diesel service displaced and should not be interpreted as a direct consequence of the nominal FCEB fleet share under all operating conditions. These values do not represent well-to-wheel or full lifecycle greenhouse gas reductions. The net climate benefit of FCEB integration depends on the emissions intensity of the hydrogen-production and delivery pathway, including electrolysis, water treatment where applicable, compression, storage, transport, and dispensing. Within the operational fuel-cost boundary of this study, the results are sensitive to both the assumed hydrogen fuel price and the diesel-price trajectory. Under the illustrative hydrogen-price pathway and constant diesel-price reference, mixed-fleet operation remains more expensive than diesel-only operation at $4/kgH2, while the $2/kgH2 and $1/kgH2 cases generate operational fuel-cost savings in the corresponding 2035 and 2040 scenarios. For the fixed 2040, 25% FCEB reference case, the operational fuel-cost break-even hydrogen price is approximately $3.11/kgH2 under the constant diesel-price reference. For the same fixed case, operational fuel-cost savings increase from 16.97% under the constant diesel-price reference to 19.03%, 20.54%, and 21.65% under annual diesel-price escalation rates of 2%, 4%, and 6%, respectively. These cases are deterministic sensitivity cases rather than forecasts of future diesel prices or simulations of short-term geopolitical shocks. These results concern operational fuel costs only and do not establish project-level economic viability or payback. A staged deployment strategy is recommended based on the study outcomes. Initial penetration of 10% and 15% may provide an opportunity to build operational experience and support phased infrastructure planning. However, because vehicle and refueling-infrastructure CAPEX, maintenance, financing, stack replacement, and total cost of ownership are excluded, the present analysis does not establish investment risk, payback, or overall project viability. Higher FCEB penetration may become more competitive in operational fuel-cost terms as the assumed hydrogen price declines and diesel prices increase. Domestically produced green hydrogen could contribute to transport decarbonization and energy security, provided that the hydrogen-production and delivery pathway maintains sufficiently low greenhouse-gas emissions, reliable supply conditions, and competitive operational fuel costs. The present assessment is limited to operational fuel costs and avoided diesel tailpipe CO2 emissions. It does not quantify upstream greenhouse-gas emissions associated with hydrogen production, water treatment where applicable, compression, storage, transport, or dispensing. It also excludes vehicle and refueling-infrastructure life-cycle stages, including manufacture, construction, replacement, and end-of-life treatment. The model uses deterministic reference assumptions for fleet growth, service intensity, route allocation, hydrogen consumption, and service delivery. Fleet size in the milestone years follows the illustrative one-additional-bus-per-year assumption and should not be interpreted as a GAM demand forecast. Although bounded operational sensitivities are examined, traffic conditions, seasonal demand, passenger loading, route optimization, fuel-cell degradation, maintenance downtime, vehicle availability, and climate-specific performance are not dynamically simulated. Future research should examine non-regular transition pathways, including delayed, accelerated, and adaptive deployment patterns to reflect changes in hydrogen cost, supply reliability, infrastructure availability, market readiness, and policy support. It should also account for technology evolution, including changes in hydrogen consumption, fuel-cell efficiency, stack durability, refueling performance, and vehicle availability. Detailed infrastructure planning is further required to define hydrogen-supply arrangements, depot storage, compression, dispensing capacity, safety systems, workforce readiness, and operational redundancy at each stage of FCEB deployment. Future research should conduct a pathway-specific well-to-wheel assessment and a cradle-to-grave life-cycle assessment using defined hydrogen-production, delivery, and depot-infrastructure configurations. Additionally, future work should extend this framework to compare FCEBs with battery electric buses, full replacement of diesel buses instead of gradual integration, integrate dynamic hydrogen supply pathways that include electricity-price volatility, production outages, delivery disruptions, and supply reliability, and include random modeling of diesel prices under different geopolitical contexts.

Author Contributions

All authors contributed to the conception and design of the study. Conceptualization, A.A., H.M., B.H., M.A. and R.T.; methodology, A.A., H.M. and B.H.; validation, A.A., H.M. and B.H.; investigation, H.M.; supervision, A.A., H.M., B.H. and M.A.; resources, M.A. and R.T.; review and editing, A.A., H.M. and B.H.; formal analysis, M.A. and R.T.; investigation, H.M. and M.A.; data curation, M.A. and R.T.; visualization, H.M., M.A. and R.T.; writing original draft, H.M., M.A. and R.T. All authors have read and agreed to the published version of the manuscript.

Funding

This research was funded by the Deanship of Scientific Research at the German Jordanian University under cluster grant CLUS-SATS-2024.

Data Availability Statement

The data presented in this study are available on request from the corresponding author.

Conflicts of Interest

The authors declare no conflicts of interest.

Abbreviations

The following abbreviations are used in this manuscript:
ACAlternating Current
BEV(s)Battery Electric Vehicle(s)
BRTBus Rapid Transit
CAGRCompound Annual Growth Rate
CO2Carbon Dioxide
CUICommon Use Infrastructure
DCDirect Current
EIAEnergy Information Administration
EUEuropean Union
EV(s)Electric Vehicle(s)
FCEB(s)Fuel Cell Electric Bus(es)
FCEV(s)Fuel Cell Electric Vehicle(s)
GAMGreater Amman Municipality
GDPGross Domestic Product
GH2Green Hydrogen
GHG(s)Greenhouse Gas(es)
H2Hydrogen
HEV(s)Hybrid Electric Vehicle(s)
HVACHeating, Ventilation, and Air Conditioning
ICE(s)Internal Combustion Engine(s)
IEAInternational Energy Agency
JDJordanian Dinar
LNGLiquefied Natural Gas
MEMRMinistry of Energy and Mineral Resources
MJDMillion Jordanian Dinars
MMBtuMillion British Thermal Units
MoEMinistry of Environment
MoTMinistry of Transport
MtMillion Metric Tons
M$Million US Dollars
PEMFCProton Exchange Membrane Fuel Cell
PHEV(s)Plug-in Hybrid Electric Vehicle(s)
RESRenewable Energy Sources
tCO2Tons of Carbon Dioxide
USAUnited States of America
USDUnited States Dollar

References

  1. Renewables in Energy Demand: Global Trends Renewables 2023 Global Status Report: Renewables in Energy Demand. REN21 Secretariat. 2023. Available online: https://www.ren21.net/gsr-2023/modules/energy_demand (accessed on 1 June 2026).
  2. Nakano, Y.; Sano, F.; Akimoto, K. Impacts of decarbonization technologies in air transport on the global energy system. Transp. Res. Part D Transp. Environ. 2022, 110, 103417. [Google Scholar] [CrossRef] [Scilit]
  3. Tan, J.; Wu, Q.; Zhang, M.; Wei, W.; Liu, F.; Pan, B. Chance-constrained energy and multi-type reserves scheduling exploiting flexibility from combined power and heat units and heat pumps. Energy 2021, 233, 121176. [Google Scholar] [CrossRef] [Scilit]
  4. Sinigaglia, T.; Martins, M.E.S.; Siluk, J.C.M. Technological evolution of internal combustion engine vehicle: A patent data analysis. Appl. Energy 2022, 306, 118003. [Google Scholar] [CrossRef] [Scilit]
  5. Giuntini, L.; Lamioni, R.; Linari, L.; Saccomano, P.; Mainardi, D.; Tognotti, L.; Galletti, C. Decarbonization of a tissue paper plant: Advanced numerical simulations to assess the replacement of fossil fuels with a biomass-derived syngas. Renew. Energy 2022, 198, 884–893. [Google Scholar] [CrossRef] [Scilit]
  6. Solaymani, S.; Botero, J. Reducing carbon emissions from transport sector: Experience and policy design considerations. Sustainability 2025, 17, 3762. [Google Scholar] [CrossRef] [Scilit]
  7. Mynko, O.; Amghizar, I.; Brown, D.J.; Chen, L.; Marin, G.B.; de Alvarenga, R.F.; Uslu, D.C.; Dewulf, J.; Van Geem, K.M. Reducing CO2 emissions of existing ethylene plants: Evaluation of different revamp strategies to reduce global CO2 emission by 100 million tonnes. J. Clean. Prod. 2022, 362, 132127. [Google Scholar] [CrossRef] [Scilit]
  8. Hafriz, R.S.R.M.; Arifin, N.A.; Salmiaton, A.; Yunus, R.; Taufiq-Yap, Y.H.; Saifuddin, N.M.; Shamsuddin, A.H. Multiple-objective optimization in green fuel production via catalytic deoxygenation reaction with NiO-dolomite catalyst. Fuel 2022, 308, 122041. [Google Scholar] [CrossRef] [Scilit]
  9. Falcone, P.M.; Hiete, M.; Sapio, A. Hydrogen economy and sustainable development goals: Review and policy insights. Curr. Opin. Green Sustain. Chem. 2021, 31, 100506. [Google Scholar] [CrossRef] [Scilit]
  10. Harichandan, S.; Kar, S.K.; Rai, P.K. A systematic and critical review of green hydrogen economy in India. Int. J. Hydrogen Energy 2023, 48, 31425–31442. [Google Scholar] [CrossRef] [Scilit]
  11. Korberg, A.D.; Thellufsen, J.Z.; Skov, I.R.; Chang, M.; Paardekooper, S.; Lund, H.; Mathiesen, B.V. On the feasibility of direct hydrogen utilization in a fossil-free Europe. Int. J. Hydrogen Energy 2023, 48, 2877–2891. [Google Scholar] [CrossRef] [Scilit]
  12. IEA. The Future of Hydrogen Seizing Today’s Opportunities; IEA: Paris, France, 2019; Available online: https://www.iea.org/reports/the-future-of-hydrogen (accessed on 1 June 2026).
  13. Zhao, Y.J.; Liu, Q.; Duan, Y.Y.; Zhang, Y.K.; Cui, Y.; Huang, Y.; Gao, D.; Shi, L.; Wang, J.; Yi, Q. Hydrogen energy deployment in decarbonizing transportation sector using multi-supply-demand integrated scenario analysis with nonlinear programming—A Shanxi case study. Int. J. Hydrogen Energy 2022, 47, 19338–19352. [Google Scholar] [CrossRef] [Scilit]
  14. Yang, J.; Hosseinpanahi, D.; Zou, B.; Lin, J. Powering long haul freight: Hydrogen refueling station siting using pipeline infrastructure. Transp. Res. Part D Transp. Environ. 2026, 154, 105226. [Google Scholar] [CrossRef] [Scilit]
  15. Tak, Y.C.; Paw, J.K.S.; Kadirgama, K.; Yusaf, T.; Ramasamy, D.; Sudhakar, K.; Sandhya, M.; Awad, O.; Zhou, B.; Pasupuleti, J.; et al. Decarbonizing the future for the transportation and aviation industries: Green hydrogen as the sustainable fuel solution. Mater. Today Sustain. 2025, 31, 101152. [Google Scholar] [CrossRef] [Scilit]
  16. Li, Y.; Lin, R.; O’Shea, R.; Thaore, V.; Wall, D.; Murphy, J.D. A perspective on three sustainable hydrogen production technologies with a focus on technology readiness level, cost of production and life cycle environmental impacts. Heliyon 2024, 10, e26637. [Google Scholar] [CrossRef] [Scilit] [PubMed]
  17. Muhsen, H.; Alghweri, M. Green hydrogen progress and future potential in Jordan for sustainable energy transition. Discov. Sustain. 2026, 7, 93. [Google Scholar] [CrossRef] [Scilit]
  18. Samawi, G.A.; Bwaliez, O.M.; Jreissat, M.; Kandas, A. Advancing sustainable development in Jordan: A business and economic analysis of electric vehicle adoption in the transportation sector. World Electr. Veh. J. 2025, 16, 45. [Google Scholar] [CrossRef] [Scilit]
  19. Shbeeb, L. Traffic and environmental impacts of constructing and operating a BRT service: Case study in Amman, Jordan. Cogent Eng. 2023, 10, 2283316. [Google Scholar] [CrossRef] [Scilit]
  20. AL-Quraan, A.; Alghweri, M. Techno-economic evaluation of hybrid renewable systems for green hydrogen production and utilization. Results Eng. 2026, 30, 111080. [Google Scholar] [CrossRef] [Scilit]
  21. Ma, X.; Wang, Q.; Xiong, S.; Yuan, Y. Application of fuel cell and alternative fuel for the decarbonization of China’s road freight sector towards carbon neutral. Int. J. Hydrogen Energy 2024, 49, 263–275. [Google Scholar] [CrossRef] [Scilit]
  22. Reuß, M.; Dimos, P.; Léon, A.; Grube, T.; Robinius, M.; Stolten, D. Hydrogen road transport analysis in the energy system: A case study for Germany through 2050. Energies 2021, 14, 3166. [Google Scholar] [CrossRef] [Scilit]
  23. Watabe, A.; Leaver, J.; Shafiei, E. Decarbonizing Japan’s freight transport: A long-term assessment of fuel cell truck adoption and hydrogen supply pathways. Clean. Technol. Environ. Policy 2026, 28, 18. [Google Scholar] [CrossRef] [Scilit]
  24. Abu-Rumman, G.; Khdair, A.I.; Khdair, S.I. Current status and future investment potential in renewable energy in Jordan: An overview. Heliyon 2020, 6, e03346. [Google Scholar] [CrossRef] [Scilit] [PubMed]
  25. Shboul, B.; Zayed, M.E.; Marashdeh, H.F.; Al-Smad, S.N.; Al-Bourini, A.A.; Amer, B.J.; Qtashat, Z.W.; Alhourani, A.M. Comprehensive assessment of green hydrogen potential in Jordan: Economic, environmental and social perspectives. Int. J. Energy Sect. Manag. 2024, 18, 2212–2233. [Google Scholar] [CrossRef] [Scilit]
  26. Muhsen, H.; Tarawneh, R. Hydrogen Blending as a Transitional Solution for Decarbonizing the Jordanian Electricity Generation Sector. Hydrogen 2025, 6, 101. [Google Scholar] [CrossRef] [Scilit]
  27. Jaradat, M.; Alsotary, O.; Juaidi, A.; Albatayneh, A.; Alzoubi, A.; Gorjian, S. Potential of Producing Green Hydrogen in Jordan. Energies 2022, 15, 9039. [Google Scholar] [CrossRef] [Scilit]
  28. Muhsen, H.; Hamida, F.; Tarawneh, R. The potential of green hydrogen and power-to-X to decarbonize the fertilizer industry in Jordan. Agriculture 2025, 15, 608. [Google Scholar] [CrossRef] [Scilit]
  29. Muhsen, H.; Al-Mahmodi, M.; Tarawneh, R.; Alkhraibat, A.; Al-Halhouli, A.A. The potential of green hydrogen and power-to-X utilization in Jordanian Industries: Opportunities and future prospects. Energies 2023, 17, 213. [Google Scholar] [CrossRef] [Scilit]
  30. EPA. Alternative Fuels. 2025. Available online: https://www.epa.gov/renewable-fuel-standard/alternative-fuels (accessed on 1 June 2026).
  31. Dutta, K.; Daverey, A.; Lin, J.G. Evolution retrospective for alternative fuels: First to fourth generation. Renew. Energy 2014, 69, 114–122. [Google Scholar] [CrossRef] [Scilit]
  32. Towoju, O.A.; Ishola, F.A. A case for the internal combustion engine powered vehicle. Energy Rep. 2020, 6, 315–321. [Google Scholar] [CrossRef] [Scilit]
  33. Gago, E.J. Electric vehicles: Case study for Spain. In Electric Vehicles: Prospects and Challenges; Elsevier: Amsterdam, The Netherlands, 2017; pp. 287–316. [Google Scholar] [CrossRef] [Scilit]
  34. Kulkarni, V.; Ghaisas, G.; Krishnan, S. Performance analysis of an integrated battery electric vehicle thermal management. J. Energy Storage 2022, 55, 105334. [Google Scholar] [CrossRef] [Scilit]
  35. Aguilar, P.; Groß, B. Battery electric vehicles and fuel cell electric vehicles, an analysis of alternative powertrains as a mean to decarbonize the transport sector. Sustain. Energy Technol. Assess. 2022, 53, 102624. [Google Scholar] [CrossRef] [Scilit]
  36. Fernández, R.Á.; Pérez-Dávila, O. Fuel cell hybrid vehicles and their role in the decarbonization of road transport. J. Clean. Prod. 2022, 342, 130902. [Google Scholar] [CrossRef] [Scilit]
  37. Elgendi, M.; Huh, J.; Sekar, M.; Mahmoud, M.; Abdelkareem, M.A.; Olabi, A.G. Opportunities and sustainability challenges of hydrogen as a fuel in the transportation sector: A review. Renew. Sustain. Energy Rev. 2025, 217, 115705. [Google Scholar] [CrossRef] [Scilit]
  38. Sayer, M.; Ajanovic, A.; Haas, R. On the economics of a hydrogen bus fleet powered by a wind park–A case study for Austria. Int. J. Hydrogen Energy 2022, 47, 33153–33166. [Google Scholar] [CrossRef] [Scilit]
  39. Li, Y.; Taghizadeh-Hesary, F. The economic feasibility of green hydrogen and fuel cell electric vehicles for road transport in China. Energy Policy 2022, 160, 112703. [Google Scholar] [CrossRef] [Scilit]
  40. Zhou, R.; Moser, F.C.; Feng, Y.; Jin, M.; Zou, B. Hydrogen logistics network design for hydrogen fuel cell electric long-haul trucks. Int. J. Hydrogen Energy 2026, 215, 153889. [Google Scholar] [CrossRef] [Scilit]
  41. Hwang, J.; Maharjan, K.; Cho, H. A review of hydrogen utilization in power generation and transportation sectors: Achievements and future challenges. Int. J. Hydrogen Energy 2023, 48, 28629–28648. [Google Scholar] [CrossRef] [Scilit]
  42. Kavadias, K.A.; Kosmas, V.; Tzelepis, S. Sizing, optimization, and financial analysis of a green hydrogen refueling station in remote regions. Energies 2022, 15, 547. [Google Scholar] [CrossRef] [Scilit]
  43. De Wolf, D.; Smeers, Y. Comparison of battery electric vehicles and fuel cell vehicles. World Electr. Veh. J. 2023, 14, 262. [Google Scholar] [CrossRef] [Scilit]
  44. Brousek, J.; Petr, T.; Brabec, P. Comparative analysis of CO2 emissions from conventional internal combustion engine vehicles, battery electric vehicles, and fuel cell electric vehicles in selected Central European countries. J. Clean. Prod. 2026, 544, 147706. [Google Scholar] [CrossRef] [Scilit]
  45. Tlili, O.; Mansilla, C.; Frimat, D.; Perez, Y. Hydrogen market penetration feasibility assessment: Mobility and natural gas markets in the US, Europe, China and Japan. Int. J. Hydrogen Energy 2019, 44, 16048–16068. [Google Scholar] [CrossRef] [Scilit]
  46. Saju, C.; Michael, P.A.; Jarin, T. Modeling and control of a hybrid electric vehicle to optimize system performance for fuel efficiency. Sustain. Energy Technol. Assess. 2022, 52, 102087. [Google Scholar] [CrossRef] [Scilit]
  47. Tripathi, S.; Gorbatenko, I.; Garcia, A.; Sarathy, S.M. Life cycle environmental and cost impacts of bus transit networks: A real drive cycle evaluation of different powertrains. Energy Convers. Manag. 2025, 326, 119459. [Google Scholar] [CrossRef] [Scilit]
  48. Brandon, N.P.; Kurban, Z. Clean energy and the hydrogen economy. Philos. Trans. R. Soc. A Math. Phys. Eng. Sci. 2017, 375, 20160400. [Google Scholar] [CrossRef] [Scilit] [PubMed]
  49. Kim, H.; Hartmann, N.; Zeller, M.; Luise, R.; Soylu, T. Comparative tco analysis of battery electric and hydrogen fuel cell buses for public transport system in small to midsize cities. Energies 2021, 14, 4384. [Google Scholar] [CrossRef] [Scilit]
  50. Borghetti, F.; Longo, M.; Bonera, M.; Libretti, M.; Somaschini, C.; Martinelli, V.; Medeghini, M.; Mazzoncini, R. Battery electric buses or fuel cell electric buses? A decarbonization case study in the city of brescia, Italy. Infrastructures 2023, 8, 178. [Google Scholar] [CrossRef] [Scilit]
  51. Rath, R.; Kumar, P.; Mohanty, S.; Nayak, S.K. Recent advances, unsolved deficiencies, and future perspectives of hydrogen fuel cells in transportation and portable sectors. Int. J. Energy Res. 2019, 43, 8931–8955. [Google Scholar] [CrossRef] [Scilit]
  52. IEA. Global EV Outlook 2025—Expanding Sales in Diverse Markets; IEA: Paris, France, 2025; Available online: https://www.iea.org/reports/global-ev-outlook-2025 (accessed on 1 June 2026).
  53. NREL. Fuel Cell Buses in U.S. Transit Fleets: Current Status 2017. 2017. Available online: https://rosap.ntl.bts.gov/view/dot/34666 (accessed on 1 June 2026).
  54. Ballard. Fuel Cell Buses. 2026. Available online: https://www.ballard.com/fuel-cell-buses/ (accessed on 1 June 2026).
  55. REGLOBAL. Hydrogen Bus Deployment in the US: Mega Trends & Analysis. 2021. Available online: https://reglobal.org/hydrogen-bus-deployment-in-the-us/ (accessed on 1 June 2026).
  56. Ballard. Hydrogen Fuel Cell Buses Scale up in Europe. 2021. Available online: https://blog.ballard.com/bus/fuel-cell-buses-in-europe (accessed on 1 June 2026).
  57. U.S. Department of Energy. On-Road Transit Bus Fuel Cell Stack Durability. 2020. Available online: https://www.hydrogen.energy.gov/docs/hydrogenprogramlibraries/pdfs/20008-fuel-cell-bus-durability.pdf (accessed on 1 June 2026).
  58. NREL. Zero Emission Bay Area (ZEBA) Fuel Cell Bus Demonstration Results: Fifth Report. 2016. Available online: https://rosap.ntl.bts.gov/view/dot/36075 (accessed on 1 June 2026).
  59. Fuel Cell Works. South Korean Authorities to Spend $157m Subsidising ‘World’s Largest Ever Order’ for Hydrogen Buses. 2022. Available online: https://fuelcellsworks.com/news/south-korean-authorities-to-spend-157m-subsidising-worlds-largest-ever-order-for-hydrogen-buses (accessed on 1 June 2026).
  60. Ajanovic, A.; Glatt, A.; Haas, R. Prospects and impediments for hydrogen fuel cell buses. Energy 2021, 235, 121340. [Google Scholar] [CrossRef] [Scilit]
  61. Amin, M.; Shah, H.H.; Fareed, A.G.; Khan, W.U.; Chung, E.; Zia, A.; Farooqi, Z.; Lee, C. Hydrogen production through renewable and non-renewable energy processes and their impact on climate change. Int. J. Hydrogen Energy 2022, 47, 33112–33134. [Google Scholar] [CrossRef] [Scilit]
  62. Zhou, A.; Wang, J. Behind-the-meter renewable hydrogen: Challenges and solutions. Electr. J. 2022, 35, 107134. [Google Scholar] [CrossRef] [Scilit]
  63. Razi, F.; Dincer, I. Challenges, opportunities and future directions in hydrogen sector development in Canada. Int. J. Hydrogen Energy 2022, 47, 9083–9102. [Google Scholar] [CrossRef] [Scilit]
  64. Ministry of Energy; Mineral Resources|MEMR. Green Hydrogen Common Infrastructure Development in Jordan. 2025. Available online: https://www.ebrd.com/home/work-with-us/projects/tcpsd/19048.html (accessed on 1 June 2026).
  65. Yang, F.; Wang, T.; Deng, X.; Dang, J.; Huang, Z.; Hu, S.; Li, Y.; Ouyang, M. Review on hydrogen safety issues: Incident statistics, hydrogen diffusion, and detonation process. Int. J. Hydrogen Energy 2021, 46, 31467–31488. [Google Scholar] [CrossRef] [Scilit]
  66. Kwon, D.; Choi, S.K.; Yu, C. Improved safety by cross analyzing quantitative risk assessment of hydrogen refueling stations. Int. J. Hydrogen Energy 2022, 47, 10788–10798. [Google Scholar] [CrossRef] [Scilit]
  67. Foorginezhad, S.; Mohseni-Dargah, M.; Falahati, Z.; Abbassi, R.; Razmjou, A.; Asadnia, M. Sensing advancement towards safety assessment of hydrogen fuel cell vehicles. J. Power Sources 2021, 489, 229450. [Google Scholar] [CrossRef] [Scilit]
  68. Li, B.; Han, B.; Li, Q.; Gao, W.; Guo, C.; Lv, H.; Liu, Y.; Jin, X.; Bi, M. Study on hazards from high-pressure on-board type III hydrogen tank in fire scenario: Consequences and response behaviors. Int. J. Hydrogen Energy 2022, 47, 2759–2770. [Google Scholar] [CrossRef] [Scilit]
  69. Xie, Y.; Lv, N.; Huang, Y.; Wu, D.; Gong, L.; Yang, X.; Zeng, Y. Comparative analysis on temperature characteristics of hydrogen-powered and traditional fossil-fueled vehicle fires in the tunnel under longitudinal ventilations. Int. J. Hydrogen Energy 2022, 47, 24107–24118. [Google Scholar] [CrossRef] [Scilit]
  70. Salehi, F.; Baalisampang, T.; Abbassi, R. Numerical modeling towards the safety assessment of multiple hydrogen fires in confined areas. Process Saf. Environ. Prot. 2022, 160, 594–609. [Google Scholar] [CrossRef] [Scilit]
  71. Yu, X.; Wu, Y.; Zhao, Y.; Wang, C. Flame characteristics of under-expanded, cryogenic hydrogen jet fire. Combust. Flame 2022, 244, 112294. [Google Scholar] [CrossRef] [Scilit]
  72. Chinannai, M.F.; Lee, J.; Ju, H. Study of the characteristics of temperature rise and coolant flow rate control during malfunction of PEM fuel cells. Int. J. Hydrogen Energy 2021, 46, 11160–11175. [Google Scholar] [CrossRef] [Scilit]
  73. Chinannai, M.F.; Lee, J.; Ju, H. Numerical study for diagnosing various malfunctioning modes in PEM fuel cell systems. Int. J. Hydrogen Energy 2020, 45, 11714–11732. [Google Scholar] [CrossRef] [Scilit]
  74. Yan, J.; Jing, J.; Li, Y. Hydrogen fuel cell commercial vehicles in China: Evaluation of carbon emission reduction and its economic value. Int. J. Hydrogen Energy 2024, 52, 734–749. [Google Scholar] [CrossRef] [Scilit]
  75. Halder, P.; Babaie, M.; Salek, F.; Haque, N.; Savage, R.; Stevanovic, S.; Bodisco, T.; Zare, A. Advancements in hydrogen production, storage, distribution and refuelling for a sustainable transport sector: Hydrogen fuel cell vehicles. Int. J. Hydrogen Energy 2024, 52, 973–1004. [Google Scholar] [CrossRef] [Scilit]
  76. Ministry of Transport. Transport Sector Strategic Plan (2024–2028). 2024. Available online: https://www.mot.gov.jo/EBV4.0/Root_Storage/EN/strategies/Final_Transport_Sector_2024-2028_ENG-v3.pdf (accessed on 1 June 2026).
  77. Economic Modernization Vision. Economic Modernization Vision: Unleashing Potential to Build the Future. 2022. Available online: https://www.jordanvision.jo/img/vision-en.pdf (accessed on 1 June 2026).
  78. Ministry of Environment. Annual Reports. Available online: https://www.moenv.gov.jo/EN/List/Annual_Reports (accessed on 1 June 2026).
  79. Ministry of Transport. Annual Reports. Available online: https://www.mot.gov.jo/En/List/Ministry_Reports (accessed on 1 June 2026).
  80. Ministry of Energy and Mineral Resources. Annual Reports. Available online: https://memr.gov.jo/En/List/Annual_Reports (accessed on 1 June 2026).
  81. Energy Efficiency 2024—Analysis—IEA. Available online: https://www.iea.org/reports/energy-efficiency-2024 (accessed on 1 June 2026).
  82. Greater Amman Municipality. Amman, Jordan. Available online: https://media.ammancity.gov.jo/ (accessed on 1 June 2026).
  83. Energy Sector Stable as Jordan Maintains Fuel Reserves Amid Crisis. MEMR|Jordan Times. Available online: https://jordantimes.com/news/ (accessed on 1 June 2026).
  84. Long, K. XMQ6127AGW. 2025. Available online: https://www.king-long.com/col29/1264 (accessed on 1 June 2026).
  85. Eggleston, H.S.; Buendia, L.; Miwa, K.; Ngara, T.; Tanabe, K. 2006 IPCC Guidelines for National Greenhouse Gas Inventories. 2006. ISBN 4-88788-032-4. TRN: JP07CC058. Available online: https://www.osti.gov/etdeweb/biblio/20880391 (accessed on 1 June 2026).
  86. Cummins|A Global Power Technology Leader. Available online: https://www.cummins.com/en-na (accessed on 1 June 2026).
  87. Europe Hydrogen Fueling Station Market Size, 2034. Available online: https://www.marketdataforecast.com/market-reports/ (accessed on 1 June 2026).
  88. King Long Rolls Out a 12-Meter Hydrogen Fuel Cell City Bus_News_chinabuses.org. Available online: https://m.chinabuses.org/news/11486.html (accessed on 1 June 2026).
  89. National Green Hydrogen Strategy for Jordan, Studies and Statistics—Minister of Energy and Mineral Resources. Available online: https://memr.gov.jo/En/List/Studies_and_Statistics (accessed on 1 June 2026).
  90. Jordan Petroleum Refinery CO.LTD. Available online: https://www.jopetrol.jo/default/en (accessed on 1 June 2026).
  91. International Energy Agency. World Energy Outlook 2024. In Proceedings of the IEA; IEA: Paris, France, 2024; pp. 95–127. Available online: https://www.iea.org/reports/world-energy-outlook-2024 (accessed on 1 June 2026).
  92. GlobalPetrolPrices.com. Jordan Diesel Prices: Historical Data 2016–2025. 2025. Available online: https://www.globalpetrolprices.com/Jordan/diesel_prices/ (accessed on 1 June 2026).
  93. U.S. Energy Information Administration. Short-Term Energy Outlook; EIA: Washington, DC, USA, 2026. Available online: https://www.eia.gov/outlooks/steo/ (accessed on 1 June 2026).
  94. World Bank. Inflation, Consumer Prices (Annual %)—Jordan. World Development Indicators. 2025. Available online: https://data.worldbank.org/indicator/FP.CPI.TOTL.ZG?locations=JO (accessed on 1 June 2026).
Figure 1. Hydrogen refueling stations by region 2020–2024 [52].
Hydrogen 07 00099 g001
Figure 2. Overview of FCEB design. * Heating, Ventilation, and Air Conditioning.
Hydrogen 07 00099 g002
Figure 3. Schematic configuration of FCEBs.
Hydrogen 07 00099 g003
Figure 4. GHG emissions from the Jordanian transport sector compared to total emissions for the period (2010–2021).
Hydrogen 07 00099 g004
Figure 5. Percentage of the transport sector’s consumption of final energy for the period 2020–2024.
Hydrogen 07 00099 g005
Figure 6. (Left). The population growth in Amman for the period (2004–2025). (Right). The share of daily transport services.
Hydrogen 07 00099 g006
Figure 7. Jordan Bus rapid transit routes.
Hydrogen 07 00099 g007
Figure 8. Methodology flow chart for Amman-Zarqa BRT hydrogen FCEB integration.
Hydrogen 07 00099 g008
Figure 9. Growth of annual hydrogen demand under gradual integration of FCEBs across the milestone years 2030, 2035, and 2040.
Hydrogen 07 00099 g009
Figure 10. Reference-case avoided diesel tailpipe CO2 emissions under equivalent-duty FCEB replacement.
Hydrogen 07 00099 g010
Figure 11. Comparison of net operational fuel-cost savings under the constant diesel-price reference and the central 4% annual diesel-price escalation scenario.
Hydrogen 07 00099 g011
Table 1. Quantitative indicators of regional energy disruptions in Jordan’s energy market.
ParameterPre-Crisis LevelCurrent Level
LNG import price ($/MMBtu)728
Daily treasury burden (MJD/day)-2.5
Strategic Petroleum Reserve (days of supply)30–6030–60
Power generation reserve (days)~30~30
Table 2. Baseline data for the Amman-Zarqa BRT system.
IndicatorValue
Number of buses64
Average daily distance per bus (km/day)480
Total fleet distance (km/day-km/year)30,720–11,212,800
Diesel consumption per bus (L/day)130
Diesel consumption intensity (L/km)0.271
Total diesel consumption (L/day-L/year)8320–3,036,800
Diesel tailpipe CO2 emission factor (kg CO2/L)2.67
Total diesel tailpipe CO2 emissions (tCO2/day–tCO2/year)22.2–8108.3
Fuel cost per bus ($/day)134.42
Total fuel cost ($/day–$/year)8602.88–3,140,051.2
Note: The diesel tailpipe emission factor is a generic direct-combustion planning factor derived from IPCC default fuel-combustion data and a representative diesel net calorific value. It is not a Jordan-specific fuel-characterization measurement.
Table 3. Reference-case hydrogen demand under equivalent-duty FCEB replacement in the BRT fleet, 2030–2040.
ParameterFCEB Share
(%)
Fleet SizeNumber of Diesel BusesNumber of FCEBsH2 Demand
(kg/Day)
H2 Demand
(t/Year)
Year
203010%70637302.4110.38
15%705911475.2173.45
25%705218777.6283.82
203510%75678345.6126.14
15%756411475.2173.45
25%755619820.8299.59
204010%80728345.6126.14
15%806812518.4189.22
25%806020864.0315.36
Note: Fleet sizes in 2030, 2035, and 2040 are derived from the illustrative assumption of one additional BRT bus per year stated in Section 5. They are not GAM ridership forecasts or validated fleet-growth projections.
Table 4. Reference-case avoided diesel tailpipe CO2 emissions under equivalent-duty FCEB replacement, 2030–2040.
ParameterFCEBs Share (%)Diesel Tailpipe CO2 Emissions (t/Year)Avoided Diesel Tailpipe CO2 Reduction (t/Year)
Year
10%7981.6886.8
203015%7474.81393.6
25%65882280.4
10%8488.31013.5
203515%8108.31393.6
25%7094.32407.6
10%9121.81013.5
204015%86151520.3
25%7601.52533.8
Table 5. Summary of H2, diesel, and total fuel costs of FCEB BRT system fleet in years of 2030, 2035, and 2040.
ScenarioFCEBs Share (%)Diesel Cost (M$/y)H2 Fuel Cost (M$/y)Total Fuel Cost (M$/y)
10%3.0910.6623.753
203015%2.8951.0413.935
25%2.5511.7034.254
10%3.2870.7574.044
203515%3.1401.0414.181
25%2.7481.7984.545
10%3.5330.7574.289
204015%3.3361.1354.472
25%2.9441.8924.836
Table 6. Hydrogen-price sensitivity of operational fuel costs under constant diesel pricing.
ScenarioFCEBs Share(%)H2 Price ($/kg)Diesel Price ($/L)Diesel-Only Fuel Cost (M$/y)Mixed Fleet
Fuel Cost (M$/y)
Net Savings
(M$/y)
Savings (%) *
10% 3.534−0.098−2.85
203015%41.0343.4373.59−0.154−4.47
25% 3.688−0.252−7.32
10% 3.542+0.14+3.81
203515%21.0343.6823.489+0.193+5.25
25% 3.348+0.334+9.06
10% 3.661+0.267+6.79
204015%11.0343.9273.528+0.4+10.18
25% 3.261+0.667+16.97
* Positive Net Savings indicate that the mixed-fleet costs less than the all-diesel reference; negative values denote a cost premium. Note: The hydrogen-price values are illustrative operational fuel-price inputs. They do not represent calculated Levelized Cost of Hydrogen values, confirmed future prices in Jordan, or detailed delivered-hydrogen prices for a fully engineered Aqaba-to-Amman supply chain.
Table 7. Reference values and author-defined diesel-price escalation sensitivity cases.
ReferenceTime HorizonImplied CAGRCalibration Role
IEA world energy outlook 2024 [91]25 years0.94%Lower bound
Global petrol price [92]2 years43%Upper bound
EIA Short-Term Energy Outlook 2026 [93]1 year31.1%Near-term pressure
World Bank/Jordan macroeconomic data [94]55 years5.6%Macroeconomic baseline
This study2025–20402%Lower diesel-price escalation sensitivity
This study2025–20404%Central geopolitical-stress sensitivity
This study2025–20406%Higher diesel-price escalation sensitivity
Note: The 2%, 4%, and 6% rates are author-defined deterministic sensitivity cases. They are not direct forecasts derived from an individual source.
Table 8. Operational fuel-cost sensitivity under alternative diesel-price trajectories.
Panel A. Central 4% annual diesel-price escalation trajectory.
ScenarioFCEBs Share (%)H2 Price ($/kg)Diesel Price ($/L)Diesel-only fuel cost (M$/y)Mixed fleet
fuel cost (M$/y)
Net savings
(M$/y)
Savings (%)
10% 4.204−0.023−0.56
203015%41.2584.1814.218−0.037−0.88
25% 4.241−0.06−1.44
10% 5.121+0.329+6.04
203515%21.5315.454.998+0.452+8.3
25% 4.669+0.782+14.34
10% 6.492+0.581+8.22
204015%11.8627.0736.201+0.872+12.32
25% 5.62+1.453+20.54
Panel B. Diesel-price escalation sensitivity for the fixed 2040, 25% FCEB reference case.
Annual diesel-price growthDiesel price in 2040 ($/L)Diesel-only fuel cost (M$/year)Mixed-fleet fuel cost (M$/year)Net savings (M$/year)Savings (%)
0%, constant-price reference1.0343.9273.261+0.667+16.97
2%, lower sensitivity1.3925.2864.280+1.006+19.03
4%, central sensitivity1.8627.0735.620+1.453+20.54
6%, higher sensitivity2.4789.4127.375+2.038+21.65
Note: Panel B uses the fixed 2040, 25% FCEB reference case, including 20 FCEBs, annual hydrogen demand of 315.36 tH2/year, a hydrogen price of $1/kgH2, and equivalent-duty replacement assumptions.
Table 9. Hydrogen-consumption sensitivity for the 2040, 25% FCEB reference case U = 1.00 .
Hydrogen Consumption RateHydrogen Demand (kgH2/Day)Annual Hydrogen Demand (tH2/Year)Avoided Diesel Tailpipe CO2 Emissions (tCO2/Year)
0.08 kgH2/km768.0280.322533.8
0.09 kgH2/km, reference864.0315.362533.8
0.1 kgH2/km960.0350.402533.8
Table 10. Operational-utilization sensitivity for the 2040, 25% FCEB reference case 0.09   k g H 2 / k m .
Operational-Utilization Factor, U InterpretationAnnual FCEB Service Distance (Million km/Year)Hydrogen Demand (kgH2/Day)Annual Hydrogen Demand (tH2/Year)Avoided Diesel Tailpipe CO2 Emissions (tCO2/Year)
0.50Partial duty-cycle allocation1.752432.0157.681266.90
0.75Partial route or duty-cycle allocation2.628648.0236.521900.35
0.90Reduced annual service intensity3.154777.6283.822280.42
1.00Reference equivalent-duty replacement3.504864.0315.362533.80
1.10Higher-service stress case3.854950.4346.902787.18
Table 11. Operational fuel-cost sensitivity to hydrogen price for the 2040, 25% FCEB reference case.
Hydrogen Price ($/kgH2)Annual Hydrogen Demand (tH2/Year)Mixed-Fleet Fuel Cost (M$/Year)Net Savings Relative to All-Diesel Fleet (M$/Year)Interpretation
6.00315.364.838−0.911High-price reference case
4.00315.364.207−0.280Moderate-price case
3.11315.363.9270.000Operational fuel-cost break-even
2.00315.363.576+0.351Low-cost case
1.00315.363.261+0.667Exploratory low-cost case
Disclaimer/Publisher’s Note: The statements, opinions and data contained in all publications are solely those of the individual author(s) and contributor(s) and not of MDPI and/or the editor(s). MDPI and/or the editor(s) disclaim responsibility for any injury to people or property resulting from any ideas, methods, instructions or products referred to in the content.