Article

Influence of HRS Parameters During a Direct or Serial Sampling Event to Determine Hydrogen Fuel Quality


1
National Physical Laboratory (NPL), Hampton Road, Teddington, Middlesex TW11 0LW, UK
2
ZBT, Zentrum für BrennstoffzellenTechnik, Carl-Benz-Str. 201, 47057 Duisburg, Germany
3
SINTEF Industry, Richard Birkelandsvei 2b, 7034 Trondheim, Norway
4
Research Institutes of Sweden AB (RISE), Frans Perssons väg, 412 76 Göteborg, Sweden
*
Author to whom correspondence should be addressed.
Hydrogen 2026, 7(3), 97; https://doi.org/10.3390/hydrogen7030097
Submission received: 29 May 2026 / Revised: 28 June 2026 / Accepted: 7 July 2026 / Published: 15 July 2026

Abstract

Hydrogen sampling is an essential part of ensuring reliable and accurate hydrogen fuel quality for expanding heavy-duty vehicle applications. Hydrogen sampling at refuelling stations is highly sensitive to operational conditions, especially temperature, pressure, storage homogeneity, and nozzle-purging procedures. The direct sampling method operates with a hydrogen fuelling station in maintenance mode and requires that parameters be set properly. This study investigated the impact of temperature, pressure, storage bank selection, and venting on hydrogen sample quality. This study shows that hydrogen sampling at refuelling stations is strongly influenced by operational parameters, with temperature and pressure mainly affecting the water content while other contaminants remain largely stable; storage bank composition and insufficient nozzle purging can also significantly bias results through contamination or non-representative sampling. To ensure reliable measurements, this study recommends conducting sampling under representative operational conditions, including matching the delivery temperature and nominal delivery pressure, verifying storage homogeneity, and applying adequate nozzle-purging procedures. However, further validation across different systems is still needed.

1. Introduction

The current growth of hydrogen infrastructure for heavy-duty transport is followed by the implementation of regulatory requirements, especially those related to hydrogen fuel quality [1]. Although the fuel quality specification is the same for both light-duty (LD) and heavy-duty (HD) applications, the refuelling conditions of LD or HD applications can be significantly different regarding the hydrogen flow rate, temperature, and pressure [2]. Hydrogen fuel dispensed by a hydrogen refuelling station (HRS) to fuel cell electric vehicles (FCEV) must be compliant with national or international requirements, such as EN 17124:2022 [1] in Europe, SAE J2719:2020 [3] in North America, or ISO 14687:2025 [4] worldwide. The quality of the hydrogen fuel is mostly required at the custody transfer point between the provider and the end user, which is the nozzle receptacle interface. Despite the rapid development of online analysers, spot sampling is currently the only option available for assessing hydrogen fuel compliance at the HRS nozzle for all the contaminants specified by prevailing standards. Spot sampling refers to the collection of hydrogen fuel in dedicated sampling cylinders, which are subsequently transported to a laboratory for analysis. This approach allows the hydrogen quality to be assessed by a specialised analytical laboratory equipped to perform accurate, precise, and traceable measurements. Such laboratories typically possess a wide range of advanced analytical instruments suitable for comprehensive impurity analysis [5], enabling accurate analysis down to nmol/mol or pmol/mol with a robust and traceable quality system that is in line with the requirements of ISO 21087 [6], ISO 17025 [7], and ISO 14687:2025 [4].
The spot sampling method requires sampling from the HRS nozzle in challenging conditions, including temperature (from ambient temperature down to −40 °C), pressure (up to 87.5 MPa), and flow rate variations (up to 120 g/s). Two different sampling strategies are used: parallel and direct/serial, as described in the literature [8] and standard ISO 19880-9 [9]. The parallel sampling strategy performs hydrogen sampling on a tee during a normal FCEV refuelling event, following the normal filling protocol according to SAE J2601 [10]. The direct/serial sampling strategy (referred to as methods B and C in ISO 19880-9 [9]) collects samples directly from the dispenser nozzle into a sampling cylinder without following an FCEV filling protocol. As a result, the HRS must be operated in maintenance mode, and all operating parameters, such as pressure, flow rate, temperature, and storage bank selection, must be set manually by the operator. This approach allows for many possible variations in these parameters [11], and currently, there is limited information in the literature on the specific conditions used for such sampling despite the fact that several operators employ this method [8,12,13]. Additionally, the sampling operators may need to purge a certain amount of hydrogen to obtain a sample representing the HRS and to avoid sampling residual gas in the pipeline close to the HRS nozzle. Often, the sampling system and HRS actions are merged, as per ASTM D7606 [13], which typically mentions 1 kg of hydrogen before taking a sample. However, there is limited evidence for such a value, which may be challenged for health and safety or emissions purposes.
Recent studies [8,14] have highlighted the influence of several HRS parameters on the amount fraction of impurities in hydrogen fuel. For instance, Enakonda et al. [15] reported a potential variation in the water amount fraction associated with differences in delivery temperature, while Dietrich et al. [14] emphasised that both storage bank configuration and temperature are critical parameters for ensuring equivalence between sampling systems used for hydrogen fuel analysis.
The objective of this work is to investigate the variations in hydrogen fuel quality during direct sampling as a function of the operational parameters that can be adjusted by HRS operators, namely, the delivery temperature, pressure, venting, and storage bank selection, in order to support the ISO 19880-9 [9] standardisation effort.
Understanding the influence of HRS parameters on direct sampling and on the resulting hydrogen fuel sample composition is essential, particularly because the direct sampling strategy requires HRS operation in manual settings, and no guidance is currently available in the literature. This could lead to a biased sample (e.g., HRS parameters changing the composition of the sample) and inequivalence between sampling strategies and sampling events. As direct sampling is one of the most used sampling methods worldwide, the importance of taking a representative sample is essential, as important decisions (e.g., public access for refuelling) are based on the outcomes of the hydrogen quality assessment.
To achieve this, this study focuses on systematically testing several HRS parameters (temperature, pressure, storage bank, and venting) using the same sampling system (NPL DirSAM [15]) and the same analytical laboratory (NPL). This approach minimises variability in the results and ensures that any observed differences are attributable solely to the HRS parameters.
Based on the results obtained, a harmonised HRS set of parameters is discussed to enhance the equivalence of the hydrogen fuel sampled between the different direct sampling strategies. Finally, the discussion focuses on the impact of HRS parameters on fuel quality and the need for further standardisation and validation to ensure worldwide equivalence.

2. Materials and Methods

2.1. Representative Sampling System: NPL Hydrogen Direct Sampling Apparatus (NPL DirSAM)

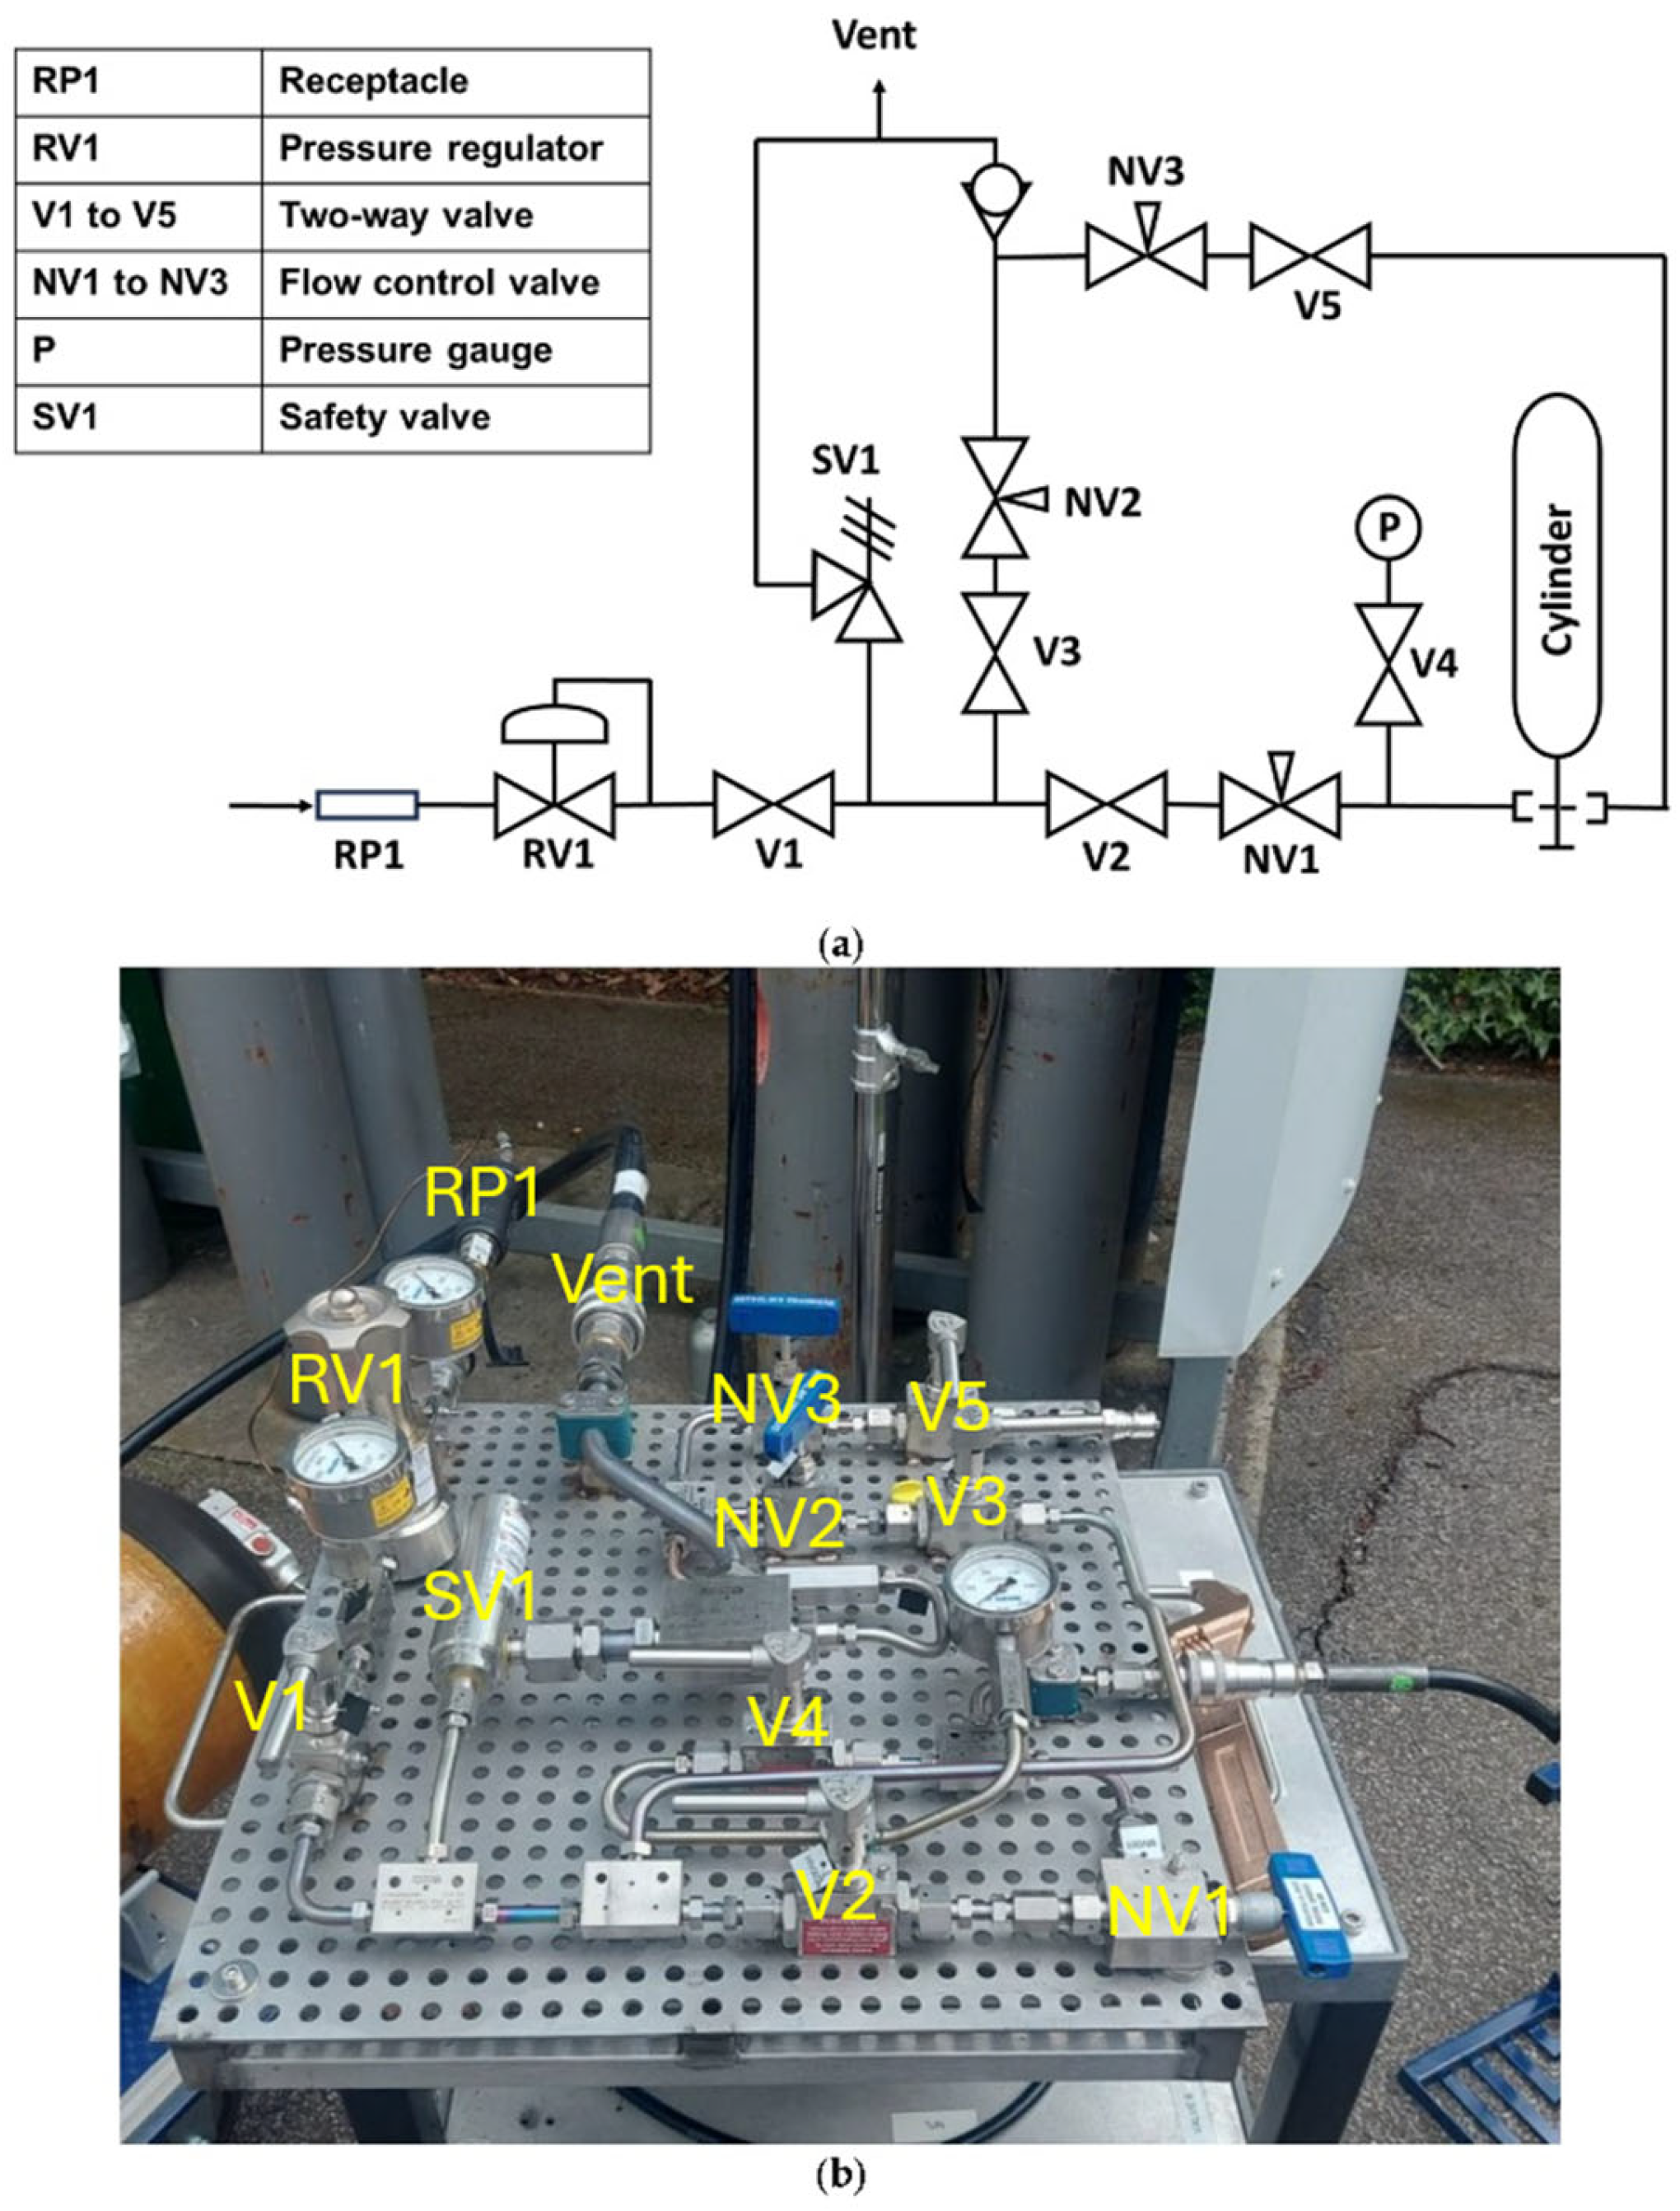
As described by Enakonda et al. [15], the NPL DirSAM follows a serial or direct sampling strategy in terms of the flow path (see Figure 1). The HRS needs to be in manual operation mode to realise the sampling. The HRS nozzle is connected to the sampler through high flowrate (HF) receptacle 1, indicated as RP1, with part number TN1 H2 HF (WEH, Illertissen, Bayern, DE). The pressure of the gas is reduced from the HRS input pressure down to 10 MPa by a regulator (TESCOM, Skelmersdale, UK). Then, a pressure relief valve (PRV) is present, with a relief pressure of 17.5 MPa.
The gas can then be vented through a portable vent, sampled into a 10 L aluminium cylinder (Luxfer, Nottingham, UK) with a double-ended DIN 477 no. 1 valve (Rotarex, Lintgen, LU), or flowed through the cylinder to a portable vent. The flexible hoses from the panel to the sampling cylinder are high-pressure wire polyamide hoses (product 2440N, Parker, Coventry, UK). Different cylinder passivation types (DBGold and Performax, Effectech, Uttoxeter, UK) were used for the sampling and were considered of equivalent stability for the following compounds investigated: total non-methane hydrocarbons, methane, carbon dioxide, carbon monoxide, nitrogen, helium, water, argon, and oxygen.
The standard purging procedure involves at least 30 purges (cycling between valves V1 and V3) and the flowing of the sample gas through valves V1 and V3 for 20 s (V1, V2, and V5 open). Additionally, venting and filling of the cylinder at 10 MPa was realised at least six times.

2.2. Experimental Setup for Impact of Temperature, Pressure, and Storage Tank

2.2.1. Hydrogen Refuelling Station (HRS)

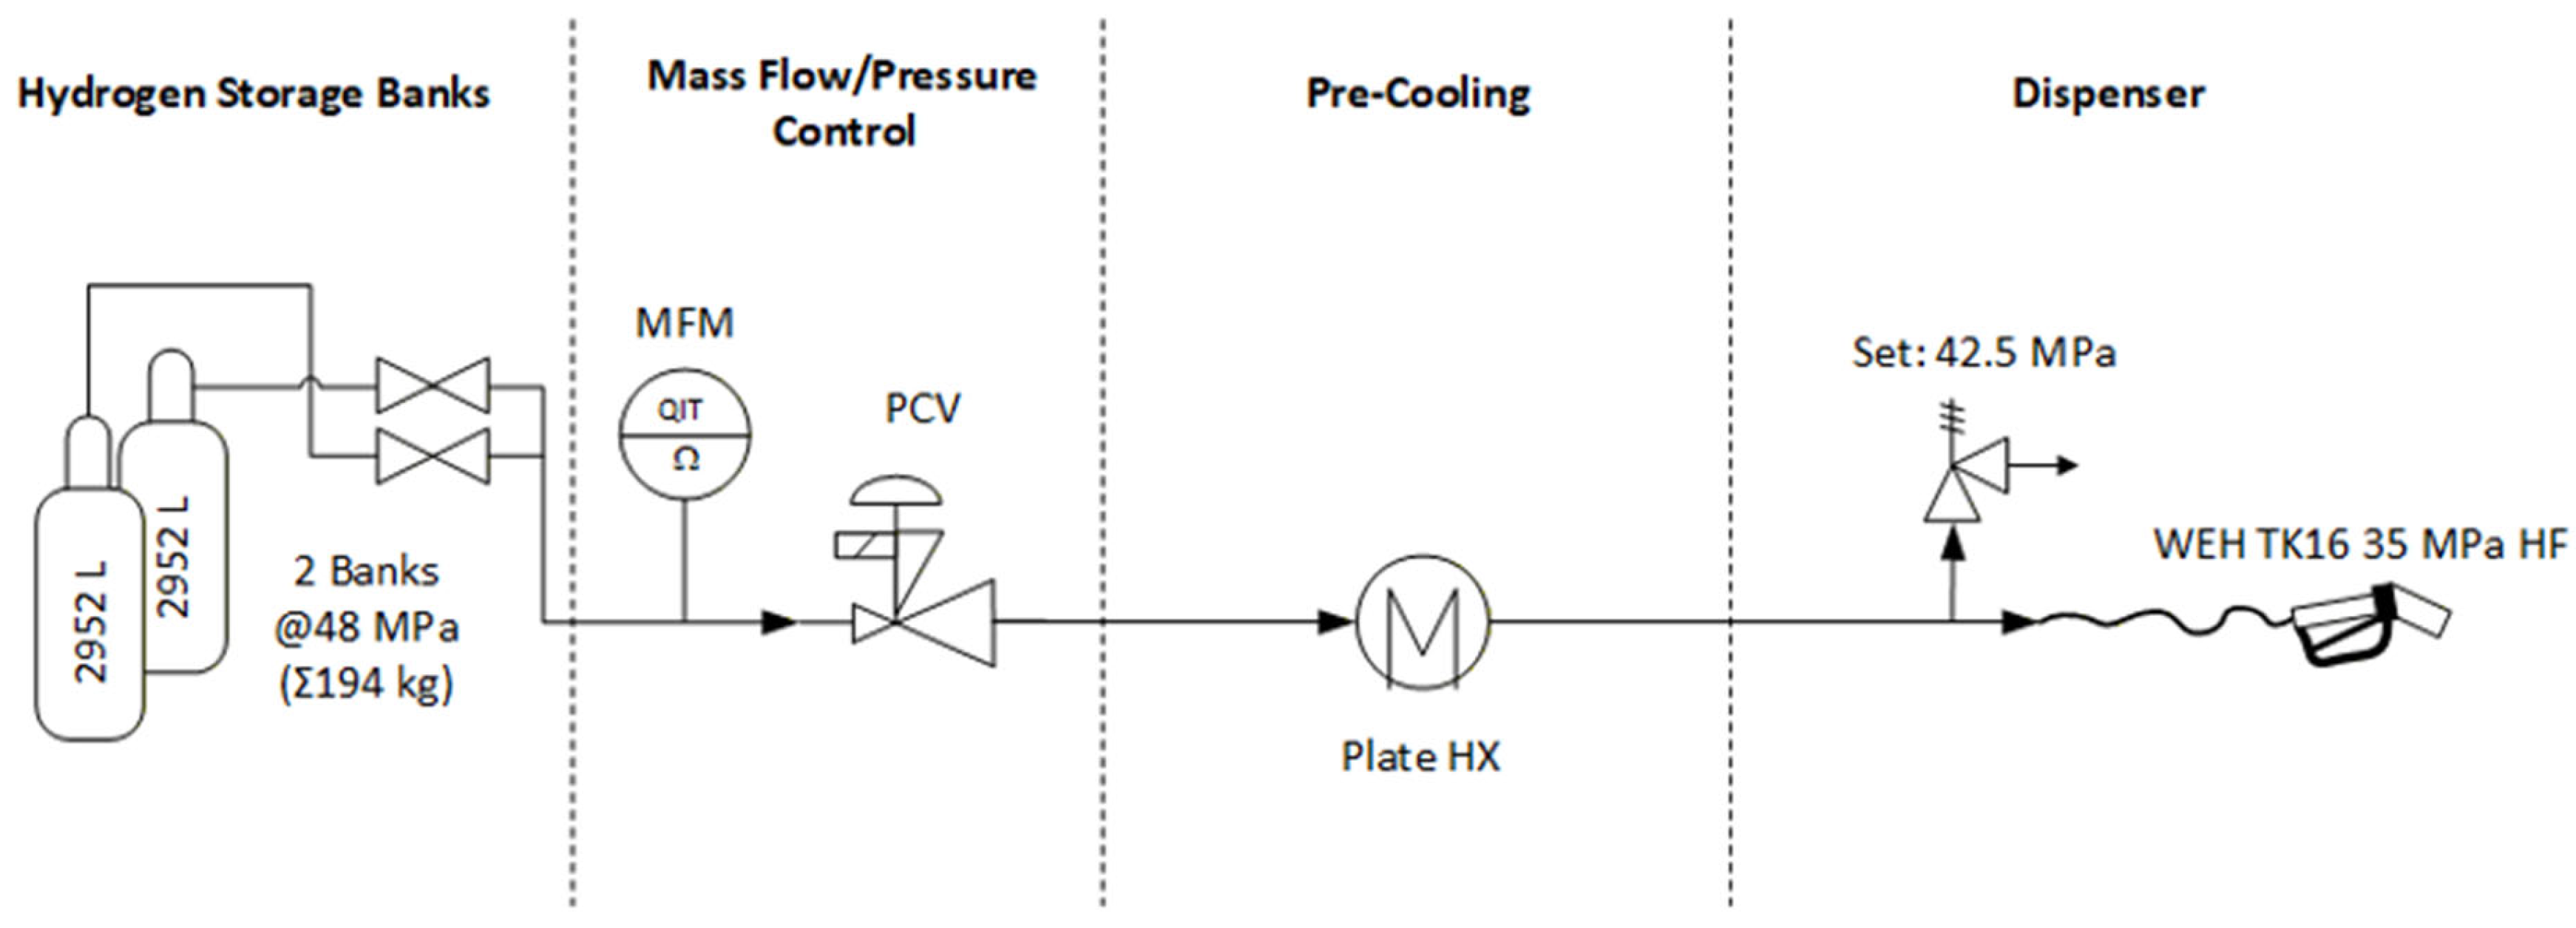
Sampling experiments were performed at ZBT’s HRS test field in Duisburg, Germany. The ZBT Hydrogen test field, located in Duisburg, Germany, was selected for several reasons, including its accessibility, its established experience with hydrogen sampling exercises during previous projects (notably 19ENG04 MetroHyVe 2), its suitable fuel composition, and its ability to modify HRS parameters such as the storage bank, flow rate, temperature, and delivery pressure. Additionally, the hydrogen dispensed at the station is known to contain measurable levels of selected impurities, which is advantageous for investigating variations in the contaminant amount fraction as a function of the HRS parameters. The test field was commissioned in 2017 and has a total hydrogen storage capacity of approximately 900 kg, distributed across storage banks at 30, 50 and 90 MPa. A simplified schematic of the refuelling line used in the test HRS is given in Figure 2.
Pre-cooling can be controlled between T40 (−33 to −40 °C), T30 (−26 to −33 °C), T20 (−17.5 to −26 °C), and T10 (−2.5 to −17.5 °C) up to ambient temperature (without pre-cooling), with a solid and plate heat exchanger available. Mass flow rates up to 70 g/s are possible. Refuelling can be performed at 70 MPa (LD) and 35 MPa (HD). Possible refuelling protocols are SAE J2601 [10,16], MC-Formular [17], PRHYDE [18], and “free” configurable. Within the European-funded RHeaDHy project [19], high-flow-rate infrastructure for 70 MPa heavy-duty hydrogen refuelling was installed, enabling peak mass flow rates of up to 300 g s−1. All the sampling tests were performed consecutively without any external events occurring in between.
After each refuelling occurrence, hydrogen is not released into the atmosphere but recycled back into the storage banks. Therefore, the ZBT HRS may have a noticeable amount fraction of several compounds, which is interesting for sampling intercomparisons. During the consecutive sampling events, the HRS’s parameters were monitored, and for each sampling, the operators set the HRS parameters.

2.2.2. Experimental Matrix

The experiments were conducted using the NPL DirSAM connected to the 35 MPa HF nozzle, with the HRS operated in maintenance mode. The parameters shown in Table 1 were applied to evaluate the influence of pressure, temperature, and storage bank within the same sampling day.

2.3. Experimental Setup for Impact of Nozzle Purge

2.3.1. Hydrogen Refuelling Station (HRS)

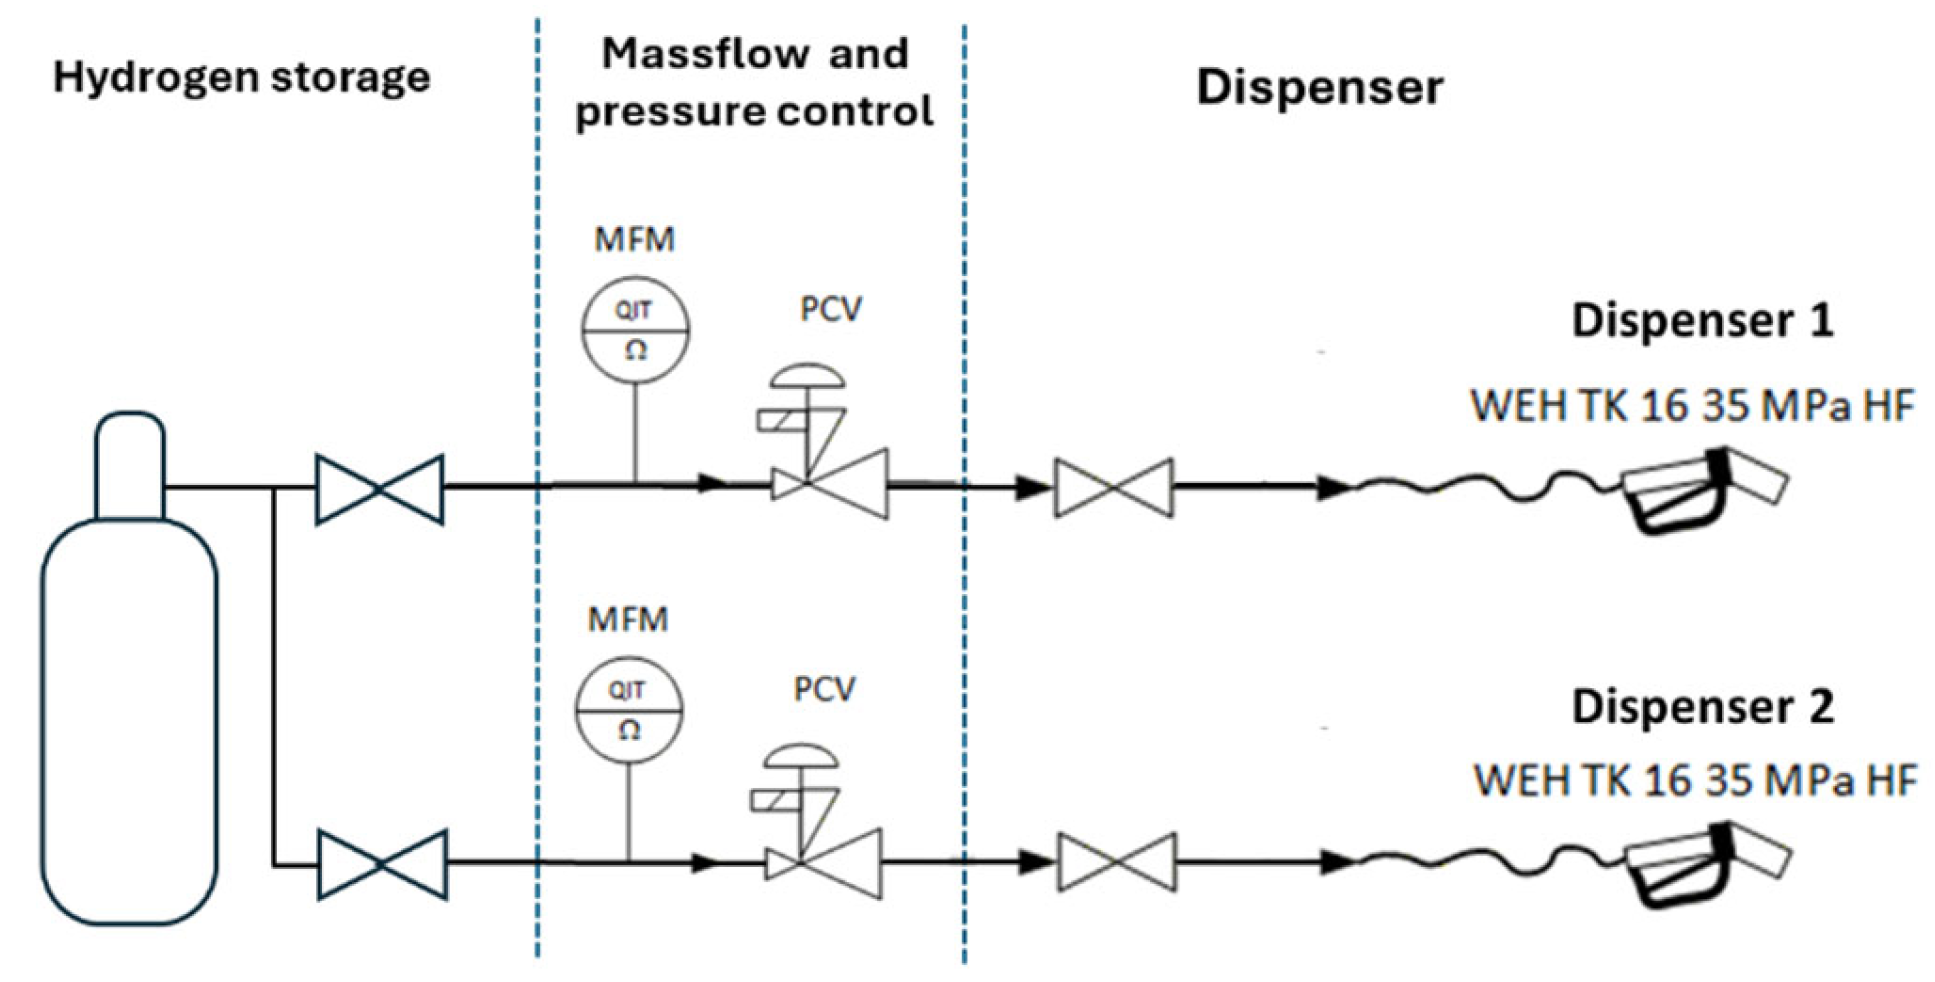
Sampling experiments were performed at a commercial HRS in Europe (location is not disclosed). A simplified schematic of the HRS is given in Figure 3. The HRS has on-site production and storage capacity (stored at 20 and 50 MPa). No pre-cooling was used for heavy-duty 35 MPa refuelling. Delivery was realised at ambient temperature (~15 °C). Mass flow rates up to 120 g/s are possible, whereas the average refuelling flow rate is around 30 g/s. Refuelling for 35 MPa (HD) was possible using two nozzles. For each sampling event, the operators set the HRS parameters.

2.3.2. Experimental Matrix

The experiments were performed using NPL DirSAM connected to the 35 MPa HF nozzle with the HRS in maintenance mode. The parameters presented in Table 2 were used to assess the impact of purging.
For this experiment, the NPL DirSAM followed the standard purge procedure on nozzle 1 to ensure that the sampling system was free from contaminants. Then, the system was kept at a low pressure (0.3 MPa), disconnected from nozzle 1, and connected to nozzle 2. Following this approach, it was feasible to determine the impact of nozzle purging independently without the influence of the sampling system purging.
For the sampling performed using the pressure pulse, the objective was to operate the NPL DirSAM with the gas delivered during a HRS’s pressure pulse (~70 g per pulse). Therefore, the purge procedure was halted after every pulse to disconnect and reconnect the nozzle to enable a new pulse.

2.4. Analytical Methods

The analyses were performed by NPL’s Hydrogen Testing Laboratory using NPL internal methods for all contaminants included in ISO 14687:2025 except particulate matter. NPL internal methods are ISO 17025 accredited for N2, O2, Ar, He, CO, CO2, CH4, total sulphur, and H2O. Analytical instruments were calibrated using NPL PRMs in H2 matrix gas. NPL gravimetric gas standards (NPL, Teddington, UK) and/or dynamic standards were used to generate calibration curves covering both the EN 17124:2022 and ISO 14687:2025 amount fraction thresholds and the measured values from the samples. The dynamic standards were prepared by dilution of NPL PRM (Teddington, UK) with high-purity hydrogen (BIP+ quality, Air Products, Chertsey, UK) using calibrated mass flow rate controllers (Bronkhorst, Veenendaal, NL). All data were examined so that no results were discarded without a valid technical reason. The calibration curve, results of analysis, and associated uncertainties were determined using NPL software XLGENline version 2 [20]. An expanded uncertainty using a k value of 2 was used for all results. In some cases, a more conservative uncertainty was derived from analytical expert knowledge. Analytical method details are provided in Supplementary Materials.

3. Results and Discussion

3.1. Impact of Temperature

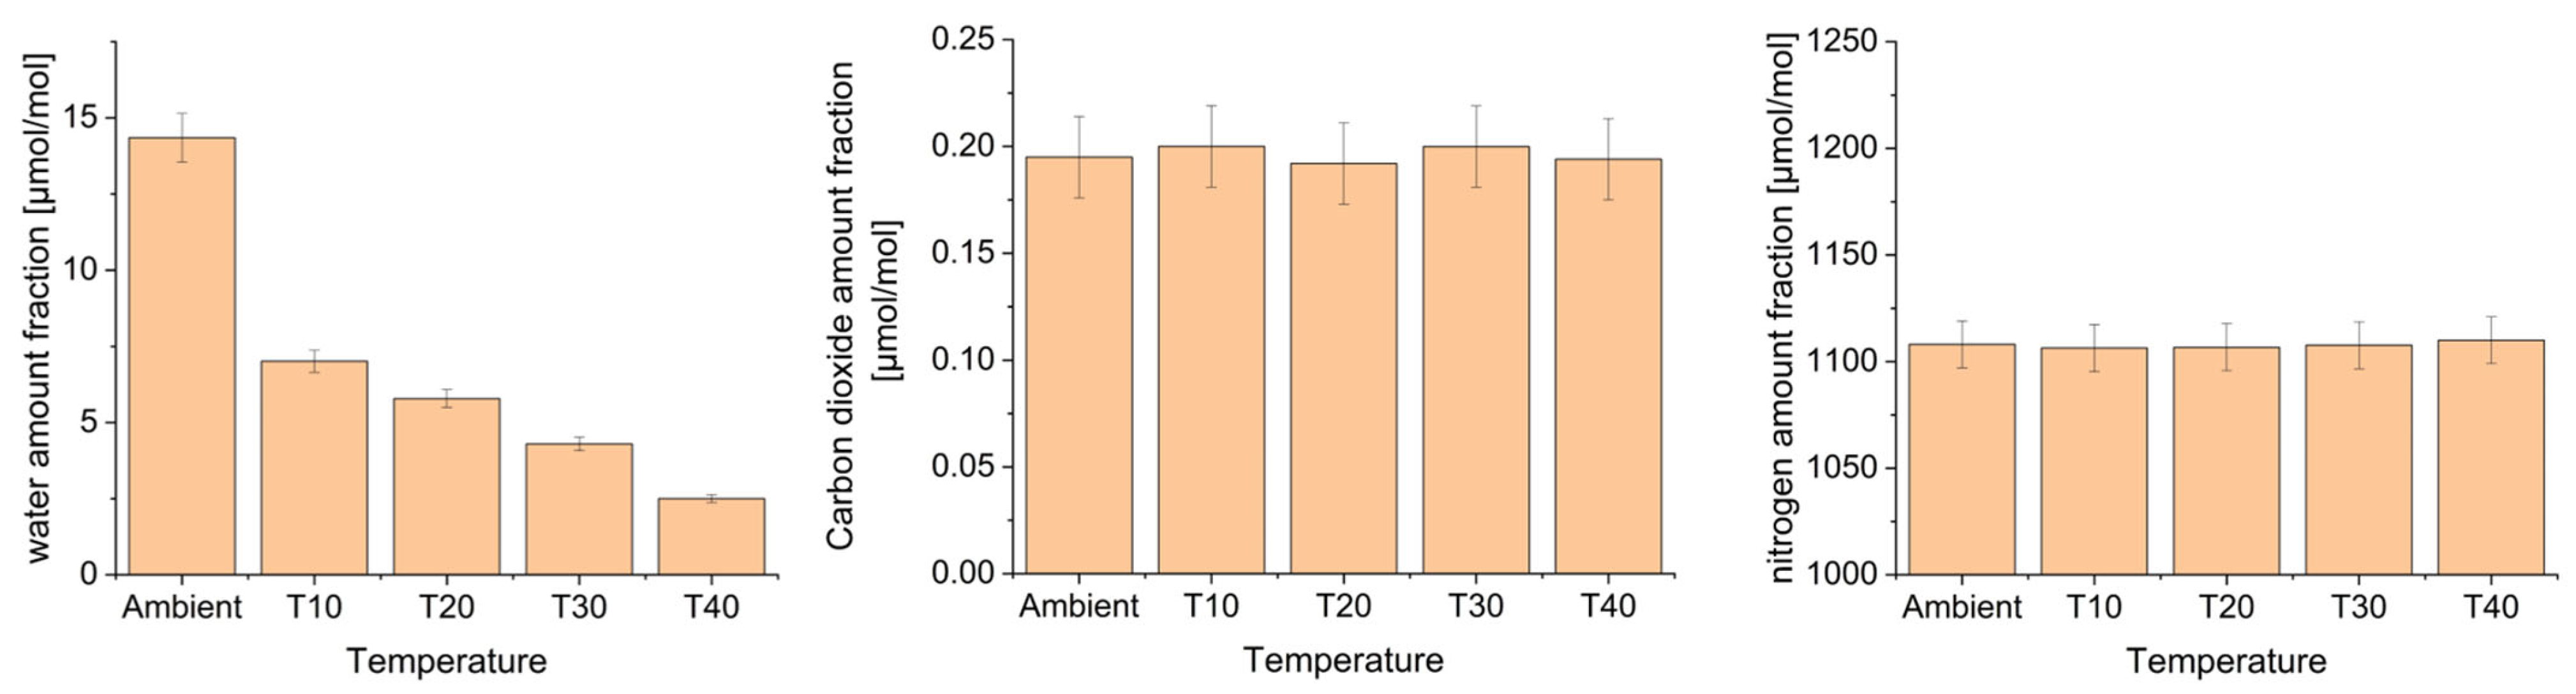
This study assessed the impact of the temperature of the gas for direct sampling from ambient down to T40 for several compounds, including total non-methane hydrocarbons, methane, carbon dioxide, carbon monoxide, nitrogen, helium, water, argon, and oxygen. For all compounds except water, no significant variation in measured amount fractions was observed (see Table A1). The water amount fraction decreased significantly as the temperature dropped (Figure 4). Nitrogen and carbon dioxide are presented in Figure 4 to provide contrast to the water results. The nitrogen amount fraction was not impacted by temperature variations between the ambient temperature and T40. In contrast, the behaviour of carbon dioxide may be affected by its thermodynamic properties, as low temperatures (below −10 °C) combined with high pressures (above 4 MPa) may bring CO2 into a liquid-phase state, thereby influencing its measured amount fraction. The results showed no changes in CO2 amount fraction due to the temperature changes.
The variation in water amount fraction was therefore the only variation observed and is supposed to be related to water condensation and trapping in the HRS system. At nominal pressure 35 MPa and for an amount fraction of approximately 14 µmol/mol, the water frost point is estimated to be around −20 °C. Therefore, it is coherent to observe a significant drop of water from ambient to low temperatures. Following thermodynamics, the evolution of the frost point as a function of temperature indicates that the amount fraction of water should follow the frost point evolution and therefore should be close to 0.5 µmol/mol at T40. However, there is no clear transition above and below the frost point but rather a gradual decay. The major variation that occurred was observed between ambient and below −10 °C. It may indicate that other parameters influence water behaviour (e.g., time in the heat exchangers or flow rate) and may affect the frost point, as the water amount fraction observed in the gas phase seemed higher than the expected value from frost point estimation. There is a clear correlation between the temperature and water amount fraction in hydrogen samples. Moreover, frozen water could be trapped in the heat exchanger in solid form or in piping following the temperature drops.
These results demonstrate a significant bias between the water amount fraction present in the HRS storage system and the actual amount fraction delivered to an FCEV. Therefore, the water amount fraction measured directly from the HRS storage is not considered representative and may provide an inaccurate basis for evaluating the water amount fraction supplied at the nozzle. Because this experiment used a direct sampling system, any solidified water particles, if not adsorbed by the HRS upstream, would have passed through the sampling system and reached the cylinder. As the cylinder was kept at ambient conditions, the gas had time to equilibrate with ambient conditions, and water to equilibrate within the gas phase. These results may be used in conjunction with possible issues related to heat exchanger challenges at a HRS.
Three points can be made: (1) Direct sampling should be carried out at the nominal delivery temperature of the HRS (if T40 filling, then the direct sampling should be performed at T40). Sufficient time is required for the gas to reach the relevant temperature. If the sampling procedure is short (i.e., if only a small volume is purged before sample collection), hydrogen gas may not have time to reach the actual temperature, and extra caution is required to achieve the relevant temperature. (2) The moisture level in high-pressure storage vessels (stored at ambient temperature) does not necessarily represent the moisture level in the hydrogen dispensed to the vehicle, especially regarding the impact of refuelling temperature. Even if such a measurement may be used for quality control, it may not reflect the amount fraction at the nozzle; therefore, sampling at the nozzle provides a more accurate determination. (3) As a significant amount of water may be trapped in the system due to pre-cooling, a system with a significant water amount fraction from production may require further investigation into the impact of water freezing on the heat exchangers (e.g., performance, maintenance, lifetime), especially when pre-cooling is used.

3.2. Impact of Pressure

Direct sampling systems are operated with the HRS in maintenance mode and therefore do not need to follow any pressure ramp. In practice, the pressure at which direct sampling is carried out is not fixed by international literature or standards. For example, ASTM D7606 [13] mentions a 6.9 MPa pressure or even lower pressure depending on the configuration of the hydrogen refuelling station. Since no comprehensive guidance exists regarding the optimal or required pressure, the present study evaluated three different pressure levels (6.9, 20, and 35 MPa), which are relevant pressures for heavy-duty HRS applications to understand how pressure might influence measured impurity concentrations.
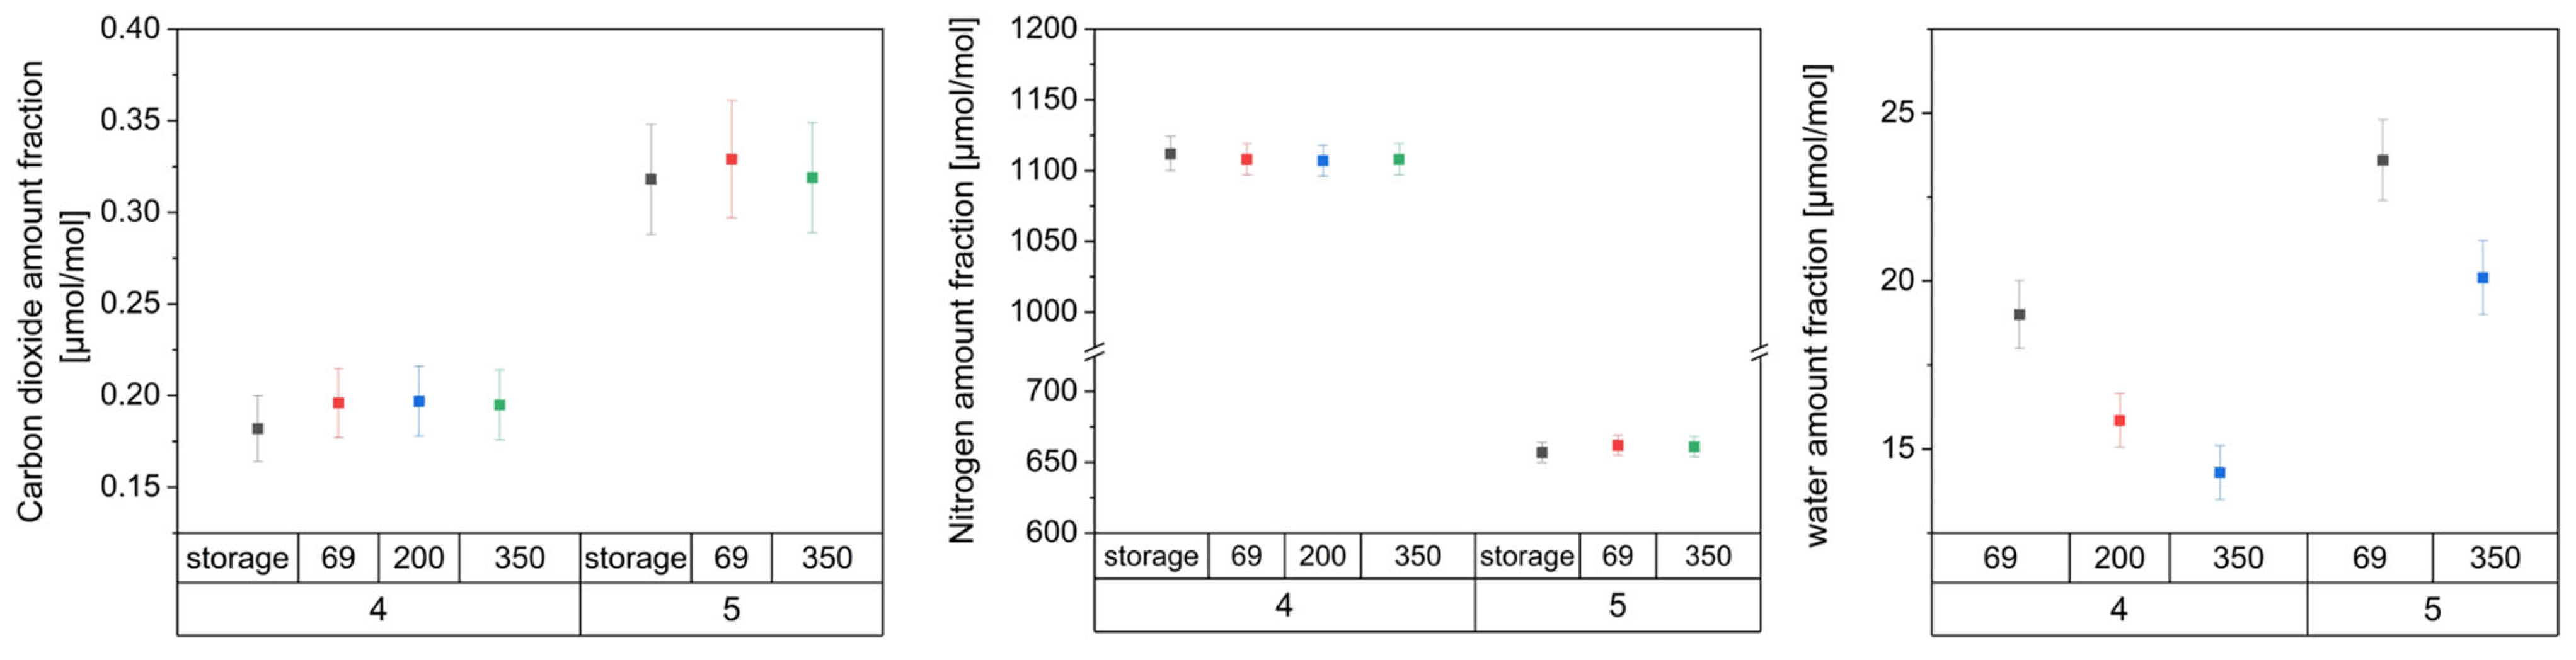
The results presented (Figure 5) show no significant differences between the sampling performed at the different pressures for total non-methane hydrocarbons, methane, carbon dioxide, carbon monoxide, nitrogen, oxygen, and helium (see Table A1).
A small but noticeable difference was observed for argon (~0.13 µmol/mol). However, this deviation is within the range of measurement uncertainty and may therefore not reflect a true pressure-dependent effect. Such a difference is considered negligible at the threshold value of the international standard for argon, which is 300 µmol/mol. The most pronounced variation was observed for water amount fractions, which show significant differences between low pressure (6.9 MPa) and higher pressures (20 and 35 MPa). The water amount fractions at 20 and 35 MPa are not significantly different from each other, even if the value at 35 MPa is lower, showing a downward trend in water amount fraction in hydrogen gas related to the HRS’s pressure. The difference may be explained by either the effect of pressure leading to higher water adsorption on the infrastructure or the efficiency of the purging/conditioning of the sampling system and flow path at a higher pressure (i.e., removal of residual water from dead volume). As the filling protocol would use higher-pressure gases to fill a FCEV, high-pressure sampling conditions (>20 MPa) are equivalent or more representative than low-pressure sampling conditions (6.9 MPa).
The recommendation would be to perform sampling at a pressure above 20 MPa. In practice, sampling should be carried out at the nominal filling pressure of the hydrogen refuelling station, either 35 MPa for HD-35MPa-HRS or 70 MPa for LD-70MPa-HRS as examples.

3.3. Impact of Storage Bank

The effect of storage bank selection may initially be considered negligible as hydrogen storage systems at HRSs are generally designed and engineered to be functionally equivalent and, therefore, no significant variation in impurity levels is expected to arise solely from differences between storage banks. For small-scale HRSs using a single cylinder bundle, it is probably correct. However, in large-scale operations, with multiple on-site storages and through a future variety of suppliers, storage banks may have different origins, ages, and histories. As the fuelling protocol optimises FCEV filling based on the pressure bank available, use of potentially different banks is a regular event (or the use of different banks during normal operation is a regular and expected event).
In this study, the impact of storage bank composition on the sampled gas was investigated at a research hydrogen refuelling station. It is important to note that the research HRS does not refuel vehicles or recycle hydrogen. Hydrogen composition differences between storage banks were expected due to research activities involving different banks and the lack of homogeneity between storage banks. The experiments included a comparison of HRS nozzle sampling when the hydrogen originated from different storage banks; specifically, bank 4 and bank 5.
The results presented in Figure 5 show no significant difference between the sampling realised at the different storage banks for total non-methane hydrocarbons, methane, and helium (see Table A1). For carbon dioxide, carbon monoxide, nitrogen, water, oxygen, and argon, a significant difference was observed between the sampling in storage banks 4 and 5. As the ZBT HRS is experimental, it is likely to exhibit greater variability between storage banks compared with a commercial HRS. The actual homogeneity of the hydrogen fuel in commercial mass production HRSs has not been extensively studied and would benefit from further study to determine the homogeneity between storage banks, transient if hydrogen quality varies from the production to provide more confidence in overall storage bank homogeneity. However, the experiment highlighted the importance of systematically identifying and recording which storage bank was used during each sampling event.
It is important to assess the supply chains of the HRSs to determine how homogeneous the hydrogen composition is across sites. The possibility of having different suppliers or supply chain elements delivered to a HRS may lead to diffusive mixing between the current storage composition and the newly delivered composition. In such a potential case, sampling of one specific storage may not represent the hydrogen fuel composition but only a fraction of the HRS. Therefore, the sampling may not be representative of HRS operations.
It is therefore recommended to coordinate with the HRS operator to ensure homogeneity of the storage bank. In addition, the specific storage bank used at the time of sampling should always be explicitly recorded.

3.4. Impact of Purging

Purging in a sampling exercise concerns two key aspects: the purging of the sampling system itself and purging to obtain a representative sample. While the purging of the sampling system is entirely dependent on the sampling system procedure (i.e., parts, number of connections, valves, flow path, pipe sizing, pressure, surface) [21], defining whether a minimum volume of hydrogen must be vented from the HRS prior to collecting a sample is important. HRSs do not operate with the same frequency or volume of dispensing activity.
As a result, the residence time of hydrogen near the nozzle can vary significantly, depending on how often the station is used. As direct sampling does not require any pressure pulse or significant flow rate into a FCEV or a mock-up tank, it may be possible to take a sample of gas from the supply line to the dispenser. It is important to understand how representative gas in the supply line is to the dispenser compared to gases transferred from HRS storage.
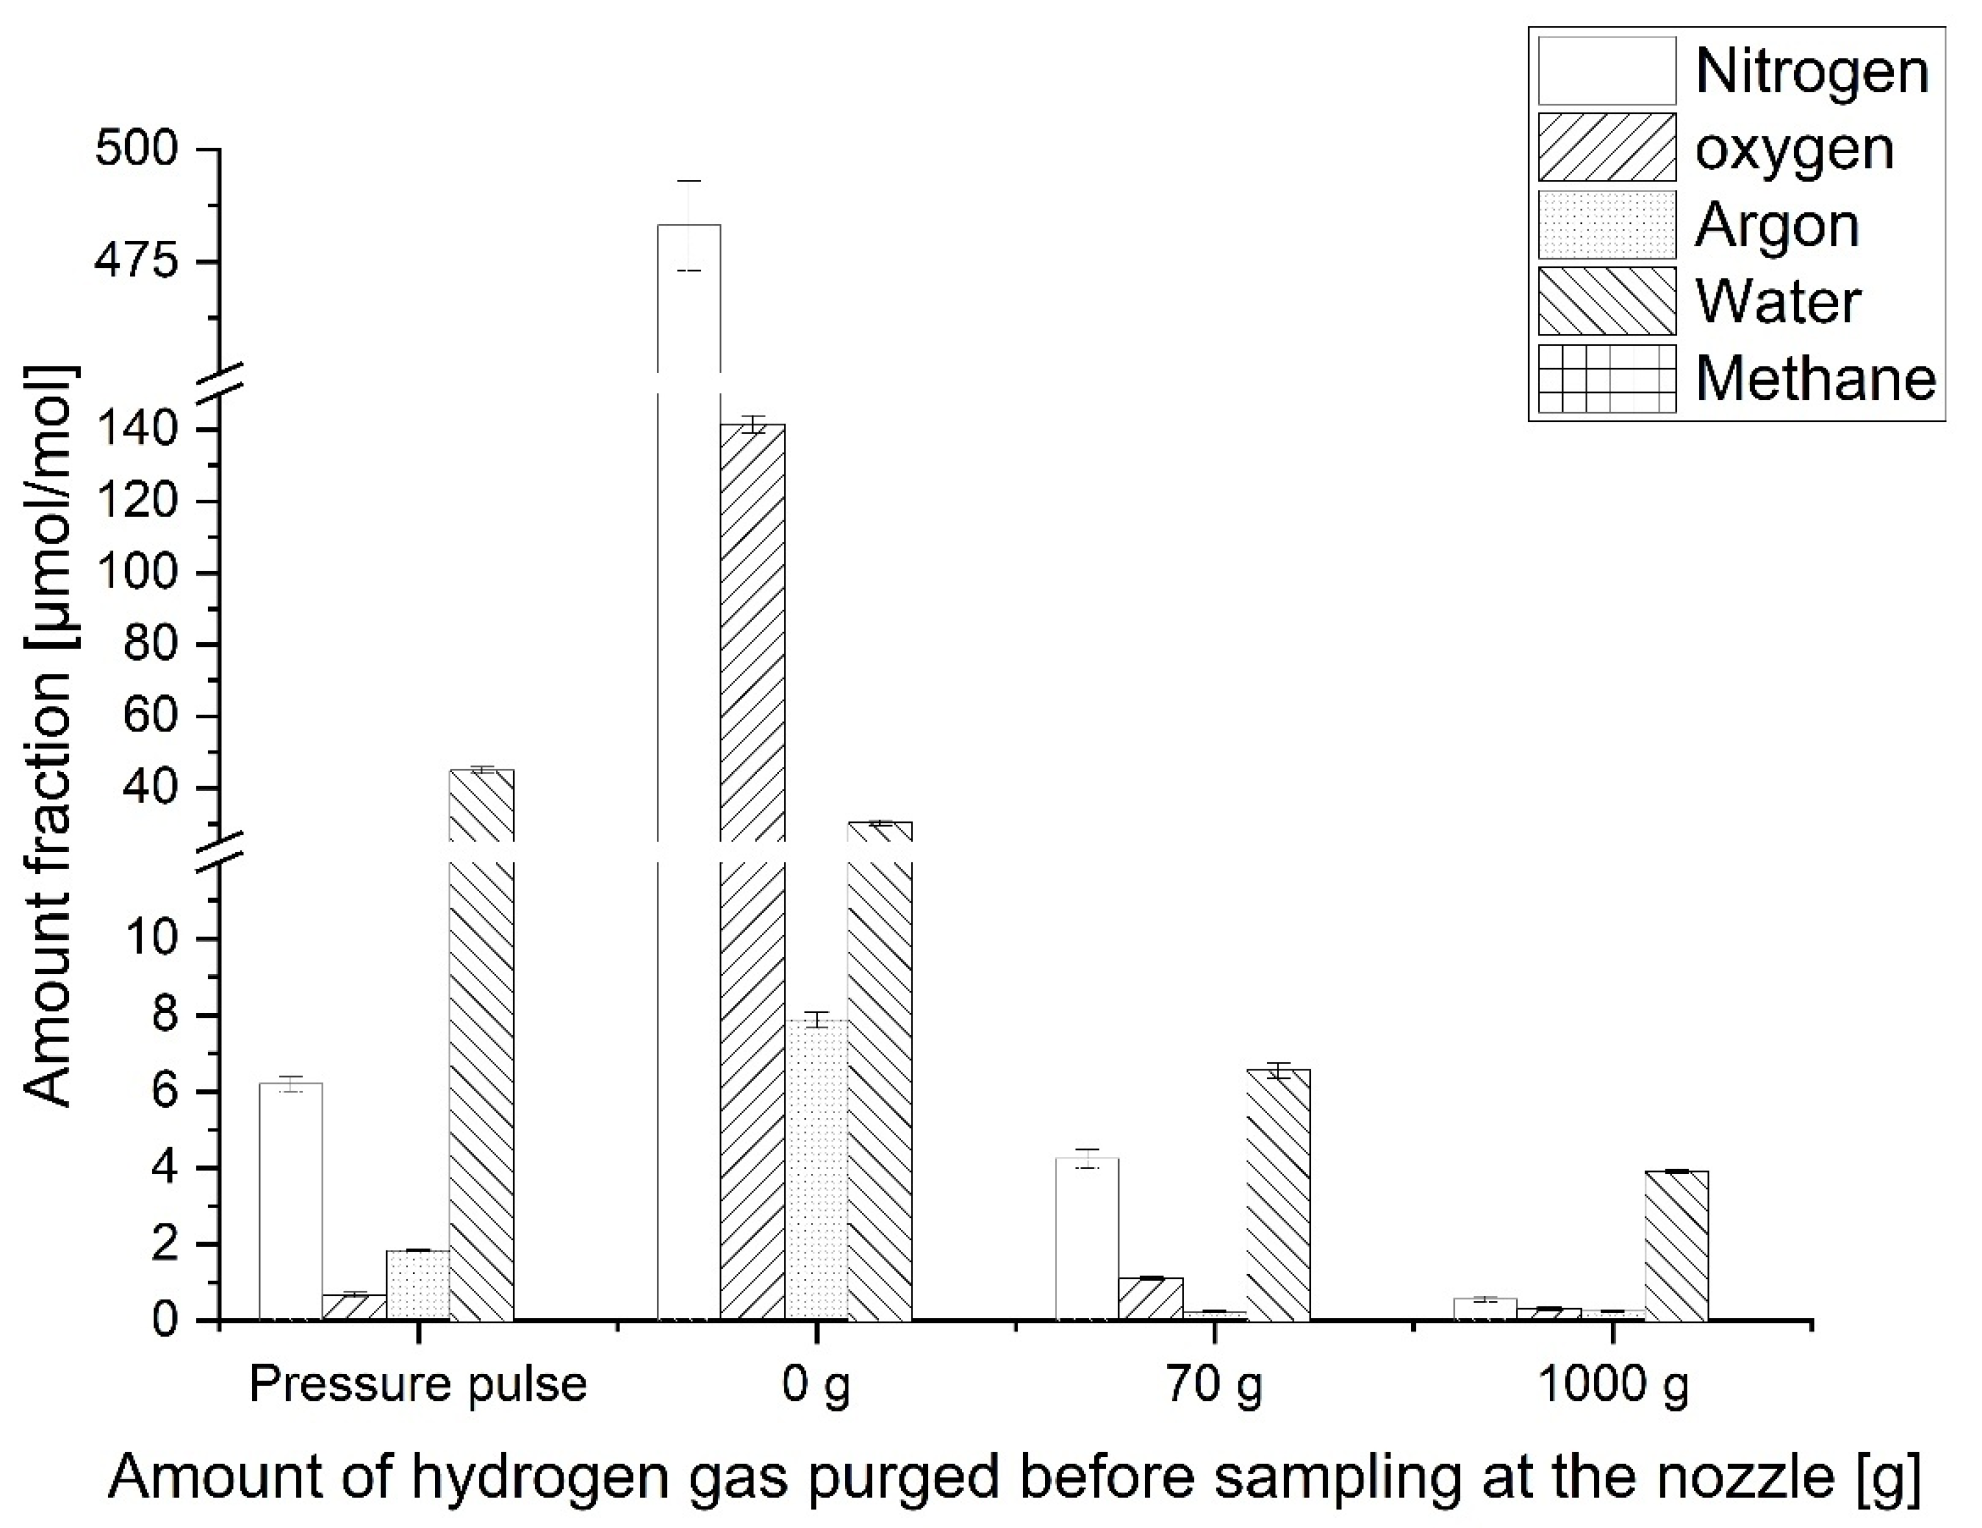
The experiment presented the evolution of total non-methane hydrocarbons, methane, carbon dioxide, carbon monoxide, nitrogen, water, oxygen, argon, and total sulphur halogenated as a function of the number of purges at the nozzle (see Table A2). The results showed that methane and halogenated compounds were not present in any case. Figure 6 shows that carbon monoxide, nitrogen, oxygen, argon, and carbon dioxide are all present when no purge of the nozzle is realised, indicating the presence of residual gases in the supply line to the dispenser.
As the number of purges increases, the measured concentrations of these contaminants decrease, demonstrating that purging effectively removes these non-representative gases remaining in the supply line to the nozzle. A HRS purge of 70 g presents results comparable to an extensive 1000 g purge for most compounds. However, the water amount fraction remained significantly biased between samples taken after 70 g and 1000 g HRS purges. In this case, the purge of 70 g leads to a hydrogen fuel sample that is non-compliant with ISO 14687, while after a 1000 g purge, the hydrogen fuel sample is compliant. The presence of residual air may be conceivable as a number of connections are made between the HRS nozzle and receptacle, which cannot be purged efficiently with only a 70 g of hydrogen gas.
The experiment highlights the presence of small amount fractions of sulphur and total hydrocarbons in the absence of HRS nozzle purging. The presence of such contaminants could be attributed to the fact that this specific nozzle remained unused for an extended period of time (several months), and some HRS components such as the gasket and O-ring could have permeated, releasing byproducts into the hydrogen present in this part of the HRS. It could hint at a potential additional contamination from stored gas in the supply line to the HRS nozzle. Further investigation on the impact of residual gas, permeation, and leaching of the gasket and O-ring should be related to the overall usage of the HRS, as a high number of refuelling events would reduce the residual time and the likelihood of the contaminant amount fraction increasing due to permeation or leaching.
The experiment highlighted the need for sufficient purging from the HRS nozzle prior to sampling hydrogen fuel. The experiment showed that a purge mass of 70 g may be a minimum for most compounds, except for water, in which case, a larger amount of up to 1000 g may be necessary.
The use of the HRS test pulse as a means to perform sampling with a direct sampling system was explored as a potential way to avoid the need for a dedicated HRS operator to configure all parameters. During the start of a refuelling event, the pressure pulse can deliver hydrogen to the direct sampling system. The HRS will determine that the serial sampling system cannot be refilled as it is not a FCEV. However, the amount of gas delivered (~70 g) is obtained without the need for an operator or maintenance mode. By relying on the HRS to deliver repeated pressure pulses, it becomes possible to complete the full sampling sequence, including purging the sampling system and filling a sampling cylinder to 10 MPa. This experiment confirmed that sample collection is technically feasible on a commercial HRS.
However, the results differ from those obtained using the standard direct sampling method, in which the sampling system remains continuously connected to the HRS throughout the procedure. For most measured parameters (methane, carbon dioxide, carbon monoxide, nitrogen, water, oxygen, argon, total sulphur, and halogenated compounds), no significant differences were observed compared with the samples taken using a 1000 g purge. Nonetheless, several notable discrepancies were identified.
Nitrogen, oxygen, and argon amount fractions are higher than expected; this may be due to some air ingress (supported by the observation that, in both the zero and 80 g purging cases, the N2/O2 ratio remains between 3 and 4, which is consistent with ambient air) or due to incomplete purging caused by multiple connections and disconnection of the nozzle and receptacle.
The water amount fraction is significantly higher, which is probably related to an issue with proper purging of water from the connections.
Total non-methane hydrocarbons were detected, which may be associated with contaminants introduced during repeated manipulation of the nozzle, such as grease, lubricants, or other external sources.
Although using the pressure pulse method is technically possible, the experiment highlights several challenges, particularly in controlling water amount fractions that compromise sample representativeness. For these reasons, this approach is not recommended for obtaining a reliable and representative hydrogen sample.

3.5. Impact on HRS Operation

This study demonstrated that several HRS operational parameters influence the delivered fuel composition. Consequently, HRS operations and fuel dispensing conditions can directly affect the final quality of hydrogen. In the context of sampling and compliance with ISO 14687 and ISO 19880-9, establishing clear and standardised guidelines for HRS operators is essential to ensure that all relevant parameters are accurately reported and that collected hydrogen samples are truly representative. Such guidelines would help ensure that each direct sampling event is both accurate and reliable, thereby increasing operator confidence in the resulting hydrogen quality assessments. The ongoing work within ISO 19880-9 remains critical for achieving this harmonisation and providing robust guidance for direct sampling procedures across different HRSs.
The above experimental results also emphasise the effect of temperature on the water amount fraction in hydrogen and highlight the potential risks to heat exchangers when hydrogen contains elevated water levels. A better understanding of water amount fraction variations as a function of pressure and temperature in hydrogen gas would be needed, especially in terms of fundamental physicochemical mechanisms governing phase behaviour and impurity partitioning. It is therefore important for HRS operators to evaluate and manage the water amount fraction prior to the pre-cooling step to mitigate risks associated with water accumulation in the heat exchanger.
Hydrogen storage homogeneity is another key consideration, particularly for stations supplied by multiple producers or stations operating with several storage banks. A thorough understanding of hydrogen delivery logistics and feedstock mixing behaviour is required to assess the degree of compositional uniformity within the storage system. While interconnections between storage banks can help equilibrate the composition on site, the complexity and design limitations of individual HRSs may restrict full homogenisation. Because sampling provides only a snapshot of the system, it may not capture the variability across all storage units. Therefore, operators should maintain an awareness of their overall supply chain and potential inhomogeneities. When uncertainty exists, or when multiple suppliers are used, sampling from multiple storage banks may be advisable.

4. Conclusions

This study presents a robust assessment of the influence of the HRS parameters for direct sampling of hydrogen fuel. This study investigated the impacts of temperature from ambient to T40; pressure, from 6.9 to 35 MPa; storage bank; and nozzle purging on the hydrogen fuel composition. This study identified that temperature and pressure mostly affect the water amount fraction, while other contaminants are not significantly affected. Storage bank composition is critical, especially if the HRS does not have homogeneous hydrogen between storage banks, such as for the ZBT experimental HRS (banks 4 and 5). The HRS nozzle purge is essential to avoid air and water contamination (which would lead to an overestimation of these compounds and a possible false conclusion of non-compliance being drawn) and a potential increase in contaminants in hydrogen gas close to the nozzle in case of low HRS usage.
To achieve representative direct sampling, it is therefore recommended to (1), ensure storage bank homogeneity with the operator and specifically record the storage bank used for the sampling; (2) sampling should be performed at the nominal delivery temperature of the HRS (if T40 filling, then the direct sampling should be performed at T40) and allow sufficient time for the gas to reach the temperature; (3) perform sampling at a pressure at least above 20 MPa, with the recommendation of using the nominal filling pressure of either 35 MPa for HD-35MPa-HRS or 70 MPa for LD-70MPa-HRS as examples; (4) avoid using the pressure pulse, and (5) ensure a minimum of 70 g purged from the nozzle, with this ideally being closer to 1000 g.
Further studies are required to validate these recommendations using other sampling systems.

Supplementary Materials

The following supporting information can be downloaded at: https://www.mdpi.com/article/10.3390/hydrogen7030097/s1, presenting additional details on analytical methods.

Author Contributions

Conceptualization, T.B., K.A., T.A.A. and M.F.; methodology, A.S.O.M., S.K., L.R.E., M.F., O.S.K., T.A.A. and T.B.; formal analysis, M.D., A.S.O.M., S.K. and L.R.E.; investigation, L.R.E., T.A.A., M.F., O.S.K. and T.B.; data curation, T.B., L.R.E. and T.A.A.; writing—original draft preparation, T.B.; writing—review and editing, A.S.O.M., S.K., L.R.E., M.D., M.F., O.S.K., K.A. and T.A.A.; visualisation, T.B. and M.F.; supervision, T.B., T.A.A. and K.A.; project administration, T.B. and K.A.; funding acquisition, K.A. All authors have read and agreed to the published version of the manuscript.

Funding

This project (22NRM03 MetHyTrucks) has received funding from the European Partnership on Metrology, co-financed by the European Union’s Horizon Europe Research and Innovation Programme and by the participating states. Funder name: European Partnership on Metrology. Funder ID: 10.13039/100019599. Grant number: 22NRM03 MetHyTrucks. NPL’s contribution to this work was partially funded by the UK Government’s Department for Science, Innovation and Technology through the UK’s National Measurement System programmes.

Data Availability Statement

The original contributions presented in this study are included in the article/Supplementary Material. Further inquiries can be directed to the corresponding author.

Acknowledgments

Microsoft copilot for Microsoft® Word for Microsoft 365 MSO (Version 2604) was used to generate the first version of the article abstract. The abstract was reviewed and amended by the authors. No other GenAI was used for this article.

Conflicts of Interest

Author Ole Sigmund Kjos and Thor Anders Aarhaug were employed by the company SINTEF Industry, author Karine Arrhenius was employed by the company Research Institutes of Sweden AB (RISE). The remaining authors declare that the research was conducted in the absence of any commercial or financial relationships that could be construed as a potential conflict of interest.

Appendix A

Table A1. The Results of Analysis for the Experimental Study for Impact of Temperature, Pressure, and Storage Tank. Uncertainties Are Provided with k = 2. NMHC Means Total Non-Methane Hydrocarbons.
Temperature of Gas at NozzlePressure of SamplingStorage Bank UsedType of Al CylinderCylinder ReferenceCompounds Analysed
NMHCCH4CO2CON2HeH2OArO2
Measured Amount Fraction [µmol/mol]
n.a.n.a.Storage bank 4 only (not nozzle)DBGoldD2199940.0059 ± 0.0033<0.0050.182 ± 0.0180.0084 ± 0.00111112 ± 1228 ± 218.4 ± 11.961 ± 0.050.522 ± 0.09
n.a.n.a.Storage bank 5 only (not nozzle)DBGoldD2199760.0195 ± 0.0034<0.0050.318 ± 0.030.0095 ± 0.0011657 ± 727 ± 224.79 ± 1.32.011 ± 0.060.234 ± 0.06
Ambient69bank 4DBGoldD2199590.0186 ± 0.0032<0.0050.196 ± 0.0190.0087 ± 0.00111108 ± 1128 ± 2.319.01 ± 12.074 ± 0.050.271 ± 0.042
Ambient200bank 4DBGoldD2199530.0169 ± 0.0042<0.0050.197 ± 0.0190.0086 ± 0.00121107 ± 1127 ± 2.215.85 ± 0.82.065 ± 0.050.269 ± 0.043
Ambient350bank 5PerformaxD2968780.0266 ± 0.005<0.0050.319 ± 0.0300.0098 ± 0.0012661 ± 726 ± 2.920.1 ± 1.11.658 ± 0.050.358 ± 0.06
Ambient69bank 5DBGoldD2199630.0173 ± 0.0039<0.0050.329 ± 0.0320.0095 ± 0.0011662 ± 726 ± 2.123.6 ± 1.21.639 ± 0.050.351 ± 0.048
Ambient350bank4PerformaxD2968800.0137 ± 0.0034<0.0050.195 ± 0.0190.0089 ± 0.00121108 ± 1127 ± 2.714.3 ± 0.82.199 ± 0.060.226 ± 0.038
T10350bank4DBGoldD2199560.0177 ± 0.0036<0.0050.2 ± 0.0190.0089 ± 0.00121106 ± 1128 ± 2.67.01 ± 0.362.078 ± 0.050.251 ± 0.046
T20350bank4DBGoldD2199510.0094 ± 0.0029<0.0050.192 ± 0.0190.0088 ± 0.00111107 ± 1127 ± 2.55.79 ± 0.292.035 ± 0.050.174 ± 0.05
T30350bank4DBGoldD2199600.0168 ± 0.0033<0.0050.199 ± 0.0190.0089 ± 0.00121108 ± 1128 ± 1.94.3 ± 0.222.145 ± 0.050.248 ± 0.039
T40350bank4PerformaxD2968730.0127 ± 0.0033<0.0050.194 ± 0.0190.0092 ± 0.00121110 ± 1128 ± 1.92.5 ± 0.132.081 ± 0.050.232 ± 0.039
Table A2. Results of Analysis for the Experimental Study for Impact of Nozzle Purge. Uncertainties Are Provided with k = 2. NMHC Means Total Non-Methane Hydrocarbons.
Cylinder ReferencePurge Volume from the HRS NozzleNMHCCH4CO2CON2H2OO2ArSulphurHalogens
Amount Fraction
[µmol/mol]
Amount Fraction [nmol/mol]
D296876using pressure pulse0.098 ± 0.008<0.0200.0943 ± 0.0039<0.0226.19 ± 0.1844.83 ± 0.970.674 ± 0.071.838 ± 0.023<0.5<23
D2968780 g0.028 ± 0.009<0.0200.536 ± 0.0070.062 ± 0.007483 ± 1030.3 ± 0.8141.5 ± 2.47.87 ± 0.219.2 ± 1.0<19
D85362580 g<0.015<0.0200.0633 ± 0.0044<0.0224.24 ± 0.236.55 ± 0.211.115 ± 0.0430.244 ± 0.025<0.5<22
D8536281000 g<0.015<0.0200.0332 ± 0.0037<0.0220.56 ± 0.083.91 ± 0.0470.32 ± 0.0470.253 ± 0.026<0.5<20

References

  1. EN 17124:2022; Hydrogen Fuel. Product Specification and Quality Assurance. Proton Exchange Membrane (PEM) Fuel Cell Applications for Road Vehicles. European Committee on Standardisation: Bruxelles, Belgium, 2022.
  2. ISO 19880-1:2020; Gaseous Hydrogen—Fuelling Stations Part 1: General Requirements. International Organization for Standardization: Geneva, Switzerland, 2020.
  3. SAE J2719:202003; Hydrogen Fuel Quality for Fuel Cell Vehicles. SAE International: Warrendale, PA, USA, 2020.
  4. ISO 14687; Hydrogen Fuel Quality Product Specification. International Organization for Standardization: Geneva, Switzerland, 2025.
  5. Beurey, C.; Gozlan, B.; Carré, M.; Bacquart, T.; Morris, A.; Moore, N.; Arrhenius, K.; Meuzelaar, H.; Persijn, S.; Rojo, A.; et al. Review and survey of methods for analysis of impurities in hydrogen for fuel cell vehicles according to ISO 14687:2019. Front. Energy Res. 2021, 8, 615149. [Google Scholar] [CrossRef] [Scilit]
  6. ISO 21087:2019; Gas Analysis—Analytical Methods for Hydrogen Fuel—Proton Exchange Membrane (PEM) Fuel Cell Applications for Road Vehicles. International Organization for Standardization: Geneva, Switzerland, 2019.
  7. ISO 17025; General Requirements for the Competence of Testing and Calibration Laboratories. International Organization for Standardization: Geneva, Switzerland, 2017.
  8. Arrhenius, K.; Aarhaug, T.; Bacquart, T.; Morris, A.; Bartlett, S.; Wagner, L.; Blondeel, C.; Gozlan, B.; Lescornez, Y.; Chramosta, N.; et al. Strategies for the sampling of hydrogen at refuelling stations for purity assessment. Int. J. Hydrogen Energy 2021, 46, 34839–34853. [Google Scholar] [CrossRef] [Scilit]
  9. ISO 19880-9; Gaseous Hydrogen—Fuelling Stations Part 9: Sampling for Fuel Quality Analysis. International Organization for Standardization: Geneva, Switzerland, 2024.
  10. SAE J2601; Fueling Protocols for Light Duty Gaseous Hydrogen Surface Vehicles. SAE International: Warrendale, PA, USA, 2020.
  11. Arrhenius, K.; Büker, O.; Hultmark, S.; Bacquart, T.; Aarhaug, T.; Persijn, S.; van Workum, D.; Kaiser, S.; Dufond, M.; Basset, E.; et al. Parameters affecting the reliability of sampling during the assessment of the purity of hydrogen used as a vehicle fuel. Meas. Sens. 2025, 38, 101771. [Google Scholar] [CrossRef] [Scilit]
  12. Aarhaug, T.A.; Bacquart, T.; Daniels, C.; Adkins, A.; Wong, Y.; Chen, Z.; Madise, H.; Khaki, S.; Morris, A.S.; Clough, P.T.; et al. Hydrogen fuel sampling intercomparisons: Challenges in real-life experiments. Int. J. Hydrogen Energy 2025, 153, 150243. [Google Scholar] [CrossRef] [Scilit]
  13. ASTM D7606-17; Standard Practice for Sampling of High Pressure Hydrogen and Related Fuel Cell Feed Gases. ASTM International: West Conshohocken, PA, USA, 2017. [CrossRef] [Scilit]
  14. Dietrich, M.; Bacquart, T.; Morris, A.; Khaki, S.; Basset, E.; Rizand, M.; Carré, M.; Blondeel, C.; Chramosta, N.; Kvasnicka, A.; et al. Representative Hydrogen Sampling at Hydrogen Refuelling Stations: Interplay of Sampling Strategy and Station Parameters. Clean Technol. 2026, 8, 91. [Google Scholar] [CrossRef] [Scilit]
  15. Enakonda, L.R.; Bacquart, T.; Khaki, S.; Zhang, F.; Kerr, H.; Longhurst, B.; Morris, A.S.O. New Heavy-Duty Sampling System for Hydrogen Refuelling Stations—Comparison of Impact of Light-Duty Versus Heavy-Duty Sampling Techniques on Hydrogen Fuel Quality. Hydrogen 2025, 6, 35. [Google Scholar] [CrossRef] [Scilit]
  16. SAE J2601-5; high-Flow Prescriptive Fueling Protocols for Gaseous Hydrogen Powered Medium and Heavy-Duty Vehicles. SAE International: Warrendale, PA, USA, 2020.
  17. Kuroki, T.; Onorato, S.; Myhre, R. MC Formula Protocol for H35HF Fueling; National Renewable Energy Laboratory (NREL): Golden, CO, USA, 2025. [Google Scholar] [CrossRef] [Scilit] [PubMed]
  18. PRHYDE Consortium. PRHYDE Protocol for Heavy-Duty Hydrogen Refuelling; Clean Hydrogen Partnership; European Union: Brussels, Belgium, 2025; Available online: https://cordis.europa.eu/project/id/874997 (accessed on 22 May 2026).
  19. RHeaDHy Consortium. Refuelling Heavy Duty with Very High Flow Hydrogen (RHeaDHy). Available online: https://rheadhy.eu/ (accessed on 22 May 2026).
  20. Smith, I.M.; Onakunle, F.O. SSfM-3 1.6.1—XLGENLINE, Software for Generalised Least-Squares Fitting, Developed by the (NPL), Teddington, UK, NPL Document Reference: CMSC/M/06/657; National Physical Laboratory: Teddington, UK, 2007. [Google Scholar]
  21. Bacquart, T.; Moore, N.; Hart, N.; Morris, A.; Aarhaug, T.A.; Kjos, O.; Aupretre, F.; Colas, T.; Haloua, F.; Gozlan, B.; et al. Hydrogen Quality Sampling at the Hydrogen Refuelling Station—Lessons Learnt on Sampling at the Production and at the Nozzle. Int. J. Hydrogen Energy 2020, 45, 5565–5576. [Google Scholar] [CrossRef] [Scilit]
Figure 1. (a) Schematic of the hydrogen fuel sampling system using a direct sampling strategy used by the National Physical Laboratory (NPL) and referred to as NPL DirSAM. (b) Image of the NPL DirSAM sampling system from [15].
Hydrogen 07 00097 g001
Figure 2. Simplified scheme of ZBT HRS used during the pressure, temperature, and storage bank test.
Hydrogen 07 00097 g002
Figure 3. Simplified scheme of the HRS used during the purge test.
Hydrogen 07 00097 g003
Figure 4. Evolution of water, nitrogen, and carbon dioxide amount fractions in hydrogen fuel delivered by a HRS as a function of temperature (ambient, T10–T40).
Hydrogen 07 00097 g004
Figure 5. Evolution of water, nitrogen, and carbon dioxide amount fractions in hydrogen fuel delivered by a HRS as a function of the pressure set by the HRS operator and the storage bank used (4 and 5).
Hydrogen 07 00097 g005
Figure 6. Impact of number of purges on the amount fraction of nitrogen (blank bar), oxygen (left diagonal pattern bar), argon (dotted bar), water (right diagonal pattern bar), and methane (hatched fills bar) in the hydrogen sampled by direct sampling methods. Expanded uncertainties are provided with a k factor of 2.
Hydrogen 07 00097 g006
Table 1. Summary of the test matrix and parameters implemented for each pre-cooling (grey cells), pressure (yellow and red cells), and storage bank test (blue and green cells).
DescriptionTestSampling SystemPre-CoolingManual Pressure SettingMedium Storage Bank Reference
BankA1NPL DirSAM ambient6.9 MPanumber 4
A2NPL DirSAM ambient6.9 MPanumber 5
B1NPL DirSAM ambient35 MPanumber 4
B2NPL DirSAM ambient35 MPanumber 5
PressureC1NPL DirSAM ambient6.9 MPanumber 5
C2NPL DirSAM ambient35 MPanumber 5
D1NPL DirSAM ambient6.9 MPanumber 4
D2NPL DirSAM ambient20 MPanumber 4
D3NPL DirSAM ambient35 MPanumber 4
TemperatureE1NPL DirSAM ambient35 MPanumber 4
E2NPL DirSAM T1035 MPanumber 4
E3NPL DirSAM T2035 MPanumber 4
E4NPL DirSAM T3035 MPanumber 4
E5NPL DirSAM T4035 MPanumber 4
Table 2. Summary of the test matrix and parameters implemented for each purge test.
DescriptionSampling SystemPurging of Sampling SystemNumber of Purges on Nozzle 2Pre-CoolingManual Pressure SettingMedium Storage Bank Reference
Purge using pressure pulseNPL DirSAM Using pulse only on nozzle 210 purges of 70 g of H2AmbientpulseNumber 1
Nozzle purgeNPL DirSAM Standard on nozzle 1No purgeAmbient35 MPaNumber 1
Nozzle purgeNPL DirSAM Standard on nozzle 11 purge of 78 g of H2Ambient35 MPaNumber 1
Nozzle purgeNPL DirSAM Standard on nozzle 113 purges of 78 g of H2Ambient35 MPaNumber 1
Disclaimer/Publisher’s Note: The statements, opinions and data contained in all publications are solely those of the individual author(s) and contributor(s) and not of MDPI and/or the editor(s). MDPI and/or the editor(s) disclaim responsibility for any injury to people or property resulting from any ideas, methods, instructions or products referred to in the content.