Article

Mechanism and Energetics of Hydrogen Sulfide Thermolysis from Reactive Molecular Dynamics: Cutoff-Radius Effects, Thermochemically Validated Energy Costs, and the Elementary Reaction Network


by
Mariana Ramos-Estrada
1,
Cristian Aguilera-Torres
2,
Andrés Béjar-Vega
2,
Alfonso Lemus-Solorio
1 and
José L. Rivera
3,*
1
Department of Chemical Engineering, Universidad Michoacana de San Nicolás de Hidalgo, Morelia 58060, Michoacán, Mexico
2
Graduate Program in Environmental Engineering, Universidad Michoacana de San Nicolás de Hidalgo, Morelia 58060, Michoacán, Mexico
3
Department of Physico—Mathematical Sciences, Universidad Michoacana de San Nicolás de Hidalgo, Morelia 58060, Michoacán, Mexico
*
Author to whom correspondence should be addressed.
Hydrogen 2026, 7(3), 117; https://doi.org/10.3390/hydrogen7030117
Submission received: 20 July 2026 / Revised: 12 August 2026 / Accepted: 14 August 2026 / Published: 17 August 2026

Abstract

Hydrogen sulfide (H2S), a high-volume by-product of the hydrodesulfurization of fossil fuels, can be valorized by thermolysis to recover both molecular hydrogen and elemental sulfur, rather than being oxidized as in the conventional Claus process. The viability of this route depends on quantitative knowledge of the reaction mechanism and of the energy costs of dissociation, which are difficult to obtain experimentally at the temperatures involved. Here we study H2S thermolysis by reactive molecular dynamics (RMD) with the ReaxFF potential for systems of 1000 H2S molecules at 1 atm, addressing three coupled questions: the simulation parameters required for dilute gases, the energetics of dissociation, and the elementary reaction mechanism. The interaction cutoff radius proved critical: the original 10 Å value, parametrized for condensed systems, misses about 23 eV of attractive non-bonded interaction energy in the gaseous system at 298.15 K (≈0.023 eV per molecule) and fails to capture dissociation at 3000 K within 20 ns, whereas radii of 30–40 Å converge. Using a 40 Å cutoff at 2500, 3000 and 3500 K, atom-resolved species-transition records reveal a free-radical chain mechanism built from the same set of elementary steps at the three temperatures, whose relative contributions shift with temperature: S–H homolysis initiates the chain, hydrogen abstraction (H• + H2S → H2 + HS•) is essentially the exclusive source of H2 (persistent H• + H• recombination contributed only 1, 13 and 17 events, below 0.5% of the abstraction count), and a slow sulfur-condensation stage (S2 → S3 → S4) limits the net conversion, which reached 9.3 ± 0.9%, 26.3 ± 1.4% and 46.7 ± 1.6% within the simulated windows (single-trajectory counting resolution)—kinetically limited values, not equilibrium conversions. The enthalpy of the system rises linearly with the number of H2S molecules consumed (R2 ≥ 0.99), defining energy costs of 2.46 ± 0.04, 3.10 ± 0.08 and 3.95 ± 0.18 eV per molecule that increase with temperature by ≈1.48 eV per 1000 K; at 3500 K the cost lies between the 0 K complete-dissociation limit D0 = 3.90 eV derived from the experimental H–SH bond energy and the Kirchhoff-corrected complete-dissociation enthalpy at that temperature (4.11–4.12 eV), statistically indistinguishable from the latter (a 0.9σ difference). These results provide a thermochemically validated, molecular-level basis for engineering the valorization of residual H2S as a source of green hydrogen.

Graphical Abstract

1. Introduction

The transition toward sustainable energy systems requires simultaneously reducing pollutant emissions and developing clean energy vectors. Hydrogen sulfide (H2S) occupies a singular position in this context: it is at once one of the most problematic gaseous pollutants of the oil-and-gas industry and a potential source of hydrogen. Large volumes of H2S are produced during the sweetening of sour natural gas, in petroleum refining, particularly in hydrodesulfurization [1], in the anaerobic digestion of wastewater and organic waste [2], and in geothermal fields [3]. Its acute toxicity, comparable to that of cyanide, together with its corrosivity, makes it both an occupational and an environmental hazard. The dominant treatment, the Claus process, partially oxidizes H2S to recover elemental sulfur but converts the hydrogen of the molecule into water, discarding its energy value [4].
Above roughly 700 °C, H2S undergoes thermal decomposition—thermolysis—an endothermic, reversible reaction, H2S(g) ⇌ H2(g) + (1/n) Sn(g), with S2 the dominant sulfur vapor species [5]. The reaction is strongly endothermic and thermodynamically limited: at atmospheric pressure the equilibrium conversion does not exceed ~4.2% at 1000 °C and 1 atm, and it approaches 25% only above ~1350 °C and 1 atm [5]. Thermolysis thus offers a circular-economy alternative to the Claus process, recovering both sulfur and usable molecular hydrogen, but its viability depends on operating at elevated temperatures and on understanding the kinetics, the mechanism, and the energy costs of the reaction.
The kinetics of H2S thermolysis have been debated for decades. In the low-to-medium-temperature regime (800–1250 °C), tubular flow-reactor studies agree on a first-order dependence on H2S concentration, whereas in the high-temperature regime (2700–3800 K), shock-tube studies in the presence of an inert third body M report a second-order primary step, H2S + M → SH + H + M [6,7,8]. Karan and co-workers reconciled the high- and low-temperature data into a unified rate expression [7]. In thermal-plasma reactors, thermal dissociation dominates, with near-complete conversion reported around ~2400 K and 0.1 atm [9,10]. The identity of the initiation step has itself been controversial, with homolytic S–H fission [6,11] competing in the literature with a spin-forbidden molecular elimination to S(3P) + H2 [12,13]. We note at the outset that ReaxFF, the reactive potential used in this work, evolves on a single effective potential-energy surface and does not resolve electronic spin, so the spin-forbidden channel can be observed but not weighed quantitatively against experiment (Section 3.8). Yet, the molecular sequence of elementary steps—where exactly the H2 comes from, and which step limits conversion—cannot be resolved by macroscopic kinetics alone.
Reactive molecular dynamics (RMD) simulations with ReaxFF-type force fields allow the formation and breaking of chemical bonds to be observed atom-by-atom with femtosecond resolution [14,15,16], making them an ideal tool to address these questions where direct experimentation is complex. Their application to dilute gaseous systems, however, requires reconsidering the interaction cutoff radius of the potential, originally parametrized for condensed phases. There is thus a twofold knowledge gap—methodological, concerning the appropriate simulation parameters, and applied, concerning the mechanism and energy costs of H2S thermolysis. The present work addresses both within a single, internally consistent set of simulations: we first establish the cutoff radius and temperature window required for reliable dilute-gas RMD, then quantify the energy costs of dissociation and validate them against independent thermochemistry, and finally reconstruct the complete elementary reaction network with forward/reverse event counts for every step.

2. Materials and Methods

2.1. Reactive Molecular Dynamics with ReaxFF

Reactive molecular dynamics integrates Newton’s equations of motion for a system of N atoms, with forces obtained from an interatomic potential in which chemical connectivity emerges dynamically from the instantaneous atomic positions. This work employs the ReaxFF potential [15] in the parametrization of Zhang and van Duin, tuned to describe weak interactions between hydrocarbons and water [17]. This parametrization was chosen for three reasons. First, its parameter set contains the full S/H block inherited from the combustion branch of ReaxFF, including S–H and S–S bonded terms, while retraining the weak non-bonded interactions—the terms to which the dilute-gas energetics are most sensitive (Section 3.1). Second, the force field was probed directly for the S–H energetics: the optimized H2S monomer geometry (r(S–H) = 1.359 Å, ∠HSH = 98.7°) lies within 2% and 7° of experiment (1.336 Å, 92.1°), and fragment-based potential-energy differences—each species minimized in its own cell, so that charge equilibration keeps every fragment rigorously neutral—give first and second S–H dissociation energies of De = 4.69 and 4.81 eV, 14% and 27% above the experimental well depths (4.13 and 3.79 eV, obtained by adding the zero-point corrections to D0); this overbinding of the individual bonds partially cancels in the reaction enthalpies of the network, as evidenced by the direct agreement of the collective energy cost with the experimental thermochemistry (Section 3.3). Third, the parametrization is validated a posteriori by the properties on which the conclusions rest: the experimental gas density at 298.15 K (Figure 1), the thermochemically consistent energy cost at 3500 K (Section 3.3), and an initiation step and product spectrum consistent with shock-tube and plasma experiments (Section 3.4 and Section 3.5). In addition, two alternative sulfur-containing ReaxFF parametrizations—fitted for the mechanochemistry of organic disulfides [18] and for molybdenum disulfide [19]—were tested and failed to reproduce the experimental gas density of H2S at 298.15 K and 1 atm, presumably because they were trained on target systems far from a molecular gas; they were therefore discarded in favor of the present parametrization, the only one tested that passes this benchmark. No H2S-specific refit of the S–H parameters has been published to date; this limitation is noted in Section 3.8. ReaxFF describes the energy through the bond order, a continuous function of interatomic distance that tends smoothly to zero as atoms separate, so that all connectivity-dependent energy terms (bond, angle, torsion, over/under-coordination) decay continuously as a bond breaks, while van der Waals and Coulomb interactions act between all atom pairs. Partial charges are recomputed at each step by charge equalization (QEq) [20]. Simulations were run in LAMMPS version 22Jul25 [21] in the isothermal–isobaric (NPT) ensemble using the equations of motion of Shinoda and co-workers [22] (Nosé–Hoover-chain thermostat and barostat in the Martyna–Tobias–Klein formulation, isotropic cell coupling, with damping constants of 100 and 1000 integration steps—10 fs and 100 fs—for the thermostat and the barostat, respectively; this coupling acts on the global kinetic energy and the cell volume rather than on individual collision trajectories, and the validations of Section 3.1 and Section 3.3, Section 3.4 and Section 3.5 indicate that the reactive statistics are not conditioned by it). The integration time step was 0.1 fs, required for numerical stability of the dynamics and of the charge-equilibration solve at the highest temperature studied (3500 K), where the customary 0.25–0.5 fs ReaxFF time steps proved too coarse; at this time step the production trajectories comprise 1.5–1.8 × 10⁹ integration steps each, several months of continuous computation per run. Each system consisted of 1000 H2S molecules (3000 atoms) at 1 atm.

2.2. The Cutoff Radius for Dilute Gases

Both the connectivity-dependent and the non-bonded energy terms are truncated at a maximum interatomic distance, the cutoff radius (rC), with a seventh-order taper function ensuring that the energy and its first derivatives vanish continuously at rC. In condensed systems a cutoff of 10 Å, the value for which the ReaxFF potentials were originally parametrized [17,23,24] are sufficient to describe structural properties of condensed phases, but realistic calculations require the consideration of long-ranged electrostatic contributions [25]. Classical molecular dynamics simulations have shown that the accountability of long-ranged contributions are important to describe interfacial properties of systems interaction through Van der Waals and electrostatic + Van der Waals interactions [26,27]. In a dilute gas, the mean intermolecular distance can considerably exceed this radius, so a 10 Å cutoff may systematically exclude non-bonded interactions relevant to the thermodynamics and dynamics. No long-range electrostatic solver is applied: the shielded Coulomb interactions between the QEq charges are, like the dispersion terms, smoothly tapered to zero at rC, so that all interactions beyond rC are strictly absent from the model, and the choice of rC must reflect the intermolecular structure of the dilute gas. At 1 atm the mean volume per molecule corresponds to a characteristic spacing (V/N)1⁄3 of 34 Å at 298.15 K and of 70–78 Å at 2500–3500 K, and the mean nearest-neighbor distance of a random (ideal-gas) distribution, 0.554·(V/N)1⁄3, is ≈19 Å at 298.15 K and ≈39–43 Å at the reaction temperatures; a 10 Å cutoff thus excludes essentially all intermolecular pairs, whereas 40 Å spans the mean first-neighbor separation at all simulated temperatures. Cutoff radii of 10, 15, 18, 30 and 40 Å were therefore evaluated, first at 298.15 K against the experimental density [28], and then at 3000 K against the dissociation kinetics. All production runs used rC = 40 Å at 2500, 3000 and 3500 K, temperatures chosen to span the interval over which thermolysis is progressively activated; each was followed for 147–180 ns of effective chemistry after a 10 ns isothermal equilibration at 298.15 K and 1 atm; times are reported relative to the start of the reactive window. To quantify run-to-run variability at an affordable cost, five additional independent replicas of a smaller system (100 H2S molecules) were run at 3500 K and 1 atm, each prepared with an independent initial configuration and equilibration period (0.8–1.2 ns) before instantaneous heating, and followed for 25–27 ns of reactive chemistry (cell length ≈ 360 Å at 3500 K, an order of magnitude larger than rC); their statistics are compared with the production trajectory in Section 3.2.

2.3. Reconstruction of the Reaction Network by Co-Occurrence Signatures

Extracting the mechanism from the trajectory requires identifying every elementary reaction event from atom-resolved species-transition records. Each sulfur and hydrogen atom was assigned a species code equal to 10·nS + nH, where nS and nH are the numbers of sulfur and hydrogen atoms in its molecule (12 = H2S, 11 = HS•, 1 = H•, 2 = H2, 10 = S, 13 = [H3S]•, 22 = HSSH). The scalar code is a bookkeeping label for these small species and is collision-free over the chemistry actually observed, in which no molecule ever contained more than three hydrogen atoms (an ambiguity would require nH ≥ 10); polysulfur aggregates are tracked independently of this code by the union–find cluster analysis described below, which stores the explicit composition (nS, nH) of every aggregate. An elementary reaction modifies several atoms in the same time step, and this temporal co-occurrence constitutes its signature; recognizing each signature allows the forward and reverse events of every step to be counted separately, and degenerate exchanges that produce no net chemistry to be excluded. Channels that form a bound pair (the S2H2 complex/HSSH, or H2 from H• + H•) were counted as reactive events only when the product persisted for at least 10 ps; more fleeting encounters were classified as transient collision complexes and excluded, a criterion applied consistently throughout (including to the first appearance of sulfur chains in Section 3.6). The 10 ps threshold corresponds to ≈800 vibrational periods of the S–H stretch and exceeds by one to two orders of magnitude the lifetimes of the fleeting collision complexes, which redissociate within a few picoseconds, so it falls in the gap of a strongly bimodal lifetime distribution: contacts that fail to persist dissolve with a median lifetime of ≈2–3 ps. Re-analysis of the stored transition records shows that the mechanistic classification is insensitive to the precise threshold—for any choice between 5 and 20 ps the persistent H• + H• recombination channel remains at the level of a few percent of the abstraction count or below—and no conclusion of this work is affected. As quality control, mass balances were propagated for every atom, and exact closure of the sulfur and hydrogen inventories confirmed that no transitions were missed. The growth of polysulfur chains was followed with a dedicated cluster-detection program based on a union–find algorithm [29,30,31], which reconstructs frame by frame which atoms belong to the same sulfur aggregate.
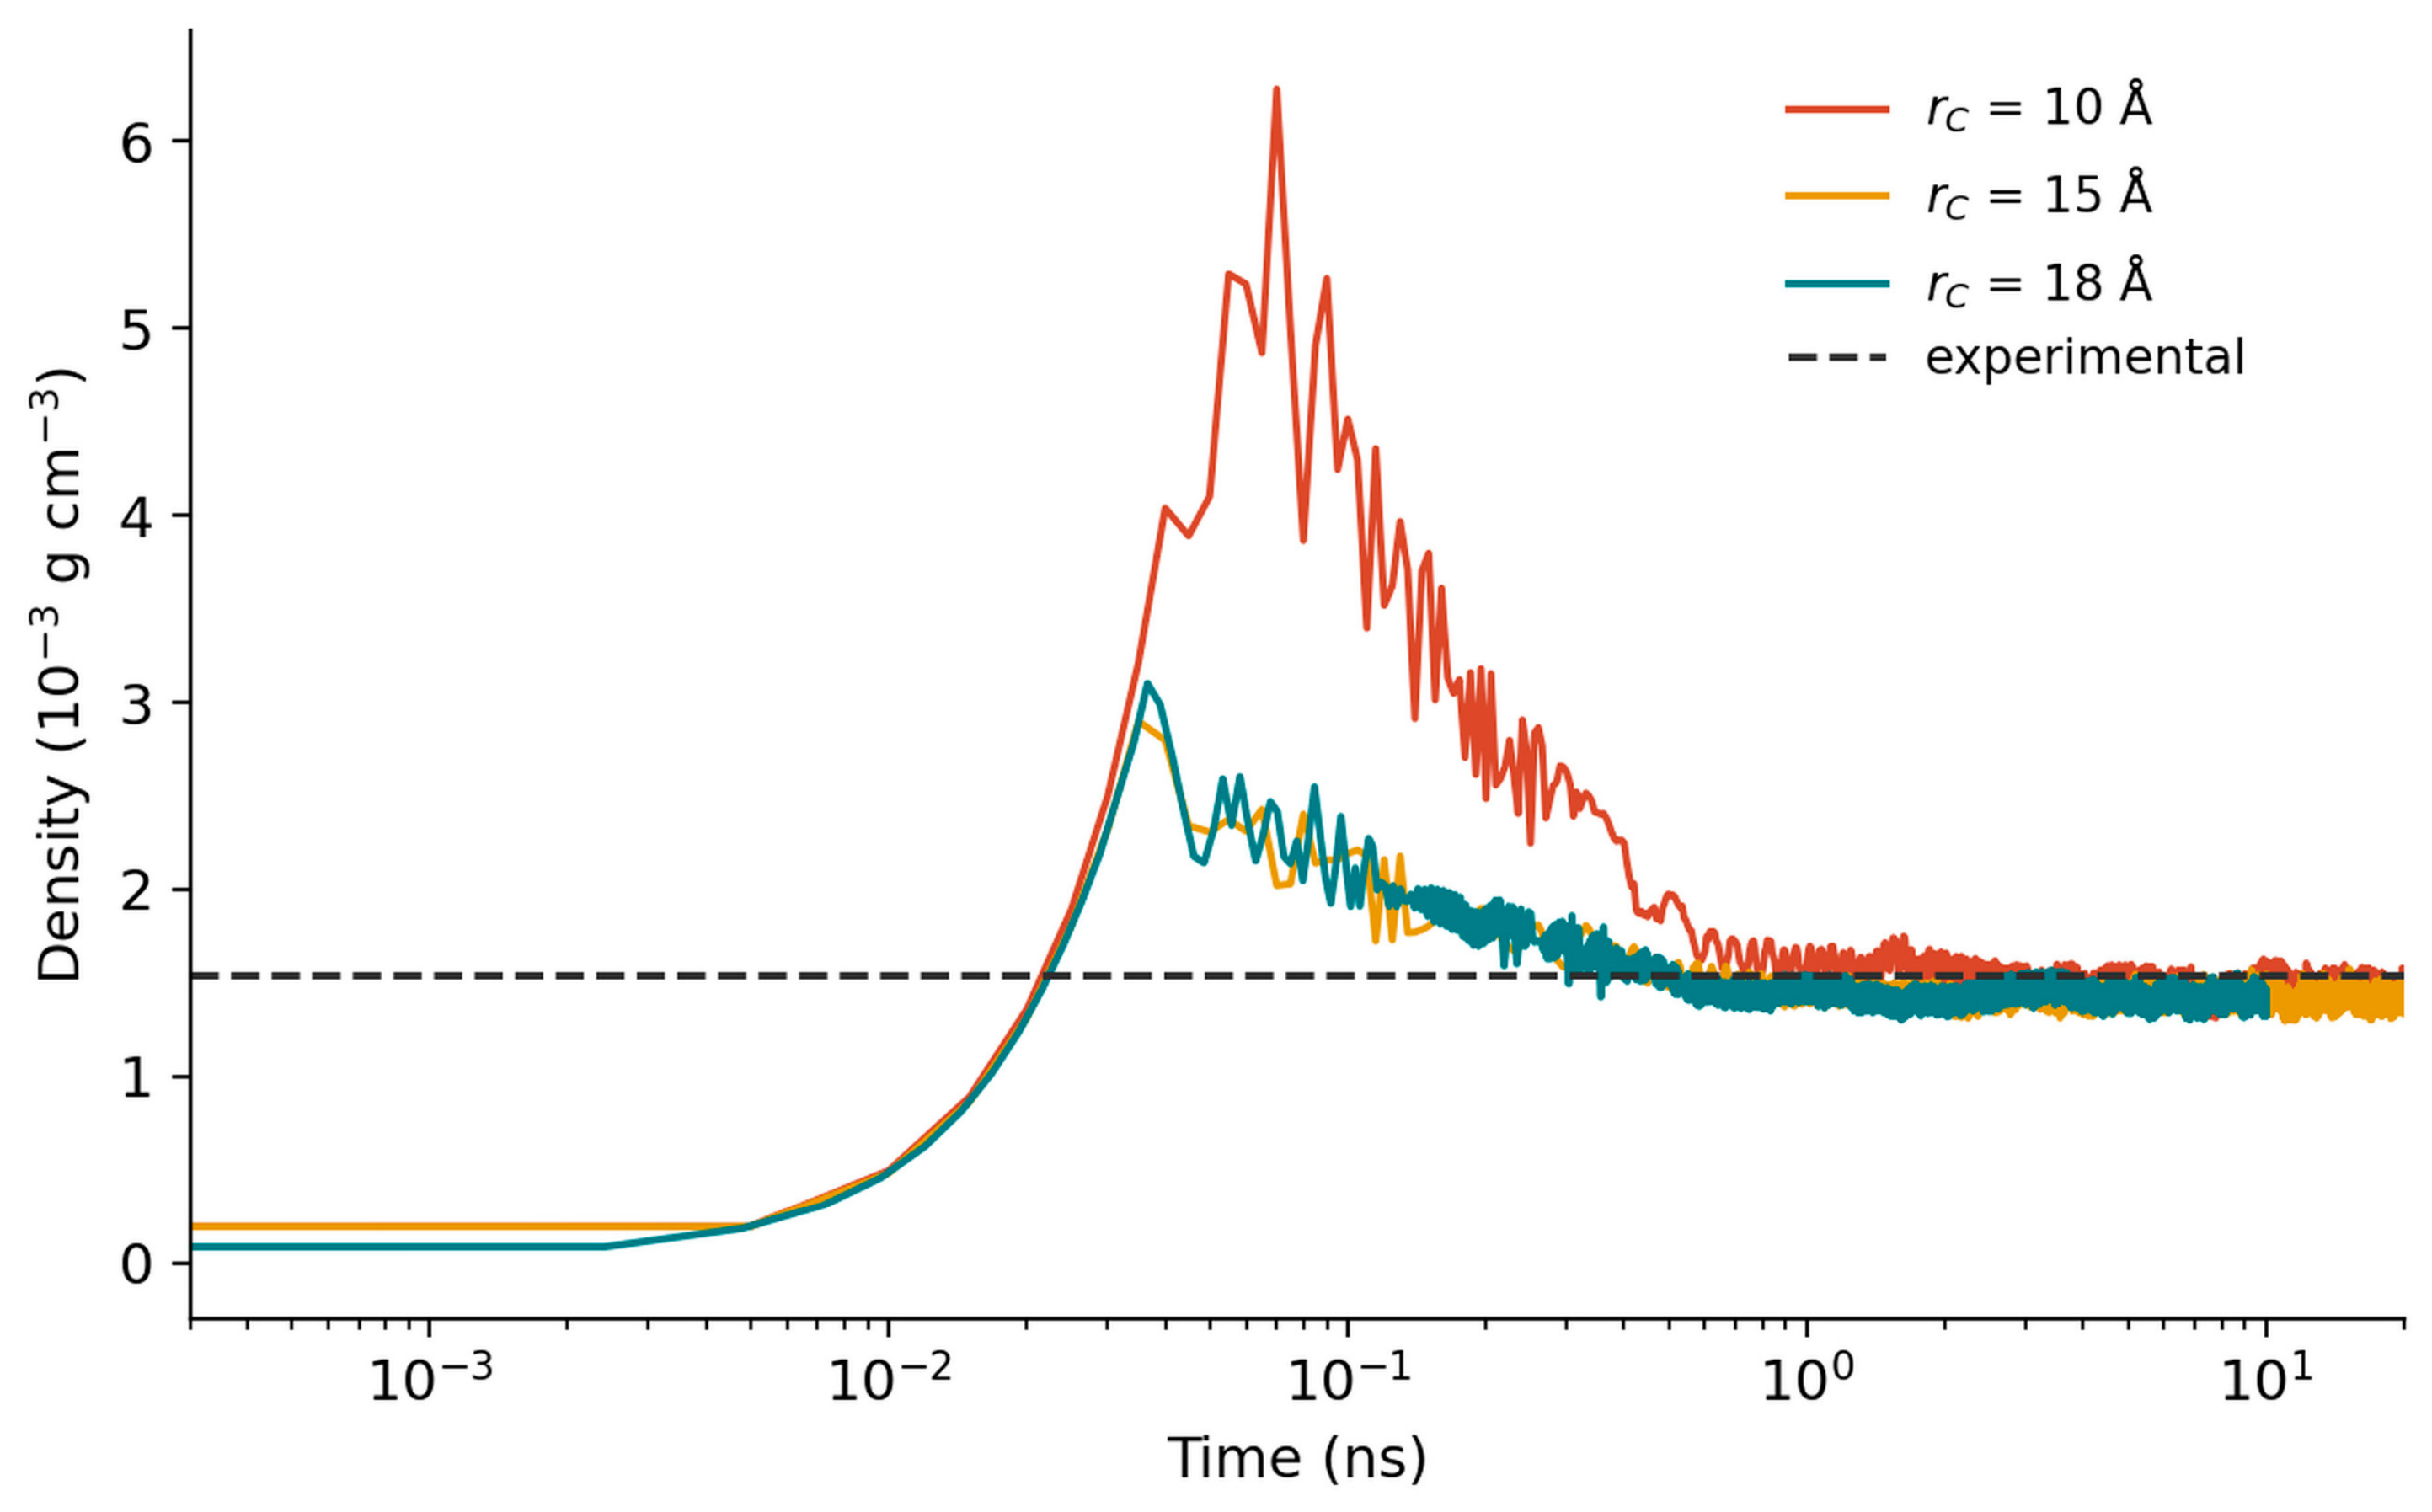
Figure 1. Evolution of the system density for 1000 H2S molecules at 298.15 K and 1 atm, for cutoff radii of 10, 15 and 18 Å (logarithmic time axis), with the experimental equilibrium density [28] shown as the dashed line.
Hydrogen 07 00117 g001

2.4. Energy Costs and Thermochemical Validation

The energy cost of dissociation was quantified as the slope of the total system enthalpy against the number of H2S molecules consumed, dH/dN, evaluated over the chemically controlled window (excluding the first 2–3 ns of thermal expansion after the instantaneous heating). The slope was obtained by block averaging with bootstrap error estimation [32,33], using 18 blocks of 8–10 ns each—more than three orders of magnitude longer than the integrated autocorrelation time of the enthalpy fluctuations under production conditions (τH ≈ 0.8–0.9 ps)—so that the blocks are effectively independent; halving or doubling the block count changes the fitted slopes by less than 0.5% and leaves the uncertainty estimates of the same magnitude, confirming that the estimates lie on the block-size plateau. The procedure is robust to the choice of kinetic-regime boundaries. For independent validation, the complete-dissociation enthalpy was estimated by Kirchhoff’s law using the experimental H–SH bond dissociation energy of 376.24 ± 0.05 kJ·mol−1 [34], corroborated by high-level ab initio calculations [35], together with the heat-capacity polynomials of the species [36], yielding 4.11–4.12 eV per H2S molecule over the simulated temperature range. The corresponding 0 K limit, used below as a fixed reference, is D0 = 3.90 eV.

3. Results and Discussion

3.1. The Cutoff Radius Is Critical for Dilute-Gas RMD

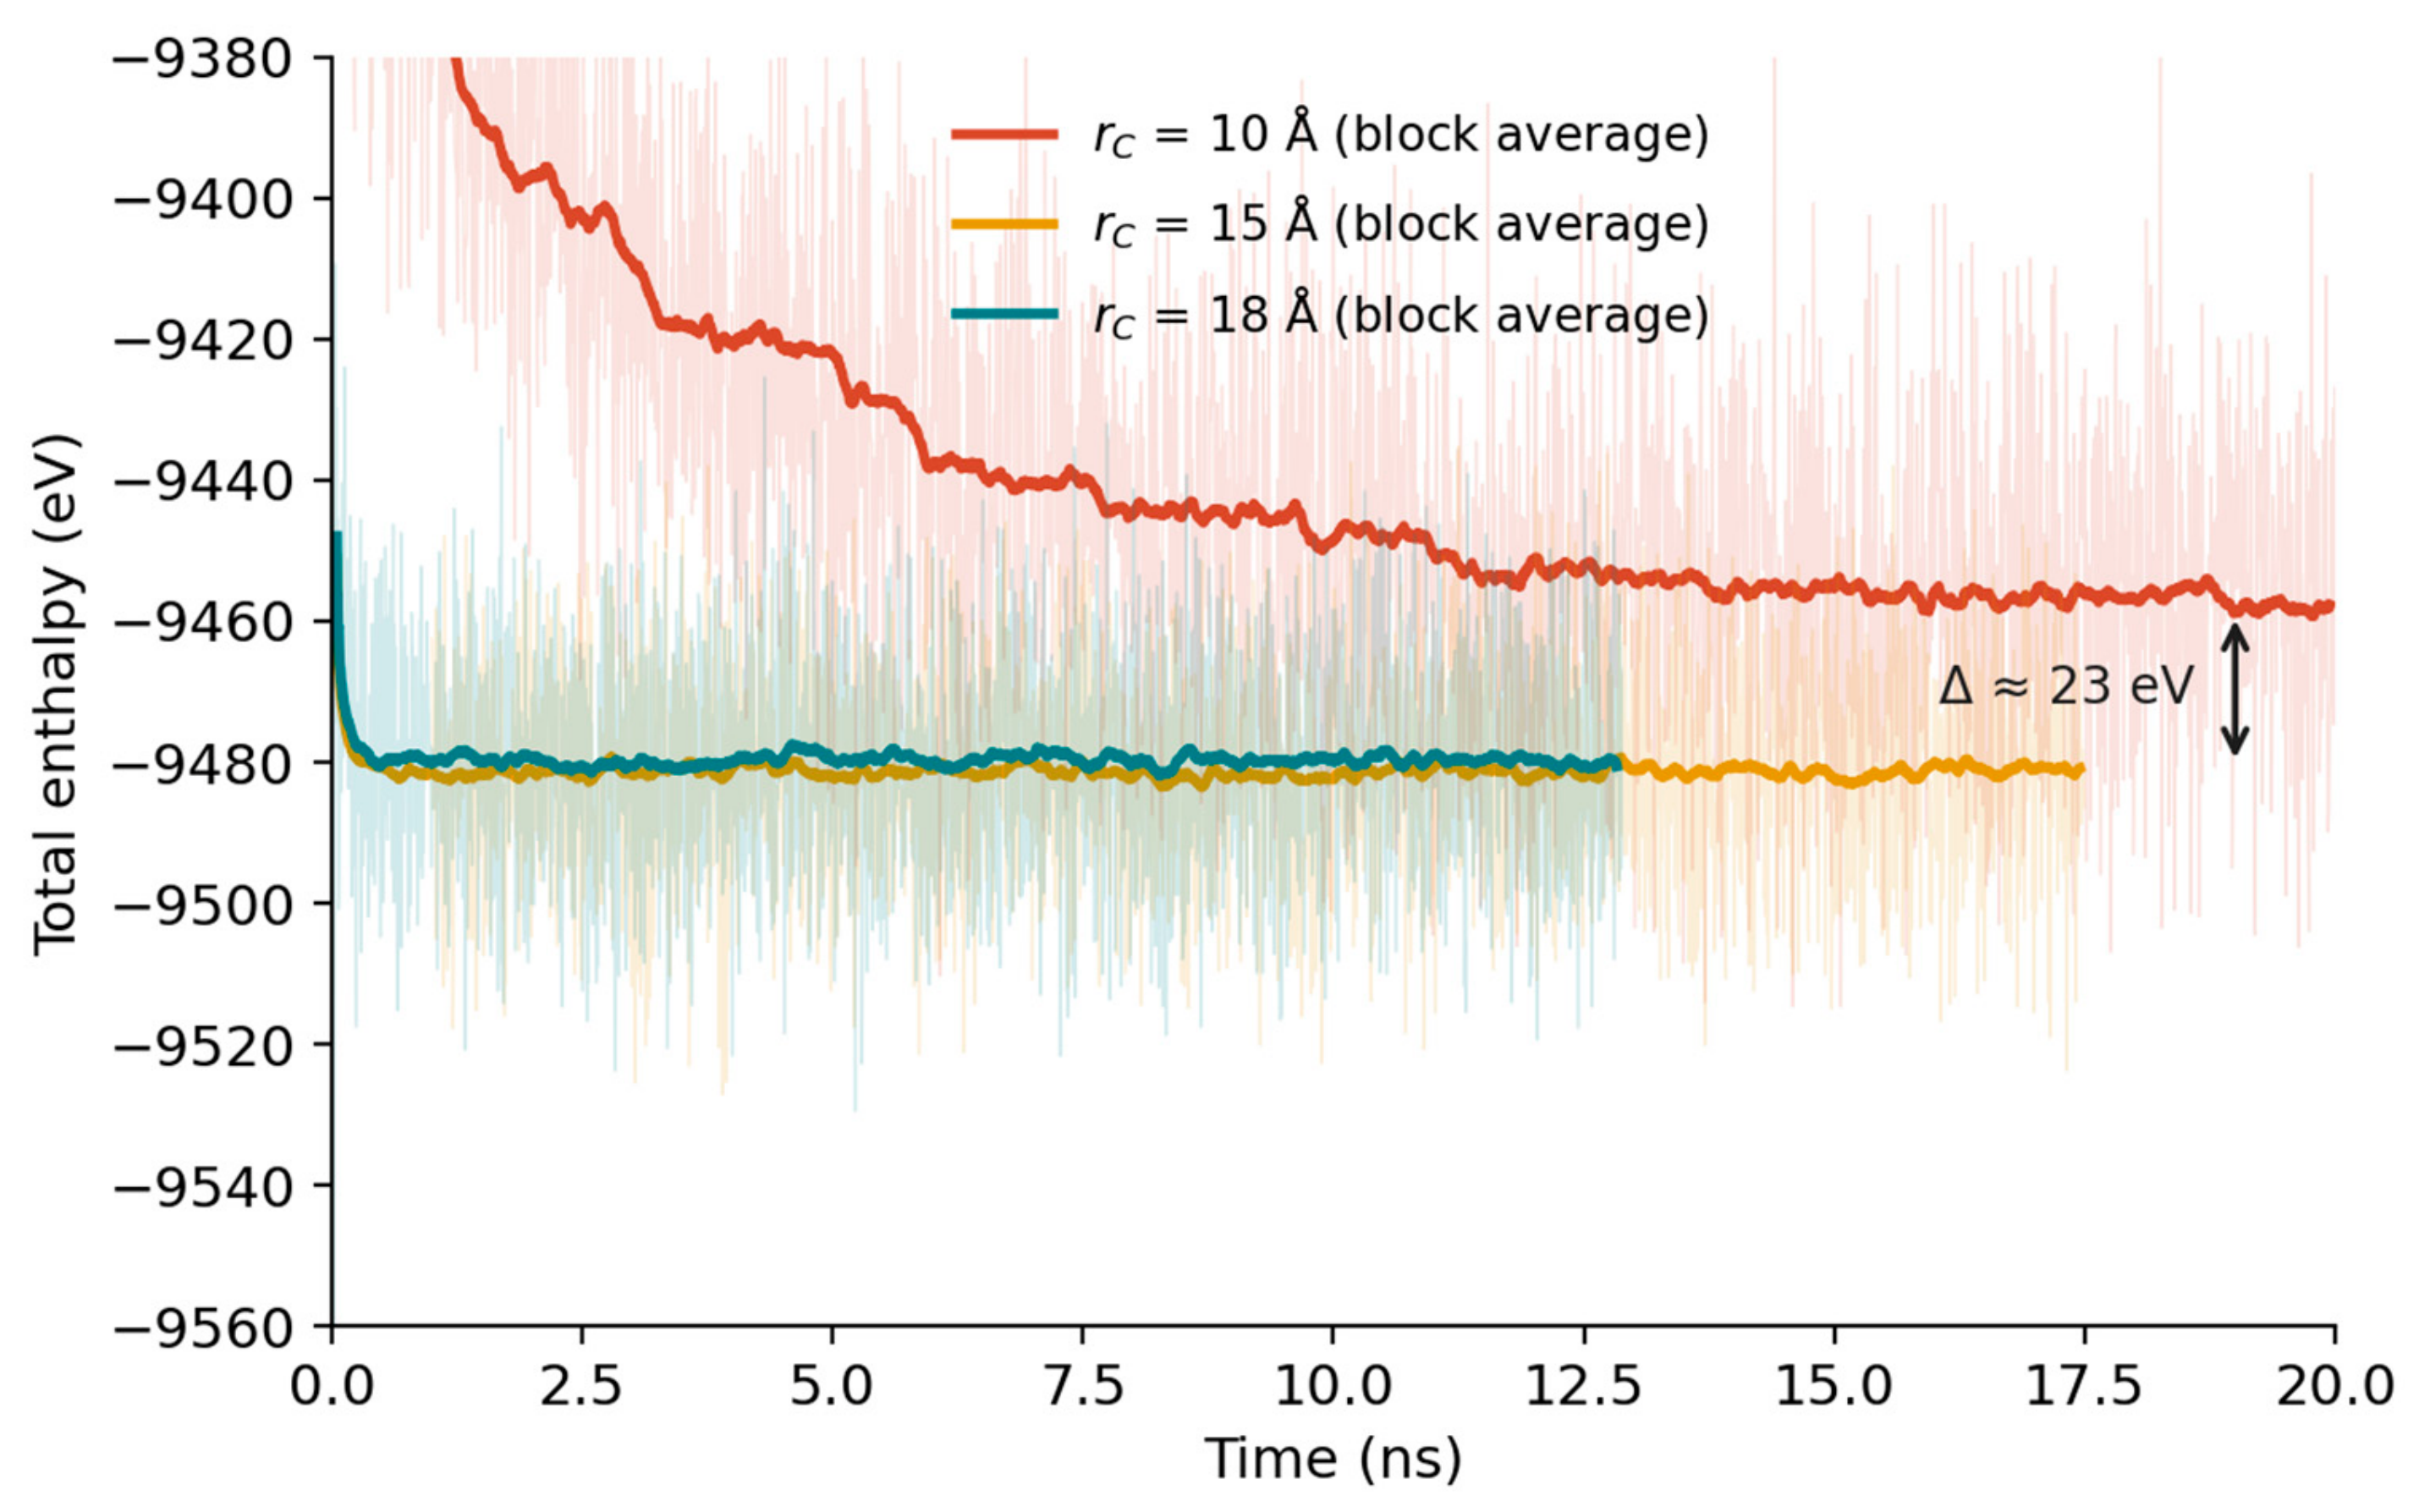
Simulations at 298.15 K and 1 atm, started from an out-of-equilibrium configuration, showed that the cell density first overshoots and then relaxes toward the experimental value for all cutoff radii, but the overshoot is much larger (a peak of ≈4× the equilibrium density, versus ≈ 2×) and the relaxation slower (~1.7 ns versus ~0.4–0.6 ns) with the original 10 Å cutoff than with 15 or 18 Å (Figure 1). The energetics display the same pattern: the 15 and 18 Å models reach a steady total enthalpy within ~0.2 ns and agree with each other to within 1 eV, whereas the 10 Å model requires ~13 ns and settles ≈23 eV above the converged value (about 0.023 eV per molecule)—that is, it misses roughly 23 eV of attractive non-bonded interaction energy—with instantaneous fluctuations ~1.5 times larger (standard deviation 21 versus 14.5 eV; Figure 2). A significant fraction of the energetically relevant non-bonded interactions therefore occurs beyond 10 Å in the dilute gas.
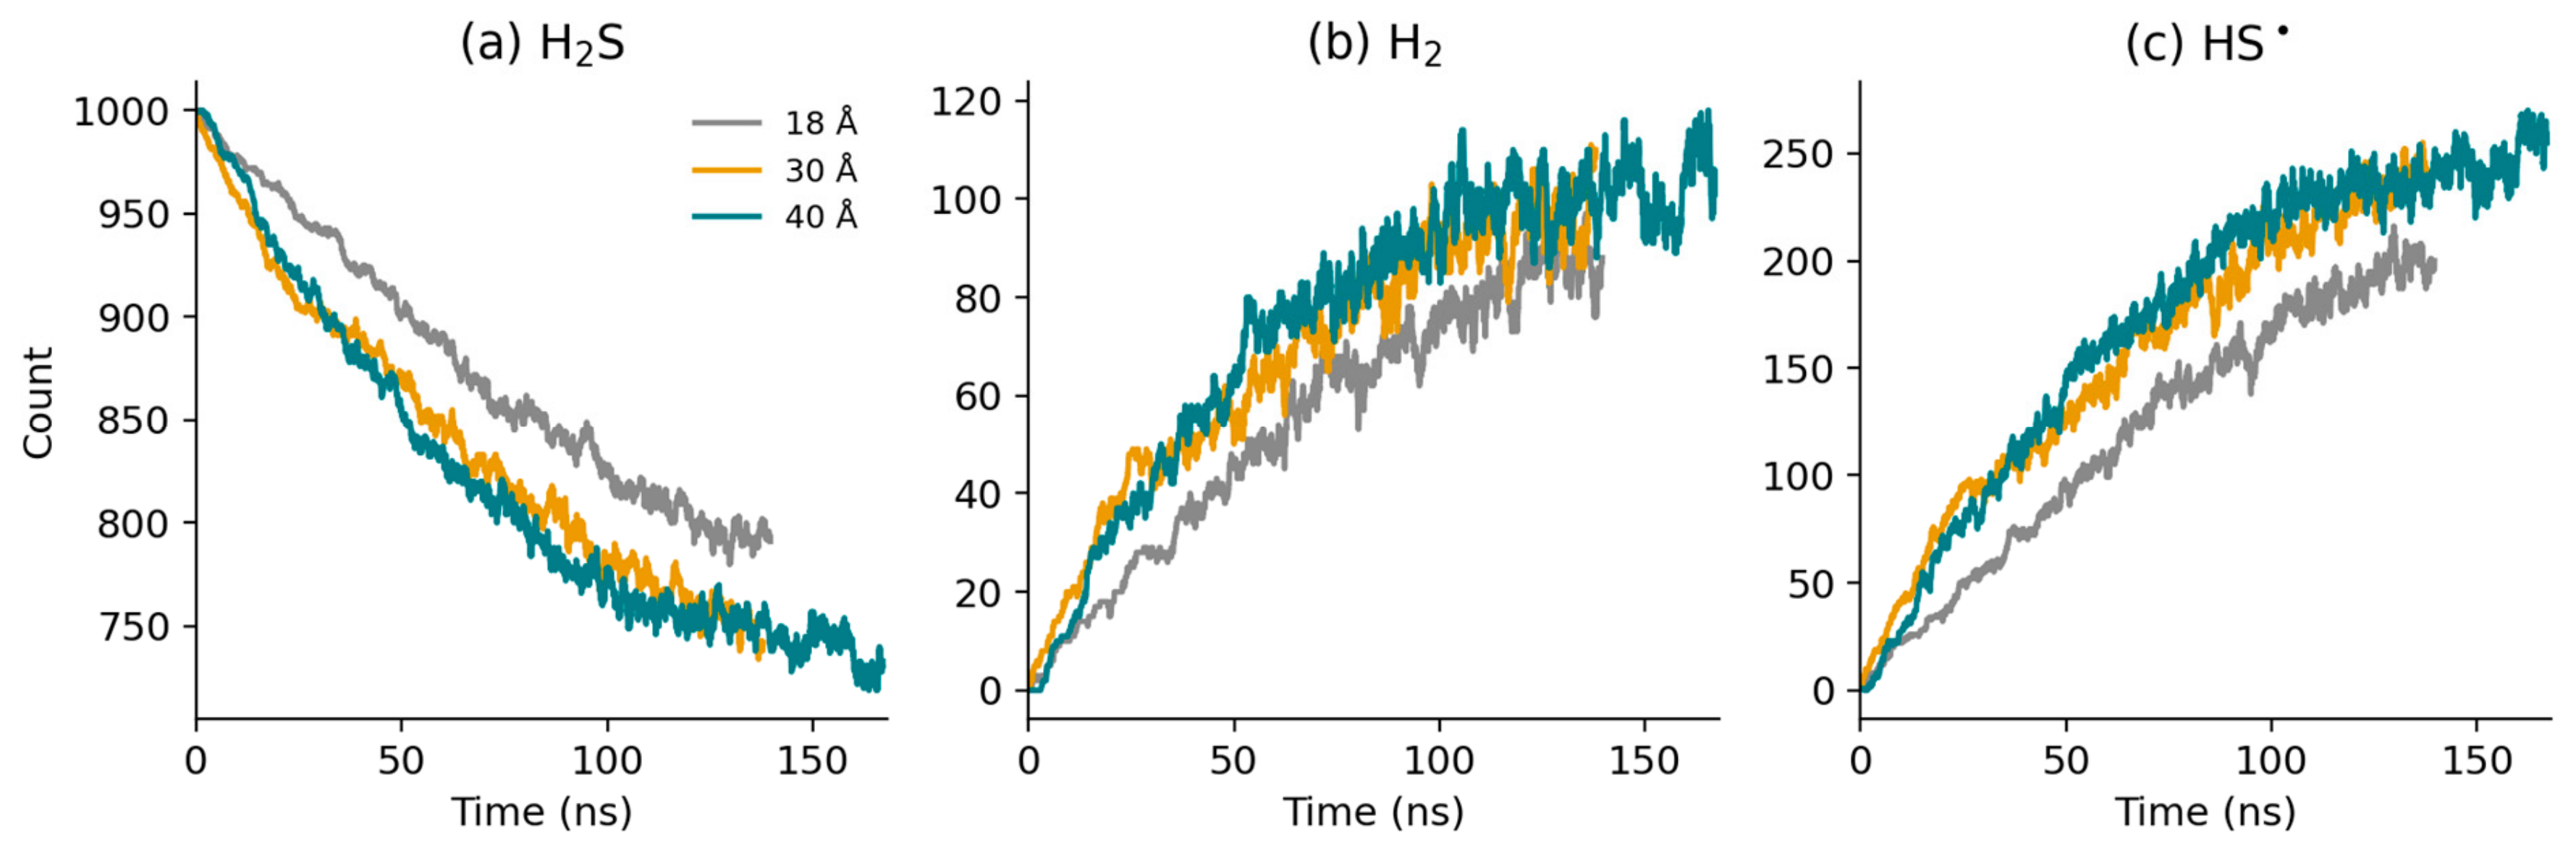
The consequences for reactivity are more severe. Upon instantaneous heating to 3000 K, no dissociation was observed with rC of 10 or 15 Å within 20 ns, whereas radii of 18, 30 and 40 Å captured the thermolysis, with a dissociation rate that increases with rC but converges within the statistical resolution of the single-trajectory estimates: at 130 ns the conversion rises by 2.5 percentage points from 18 to 30 Å but by only 1.0 point from 30 to 40 Å, the latter difference lying within the counting resolution of a single 1000-molecule trajectory (±1.3–1.4 percentage points per run) (Figure 3). The cell volume proved essentially insensitive to rC, indicating that the volumetric properties are governed by short-ranged interactions [37], whereas the enthalpy tracked the rC-dependent reaction progress. All subsequent results therefore employ rC = 40 Å.

3.2. Temperature Threshold and Global Kinetics

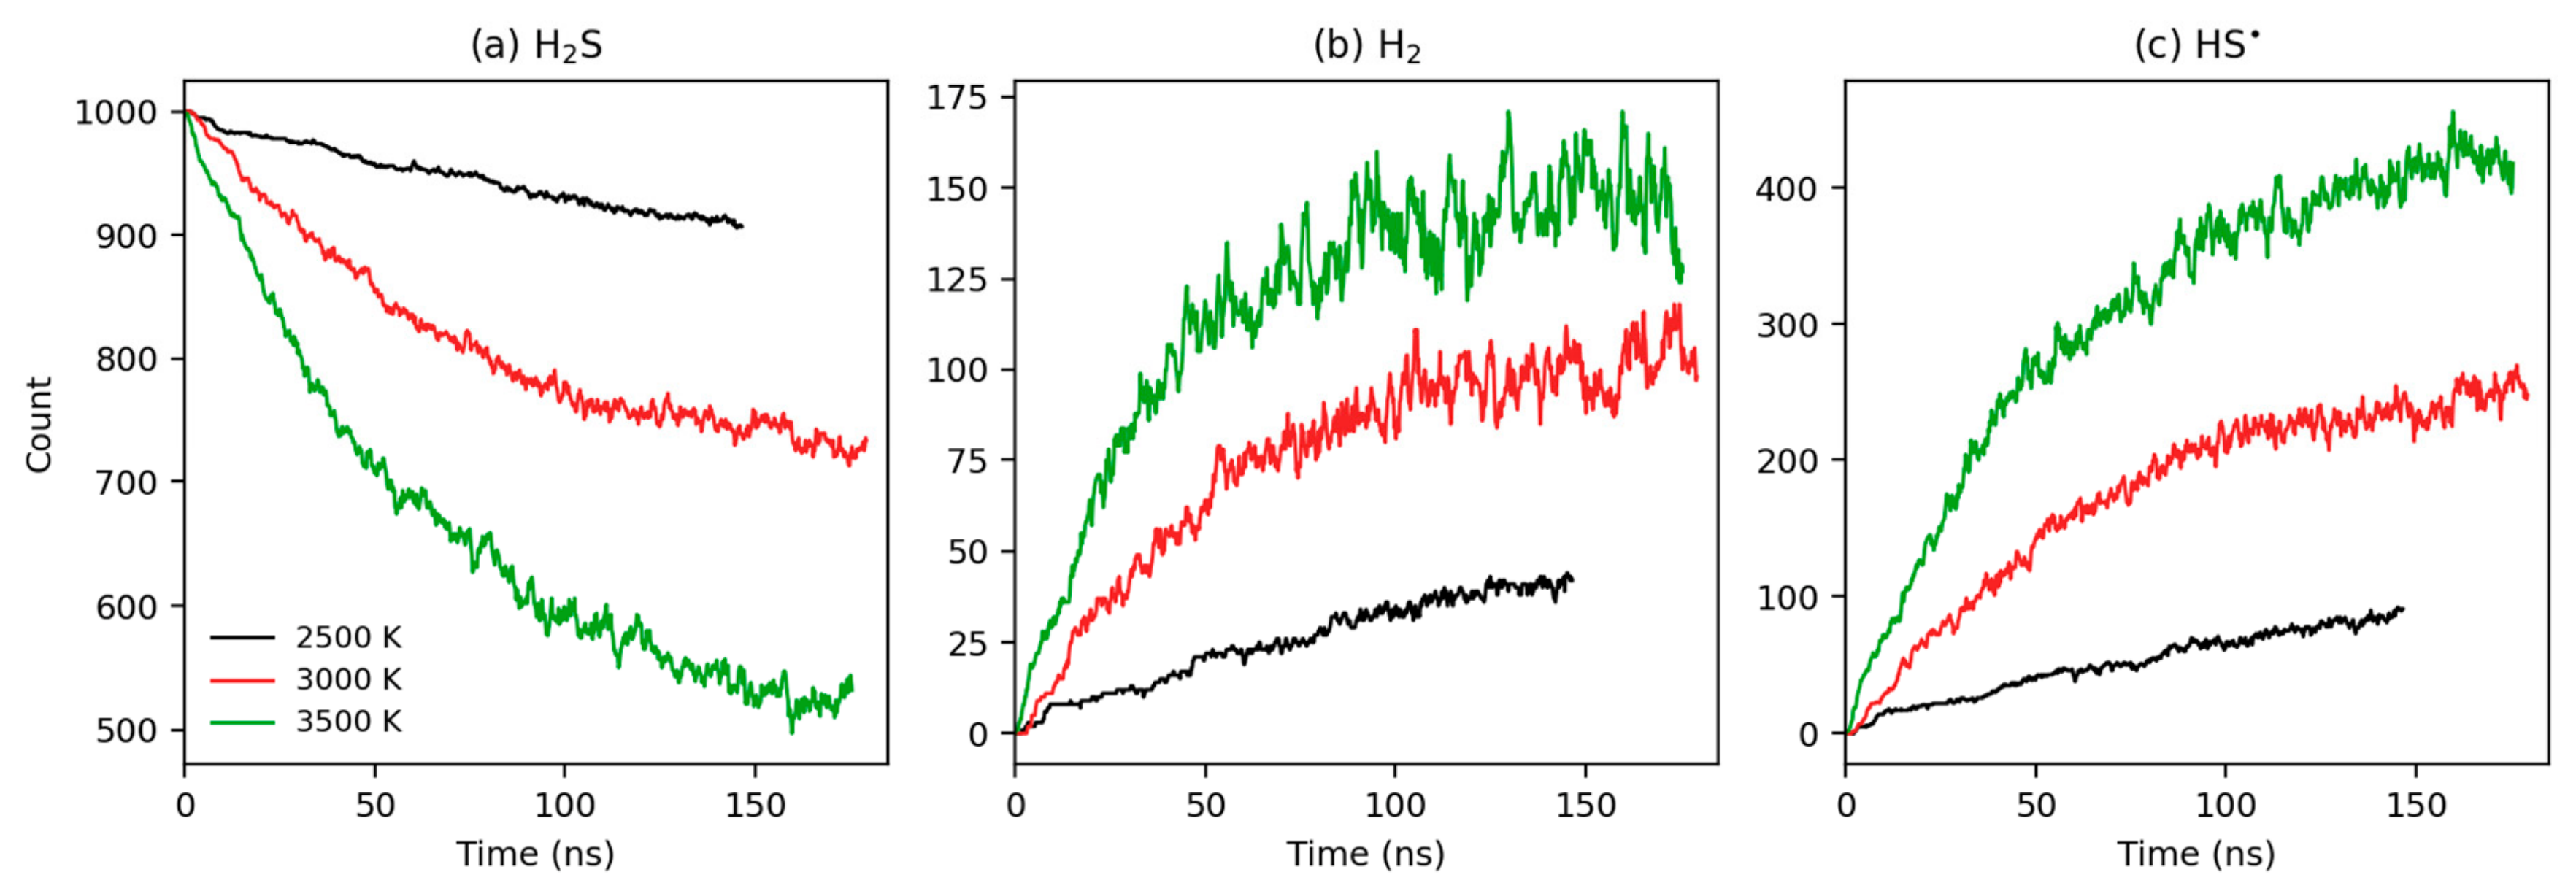
With rC = 40 Å, no dissociation was detected between 1000 and 2000 K within 20 ns, consistent with the seconds-scale residence times required experimentally at low temperature [7] and with the intrinsic time-scale limitation of RMD. At 2500, 3000 and 3500 K, dissociation proceeded clearly (Figure 4). The decay of H2S and the growth of H2 and HS• follow exponential asymptotic behavior consistent with first-order kinetics over the conversions reached, in agreement with the flow-reactor literature [7,8]. Fits of the H2S decay to a first-order approach to its asymptote, N(t) = N_eq + (N0 − N_eq)·exp(−k_obs·t), and yield apparent rate constants k_obs = 5.5 × 10⁶, 1.3 × 10⁷ and 1.6 × 10⁷ s−1 at 2500, 3000 and 3500 K (R2 = 0.989, 0.992 and 0.995), confirming that a single-exponential, first-order form describes the decay over the conversions reached. The Arrhenius slope of these constants corresponds to an apparent activation energy of ≈80 kJ·mol−1, well below the intrinsic initiation barrier, as expected for relaxation constants of a closed system approaching equilibrium, where k_obs reflects the sum of forward and reverse contributions of near-balanced channels; the transferable observable is the first-order form itself, not the absolute constants, which cannot be compared directly with flow-reactor rate constants (see the final paragraph of this section). The fitted asymptote N_eq is likewise an apparent stationary level of the kinetically limited regime, not the thermodynamic equilibrium composition: the net conversion continues to advance slowly through sulfur condensation beyond these fits (Section 3.6). By the end of the runs (147–180 ns), the net conversion referred to the initial 1000 molecules was 9.3 ± 0.9% at 2500 K, 26.3 ± 1.4% at 3000 K and 46.7 ± 1.6% at 3500 K, where the uncertainties are the binomial counting resolution of a single 1000-molecule trajectory—an increase of more than a factor of five across the 1000 K interval. The product species (H•, HS•, H2, S, with HSSH and HS2• as intermediates) coincide with those of the homolytic mechanisms reported for thermal plasma at comparable temperatures [9], supporting the physical validity of the reactive potential.
A caveat applies to any direct comparison with experimental conversions. The present simulations describe a closed, homogeneous system heated instantaneously and relaxing toward equilibrium over ≈102 ns, whereas flow-reactor conversions refer to open systems with residence times of seconds, shock-tube experiments use high dilution in inert bath gases, and plasma reactors add non-thermal channels. The quantities transferable across these conditions are the reaction order, the identity of the elementary steps, the product spectrum and the thermochemistry—and it is at this level that the comparisons in this work are made; absolute conversions and apparent rate constants are condition-specific. In particular, none of the conversions reported here is an equilibrium conversion: at the end of every run the sulfur-condensation channel still carries a net forward flux (Section 3.6), while thermal dissociation at comparable temperatures reaches near-complete conversion in plasma reactors [9,10]; the simulated values are kinetic snapshots that bound the equilibrium conversion from below, and their shortfall is itself the central mechanistic result—the conversion is limited by the slow drainage of sulfur, not by thermodynamics.
Run-to-run variability was quantified directly with the five independent 100-molecule replicas at 3500 K (Section 2.2). Their conversions after 25–27 ns were 19, 18, 16, 22 and 24% (mean 19.8%, standard deviation 3.2 points), a spread consistent with the binomial counting resolution of a 100-molecule system (±4 points) and bracketing the 1000-molecule production trajectory over the same window (17.3% at 25.5 ns). The frequencies of the bimolecular channels are consistent with a common Poisson rate across the five replicas (χ2 tests at the 95% level for forward and reverse abstraction and for elimination), and the net homolysis flux is likewise Poisson-consistent (χ2 = 1.6 with 4 degrees of freedom); only the raw homolysis and hydrogen-exchange counts are super-Poissonian, as expected for correlated recrossing bursts, which does not affect the net fluxes that carry the chemistry. The variability between independent runs is therefore fully accounted for by counting statistics, supporting the internal (Poisson and binomial) uncertainties used throughout this work. From the enthalpy and volume records of the replicas, the early-window energy cost per molecule (3–25 ns) is 3.02 ± 0.16 eV across the five runs, and the replica cell densities agree with the production system and with the ideal-gas estimate at 3500 K within the larger fluctuations expected for a 100-molecule cell. The replicas do hint at a mild finite-size acceleration of the chemistry: their mean conversion (19.8%) and early-window cost lie slightly—though not significantly (1–2σ)—above the production values over the same window (17.3% and 2.67 eV). Faster apparent kinetics in small reactive systems are a documented phenomenon: the relative fluctuations of the radical population scale as 1/√N, and transient radical-rich fluctuations accelerate autocatalytic chain chemistry, an effect established for small autocatalytic systems [38] and observed as stochastic, system-size-dependent induction behavior in molecular-dynamics studies of thermal ignition [39]; system size is accordingly a recognized convergence parameter in reactive-MD practice [40]. The 1000-molecule production system, whose relative fluctuations are ≈3 times smaller, is therefore the more reliable estimator of the bulk kinetics, and the replicas are used here to bound run-to-run variability.

3.3. Energy Costs Rise with Temperature and Approach the Kirchhoff Limit

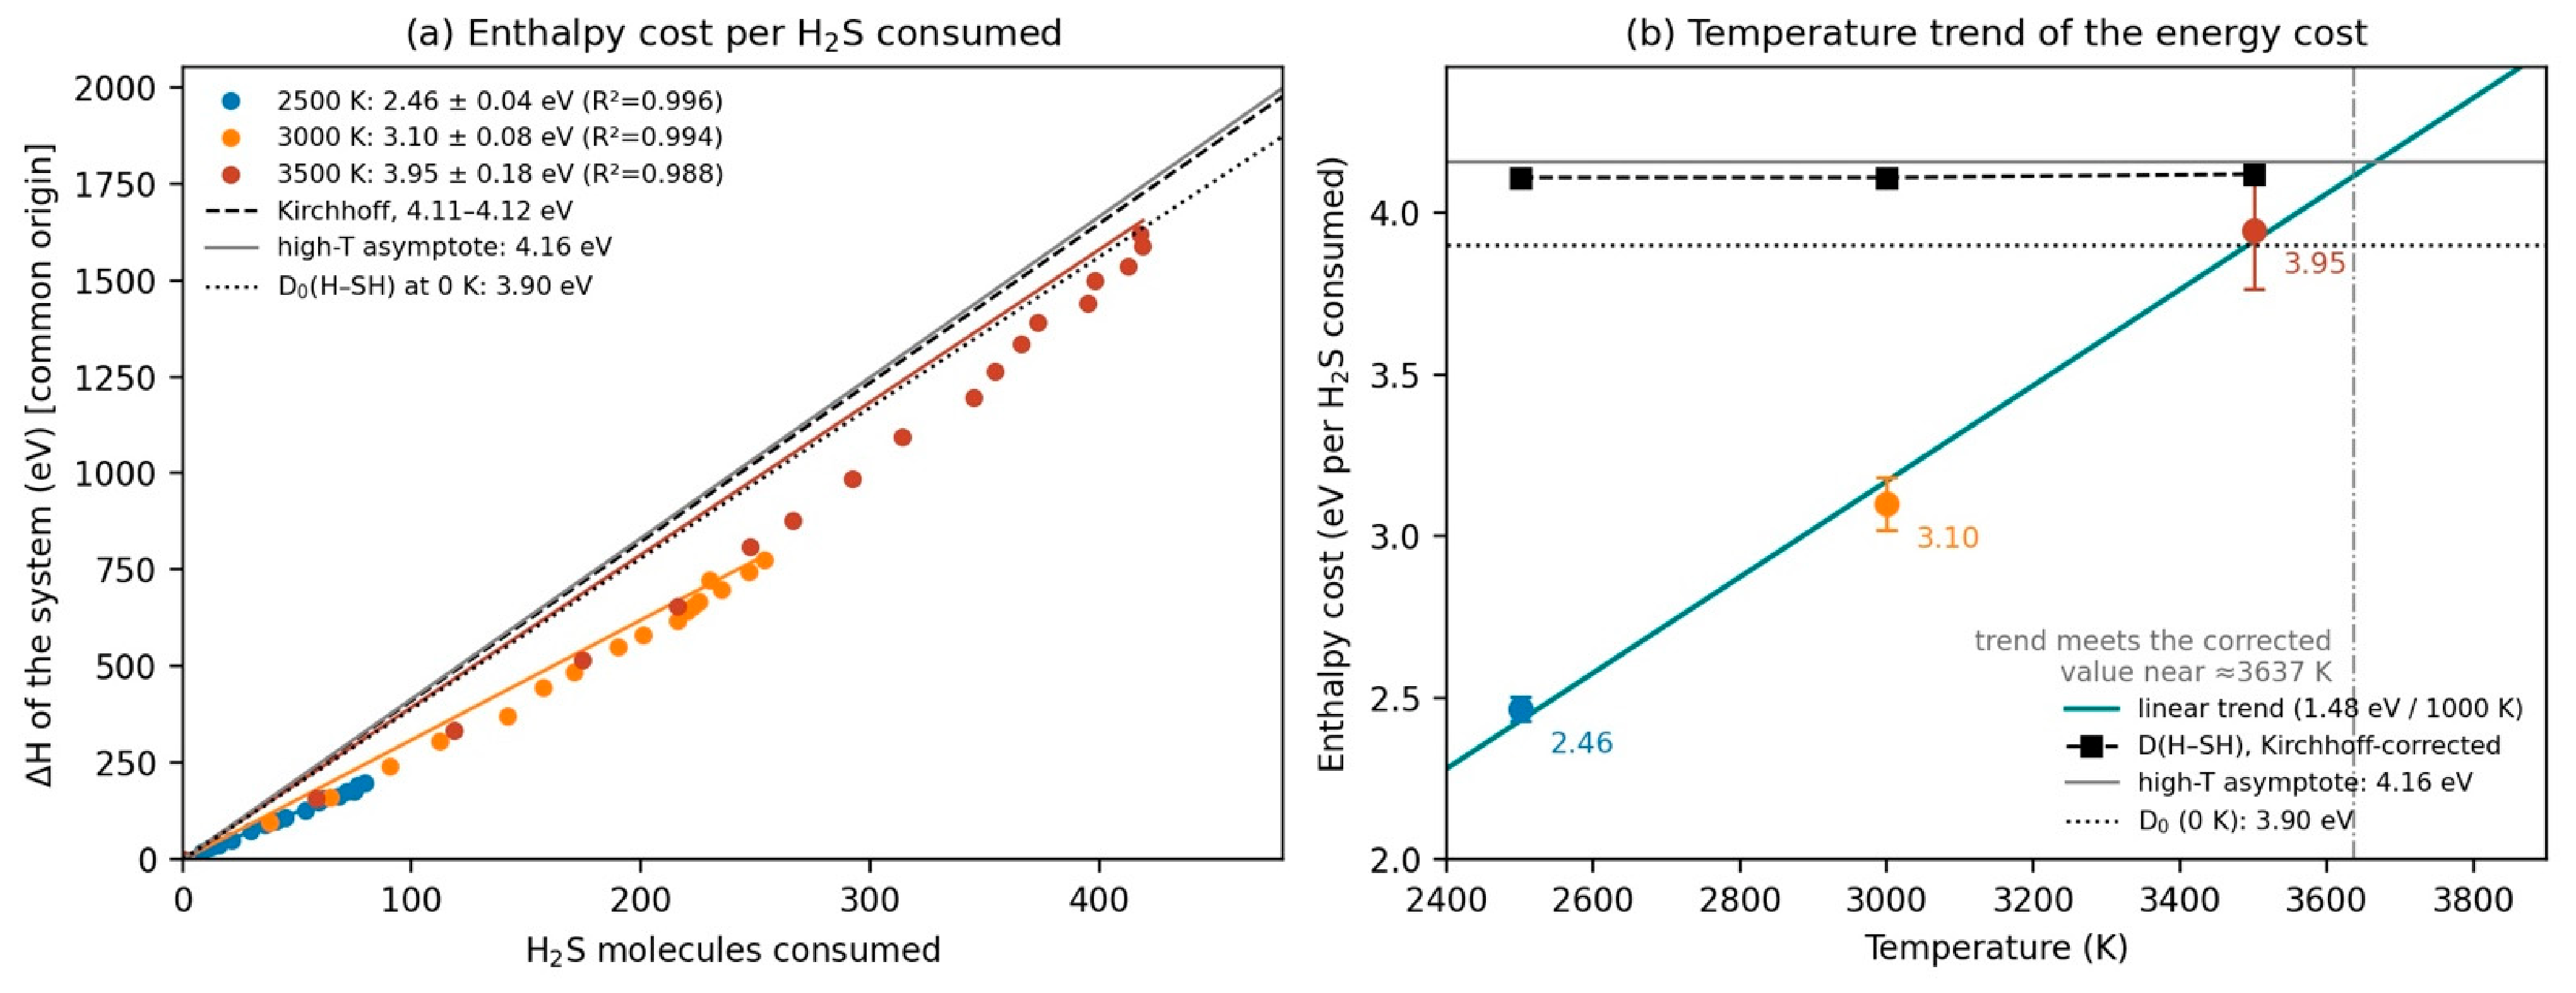
Figure 5a shows the change in the total system enthalpy plotted against the number of H2S molecules consumed, after excluding the initial 2–3 ns thermal-expansion transient. The relationship is strikingly linear at all three temperatures (R2 = 0.996, 0.994 and 0.988), demonstrating that the enthalpy cost per molecule is a single well-defined quantity at each temperature. The block-averaged slopes are 2.46 ± 0.04, 3.10 ± 0.08 and 3.95 ± 0.18 eV per H2S consumed at 2500, 3000 and 3500 K. The cost increases approximately linearly with temperature, at ≈1.48 eV per 1000 K (Figure 5b), and approaches the complete-dissociation thermochemistry of Section 2.4: at 3500 K the simulated cost (3.95 ± 0.18 eV) lies slightly above the 0 K limit D0 = 3.90 eV [34] and is statistically indistinguishable (a 0.9σ difference) from the Kirchhoff-corrected complete-dissociation enthalpy at that temperature (4.11–4.12 eV), while remaining numerically below the latter. An extrapolation of the linear trend would meet the Kirchhoff-corrected limit near ≈3640 K; with only three temperatures supporting the fit this figure is indicative only, and the expected behavior beyond the simulated range is an asymptotic saturation at the thermochemical limit rather than a crossing.
The physical interpretation is direct. At 2500 K a large fraction of the H2S consumed proceeds only as far as HS• (a single S–H bond broken), so the net cost per molecule lies well below the complete-dissociation value. As the temperature rises, dissociation proceeds further per molecule consumed—more H2 is released and sulfur begins to condense—and the cost per molecule converges toward the full thermochemical value. The linear extrapolation of the trend reaches the Kirchhoff-corrected limit only near ≈3640 K; given that only three temperatures support the fit, this figure should be read as indicative, and the expected behavior beyond the simulated range is a saturation at the thermochemical limit rather than a crossing. This quantitative agreement between the simulated slopes and the independent Kirchhoff estimate validates the RMD energetics once the thermal-expansion contribution is excluded (first 2–3 ns of simulation).

3.4. The Same Elementary Steps Operate at the Three Temperatures

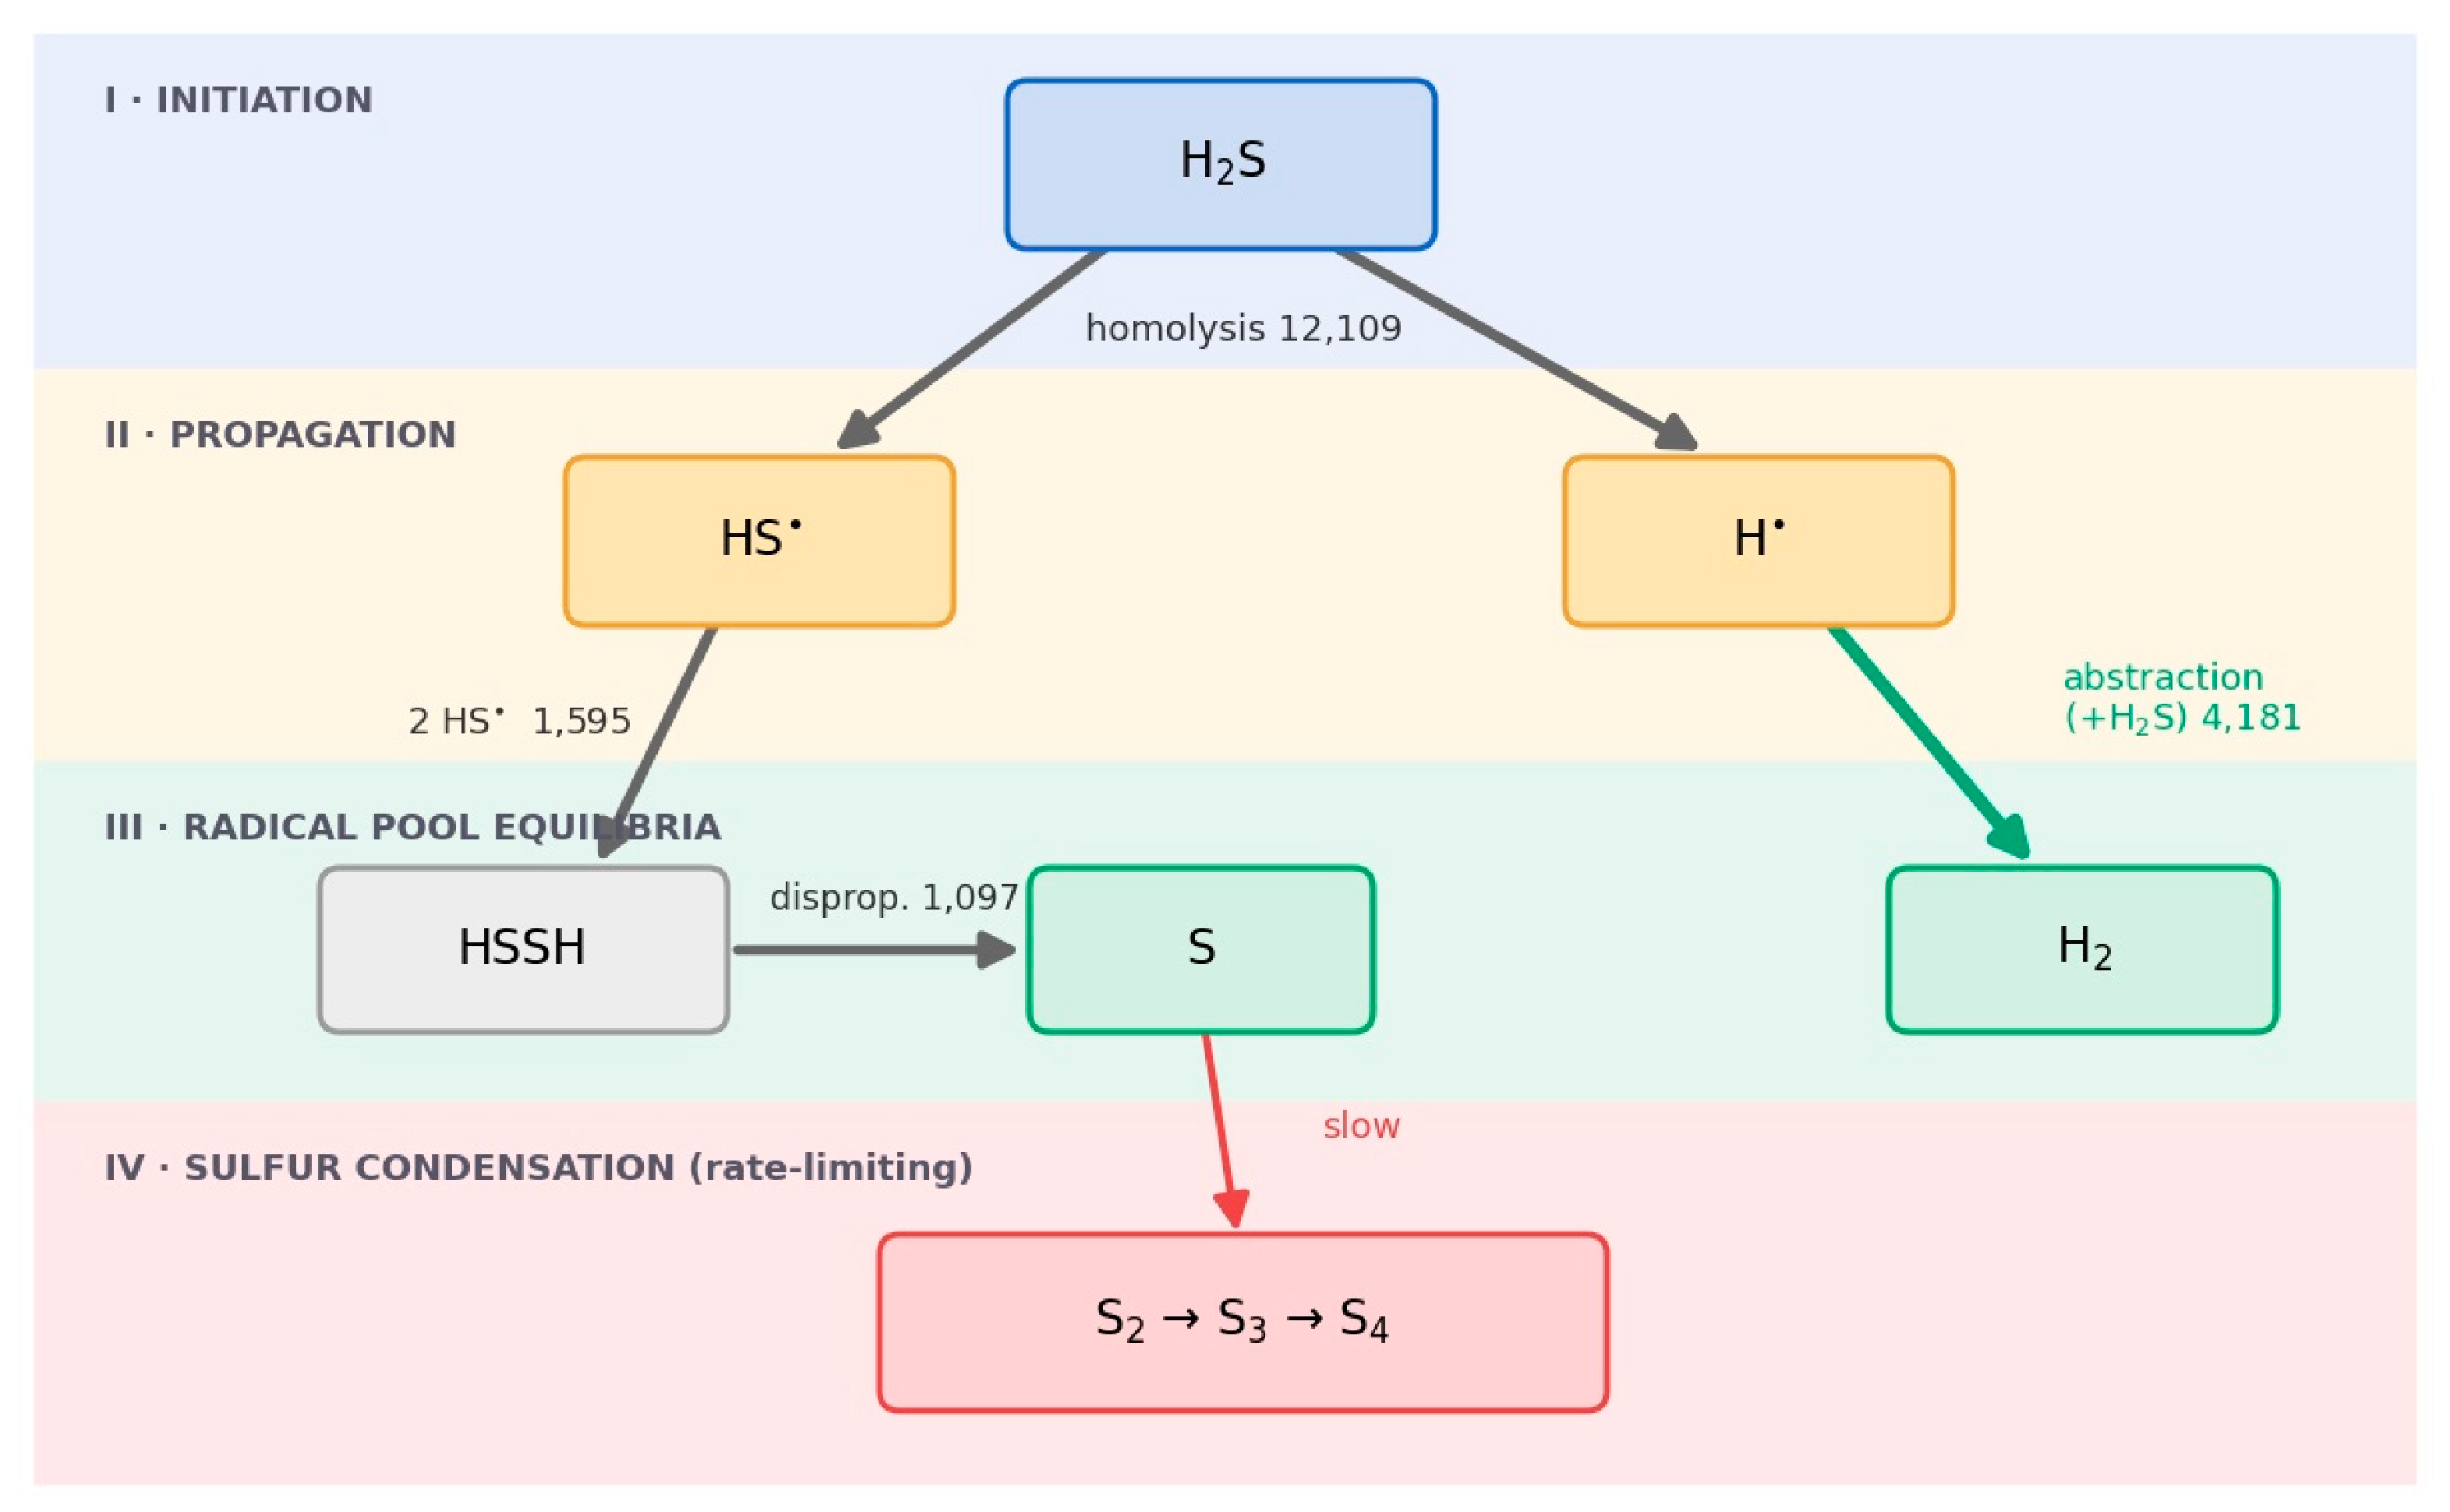
The co-occurrence signature analysis reconstructed the complete elementary reaction network (Figure 6). The fundamental structural finding is that the same set of elementary steps operates at the three temperatures: no new elementary step appears at high temperature that was not already present, if only marginally, at low temperature. What changes is the relative frequency of the higher-barrier channels, which are progressively activated as the temperature increases. Table 1 summarizes the forward/reverse event counts.
Three trends stand out. First, homolysis dominates in number at all temperatures and lies very close to equilibrium, with almost identical forward and reverse counts—settling, for these conditions, the historical question of the initiation step in favor of homolytic S–H fission [8,11]; the molecular-elimination channel does appear, but since ReaxFF evolves on a single effective potential-energy surface and does not track spin, its rate cannot be compared quantitatively with the spin-forbidden channel discussed in the shock-tube literature [12,13]. Second, the channels of elimination, thiyl recombination and disproportionation, marginal at 2500 K, grow by roughly an order of magnitude at 3000 and 3500 K. The branching pathway S + H2S ⇌ 2 HS• proceeds through the bound S2H2 complex: 53, 551 and 970 complete forward passages were observed at the three temperatures, contained within the recombination/disproportionation counts of Table 1. Third, the forward and reverse fluxes of the hydrogen chemistry channels are balanced within their Poisson uncertainties—for homolysis the net fluxes lie 0.3σ, 1.0σ and 0.2σ from zero at 2500, 3000 and 3500 K, and for abstraction 1.0σ, 0.1σ and 0.5σ; the only statistically significant net fluxes are those of the sulfur-draining channels at 3500 K (Section 3.6)—the signature of partial equilibrium at high temperature.

3.5. Hydrogen Originates from Abstraction, Not from Recombination

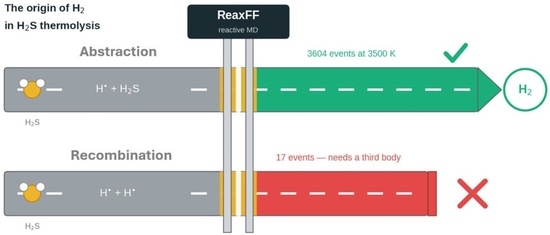
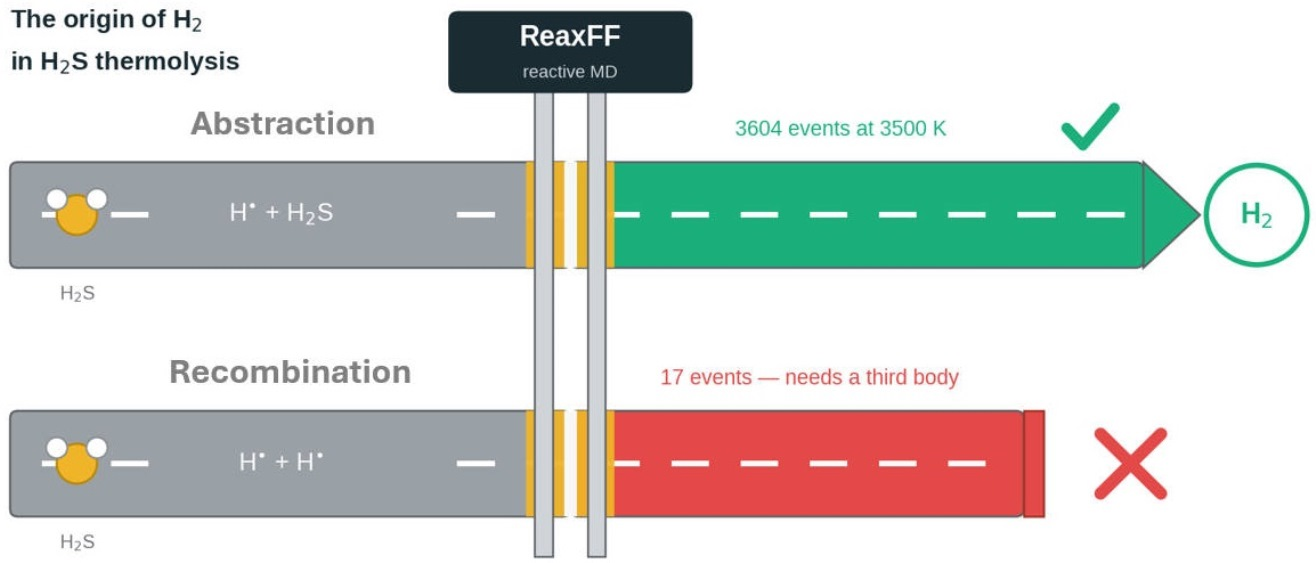
The data are unambiguous regarding the source of molecular hydrogen. Persistent recombination H• + H• → H2 (product surviving ≥ 10 ps) occurred only one, 13 and 17 times at 2500, 3000 and 3500 K—below 0.5% of the abstraction count at every temperature. Fleeting H–H contacts that redissociated within a few picoseconds were two orders of magnitude more frequent, underscoring the third-body requirement. This comparison survives normalization by the reactant populations: since abstraction is first-order in H• and H2S while recombination is second-order in H•, the expected ratio of their frequencies scales with N(H•)/N(H2S); taking the end-of-run populations (which maximize H• and therefore underestimate the suppression), persistent recombination remains ≥ 23 times (3000 K) and ≥120 times (3500 K) less effective than abstraction per available H• partner, while at 2500 K the populations (one persistent event, eight final H• atoms) are too small for a meaningful normalized comparison. The residual suppression, beyond the population disadvantage, quantifies the third-body requirement of the H• + H• channel. Essentially all the H2 is produced by hydrogen abstraction, H• + H2S → H2 + HS•, both directly and through a transient hypervalent adduct [H3S]•, in quantitative agreement with the canonical propagation step of the H/S system [41,42,43,44]. The reason is mechanistic: H + H recombination is a three-body process that cannot compete when each hydrogen atom is surrounded by an enormous excess of H2S, whereas abstraction is bimolecular, first-order in H• and H2S, and requires no third body because the HS• fragment carries away the excess energy. Because H2 arises from abstraction, appreciable H2 is produced even when the population of free H• is small, as observed at low temperature.
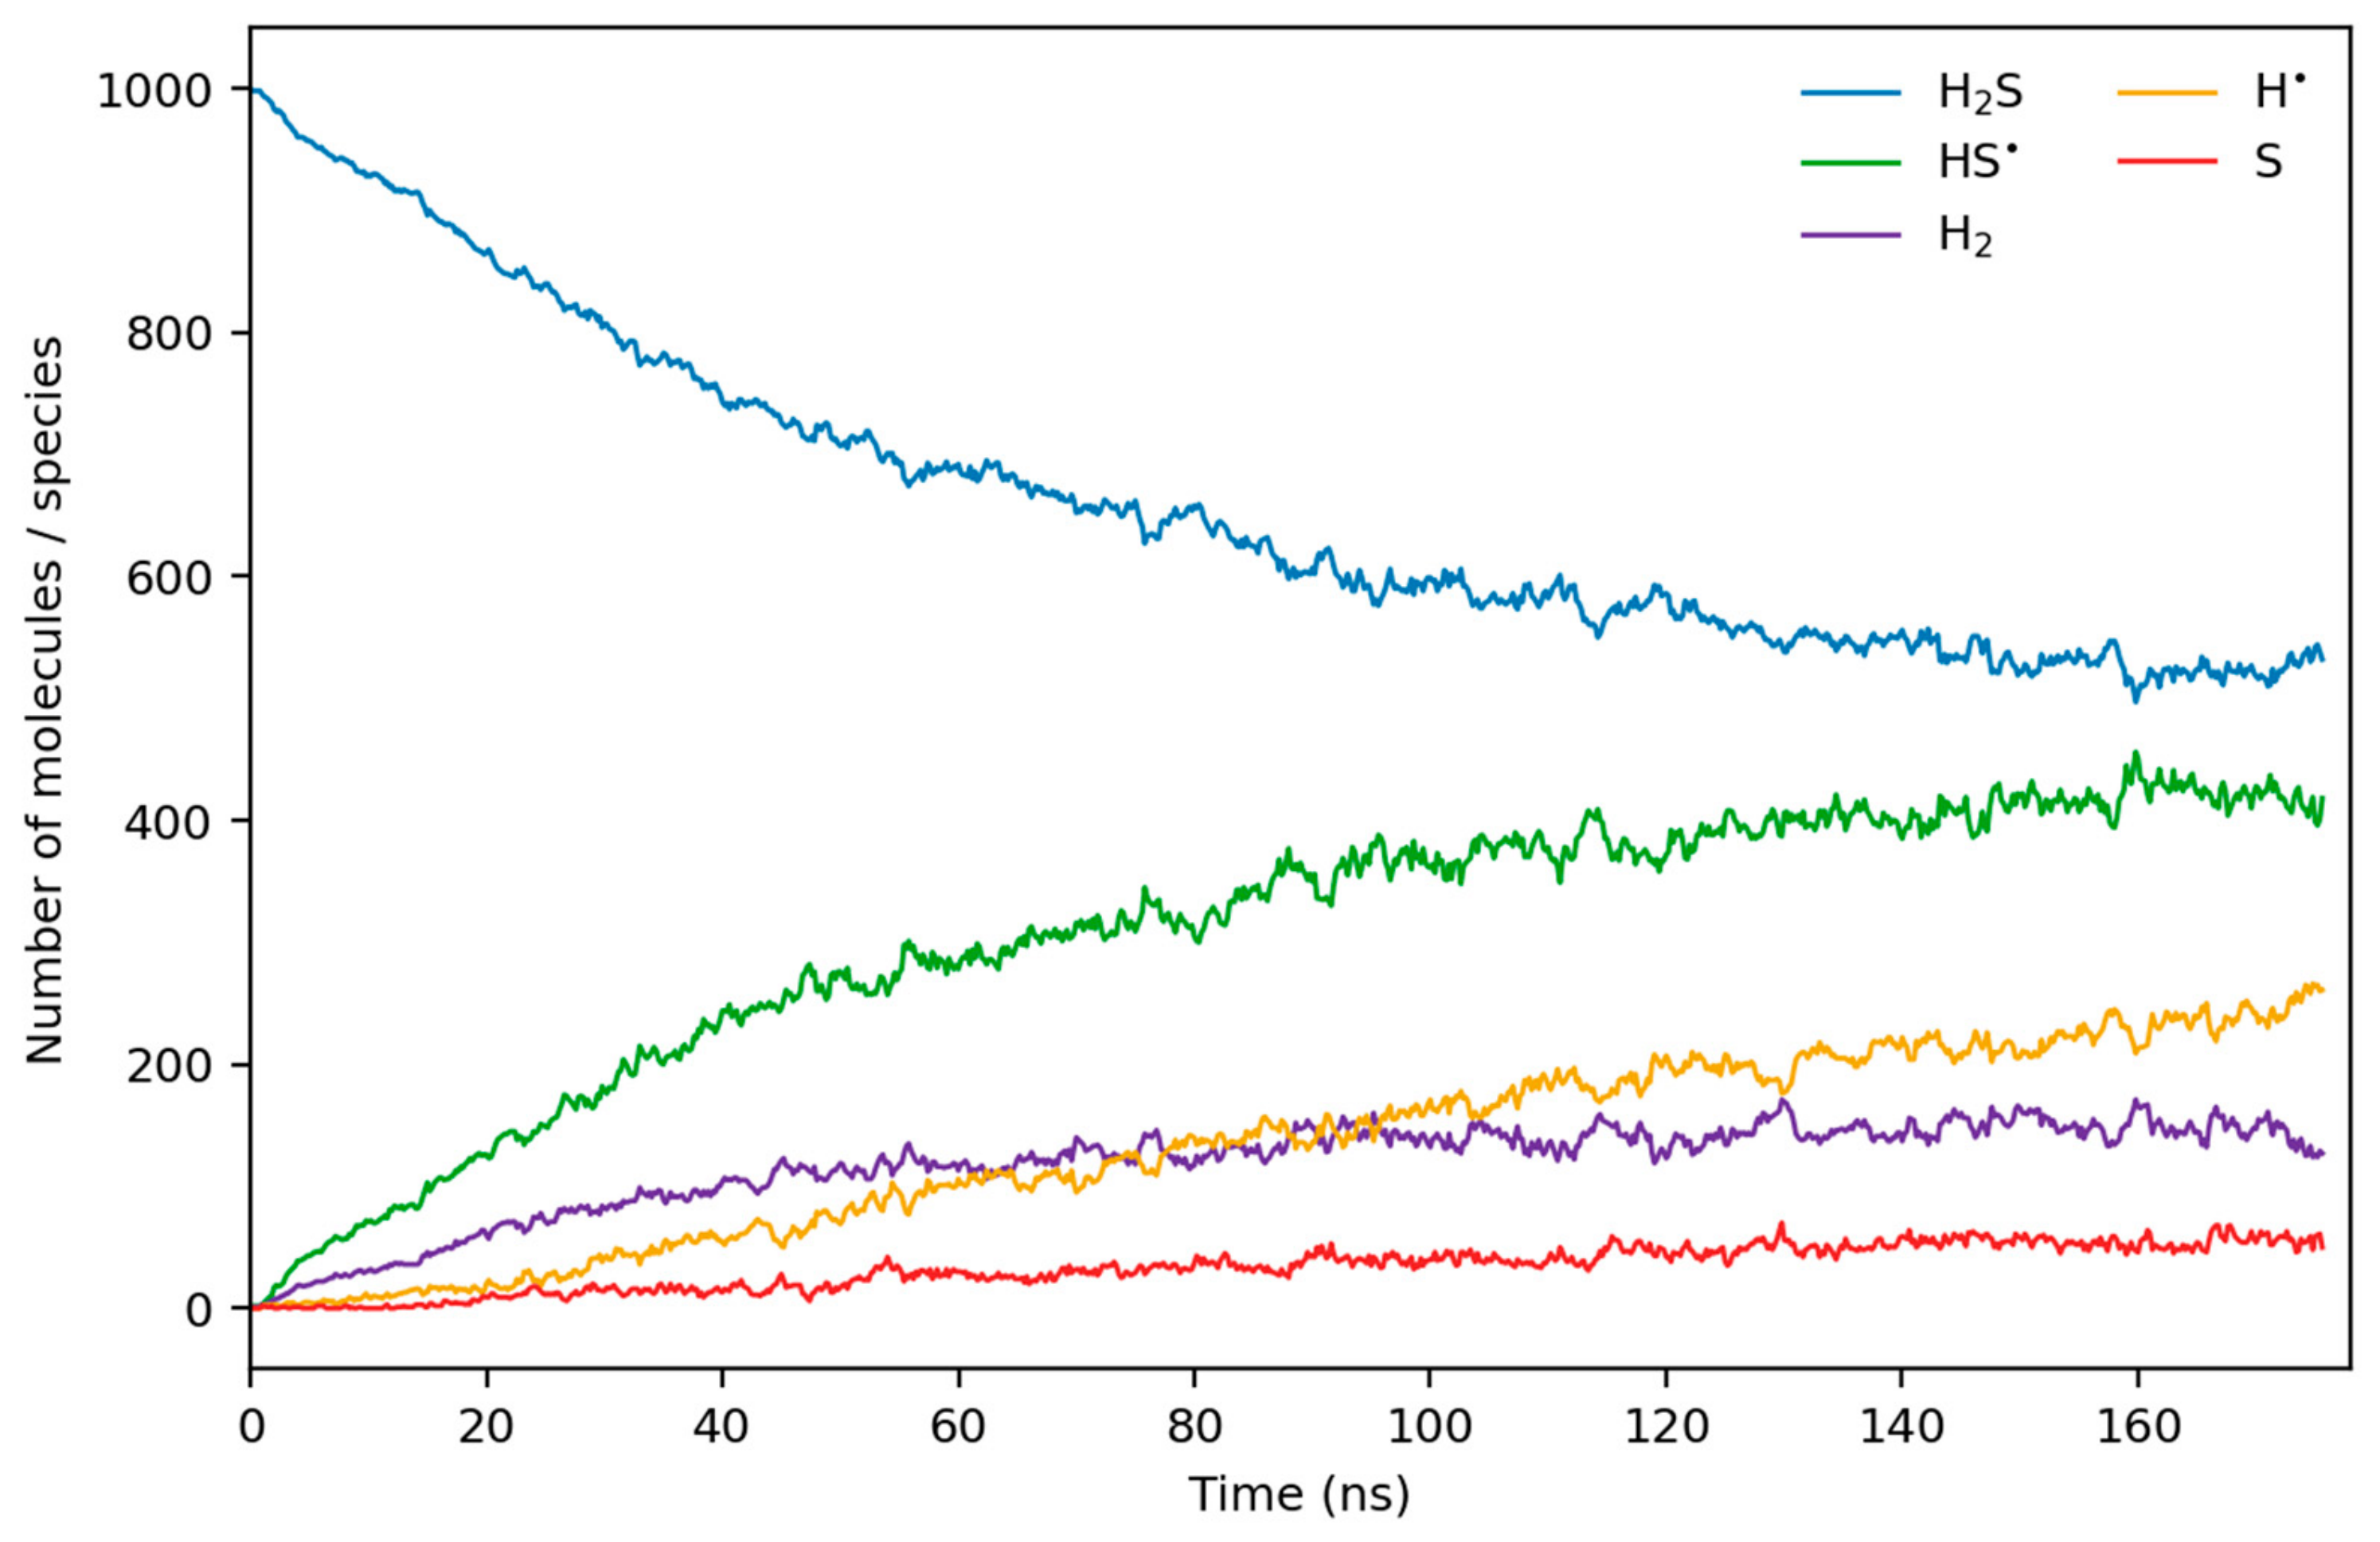
The temperature dependence of the rate-controlling structure was resolved into three successive stages: initiation (homolysis far from equilibrium, radical reservoir accumulating), propagation (abstraction activates and rapidly equilibrates, H2 rises to a broad maximum), and partial equilibrium (all reversible channels balanced, net conversion sustained only by the drainage of sulfur into chains). At 2500 K the mechanism reduces to a two-step chain: the population of free H• peaked at 11 atoms and ended at eight—a fraction of 10−3 of the 2000 hydrogen atoms—behaving as a quasi-steady-state intermediate, and the products satisfied the radical balance N(HS•) + 2N(S) = N(H•) + 2N(H2) to within the hydrogen atoms transiently held in bound intermediates at the final frame (95 vs. 92, a residual of exactly the three intermediate-bound H atoms; Figure 7, Table 2). The same balance closes exactly at all three temperatures once the bound intermediates are counted: the residual between N(HS•) + 2N(S) and N(H•) + 2N(H2)—95 vs. 92 (2500 K), 283 vs. 274 (3000 K) and 518 vs. 515 (3500 K)—equals in every case exactly the number of hydrogen atoms transiently held in the bound intermediates (HSSH, HS2•, [S2H3]•) at that instant: three, nine and three atoms. At 3500 K the radical reservoir thermalizes (H• ≈ 261), the quasi-steady-state approximation ceases to hold, and the system reaches a thermodynamically controlled partial equilibrium. This transition is resolved in time rather than inferred from endpoints: at 2500 K the free-H• population fluctuates about a low quasi-stationary level for the whole run (peak 11, final eight atoms), whereas at 3500 K it grows to ≈170 atoms by ≈105 ns and thereafter slows to a residual drift of ≈1 atom·ns−1 (≈215 → 243 atoms between 145 and 175 ns; Figure 8), a slow growth that tracks the drainage of sulfur into chains rather than a fast transient; 3000 K shows the same behavior at an intermediate level (≈63–74 atoms over the final 40 ns); the final inventories of Table 2 are therefore representative of the slowly drifting late-time reservoir rather than of a rapidly evolving transient.
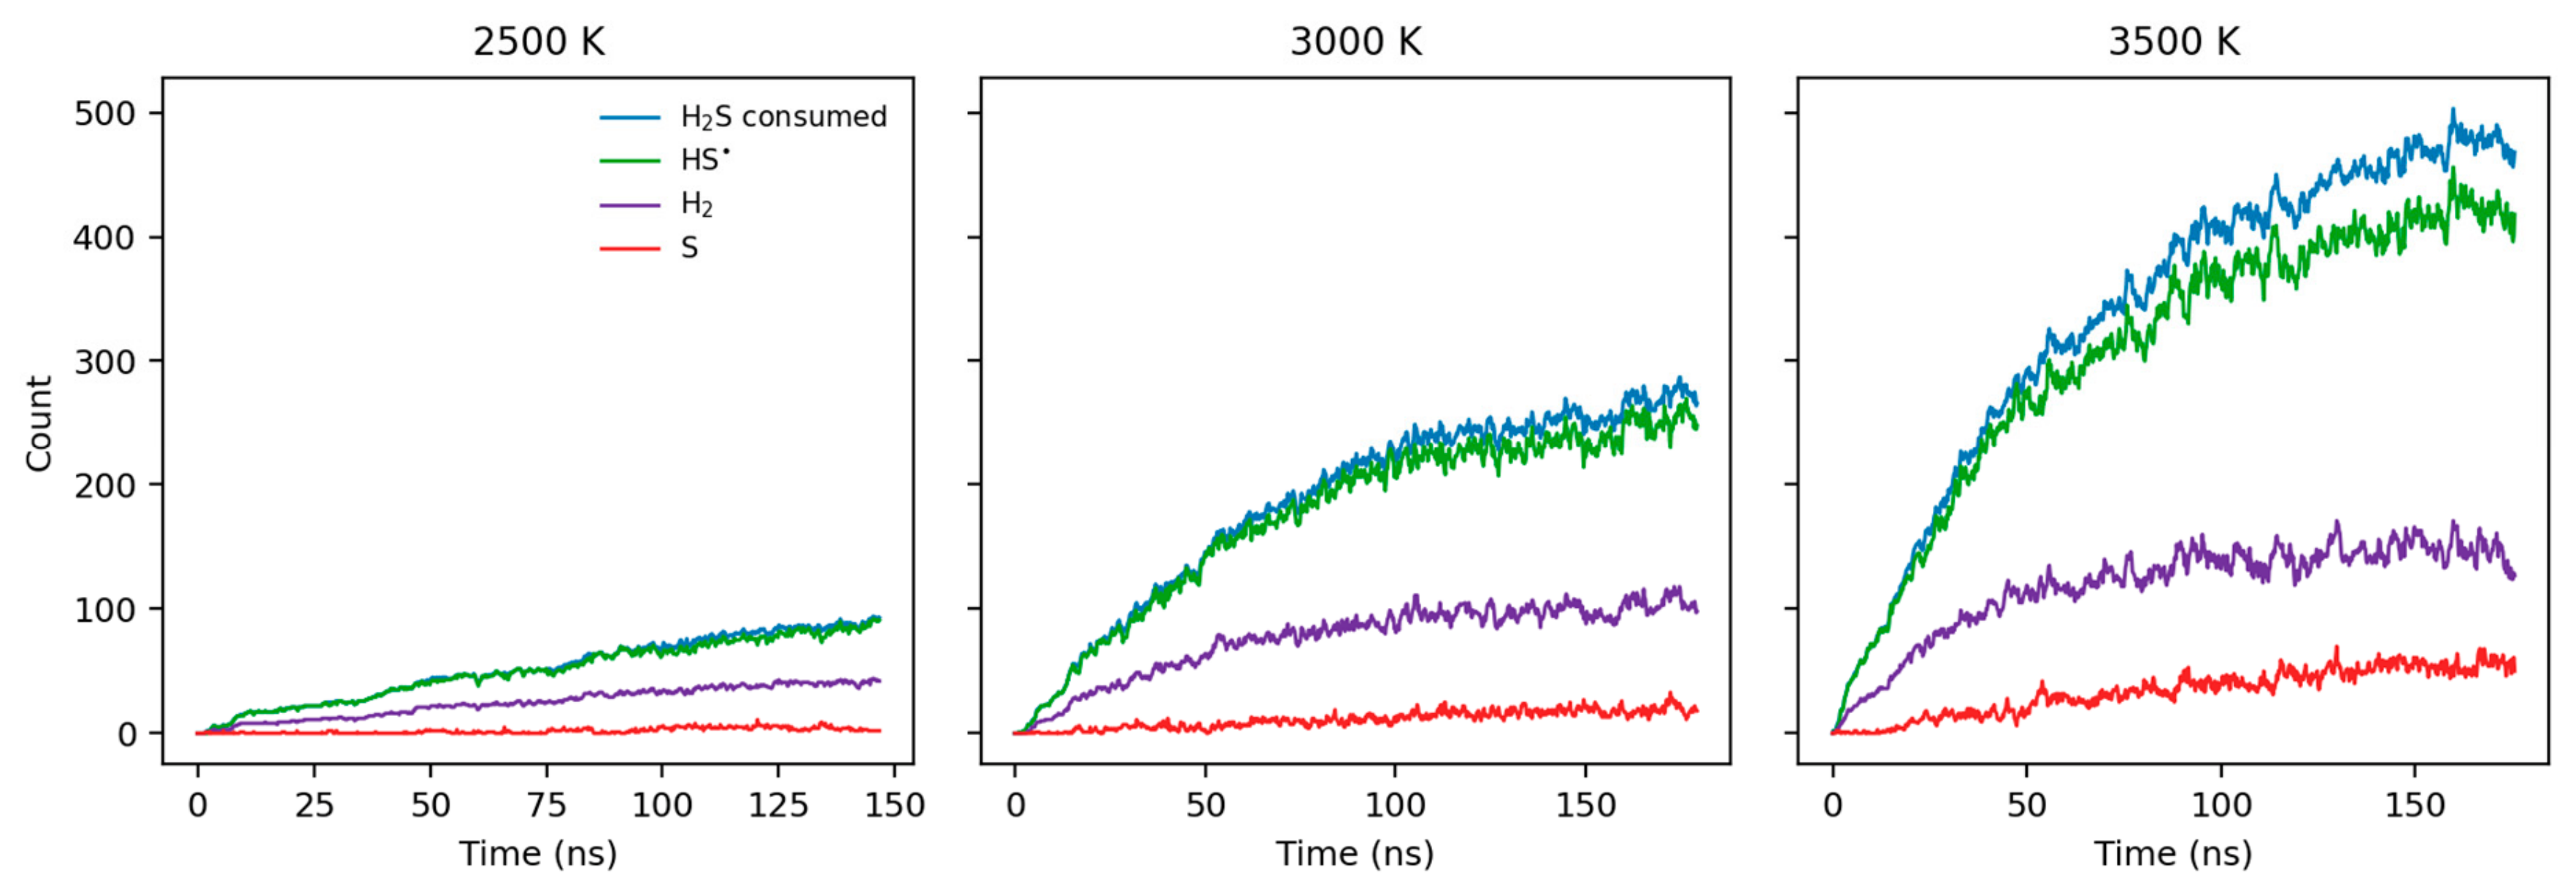
Figure 7 compares the main species at the three temperatures on a common scale. The HS• radical closely tracks the consumed H2S at all temperatures, reflecting its role as chain carrier, while atomic sulfur remains practically absent at 2500 K and accumulates appreciably only at 3500 K—the visual evidence that the sulfur sink opens only at the highest temperatures.

3.6. The Rate-Limiting Step: Sulfur Condensation

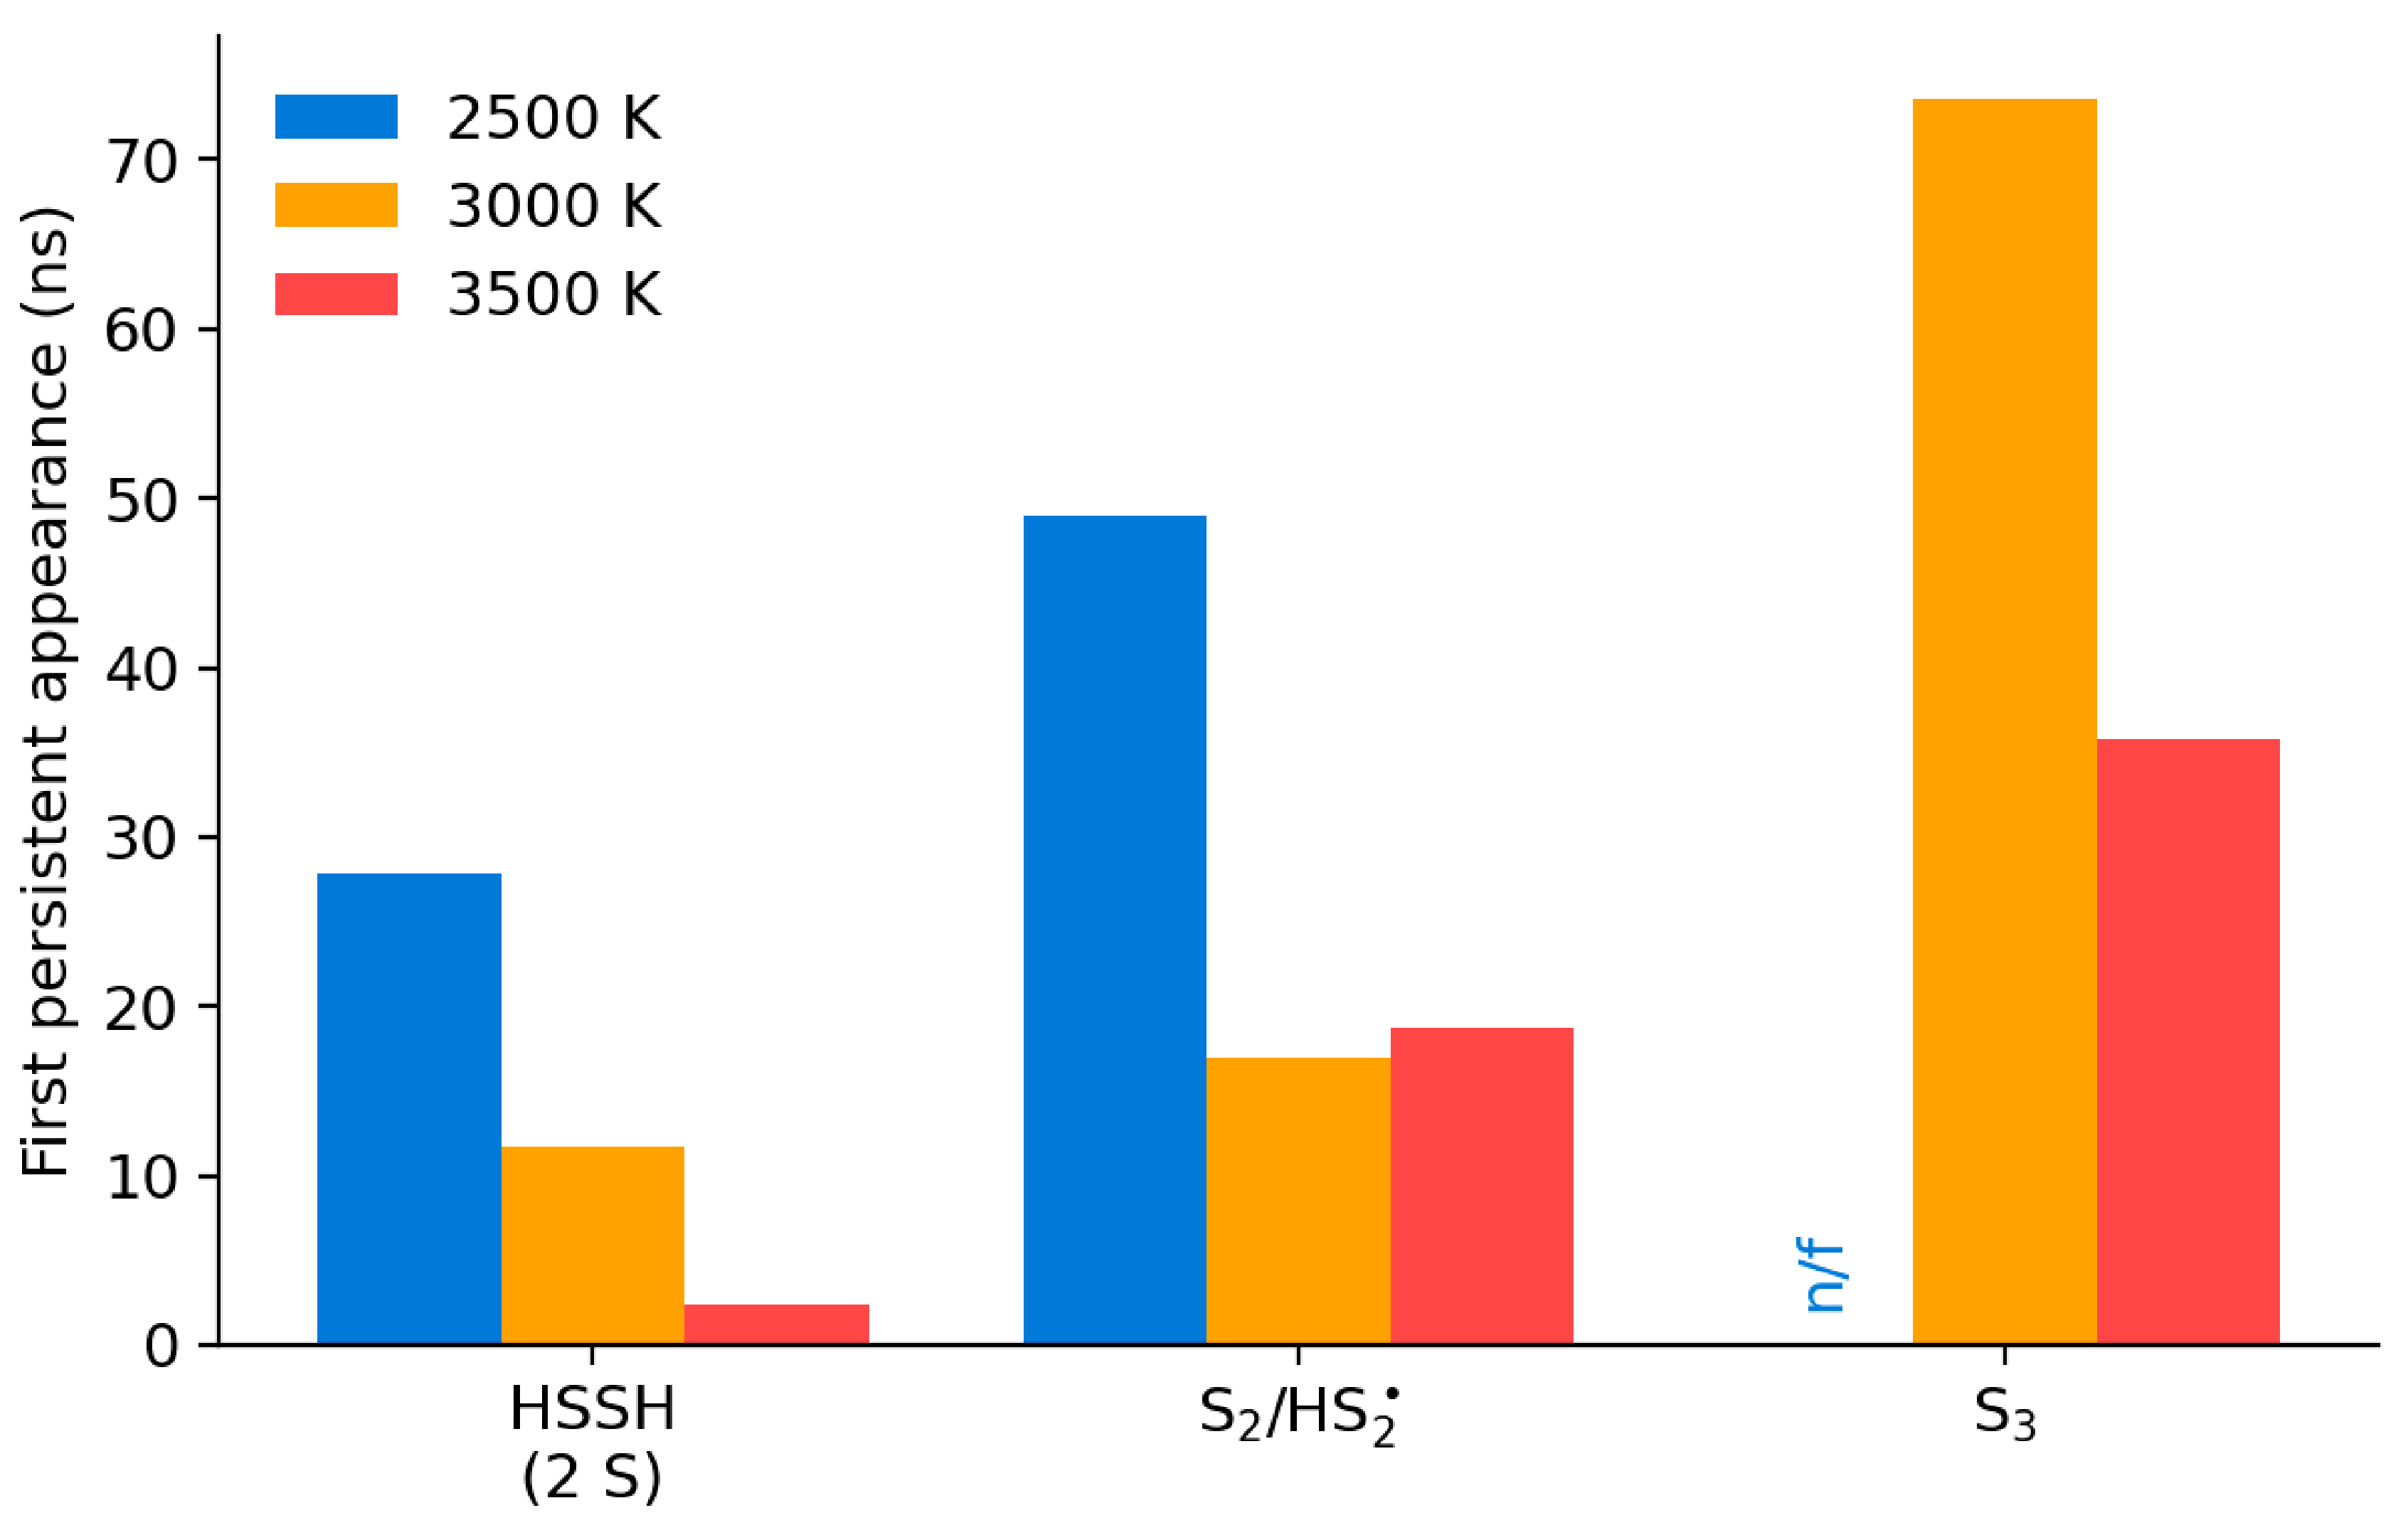
S–H bond events are counted in the tens of thousands, whereas S–S bond-forming events number only in the hundreds. Every sulfur atom that becomes fixed in a growing Sx chain irreversibly loses its capacity to produce net H2, so the net production of hydrogen follows the slow condensation of sulfur and not the fast, equilibrated abstraction step. Figure 9 and Table 3 show the first appearance of each sulfur-chain class that persisted for at least 10 ps—a criterion that excludes fleeting collision complexes. The persistent species appear in a strictly sequential order—HSSH, then S2, then S3—evidencing atom-by-atom chain growth, and every stage accelerates with temperature. Persistent S3 forms only at 3000 K and above. At 3500 K a single S4 aggregate was additionally observed near 87 ns, but it survived less than the 10 ps persistence threshold; it is therefore recorded as a transient encounter, consistent with—though not demonstrating—the next step of the growth sequence. At 2500 K no sulfur species beyond S2 ever persisted, which explains the stalling of the conversion at that temperature. The sequence observed here terminates at S3/S4 not because these species are a natural endpoint of the mechanism—equilibrium sulfur vapor extends to S6 and S8, which dominate at lower temperatures—but because the accessible window (147–180 ns, 1000 molecules) truncates a condensation cascade that is itself the slow, thermally activated stage of the process; on longer time scales, and particularly on cooling, growth toward the larger allotropes is expected to continue. The energetics of Section 3.3 tell the same story from the enthalpy side: the cost per molecule approaches the complete-dissociation limit precisely as the sulfur sink opens.
The event statistics of Table 1 make this argument kinetic rather than merely enumerative. The net flux of each reversible channel (forward minus reverse events) can be tested against its Poisson uncertainty: for homolysis the net fluxes are +29 (0.3σ), +135 (1.0σ) and +38 (0.2σ) at 2500, 3000 and 3500 K, and for abstraction +26 (1.0σ), +10 (0.1σ) and +50 (0.5σ)—statistically indistinguishable from zero, the signature of equilibrated channels that produce no net conversion on their own. The only channels whose net forward flux is statistically significant at 3500 K are those that drain sulfur from the radical reservoir: thiyl recombination (+127, 2.3σ), disproportionation (+122, 2.7σ) and elimination (+63, 1.8σ). The net conversion is therefore carried by the sulfur-condensation branch while the hydrogen chemistry idles at equilibrium—the kinetic definition of a rate-limiting condensation stage.
This result has an immediate reading for process engineering. Because the conversion advances only insofar as sulfur is removed from the quasi-equilibrated reservoir into chains, and because this drainage is slow and thermally activated, raising the temperature progressively opens the sulfur sink at the price of an energy cost that converges to the thermochemical limit. Below a certain temperature the process is effectively blocked at the sulfur link, however active the radical chemistry. The engineering lever to improve the yield is therefore to facilitate the removal or condensation of sulfur, rather than to optimize the already-equilibrated hydrogen chemistry.

3.7. Validation Summary

Table 4 collects the points of contact between the present simulations and independent experimental or theoretical results: the thermochemical validation of the energy cost, the kinetic order, the identity of the initiation step, the origin of the molecular hydrogen, the product spectrum, and the gas density at ambient conditions.

3.8. Limitations

Several limitations bound the quantitative scope of these results. First, ReaxFF evolves on a single effective potential-energy surface and does not track electronic spin, so the molecular-elimination channel to S(3P) + H2 appears in the simulations but its rate should not be compared quantitatively with experiment [12,13]. Second, classical nuclear dynamics neglects tunneling in the hydrogen-abstraction step; instanton calculations for H• + H2S → H2 + HS• give a crossover temperature—below which tunneling dominates—of Tc = 285 K, so at 2500–3500 K the system operates at 9–12 × Tc, deep in the classical over-barrier regime, and the neglect of tunneling introduces only a minor correction here, although it becomes significant if the present rates are extrapolated toward the low-temperature experimental regime [43]. Third, the global charge-equalization scheme leaves small residual charges on separated radicals; their electrostatic effect is much smaller than kT and does not alter the identity or ordering of the reaction channels, which rest on bond topology. Finally, the accessible time scale (hundreds of ns) restricts the study to T ≥ 2500 K; the experimental low-temperature regime remains beyond direct reach of RMD. In addition, one trajectory was run at each temperature: at 1.5–1.8 × 10⁹ time steps per run, full-scale independent replicates were computationally out of reach, so the reported uncertainties are internal (Poisson counting errors on event counts, binomial counting resolution on conversions, bootstrap errors on the enthalpy slopes); the five independent 100-molecule replicas at 3500 K show, however, that the run-to-run spread of conversions and channel frequencies is consistent with these counting statistics (Section 3.2), and the large production system (1000 molecules, 103–104 events per channel) provides substantial additional self-averaging. A further limitation is that no H2S-specific refit of the ReaxFF S–H parameters has been published; the individual S–H well depths of the present parametrization are overbound by 14–27% (Section 2.1), although the collective reaction energetics track the experimental thermochemistry (Section 3.3), indicating substantial error cancelation among the S–H, H–H and S–S terms.

4. Conclusions

A single, internally consistent set of reactive molecular dynamics simulations resolved the methodology, the energetics and the mechanism of H2S thermolysis. Methodologically, the interaction cutoff radius proved critical for dilute gases: the original 10 Å parametrization misses ~23 eV of non-bonded interaction energy and fails to capture dissociation at 3000 K, whereas 30–40 Å converges within the statistical resolution of the simulations; a thermal threshold for observable dissociation lies between 2000 and 2500 K on RMD time scales. Energetically, the system enthalpy rises linearly with the number of H2S molecules consumed, defining costs of 2.46 ± 0.04, 3.10 ± 0.08 and 3.95 ± 0.18 eV per molecule at 2500, 3000 and 3500 K that increase by ≈1.48 eV per 1000 K, with the cost at 3500 K lying between the 0 K complete-dissociation limit D0 = 3.90 eV and the Kirchhoff-corrected complete-dissociation enthalpy at that temperature (4.11–4.12 eV), statistically indistinguishable from the latter: a quantitative, thermochemically anchored validation of the approach. Mechanistically, thermolysis proceeds by a free-radical chain built from the same set of elementary steps at the three temperatures, whose relative contributions shift with temperature: homolytic S–H initiation, hydrogen abstraction as the essentially exclusive source of H2 (direct H• + H• recombination is negligible), and a rate-limiting sulfur-condensation stage that determines the net conversions attained on the simulated time scale—kinetic values that remain below the equilibrium conversions—with control shifting from a low-temperature quasi-steady-state chain to a high-temperature partial equilibrium. Beyond its mechanistic value, the analysis indicates that the removal of sulfur—not the hydrogen chemistry—is the bottleneck to be addressed when engineering the valorization of residual H2S as a source of green hydrogen.

Author Contributions

Conceptualization, J.L.R., A.L.-S. and M.R.-E.; methodology, J.L.R. and A.L.-S.; software and simulations, J.L.R., A.B.-V. and C.A.-T.; formal analysis, M.R.-E., A.L.-S. and J.L.R.; writing—original draft, A.L.-S. and J.L.R.; writing—review and editing, J.L.R. and M.R.-E.; supervision, J.L.R., A.L.-S. and M.R.-E. All authors have read and agreed to the published version of the manuscript.

Funding

This study received financial support from an internal grant provided by the Universidad Michoacana de San Nicolás de Hidalgo.

Data Availability Statement

The simulation trajectories, species-transition data and analysis scripts supporting the reported results are available from the authors upon reasonable request.

Conflicts of Interest

The authors declare no conflicts of interest.

References

  1. De Crisci, A.G.; Moniri, A.; Xu, Y. Hydrogen from Hydrogen Sulfide: Towards a More Sustainable Hydrogen Economy. Int. J. Hydrogen Energy 2019, 44, 1299–1327. [Google Scholar] [CrossRef] [Scilit]
  2. Spatolisano, E.; Restelli, F.; Pellegrini, L.A.; de Angelis, A.R. Waste to H2 Sustainable Processes: A Review on H2S Valorization Technologies. Energies 2024, 17, 620. [Google Scholar] [CrossRef] [Scilit]
  3. D’Imperio, S.; Lehr, C.R.; Oduro, H.; Druschel, G.; Kühl, M.; McDermott, T.R. Relative Importance of H2 and H2S as Energy Sources for Primary Production in Geothermal Springs. Appl. Environ. Microbiol. 2008, 74, 5802–5808. [Google Scholar] [CrossRef] [Scilit] [PubMed]
  4. Elsner, M.P.; Menge, M.; Müller, C.; Agar, D.W. The Claus Process: Teaching an Old Dog New Tricks. Catal. Today 2003, 79–80, 487–494. [Google Scholar] [CrossRef] [Scilit]
  5. Kaloidas, V.E.; Papayannakos, N.G. Hydrogen Production from the Decomposition of Hydrogen Sulphide. Equilibrium Studies on the System H2S/ H2/Si, (i = 1,…,8) in the Gas Phase. Int. J. Hydrogen Energy 1987, 12, 403–409. [Google Scholar] [CrossRef] [Scilit]
  6. Bowman, C.T.; Dodge, L.G. Kinetics of the Thermal Decomposition of Hydrogen Sulfide behind Shock Waves. Symp. Int. Combust. 1977, 16, 971–982. [Google Scholar] [CrossRef] [Scilit]
  7. Karan, K.; Mehrotra, A.K.; Behie, L.A. On reaction kinetics for the thermal decomposition of hydrogen sulfide. AIChE J. 1999, 45, 383–389. [Google Scholar] [CrossRef] [Scilit]
  8. Kaloidas, V.; Papayannakos, N. Kinetics of Thermal, Non-Catalytic Decomposition of Hydrogen Sulphide. Chem. Eng. Sci. 1989, 44, 2493–2500. [Google Scholar] [CrossRef] [Scilit]
  9. Zhang, Q.-Z.; Wang, W.; Thille, C.; Bogaerts, A. H2S Decomposition into H2 and S2 by Plasma Technology: Comparison of Gliding Arc and Microwave Plasma. Plasma Chem. Plasma Process. 2020, 40, 1163–1187. [Google Scholar] [CrossRef] [Scilit]
  10. Sassi, M.; Amira, N. Chemical Reactor Network Modeling of a Microwave Plasma Thermal Decomposition of H2S into Hydrogen and Sulfur. Int. J. Hydrogen Energy 2012, 37, 10010–10019. [Google Scholar] [CrossRef] [Scilit]
  11. Woiki, D.; Roth, P. Kinetics of the High-Temperature H2S Decomposition. J. Phys. Chem. 1994, 98, 12958–12963. [Google Scholar] [CrossRef] [Scilit]
  12. Olschewski, H.A.; Troe, J.; Wagner, H.G. UV Absorption Study of the Thermal Decomposition Reaction H2S. Fwdarw. H2 + S(3P). J. Phys. Chem. 1994, 98, 12964–12967. [Google Scholar] [CrossRef] [Scilit]
  13. Shiina, H.; Oya, M.; Yamashita, K.; Miyoshi, A.; Matsui, H. Kinetic Studies on the Pyrolysis of H2S. J. Phys. Chem. 1996, 100, 2136–2140. [Google Scholar] [CrossRef] [Scilit]
  14. Senftle, T.P.; Hong, S.; Islam, M.M.; Kylasa, S.B.; Zheng, Y.; Shin, Y.K.; Junkermeier, C.; Engel-Herbert, R.; Janik, M.J.; Aktulga, H.M.; et al. The ReaxFF Reactive Force-Field: Development, Applications and Future Directions. npj Comput. Mater. 2016, 2, 15011. [Google Scholar] [CrossRef] [Scilit]
  15. Chenoweth, K.; van Duin, A.C.T.; Goddard, W.A. ReaxFF Reactive Force Field for Molecular Dynamics Simulations of Hydrocarbon Oxidation. J. Phys. Chem. A 2008, 112, 1040–1053. [Google Scholar] [CrossRef] [Scilit] [PubMed]
  16. Zhang, J.-H.; Wang, Y.-Q.; Chen, J.-G.; Ma, Y.; Liu, Y.; Wang, K.; Wang, Y.; Liu, Z.-T.; Wang, B.; Liu, Z.-W. ReaxFF MD Simulations of Thermolysis Mechanism of 1,3,5-Trinitrobenzene. Comput. Theor. Chem. 2026, 1260, 115788. [Google Scholar] [CrossRef] [Scilit]
  17. Zhang, W.; van Duin, A.C.T. Improvement of the ReaxFF Description for Functionalized Hydrocarbon/Water Weak Interactions in the Condensed Phase. J. Phys. Chem. B 2018, 122, 4083–4092. [Google Scholar] [CrossRef] [Scilit] [PubMed]
  18. Müller, J.; Hartke, B. ReaxFF Reactive Force Field for Disulfide Mechanochemistry, Fitted to Multireference Ab Initio Data. J. Chem. Theory Comput. 2016, 12, 3913–3925. [Google Scholar] [CrossRef] [Scilit] [PubMed]
  19. Ostadhossein, A.; Rahnamoun, A.; Wang, Y.; Zhao, P.; Zhang, S.; Crespi, V.H.; van Duin, A.C.T. ReaxFF Reactive Force-Field Study of Molybdenum Disulfide (MoS2). J. Phys. Chem. Lett. 2017, 8, 631–640. [Google Scholar] [CrossRef] [Scilit] [PubMed]
  20. Rappe, A.K.; Goddard, W.A.I. Charge Equilibration for Molecular Dynamics Simulations. J. Phys. Chem. 1991, 95, 3358–3363. [Google Scholar] [CrossRef] [Scilit]
  21. Thompson, A.P.; Aktulga, H.M.; Berger, R.; Bolintineanu, D.S.; Brown, W.M.; Crozier, P.S.; in ’t Veld, P.J.; Kohlmeyer, A.; Moore, S.G.; Nguyen, T.D.; et al. LAMMPS—A Flexible Simulation Tool for Particle-Based Materials Modeling at the Atomic, Meso, and Continuum Scales. Comput. Phys. Commun. 2022, 271, 108171. [Google Scholar] [CrossRef] [Scilit]
  22. Shinoda, W.; Shiga, M.; Mikami, M. Rapid Estimation of Elastic Constants by Molecular Dynamics Simulation under Constant Stress. Phys. Rev. B 2004, 69, 134103. [Google Scholar] [CrossRef] [Scilit]
  23. Peña-Obeso, P.J.; Huirache-Acuña, R.; Ramirez-Zavaleta, F.I.; Rivera, J.L. Stability of Non-Concentric, Multilayer, and Fully Aligned Porous MoS2 Nanotubes. Membranes 2022, 12, 818. [Google Scholar] [CrossRef] [Scilit] [PubMed]
  24. Voyiatzis, E.; Stepanyan, R. Sensitivity Analysis of ReaxFF Potential: The Case of Si/O System. J. Phys. Chem. B 2022, 126, 7027–7036. [Google Scholar] [CrossRef] [Scilit] [PubMed]
  25. Nwankwo, U.; Lam, C.-H.; Onofrio, N. Reactive Force Field Potential with Shielded Long-Range Coulomb Interaction: Application to Graphene–Water Capacitors. J. Appl. Phys. 2023, 134, 184502. [Google Scholar] [CrossRef] [Scilit]
  26. Rivera, J.L.; Molina-Rodríguez, L.; Ramos-Estrada, M.; Navarro-Santos, P.; Lima, E. Interfacial Properties of the Ionic Liquid [Bmim][Triflate] over a Wide Range of Temperatures. RSC Adv. 2018, 8, 10115–10123. [Google Scholar] [CrossRef] [Scilit] [PubMed]
  27. Rivera, J.L.; Douglas, J.F. Influence of Film Thickness on the Stability of Free-Standing Lennard-Jones Fluid Films. J. Chem. Phys. 2019, 150, 144705. [Google Scholar] [CrossRef] [Scilit] [PubMed]
  28. Lemmon, E.W.; Span, R. Short Fundamental Equations of State for 20 Industrial Fluids. J. Chem. Eng. Data 2006, 51, 785–850. [Google Scholar] [CrossRef] [Scilit]
  29. Galler, B.A.; Fisher, M.J. An Improved Equivalence Algorithm. Commun. ACM 1964, 7, 301–303. [Google Scholar] [CrossRef] [Scilit]
  30. Hoshen, J.; Kopelman, R. Percolation and Cluster Distribution. I. Cluster Multiple Labeling Technique and Critical Concentration Algorithm. Phys. Rev. B 1976, 14, 3438–3445. [Google Scholar] [CrossRef] [Scilit]
  31. Stoddard, S.D. Identifying Clusters in Computer Experiments on Systems of Particles. J. Comput. Phys. 1978, 27, 291–293. [Google Scholar] [CrossRef] [Scilit]
  32. Flyvbjerg, H.; Petersen, H.G. Error Estimates on Averages of Correlated Data. J. Chem. Phys. 1989, 91, 461–466. [Google Scholar] [CrossRef] [Scilit]
  33. Efron, B. Bootstrap Methods: Another Look at the Jackknife. In Breakthroughs in Statistics: Methodology and Distribution; Kotz, S., Johnson, N.L., Eds.; Springer: New York, NY, USA, 1992; pp. 569–593. [Google Scholar]
  34. Shiell, R.C.; Hu, X.K.; Hu, Q.J.; Hepburn, J.W. A Determination of the Bond Dissociation Energy (D0(H−SH)):  Threshold Ion-Pair Production Spectroscopy (TIPPS) of a Triatomic Molecule. J. Phys. Chem. A 2000, 104, 4339–4342. [Google Scholar] [CrossRef] [Scilit]
  35. Peebles, L.R.; Marshall, P. High-Accuracy Coupled-Cluster Computations of Bond Dissociation Energies in SH, H2S, and H2O. J. Chem. Phys. 2002, 117, 3132–3138. [Google Scholar] [CrossRef] [Scilit]
  36. McBride, B.; Zehe, M.; Gordon, S. NASA Glenn Coefficients for Calculating Thermodynamic Properties of Individual Species; National Aeronautics and Space Administration (NASA): Washington, DC, USA, 2002. [Google Scholar]
  37. Nezbeda, I. Role of the Range of Intermolecular Interactions in Fluids. Curr. Opin. Colloid Interface Sci. 2004, 9, 107–111. [Google Scholar] [CrossRef] [Scilit]
  38. Togashi, Y.; Kaneko, K. Transitions Induced by the Discreteness of Molecules in a Small Autocatalytic System. Phys. Rev. Lett. 2001, 86, 2459–2462. [Google Scholar] [CrossRef] [Scilit] [PubMed]
  39. Sirmas, N.; Radulescu, M.I. Thermal Ignition Revisited with Two-Dimensional Molecular Dynamics: Role of Fluctuations in Activated Collisions. Combust. Flame 2017, 177, 79–88. [Google Scholar] [CrossRef] [Scilit]
  40. Liu, S.; Wei, L.; Zhou, Q.; Yang, T.; Li, S.; Zhou, Q. Simulation Strategies for ReaxFF Molecular Dynamics in Coal Pyrolysis Applications: A Review. J. Anal. Appl. Pyrolysis 2023, 170, 105882. [Google Scholar] [CrossRef] [Scilit]
  41. Sendt, K.; Jazbec, M.; Haynes, B.S. Chemical Kinetic Modeling of the H/S System: H2S Thermolysis and H2 Sulfidation. Proc. Combust. Inst. 2002, 29, 2439–2446. [Google Scholar] [CrossRef] [Scilit]
  42. Yoshimura, M.; Koshi, M.; Matsui, H.; Kamiya, K.; Umeyama, H. Non-Arrhenius Temperature Dependence of the Rate Constant for the H + H2S Reaction. Chem. Phys. Lett. 1992, 189, 199–204. [Google Scholar] [CrossRef] [Scilit]
  43. Lamberts, T.; Kästner, J. Tunneling Reaction Kinetics for the Hydrogen Abstraction Reaction H + H2S → H2 + HS in the Interstellar Medium. J. Phys. Chem. A 2017, 121, 9736–9741. [Google Scholar] [CrossRef] [Scilit] [PubMed]
  44. Peng, J.; Hu, X.; Marshall, P. Experimental and Ab Initio Investigations of the Kinetics of the Reaction of H Atoms with H2S. J. Phys. Chem. A 1999, 103, 5307–5311. [Google Scholar] [CrossRef] [Scilit]
Figure 2. Evolution of the total enthalpy for 1000 H2S molecules at 298.15 K and 1 atm, for cutoff radii of 10, 15 and 18 Å. Light traces are instantaneous values; bold curves are block averages. The 10 Å model converges an order of magnitude more slowly and settles ≈ 23 eV above the higher-cutoff models.
Hydrogen 07 00117 g002
Figure 3. Thermolysis kinetics at 3000 K and 1 atm for cutoff radii of 18, 30 and 40 Å: (a) H2S, (b) H2 and (c) HS• versus simulation time. The dissociation rate increases with the cutoff radius but converges; at 130 ns the conversion is 21.8%, 24.3% and 25.3% for 18, 30 and 40 Å.
Hydrogen 07 00117 g003
Figure 4. Thermolysis kinetics at 1 atm and rC = 40 Å for 2500, 3000 and 3500 K: (a) H2S, (b) H2 and (c) HS• versus simulation time. Higher temperature increases both the rate and the extent of conversion.
Hydrogen 07 00117 g004
Figure 5. Energetics of the thermolysis. (a) Enthalpy change versus H2S molecules consumed at the three temperatures (block averages, common origin). Dashed curve: Kirchhoff-corrected H–SH bond dissociation enthalpy (4.11–4.12 eV at the simulation temperatures, squares); solid gray line: its high-temperature asymptote (4.16 eV); dotted line: D0 at 0 K (3.90 eV, ref. [34]). (b) Enthalpy cost vs Kirchhoff corrected cost as a function of temperature; error bars are bootstrap estimates.
Hydrogen 07 00117 g005
Figure 6. Elementary reaction network of H2S thermolysis reconstructed from the RMD trajectories. Gray boxes denote transient intermediates; the sulfur-condensation step (red) is rate-limiting for the net conversion.
Hydrogen 07 00117 g006
Figure 7. Comparison of the evolution of the main species at 2500, 3000 and 3500 K. The HS• radical tracks the consumed H2S; atomic sulfur accumulates appreciably only at high temperature.
Hydrogen 07 00117 g007
Figure 8. Evolution of the species populations at 3500 K (initial system of 1000 H2S molecules). H2S decreases from 1000 to 533 (46.7% conversion); H2 passes through a broad maximum (≈175 molecules near 130 ns) and declines slowly thereafter as sulfur condensation shifts the partial equilibrium.
Hydrogen 07 00117 g008
Figure 9. First persistent appearance (≥10 ps) of the sulfur-chain species. Growth is sequential and accelerates with temperature; persistent S3 requires ≥3000 K, and S4 appeared only transiently at 3500 K (n/f, no persistent occurrence).
Hydrogen 07 00117 g009
Table 1. Event counts (forward/reverse) of the main elementary reactions, identified by isolated co-occurrence signatures at 1 ps resolution. Channels forming a bound pair (HSSH; H2 from H• + H•) are counted only when the product persists ≥ 10 ps; transient collision complexes (thousands per run) and degenerate hydrogen-exchange events are excluded. Uncertainties are Poisson counting errors (±√N); for counts below ≈20 these intervals are indicative only.
Reaction2500 K3000 K3500 K
H2S ⇌ HS• + H• (homolysis)3935 ± 63/3906 ± 628714 ± 93/8579 ± 9312,109 ± 110/12,071 ± 110
H• + H2S ⇌ H2 + HS• (abstraction)352 ± 19/326 ± 182713 ± 52/2703 ± 524181 ± 65/4131 ± 64
H2S ⇌ H2 + S (elimination)25 ± 5/15 ± 4193 ± 14/178 ± 13627 ± 25/564 ± 24
2 HS• ⇌ HSSH (bound ≥ 10 ps)143 ± 12/140 ± 12916 ± 30/902 ± 301595 ± 40/1468 ± 38
HSSH ⇌ H2S + S (disproportionation)56 ± 7/53 ± 7565 ± 24/556 ± 241097 ± 33/975 ± 31
H• + H• → H2 (persistent ≥ 10 ps)11317
Table 2. Final species inventories at the three temperatures. Conversion is referred to the initial 1000 H2S molecules; values refer to the end of the extended runs (147–180 ns) and are kinetic, not equilibrium, conversions. A few hydrogen atoms (3, 9 and 3 at 2500, 3000 and 3500 K) reside in transient bound intermediates at the final frame; the inventories close exactly when these are included.
T (K)t (ns)H2S (conv.)HS•H•H2S
2500147907 (9.3%)918422
3000180737 (26.3%)243849520
3500176533 (46.7%)41626112751
Table 3. First appearance (ns, reactive window) of each condensed-sulfur class persisting ≥ 10 ps. n/f: no persistent occurrence within the simulated window.
Species2500 K3000 K3500 K
HSSH (2 S)27.911.72.4
S2/HS249.016.918.7
S3 speciesn/f73.635.8
S4 speciesn/fn/ftransient (~87)
Table 4. Summary of simulated thermochemical, kinetic and mechanistic observables against independent experimental or theoretical references.
ObservableThis Work (RMD)Independent Value/ObservationSources
Energy cost per H2S consumed, 3500 K3.95 ± 0.18 eVKirchhoff-corrected complete-dissociation enthalpy 4.11–4.12 eV; D0(0 K) = 3.90 eV[34,35,36]
Gas density, 298.15 K, 1 atmReproduced (Figure 1)Reference equation of state[28]
Kinetic order in H2SConsistent with first orderFirst order, flow reactors (800–1250 °C)[7,8]
Initiation stepS–H homolysis, near-equilibratedHomolysis inferred from shock-tube studies[6,11]
Source of H2Hydrogen abstraction (persistent H• + H• recombination < 0.5% of abstraction events)Canonical propagation step of H/S kinetic models[41,42,43,44]
Product spectrumH2, HS•, S2–S3; HSSH and [H3S]• as intermediatesProducts of homolytic mechanisms in thermal plasma[9,10]
Conversion trend with temperature9.3 ± 0.9% → 26.3 ± 1.4% → 46.7 ± 1.6% (2500 → 3500 K)Strongly temperature-limited conversion[5]
Disclaimer/Publisher’s Note: The statements, opinions and data contained in all publications are solely those of the individual author(s) and contributor(s) and not of MDPI and/or the editor(s). MDPI and/or the editor(s) disclaim responsibility for any injury to people or property resulting from any ideas, methods, instructions or products referred to in the content.