Article

Performance Analysis and Assessment of an Integrated Solar-Hydrogen System with SMR, PEM Electrolysis, and Fuel Cell Technologies for North Texas


Department of Mechanical, Environmental, and Civil Engineering, Mayfield College of Engineering, Tarleton State University, 270 Saint Peter Street, Stephenville, TX 76401, USA
*
Author to whom correspondence should be addressed.
Hydrogen 2026, 7(3), 110; https://doi.org/10.3390/hydrogen7030110
Submission received: 3 July 2026 / Revised: 26 July 2026 / Accepted: 3 August 2026 / Published: 6 August 2026
(This article belongs to the Special Issue Hydrogen Energy and Fuel Cell Technology)

Abstract

Hydrogen has emerged as a promising energy carrier for sustainable, low-carbon energy systems because of its high energy density and compatibility with fuel cell technologies. This study presents a comprehensive investigation of hydrogen production through the integration of steam methane reforming (SMR), solar photovoltaic (PV) power generation, proton exchange membrane (PEM) electrolysis, hydrogen storage, and PEM fuel cells. A three-dimensional computational fluid dynamics (CFD) model was developed to analyze fluid flow, heat transfer, species transport, and chemical reactions within a catalytic steam methane reformer. The simulation predicted a methane conversion of 94.71%, a hydrogen yield of 3.75 mol H2/mol CH4, and an overall efficiency of 63.35%, indicating highly efficient hydrogen production. Sensitivity analyses identify catalyst temperature, inlet temperature, and residence time as the dominant parameters affecting hydrogen yield. Integration with renewable energy systems demonstrated that a hybrid configuration consisting of a 120 kW PV array, a 50 kW PEM electrolyzer, a 6 kW PEM fuel cell, and 6–8 kg hydrogen storage can effectively support sustainable hydrogen production and auxiliary power demands. The proposed framework provides a practical pathway for integrating thermochemical and renewable hydrogen technologies into future energy applications worldwide.

1. Introduction

The integration of renewable energy sources with hydrogen production technologies has become a crucial component of the global transition to sustainable energy systems [1,2,3,4,5]. Electrolysis is the process of splitting water molecules to produce hydrogen and is a well-established technology [6,7]. Alkaline electrolyzers are the most commonly used, but they often fail to produce hydrogen pure enough for fuel cell applications [8,9]. PEM electrolyzers can offer high-purity hydrogen but require high-quality water, which is both expensive and resource-intensive to produce. PEM electrolyzers provide a highly efficient method for producing hydrogen and oxygen from water using electricity derived from renewable sources such as solar and wind [10,11,12]. To optimize the performance of PEM electrolyzers, several design and operational factors must be considered, including cell architecture, operating conditions, energy management, and storage systems. A key aspect of PEM electrolyzer performance lies in the careful selection and design of its components. This includes high-conductivity membranes, corrosion-resistant electrodes, and well-structured gas diffusion layers, all of which work together to facilitate efficient electrochemical reactions. In addition, flow field geometry plays a vital role in ensuring uniform reactant distribution and effective removal of gaseous products. Beyond cell design, operating conditions such as temperature, pressure, and water purity significantly impact the system’s efficiency and longevity. Moreover, since renewable energy sources are inherently intermittent, reliable and stable, DC power supplies and energy storage solutions such as lithium-ion or flow batteries are essential [13,14]. These battery systems not only store excess energy generated during peak periods, but also ensure uninterrupted electrolyzer operation during times of low renewable output. The performance and durability of a PEM electrolyzer strongly depend on careful material selection and cell design. A high-conductivity and chemically stable membrane, such as Nafion, is essential to ensure efficient proton transport while maintaining long-term durability under acidic operating conditions [15,16]. Catalyst-coated electrodes are typically employed, with platinum used at the hydrogen electrode and iridium at the oxygen electrode, providing high catalytic activity, large effective surface area, and strong corrosion resistance [17,18]. The gas diffusion layers must be designed to achieve an optimal balance between water management, gas permeability, and mechanical integrity to support stable operation. In addition, the flow field geometry plays a critical role in ensuring uniform reactant distribution and effective removal of product gases, thereby minimizing pressure losses and enhancing overall cell efficiency [19]. The operational performance of a PEM electrolyzer is strongly influenced by temperature, pressure, and water quality. Elevated operating temperatures, typically in the range of 50–80 °C, enhance proton conductivity and accelerate reaction kinetics, thereby improving overall efficiency; however, effective thermal management is required to prevent membrane degradation and ensure system stability. Recent studies indicate that the optimal operating temperature of PEM electrolyzers varies with the State-of-Health (SOH) of key components. SOH-based thermal management can adjust operating temperature to reduce degradation, improve hydrogen production efficiency, and extend electrolyzer lifetime under variable renewable energy conditions [20]. Operating under pressurized conditions, up to approximately 30 bars, can increase hydrogen purity and reduce downstream compression requirements, although it introduces additional mechanical and system complexity. Furthermore, high-quality ultrapure water is essential to prevent membrane fouling, catalyst poisoning, and scaling, thereby extending the operational lifespan and maintaining consistent electrochemical performance [21]. Compared to a water-based electrolyzer, a SMR is a high-temperature chemical reactor used to produce hydrogen from natural gas through the endothermic reaction between methane ( C H 4 ) and steam ( H 2 O ) [22,23,24].
Steam methane reforming (SMR) is the most widely used industrial process for hydrogen production and can utilize either natural gas or upgraded biogas as the feedstock [25,26]. In this process, the feed gas is desulfurized, preheated, mixed with steam, and introduced into a catalytic reformer to produce a hydrogen-rich synthesis gas. Although industrial SMR systems commonly include a water-gas shift (WGS) reactor to enhance hydrogen production, only the primary SMR reaction was considered in the present CFD study. The CFD model represents a high-temperature catalytic reactor with the catalyst region maintained at 1250 K. The reactant mixture enters the reactor at 837 K and 1.5 MPa with turbulent flow conditions, while the outlet pressure is maintained at 100 kPa. The reactor walls are assumed to be adiabatic with no-slip boundary conditions. Natural gas generally provides higher hydrogen yields because of its higher methane content, whereas biogas offers a renewable alternative with lower lifecycle carbon emissions but requires additional cleaning and upgrading because of impurities and carbon dioxide dilution [27,28,29,30,31,32]. The reformer comprises several reactor tubes filled with reforming catalysts and provides heat for the endothermic reaction and operates in the temperature range between 500 °C and 900 °C and pressure from 15 bars to 20 bars [33,34].
The overall process involves two key reactions, which are based on steam reforming reactions in Equation (1).
C H 4   ( g ) + H 2   O ( g ) C O + 3 H 2 g     Δ H = + 206   k J / m o l
This highly endothermic reaction occurs inside catalyst-filled reformer tubes, typically using nickel-based catalysts, at temperatures between 800 and 950 °C and pressures ranging from 15 to 30 bar [35]. The water–gas shift reaction (WGS) takes place downstream of the reformer to convert carbon monoxide into additional hydrogen and carbon monoxide as shown in Equation (2).
C O g + H 2   O g C O 2   g + H 2 g     Δ H = 41   k J / m o l
The reactor consists of multiple tubes packed with catalysts placed inside a fire furnace, where heat is supplied by burning natural gas or other fuels. The reformer’s performance strongly depends on temperature uniformity, residence time, steam-to-carbon (S/C) ratio, and catalyst activity.
The goal of this study is to develop and evaluate an integrated hydrogen production system that combines SMR, solar PV energy system, PEM electrolysis, hydrogen storage, and PEM fuel cells. The study aims to improve hydrogen production efficiency, optimize energy utilization, and support the development of sustainable and low-carbon energy systems. By integrating thermochemical and electrochemical hydrogen production technologies with renewable energy resources, the study seeks to establish a reliable framework for continuous hydrogen generation and energy management. To achieve this goal, a three-dimensional CFD model of the SMR was developed to investigate fluid flow, heat transfer, species transport, and chemical reaction kinetics within the catalytic reactor. The model was used to evaluate methane conversion, hydrogen yield, temperature distribution, and overall reactor performance under representative operating conditions. In addition, the study examined the effects of key operating and geometric parameters, including catalyst temperature, inlet temperature, pressure, gas velocity, catalyst length, porosity, wall thickness, and pipe diameter, on hydrogen production and reforming efficiency. Furthermore, the research evaluated the integration of SMR technology with renewable energy systems by designing a hybrid solar PV-PEM electrolyzer-fuel cell configuration. The study investigated optimal component sizing, hydrogen storage requirements, and energy management strategies to support both daytime and nighttime operation. Through sensitivity analysis and system-level optimization, the research aimed to identify the most influential factors affecting hydrogen production and to demonstrate the technical feasibility of combining SMR, renewable energy, hydrogen storage, and fuel cell technologies for sustainable hydrogen generation.

2. Materials and Methods

The analysis of PEM electrolyzer design evaluates efficiency, durability, and overall system performance through appropriate material selection and structural optimization. One critical aspect is the investigation of different membrane materials and their influence on proton conductivity and chemical stability. Membranes must provide high ionic conductivity while maintaining mechanical strength and resistance to degradation under acidic and high-potential operating conditions. Figure 1 shows the integrated solar PV system coupled with PEM electrolysis and steam methane reforming for hybrid hydrogen production. In addition to membrane performance, electrode materials must be assessed for catalytic activity and corrosion resistance. High-performance catalysts contribute to increased hydrogen and oxygen evolution reactions, while durable electrode structures ensure long-term stability under elevated temperatures and pressures. The selection and configuration of catalyst layers significantly affect electrochemical efficiency and system lifespan.
The proposed system integrates a solar PV array, a PEM electrolyzer, and a steam methane reformer to create a hybrid hydrogen production platform powered by solar energy. The solar PV panels generate DC electricity based on irradiance and ambient temperature conditions. This conditioned electrical power supplies both the PEM electrolyzer and auxiliary components of the reforming unit. The integrated architecture enables coordinated operation between renewable-powered electrolysis and thermochemical reforming. The solar PV system provides energy input and a boost converter ensures efficient power conditioning, and both the PEM electrolyzer and SMR reformer contribute to hydrogen generation. This hybrid configuration enhances reliability, improves hydrogen output stability, and allows dynamic operation under fluctuating solar conditions. In this study, CFD is applied for modeling the SMR process, capturing temperature, velocity, and species concentration profiles across the reformer tube. The CFD model solves the coupled conservation equations of mass, momentum, and energy, along with methane steam reforming and WGS reaction kinetics, to analyze heat transfer efficiency and reaction conversion under different operational conditions. The modeling assumptions for the reformer include steady-state flow conditions, with either laminar or turbulent flow behavior determined by the Reynolds number. The inlet gas stream is assumed to have a uniform temperature and pressure distribution. The catalyst bed is modeled as a porous medium, where chemical reactions are represented using appropriate reaction-rate expressions. Heat transfer within the system is accounted for through both radiative and convective mechanisms across the reactor tube wall, enabling accurate prediction of temperature distributions and reforming performance. The simulation output provides critical insights into temperature gradients, reaction conversion efficiency, hydrogen yield, and thermal stresses in the reactor wall, supporting the optimization of reformer geometry and operating conditions for maximum hydrogen production efficiency.

2.1. Solar PV Module System

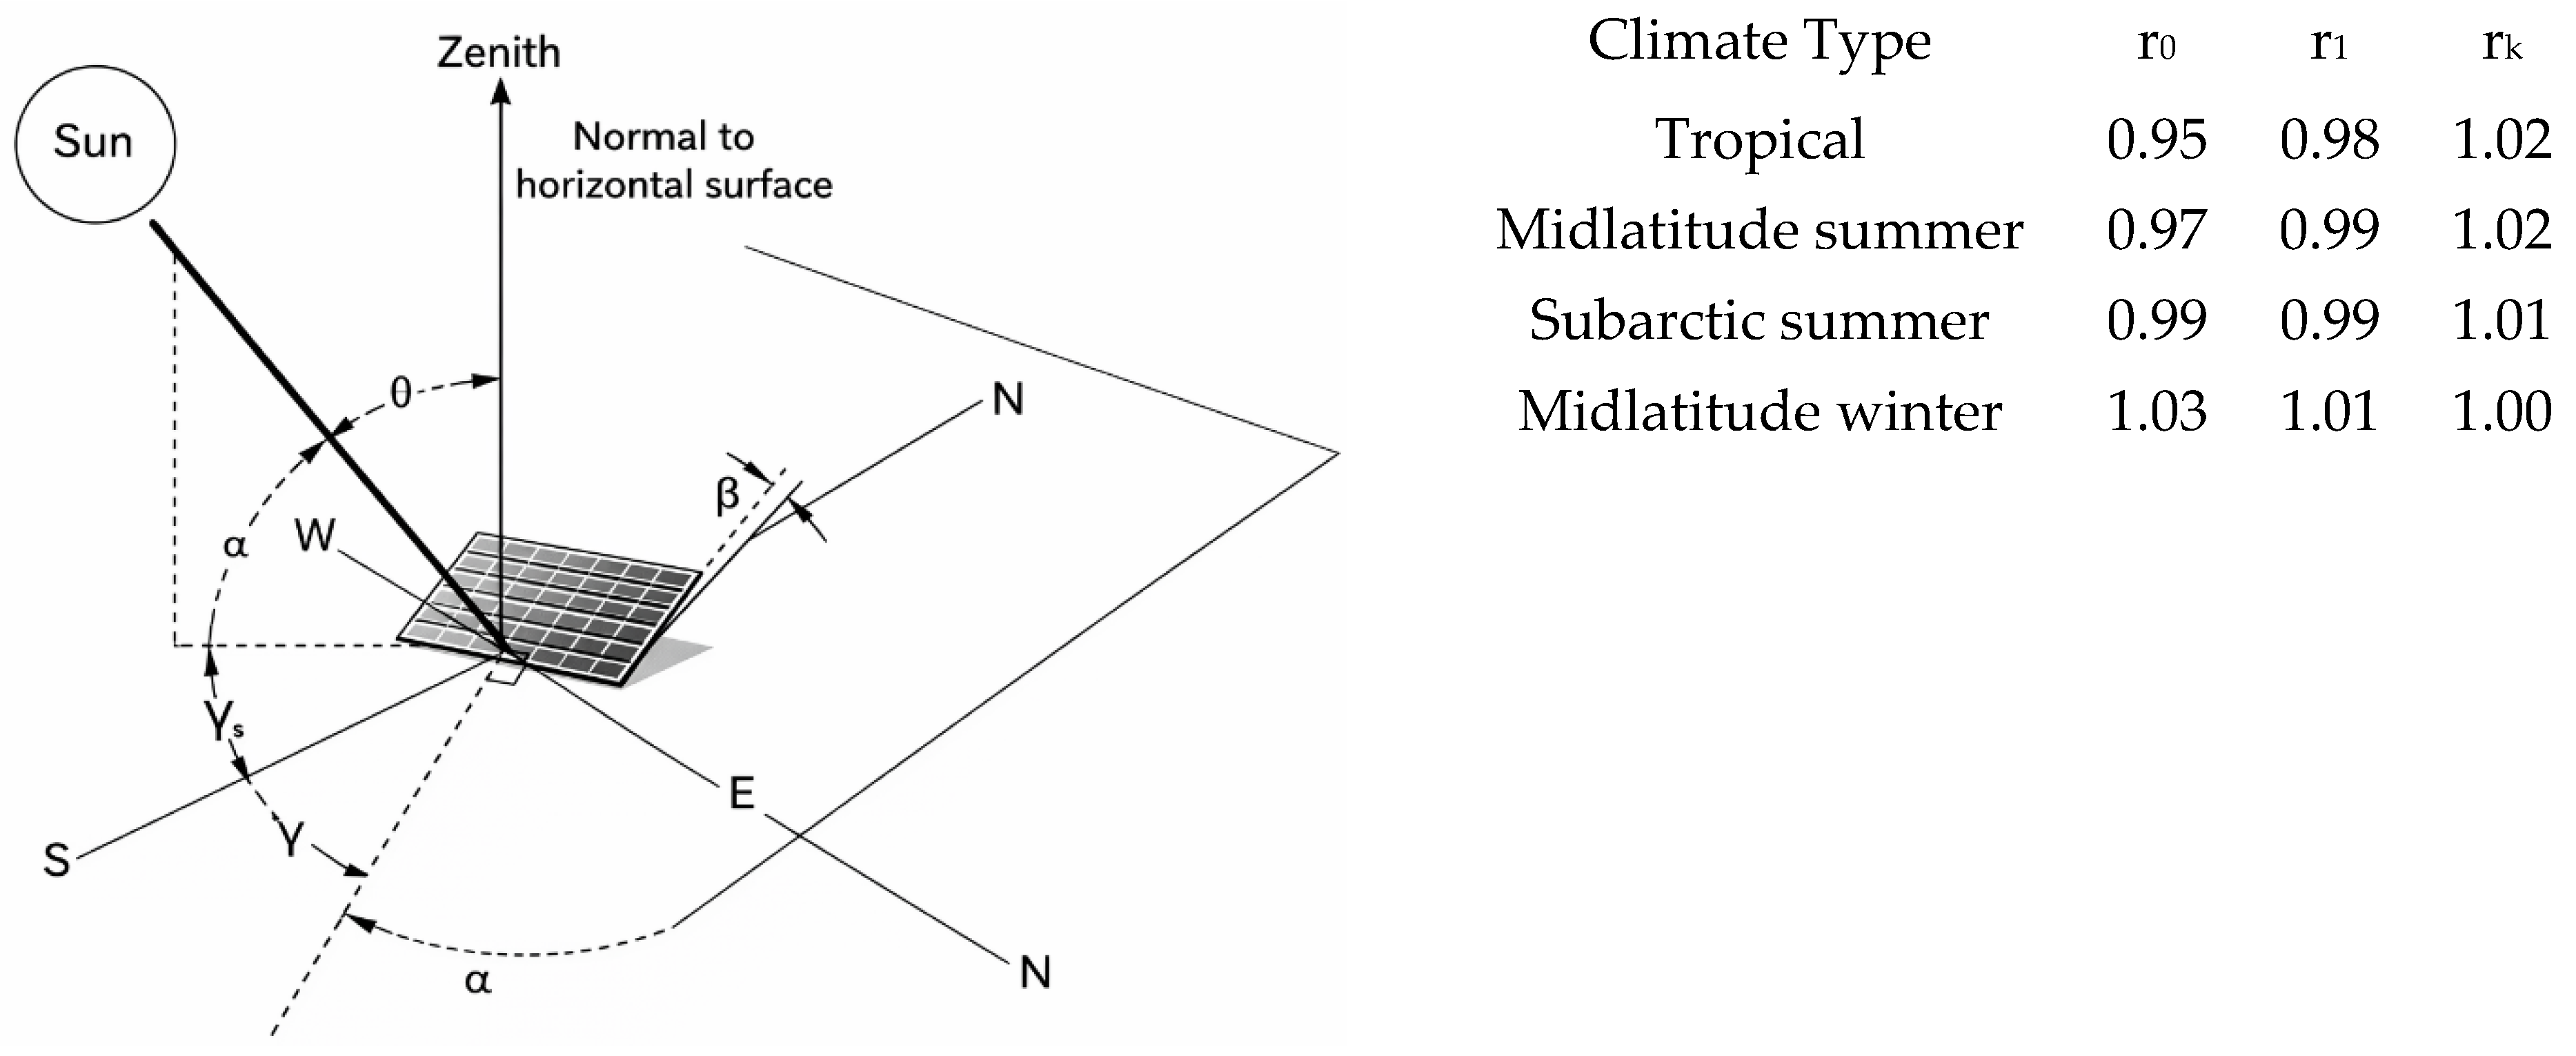
When solar radiation passes through a solar PV collector, a large portion of solar energy should be absorbed by the PV collector. When a single array system is installed, the tilt angle of the system should be determined to collect maximum solar energy. Accurately estimating solar radiation is challenging because solar irradiance is strongly influenced by cloud cover and atmospheric conditions. It is also necessary to define standard sky conditions and estimate the hourly solar radiation incident on a horizontal collector surface under these standardized conditions for a specific location. The beam radiation transmitted through a clear atmosphere is typically calculated by considering the solar zenith angle, site altitude, and standard atmospheric properties. These calculations are further adjusted to represent the four major climate types, enabling more reliable prediction of solar energy availability and system performance as shown in Figure 2 [36,37,38,39]. Accordingly, the atmospheric transmittance for beam radiation τb is given by Equation (3):
τ b =   a 0 + a 1 exp ( k c o s θ z )
The constants of a 0 * , a 1 * and k * for the standard atmosphere with 23 km visibility are determined from the values corresponding to altitudes below 2.5 km.
For different climate types, the correction factors r 0 = a 0 / a 0 * , r 1 = a 1 / a 1 * and r k = k / k * . Thus, the transmittance of the standard atmosphere for beam radiation can be determined for any solar zenith angle and for locations with altitudes up to 5 km above sea level. The clear-sky beam radiation is given by Equations (4) and (5):
G c n b = G o n τ b
where
G o n = G s c   ( 1 + 0.033   c o s 360   n 365 )
and Gsc is the solar constant. The clear-sky horizontal beam radiation can be determined using Equation (6)
G b = G o n τ b cos θ z
Under clear atmospheric conditions, the diffuse radiation transmission coefficient is empirically related to the beam radiation transmission coefficient as shown in Equations (7) and (8):
τ d = 0.271 0.294   τ b
G d = G o n τ d cos θ z
The incident of solar irradiation per unit area on shaded and unshaded surfaces is calculated using Equation (9):
S = H L [ q b + q d + ( K 1 ) ( q b s h + q d s h ) ]
where qb represents the yearly beam irradiation per unit area received by an unshaded collector in the first row and is calculated as shown in Equation (10):
q b =   n = 1 12 T = 1 24 G b   c o s   θ   Δ T
The yearly diffuse irradiation per unit area collected by the unshaded first-row collector, q d , is determined by summing the hourly diffuse irradiation values of the typical day for each month of the year as shown in Equation (11):
q d =   n = 1 12 T = 1 24 G b d h   Δ T
The mean annual beam irradiation per unit area incident on a shaded collector (K-1 rows) is given by Equation (12):
q b s h =   n = 1 12 T = 1 24 G b   c o s θ   1 a s   Δ T
The average annual diffuse solar irradiation per unit area received by the shaded collectors’ rows excluding the first row; the equation can be expressed using Equation (13):
q d s h =   F d s h n = 1 12 T = 1 24 G d h   Δ T
where G b is the direct beam irradiance on a plane perpendicular to the incident solar radiation, and G d h represents the horizontal diffuse irradiance. The incidence angle, θ defined as the angle between the solar beam and the normal vector to the collector surface expressed using Equation (14):
cos θ = cos β sin α + sin β cos α cos γ
The geometric view factors for the unshaded and shaded collector surfaces are expressed in Equations (15) and (16):
F d = cos 2 ( β / 2 )
F d s h = cos 2 ( β / 2 ) 1 / 2 [ ( d 2 + 1 ) 1 / 2 d ] sin β
where the normalized distance between two adjacent rows and is given by Equation (17):
d = D / ( H   s i n β )
The relatively shaded area is given by Equations (18)–(23):
a s = l s h s
l s = 1 d sin β + cos β l | sin γ | cos β tan α + sin β cos γ
is the relative shadow length.
a s   0 ,   γ   90   d e g . ,   0     l s   1  
h s = 1 d sin β + cos β cos β + [ sin β cos γ / tan α ]   is the relative shadow width
a s   0 ,   γ   90   d e g . ,   0     h s   1  
and
l = L / ( H   s i n β )   is the normalized collector length .
Thus, the incident solar energy of solar PV array system is given by Equation (24):
Q = L a × H a × q b + q d + K 1 q b s h + q d s h
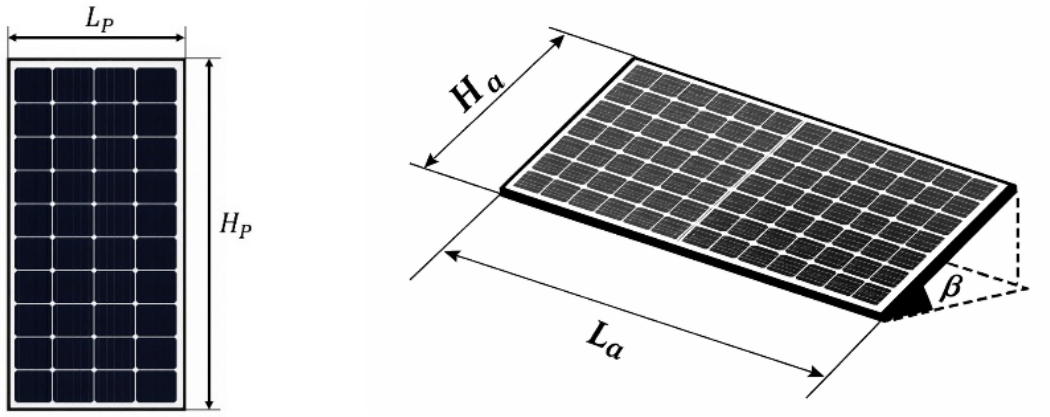
For a single array system, there is no need to consider the shading effects and hence only the tilt angle and the corresponding absorbed area are considered at the specific location. Figure 3 shows a configuration of a single PV panel and a single PV array. The single PV module selected for this study is the SW300 module, which has a rated peak power output of 300 W. The module operates at a maximum power point voltage of 31.6 V and a maximum power point current of 9.57 A. Its open-circuit voltage and short-circuit current are 40.1 V and 10.23 A, respectively. The module has an efficiency of 17.89% and is designed for a maximum system voltage of 1000 V. The amount of solar energy depends on the design variables of heigh ( H a ) and length ( L a ) of a single array and the tilt angle in a solar PV array ( L a × H a ), which can be expressed in terms of the number of cells and panels used.
When multiple photovoltaic (PV) arrays are installed within a limited area, both the tilt angle and array dimensions must be considered because they directly affect spacing and system layout. Shading between adjacent rows is a critical factor, as insufficient spacing reduces the solar radiation received by the panels and lowers energy production. As a result, optimization must include row-to-row shading constraints along with geometric design parameters to maximize solar energy capture while efficiently utilizing the available land area. For fixed, non-tracking PV systems, seasonal performance depends primarily on the tilt angle and azimuth angle, which determine the array orientation relative to the sun’s daily and seasonal movement. The design can be optimized by selecting the appropriate array of geometry and orientation to maximize the incident solar radiation received throughout the year.
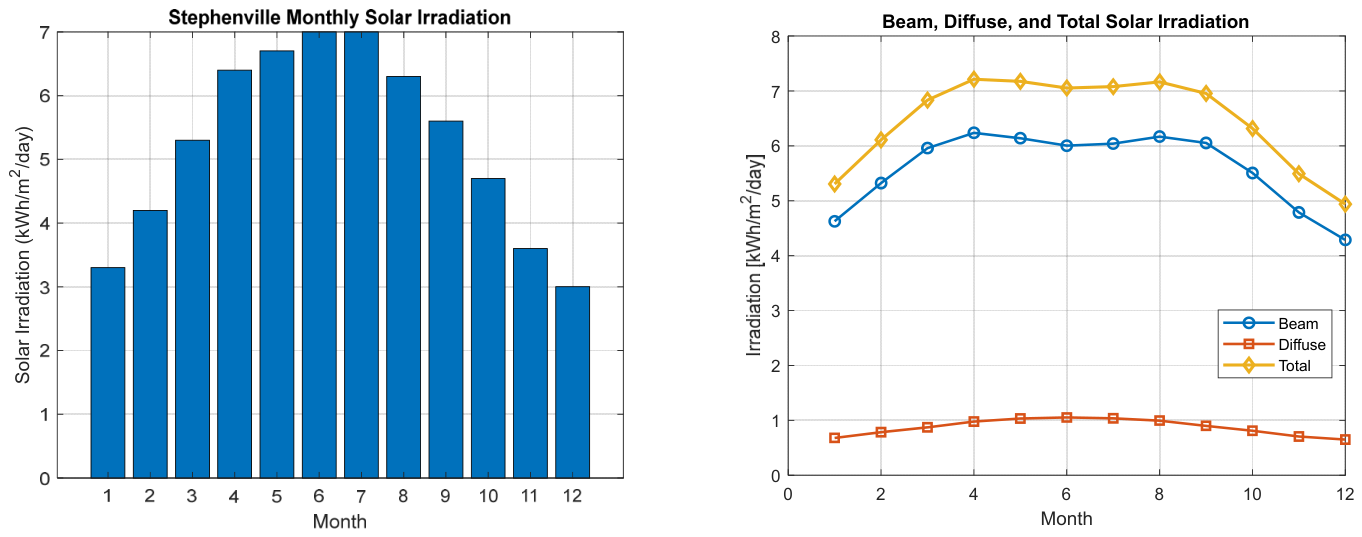
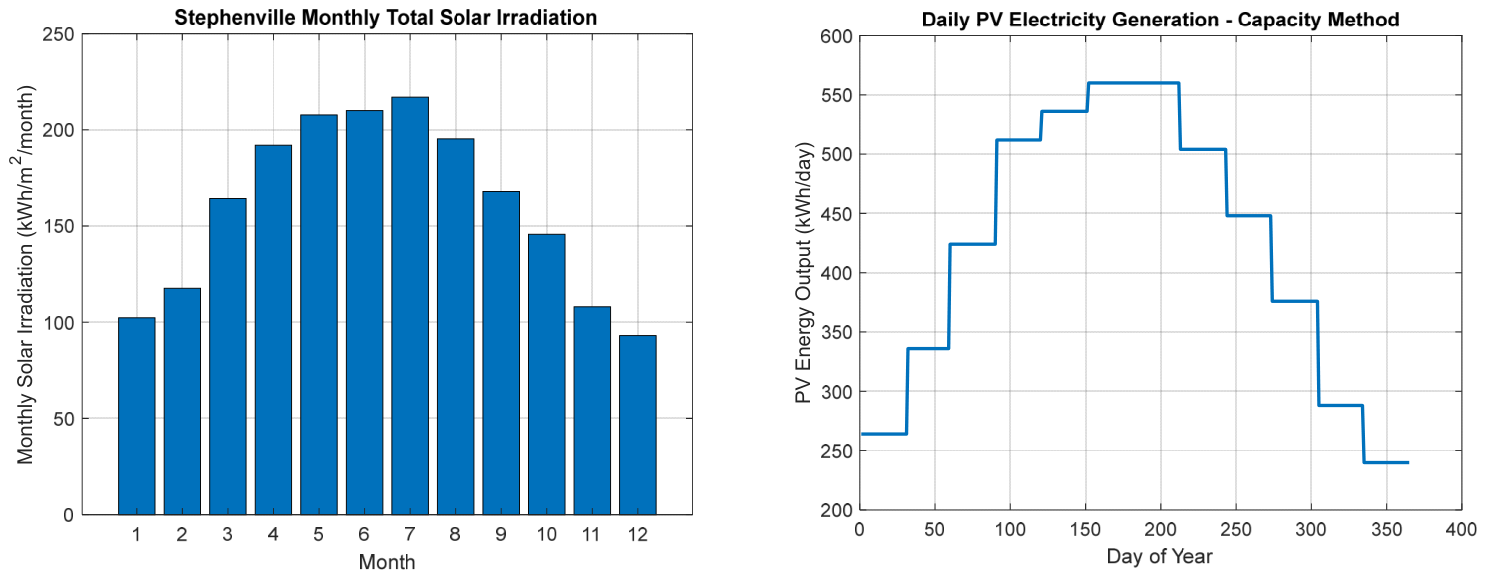
Stephenville, Texas shows a strong solar resource that is suited for solar PV system design and optimization. Under optimal tilt conditions, the average solar irradiation is approximately 6.2 kWh/(m2 · day), which indicates an annual irradiation of about 2263 kWh/(m2 · year). Seasonal variation is evident, with peak summer irradiation reaching approximately 8.0–8.2 kWh/(m2 · day), while winter values decrease to around 3.5–4.0 kWh/(m2 · day). These values are consistent with typical Central Texas solar conditions and provide a reliable basis for preliminary system sizing and performance evaluation. Using site-specific modeling conditions for Stephenville, which include a latitude of 32.22°, a solar constant of 1367 W/m2, and an altitude of approximately 0.42 km, the detailed monthly irradiation analysis yields an average daily irradiation of about 5.263 kWh/(m2 · day) and an annual irradiation of approximately 1920.9 kWh/(m2 · year). The discrepancy between these values and the optimal-tilt estimate reflects the influence of array geometry, tilt selection, and shading effects included in the model. The calculated solar irradiation shows clear seasonal trends. Monthly irradiation increases from approximately 102.3 kWh/m2 in January to a peak value of about 217 kWh/m2 in July, followed by a gradual decline toward the winter months. Correspondingly, the available peak sun hours vary throughout the year, ranging from approximately 3 h/day during winter to about 7 h/day during summer, as shown in Figure 4. These results reflect the seasonal variation in solar altitude, day length, and atmospheric conditions that influence the solar energy available to the PV system.
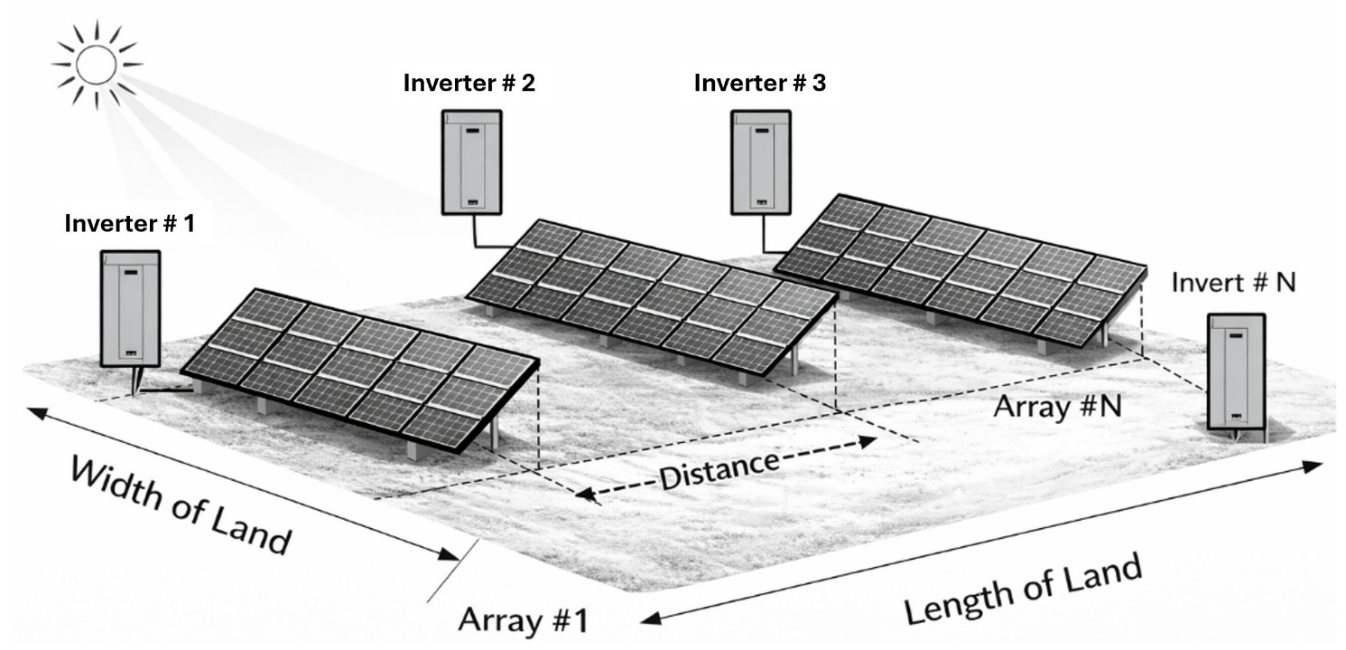
These irradiation characteristics directly influence PV system performance and optimal PV system design. Based on the modeled solar field design, the optimal configuration for Stephenville indicates a collector height of 2.50 m, a row length of 35.00 m, a row spacing of 4.00 m, and a tilt angle of approximately 29.22°, which closely aligns with the local latitude to maximize annual energy collection. The optimized layout consists of 33 rows within the allowable constraints, which results in an annual field energy production of approximately 280,667 kWh. Under these optimized conditions, the effective average daily irradiation increases to about 6.47 kWh/(m2 · day), which indicates an annual irradiation of approximately 2362 kWh/(m2 · year). From a PV system installation and optimization perspective, Stephenville’s solar resource demonstrates efficient energy generation with typical peak hours around 6.2 h per day. Assuming a PV module efficiency of approximately 18% and a system performance ratio between 0.75 and 0.85, the expected energy yield ranges from about 4.6 to 5.3 kWh per day per installed kW of PV capacity. This relationship is essential for sizing PV systems and estimating total energy output based on installed capacity. The geometric design of the PV array plays a critical role in system optimization. For Stephenville’s latitude of approximately 32°, an optimal tilt angle between 25° and 30° is recommended. With a typical panel height of about 2 m, row spacing is generally selected between 4 and 6 m to minimize inter-row shading while maintaining efficient land use. The optimized spacing of 4.00 m in the design reflects a balance between compact installation and shading mitigation, as shown in Figure 5.
In large-scale PV installations, arrays are typically organized into multiple inverter-connected subarrays. Each inverter generally operates within a range of 100 kW to 500 kW depending on system scale, and the DC-to-AC ratio is commonly designed between 1.1 and 1.3 to maximize energy harvest. This configuration improves system efficiency and ensures better utilization of inverter capacity under varying solar conditions. From a land-use perspective, utility-scale PV systems in Stephenville typically require about 4 to 6 acres per MW, depending on tilt angle, spacing, and layout design. The spacing between subarrays is determined by both geometric constraints and shading considerations, ensuring that each array receives sufficient solar exposure throughout the year. In the optimized configuration, each subarray represents a modular unit connected to a dedicated inverter, allowing for scalable and efficient system design. The integration of Stephenville’s solar resource characteristics with geometric layout optimization and electrical system design enables the development of high-performance PV installations. The combination of strong solar irradiation, appropriate tilt selection, optimized spacing, and efficient inverter configurations supports both cost-effective installation and maximized annual energy production.

2.2. PEM Electrolyzer

A PEM electrolyzer should be designed by considering key factors such as electrolyzer capacity, hydrogen production rate, electrical power requirements, heat generation, heat exchanger duty, and heat exchanger surface area. The electrochemical voltage model is governed by activation losses, ohmic losses, and diffusion losses, which together determine the total operating voltage. These factors also influence hydrogen generation, overall power consumption, and system efficiency.
The overall electrochemical reaction in a PEM electrolyzer is given in Equation (25):
H 2 O + e l e c t r i c i t y + h e a t   H 2 + 1 2 O 2
Electrode reactions:
Anode is shown in Equation (26).
H 2 O   2 H + + 2 e + 1 2 O 2
Cathode is shown in Equation (27).
2 H + + 2 e   H 2
The thermodynamic reactions are shown in Equations (28) and (29):
Δ H =   Δ G + T Δ S
V r e v i s i b l e = Δ G n F , V t h e r m o d y n a m i c = Δ H n F
The operating voltage is the sum of the reversible voltage and irreversibility losses as shown in Equation (30):
V o p e r a t i n g = V r e v e r s i b l e + η a c t i v a t i o n + η o h m i c + η d i f f u s i o n
For the activation losses as shown in Equations (31)–(33),
η a c t i v a t i o n ,   a = R T α a z F l i n ( i a i 0 , a )
η a c t i v a t i o n ,   c = R T α c z F l i n ( i c i 0 , c )
η a c t i v a t i o n = η a c t i v a t i o n ,   a + η a c t i v a t i o n ,   c
For ohmic losses as shown in Equation (34),
η o h m i c = ( R e l e c t r o n + R i o n ) I
For area-based PEM stack design, the current density can be calculated using Equation (35):
η o h m i c = i   × a r e a s p e c i f i c   r e s i s t a n c e
For diffusion losses in Equations (36)–(38),
η d i f f u s i o n = η d i f f u s i o n , a + η d i f f u s i o n , c
η d i f f u s i o n , a = R T a 4 F ln ( C O 2 , m C O 2 , m , 0 )
η d i f f u s i o n , c = R T c 4 F ln ( C H 2 , m C H 2 , m , 0 )
To determine the electrolyzer capacity, the current density and active area can determine the stack current as shown in Equation (39):
I = i A c e l l
For a stack with N c e l l cells in Equations (40) and (41):
V s t a c k = N c e l l   V o p e r a t i o n
P s t a c k = V s t a c k   I = N c e l l   V o p e r a t i o n i ,   T ,   p ,   δ m ,   α ,   i 0 ,   · i A c e l l
which indicates the size of a PEM electrolyzer to a required power demand.
For a given power requirement, the electrolyzer design can be determined using either the cell active area or the number of cells. If the number of cells is fixed, the required active cell area for the capacity is shown in Equation (42):
A c e l l = P r e q u i r e m e n t N c e l l V o p i
If the active area is fixed, the required number of cells is given in (43):
N c e l l = P r e q u i r e m e n t V o p i A c e l l
The electrolyzer capacity can be achieved by adjusting either the cell area or the number of cells, depending on design constraint.
For hydrogen production rate and electrolyzer capacity, hydrogen molar production can be specified as shown in Equation (44):
η ˙ H 2 = N c e l l I 2 F
Hydrogen mass flow rate in Equation (45):
m ˙ H 2 =   η ˙ H 2 M H 2   = N c e l l I 2 F M H 2
This equation is inverted to size the electrolyzer for a required hydrogen rate as shown in Equation (46):
I = 2 F m ˙ H 2 N c e l l M H 2
The required power is calculated in Equation (47):
P s t a c k = V s t a c k I
To calculate power consumption and efficiency as shown in Equation (48):
P = I V
The electrolyzer efficiency as shown in Equation (49):
η e = P H 2 P = V r e v V
For engineering design, hydrogen power is calculated using lower heating values as shown by Equations (50) and (51):
Q ˙ H 2 ,   L H V =   m ˙ H 2 L H V H 2
η L H V = m ˙ H 2 L H V H 2 P s t a c k
For specific energy consumption as shown in Equation (52):
e ˙ c o n s u m p t i o n = P s t a c k m ˙ H 2   k W h k g · H 2
The capacity design is given in Equation (53):
P s t a c k = m ˙ H 2 ,   r e q u i r e d   ×   e ˙ c o n s u m p t i o n  
Once the PEM electrolyzer capacity is determined, the heat exchanger is determined [40,41].
The heat exchanger rate can be calculated as Equation (54):
Q ˙ g e n =   I V o p V t n N c e l l
A more complete balance for cooling design is shown in Equations (55) and (56):
Q ˙ H X =   Q ˙ g e n +   Q ˙ a u x   Q ˙ l o s s , a m b i e n t
Q ˙ H X     Q ˙ g e n
Coolant heat removal equation for the heat exchanger is shown in Equation (57).
Q ˙ H X = m ˙ c c p , c ( T c ,   o u t T c ,   i n )
Coolant flow can be sized in Equation (58):
m ˙ c = Q ˙ H X c p , c Δ T c
For heat exchanger area calculation as shown in Equations (59)–(61):
Q ˙ H X = U A Δ T L M T D
Δ T L M T D = T h , i n T c , o u t ( T h , o u t T c , i n ) ln T h , i n T c , o u t T h , o u t T c , i n
A H X = Q ˙ H X U Δ T L M T D
For required hydrogen production as shown in Equations (62) and (63)
I = 2 F m ˙ H 2 , r e q N c e l l M H 2
P s t a c k = N c e l l V o p e r a t i n g I
Heat exchanger duty as shown in Equation (64):
Q ˙ H X N c e l l V o p V t n  
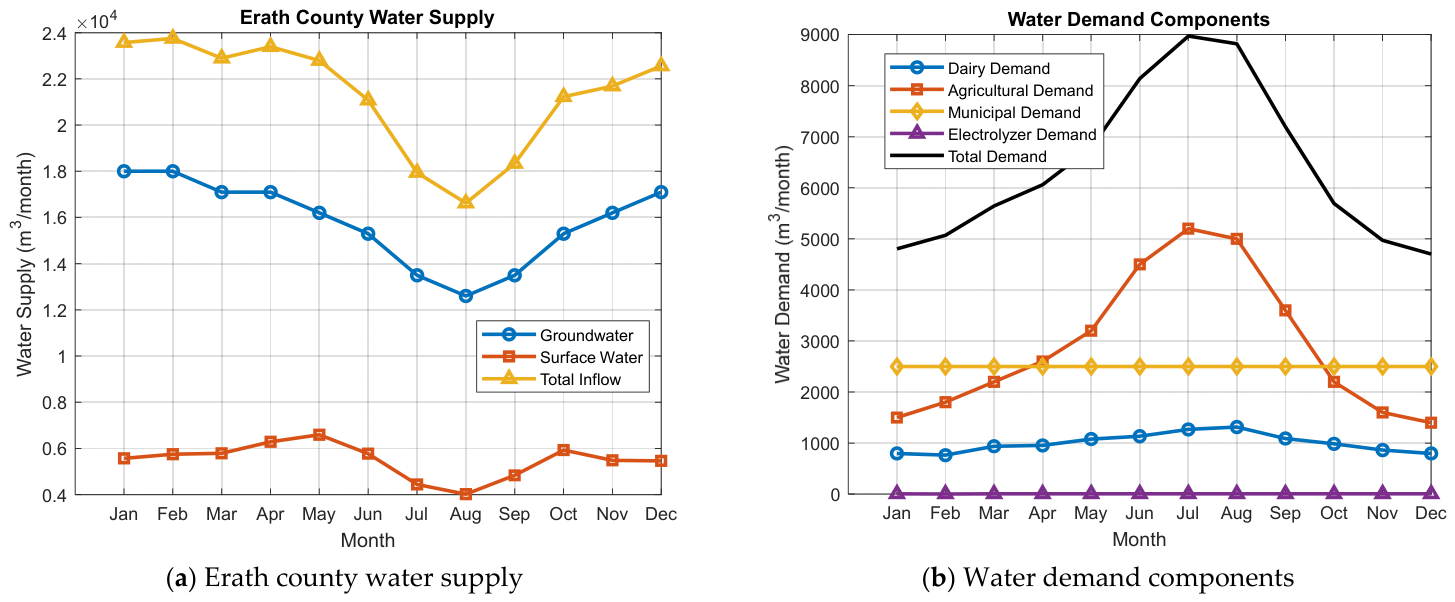
The design of a PEM electrolyzer is determined by electrochemical, thermodynamic, and transport processes. Hydrogen production is directly controlled by current through Faraday’s law, while the required operating voltage depends on activation, ohmic, and diffusion losses. The electrolyzer capacity can be determined by adjusting the number of cells or active area to meet power demands. Efficiency and energy consumption are closely tied to operating voltage and hydrogen output. Since a significant portion of input energy is converted to heat, proper heat exchanger design is essential to maintain thermal stability and ensure safe, efficient operation. Erath County water resources are characterized by a strong reliance on groundwater, which serves as the main source for agricultural, municipal, and rural water needs. This dependence highlights the importance of sustainable groundwater management to ensure long-term availability, especially under increasing demand. In addition to groundwater, surface water resources such as the Bosque River and farm ponds provide a limited but valuable supplemental supply. While these sources are not consistently reliable due to seasonal variability and evaporation, they play an important role in supporting livestock watering and localized agricultural activities. Due to periodic drought conditions and variable recharge rates, effective water storage and management strategies are essential in Erath County. The use of reservoirs, storage tanks, and controlled distribution systems helps maintain a stable water supply during dry periods and ensures operational reliability for farms and related systems. As a result, the water resource conditions in Erath County make it suited for dairy farming and broader agricultural operations. The region is highly compatible with hydrogen-energy integration systems, where water can be efficiently utilized for processes such as electrolysis without significantly impacting existing agricultural water demands. Figure 6 indicates that groundwater is the main water source in Erath County with total water supply exceeding the combined dairy, agricultural, municipal and PEM electrolyzer water demands.
For electrolysis, the theoretical water requirement is approximately 9 L per kilogram of hydrogen, but the actual treated-water demand is typically higher due to purification requirements and ancillary system losses [42,43]. In Stephenville, precipitation shows significant monthly variability, ranging from about 1.84 inches in January to 4.97 inches in May, with an annual average of approximately 34.13 inches [44]. As a result, an effective system design should not rely on a constant water-supply assumption but instead adopt a monthly and seasonal optimization strategy that integrates rainwater harvesting, reservoir storage, groundwater use, and supplemental purchased water. The objective of this approach is to minimize the annual water-supply cost while consistently satisfying the electrolyzer’s monthly water demand. Within this framework, the optimization determines the appropriate contribution from each water source on a monthly basis. Given that Stephenville experiences higher precipitation during spring and comparatively drier conditions in winter and midsummer, the reservoir should be strategically filled during wetter months and subsequently utilized to reduce groundwater extraction during drier periods. This seasonal operating strategy is directly informed by the local precipitation patterns.

2.3. Modeling of Steam Methane Reformer (SMR)

The CFD model of the steam methane reformer was developed to simulate coupled fluid flow, heat transfer, and chemical reactions within the catalyst-filled reformer tubes. The objectives are to analyze methane conversion efficiency, hydrogen yield, and the thermal distribution under steady-state operating conditions.
Hydrogen is the dominant product for both natural gas and biogas, which supports SMR and is effective for hydrogen generation regardless of the methane source. However, natural gas produces a substantially larger hydrogen fraction than biogas. The natural gas case yields approximately 311 mol/s of hydrogen, whereas the biogas case produces about 195 mol/s with a reduction of roughly 37% in hydrogen production. The lower hydrogen yield from biogas is primarily due to the presence of carbon dioxide ( C O 2 ) in the feedstock. Unlike natural gas, which consists predominantly of methane, biogas contains a significant amount of C O 2 that does not contribute directly to hydrogen production. Consequently, the biogas reforming process introduces additional inert carbon dioxide into the reactor, reducing the amount of methane available for reforming and decreasing overall hydrogen output. The outlet composition comparison further illustrates these differences. The biogas case exhibits a higher C O 2 concentration at the reactor outlet approximately 83 mol/s than the natural gas case approximately 75 mol/s. In contrast, the natural gas case generates a larger amount of water vapor of about 133 mol/s compared with biogas about 87 mol/s, reflecting the greater extent of methane conversion and reforming reactions. The results show that natural gas SMR achieves significantly higher hydrogen production and hydrogen concentration than biogas SMR, while biogas reforming results in greater C O 2 content in the product stream due to the inherent carbon dioxide present in the feedstock.
Governing equations
The flow inside the reformer tube is assumed to be steady-state, three-dimensional, and compressible. The gas mixture is modeled as an ideal gas with temperature-dependent thermophysical properties. The governing equations include continuity, momentum, energy, and species transport equations [45,46].
The continuity equation is shown in Equation (65).
( ρ v ) = 0
The momentum Equation (Navier–Stokes) is given in Equation (66).
( ρ v v ) = p + ( μ v ) + S m  
where S m is the momentum source term associated with flow resistance in the porous catalyst region.
The energy equation is described in Equation (67).
( ρ v h ) = ( k e f f   T ) + S h  
where S h   represents the volumetric heat source or sink due to endothermic and exothermic reactions and radiative heat transfer through the wall.
The species transport equation is presented in Equation (68).
( ρ v Y i ) = ( J i ) + R i  
where J i is the diffusive flux of species i, and R i is the reaction rate term calculated from the surface catalytic reactions.
The rate expressions follow the Langmuir–Hinshelwood kinetics model for nickel catalysts shown in Equation (69):
r i = k i   P C H 4     P H 2   O     P C O   P H 2 3   K i       ( 1 + a P C H 4     + b P H 2 O       + c P C O   + d P H 2   )  
Boundary conditions
The CFD simulation was performed under representative industrial steam methane reforming (SMR) conditions. The reactor inlet was specified as a mass-flow inlet with a methane–steam mixture having a steam-to-carbon ratio of 3 to 4. The feed entered the reformer at a pressure of 1.5 MPa, a temperature of 837 K, and a velocity of 0.3 m/s. The inlet gas composition consisted of methane (CH4), steam (H2O), and inert nitrogen (N2), with the corresponding mole (or mass) fractions. The methane steam mixture served as the reactant stream, while nitrogen was included as an inert species to represent the feed composition and improve numerical stability. No air was introduced into the reformer feed because the presence of oxygen would alter the reaction pathway from conventional steam methane reforming to partial oxidation or autothermal reforming. The inlet composition was specified uniformly over the inlet cross-section. Turbulence was modeled using a turbulence intensity of 5% and a turbulent viscosity ratio of 10, with uniform distributions of velocity, temperature, and species concentrations assumed at the inlet. The reactor outlet was defined as a pressure-outlet boundary with a gauge pressure of 0.1 MPa and a backflow temperature of 900 K to represent discharge toward downstream processing while maintaining numerical stability. The inlet and outlet pressures were prescribed CFD boundary conditions and should not be interpreted as the pressure drop across the catalyst bed. Instead, the local pressure loss through the porous catalyst region was determined using the Ergun equation. A convective and radiative heat flux boundary condition is applied to the tube wall as shown in Equation (70).
k n T   = h ( T w a l l T g a s ) + σ ε ( T w a l l 4 T f u r n a c e 4 )
The catalyst wall is assumed to be stationary and no-slip. The catalyst bed is modeled as a porous medium with an effective thermal conductivity of k e f f and flow resistance coefficients derived from Ergun’s equation given in Equation (71).
Δ P L =   150 1 ε 2 μ U ε 3 d p 2 +   1.75 1 ε ρ U 2 2 ε 3 d p  
where ε is the bed porosity and d p is the catalyst particle diameter.
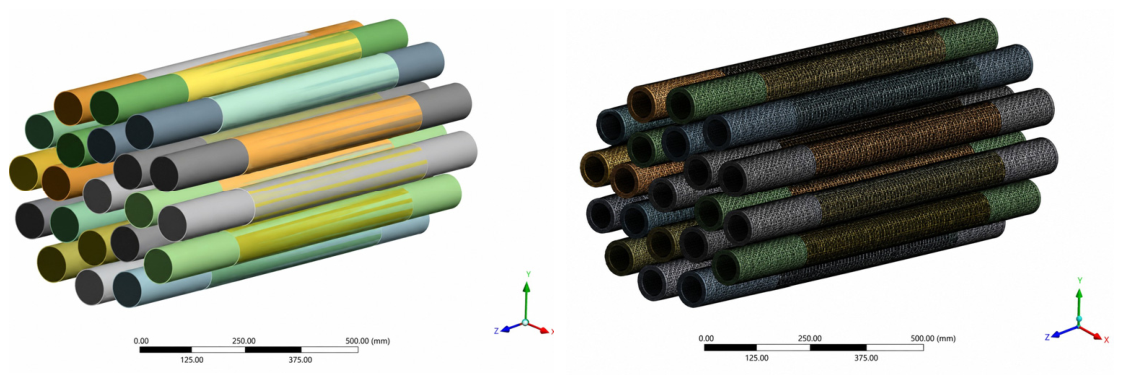
The reactor walls were modeled as stationary aluminum surfaces with no-slip boundary conditions. Convective and radiative heat transfer at the tube walls was applied according to Equation (70), while the catalyst bed was modeled as a porous medium with an effective thermal conductivity and Ergun-based flow resistance coefficients. The catalyst region was maintained at a constant temperature of 1250 K to represent the externally heated reforming zone. These boundary conditions enabled the coupled simulation of turbulent flow, heat transfer, and steam methane reforming reaction kinetics under steady-state operating conditions. Convective and radiative heat transfer were applied at the tube walls according to Equation (70). The reactor walls were modeled as stationary aluminum surfaces with no-slip boundary conditions, while the catalyst bed was represented as a porous medium with an effective thermal conductivity and Ergun-based flow resistance coefficients. The catalyst region was maintained at a constant temperature of 1250 K to represent the externally heated reforming zone. These boundary conditions enabled the coupled simulation of turbulent flow, heat transfer, radiation, and steam methane reforming reaction kinetics under steady-state operating conditions. Figure 7 shows the three-dimensional geometry of the tube bundle used in the CFD simulation of the SMR.
The mesh discretizes the computational domain into a large number of finite-volume cells, enabling the numerical solution of the governing equations for fluid flow, heat transfer, species transport, and chemical reactions. A structured mesh was employed along the tube length to accurately capture the velocity, temperature, and concentration gradients within the reformer. The mesh quality and refinement are critical for ensuring numerical stability and obtaining reliable predictions of methane conversion, hydrogen yield, and thermal performance. The mesh density was selected to provide a balance between computational accuracy and simulation cost. Table 1 shows the CFD mesh information and quality.
The computational mesh generated for the SMR CFD simulation consisted of 13,096,041 cells, 39,714,837 faces, and 13,529,340 nodes, providing sufficient spatial resolution to capture fluid flow, heat transfer, species transport, and chemical reaction phenomena within the reformer. The mesh quality assessment indicated a minimum orthogonal quality of 0.5216, which is within the acceptable range for accurate CFD simulations, and a maximum aspect ratio of 7.4419, demonstrating reasonable cell stretching along the tube geometry. Overall, the mesh quality metrics confirm that the computational grid is suitable for obtaining reliable numerical predictions while maintaining computational efficiency. The simulation for the steam methane reformer was established under three-dimensional, steady-state conditions to capture detailed flow and reaction characteristics. The SST k–ω turbulence model was employed to accurately resolve turbulent flow and heat transfer effects near the reactor walls. The energy equation was activated with heat transfer modeling to capture conduction and convection within the reformer. Radiative heat transfer was incorporated using the Discrete Ordinates (DO) model to account for the significant influence of radiation from the heated walls on the reforming reactions. Additionally, the reacting species transport model was used to simulate the complex chemical kinetics involved in steam methane reforming, including methane conversion and hydrogen production. This comprehensive setup allows for an accurate prediction of temperature distribution, species concentration profiles, and overall reformer performance under realistic operating conditions. The thermophysical properties of the gaseous species used in the steam methane reformer (SMR) simulation were defined to accurately represent fluid flow, heat transfer, species transport, and chemical reactions occurring within the reactor. The fluid mixture consisted of oxygen (O2), water vapor (H2O), carbon monoxide (CO), carbon dioxide (CO2), methane (CH4), nitrogen (N2), hydrogen (H2), and air. The density, thermal conductivity, and dynamic viscosity of each species were specified using standard reference data to ensure reliable CFD predictions. Hydrogen exhibited the lowest density and highest thermal conductivity, enhancing heat transfer characteristics, whereas carbon dioxide showed the highest density and relatively low thermal conductivity. These material properties provide a realistic representation of gas behavior under reforming conditions. The reacting gas mixture was modeled as an ideal gas in ANSYS Fluent 2024 R1. Gas density was calculated using the ideal gas equation of state, while the thermophysical properties of each gaseous species, including specific heat, viscosity, and thermal conductivity were obtained from the built-in temperature-dependent material property database in ANSYS Fluent. Mixture properties were computed locally from the species composition and updated automatically during each iteration based on the predicted temperature, pressure, and species concentrations throughout the reactor. Consequently, no constant thermophysical properties were assumed in the CFD simulations. The material properties used in the SMR simulation included density, thermal conductivity, and dynamic viscosity, which directly influence fluid flow, heat transfer, species transport, and reaction performance within the reactor. Aluminum was selected as the solid material for the reformer wall because of its high thermal conductivity, allowing efficient transfer of heat from the external furnace to the reacting gases. Its density and heat capacity contribute to thermal stability and heat storage within the system. The gas mixture represented the reacting fluid domain where methane and steam undergo endothermic reforming reactions. Mixture properties were calculated using appropriate mixing laws, while density variations were modeled using the ideal gas law. Accurate material property definitions are essential for predicting temperature distribution, species transport, methane conversion, hydrogen production, and overall reactor performance.

3. Results

The optimized steam methane reformer requires a total catalyst heat transfer rate of approximately 9.68 kW within the catalyst region to sustain steady state operation. This value represents the net thermal power supplied to support the endothermic steam methane reforming reactions. Under continuous operation, the required thermal energy input is therefore approximately 9.68 kWh during one hour of operation. Assuming a fuel-to-heat conversion efficiency of 75%, the required fuel energy input increases to approximately 12.91 kWh per hour to compensate for thermal losses and system inefficiencies. The hydrogen production rate is determined from the outlet gas composition and flow conditions. The total outlet gas mass flow rate is 0.007854 kg/s, corresponding to 28.27 kg/h. Based on the outlet mole fractions of hydrogen, carbon dioxide, methane, carbon monoxide, and water vapor, the average molecular weight of the product gas mixture is 13.185 kg/kmol, resulting in a total molar flow rate of 0.000596 kmol/s. Using a hydrogen mole fraction of 0.488, the hydrogen molar flow rate is 0.000291 kmol/s, corresponding to a hydrogen mass flow rate of 0.000582 kg/s or approximately 2.095 kg/h. The hydrogen production capacity can be evaluated in terms of its ability to supply PEM fuel cells. Using the lower heating value (LHV) of hydrogen of 33.3 kWh/kg and assuming a PEM fuel cell efficiency of 50%, the effective electrical energy output is 16.65 kWh per kilogram of hydrogen. Approximately 0.060 kg of hydrogen is required to generate 1 kWh of electricity. Therefore, a 1 kW PEM fuel cell operating continuously for one hour requires approximately 0.060 kg of hydrogen. Based on the estimated hydrogen production rate of 2.095 kg/h, the optimized SMR system is capable of supporting approximately 35 individual 1 kW PEM fuel cells operating continuously. A solar-hydrogen integrated energy system is proposed to provide the electrical requirements of the SMR process during both daytime and nighttime operation. During daytime operation, the photovoltaic (PV) array directly supplies the electrical demand of the SMR auxiliaries and the PEM electrolyzer while simultaneously producing hydrogen for energy storage. During nighttime operation, the stored hydrogen is converted back to electricity using a PEM fuel cell to power auxiliary loads, including pumps, control systems, sensors, purge systems, and other balance-of-plant components. A balanced system configuration consists of approximately 100 kW of solar PV, a 50 kW PEM electrolyzer, a 6 kW PEM fuel cell, and 6–8 kg of hydrogen storage. The daytime electrical demand includes approximately 32.85 kW for SMR operation and 50 kW for the PEM electrolyzer, resulting in a combined load of 82.85 kW. Under peak solar conditions, a 100 kW PV array can satisfy this demand while providing approximately 17.15 kW of surplus power. The PEM electrolyzer is expected to produce approximately 0.9–1.0 kg of hydrogen per hour, allowing a 6–8 kg hydrogen storage system to be fully charged within a typical sunny day. During nighttime operation, a 6 kW PEM fuel cell supplies approximately 5 kW auxiliary SMR load. Assuming a 12 h night-time operation and a fuel cell efficiency of 50%, the hydrogen demand is approximately 3.6 kg per night. Consequently, an 8 kg hydrogen storage system provides approximately two nights of backup operation. To improve system reliability under variable solar irradiance and seasonal fluctuations, a 120 kW PV array is recommended to ensure stable daytime operation and continuous hydrogen production.

3.1. Solar Energy

To reduce grid dependence and optimize operating cost, the steam methane reformer can be integrated with a solar PV system, a PEM electrolyzer, hydrogen storage, and a fuel cell subsystem. The objective of this integrated design is to supply the electrical demand of the SMR while minimizing the capital cost associated with oversizing the solar array and hydrogen subsystem. In this study, the SMR electrical demand is taken as the sum of the reformer heating duty and auxiliary electrical loads. The reformer heating requirement is 27.85 kW, and the auxiliary load is 5 kW, giving a total continuous electrical load of 32.85 kW.
The total daily electrical energy demand of the SMR is calculated using Equations (72) and (73).
E S M R ,   d a y = P S M R × 24
E S M R ,   d a y = 32.85 × 24 = 788.4   k W h / d a y
A direct solar-only 24 h design would require very large PV and storage capacity. For cost optimization, a balanced hybrid strategy is proposed in which the solar PV array directly supplies the daytime SMR power demand, while the PEM electrolyzer converts excess daytime electricity into hydrogen for storage. The stored hydrogen is then used in a fuel cell to supply the required nighttime electrical load. This approach reduces both the required solar capacity and the hydrogen loop size, resulting in a more economical overall system. The proposed design is based on the following assumptions. Figure 8 shows the monthly solar irradiation and estimated daily PV electricity generation potential in Stephenville, Texas. The solar resource is represented by 5.5 peak hours per day.
The solar PV system performance ratio, including inverter losses, temperature effects, dust, and wiring losses, is taken as 0.80. The PEM electrolyzer specific electricity consumption is assumed to be 55.2 kWh/kg- H 2 . The hydrogen lower heating value is taken as 33.3 kWh/kg- H 2 . The fuel cell electrical efficiency is assumed to be 50%, corresponding to an effective electrical output of 16.65 kWh/kg- H 2 . The fuel cell is sized with a small operating margin above the required nighttime load. Hydrogen storage is designed to provide one night of operation plus a reserve margin. Under the balanced design concept, the SMR is operated at full power during daylight hours using electricity supplied directly from the solar PV array. During nighttime operation, only the critical auxiliary load is supplied by the fuel cell, rather than attempting to sustain the full 32.85 kW reformer load through hydrogen storage. This significantly reduces both the electrolyzer size and the hydrogen storage requirement. The estimated land area required for the solar PV system ranges from approximately 950 m2 for a 100 kW system to 1160 m2 for a 120 kW system, corresponding to about 0.23 to 0.29 acres depending on panel rating and layout spacing. Daily electrical energy production is estimated to range from about 400 to 468 kWh/day for a 100 kW system, 440 to 514 kWh/day for a 110 kW system, and 480 to 561 kWh/day for a 120 kW system, based on 5.0 to 5.5 peak sun hours and an overall derating factor of 0.80 to 0.85. Since the combined daytime energy demand of the SMR unit and PEM electrolyzer is approximately 497 kWh/day for 6 h of operation, a 120 kW PV system is recommended for improved reliability and energy balance. Table 2 indicates the annual performance of the hybrid system.
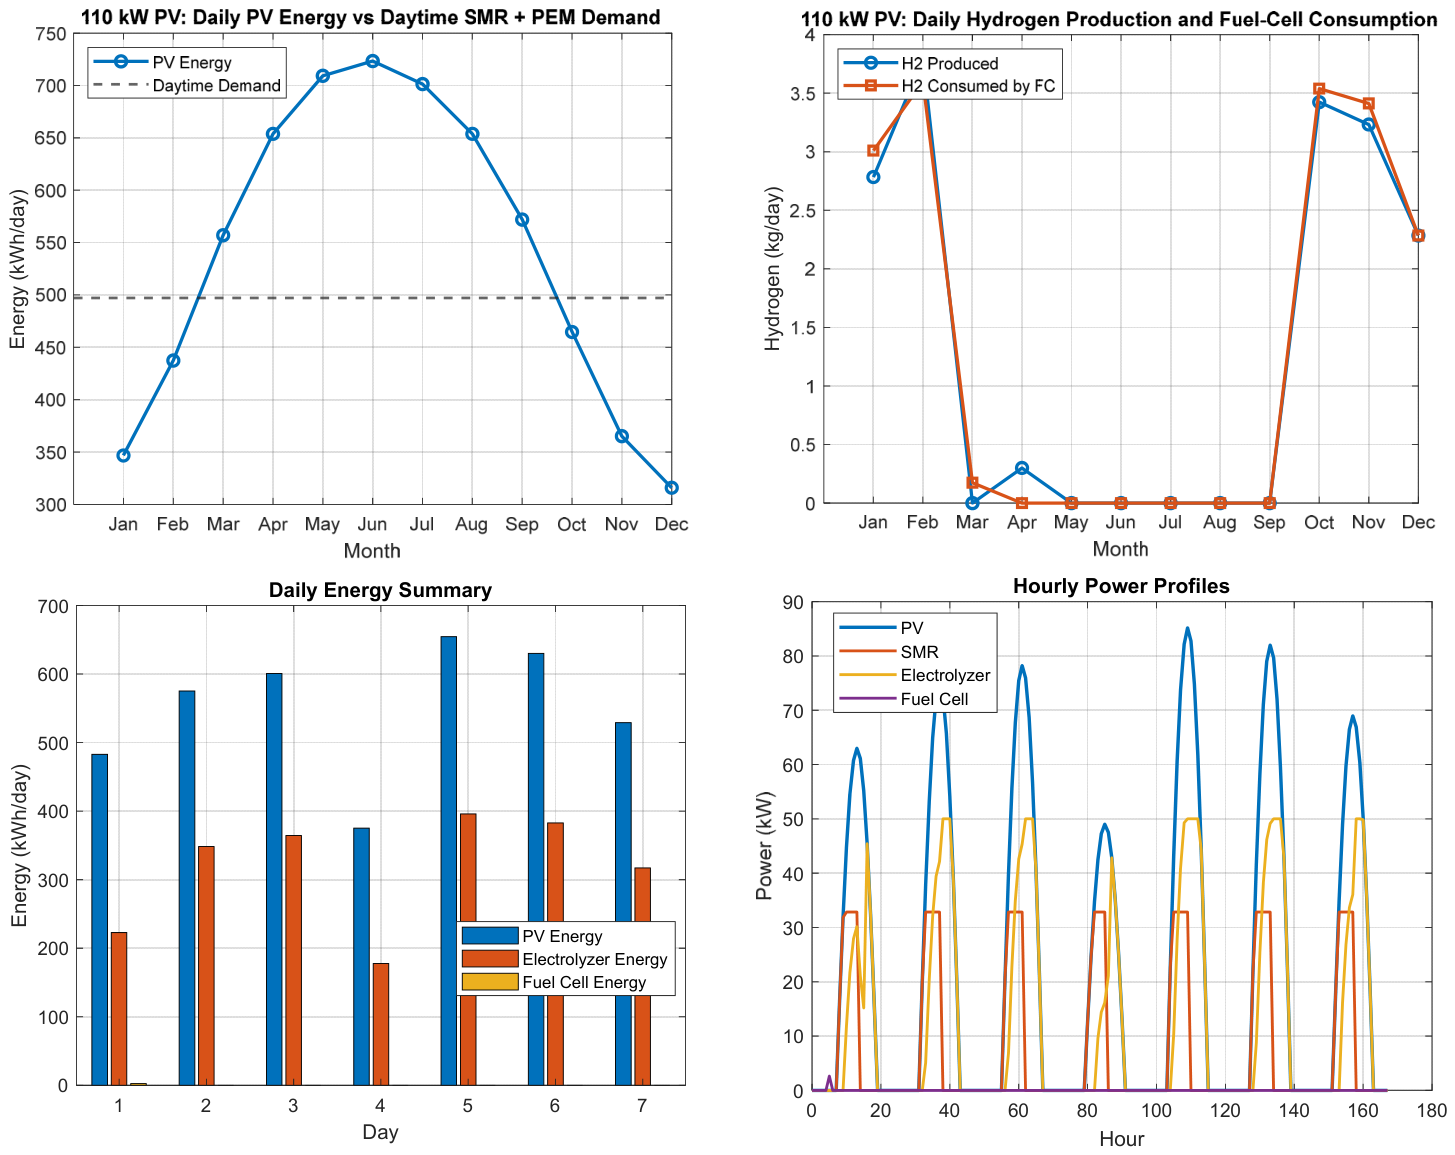
Thus, the 110 kW PV system shows the optimal configuration from the three capacities, which balance energy generation, hydrogen, and the system efficiency while minimizing energy losses. Figure 9 presents the operational performance and energy management characteristics of the integrated 110 kW PV hydrogen production system.
Based on Stephenville, Texas solar and climate conditions, the estimated daily energy production of a fixed solar PV system ranges seasonally with local solar irradiation and weather variability. Using monthly average solar resource values for Stephenville and an overall derating factor of 0.80, a 100 kW PV system is expected to produce approximately 287 to 658 kWh/day, a 110 kW system approximately 316 to 723 kWh/day, and a 120 kW system approximately 345 to 789 kWh/day. Since the combined daytime energy requirement of the SMR unit and PEM electrolyzer is approximately 497 kWh/day for 6 h of operation, a 120 kW PV system is recommended for improved annual reliability in Stephenville, although winter months may still require hydrogen storage support, curtailed electrolyzer operation, or supplemental energy input.

3.2. PEM Electrolyzer and Fuel Cells

During nighttime operation, only the critical auxiliary load is supplied by the fuel cell, rather than attempting to sustain the full 32.85 kW reformer load through hydrogen storage. This significantly reduces both the electrolyzer size and the hydrogen storage requirement.
The nighttime auxiliary energy demand is calculated as Equation (74):
E n i g h t = P a u x   × n i g h t t i m e
Assuming an auxiliary power demand ( P a u x ) of 5 kW and 17.85 h of non-solar operation per day, the nighttime energy requirement is calculated by Equation (75),
E n i g h t = 5 × 17.85 = 89.25   k W h / d a y
The required hydrogen mass to supply this nighttime energy demand is given in Equation (76).
m H 2 = E n i g h t η F C × L H V H 2 = 89.25 0.50 × 33.3 = 5.36   k g / d a y
Thus, approximately 5.36 kg of hydrogen must be produced and stored each day to supply the nighttime auxiliary load.
The specific energy consumption of the PEM electrolyzer was assumed to be 55.2 kWh/kg- H 2 [47]. The electrical energy required by the PEM electrolyzer to generate this hydrogen is shown in Equations (77) and (78).
E e l e c ,   H 2 = m H 2 × S p e c i f i c   E n e r g y   C o n s u m p t i o n
E e l e c ,   H 2 = 5.36 × 55.2 = 295.87   k W h / d a y
The daytime direct SMR energy supplied by solar PV is given in Equations (79) and (80)
E P V ,   t o t a l = E d a y , S M R = E e l e c ,   H 2
E P V ,   t o t a l = 202.36 + 295.87 = 498.23   k W h / d a y
The required PV array size is then estimated using Equations (81) and (82).
P P V = E P V ,   t o t a l P S H × P R
P P V = 498.23 616 × 0.80 = 101.1   k W
Accordingly, a solar PV capacity of about 100 kW is recommended for the balanced system.
The PEM electrolyzer must convert the daytime excess PV electricity into hydrogen over the available solar generation period. Its nominal size is estimated using Equations (83) and (84).
P e l e c = E e l e c ,   H 2 t s u n
P e l e c = 295.87 6.16 = 48.0   k W
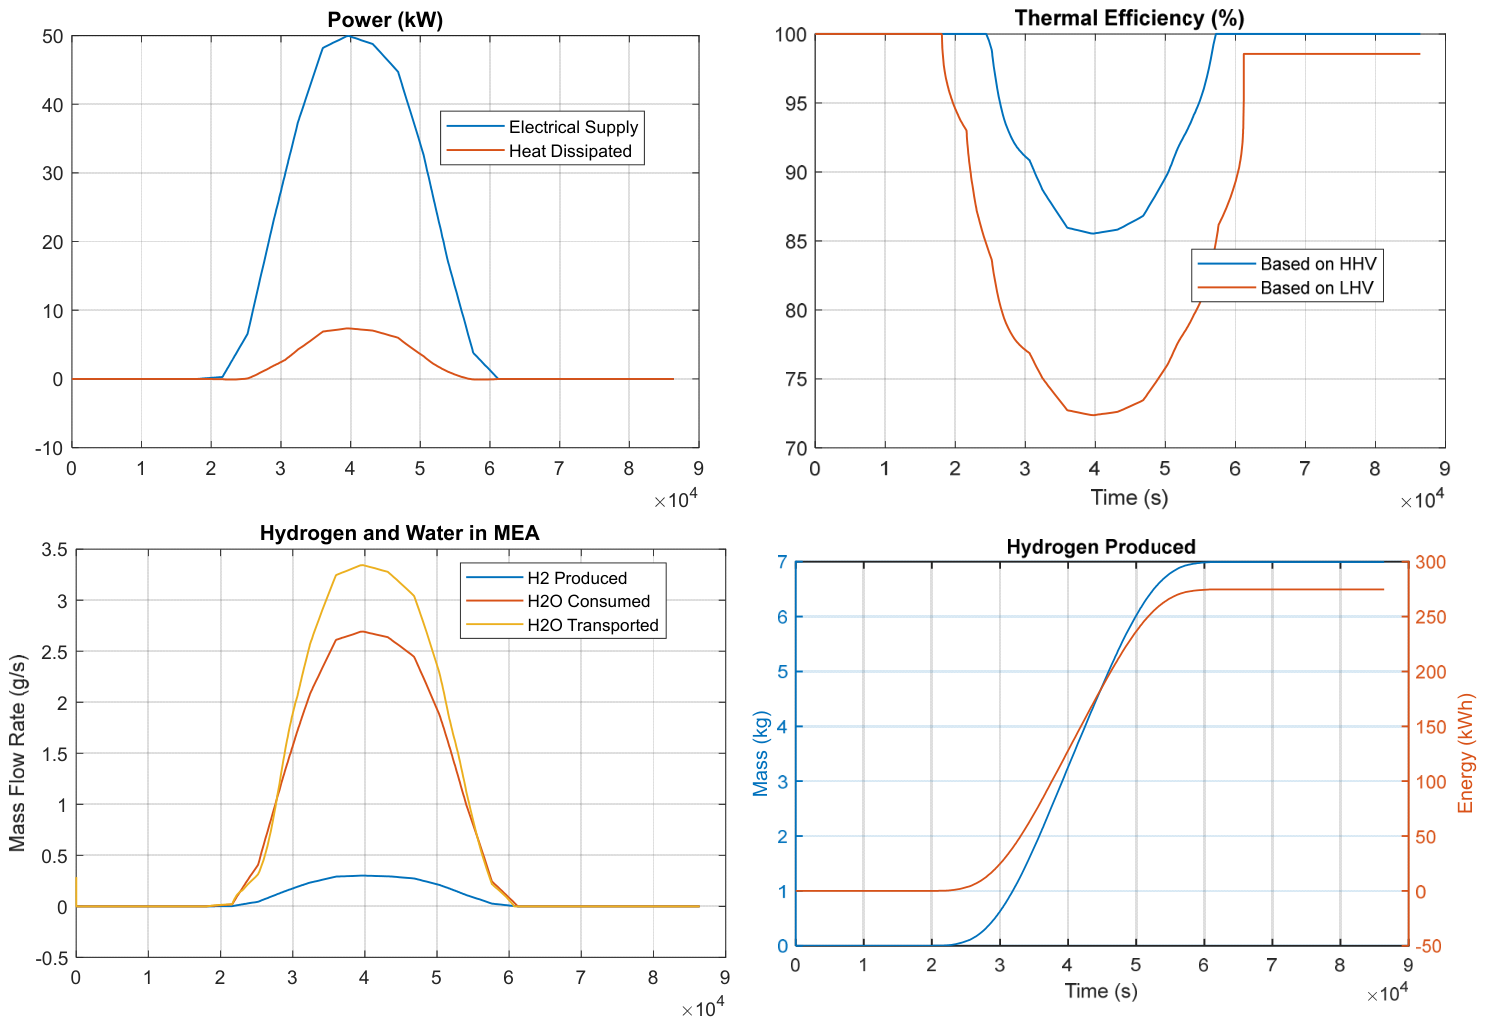
Thus, a PEM electrolyzer rated at approximately 50 kW is appropriate. Figure 10 analyzes the 50 kW PEM electrolyzer system performance, which considered the electrical power supply and heat dissipation, thermal efficiency based on higher and lower heating values, hydrogen and water transport rates, and cumulative hydrogen production over the operating period.
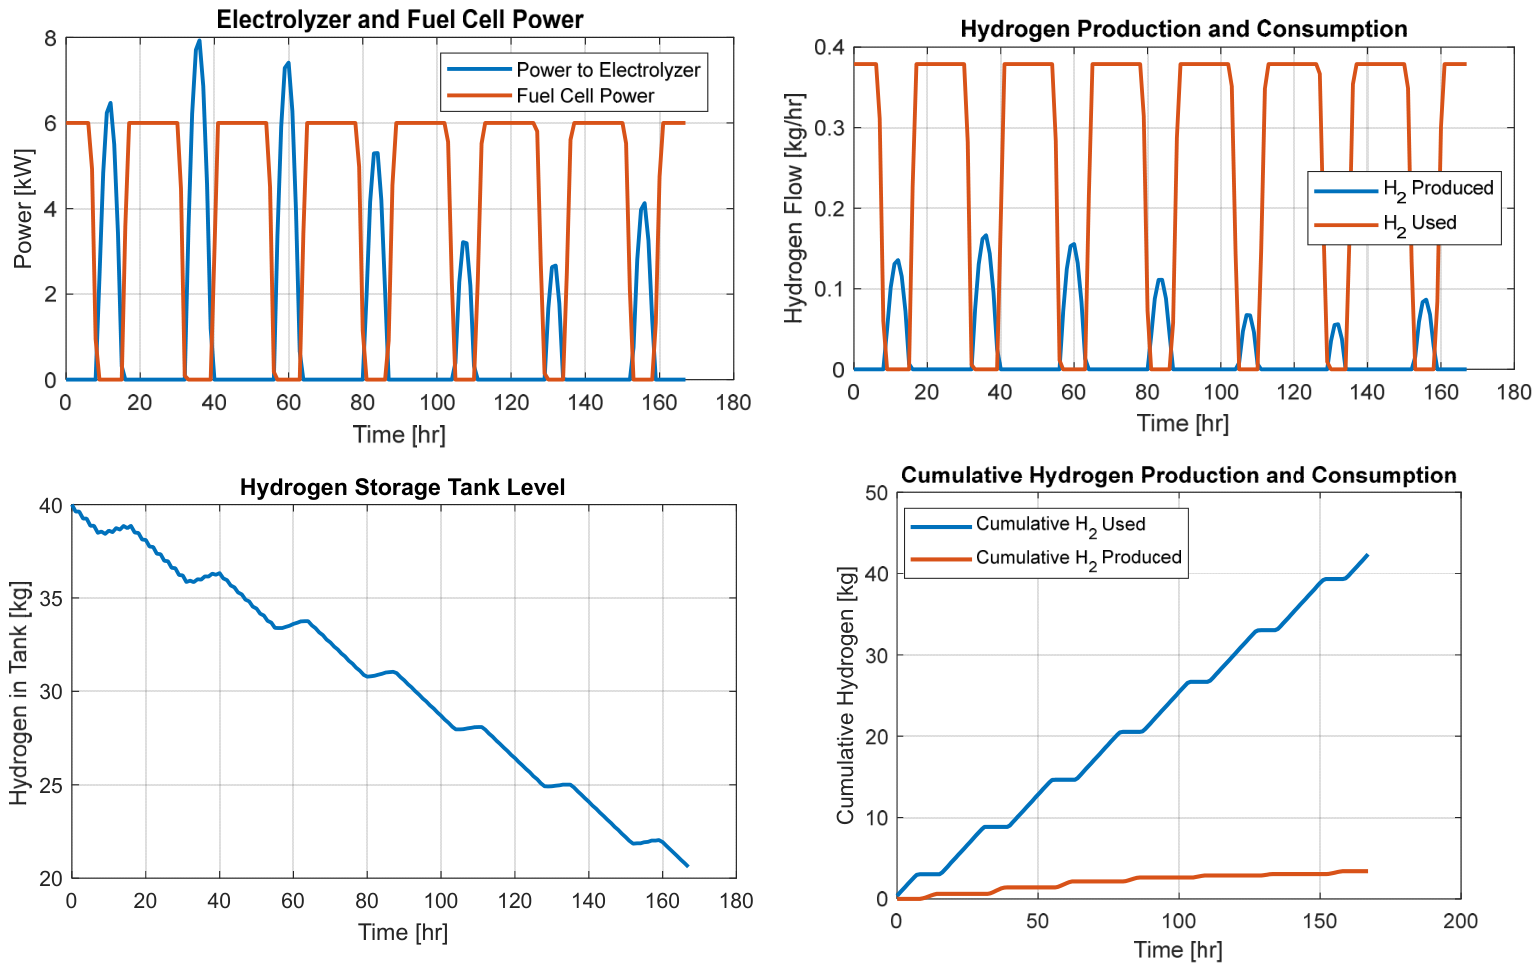
The PEM electrolyzer required active area per cell is 146.20 cm2. At nominal operation, the stack delivers 292.40 A and 171.00 V, which confirms a stack power of 50.00 kW. Under these conditions, the system produces about 0.9897 kg/h of hydrogen, consumes 8.84 kg/h of water, and generates 7.85 kg/h of oxygen. The fuel cell should be sized to meet the 5 kW nighttime auxiliary demand with a modest safety margin. Thus, a practical fuel cell size is about 6 kW. The hydrogen storage requirement is 5.36 kg/day, and with a reserve allowance, a storage capacity of 6 to 8 kg was estimated. Figure 11 shows the operational performance of the integrated electrolyzer, fuel cell, and hydrogen storage system. This performance analysis includes the power distribution between the electrolyzer and fuel cell, hydrogen production and consumption rates, variations in the hydrogen storage tank level, and the cumulative hydrogen production and utilization throughout the operating period.
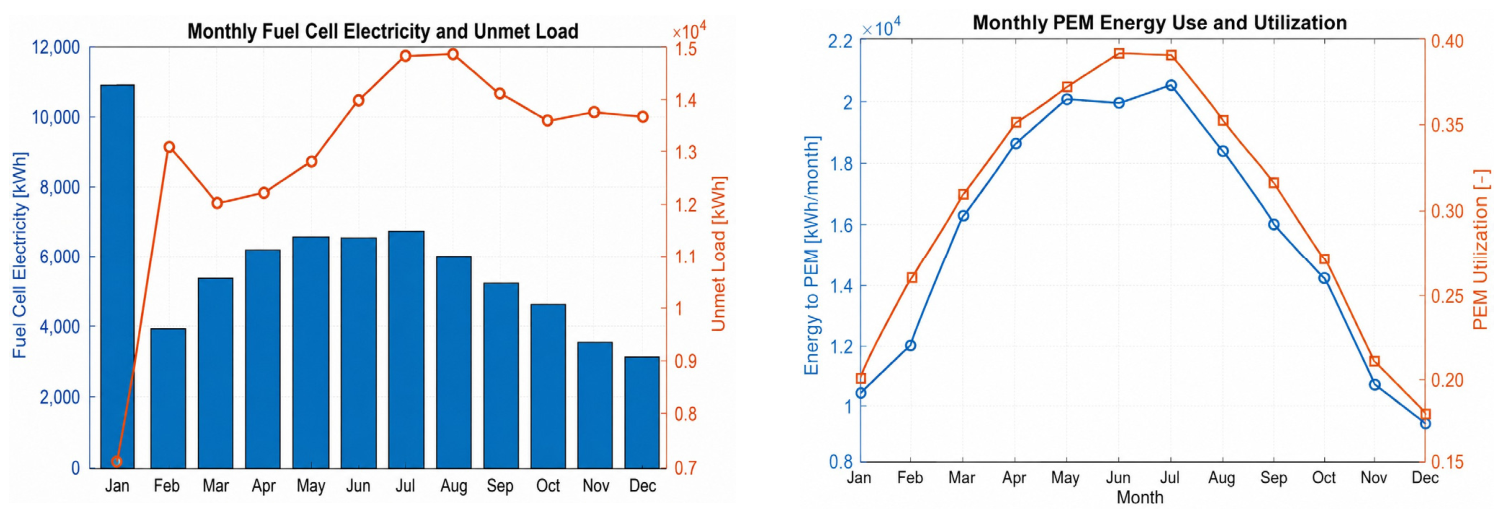
Based on these calculations, the balanced and cost-optimized hybrid design consists of a 120 kW solar PV array, a 50 kW PEM electrolyzer, a 6 kW fuel cell, and a hydrogen storage system sized for 6 to 8 kg of usable hydrogen. This configuration is more economical than sizing the hydrogen subsystem to operate the full SMR load overnight. If full 24 h reformer operation from hydrogen were required, the PV capacity, electrolyzer size, fuel cell capacity, and hydrogen storage volume would increase substantially, leading to significantly higher capital cost. Figure 12 shows the monthly variation in fuel cell electricity generation and unmet load. Fuel cell output is the highest in the winter months, particularly in January, and gradually decreases toward late fall in Stephenville, Texas. The energy input to the PEM system increases from winter to summer, closely following the seasonal variation in solar energy availability, with peak values occurring in June and July. However, PEM utilization remains relatively low throughout the year, with a maximum efficiency of only about 39%, which indicates that the electrolyzer is underutilized. During winter months, both energy input and utilization decrease due to limited solar power.
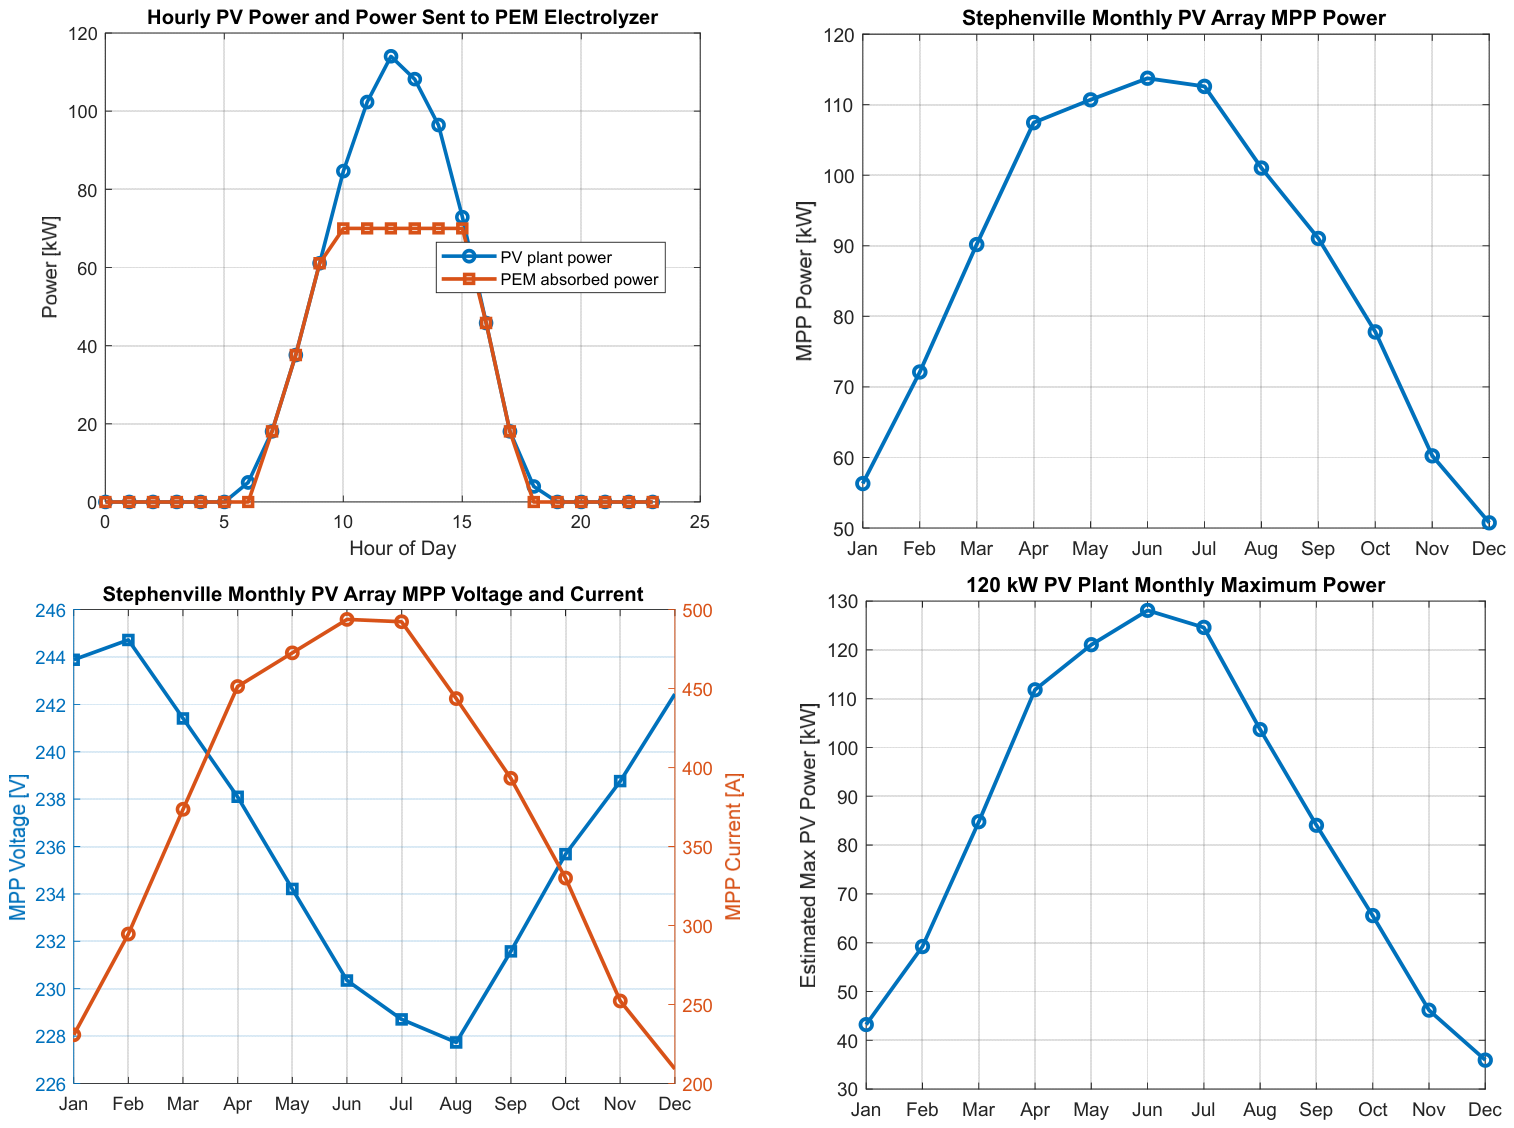
Figure 13 presents the hourly variation in PV power and the power delivered to the PEM electrolyzer. PV output increases rapidly in the morning, peaks around midday at over 110 kW, and then decreases toward the evening. The PEM electrolyzer, however, is limited to approximately 50 kW, so it follows the PV output only until reaching its rated capacity and then remains constant during peak solar hours. This indicates that excess PV energy above 50 kW is not utilized by the electrolyzer and could be redirected to other loads or energy storage systems. The monthly variation in the PV array maximum power in Stephenville shows that PV power increases from winter to summer, reaching a peak around June, and then gradually declines toward December. This trend reflects seasonal changes in solar irradiance, with higher energy production during late spring and summer and lower output in winter. Additionally, PV voltage is higher during winter and decreases in summer, while the current follows the opposite trend, increasing with temperature. Consequently, the 120 kW PV plant produces rated power in summer and significantly less in winter, highlighting strong seasonal dependence.
Thus, the system is configured such that the 120 kW PV array supports an 82.85 kW daytime process load, while excess energy can charge the battery and potentially support hydrogen production and storage. The battery provides 96 kWh of usable storage, and the hydrogen subsystem, including the 10 kg tank and fuel cell, supports nighttime auxiliary operation at 5 kW.

3.3. SMR Analysis and Results

The reactor system operates under high-temperature conditions, with a pipe wall temperature of approximately 1021 K and a catalyst bed temperature of 1250 K, indicating strong endothermic reforming activity. The gas exits the reactor at an average temperature of 926 K. The outlet mass flow rate is about −0.0012 kg/s, where the negative sign likely represents the outflow direction. The catalyst sensible heat transfer rate was calculated as −2347.78 W, where the negative sign denotes heat absorption according to the CFD sign convention. The total heat-transfer rate associated with the catalyst region was 9681.30 W, representing the net thermal input required under the specified single-tube reactor conditions. At the outlet, the pressure is around 82.6 kPa. The product gas composition reveals extensive methane conversion, with a low C H 4 mole fraction (0.0083), a dominant hydrogen fraction (0.585), and moderate amounts of C O 2 (0.139), CO (0.0084), and H 2 O (0.259). These results confirm effective reforming and hydrogen-rich synthesis gas production. The thermal, flow, heat transfer, pressure, and gas composition results obtained from the CFD simulation are listed in Table 3, Table 4 and Table 5 to evaluate the performance and operating characteristics of the steam methane reforming reactor.
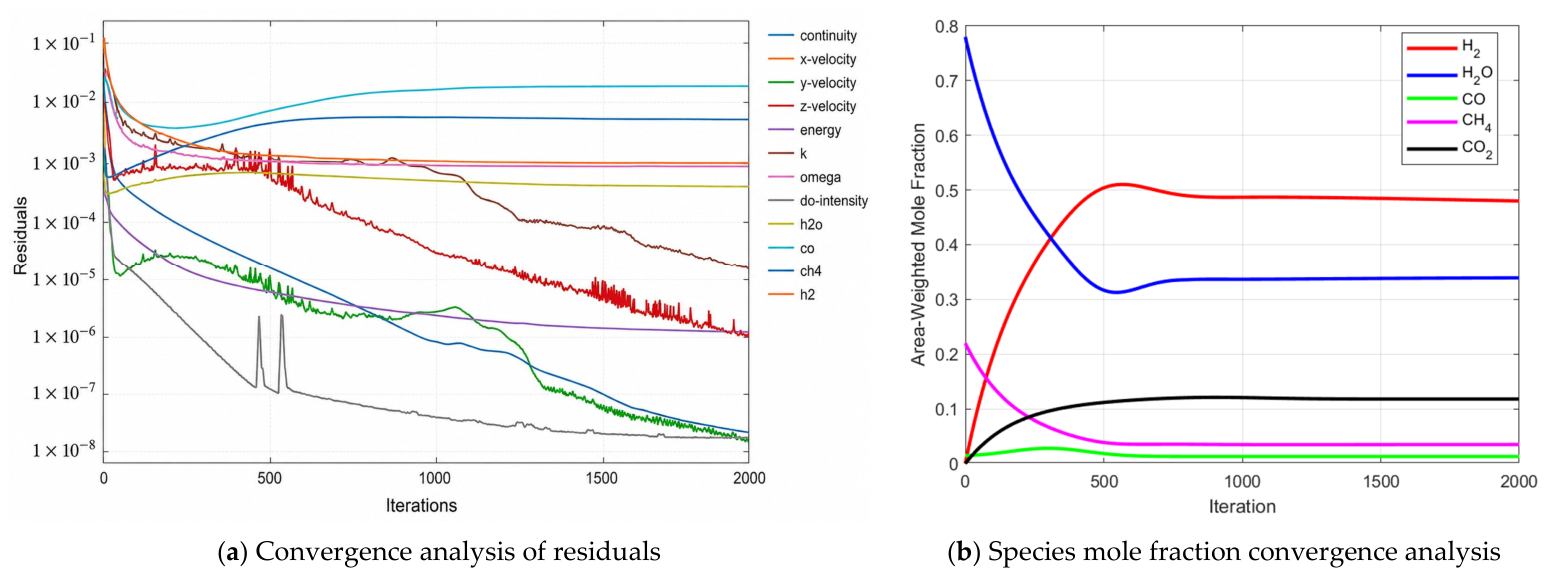
The reactor demonstrates excellent performance under strong endothermic steam methane reforming conditions. The elevated catalyst-bed temperature of approximately 1012–1050 K promotes methane conversion and hydrogen production while maintaining stable reactor operation. The negative sensible heat confirms substantial energy absorption by the reforming reactions. The outlet gas composition, characterized by a high hydrogen mole fraction of approximately 0.585 and a very low residual methane concentration of about 0.0083, indicates efficient methane utilization. Furthermore, the high H 2 / C O ratio of nearly 70:1 confirms extensive water–gas shift reaction activity, resulting in a hydrogen-rich product stream. Based on the outlet conditions and assuming C H 4 and H 2 O as the feed species, the calculated inlet flow rates are 0.01536 mol/s for C H 4 and 0.05378 mol/s for H 2 O , corresponding to a steam-to-carbon ratio of 3.50. The reactor achieves a methane conversion efficiency of 94.71%, producing 3.753 mol H2 per mole of C H 4 fed and 3.963 mol H2 per mole of C H 4 converted, approaching the theoretical maximum of 4 mol H2/mol C H 4 . The hydrogen energy output is 13.94 kW, while the external heat supplied to the catalyst is 9.68 kW. The heat-to-hydrogen efficiency reaches 144% when considering only the external heat input, whereas the overall energy efficiency, accounting for both methane chemical energy and external heat, is 63.35%. Elemental balance analysis confirms the model accuracy, with negligible errors for carbon and oxygen and only a 0.35% deviation in hydrogen, demonstrating accurate reaction modeling, efficient energy utilization, and high-performance hydrogen production. Figure 14 shows that convergence of the governing equation residuals and area-weighted species mole fractions demonstrates that the CFD simulation of catalytic steam methane reforming achieved numerical stability and solution convergence.
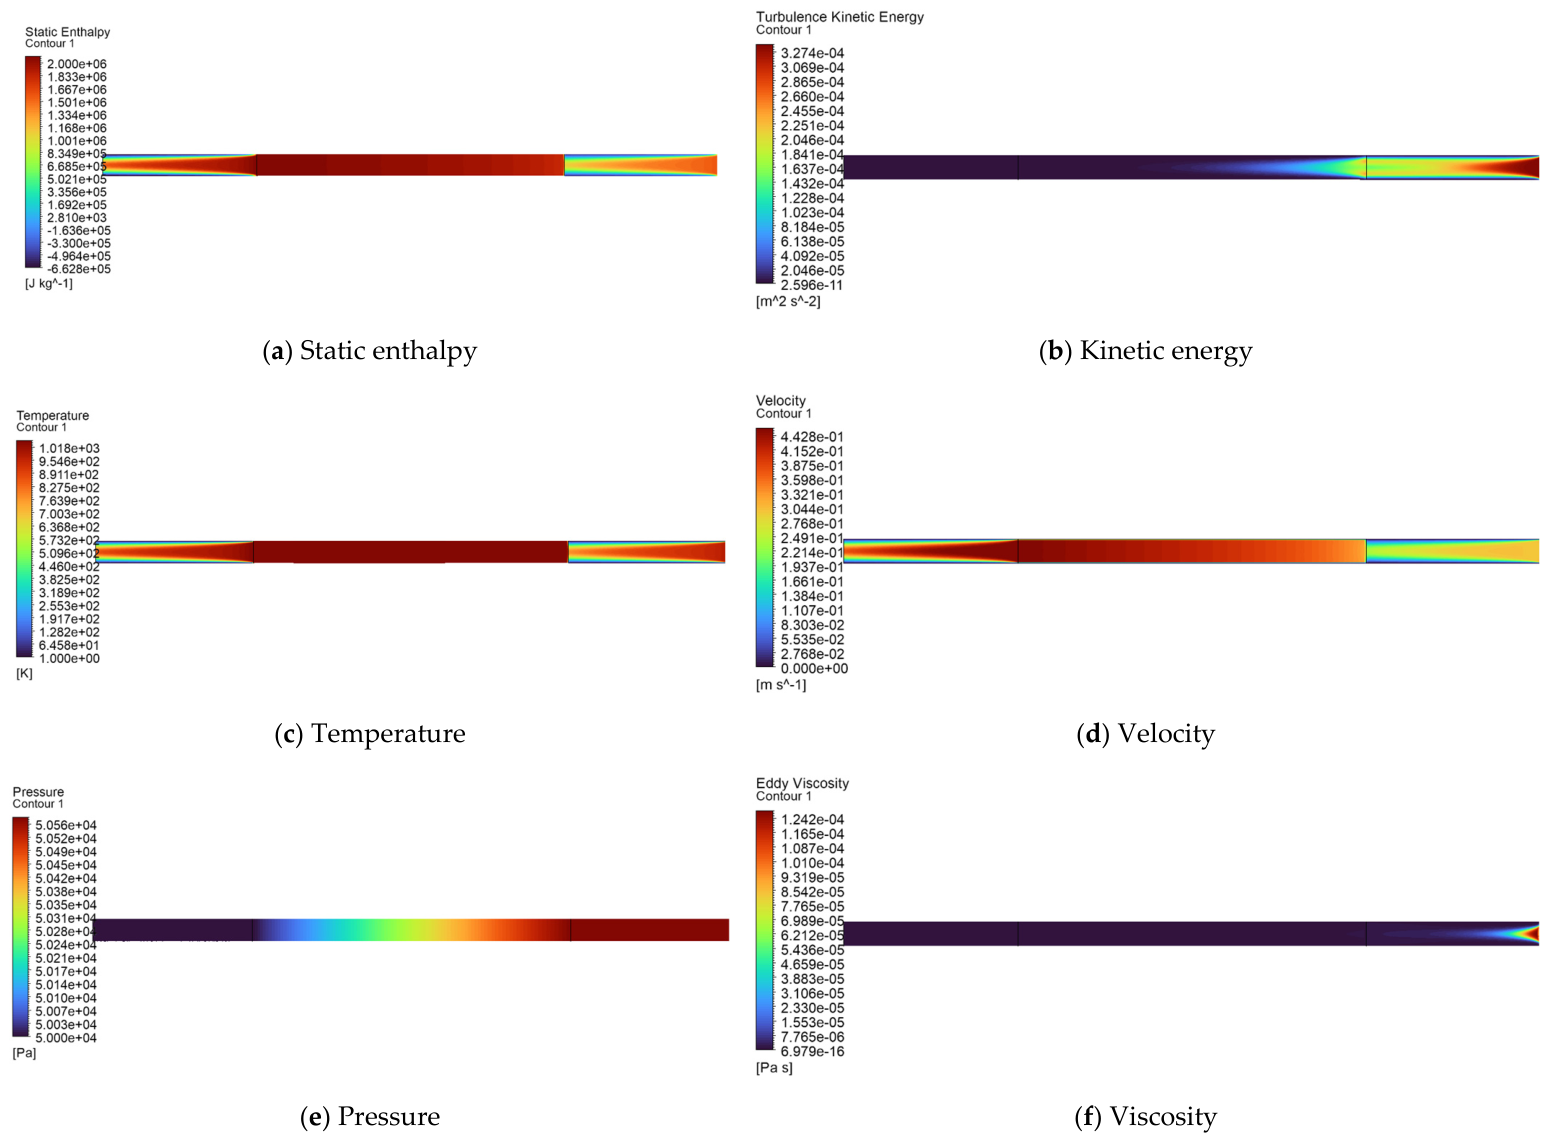
The convergence histories of the governing equation residuals and species transport equations demonstrated the numerical stability and accuracy of the CFD simulation. At the beginning of the simulation, relatively high residual values were observed due to the initialization of the flow field, heat transfer, and reaction kinetics. As the iterations progressed, the residuals associated with continuity, momentum, turbulence, and species transport decreased steadily by several orders of magnitude, indicating successful convergence of the numerical solution. The continuity and velocity of residuals fell below approximately 10 6 10 8 , while the species residuals for H 2 ,   C O ,   C H 4 , and C O 2 also decreased and stabilized, confirming convergence of the chemical reaction and species transport calculations. Although the energy and turbulence residuals remained slightly higher, they exhibited stable behavior without significant oscillations, indicating an acceptable converged solution for the reacting flow simulation. The convergence of the area-weighted average mole fractions further verified the stability of the catalytic reforming process. Initially, water vapor ( H 2 O ) was the dominant species, whereas hydrogen ( H 2 ), carbon monoxide (CO), and carbon dioxide ( C O 2 ) were present at relatively low concentrations. As the steam methane reforming reactions progressed, methane was consumed and hydrogen production increased rapidly, reaching a stable mole fraction of approximately 0.48–0.50 after about 700 iterations. Simultaneously, the H 2 O mole fraction decreased and stabilized near 0.33–0.35, reflecting its consumption during the reforming reactions. Carbon monoxide and carbon dioxide concentrations gradually increased and approached steady values as reaction products accumulated. The methane mole fraction decreased significantly due to conversion within the catalyst bed and eventually stabilized at a low value. The stabilization of all species mole fractions after approximately 700–1000 iterations confirms that both numerical convergence and steady-state chemical behavior were achieved, providing confidence in the predicted hydrogen production, methane conversion, and overall reactor performance. Figure 15 shows the CFD contours for the single-tube steam methane reformer, including static enthalpy, turbulence kinetic energy, temperature, velocity, pressure, and eddy viscosity.
The CFD results show that the single-tube reformer provides stable flow, effective heat transfer, and favorable reaction conditions for steam methane reforming. The temperature and enthalpy distributions confirm that sufficient thermal energy is supplied to sustain the endothermic reforming reactions, while the gradual pressure drop and velocity reduction are consistent with flow through a porous catalyst bed. Turbulence kinetic energy and eddy viscosity are significant only near the inlet and are effectively damped within the catalyst region. These results indicate that the single-tube model captures the fundamental thermo-fluid and reaction characteristics of the reformer and provides a computationally efficient basis for detailed parametric studies before extending the analysis to the full 21-tube reactor configuration.
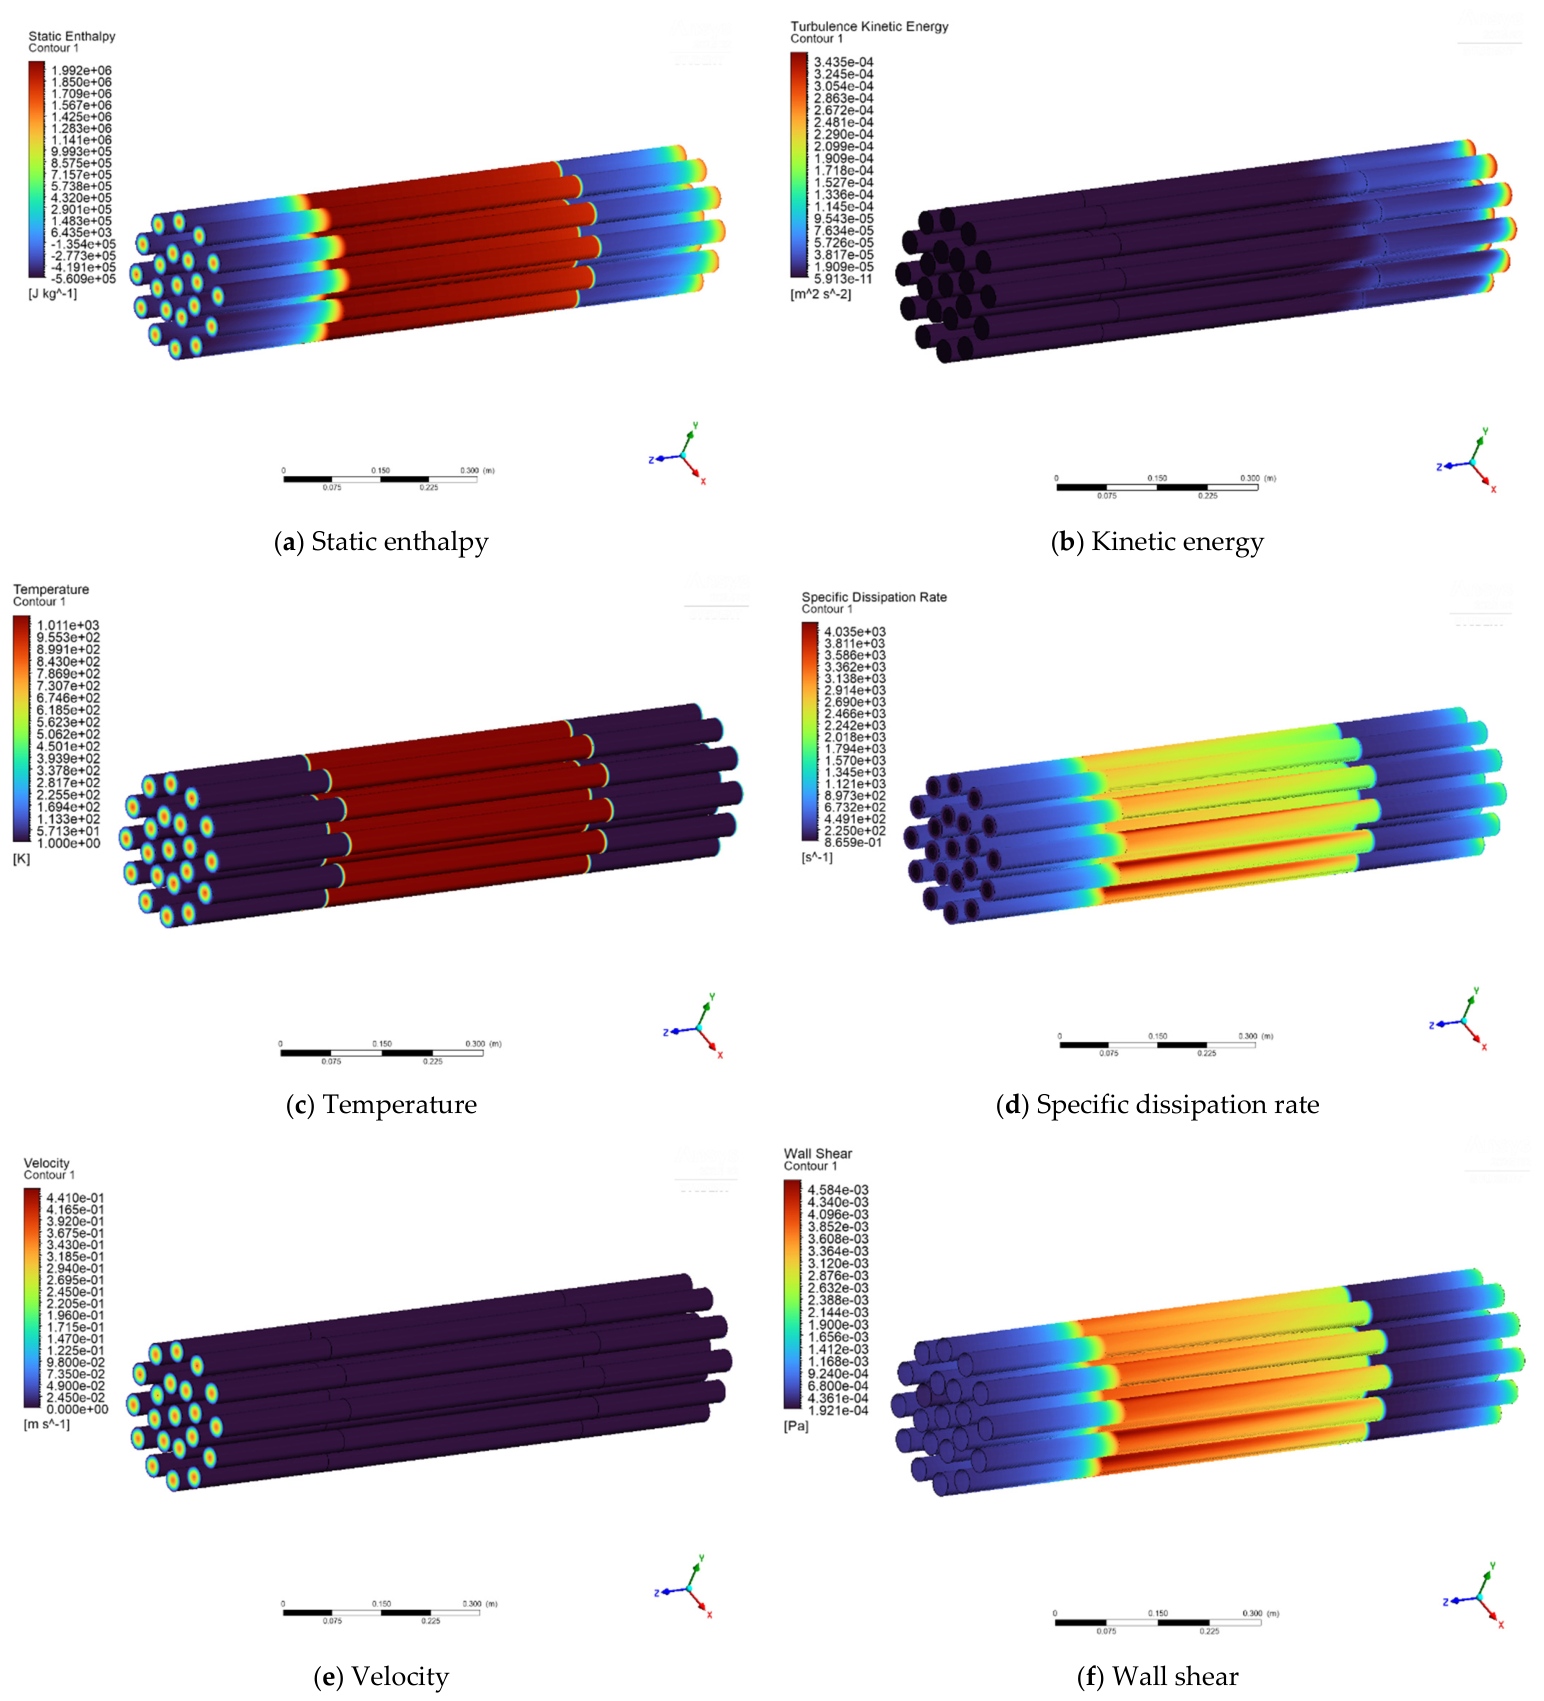
Figure 16 shows the contours of temperature, static enthalpy, turbulence kinetic energy, specific dissipation rate, velocity, and wall shear stress demonstrates the effectiveness of heat transfer and reaction progression within the catalyst-filled reformer tubes.
The CFD results provide favorable thermal-fluid characteristics for hydrogen production in the multi-tube steam methane reforming reactor. The temperature distribution shows that the catalyst region reaches approximately 1000–1010 K, while the inlet and outlet sections remain cooler, which indicates effective heat transfer from the external heat source to support the highly endothermic reforming reaction. The nearly uniform high-temperature zone promotes efficient methane conversion and hydrogen generation. Similarly, the static enthalpy increases substantially within the reaction zone, reaching approximately 1.99 × 10 6 J/kg, confirming significant thermal energy absorption by the reacting gas mixture. The velocity distribution remains low and uniform, with peak values below 0.44 m/s, providing adequate residence time and minimizing channeling effects. Low turbulence kinetic energy indicates predominantly laminar flow conditions, reducing pressure losses while maintaining stable heat transfer. Elevated specific dissipation rates and moderate wall shear stresses within the reaction region further enhance heat and mass transfer processes, resulting in efficient methane conversion, low pressure drop, and sustained hydrogen production performance. Figure 17 presents the CFD distributions of total energy, surface heat flux, reaction rate, and enthalpy within the SMR tube bundle.
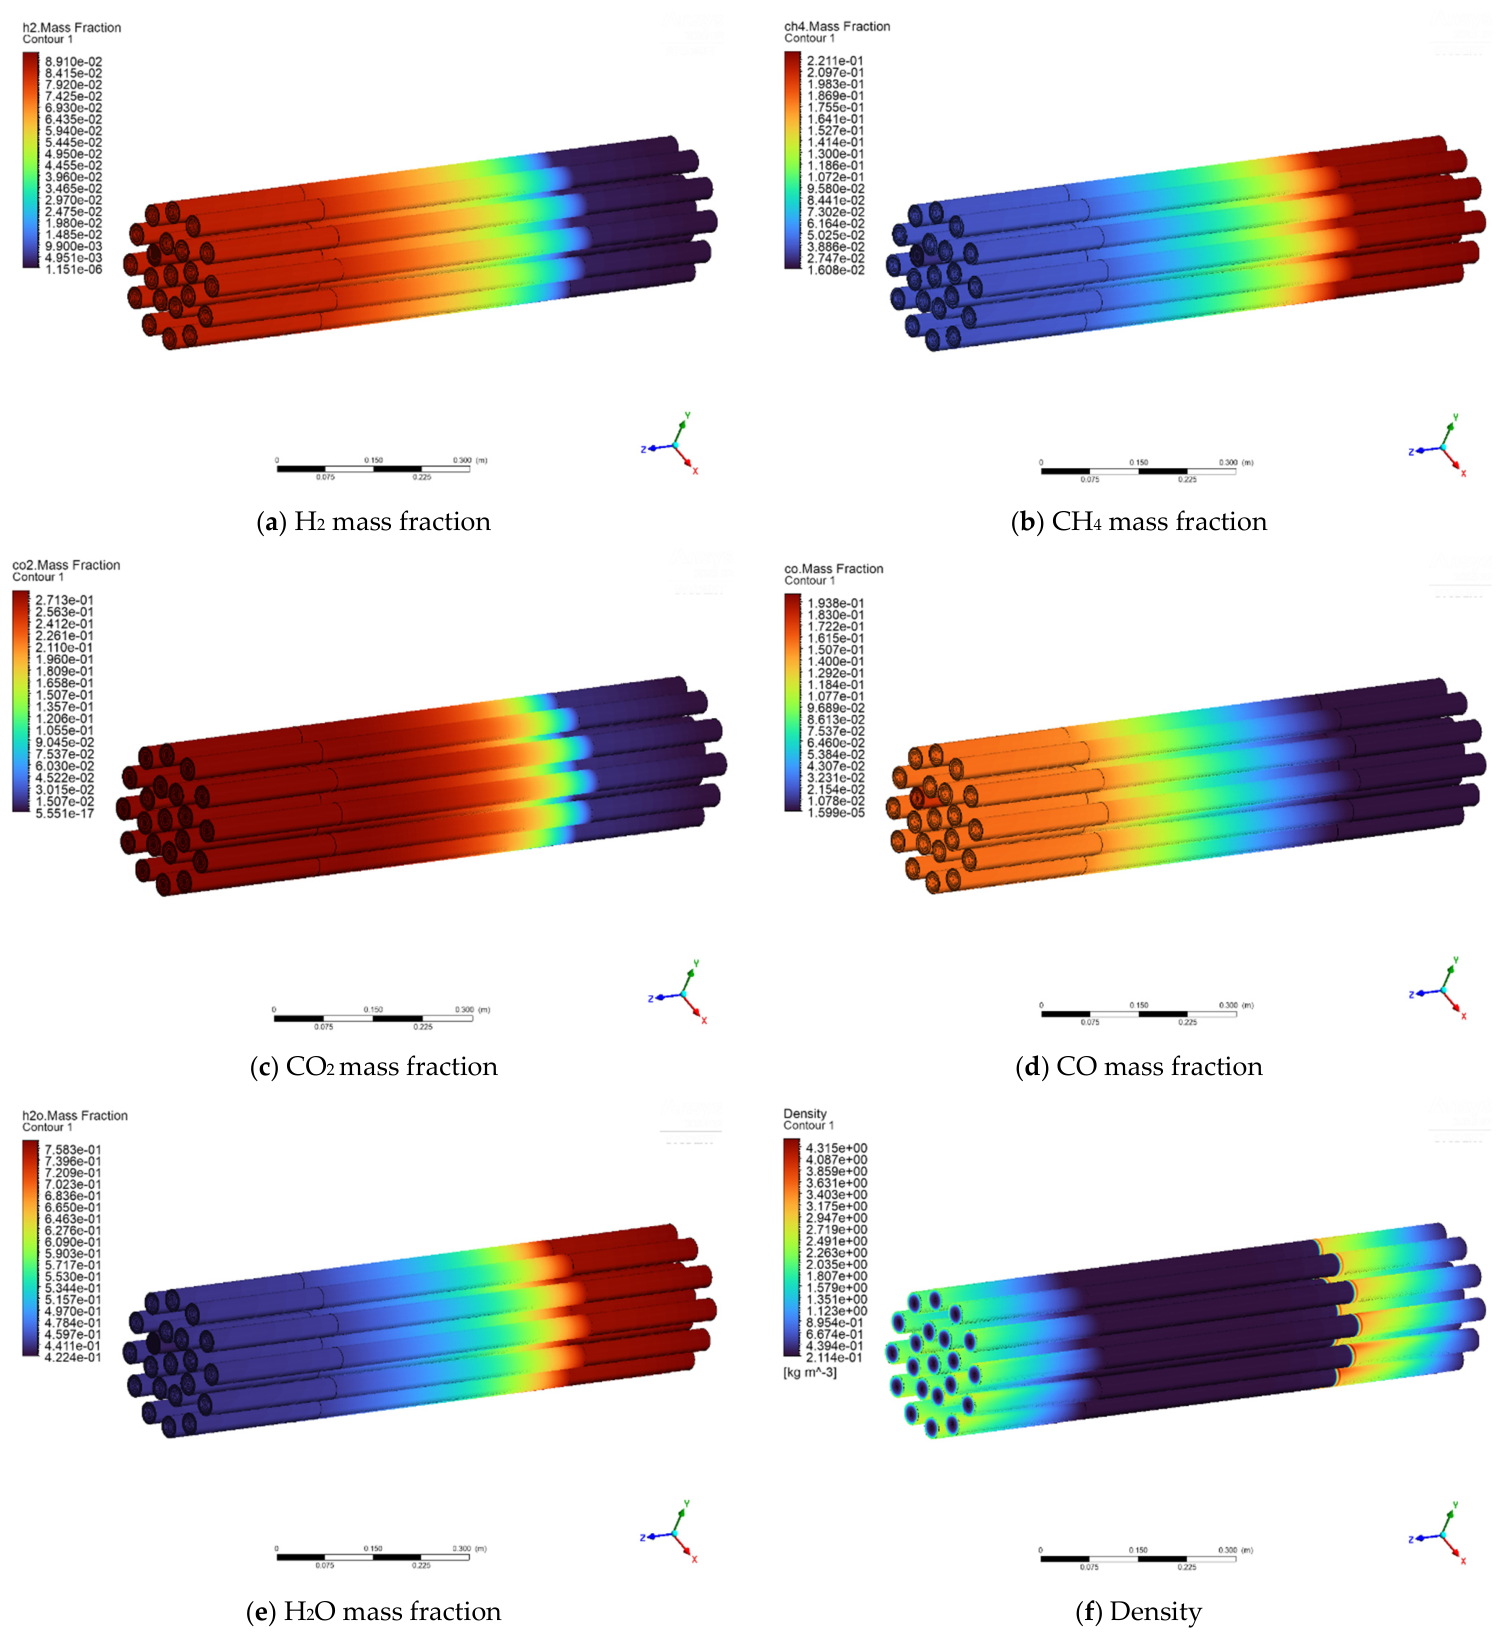
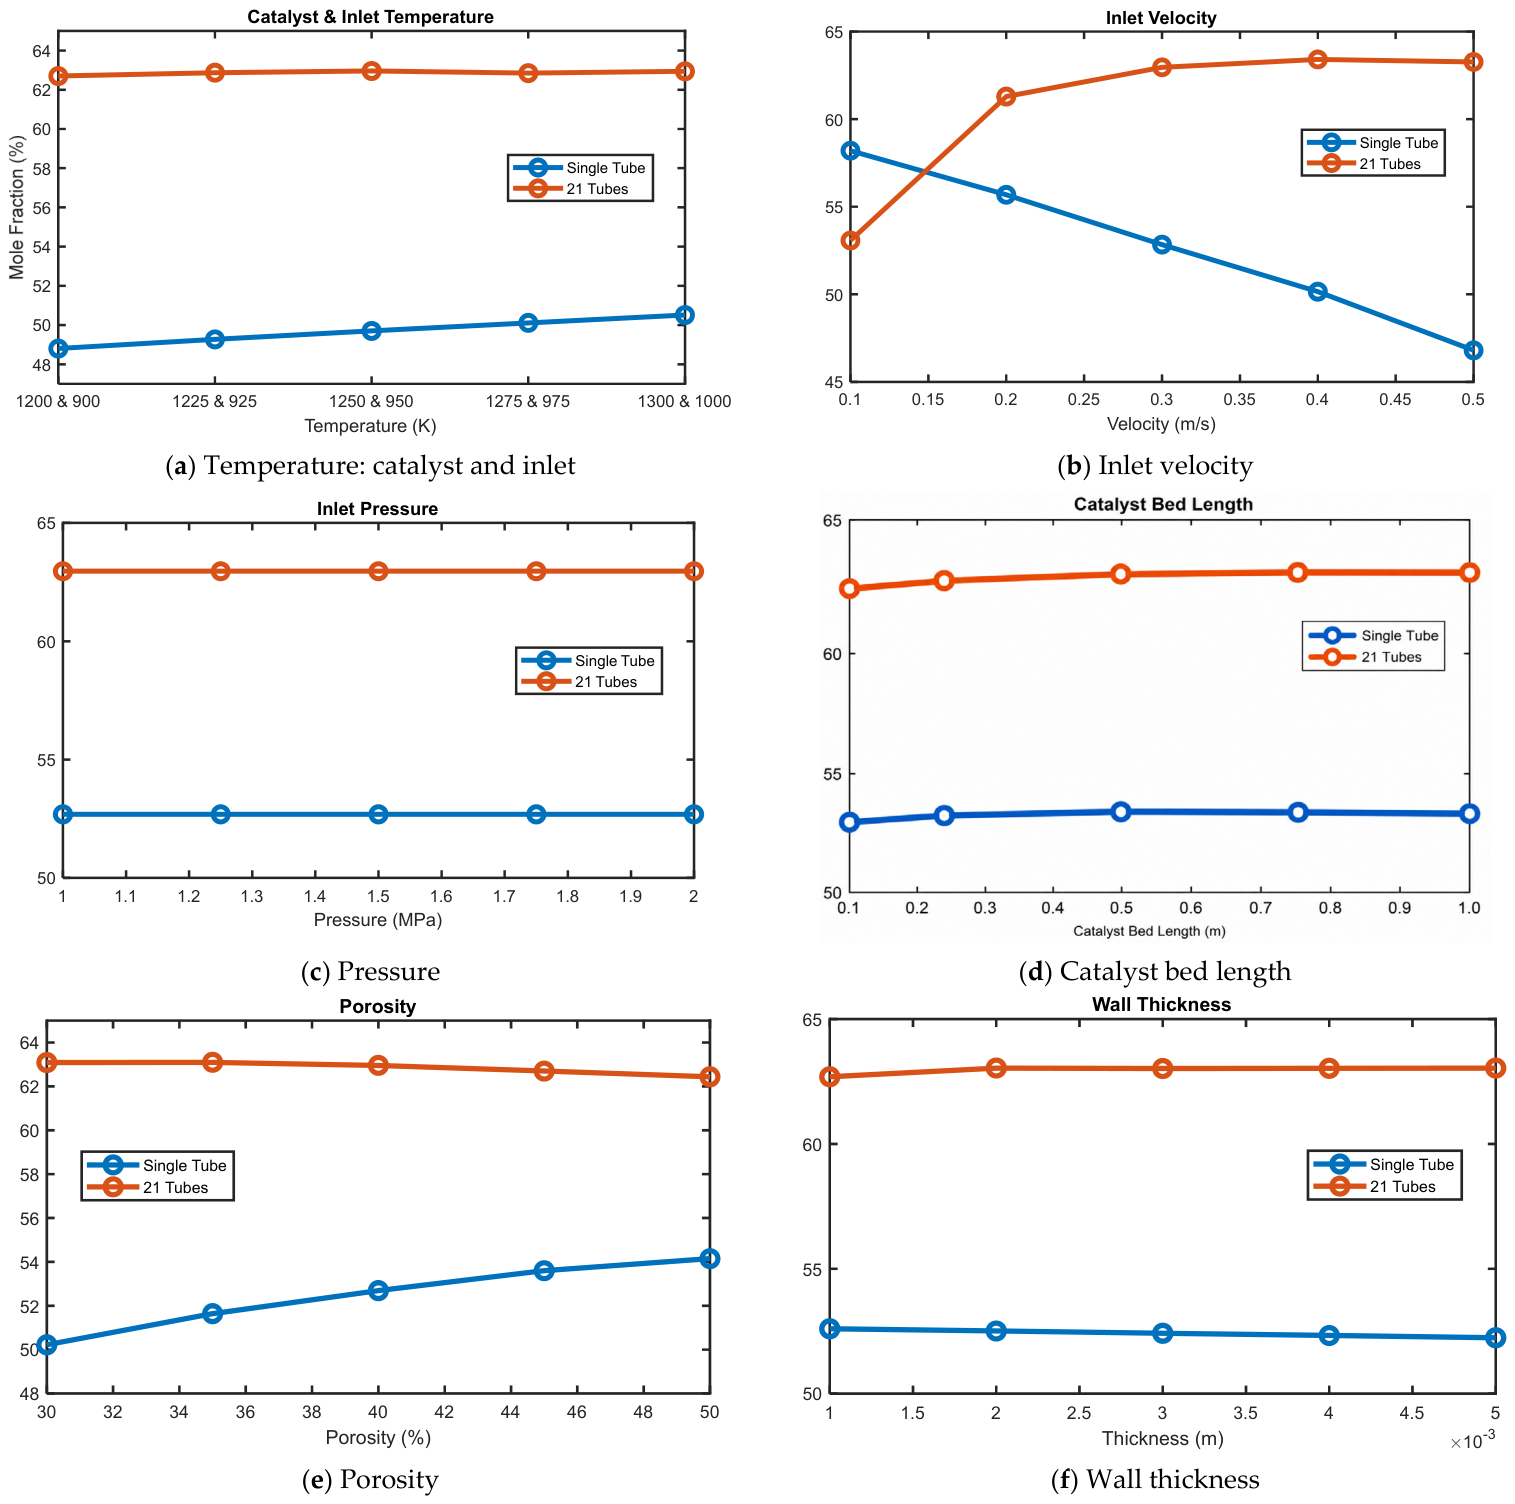
The CFD model considers only the SMR reaction. The reported species distributions and methane conversion reflect only the SMR reaction, while the WGS reaction is neglected. The H 2 mass fraction increases significantly along the reactor length, reaching a maximum value of approximately 0.089, indicating successful conversion of methane into hydrogen. Correspondingly, the C H 4 mass fraction decreases from approximately 0.221 at the inlet to near zero at the outlet, demonstrating substantial methane consumption within the catalyst bed. The C O mass fraction decreases along the reactor length, while C O 2 displays a corresponding increase, confirming the occurrence of the water–gas shift reaction, which further enhances hydrogen generation. Similarly, H 2 O mass fraction decreases progressively due to its consumption during reforming and shift reactions. The density distribution shows a reduction within the heated reaction zone because of elevated temperatures and changes in gas composition. The relatively uniform species distributions across all reformer tubes indicate balanced reactant flow and consistent catalytic activity, minimizing channeling effects and promoting efficient reaction kinetics. As a result, the CFD results demonstrate high methane conversion, effective heat utilization, and favorable reaction progression, confirming that the proposed multi-tube reactor configuration provides suitable operating conditions for enhanced hydrogen production and industrial steam methane reforming applications. To accurately evaluate the thermal and reaction characteristics of the SMR system, several key operating and geometric parameters were considered, including catalyst temperature, inlet temperature, operating pressure, gas velocity, catalyst bed length, catalyst porosity, wall thickness, and pipe diameter. These parameters significantly influence heat transfer, species transport, reaction kinetics, methane conversion, hydrogen yield, and the overall performance of the reformer, as illustrated in Figure 18.
To evaluate the influence of reactor configuration, CFD simulations were conducted for both a single reformer tube and a reactor consisting of 21 identical catalyst-filled tubes. Both models employed identical operating conditions, which included the same inlet gas composition, steam-to-carbon ratio, inlet temperature of 837 K, operating pressure of 1.5 MPa, catalyst properties, reaction kinetics, porous-media parameters, and wall thermal boundary conditions. For the 21-tube configuration, the total feed flow was distributed uniformly among the tubes, and each tube was assumed to experience identical thermal and flow conditions. Tube-to-tube flow maldistribution, manufacturing tolerances, and non-uniform furnace heating were neglected. Consequently, the comparison isolates the effect of reactor configuration while maintaining all other operating parameters unchanged. All parameters investigated indicate that temperature, inlet velocity, and porosity exert the most significant influence on hydrogen production. In contrast, pressure, catalyst length, and wall thickness have minimal effects within the examined ranges. The 21-tube reactor consistently produces higher hydrogen mole fractions than the single-tube reactor, demonstrating superior heat transfer, flow distribution, and reaction efficiency. These characteristics make the multi-tube configuration a more effective and robust design for large-scale hydrogen production applications.

3.4. Sensitivity Analysis

The sensitivity analysis proved that hydrogen production in the SMR reactor is critically influenced by temperature and residence time. Catalyst and inlet temperatures exhibited the strongest effects, as higher temperatures promoted endothermic reforming reactions and enhanced methane conversion. While hydrogen production increased noticeably in the single-tube reactor, the multi-tube configuration maintained consistently high hydrogen mole fractions, indicating operation near equilibrium conditions. Inlet velocity also played a significant role by affecting reactant residence time within the catalyst bed. Increased velocity reduced hydrogen production in the single-tube reactor, whereas the multi-tube system showed greater stability due to improved heat and mass transfer characteristics. In contrast, operating pressure, catalyst length, and wall thickness had minimal influence on hydrogen yield within the investigated ranges, suggesting that the reactor had already achieved near-complete conversion. Catalyst porosity and pipe radius produced moderate effects by altering flow distribution, heat transfer, and catalytic surface availability. As a result, the multi-tube reactor consistently outperformed the single-tube configuration, demonstrating superior thermal management and reaction efficiency for hydrogen production. The design of experiments (DOE) matrix made the operating and geometric parameters used to evaluate hydrogen production performance in the steam methane reforming reactor shown in Table 6.
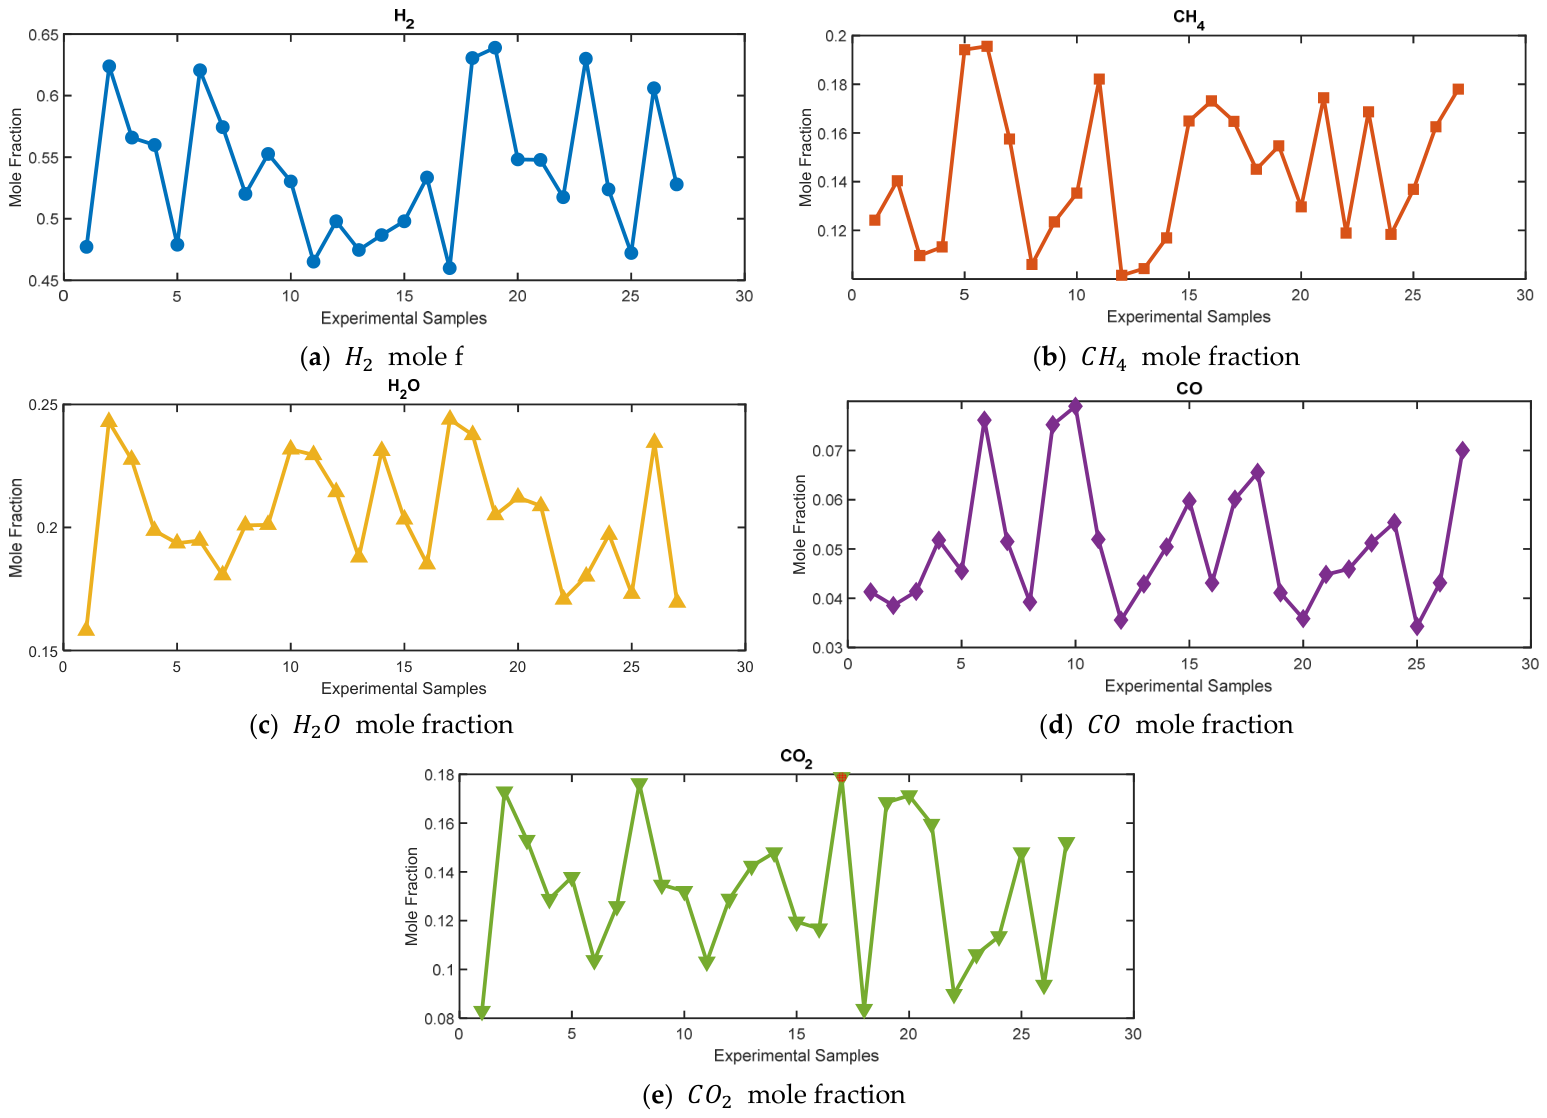
A structured parametric variation is conducted at two discrete levels of catalyst temperature and inlet temperature (1200–1300 K and 900–1000 K), combined with two velocity levels (0.1 and 0.5 m/s), two porosity levels (30% and 50%), and two pipe diameters (0.025 and 0.045 m). This arrangement enables the evaluation of individual parameter effects as well as their interactions on hydrogen yield. By comparing these cases, the sensitivity of hydrogen production to thermal conditions, residence time, and reactor geometry can be clearly identified. It includes intermediate operating conditions and fine-tuning of individual parameters around a baseline case. These cases introduce mid-range temperatures (1225–1275 K), moderate velocities (0.2–0.4 m/s), and variations in porosity and pipe diameter centered around nominal values. This approach allows for a more detailed investigation of local trends and supports the identification of optimal operating conditions for maximizing hydrogen production. Thus, the DOE matrix provides a comprehensive framework for analyzing the influence of key SMR parameters on reactor performance. Figure 19 shows the variation of H 2 , C H 4 , H 2 O , and C O 2 mole fractions under different operational and geometric parameters in the SMR, which contribute to the hydrogen production performance. It enables systematic comparison between different configurations, including single-tube and multi-tube systems, and supports the development of predictive models and optimization strategies for efficient hydrogen production.
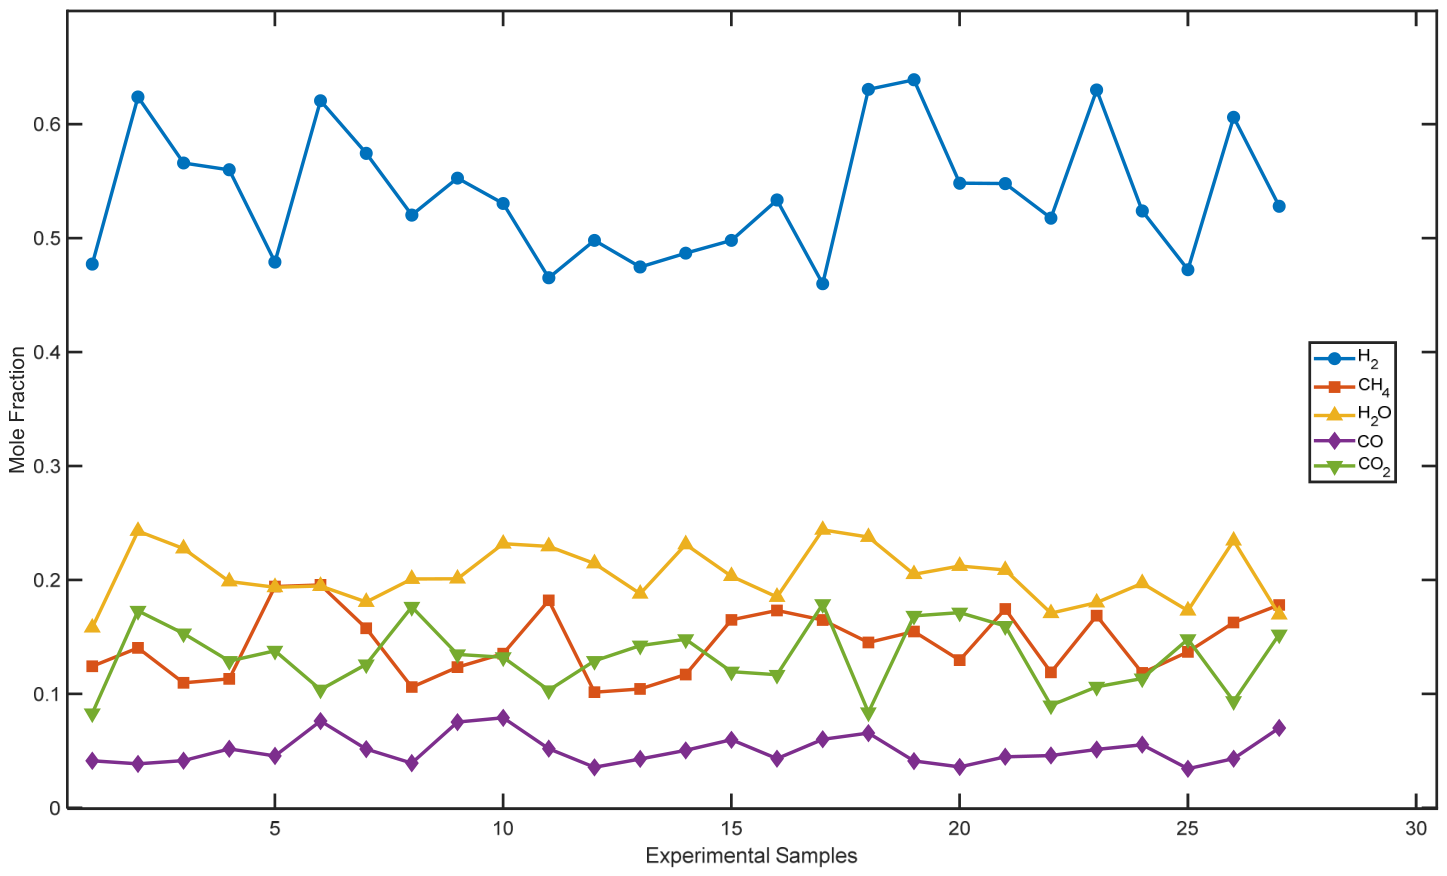
The hydrogen (H2) graph shows fluctuations across the samples, with mole fractions ranging approximately from 0.46 to 0.64. Higher hydrogen fractions are observed in several temperature cases, indicating improved methane conversion under favorable thermal conditions. The variability suggests that hydrogen production is strongly influenced by operating parameters such as temperature and residence time. Peaks in hydrogen concentration correspond to conditions where reforming and water–gas shift reactions are more effective. The methane ( C H 4 ) plot exhibits an inverse trend relative to hydrogen, with mole fractions generally ranging from about 0.10 to 0.20. Lower methane values indicate higher conversion efficiency. Cases with reduced C H 4 levels align with higher H 2 production, confirming that methane is being effectively reformed. Conversely, higher methane concentrations indicate incomplete reforming, likely due to insufficient temperature or reduced residence time. The water ( H 2 O ) plot shows moderate variation, with mole fractions typically between 0.16 and 0.24. Water plays a dual role as both a reactant in steam reforming and a product in the water–gas shift reaction. The relatively stable range suggests a balance between consumption in the reforming reaction and regeneration through secondary reactions. Slight increases in water content may indicate enhanced shift reaction activity, contributing to additional hydrogen production. The carbon monoxide ( C O ) plot demonstrates smaller but important variations, generally between 0.035 and 0.08. C O is an intermediate product of SMR and a reactant in the water–gas shift reaction. Higher C O levels suggest incomplete conversion to C O 2 , while lower values indicate effective shift reaction performance. The fluctuations imply that C O conversion is sensitive to operating conditions, particularly temperature and steam availability. The carbon dioxide ( C O 2 ) plot ranges approximately from 0.08 to 0.18 and reflects the extent of the water–gas shift reaction. Higher C O 2 concentrations correspond to more complete conversion of C O , which is favorable for hydrogen production. The variability in C O 2 indicates that some operating conditions promote stronger shift reaction activity, enhancing overall system efficiency. As a result, the combined interpretation of these plots shows clear interdependence among species. Increased hydrogen production is consistently associated with lower methane and carbon monoxide levels and higher carbon dioxide formation. This confirms that optimal SMR performance occurs under conditions that maximize methane conversion and promote the water–gas shift reaction, leading to higher hydrogen yield and improved reactor efficiency. Figure 20 shows the combined mole fractions of the key gases across all experimental samples, providing a comprehensive view of reaction progress and equilibrium behavior.
The comparative results show a clear interdependent relationship among all species across the experimental samples, with hydrogen production strongly linked to methane conversion and secondary reaction pathways. Hydrogen remains the dominant product, exhibiting the highest mole fraction, and its peak value consistently corresponds to lower methane concentrations, confirming effective reforming under favorable conditions. Methane, as the primary reactant, shows an inverse trend with hydrogen, where higher residual methane indicates incomplete conversion due to insufficient temperature or reduced residence time. Water maintains a relatively stable range, reflecting its dual role as both a reactant and a product, while also supporting the water–gas shift reaction. Carbon monoxide appears in low concentrations, indicating partial conversion to carbon dioxide, whereas fluctuations in C O suggest sensitivity to operating conditions such as temperature and steam availability. Carbon dioxide levels increase when C O decreases, demonstrating effective shift reaction activity and enhanced hydrogen generation. Thus, the results confirm that optimal SMR performance occurs when methane conversion is maximized and the water–gas shift reaction is promoted, leading to higher hydrogen yield, lower C O levels, and increased C O 2 formation.

4. Discussion

A comprehensive CFD model of a SMR was successfully developed and validated to investigate hydrogen production, heat transfer, species transport, and reaction kinetics under high-temperature reforming conditions. Numerical convergence was achieved with residuals decreasing and stable species mole fractions, confirming solution accuracy and reliability. The optimized SMR reactor achieved a methane conversion of 94.71%, a hydrogen yield of 3.75 mol H2/mol C H 4 fed, and an overall energy efficiency of 63.35%, demonstrating effective utilization of thermal energy and near-theoretical hydrogen production performance. The product gas contained a high hydrogen mole fraction of approximately 0.585 and very low residual methane, indicating efficient reforming and water–gas shift reactions. CFD contour analyses of total energy, heat flux, reaction rate, enthalpy, and hydrogen distribution revealed strong coupling between heat transfer and chemical reactions. Efficient heat transfer from the reactor walls sustained the endothermic reforming process and promoted uniform hydrogen generation throughout the catalyst bed. The influence of catalyst-bed length on reactor performance was evaluated for both the single-tube and 21-tube reformers. The results show only minor variation in the selected performance parameter as the catalyst-bed length increases from 0.1 to 1.0 m. This behavior indicates that the reforming reactions proceed rapidly under the selected operating conditions, including the high operating temperature and catalyst activity. Consequently, the reaction approaches equilibrium within a relatively short distance, and additional catalyst-bed length provides little further improvement in reactor performance. This observation suggests that extending the catalyst bed beyond the effective reaction zone does not significantly enhance methane conversion or hydrogen production and may instead increase reactor size and cost without substantial performance benefits. Sensitivity analysis demonstrated that catalyst temperature, inlet temperature, and residence time are the most influential parameters affecting hydrogen production. Higher temperatures significantly enhanced methane conversion and hydrogen yield, while increased inlet velocity reduced performance by decreasing reactant residence time. In contrast, pressure, catalyst length, and wall thickness had relatively minor effects within the operating ranges investigated. The multi-tube reactor configuration consistently outperformed the single-tube design due to improved heat transfer, flow distribution, and mass transport characteristics. The results indicate that multi-tube reactors provide greater operational stability and higher hydrogen production efficiency, making them more suitable for large-scale hydrogen generation applications. Integrations of the SMR system with renewable energy were evaluated using a solar PV-PEM electrolyzer-fuel cell configuration. A hybrid system consisting of a 120 kW solar PV array, 50 kW PEM electrolyzer, 6 kW fuel cell, and 6–8 kg hydrogen storage system was identified as a practical and cost-effective solution for supporting continuous operation while reducing grid dependence and carbon emissions. Thus, the study demonstrates that combining optimized SMR reactor design with renewable hydrogen and energy storage technologies can provide an efficient pathway for sustainable hydrogen production, improved energy utilization, and reduced reliance on conventional fossil fuel-based energy systems. To support sustainable hydrogen production, future efforts should concentrate on optimizing the design, operation, and large-scale implementation of steam methane reforming systems. Experimental validation using laboratory-scale and pilot-scale reactors is recommended to verify the CFD predictions of temperature distribution, methane conversion, and hydrogen yield. More detailed catalyst models incorporating catalyst deactivation, carbon deposition, and long-term degradation effects should be developed to improve prediction accuracy under realistic operating conditions.
Future research should investigate the transient behavior of the steam methane reformer during startup, shutdown, and variable load operation, particularly when integrated with intermittent renewable energy sources. Further optimization of reactor geometry, catalyst configuration, and heat-transfer enhancement techniques is also needed to improve methane conversion, hydrogen production efficiency, and overall system performance. Incorporating the water-gas shift (WGS) reaction into the CFD model would provide a more comprehensive representation of reactor chemistry and improve the prediction of hydrogen yield and product gas composition. Future studies should develop integrated water management and operational control strategies that account for seasonal water availability, groundwater withdrawal constraints, monthly water storage scheduling, and hydrogen production demand to ensure sustainable long-term operation. In addition, long-term degradation models for PEM electrolyzers and fuel cells should be incorporated to evaluate component aging, reversible voltage recovery, and performance degradation under repeated start-stop and cyclic operating conditions. Advanced energy management strategies based on artificial intelligence, which include reinforcement learning and state-of-health aware control, should be investigated to optimize the operation of integrated PV/SMR/PEM hydrogen systems under dynamic operating conditions. These approaches have the potential to improve system efficiency, reliability, and operational flexibility while extending component lifetime. Future work should also include comprehensive techno-economic and environmental assessments of the proposed hybrid hydrogen production system. Such analyses should evaluate the Levelized Cost of Hydrogen (LCOH), Net Present Value (NPV), CAPEX, OPEX, lifecycle carbon emissions, and sensitivity to energy prices and renewable resource variability. Finally, experimental validation, pilot-scale demonstrations, and scale-up studies are needed to verify the numerical predictions and assess the commercial feasibility of large-scale hydrogen production systems integrated with solar PV, wind energy, hydrogen storage, carbon capture, utilization and storage, and fuel-cell technologies.

Author Contributions

Conceptualization, H.-G.L.; methodology, H.-G.L.; software, B.R.; validation, H.-G.L.; formal analysis, B.R.; investigation, B.R. and J.T.; resources, J.T.; data curation, B.R. and J.T.; writing—original draft preparation, H.-G.L.; writing—review and editing, H.-G.L.; visualization, B.R. and J.T.; supervision, H.-G.L.; project administration, H.-G.L.; funding acquisition, H.-G.L. All authors have read and agreed to the published version of the manuscript.

Funding

This research was supported by the Tarleton State University Graduate Studies Clean Energy Initiative.

Data Availability Statement

All data generated or analyzed during this study are included in this published article.

Acknowledgments

The authors have reviewed and edited the output and take full responsibility for the content of this publication. The authors used OpenAI’s ChatGPT-5.5 in order to improve language and readability. After using this tool/service, the authors reviewed and edited the content as needed and took full responsibility for the content of the publication.

Conflicts of Interest

The authors declare no conflicts of interest.

Abbreviations

ASRArea-Specific Resistance
HXHeat Exchanger
CFDComputational Fluid Dynamics
DOEDesign of Experiments
GDLGas Diffusion Layer
HRTHydraulic Retention Time
LHVLower Heating Value
MECMicrobial Electrolysis Cell
PEMProton Exchange Membrane
PLCProgrammable Logic Controller
PSAPressure Swing Adsorption
PVPhotovoltaic
RFRadio Frequency
S/CSteam-to-Carbon Ratio
SMRSteam Methane Reforming

Nomenclature

a 0 Atmospheric transmittance coefficient accounting for beam radiation unaffected by air mass
a 1 Atmospheric transmittance coefficient accounting with attenuation through the atmosphere
a 0 * Standard-atmosphere value of a 0 for 23 km visibility
a 1 * Standard-atmosphere value of a 1 for 23 km visibility
k Atmospheric extinction coefficient
k * Standard-atmosphere value of the extinction coefficient for 23 km visibility
τ b Atmospheric transmittance for direct-beam solar radiation
θ Solar incidence angle between the beam radiation and the surface normal
θ z Solar zenith angle between the solar beam and the vertical direction
α Solar altitude angle (°)
β Surface tilt angle measured from the horizontal plane
γ Surface azimuth angle (°)
γ s Solar azimuth angle (°)
α a Anodic charge-transfer coefficient
α c Cathodic charge-transfer coefficient
C H 2 , m Hydrogen concentration at the cathode reaction interface ( m o l m 3 )
C H 2 , m , 0 Reference or bulk hydrogen concentration at the cathode ( m o l m 3 )
C O 2 , m Oxygen concentration at the anode reaction interface ( m o l m 3 )
C O 2 , m , 0 Reference or bulk oxygen concentration at the anode ( m o l m 3 )
c p , c Specific heat capacity of the coolant ( J K g · K )
Δ G Gibbs free-energy change in the electrolysis reaction ( J m o l )
Δ H Enthalpy change in the electrolysis reaction ( J m o l )
Δ S Entropy change in the electrolysis reaction ( J m o l · K )
Δ T L M T D Logarithmic mean temperature difference (K)
Q ˙ a u x Heat generated by auxiliary components (W)
Q ˙ g e n Heat generated within the electrolyzer stack (W)
Q ˙ H 2 , L H V Chemical-energy rate of hydrogen based on its lower heating value (W)
Q ˙ H X Heat-removal rate required from the heat exchanger (W)
Q ˙ l o s s , a m b i e n t Heat loss from the electrolyzer system to the surroundings (W)
R Universal gas constant 8.314 ( J m o l · K )
R e l e c t r o n Electronic resistance of the cell or stack components ( Ω )
R i o n Ionic resistance of the membrane and electrolyte path ( Ω )
δ m PEM thickness ( u m )
d p Catalyst particle diameter ( m )
J i Diffusive flux of species i ( k g m 2 · K )
k e f f Effective thermal conductivity of porous catalyst ( W m · K )
r i Langmuir–Hinshelwood reaction rate ( m o l m 3 · s )
S h Volumetric heat source/sink ( W m 3 )
S m Momentum source term ( N m 3 )
U Superficial gas velocity ( m s )
ε Catalyst bed porosity
μ Dynamic viscosity ( P a · s )
ρ Fluid density ( k g m 3 )
σ Stefan–Boltzmann constant 5.67 10 8 ( W m 2 · K 4 )

References

  1. Nebey, A.H. Recent advancements in hydrogen production from renewable energy sources. Energy Convers. Manag. X 2026, 30, 101717. [Google Scholar] [CrossRef] [Scilit]
  2. Konvalov, D.; Adams, T.A. Hydrogen power development: A comparative review of national strategies and the role of energy in scaling green hydrogen. Renew. Sustain. Energy Rev. 2026, 226, 116378. [Google Scholar] [CrossRef] [Scilit]
  3. Liu, W.; Zuo, H.; Wang, J.; Xue, Q.; Ren, B.; Yang, F. The production and application of hydrogen in steel industry. Int. J. Hydrogen Energy 2021, 46, 10548–10569. [Google Scholar] [CrossRef] [Scilit]
  4. Lee, H.; Dulany, Z. Biogas and Hydrogen Production from Waste Biomass via Dark Fermentation Evaluating VFAs, COD, and HRT for Process Optimization. Biomass 2025, 5, 57. [Google Scholar] [CrossRef] [Scilit]
  5. Lee, H.G.; Rice, B. Design and CFD Analysis of a Compact Anaerobic Digestion Bioreactor Evaluating Agitation Designs and Configurations for Energy Efficiency. Energies 2025, 18, 5085. [Google Scholar] [CrossRef] [Scilit]
  6. Zhou, H.; Chen, W.; Meng, K.; Deng, Q.; Zhang, N.; Chen, B. A review on proton exchange membrane water electrolyzer: Advances in heat and mass transport. Renew. Sustain. Energy Rev. 2025, 223, 116015. [Google Scholar] [CrossRef] [Scilit]
  7. Nasser, M.; Megahed, T.F.; Ookawara, S.; Hassan, H. A review of water electrolysis–based systems for hydrogen production using hybrid/solar/wind energy systems. Environ. Sci. Pollut. Res. 2022, 29, 86994–87018. [Google Scholar] [CrossRef] [Scilit] [PubMed]
  8. Dubouis, N.; Aymé-Perrot, D.; Dégoulange, D.; Grimaud, A.; Girault, H.H. Alkaline electrolyzers: Powering industries and overcoming fundamental challenges. Joule 2024, 8, 883–898. [Google Scholar] [CrossRef] [Scilit]
  9. Tuysuz, H. Alkaline Water Electrolysis for Green Hydrogen Production. Acc. Chem. Res. 2024, 57, 558–567. [Google Scholar] [CrossRef] [Scilit] [PubMed]
  10. Zhang, B.; Fan, L.; Ambre, R.B.; Liu, T.; Meng, Q. Advancing Proton Exchange Membrane Electrolyzers with Molecular Catalysts. Joule 2020, 4, 1408–1444. [Google Scholar] [CrossRef] [Scilit]
  11. Kumar, S.; Himabindu, V. Hydrogen production by PEM water electrolysis—A review. Mater. Sci. Energy Technol. 2019, 2, 442–454. [Google Scholar] [CrossRef] [Scilit]
  12. Ayers, K. High efficiency PEM water electrolysis: Enabled by advanced catalysts, membranes, and processes. Curr. Opin. Chem. Eng. 2021, 33, 100719. [Google Scholar] [CrossRef] [Scilit]
  13. Lee, H.-G.; Herescu, A.; Gregg, K.; Harmon, T. Development of PEM Fuel Cell Performance Through Simulations and Gas Diffusion Layer Assessment, Considering Degradation and Quality Control. In ASME 2025 International Mechanical Engineering Congress and Exposition; IMECE2025-167031, V006T09A056; ASME: New York, NY, USA, 2025; 11p. [Google Scholar] [CrossRef] [Scilit]
  14. Lee, H.; Messer, D. Mass energy transfer effects of PEM fuel cell flow channels with correlation between geometric parameters and operating conditions. Int. J. Power Energy Convers. 2024, 15, 220–256. [Google Scholar] [CrossRef] [Scilit]
  15. Rimon, S.; Mourshed, M.; Kibria, M. Proton exchange membrane fuel cells: Advances in materials development, performance optimization, and future outlook. Energy Convers. Manag. 2025, 27, 101102. [Google Scholar] [CrossRef] [Scilit]
  16. Lamb, K.; Mole, R.A.; Yu, D.; de Marco, R.; Bartlett, J.R.; Windsor, S.; Jiang, S.P.; Zhang, J.; Peterson, V.K. Proton dynamics in phosphotungstic acid impregnated mesoporous silica proton exchange membrane materials. Green Energy Environ. 2017, 2, 294–301. [Google Scholar] [CrossRef] [Scilit]
  17. Sezer, N.; Bayhan, S.; Fesli, U.; Sanfiippo, A. A comprehensive review of the state-of-the-art of proton exchange membrane water electrolysis. Mater. Sci. Energy Technol. 2025, 8, 44–65. [Google Scholar] [CrossRef] [Scilit]
  18. Park, J.E.; Kim, J.; Han, J.; Kim, K.; Park, S.B.; Kim, S.; Park, H.S.; Cho, Y.H.; Lee, J.C.; Sung, Y.-E. High-performance proton-exchange membrane water electrolysis using a sulfonated poly (arylene ether sulfone) membrane and ionomer. J. Membr. Sci. 2021, 620, 118871. [Google Scholar] [CrossRef] [Scilit]
  19. Athanasaki, G.; Jayakumar, A.; Kannan, A.M. Gas diffusion layers for PEM fuel cells: Materials, properties and manufacturing—A review. Int. J. Hydrogen Energy 2023, 48, 2294–2313. [Google Scholar] [CrossRef] [Scilit]
  20. Tang, X.; Yang, M.; Shi, L.; Hou, Z.; Xu, S. Adaptive state-of-health temperature sensitivity characteristics for durability improvement of PEM fuel cells. Chem. Eng. J. 2024, 491, 151951. [Google Scholar] [CrossRef] [Scilit]
  21. Javed, A.; Wolf, N.L.; Meyer, F.; Treutlein, L.; Kungl, H.; Karl, A.; Jodat, E.; Eichel, R.-A. Exploring the state-of-operation of proton exchange membrane electrolyzers. Int. J. Hydrogen Energy 2025, 98, 280–294. [Google Scholar] [CrossRef] [Scilit]
  22. Szablowski, L.; Wojcik, M.; Dybinski, O. Review of steam methane reforming as a method of hydrogen production. Energy 2025, 316, 134540. [Google Scholar] [CrossRef] [Scilit]
  23. Sanna, A.; Openshaw Oghotomo, P.; Bagnato, G. Steam reforming of methane: State of the art and novel technologies. React. Chem. Eng. 2025, 10, 1963–1977. [Google Scholar] [CrossRef] [Scilit]
  24. Tuna, C.E.; Silveira, J.L.; da Silva, M.E.; Boloy, R.M.; Braga, L.B.; Pérez, N.P. Biogas steam reformer for hydrogen production: Evaluation of the reformer prototype and catalysts. Int. J. Hydrogen Energy 2018, 43, 2108–2120. [Google Scholar] [CrossRef] [Scilit]
  25. Sengupta, M.; Lopez, A.; Habte, A.; Maclaurin, G.; Shelby, J. The National Solar Radiation Data Base (NSRDB). Renew. Sustain. Energy Rev. 2018, 89, 51–60. [Google Scholar] [CrossRef] [Scilit]
  26. Carmo, M.; Fritz, D.L.; Mergel, J.; Stolten, D. A comprehensive review on PEM water electrolysis. Int. J. Hydrogen Energy 2013, 38, 4901–4934. [Google Scholar] [CrossRef] [Scilit]
  27. Lao, L.; Aguirre, A.; Tran, A.; Wu, Z.; Durand, H.; Christofides, P.D. CFD modeling and control of a steam methane reforming reactor. Chem. Eng. Sci. 2016, 148, 78–92. [Google Scholar] [CrossRef] [Scilit]
  28. Iyer, M.; Norcio, L.P.; Kugler, E.; Dadyburjor, D.B. Kinetic Modeling for Methane Reforming with Carbon Dioxide over a Mixed-Metal Carbide Catalyst. Ind. Eng. Chem. Res. 2003, 42, 2712–2721. [Google Scholar] [CrossRef] [Scilit]
  29. Niesner, J.; Jecha, D.; Stehlik, P. Biogas Upgrading Technologies: State of Art Review in European Region. Chem. Eng. Trans. 2013, 35, 517–522. [Google Scholar] [CrossRef] [Scilit]
  30. Singh, D.; Sirini, P.; Lombardi, L. Green Hydrogen Production from Biogas or Landfill Gas by Steam Reforming or Dry Reforming: Specific Production and Energy Requirements. Energies 2025, 18, 2631. [Google Scholar] [CrossRef] [Scilit]
  31. Ahmed, S.; Lee, S.H.D.; Ferrandon, M.S. Catalytic steam reforming of biogas—Effects of feed composition and operating conditions. Int. J. Hydrogen Energy 2015, 40, 1005–1015. [Google Scholar] [CrossRef] [Scilit]
  32. Kumar, R.; Kumar, A. Steam reforming of methane and biogas: Thermodynamic and kinetic review for hydrogen production. Environ. Prog. Sustain. Energy 2026, 45, e70345. [Google Scholar] [CrossRef] [Scilit]
  33. Ngo, S.I.; Nguyen, D.D.; Lim, Y.-I.; Kim, W.; Seo, D.; Yoon, W.-L. Computational fluid dynamics model on a compact type steam methane reformer for highly-efficient hydrogen production from natural gas. Comput. Aided Chem. Eng. 2018, 44, 307–3120. [Google Scholar] [CrossRef] [Scilit]
  34. El-Bousiffi, M.A.; Gunn, D.J. A dynamic study of steam-methane reforming. Int. J. Heat Mass Transf. 2007, 50, 723–733. [Google Scholar] [CrossRef] [Scilit]
  35. Karibe, H.; Sair, S.; Faik, A.; Ousaleh, H.A. Electrified steam methane reforming: A review of heating technologies, challenges, and prospects. Int. J. Hydrogen Energy 2025, 133, 200–213. [Google Scholar] [CrossRef] [Scilit]
  36. Lee, H.G. Multilevel Optimal Design of a Solar PV Array System using Game Theory Approach. In ASME Power Conference, 13th International Conference on Energy Sustainability American Society Mechanical Engineers; POWER2019-1840, V001T06A006; ASME: New York, NY, USA, 2019. [Google Scholar] [CrossRef] [Scilit]
  37. Messer, D.; Lee, H.G. Study on the Capacity of a Hybrid Solar PV/Wind Turbine System Using Small-Scale Prototype Application for Dairy Farm Power Demand in North Texas. Int. J. Comput. Sci. Eng. 2024, 27, 302–313. [Google Scholar] [CrossRef] [Scilit]
  38. Rao, S.S.; Lee, H.G.; Hu, Y. Optimal design of compound parabolic concentrator solar collector system. J. Mech. Des. 2014, 136, 091402. [Google Scholar] [CrossRef] [Scilit]
  39. Lee, H.G. Optimal Design of Solar Photovoltaic Systems; University of Miami: Coral Gables, FL, USA, 2008. [Google Scholar]
  40. Molina, P.; Rios, C.; Leon, C.; Brey, J.J. Heat management system design and implementation in a PEM water electrolyser. Int. J. Hydrogen Energy 2025, 107, 656–665. [Google Scholar] [CrossRef] [Scilit]
  41. Awasthi, A.; Scott, K.; Basu, S. Dynamic modeling and simulation of a proton exchange membrane electrolyzer for hydrogen production. Int. J. Hydrogen Energy 2011, 36, 14779–14786. [Google Scholar] [CrossRef] [Scilit]
  42. Simões, S.G.; Catarino, J.; Picado, A.; Lopes, T.F.; di Berardino, S.; Amorim, F.; Gírio, F.; Rangel, C.M.; Ponce de Leão, T. Water availability and water usage solutions for electrolysis in hydrogen production. J. Clean. Prod. 2021, 315, 128124. [Google Scholar] [CrossRef] [Scilit]
  43. Terlouw, T.; Bauer, C.; McKenna, R.; Mazzotti, M. Large-scale hydrogen production via water electrolysis: A techno-economic and environmental assessment. Energy Environ. Sci. 2022, 15, 3583–3602. [Google Scholar] [CrossRef] [Scilit]
  44. U.S. Department of Commerce. Summary of Monthly Normals; National Centers for Environmental Information: Asheville, NC, USA. Available online: https://www.ncei.noaa.gov/access/services/data/v1?dataset=normals-monthly-1991-2020&endDate=9996-12-31&format=pdf&startDate=0001-01-01&stations=USC00411578&utm_source=chatgpt.com (accessed on 13 April 2026).
  45. Hou, K.; Hughes, R. Methane steam reforming, methanation and water-gas shift: I. Intrinsic kinetics. AIChE J. 1989, 35, 88–96. [Google Scholar] [CrossRef] [Scilit]
  46. Tran, A.; Aguirre, A.; Durand, H.; Crose, M.; Christofides, P. CFD modeling of a industrial-scale steam methane reforming furnace. Chem. Eng. Sci. 2017, 171, 576–598. [Google Scholar] [CrossRef] [Scilit]
  47. Herraiz, L.; Lucquiaud, M.; Chalmers, H.; Gibbins, J. Sequential Combustion in Steam Methane Reformers for Hydrogen and Power Production With CCUS in Decarbonized Industrial Clusters. Front. Energy Res. 2020, 8, 180. [Google Scholar] [CrossRef] [Scilit]
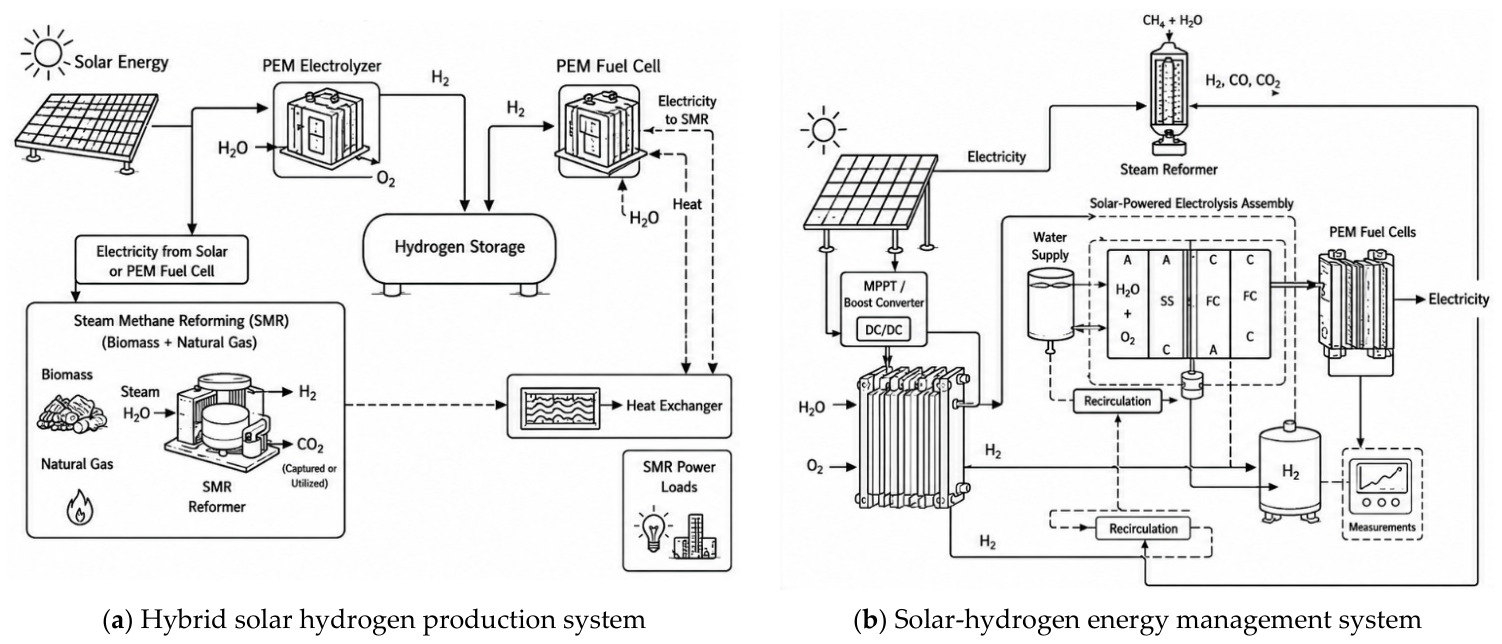
Figure 1. Integrated solar-hydrogen energy management system with PEM electrolysis, steam methane reforming, and PEM fuel cell.
Hydrogen 07 00110 g001
Figure 2. Calculation of solar radiation on tilted surfaces considering solar geometry and climate-based atmospheric corrections.
Hydrogen 07 00110 g002
Figure 3. Configuration of a single PV collector to collect incident solar energy.
Hydrogen 07 00110 g003
Figure 4. Seasonal variation in monthly solar irradiation and solar radiation resources in Stephenville, Texas.
Hydrogen 07 00110 g004
Figure 5. Solar PV array output with multiple inverter-connected subarrays.
Hydrogen 07 00110 g005
Figure 6. Water supply and water demand components for Erath County, Texas.
Hydrogen 07 00110 g006
Figure 7. Computational mesh of the steam methane reformer tube bundle for CFD analysis.
Hydrogen 07 00110 g007
Figure 8. Analysis of solar irradiation and daily PV energy generation in Stephenville, Texas.
Hydrogen 07 00110 g008
Figure 9. 110 kW PV energy production: seasonal and daily performance analysis of an integrated PV-SMR-PEM system performance for hydrogen production and fuel cell applications.
Hydrogen 07 00110 g009
Figure 10. Results for 50 kW PEM electrolyzer: Power, thermal efficiency, hydrogen production, and consumption.
Hydrogen 07 00110 g010
Figure 11. Results for 6 kW PEM fuel cell: electrolyzer, fuel cell power, hydrogen tank, and hydrogen production and consumption.
Hydrogen 07 00110 g011
Figure 12. PEM electrolyzer and fuel cell electricity in Stephenville, Texas.
Hydrogen 07 00110 g012
Figure 13. PV power generation characteristics and PEM electrolyzer operation in Stephenville Texas.
Hydrogen 07 00110 g013
Figure 14. Numerical convergence assessment of residuals and species mole fractions for catalytic reforming simulations.
Hydrogen 07 00110 g014
Figure 15. CFD contours of the single-tube steam methane reformer showing static enthalpy, turbulence kinetic energy, temperature, velocity, pressure, and viscosity.
Hydrogen 07 00110 g015
Figure 16. CFD distributions of static enthalpy, turbulence kinetic energy, temperature, specific dissipation rate, velocity, and wall shear stress in the multi-tube steam methane reforming reactor.
Hydrogen 07 00110 g016
Figure 17. CFD distributions of H 2 ,   C H 4 ,   C O 2 ,   C O , and H 2 O mass fractions, and gas density in the multi-tube steam methane reforming reactor, illustrating species conversion, reaction progression, and hydrogen production performance.
Hydrogen 07 00110 g017
Figure 18. Thermochemical and geometric parameters of an SMR reactor for hydrogen production.
Hydrogen 07 00110 g018
Figure 19. Variation of H 2 ,   C H 4 ,   H 2 O ,   C O , and C O 2 in SMR hydrogen production.
Hydrogen 07 00110 g019
Figure 20. Comparative production of H 2 ,   C H 4 ,   H 2 O , C O , and C O 2 in SMR reactors.
Hydrogen 07 00110 g020
Table 1. Mesh information and quality for the SMR CFD model.
ItemsParametersValues
Mesh SizeNumber of Cells13,096,041
Number of Faces39,714,837
Number of Nodes13,529,340
Mesh QualityCell TypeMixed Cell
Minimum Orthogonal Quality0.5216
Maximum Aspect Ratio7.4419
Table 2. Annual performance of solar PV, hydrogen and fuel cell system.
PV Capacity (kW)PV Energy (kWh)Day Surplus (kWh)H2 Produced (kg)Battery Supply Tonight (kWh)FC Supply Tonight (kWh)H2 by Fuel Cell (kg)
100179,900−1540.7432.4910,1377324.1439.49
110197,89016,449475.4712,7348040.4482.47
120215,88034,439413.0513,1907000.2420.05
Table 3. Thermal parameters.
VariablesTemperatureDescriptions
Pipe1050 K
  • Reactor pipe wall temp
  • Hot reactor wall, typical for endothermic reforming
Catalyst1012.3 K
  • Catalyst bed temperature
  • High catalytic temperature to support CH4 reforming
Exit gas925.9 K
  • Gas out temperature
  • Average gas temperature at outlet
Table 4. Flow and heat transfer.
VariablesValueDescriptions
Outlet mass flow rate−0.0012158 kg/s
  • Flow direction for outflow
Catalyst sensible heat transfer−2347.78 W
  • Heat absorbed (endothermic reaction
Catalyst total heat transfer 9681.30 W
  • Net heat input to sustain reaction
Table 5. Pressure and composition.
VariablesValueDescriptions
Pressure82,649.23 Pa
  • Slight below atmospheric
C O 2 mole fraction 0.1392566
  • Formed via water-gas shift
C H 4 mole fraction0.00825249
  • Low residual methane
C O mole fraction0.00838294
  • Product of reforming
H 2 O mole fraction0.259034
  • Steam excess
H 2 mole fraction0.585074
  • Dominant product gas
Table 6. Design of experiments matrix for sensitivity analysis of SMR hydrogen production parameters.
NoCatalyst Temperature
(K)
Inlet Temperature (K)Pressure
(MPa)
Velocity
(m/s)
Catalyst Length
(m)
Porosity (%)Wall Thickness
(m)
Pipe Diameter
(m)
112009001.50.10.5300.0030.025
212009001.50.10.5300.0030.045
312009001.50.10.5500.0030.025
412009001.50.10.5500.0030.045
512009001.50.50.5300.0030.025
612009001.50.50.5300.0030.045
712009001.50.50.5500.0030.025
812009001.50.50.5500.0030.045
9130010001.50.10.5300.0030.025
10130010001.50.10.5300.0030.045
11130010001.50.10.5500.0030.025
12130010001.50.10.5500.0030.045
13130010001.50.50.5300.0030.025
14130010001.50.50.5300.0030.045
15130010001.50.50.5500.0030.025
16130010001.50.50.5500.0030.045
1712259251.50.30.5400.0030.035
1812759751.50.30.5400.0030.035
1912509501.50.20.5400.0030.035
2012509501.50.40.5400.0030.035
2112509501.50.30.5350.0030.035
2212509501.50.30.5450.0030.035
2312509501.50.30.5400.0030.03
2412509501.50.30.5400.0030.04
2512509501.50.30.5400.0030.035
2612509501.50.30.5400.0030.035
2712509501.50.30.5400.0030.035
Disclaimer/Publisher’s Note: The statements, opinions and data contained in all publications are solely those of the individual author(s) and contributor(s) and not of MDPI and/or the editor(s). MDPI and/or the editor(s) disclaim responsibility for any injury to people or property resulting from any ideas, methods, instructions or products referred to in the content.