Article

Techno-Economic Evaluation of a Floating Photovoltaic-Powered Green Hydrogen for FCEV for Different Köppen Climates

Faculty of Environment, Science and Economy (ESE), Renewable Energy, Electric and Electronic Engineering, University of Exeter, Penryn TR10 9FE, UK
*
Author to whom correspondence should be addressed.
Hydrogen 2025, 6(3), 73; https://doi.org/10.3390/hydrogen6030073
Submission received: 30 July 2025 / Revised: 12 September 2025 / Accepted: 13 September 2025 / Published: 22 September 2025

Abstract

The escalating global demand for electricity, coupled with environmental concerns and economic considerations, has driven the exploration of alternative energy sources, creating competition for land with other sectors. A comprehensive analysis of a 10 MW floating photovoltaic (FPV) system deployed across different Köppen climate zones along with techno-economic analysis involves evaluating technical efficiency and economic viability. Technical parameters are assessed using PVsyst simulation and HOMER Pro. While, economic analysis considers return on investment, net present value, internal rate of return, and payback period. Results indicate that temperate and dry zones exhibit significant electricity generation potential from an FPV. The study outlines the payback period with the lowest being 5.7 years, emphasizing the system’s environmental benefits by reducing water loss in the form of evaporation. The system is further integrated with hydrogen generation while estimating the number of cars that can be refueled at each location, with the highest amount of hydrogen production being 292,817 kg/year, refueling more than 100 cars per day. This leads to an LCOH of GBP 2.84/kg for 20 years. Additionally, the comparison across different Koppen climate zones suggests that, even with the high soiling losses, dry climate has substantial potential; producing up to 18,829,587 kWh/year of electricity and 292,817 kg/year of hydrogen. However, factors such as high inflation can reduce the return on investment to as low as 13.8%. The integration of FPV with hydropower plants is suggested for enhanced power generation, reaffirming its potential to contribute to a sustainable energy future while addressing the UN’s SDG7, SDG9, SDG13, and SDG15.

1. Introduction

The transport system has immense significance and has played a critical role in shaping the settlement pattern of human civilization; thus, it can be inferred that its infrastructure transforms the landscape and regional economy [1], especially due to the fact that almost one-third of all energy is consumed by the transport sector, particularly in countries like the United States, resulting in huge emissions influencing air quality [2]. The global transport sector emits a significant amount of environmentally harmful gases, accounting for one-quarter of greenhouse gas emissions, which are hazardous to humans and the environment, as 95% of the world’s transport still uses fossil fuels. To achieve both, a biennial environment which uses clean transportation is essential [3]. Both battery electric vehicles (BEVs) and hydrogen-powered fuel cell electric vehicles (FCEVs) are the two with zero tailpipe emissions, representing promising alternatives to conventional fossil fuel-powered vehicles [4]. Hydrogen-powered fuel cell electric vehicles (FCEVs) offer several advantages over battery electric vehicles, such as a longer driving range of more than 300 miles on a single tank of hydrogen, comparable to traditional gasoline vehicles, a quick refueling time similar to conventional vehicles [5], and a low degradation rate. However, a hydrogen-powered fuel cell will only be considered green if hydrogen is produced through water electrolysis powered by renewable energy, which can contribute to the transition towards sustainable energy [6]. Electrolyzers just need water and electricity to produce hydrogen, and their operating efficiency varies between 70% to 80% during operation [7]. Among electrolyzers, Proton Exchange Membrane (PEM) electrolyzers are gaining popularity due to their simplicity and efficiency, along with compact design, their ability to achieve high-purity hydrogen, and their rapid response to fluctuating power inputs [8,9,10]. They have the potential to integrate with renewable energy sources such as solar and wind power, and their fast response to an intermittent energy supply and operational flexibility make them well suited for coupling with variable renewables, enabling sustainable and scalable green hydrogen production [11,12].
Simultaneously, solar photovoltaic technology has evolved through different generations, and currently, three generations of solar PV systems exist: the first, second, and third. The first generation consists of monocrystalline and multicrystalline. In the second generation, thin films are very popular and first- and second-generation systems dominate the market. The bifacial solar module is a type of solar module where electricity is converted from photons collected from incident and albedo radiation reaching both sides of the module. Though bifacial solar cells have been known since the 1960s, it was only in 1981 that the first commercial bifacial photovoltaic system was developed by ISOFOTON, in a Spanish academic spin-off [13]. The cell working temperature has decreased, and the maximum power output has increased due to the absence of aluminum back metallization, which results in the reduction [14]. Bifacial solar cells have applications in many areas, including ground-mounted PV, BIPV, Agrivoltatics, and floating photovoltaics (FPV) [15]. With some investigation, it can be concluded that covering 1% of the globally reserved areas can result in a potential capacity of 404 GWp electricity production [16]. Some studies focused on the direct comparison between the ground-mounted PV and the floating PV [17]. The implications of bifacial technology have not only been studied for FPV but also for BIPV, enabling electricity production from the weakest envelope of a building [18]. Another interesting system is agrivoltaics, where bifacial modules take advantage of the height between the ground and the panel [19]. Research found that with bifacial modules, the NPV of such systems can increase to as high as 80,713.73 in the UK [20], whereas another study comparing bifacial with monofacial for tracking and fixed axis found that the tracking bifacial is able to have as low LCOE as GBP 0.048/kWh for the UK in agrivoltaics [21]. Thus, the use of bifacial technology in different applications has enabled new opportunities with surplus electricity production. It has been estimated that if bifacial photovoltaics are used for floating photovoltaics, then they can convert up to 55% more sunlight as compared to monofacial photovoltaics [15]. In an experiment carried out, it was observed that the cell efficiency of the bifacial is 22.38%, while the fill factor is 82.58%. The open circuit voltage was estimated to be 677.4 V, and the short circuit current was 10.46 A [22]. Due to this, bifacial solar cells are used for this simulation while addressing various UN sustainability goals, including SDG 7 (ensuring affordable, reliable, and sustainable clean energy), SDG 9 (fostering innovation), SDG 13 (addressing climate change by offsetting CO2), and SDG 15 (protecting land, forest, and ecosystems by eliminating the direct competition with the energy sector) [23,24,25].
The traditional systems face challenges, particularly in terms of negative temperature coefficients, resulting in compromised efficiency and huge land requirements for installation. To abate these issues, PV can now be installed on water bodies and has emerged as a promising solution known as water-based PV. A water-based PV system includes FPV (onshore and offshore), canal top PV, and underwater [26]. Among these, FPV systems are gaining significant popularity because FPV systems benefit from the cooling effect of surrounding water bodies, which can increase efficiency by 5–15% compared to land-based systems [27]. The panels cover the water surface, reducing evaporation and conserving about 42% of water resources [13], they are exposed to solar radiation directly (unlike underwater), and not exposed to harsh environments such as saline ambient water and heavy waves, which can damage the structure of the PV [26]. Studies have indicated that there is a reduction of up to 70% in water evaporation depending on the location and system design, while some research claims this to be as high as 50–90%, especially in the arid region, with a potential of saving of up to 1.5 million gallons of water annually with 1 MW system [28]. In Greece, it was found that covering 10–30% of the surface of 128 reservoirs with FPV can save 71.55 mil.m3 to 214.65 mil.m3 of water lost annually due to evaporation and improve the water quality [29]. Thus, the FPV system installed directly on the water surface (having contact with water bodies) outperforms a canal top as they are surrounded by water. This proximity provides additional cooling effect from the water body, which enhances energy efficiency, an advantage not present for canal top PVs due to the distance between the water and the photovoltaics [30]. Incorporating bifacial solar panels in FPV systems can further enhance their benefits by generating electricity from both the front and back sides, potentially increasing energy production as water has a static reflection coefficient (albedo) of 5–7% which can contribute to additional electricity generation from the rear side of the bifacial, whereas an offshore water body has less reflection [31]. González et al. explored the enhanced electricity production and evaporation reduction, with a water saving reduction of up to 2066.15 mm/year in a dry climate and a median evaporation saving of up to 1085.24 mm/year which is due to the shading provided by the photovoltaics over the water body resulting in reduced direct exposure of sun and wind. Exploring the climate-driven performance of floating photovoltaic systems [32], it has been seen that the degradation rate of PV modules is significant in warm and humid climates, as high humidity is associated with corrosion and can also lead to interconnection failures and cracks [33]. At the same time, humidity can also lead to a reduction in the solar irradiance reaching the panel, as the available water vapor particles cause scattering of the solar light, thus resulting in reduced electricity generation [34,35,36]. Interestingly, in a study in Malaysia, the presence of wind enhanced PV output by lowering the temperature increase due to heat dissipation during the operations, especially for FPV, acting as a cooling agent, though high humidity continued to be the limiting factor [37]. Humidity and wind speed are also playing a significant role in influencing the soiling that adheres to PV, as high wind speeds can result in a 10.9% reduction in dust accumulation [38]. Temporary shading due to the presence of clouds in some regions is associated with reduced electricity production due to the reduction in the amount of direct irradiance reaching the PV, along with cloud movement, with experimental studies showing a reduced impact factor related to power output of 0.86 due to 75% shading [39,40,41].
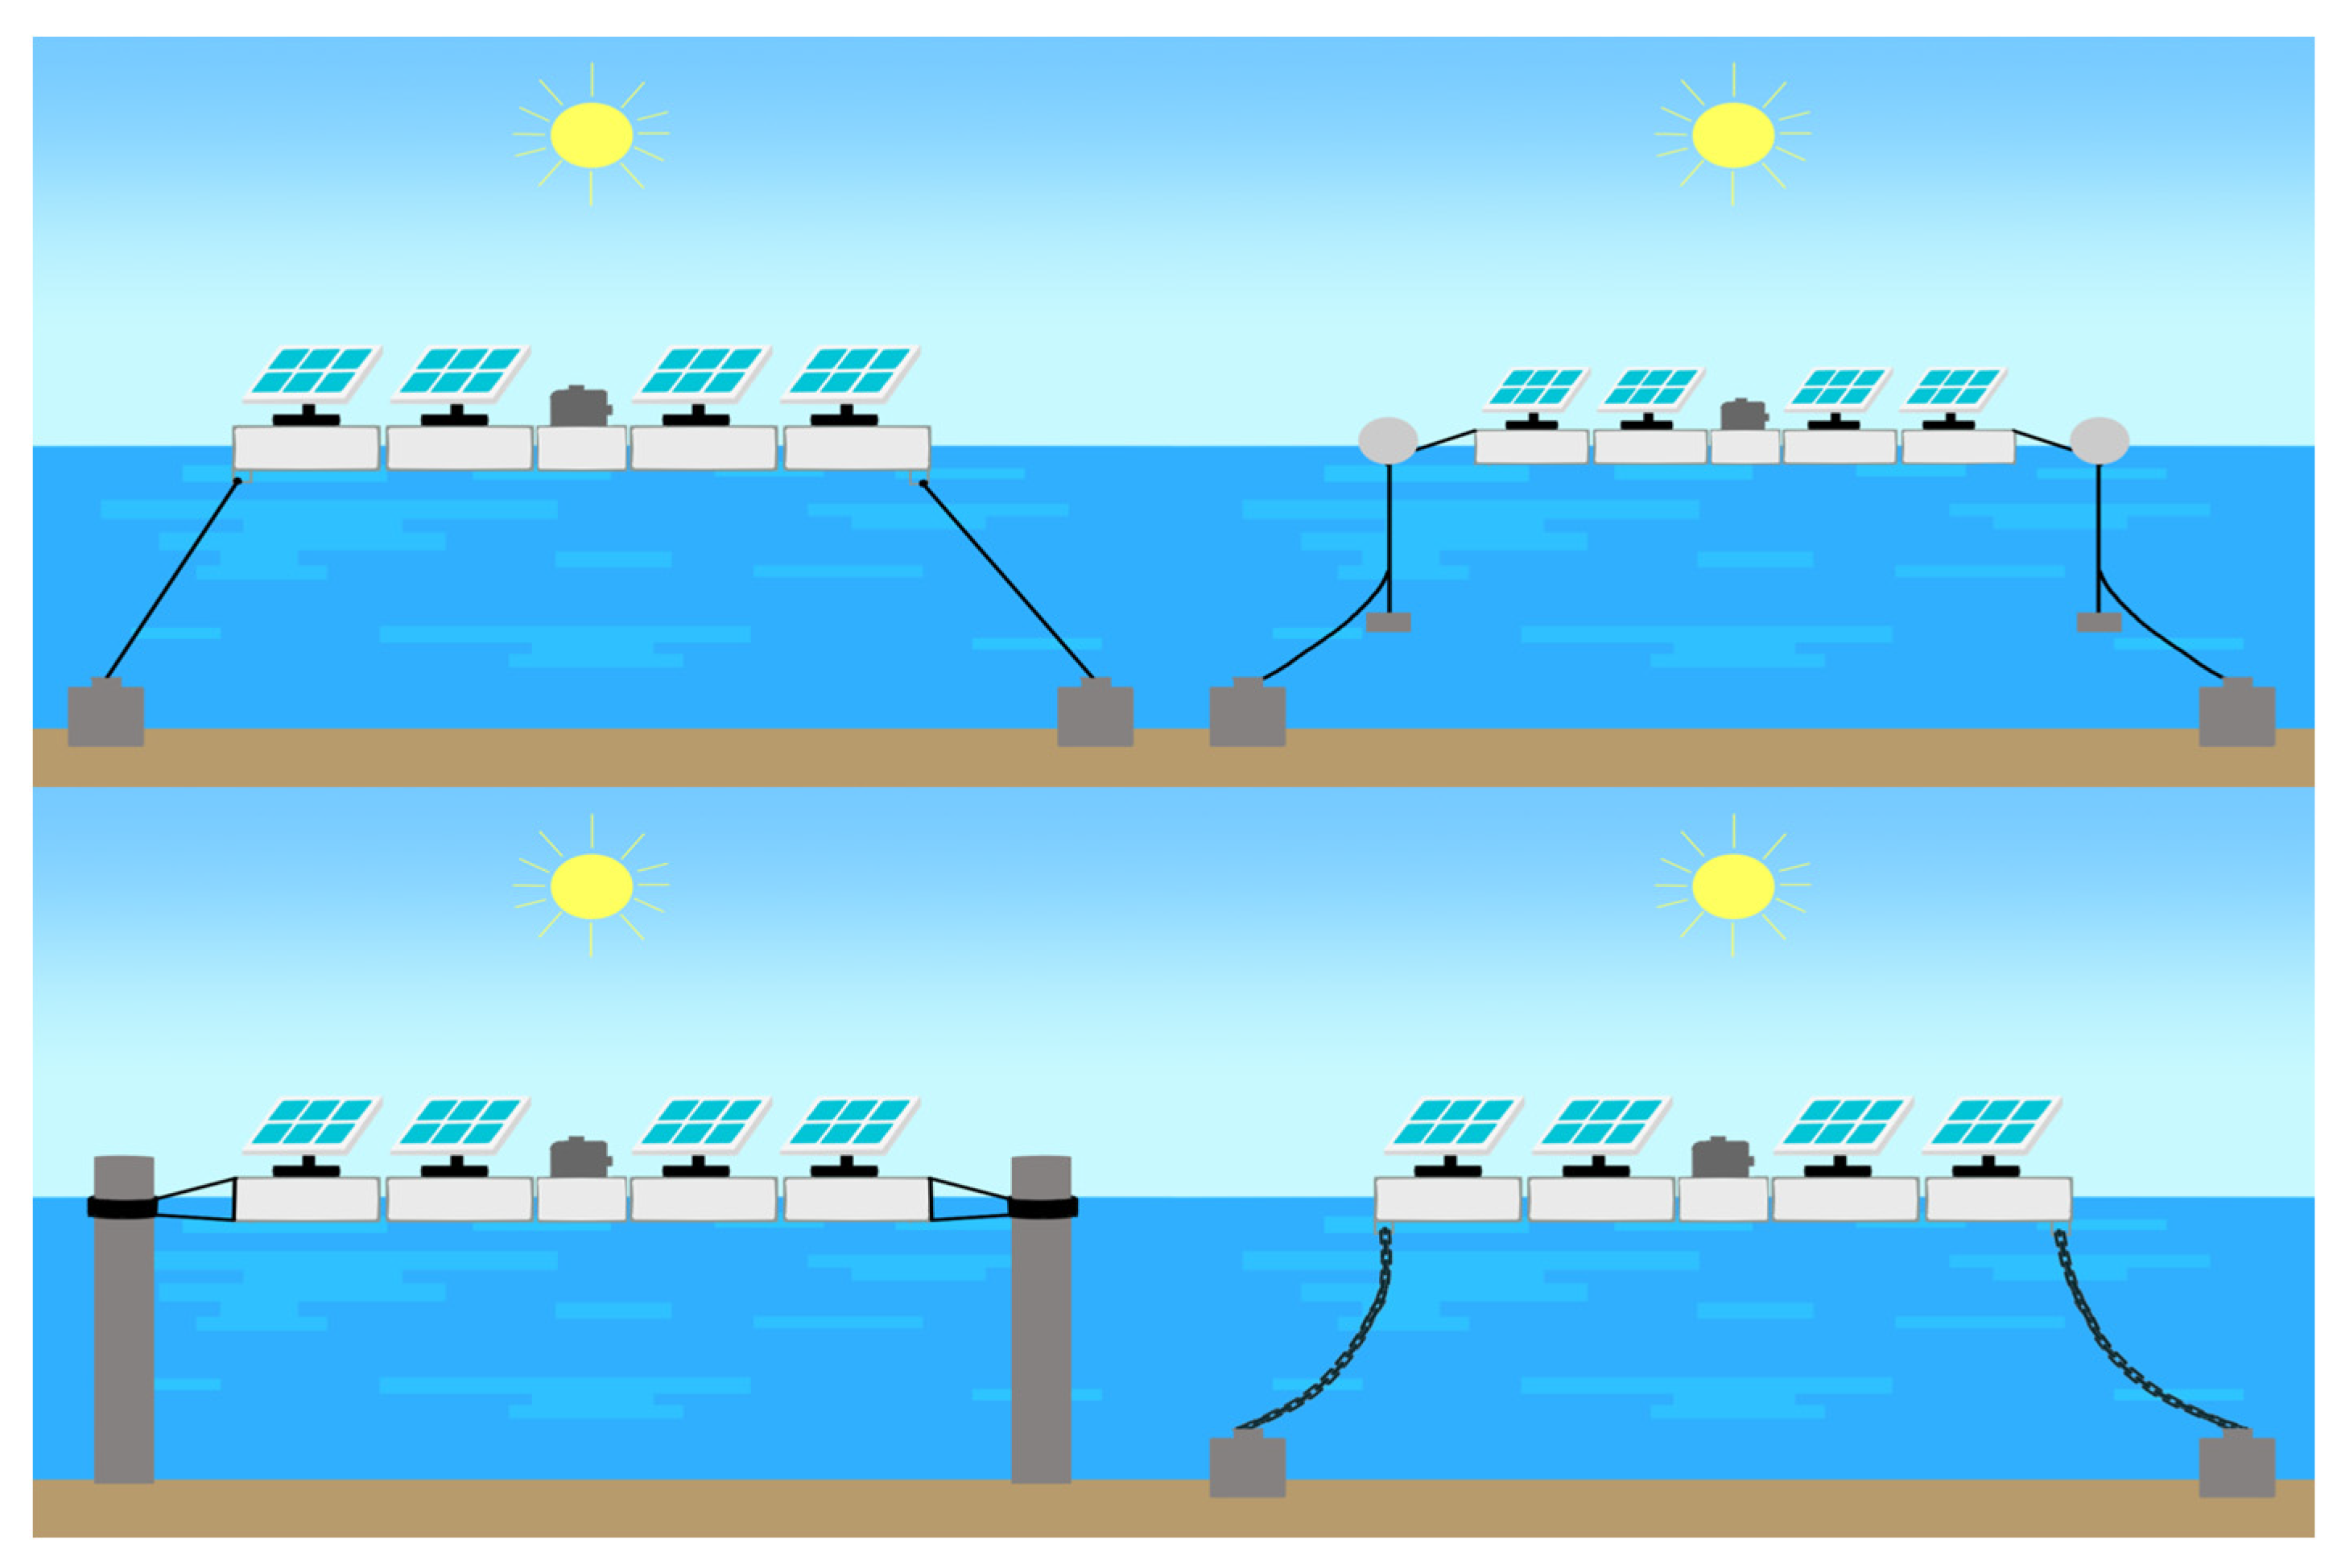
FPV, an emerging technology where solar panels are placed on water bodies such as lakes, reservoirs, and ponds to generate electricity, can have different mooring systems as shown in Figure 1. An observation by the owner of a 500 kW plant in Bubano, Italy, claimed, an increase of 20–26% in electricity output due to the cooling effect [42]. This consists of solar panels, floaters, inverters, mooring and anchoring, cables, and transformers. There are different advantages of this technology, such as a reduction in the land use, a cooling effect, a reduction in water evaporation, and a reduction in the risk of fire. Due to the increase in demand for electricity and the availability of free water bodies, it has attracted the attention of many, with some taking steps further by integrating this technology with an energy storage system to further enhance the performance [43].
Though hydrogen-powered FCEVs offer an advantage in terms of the environment, their widespread adoption faces challenges, particularly in refueling infrastructure, which is essential for fostering this new technology. The significantly small number of battery refueling stations and high charging times are among the main challenges for battery electric vehicles, hindering the uptake of traditional technology [44,45,46]. To mitigate these challenges, people utilizing home charging as an alternative have often been witnessed [20,22]. However, hydrogen refueling requires specialized stations due to safety concerns because of the unwanted risk of combustion due to the nature of its lower ignition point [47]. Home charging has still not been considered the safest charging option; hence, external roadside refueling stations are the only solution. The challenge arises in producing hydrogen for a hydrogen refueling station using a PV system, which requires a significant amount of land, causing two major issues: land competition and high capital expenditure (CAPEX) as a result of land prices being significantly high. These challenges can be resolved by implementing hydrogen-powered refueling stations, which eliminates land acquisition costs, significantly lowering capital expenditure and competition with other sectors, especially the food sector which globally covers approximately 37% of the global land surface [43,48], while water-cooling effects increased PV efficiency by 5–15% compared to land-based systems as an added benefit [49]; proximity to water sources simplifies the electrolysis process, significantly reducing the operating cost, as water can be directly sourced from the supporting water body and can reduce water evaporation from reservoirs simultaneously.
FPV systems combined with hydrogen production and utilization represent a promising avenue for sustainable energy generation and storage, and a 26.57 MWp FPV system with a 22 MW PEM electrolyzer and 60,000 kg hydrogen tank can generate up to 65.5 GWh of clean electricity annually [50]. FPV systems have gained significant attention due to their ability to utilize underused water surfaces while offering several advantages over land-based solar installations, as they can generate about 15% more electricity as compared to ground-based solar systems, primarily due to the cooling effects of water [51]. These systems are of utmost benefit in areas with limited land resources, such as coastal regions and island nations that struggle due to land competition between different sectors [52]. A 2024 study proposed a conceptual design for green hydrogen production using proton exchange membrane electrolysis powered by a floating solar photovoltaic system. This design addresses the challenge of supplying a continuous green hydrogen flow for industrial users. The proposed system requires a floating solar photovoltaic installation with a nominal capacity of 518.4 megawatts and Li-ion batteries with 780.8 megawatt-hours capacity to produce 7.5 million standard cubic feet of green hydrogen per day [53]. In another attempt at investigation, it was found that a fuel cell generator with a hydrogen production and accumulation unit can compensate through reducing the unmet electricity of a floating PV system from 49.34% to 0.57% for the Aegean Region of Turkey [54]. An investigation in Ontario, Canada, explored the possibility of hydrogen ferries with a capacity of 100 passengers and found that the average hydrogen fuel consumption was 3.05 kg/hour, which would have a payback of 7.25 years [55]. In India, it was found that, with annual average solar radiation of 3.95–4.79 kWh/m2/d and a daily annual average load demand of 138 kWh/d, the optimal energy was in the range of 30,100–25,639 kWh/yr using a 110–120 kW rated PV array, 15 kW FC, 30–60 kW electrolyzer, 40–60 kg hydrogen tank capacity, and a 15 kW inverter [56]. A study carried out to analyze the techno-economic evaluation of a hydrogen refueling station in İzmir-Çeşme, Turkey, with an aim of refueling 25 vehicles per day, required 125 kg of hydrogen production for which a 271 kW PV module, two wind turbines, and a 71 kW battery were used [53]. In another study in Turkey, a hybrid renewable power generation system for the hydrogen refueling station with a wind–PV–battery system accounted for as low a levelized cost of hydrogen (LCOH) as USD 8.92/kg, with the NPC and percentage of excess electricity being USD 8.4 million and 29.6%, respectively [57]. In 2020, the results showed that in order to supply 100% of the taxi fleet with hydrogen in the State of São Paulo, Brazil, composed of a fleet of 112 ICE vehicles run on gasoline and ethanol, approximately 185.4 kgH2/day is necessary, while only 19.8 kgH2/day is enough to supply 10% of the total fleet. The peak demand for each scenario is 44.36 kgH2/day and 4.94 kgH2/day, respectively [58]. A photovoltaic system with a green hydrogen system produces 58,615 kg of green hydrogen per year, reducing carbon dioxide emissions by 8209 kg per year [59].
When discussing solar electricity, it is of paramount importance to consider that the solar radiation and climatic conditions are not uniform throughout the planet, which results in substantial variation in energy production, especially solar energy, even with the exact same setup [60]. To classify this variation, the Koppen climate system came into existence for a better understanding based on some basic parameters [61]. The integration of photovoltaic (PV) systems for hydrogen production is significantly influenced by climatic conditions, as outlined by the Koppen climate, as green hydrogen production is dependent on renewable energy, which is linked to climate [62,63]. Research indicates that different PV technologies, such as monocrystalline, polycrystalline, and amorphous silicon, exhibit varied performance based on local climate characteristics [64,65]. A study based on the African continent found that there is a significant variation in green hydrogen production, ranging from 12,247,278 kg to 511,245 kg, due to the difference in the climatic conditions as one of the key factors [66]. Mazzeo et al. illustrated the dependence on solar and wind electricity production, where multiple locations categorized into different Koppen climate zones were investigated, including New Delhi in India, Arizona in the US, Kano in Nigeria, and Ontario, along with other places. The results clearly demonstrated the variation in electricity production due to the Koppen climate, with the site at Baghdad able to produce maximum electricity with PV, while Reykjavik generates minimum electricity with PV [67]. Another study where green hydrogen was produced with a solar and wind hybrid system found significant variation in the green hydrogen sent to the load, ranging from 29,316 kg/MW to 16,201 kg/MW [68]. Hernández-Nochebuena et al. also highlighted the relationship between PV-Hydrogen and climate, considering tropical, dry, and temperate climates for rooftop PV, emphasizing the direct relation between the three [69].
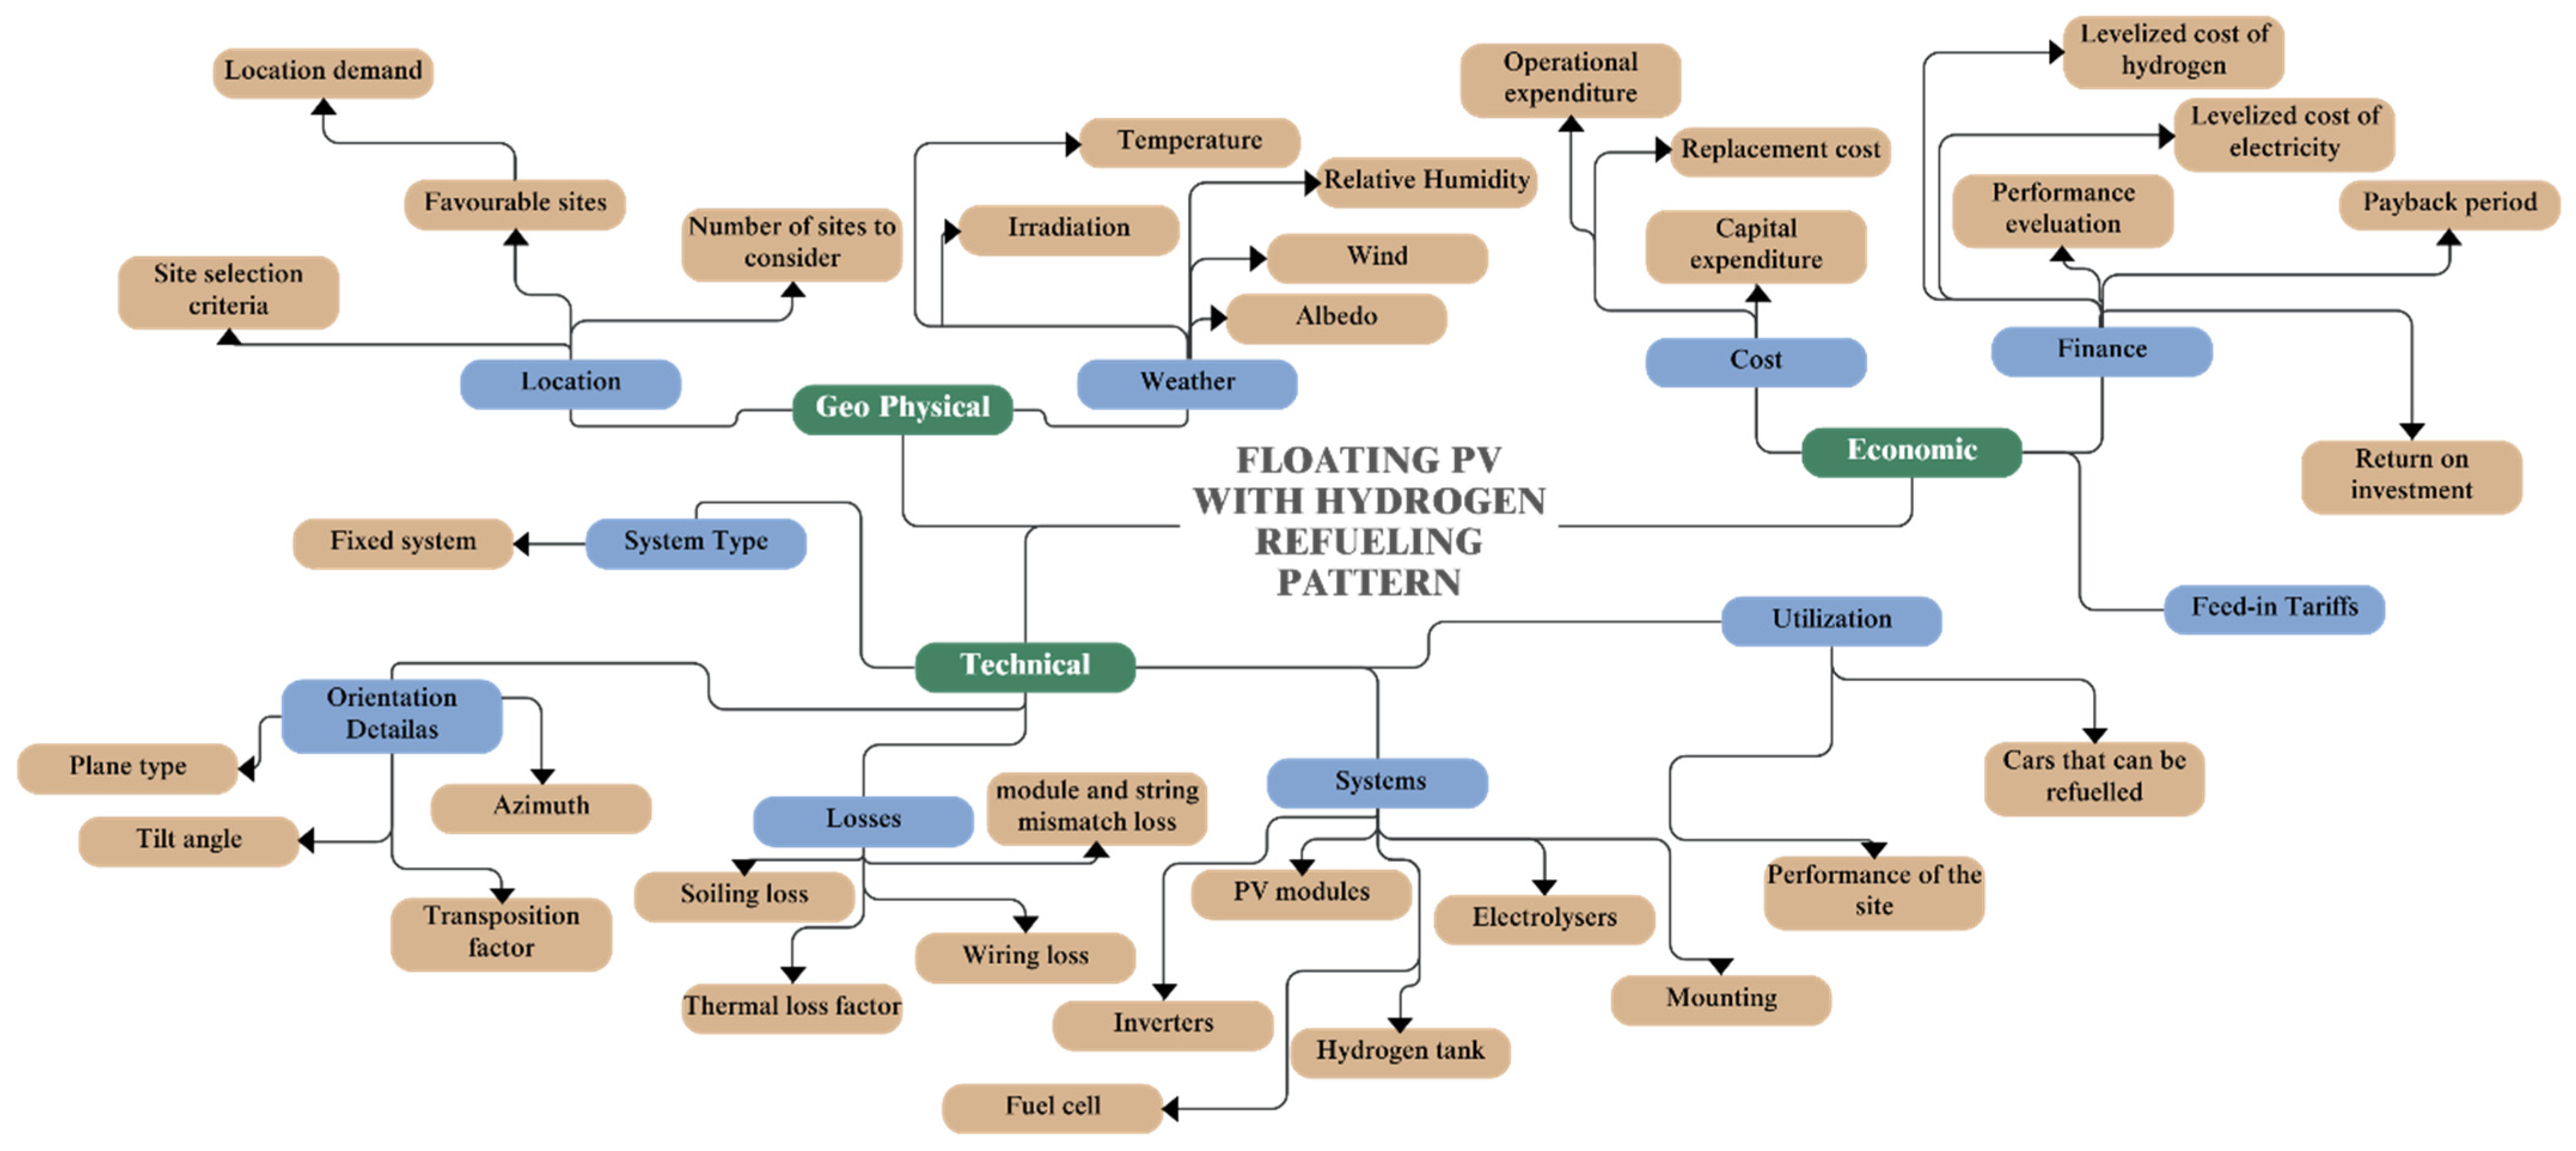
Therefore, even though there is a presence of some literature on green hydrogen production and utilization, a direct comparison of such a system for different Koppen climates with various commercially available modules is not available, especially with an estimation of the number of cars that can be refueled each day with a detailed economic analysis. Figure 2 further elaborates on the novelty of this paper, especially the system considered. This paper is divided into different sections starting from the introduction, followed by methods, results, discussion, and finally concluding with conclusion.

2. Methods

  • Site Selection
In order to evaluate the proposed system, four different locations were selected to evaluate the performance and the viability of the project. The sites were selected based on the Koppen climatic conditions. In 1936, a system was developed by Wladimir Peter Köppen, which divides the climates into five major groups based on the vegetation type that is determined by seasonality of precipitation and critical temperature and is the most widely used climatic classification [70]. This link between climate and vegetation gives a practical and understandable connection between a detailed, multivariate explanation of climate and a visually accessible representation of the natural landscape [71]. In the first publication by Köppen and Geiger, climate was classified into five classes: (a) tropical rainy climates, (b) dry climates, (c) temperate climates, (d) continental climates, and (e) polar climates, as illustrated in Figure 3, and the criteria for classification are illustrated in Table 1. This is the basic classification of the Köppen climate; though there are further classifications, this classification is considered for the simplicity of the paper.
For this paper, four different locations in different Köppen climates and different continents are considered and compared. The first one is the Nizam Sagar Dam in India, which represents the tropical climate along with its significance in the irrigation of about 275,000 acres while contributing to socio-economic impact on locals [72]. The second one is the Aswan High Dam in Lake Naseer, in Egypt, which comes under a dry climate with classification Bwh, built to cater to different demands, including power demand and agriculture expansion plans, while controlling floods [73]. The third one is Oroville Dam in California, in the United States, known to provide irrigation and control floods; simultaneously, it generates three billion kWh of electricity and falls in the category of humid mesothermal climates [74]. The last one is Uglich Dam on the Volga River in Yaroslavl Oblast in Russia. This reservoir has a significant role in providing hydropower along with the climatic conditions and location. Table 2 shows the details of the site selected. Dams were selected for this project as they have the potential to minimize the electricity generation cost due to the existing infrastructure available, simultaneously enhancing sustainability by providing renewable energy to the local load demand [75,76].
  • System Design
  • Floating Array System
Figure 4 illustrates the overall system with a detail of different parameters that were considered during the simulation of this work, from site selection to economic feasibility. The PV array was designed and simulated using PVsyst 7.4, which is widely accepted by industry because of its advanced algorithms and database, helping to simulate with accuracy while simultaneously providing flexibility to customize them based on the requirement [80]. The software takes input for site location in the form of a weather database to select the panel orientation for optimum output and system components and arrangements, which include photovoltaic modules, inverters, and other components. It calculates and generates a detailed report of system performance based on the system configuration. A 10 MWp system was designed in the PVsyst considering the albedo of water as 0.05 for the water surface. The NASA Surface Meteorology and Solar Energy (SSE) program was utilized to generate satellite-derived meteorological data files for the specified site locations. This comprehensive dataset employs mean irradiance measurements for the year 2024, offering a robust climatological perspective. The SSE dataset discretizes the Earth’s surface into a grid of 1° latitude by 1° longitude cells, providing global coverage with a spatial resolution of approximately 111 km at the equator [81,82,83]. Based on the weather file, the orientation, including the optimum tilt angle azimuth angle of the system, was chosen to produce the maximum electricity. Different tilt angles were considered for different sites depending on the latitude and longitude of the system; however, for all the systems, fixed plane was considered. To better understand the performance of the system, different PV modules were considered, which included the LG 355 n1k-n6 monocrystalline bifacial module, LG 280 S1C-B3 monocrystalline monofacial, and AS6P30-280 polycrystalline monofacial with their technical specification in Table 3. Thus, one bifacial and two monofacial modules were considered. In 2023, monocrystalline bifacial solar panels dominated the market compared to polycrystalline bifacial solar panels [84]. A Soleaf DSP-3375K inverter by Dasstech from Shenzhen, China was used, which has a nominal power of 75 kW and an operating voltage of 200–820 V while the ratio of the PV array’s nominal power (PNom STC [kWp]) to the inverter’s nominal power (PNom [kWac]) was 1.2 [85]. The total number of bifacial modules required to design a 10 MWp system was 28,169 units, while this target was achieved with 35,714 units for monocrystalline monofacial and polycrystalline monofacial.
At the same time, different losses are encountered by the array, including soiling and thermal loss; soiling loss is different for every region, which was considered while doing the simulation according to the available data [86,87,88]. The results are obtained using Equations (1) and (2).
E f f e c t i v e   e n e r g y   a t   a r r a y = E a r r M P P ( I L P m a x + E G r i d L m )
where EarrMPP is the energy generated by the PV array operating at the maximum power point, ILPmax is the power loss due to the maximum load condition, and E G r i d L m is the energy lost due to mismatch [89].
The performance ratio is the ratio of energy that is produced for consumption with respect to the energy that would have been produced if the system were working continuously at STC efficiency. This suggests the efficiency of the module and the performance of the system. It can be expressed as follows:
P e r f o r m a n c e   R a t i o =   A c t u a l   E n e r g y   O u t p u t   T h e o r e t i c a l   M a x i m u m   E n e r g y   O u t p u t   × 100
In order to quantify the significance of this system, an economic analysis was conducted, where the cost of different components was considered, as illustrated in Table 4, which includes the cost of the major components, whereas Table 5 displays the varying values in different regions, which were considered based on the market values for FPV systems.
  • Hydrogen System Modelling
To generate green hydrogen from the total electricity produced by the FPV, a system was designed to address this using HOMER Pro Version 3.16.2. It is an optimizing software, Hybrid Optimisation of Multiple Energy Resources, commonly referred to as HOMER Pro developed by UL Solutions to navigate a project’s designing complexities, cost-effectiveness, and reliability [110]. In this work, a 100% renewable system was designed using the HOMER Pro software, which utilizes solar rays to produce electricity without wasting land by using FPV to meet the assumed electric load as shown in Figure 5 with different components along with the energy flow directions. Additionally, the use of a PEM electrolyzer and fuel cell complements the system as electricity produced by the FPV is stored and used later to eliminate the intermittent nature of the PV. Each selected location represents different climatic conditions, which will enable us to study the system’s performance around the world. For each location, three types of simulations are performed with three types of PV representing Scenario 1, scenario 2, and Scenario 3. Scenario 1 is a system using monofacial (monocrystalline) PV, scenario 2 uses monofacial (polycrystalline) PV, and scenario 3 uses bifacial (monocrystalline) PV. The project was simulated in this software using the results from PVsyst and panel specifications. The PEM electrolyzer with an efficiency of 85% was considered to check the feasibility of the for various geographical locations and photovoltaic modules [111,112,113,114]. The PEM electrolyzer was considered due to its advanced technology, commercial availability, high efficiency ranging between 50 and 83 kWh/kgH2, lifetime of 50–80 thousand hours, and its capability to produce enhanced purity of the gas [115]. Sensitive analysis of the electrolyzer capacity is an essential parameter, as the design and sizing of the electrolyzer directly influence system performance, thereby affecting hydrogen production output, capital costs, and operational dynamics. An experimental study has demonstrated that electrolyzer sensitivity analysis for a 5 kW scale green hydrogen production system has an energy conversion efficiency between 73.3% and 86.2%, with the electrolyzer consuming a minimum specific electricity of 45.77 kWh/kg. In this study, a sensitive analysis was conducted over a range of electrolyzer sizes (0–30 kW) and minimum load percentages (10–50%) to determine their impact on surplus energy use [116]. A fuel cell has also been incorporated into the system to directly convert the chemical energy in hydrogen to electricity with water and potentially useful heat as the only byproducts [117]. The efficiency of the fuel cell for this has been considered as 40% and the lifetime of the proposed system fuel cell is assumed to be 40,000 h [118,119,120].
Based on the input data, HOMER Pro carried out simulations which have been analyzed. The size of the modelled system is given in Table 6. The size of the system in 1 and 3 came out to be the same. However, there is a slight change in the size of the electrolyzer and storage tank for system 2.
The electrolyzer is operational during the period of sunlight from 7 am to approximately 6 pm. The produced hydrogen is stored in a hydrogen tank, which has an initial tank level of 30% relative to tank size, while the hydrogen tank size is 10,000 kg [121]. Using Equations (3) and (4)
C a n n , t o t = C R F i , R p r o j . C N P C , t o t
where C a n n , t o t represents total annualized cost (GBP), i annual real discount rate (%), R p r o j is the project lifetime in years, and C R F is the capital recovery factor [122].
L C O H = C a n n , t o t   ν e l e c   E p r i m , A C + E p r i m , D C + E d e f + E g r i d , s a l e s M h y d r o g e n
LCOH is the levelized cost of hydrogen, where ν e l e c , value of electricity; E p r i m , primary electrical load; E d e f deferrable load; E g r i d , s a l e s total energy sold to the grid; and M h y d r o g e n total hydrogen production [123]. The input values for financial analysis of different components are listed in Table 7.
  • Refueling Pattern
This hydrogen can be utilized to refuel the vehicles for which it is essential to find scale factors which can be conducted using Equation (5)
S c a l e   F a c t o r = A v e r a g e   d a i l y   h y d r o g e n   p r o d u c t i o n 8 100
where it is assumed that 8 kg of hydrogen is required to refuel one [125] and is divided by 100 since this is the unscaled daily demand of each refueling pattern. To calculate the refueling demand, Equation (6) can be used.
D e m a n d = D e m a n d   p r o f i l e × s c a l a r
Cars refueled can be calculated using Equation (7), where it is assumed that 8 kg of hydrogen is required to refuel one car [125].
C a r s   r e f u e l l e d = s t o r a g e   l e v e l   b e f o r e s t o r a g e   l e v e l   a f t e r 8 + H y d r o g e n   P r o d u c e d 10 8
  • Water saving due to the presence of floating photovoltaics
The potential water that can be saved due to evaporation was calculated using Equation (8)
E 0 = 700 T m ( 100 A ) ( 80 T ) + 15 ( T T d ) ( 80 T )
where E 0 is the daily evaporation rate, T m is the adjusted temperature calculated using Equation (9), while T d is the dew point temperature, T is the mean temperature, and A is the latitude.
T m = T + 0.006 h
where h is the elevation. The potential water saving was calculated using Equation (10) [126].
W i = A r e s σ c o v e r a g e + W l o s s β 10 9
where A r e s is the reservoir surface area, σ c o v e r a g e is a surface covered by floating photovoltaics, W l o s s is the annual evaporation rate, and β is the evaporation reduction rate.
3. Results

To evaluate the performance of the module and the energy generated technical and economic analysis was done, which is explained in the section below.

3.1. Site Condition Variability

Figure 6 illustrates the variation in ambient temperature across different locations, resulting from the diverse Koppen climatic conditions. The tropical region of Nizam Sagar, Hyderabad, India, experiences temperatures above 20 °C throughout the year, with the highest recorded in May at 32.8 °C. Whereas, the Aswan High Dam, Egypt, has the highest temperature between June and September amongst the four locations, especially in the month of August with 36.51 °C. The Oroville Dam of the United States and Uglich Dam of Russia follow the same trend as the Aswan High Dam. Most locations have their peak ambient temperature in the month of July or August, except for the tropical region which experiences its monsoon during this time, regulating the temperature. The snow region of Uglich Dam experiences an intense plummet in the ambient temperature, especially between November and March, reaching as low as −16.09 °C in the month of January. However, at the Oroville Dam, the temperature always remains above 5 °C throughout the year.
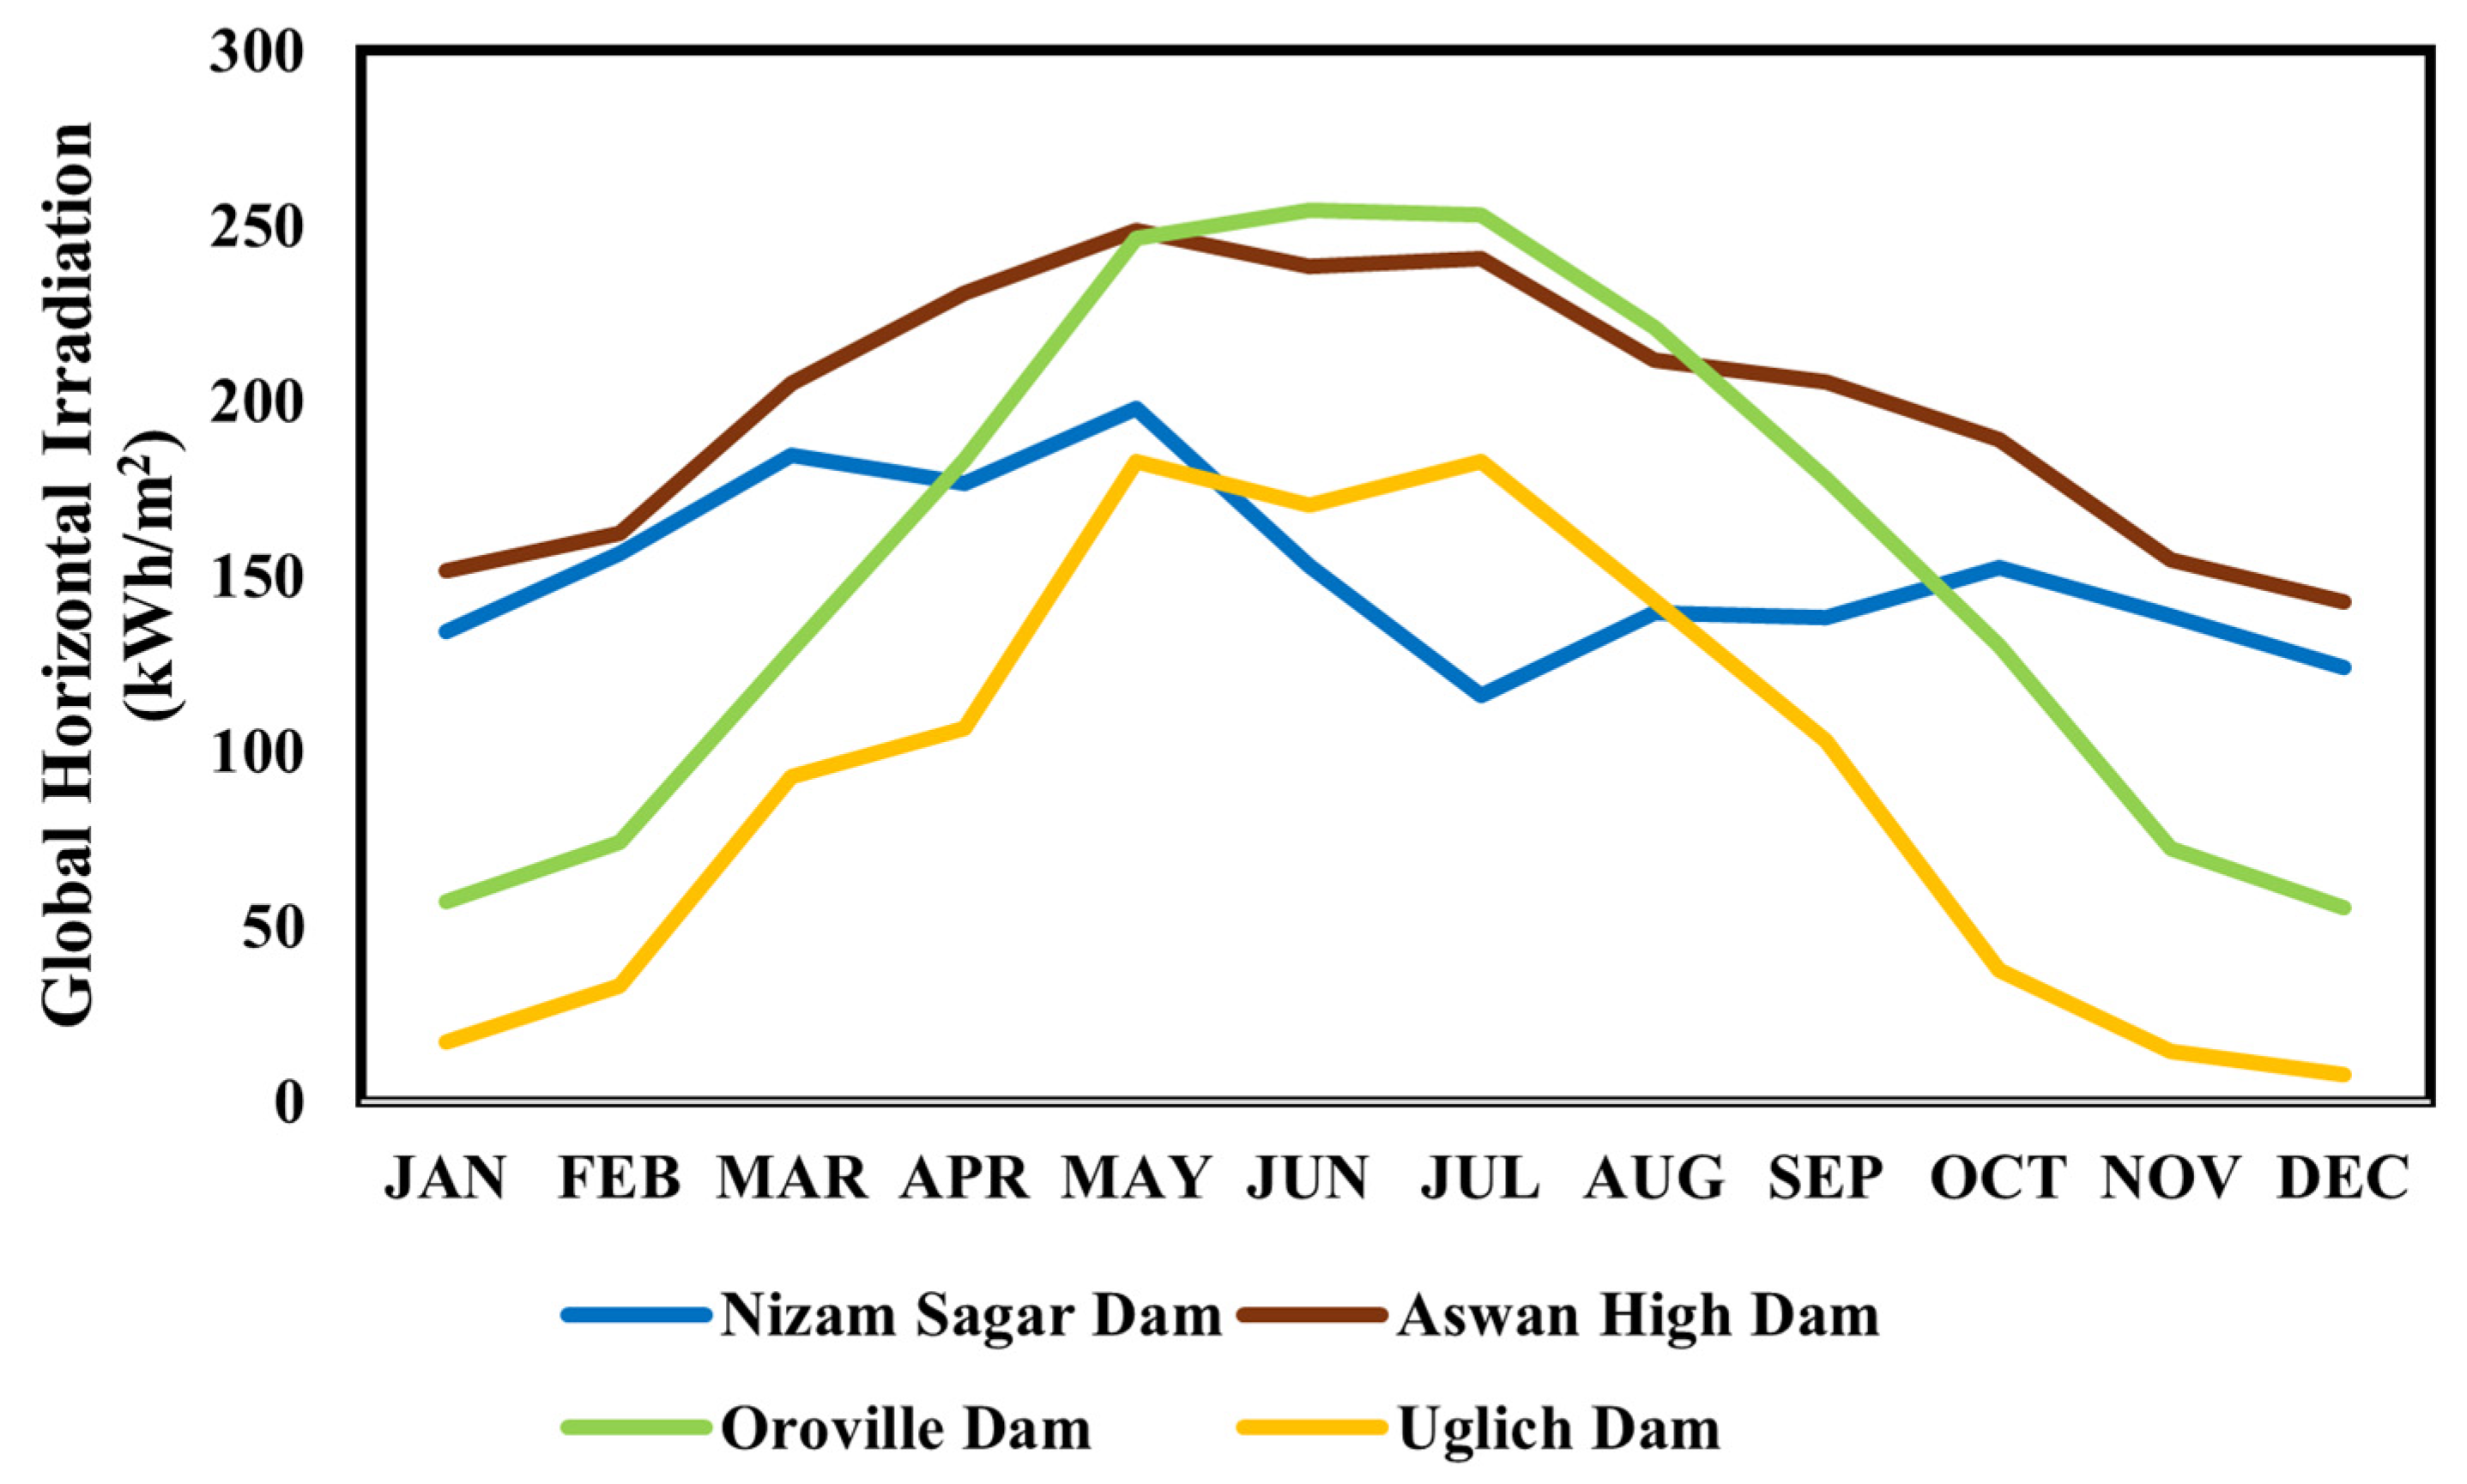
Figure 7 illustrates the global horizontal irradiance across different places, which is essential for understanding the amount of electricity produced for each of these locations. Aswan High Dam receives the maximum amount of solar irradiance for most of the year, with an average of 198.39 kWh/m2; however, during May and August, the amount of solar irradiance received is almost equal to Oroville Dam and exceeds in the months of June and July, accounting for 254.6 kWh/m2 and 253.1 kWh/m2,, respectively. The highest irradiance for the Aswan High Dam is 248.6 kWh/m2,, while the average irradiance for Nizam Sagar is 150.96 kWh/m2. Though contrary to the trend followed by other places, Nizam Sagar Dam experiences the highest irradiation in the month of May with 197.9 kWh/m2. In the month of July, Nizam Sagar Dam receives the minimum irradiation compared to the other locations during the same period, accounting for 116.2 kWh/m2. This is due to the lack of clear sky during this period, obstructing global horizontal irradiance. Uglich Dam receives the least amount of irradiation, and during the month of December, it reaches as low as 7.8 kWh/m2, resulting in the reduced solar radiation reaching the photovoltaic plane while the average global horizontal irradiance is 90.41 kWh/m2 for 2024.

3.2. Electricity Production at Floating PV

Figure 8 gives information about the effective energy produced at the output of the array every month for all the different locations for varying module panels. It is evident that all the locations have different output patterns for every month. In the case of Nizam Sagar Dam, the highest electricity produced in the month of March is by bifacial (monocrystalline) modules, which is 1,530,952 kWh, and the lowest is in July by monofacial (polycrystalline) modules, accounting for 842,759 kWh. This coincides with the results of Figure 5 and Figure 6, where it is evident that the monsoon season of the region is responsible for reduced global horizontal irradiation received in the month of July, even with bifacial modules generating only 865,839 kWh. The Aswan High Dam of Egypt, which experiences dry climatic conditions, does not experience this scenario and produces an average of 1,467,347.1 kWh of energy between June and August, though the bifacial modules produce an average of 1,500,946.3 kWh during the same period. Contrary to the Nizam Sagar Dam pattern, the lowest amount of electricity is produced in the month of December, which coincides with the temperature and global horizontal irradiance, especially by monofacial (polycrystalline) modules generating 1,443,797 Wh. In the case of Oroville, August produces 1,943,569 kWh by bifacial (monocrystalline) modules, whereas monofacial (monocrystalline) generates 1,901,192 kWh, followed by monofacial (polycrystalline) modules generating 1,876,485 kWh for the same period. However, the least amount of electricity is produced in the month of December, with bifacial producing about 858,214 kWh, followed by monocrystalline monofacial with 858,131 kWh and finally polycrystalline monofacial modules, which account for 841,769 kWh. Uglich Dam produces an average of 1,038,499.25 kWh for bifacial (monocrystalline), 1,037,690.42 kWh for monofacial (monocrystalline), and 1,016,717.17 kWh for monofacial (polycrystalline). This suggests that bifacial has the ability to produce more electricity irrespective of the Koppen climate [127].
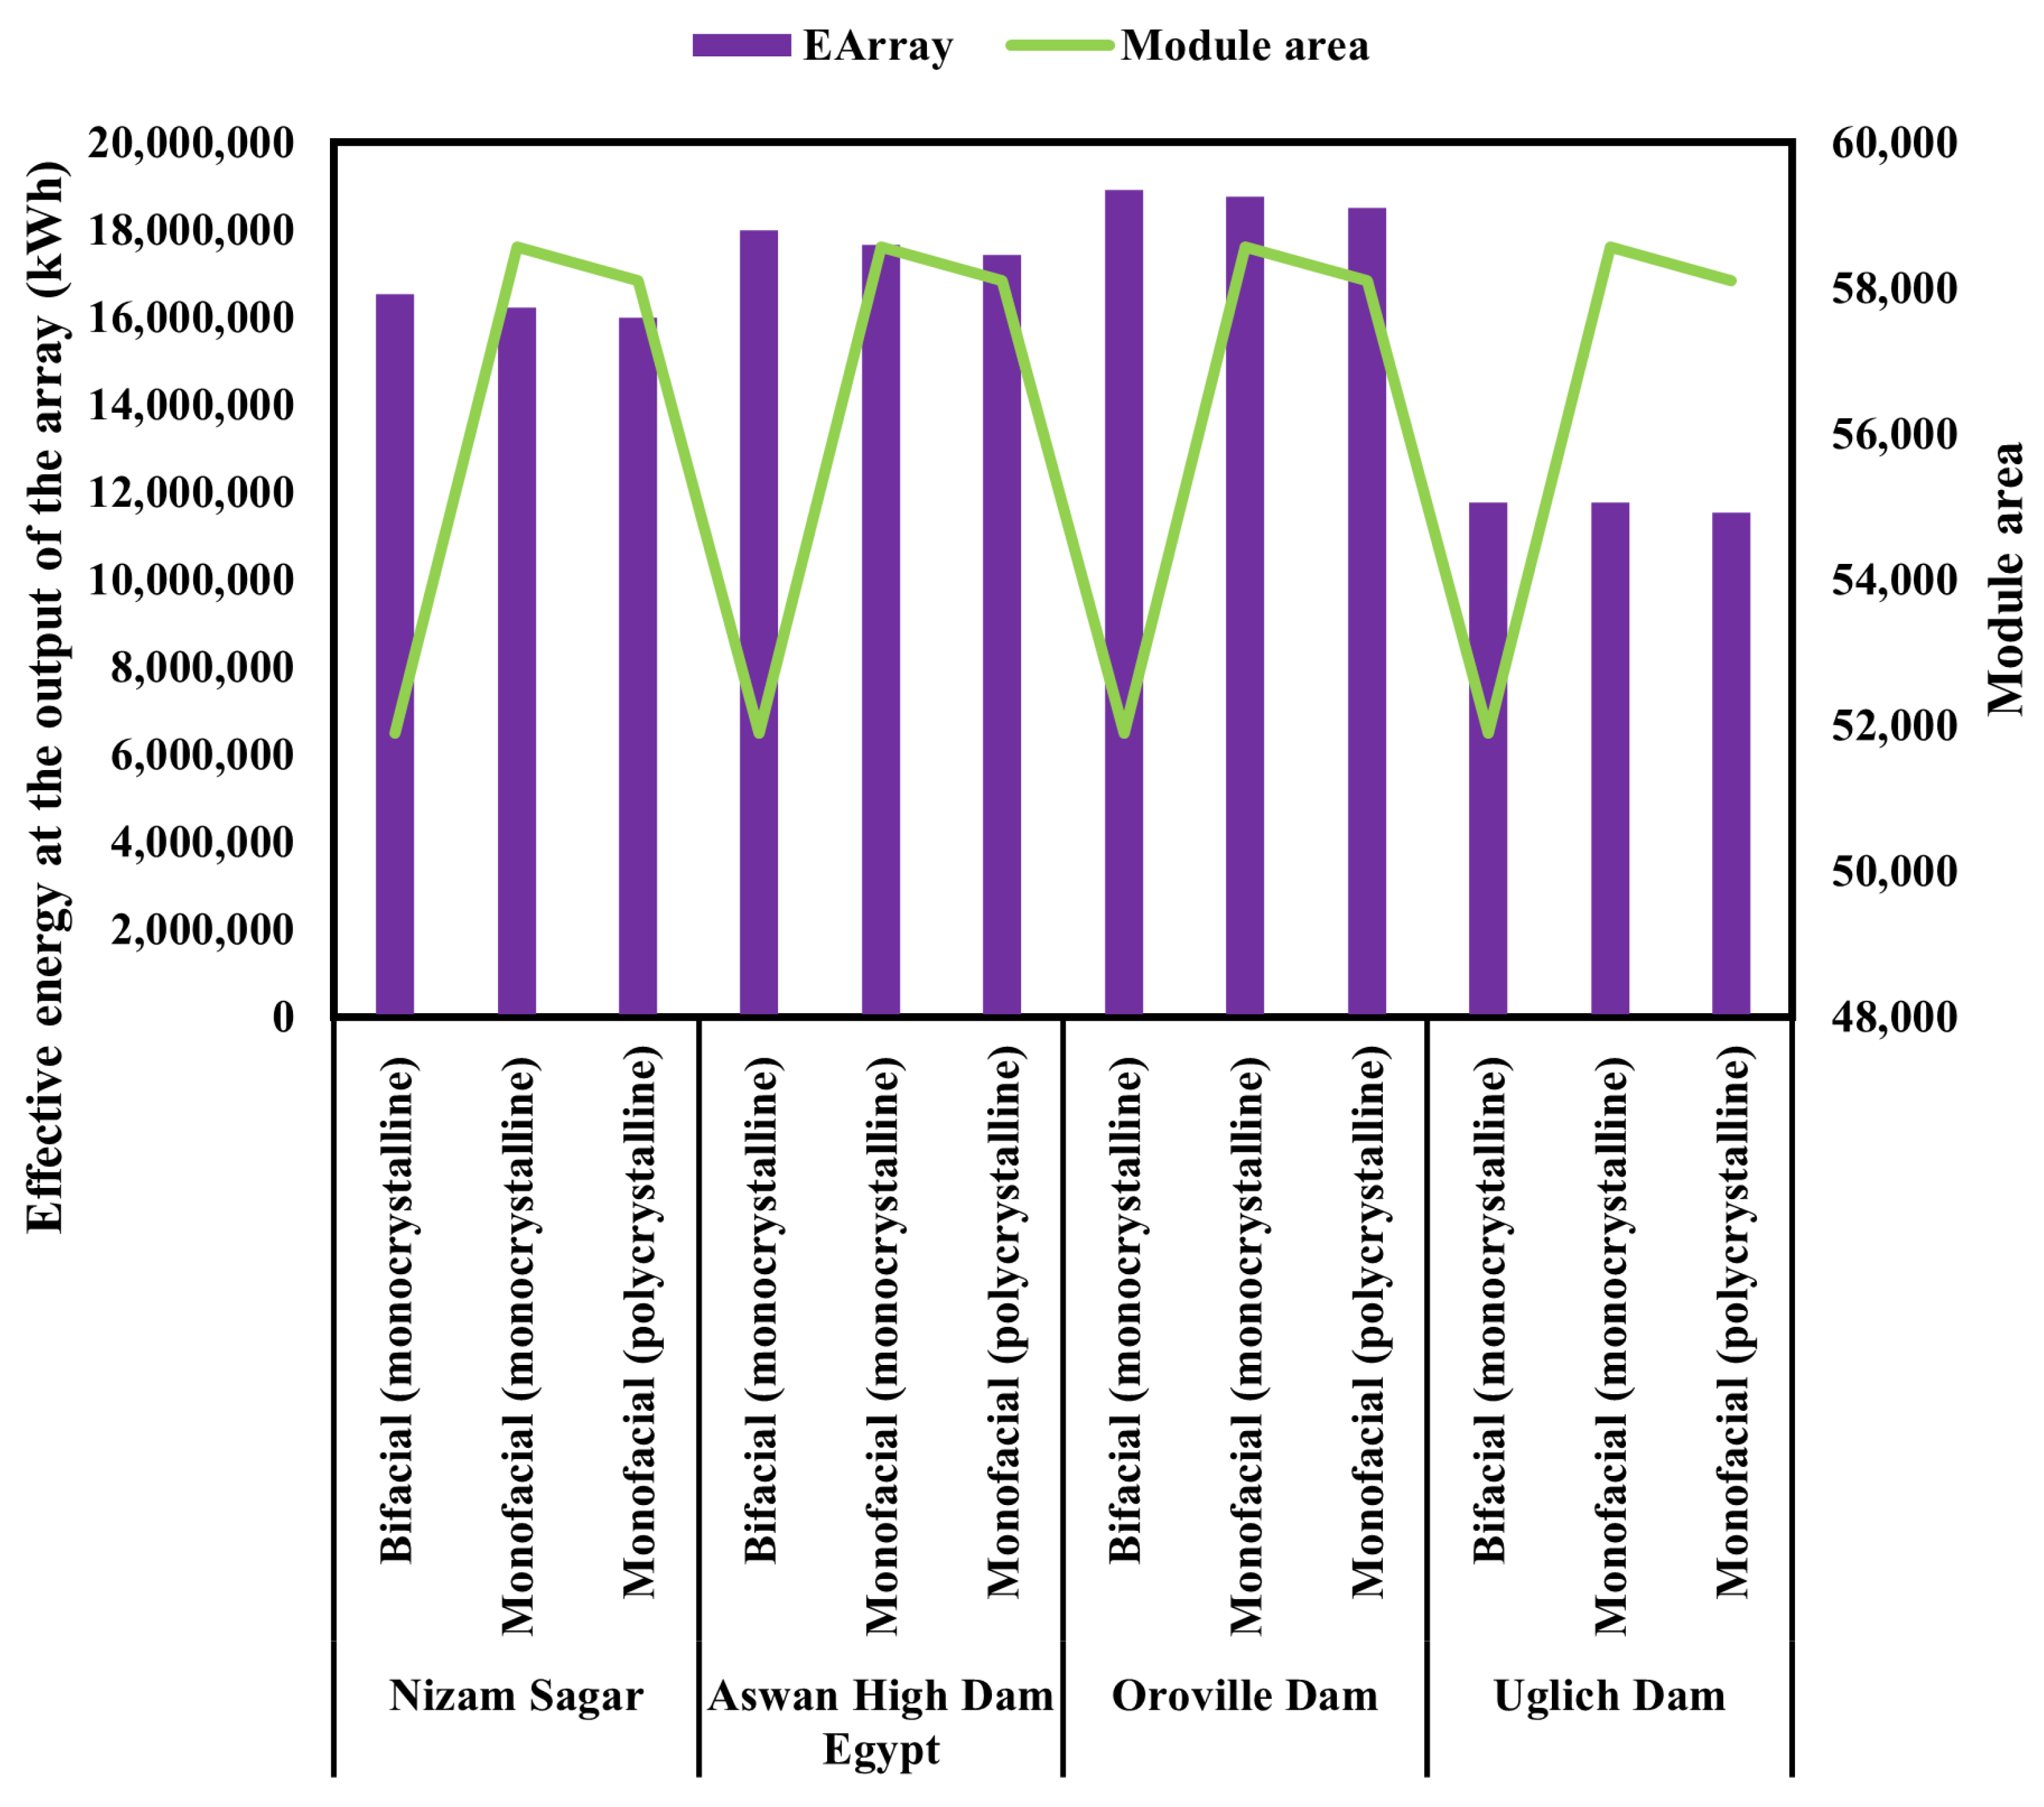
Figure 9 compares the annual effective energy and the area of the modules for each system for different locations. The bifacial array requires the minimum area for all places, which is estimated to be 51,895 m2. This is due to the characteristics of bifacial modules to produce electricity from both sides, contrary to monofacial, and it has been estimated that bifacial modules can produce up to 30% more electricity as compared to monofacial [128]. The maximum amount of the total energy produced is in the mild temperate climatic condition of Oroville Dam, where the bifacial modules produce a total of 18,231,818 kWh, followed by monocrystalline and polycrystalline monofacial modules with a reduction of 214,186 kWh and 489,095 kWh, respectively, compared to bifacial modules. Aswan High Dam of Egypt generates the highest electricity with a bifacial array system contributing 18,829,587 kWh, followed by Oroville Dam, Nizam Sagar Dam, and Uglich Dam with 18,231,818 kWh, 15,083,441 kWh, and 12,461,991 kWh, following a similar trend where a bifacial module produces the highest amount of electricity and a polycrystalline module produces the minimum amount of electricity. This suggests that dry climatic conditions provide the most favorable conditions for electricity production by floating photovoltaic systems [32,129]. This also indicates that temperature plays an important role in the performance of photovoltaic systems, and PV systems tend to reduce their efficiency in scenarios when the temperature and meteorological conditions are beyond the range of the favorable temperature, whether it is high or lower than the range [130]. Aswan High Dam, which receives the maximum amount of solar irradiation, which is evident from Figure 7, is able to produce the maximum amount of electricity, which can be inferred from Figure 9; however, the variation between the electricity production of dry and temperate climates is not significant, making it beneficial for both regions [131,132].
The Performance Ratio is another key metric used to evaluate the efficiency and reliability of photovoltaic systems, which determines the ratio of energy effectively produced by a PV system to the energy that would be produced if the system operated continuously at its nominal STC (Standard Test Conditions) efficiency [133] and helps assess and optimize the operation of solar power plants across various conditions and configurations. Figure 10 provides a picture of the performance ratio of different systems for different locations. It is evident that bifacial (monocrystalline) modules have a higher performance ratio in general; however, Uglich Dam shows interesting results where, for many months, the performance ratio for monofacial (monocrystalline) is better than bifacial systems, especially during those periods when the temperature of the region is less than 10 °C and the solar irradiation is less than or around 100 kWh/m2. It is also intriguing to notice that the higher the global horizontal irradiation at a place, the wider the difference in the performance ratio between the three systems for those locations. This suggests low PR periods are primarily caused by site-specific factors such as high module temperature, soiling loss, and reduced solar irradiance (e.g., during monsoon, or cloud cover at different Köppen climate zones), which is evident from the figure below. Nevertheless, the monofacial (polycrystalline) modules continue to have the lowest performance ratio of all the regions.
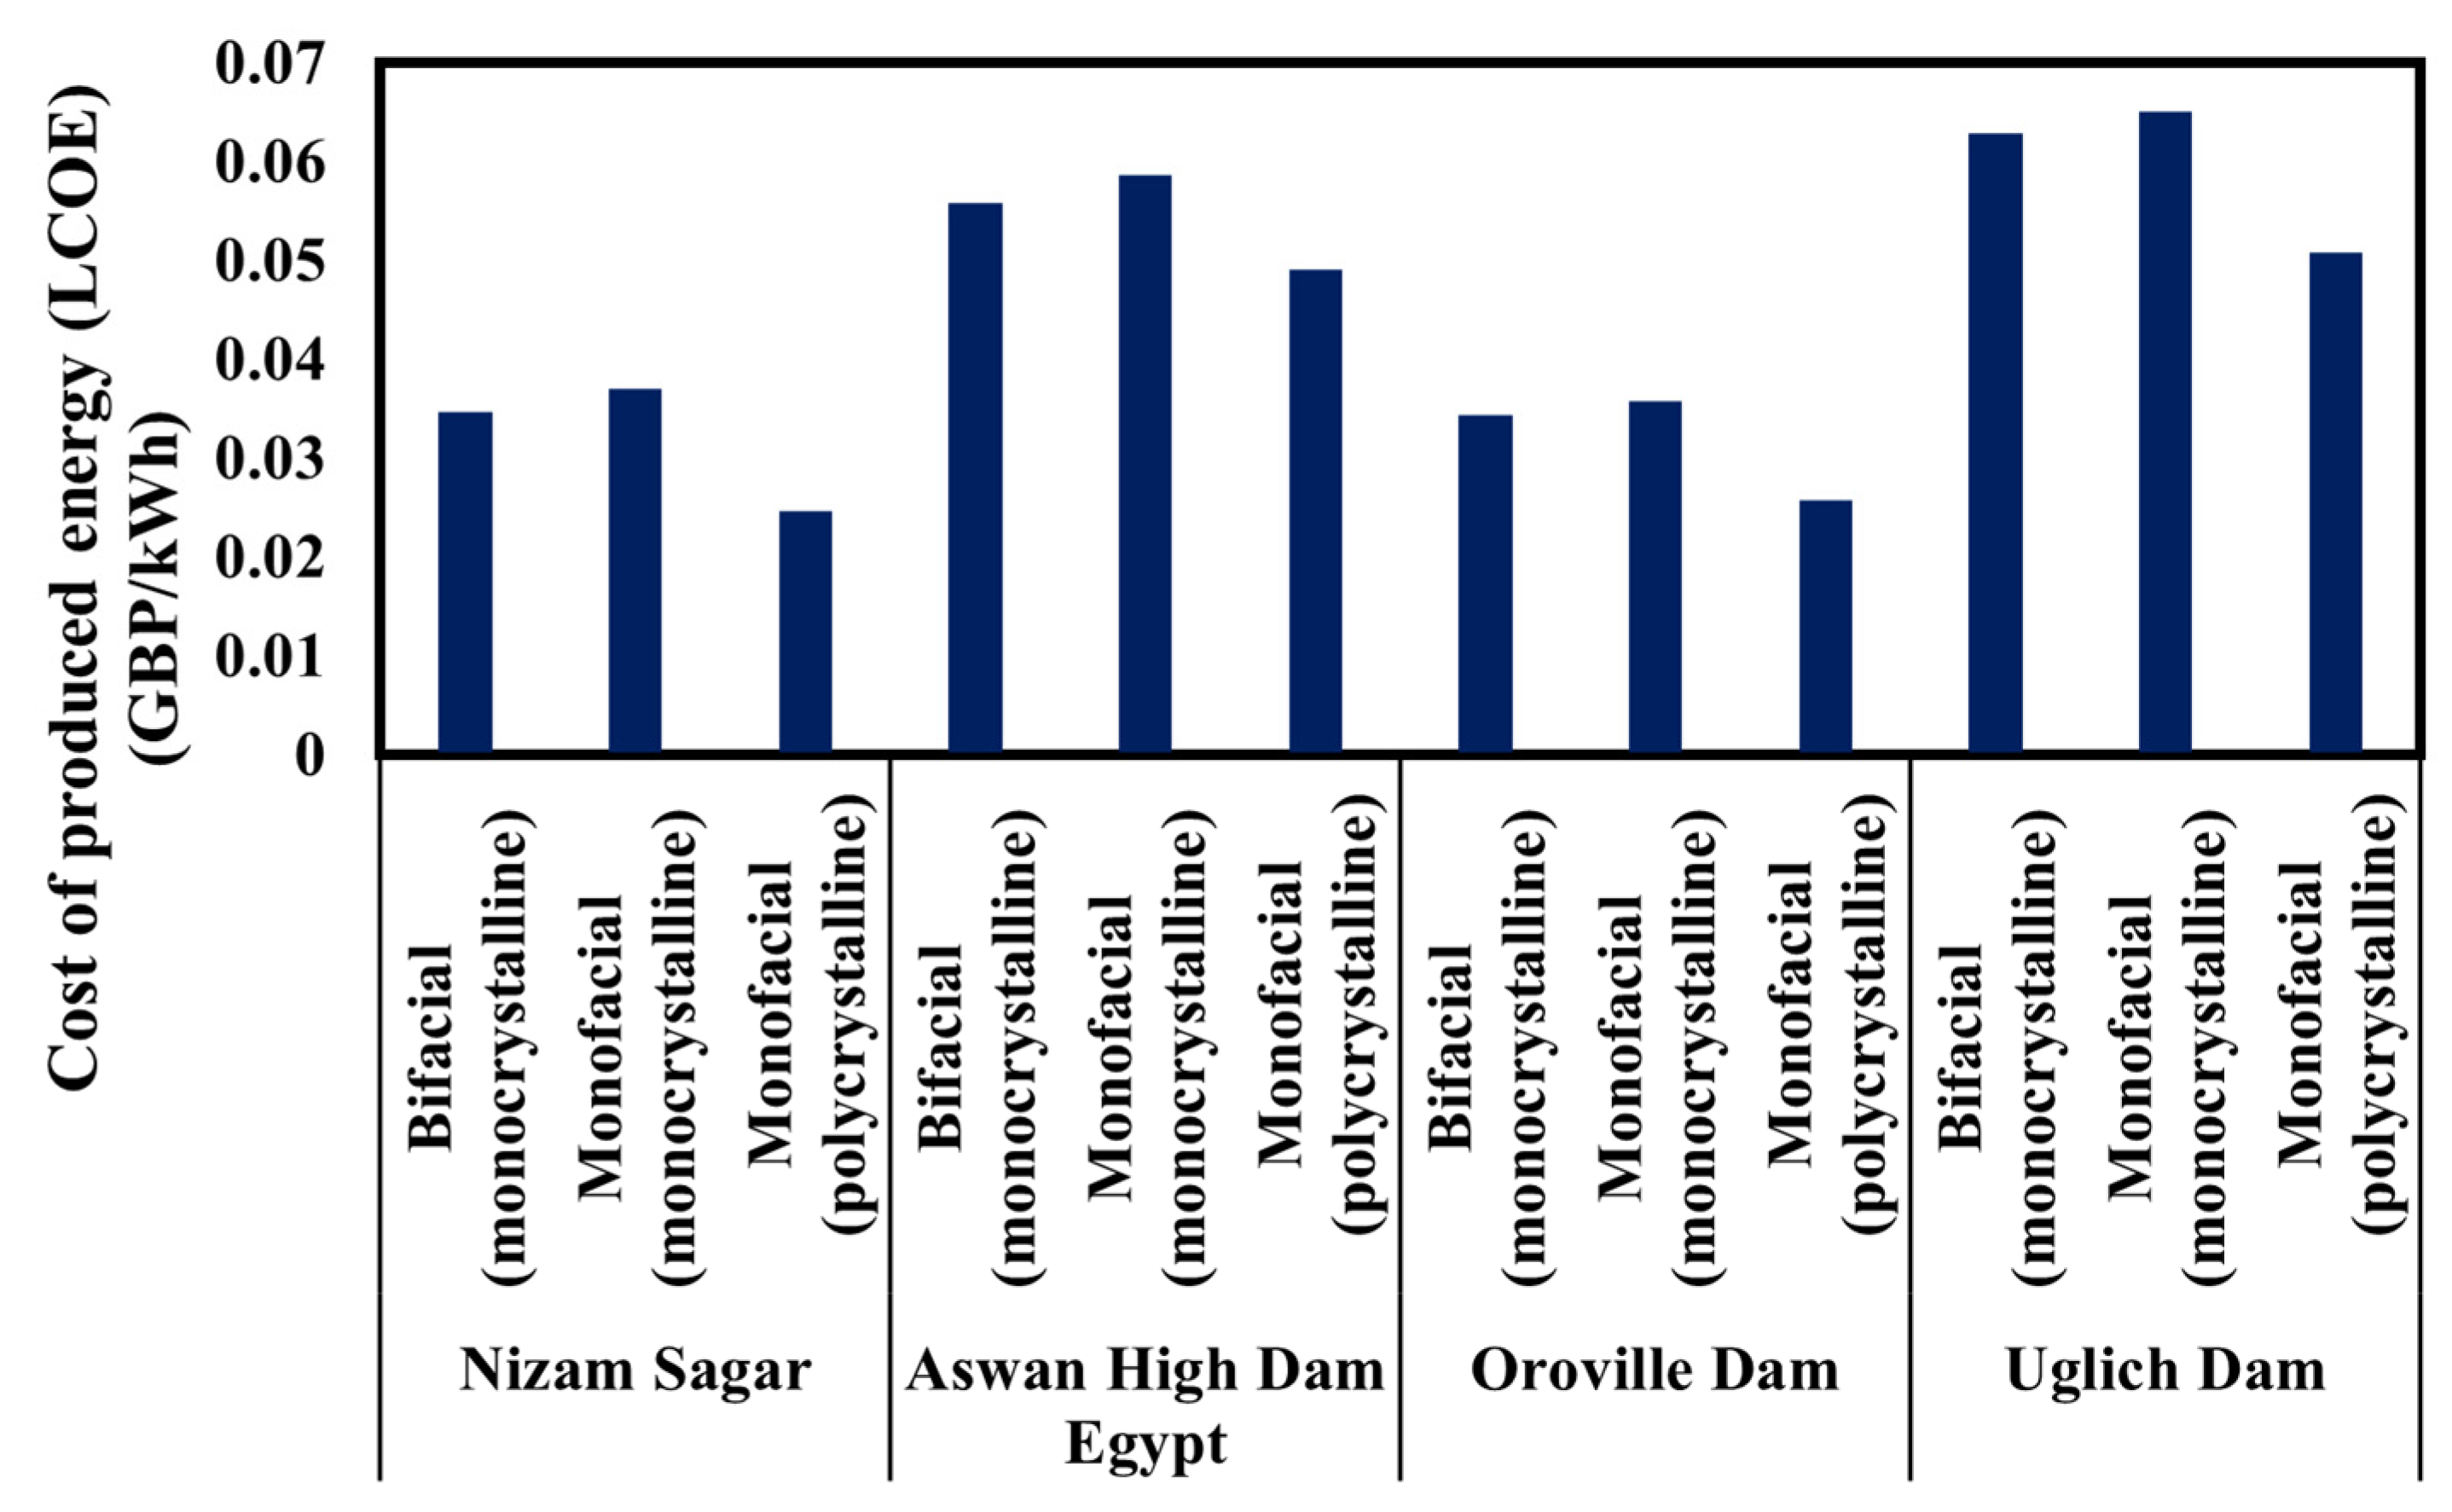
Figure 11 compares the average cost of produced energy or the levelized cost of electricity (LCOE) for different systems at different locations. In general, the LCOE is lower for bifacial solar panels compared to monofacial panels, regardless of the dam location. This suggests that bifacial technology, which can capture sunlight from both sides, is more cost effective in these scenarios. It is evident that the bifacial module in Nizam Sagar Dam has the lowest LCOE, reaching as low as 0.0246 GBP/kWh. Overall, monofacial polycrystalline modules show the lowest LCOE values for most locations, highlighting the economic advantage of technology due to a significantly low market price; however, bifacial technology has lower LCOE as compared to monofacial monocrystalline which supports the investigation of Rodríguez-Gallegos and the group that bifacial modules have the lowest LCOE when the difference in the module cost is around 15% [134,135]. The cost of energy produced is lower when there is an increase in the amount of electricity produced, thus suggesting that when more electricity is produced at a location, the cheaper the cost of produced electricity will be. Due to this, the LCOE would have been the lowest for Oroville Dam for three systems compared to other locations; however, due to the difference in the feed-in tariff, the amount of electricity generated and feed-in tariff both play a significant role in determining the LCOE along with other factors. The Aswan High Dam has a comparatively higher LCOE than the other two locations, with its highest LCOE for monofacial being 0.0587 GBP/kWh, unlike Nizam Sagar with 0.037 GBP/kWh and Oroville Dam with 0.0358 GBP/kWh. Uglich Dam has the highest values for LCOE, with the polycrystalline system having the lowest amongst the three systems, with 0.0508 GBP/kWh, which is still around almost two times higher than Oroville Dam. This suggests that economic parameters are important for low LCOE along with increased solar energy production, especially when it comes to photovoltaic [136].
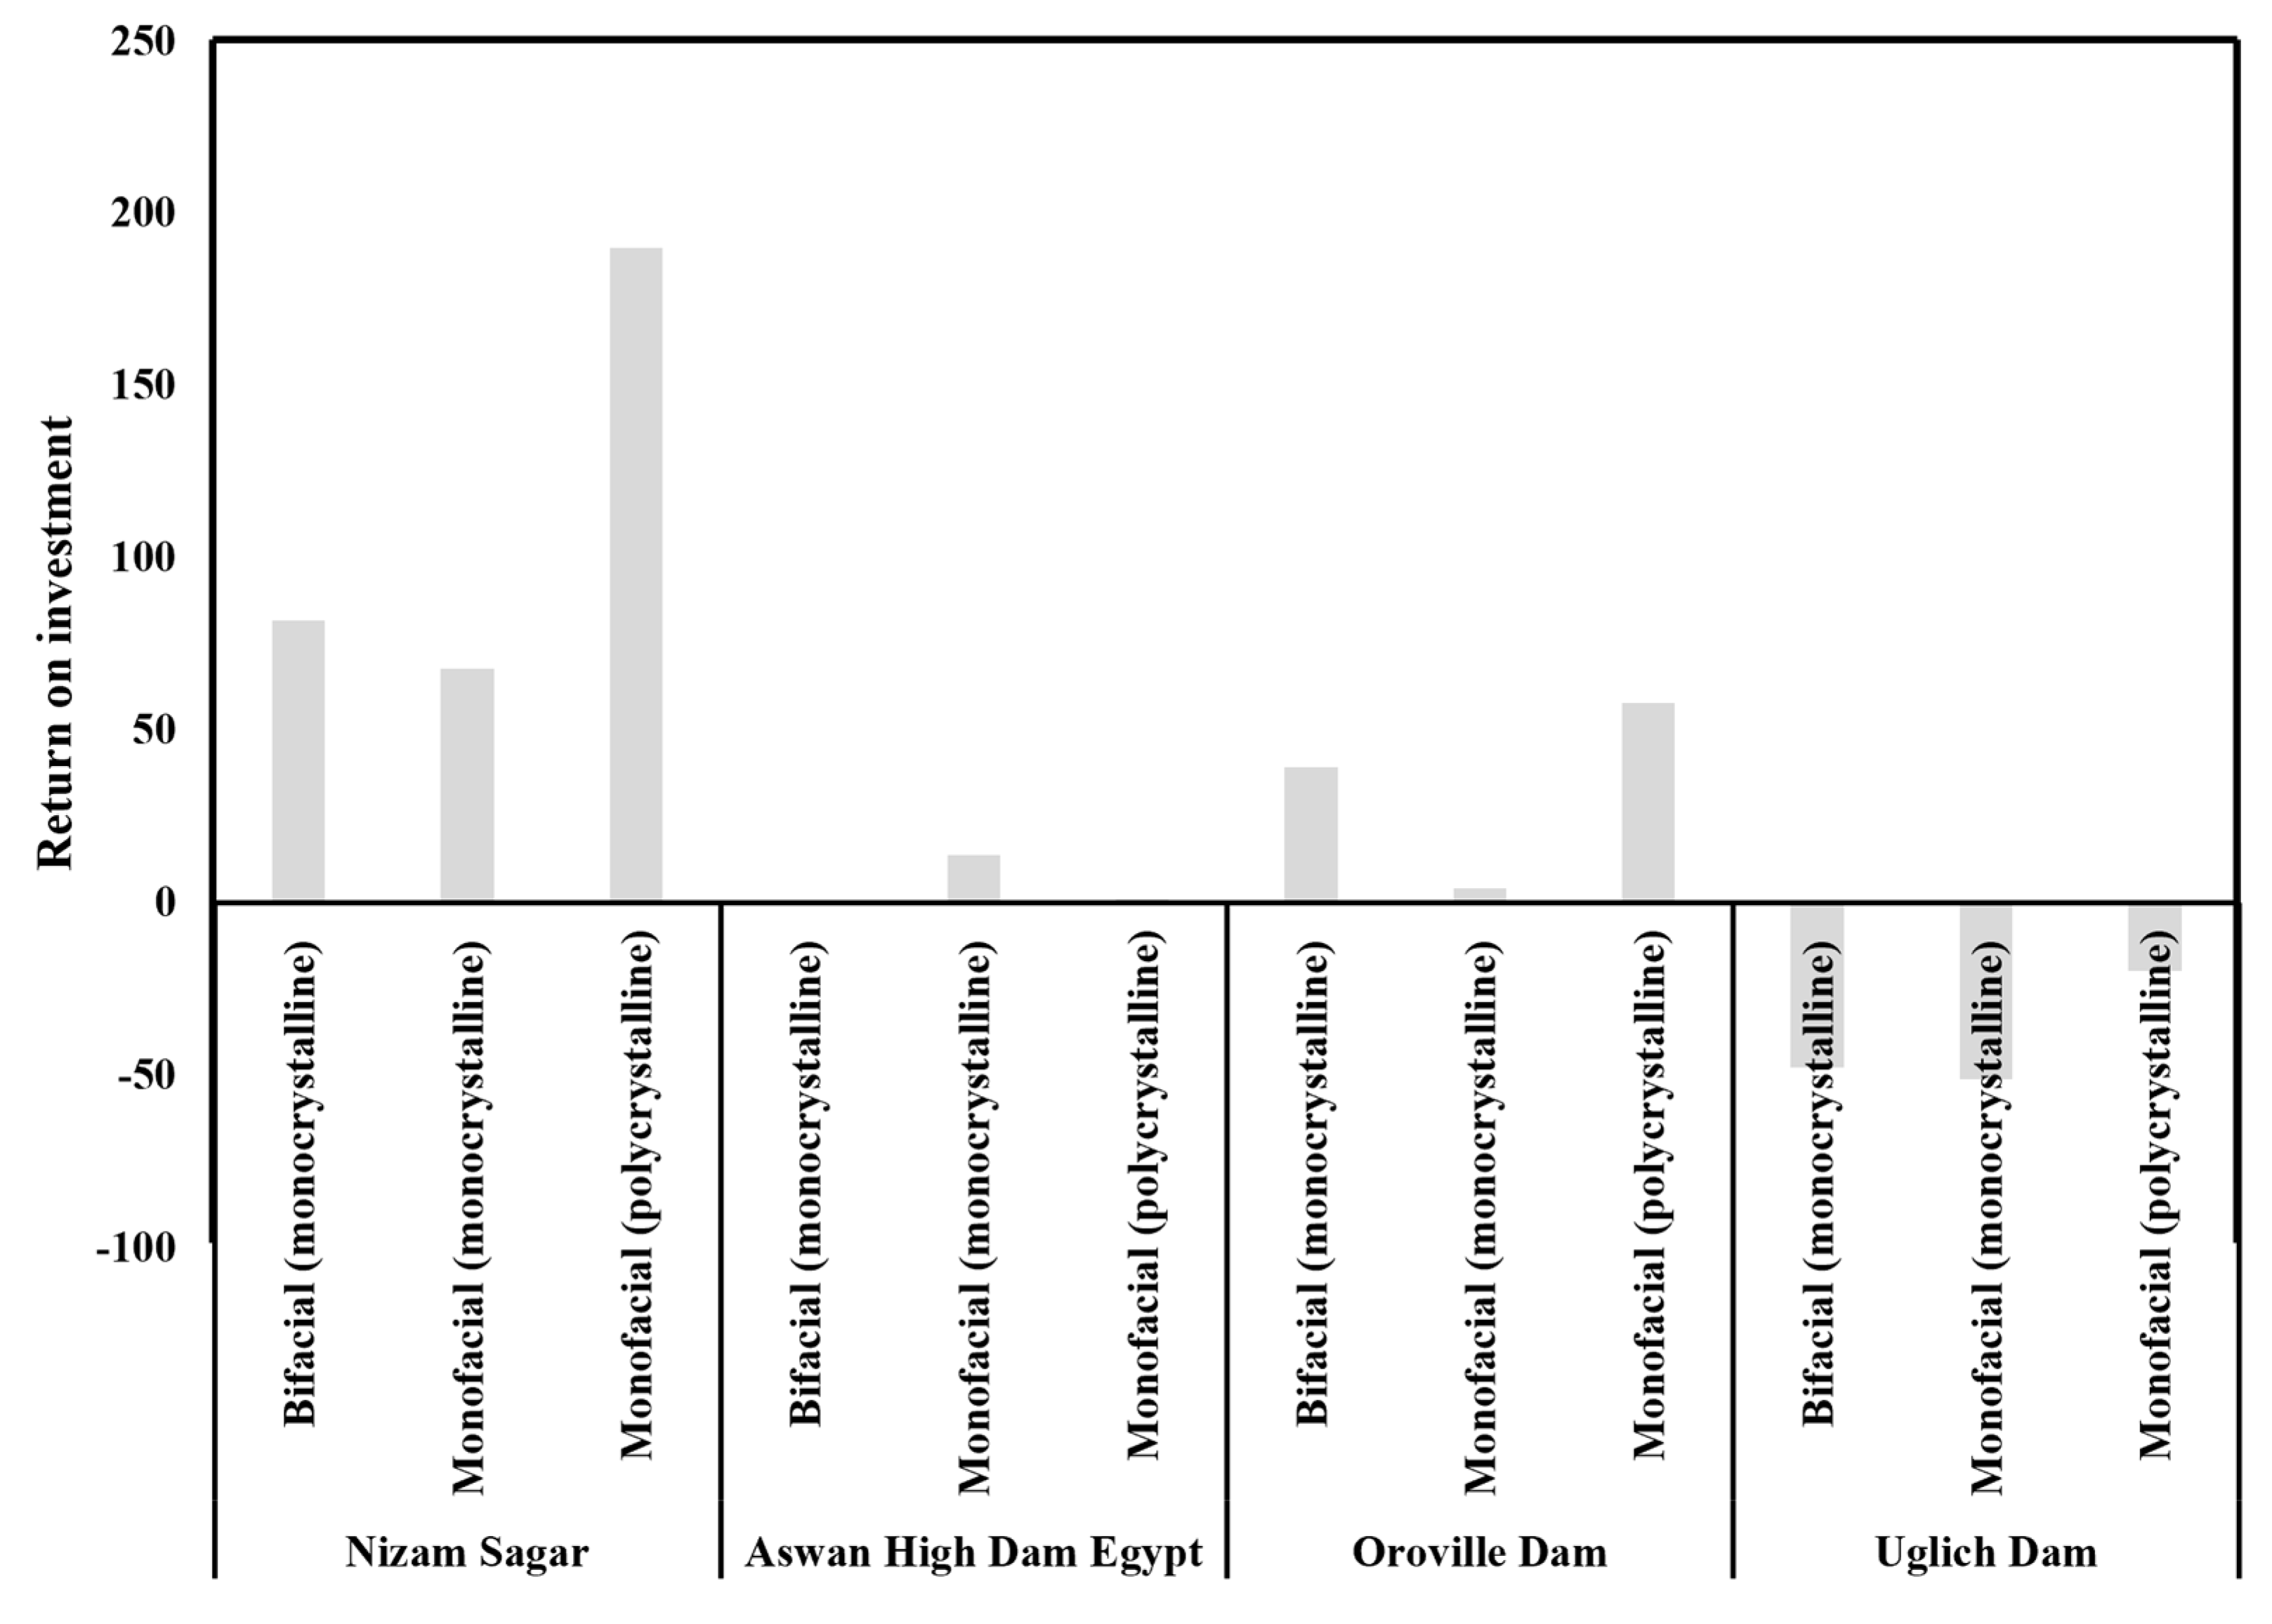
Figure 12 draws a picture of the return on investment for the different systems for varying Koppen climatic conditions. The graph represents the return on investment (ROI) for different types of solar panels (bifacial, monofacial, and polycrystalline) installed at various dam locations; the Köppen climate at each dam location plays a significant role in determining the ROI of these solar installations. In general, polycrystalline solar panels tend to show higher ROI compared to monofacial or bifacial panels across all dam locations due to the huge disparity in cost. For Nizam Sagar Dam, bifacial panels exhibit the highest ROI, which is consistent with the tropical climate, with its sunny summers creating ideal conditions for bifacial technology to excel with 81.7%. However, Uglich Dam has the worst performance with all the ROI values in negative, with polycrystalline giving the worst outcome at −51.2%. The vast difference between the bifacial and other systems suggests a higher energy yield, leading to a faster payback period and making it more economically viable when the cost of the modules is similar [137].
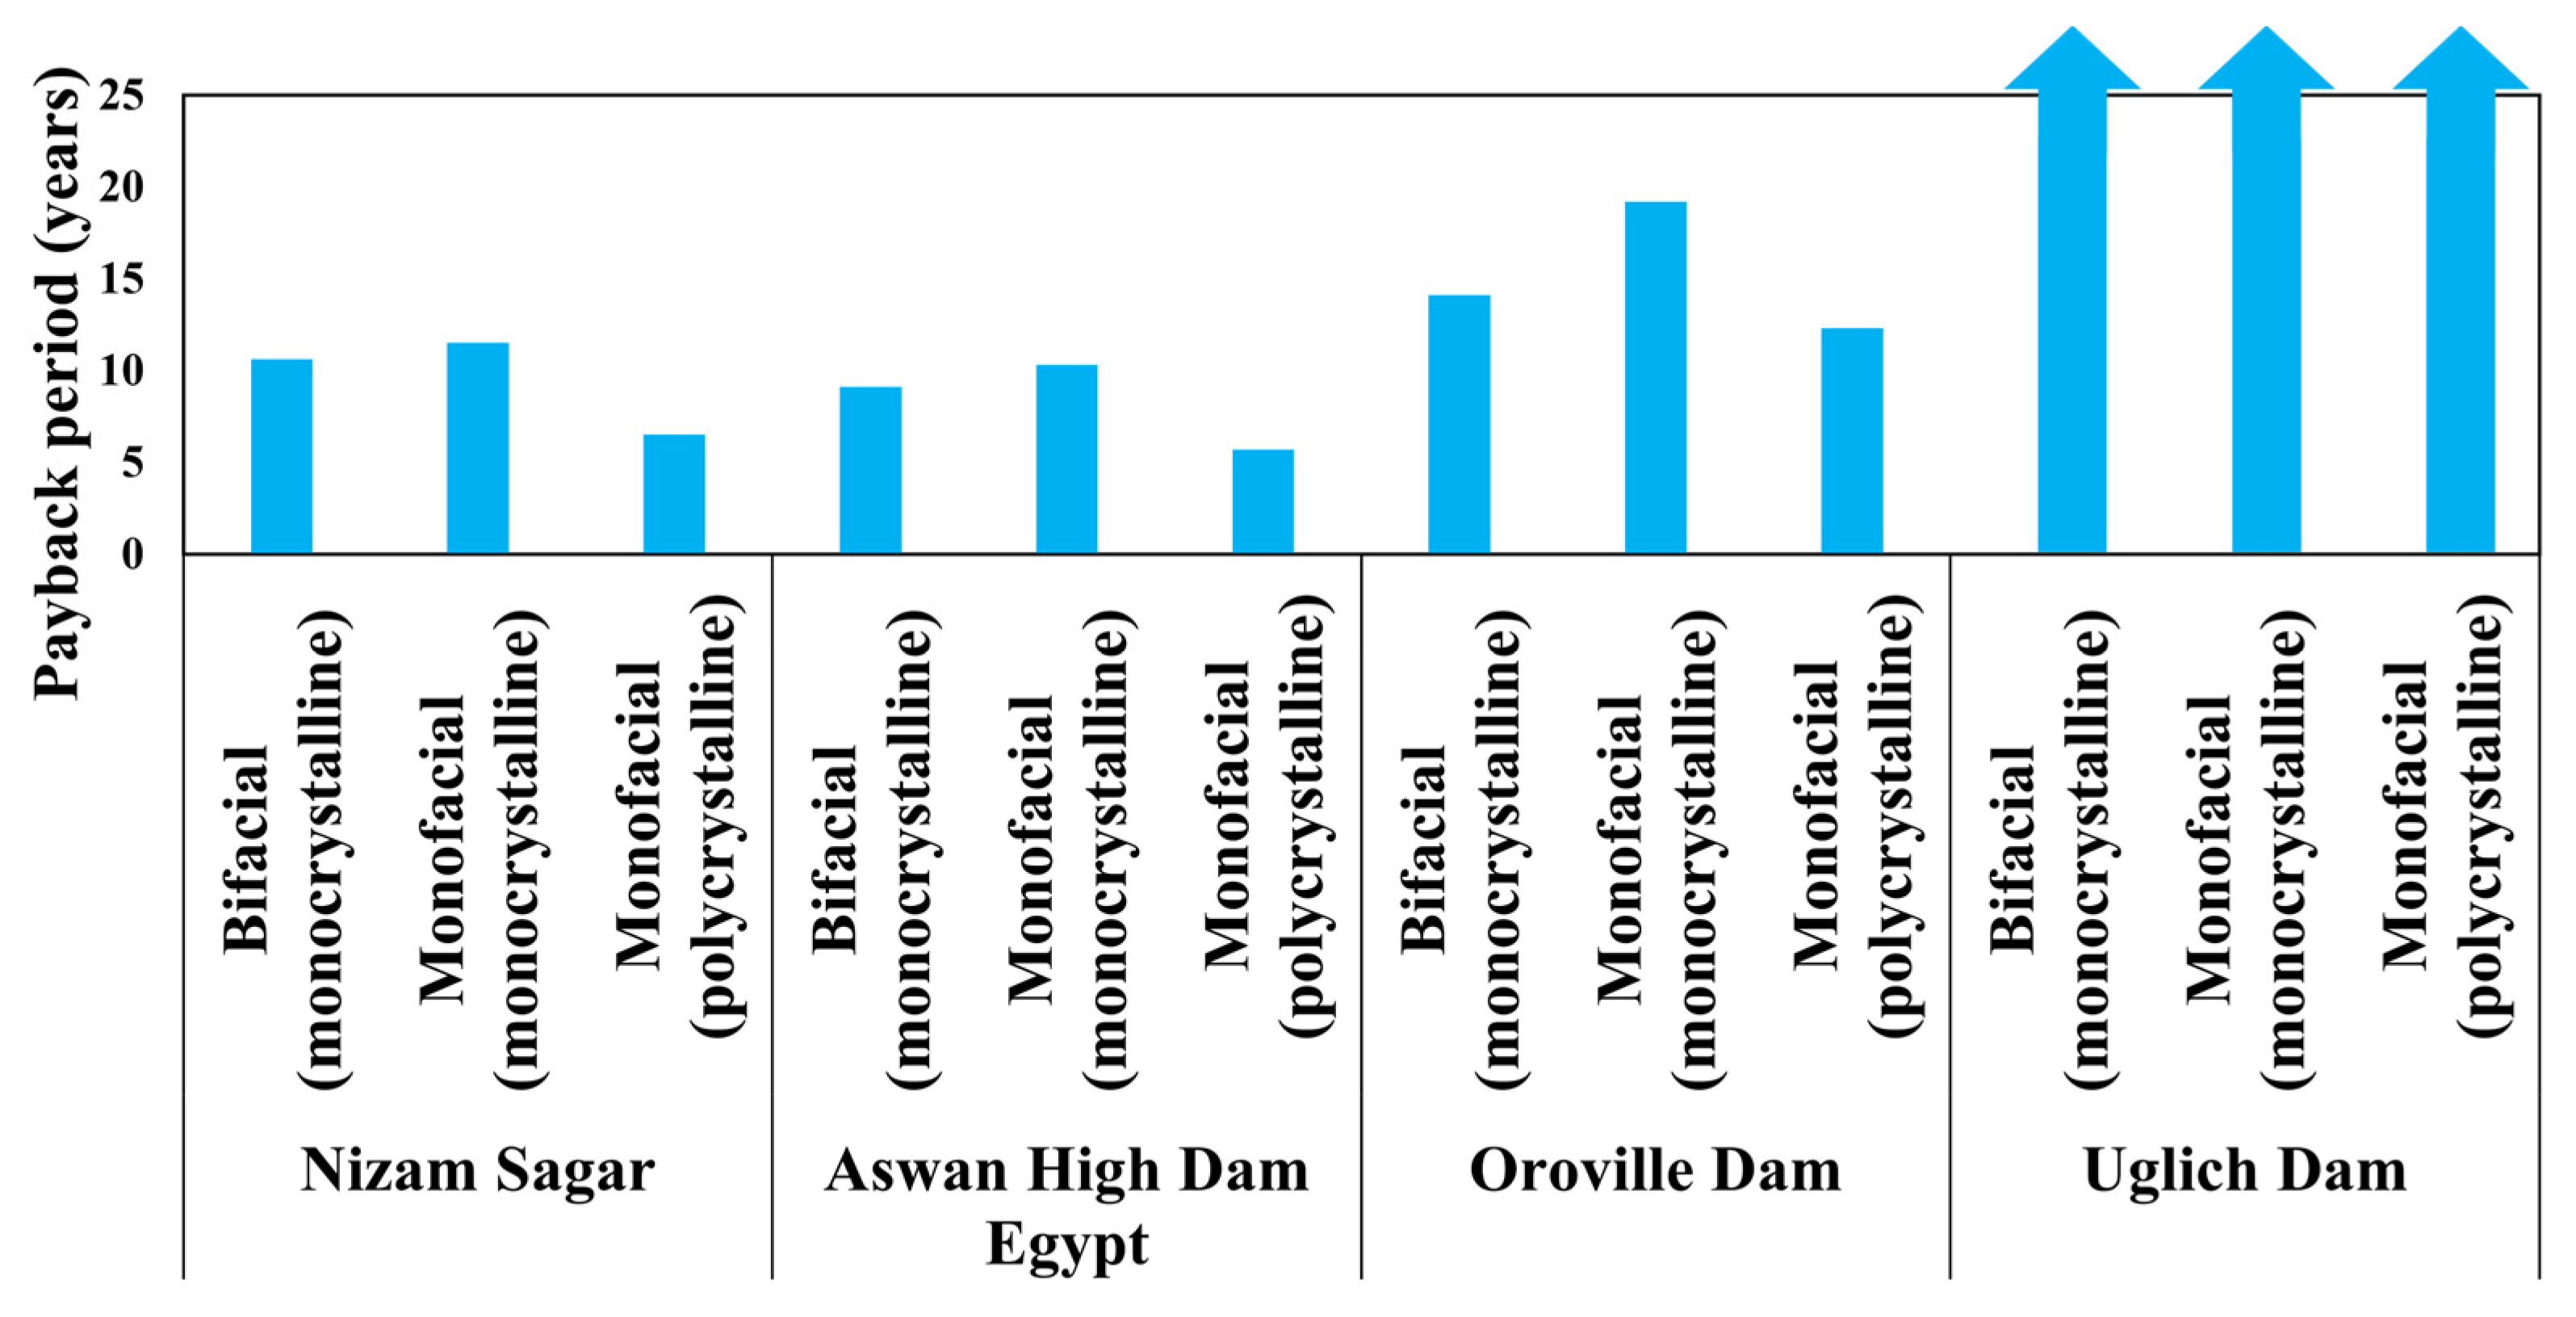
Figure 13 demonstrates the payback period for all the systems at different locations, where polycrystalline modules have significantly shorter payback periods compared to monocrystalline and bifacial modules, with 5.7 years being the minimum period amongst all the systems. This is due to the fact that the current price of the bifacial module is more than two times that of the monofacial polycrystalline modules, as in Table 4. This suggests that the return on investment will be faster for bifacial modules if the bifacial module price is similar to polycrystalline. Contrary to other places, Uglich Dam is not able to break even the investment even in 20 years which is represented with arrows indicating that payback period goes beyond 25 years; however, on further investigation, it was discovered that Uglich Dam has a payback period of 29.9 years for bifacial when the system was considered to have a 30-year project life, thus supporting the results of Frimannslund and the group that investigated the challenges of photovoltaics in Polar regions [138].
The results obtained for three different scenarios with details of each component within the system according to each location are detailed in Table 4. As is evident, hydrogen is produced by the electrolyzer during the daytime, so the amount of produced hydrogen is minimal during the early and late hours of the day, and it is zero during the nighttime. Therefore, during the hours of the day when there is little or no solar energy, hydrogen needs to be stored to meet the demand for hydrogen during these hours. The electrolyzer is the main energy consumer of this system and accounts for 86.6% of the total energy consumption of the entire system. It consumes 46.4 kWh to produce one kg of hydrogen.

3.3. Hydrogen Production

Figure 14 depicts the green hydrogen production for different locations using the electrolyzer, where it was observed that the bifacial module at Aswan High produced the highest amount of hydrogen due to high amounts of electricity produced, and the favorable conditions account for 292,817 kg/year. Whereas, the polycrystalline monofacial in the US had significantly low hydrogen production with 292,001 kg/year when compared to Egypt and India. Uglich Dam, though, produces less hydrogen as compared to India, but gives a decent production with its bifacial array accounting for 291,549 kg/year.
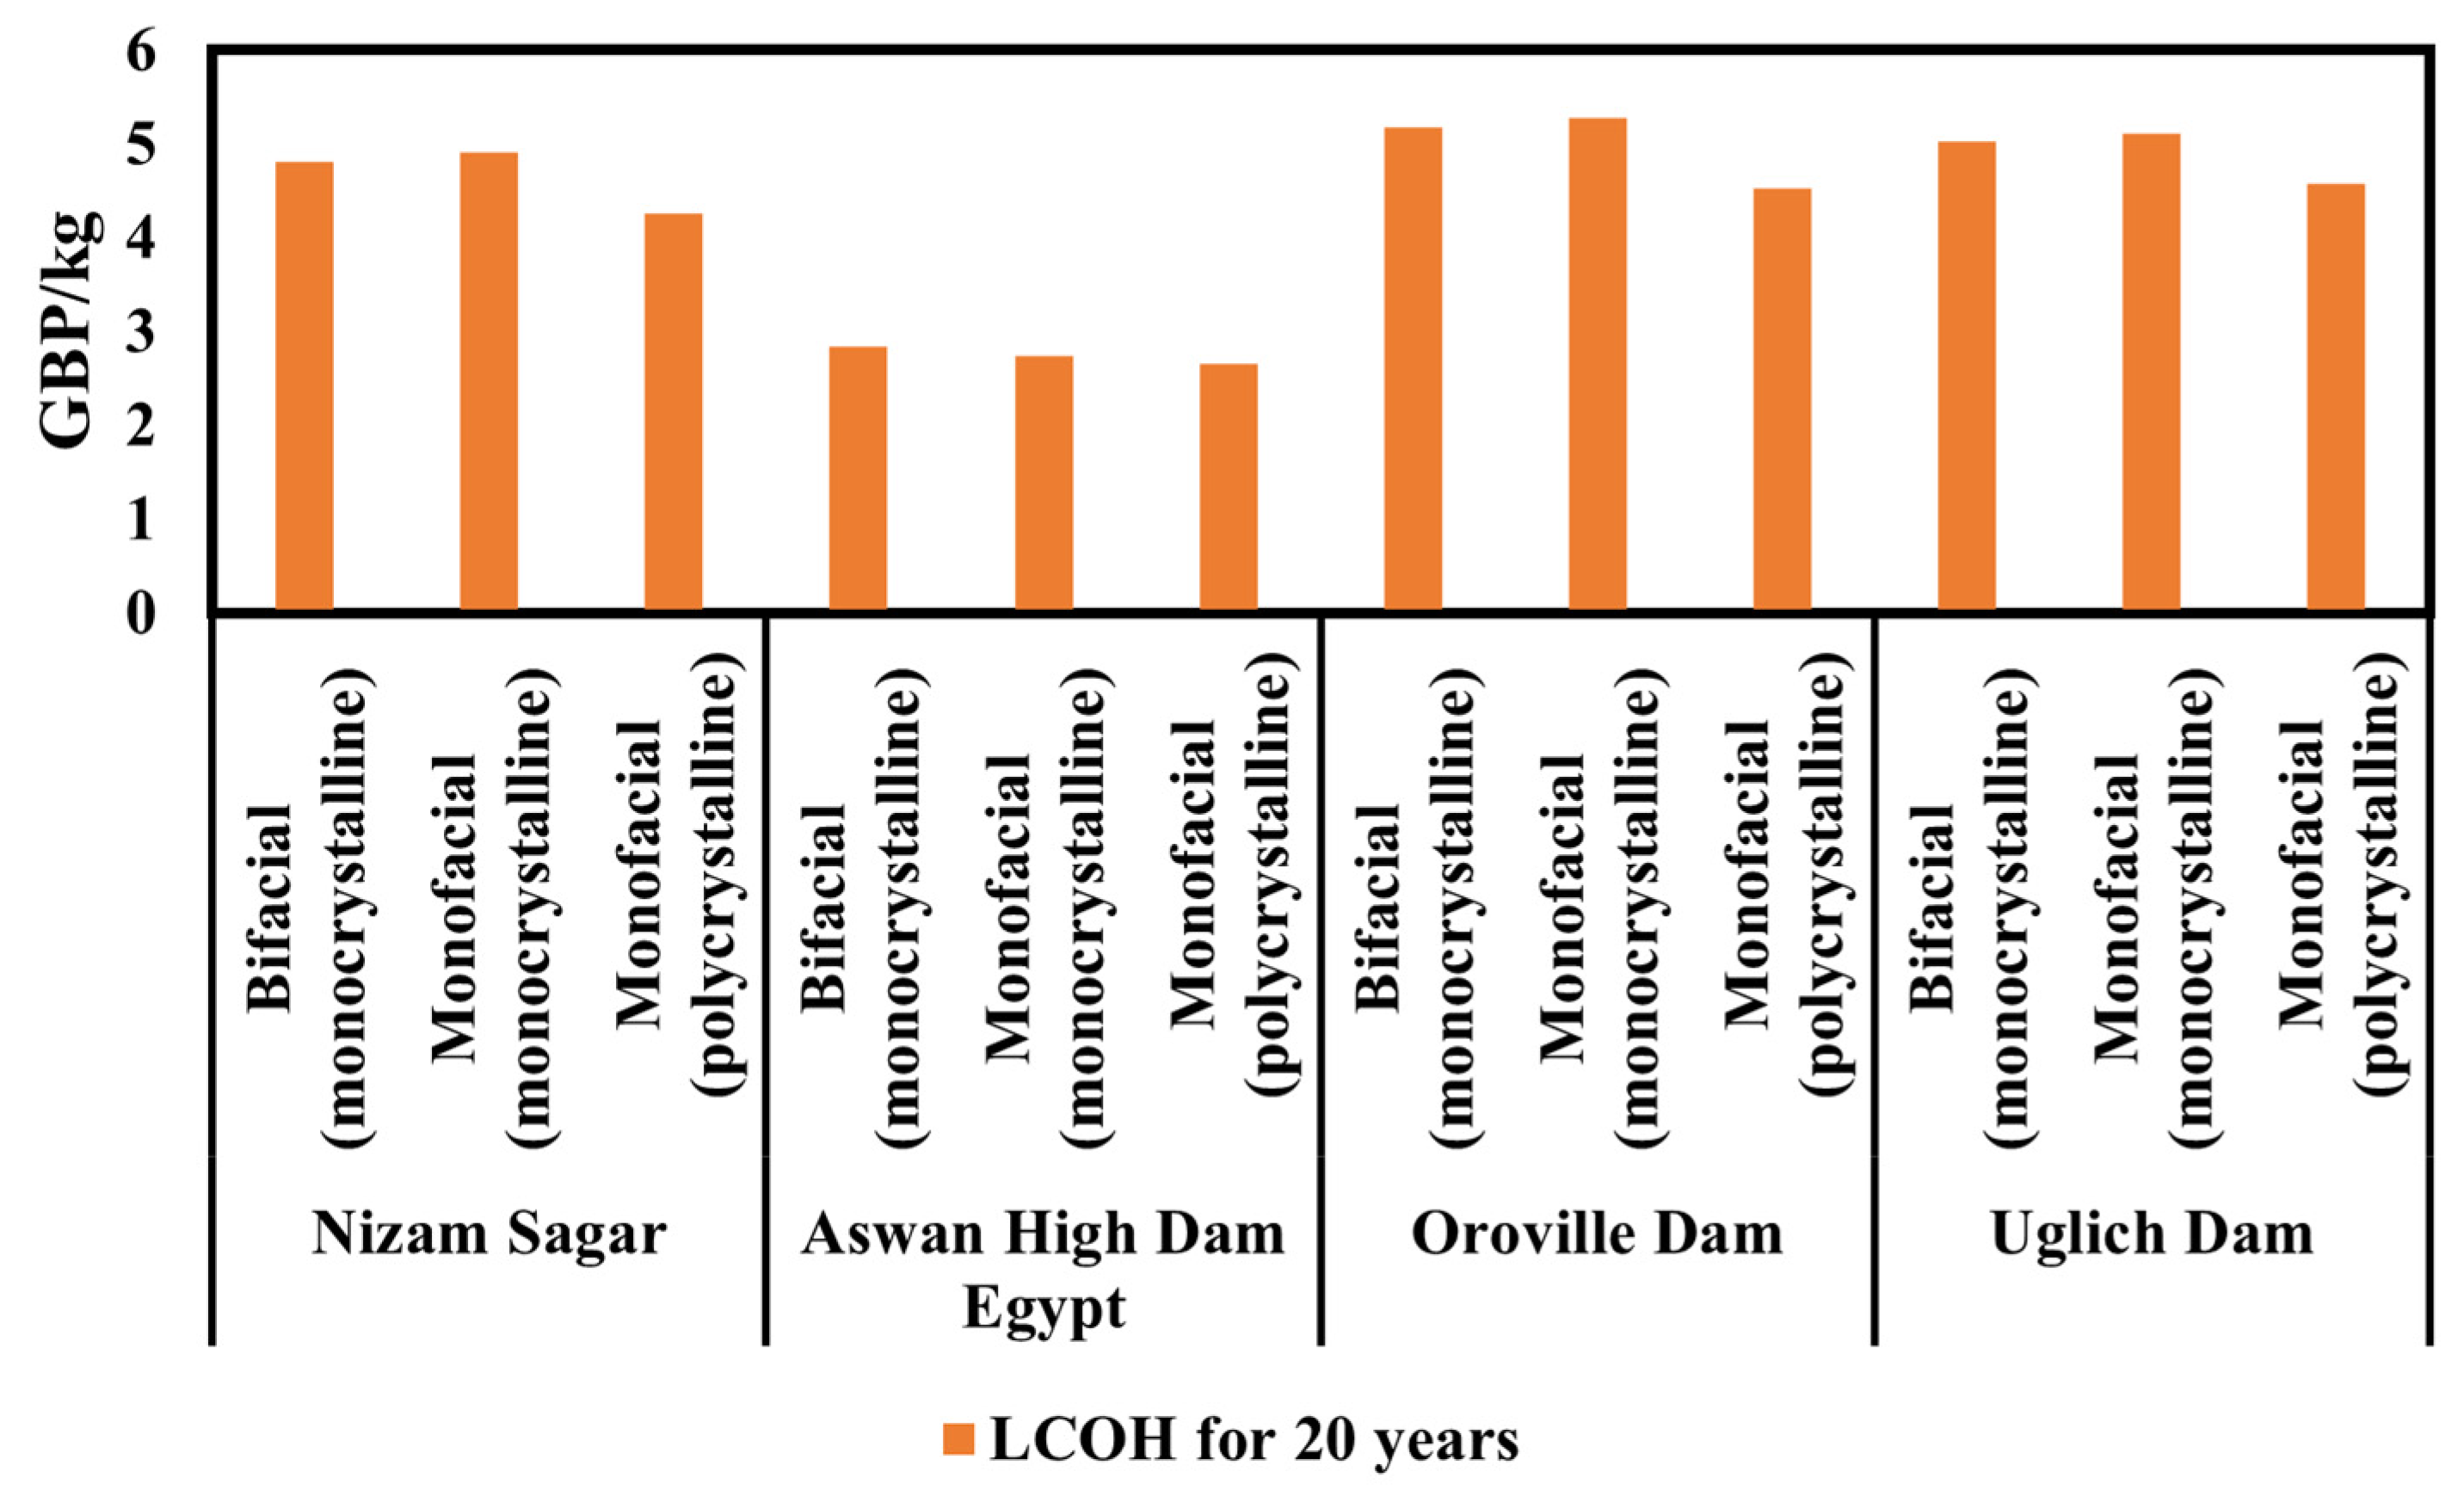
Figure 15 represents the levelized cost of hydrogen (LCOH) for different systems for the locations considered, where it can be concluded that the LCOH is lower when the project lifetime is considered for as 20 years. The levelized cost of hydrogen is generally lowest for bifacial systems, with Aswan High Dam having the lowest amongst these, with 2.66 GBP/kg. All locations have the highest LCOH for monocrystalline monofacial, with the highest value being 5.27 GBP/kg for a 20-year lifetime at Nizam Sagar Dam [139]. It is predicted that the LCOH is likely to fall from the current USD 4.5–6.5/kg to USD 2.5–4.0/kg, whereas there will be a 30–45% decrease in the CAPEX by 2030 compared with present capital expenditure [140,141].

3.4. Financial Reliance for Long-Term Assessment

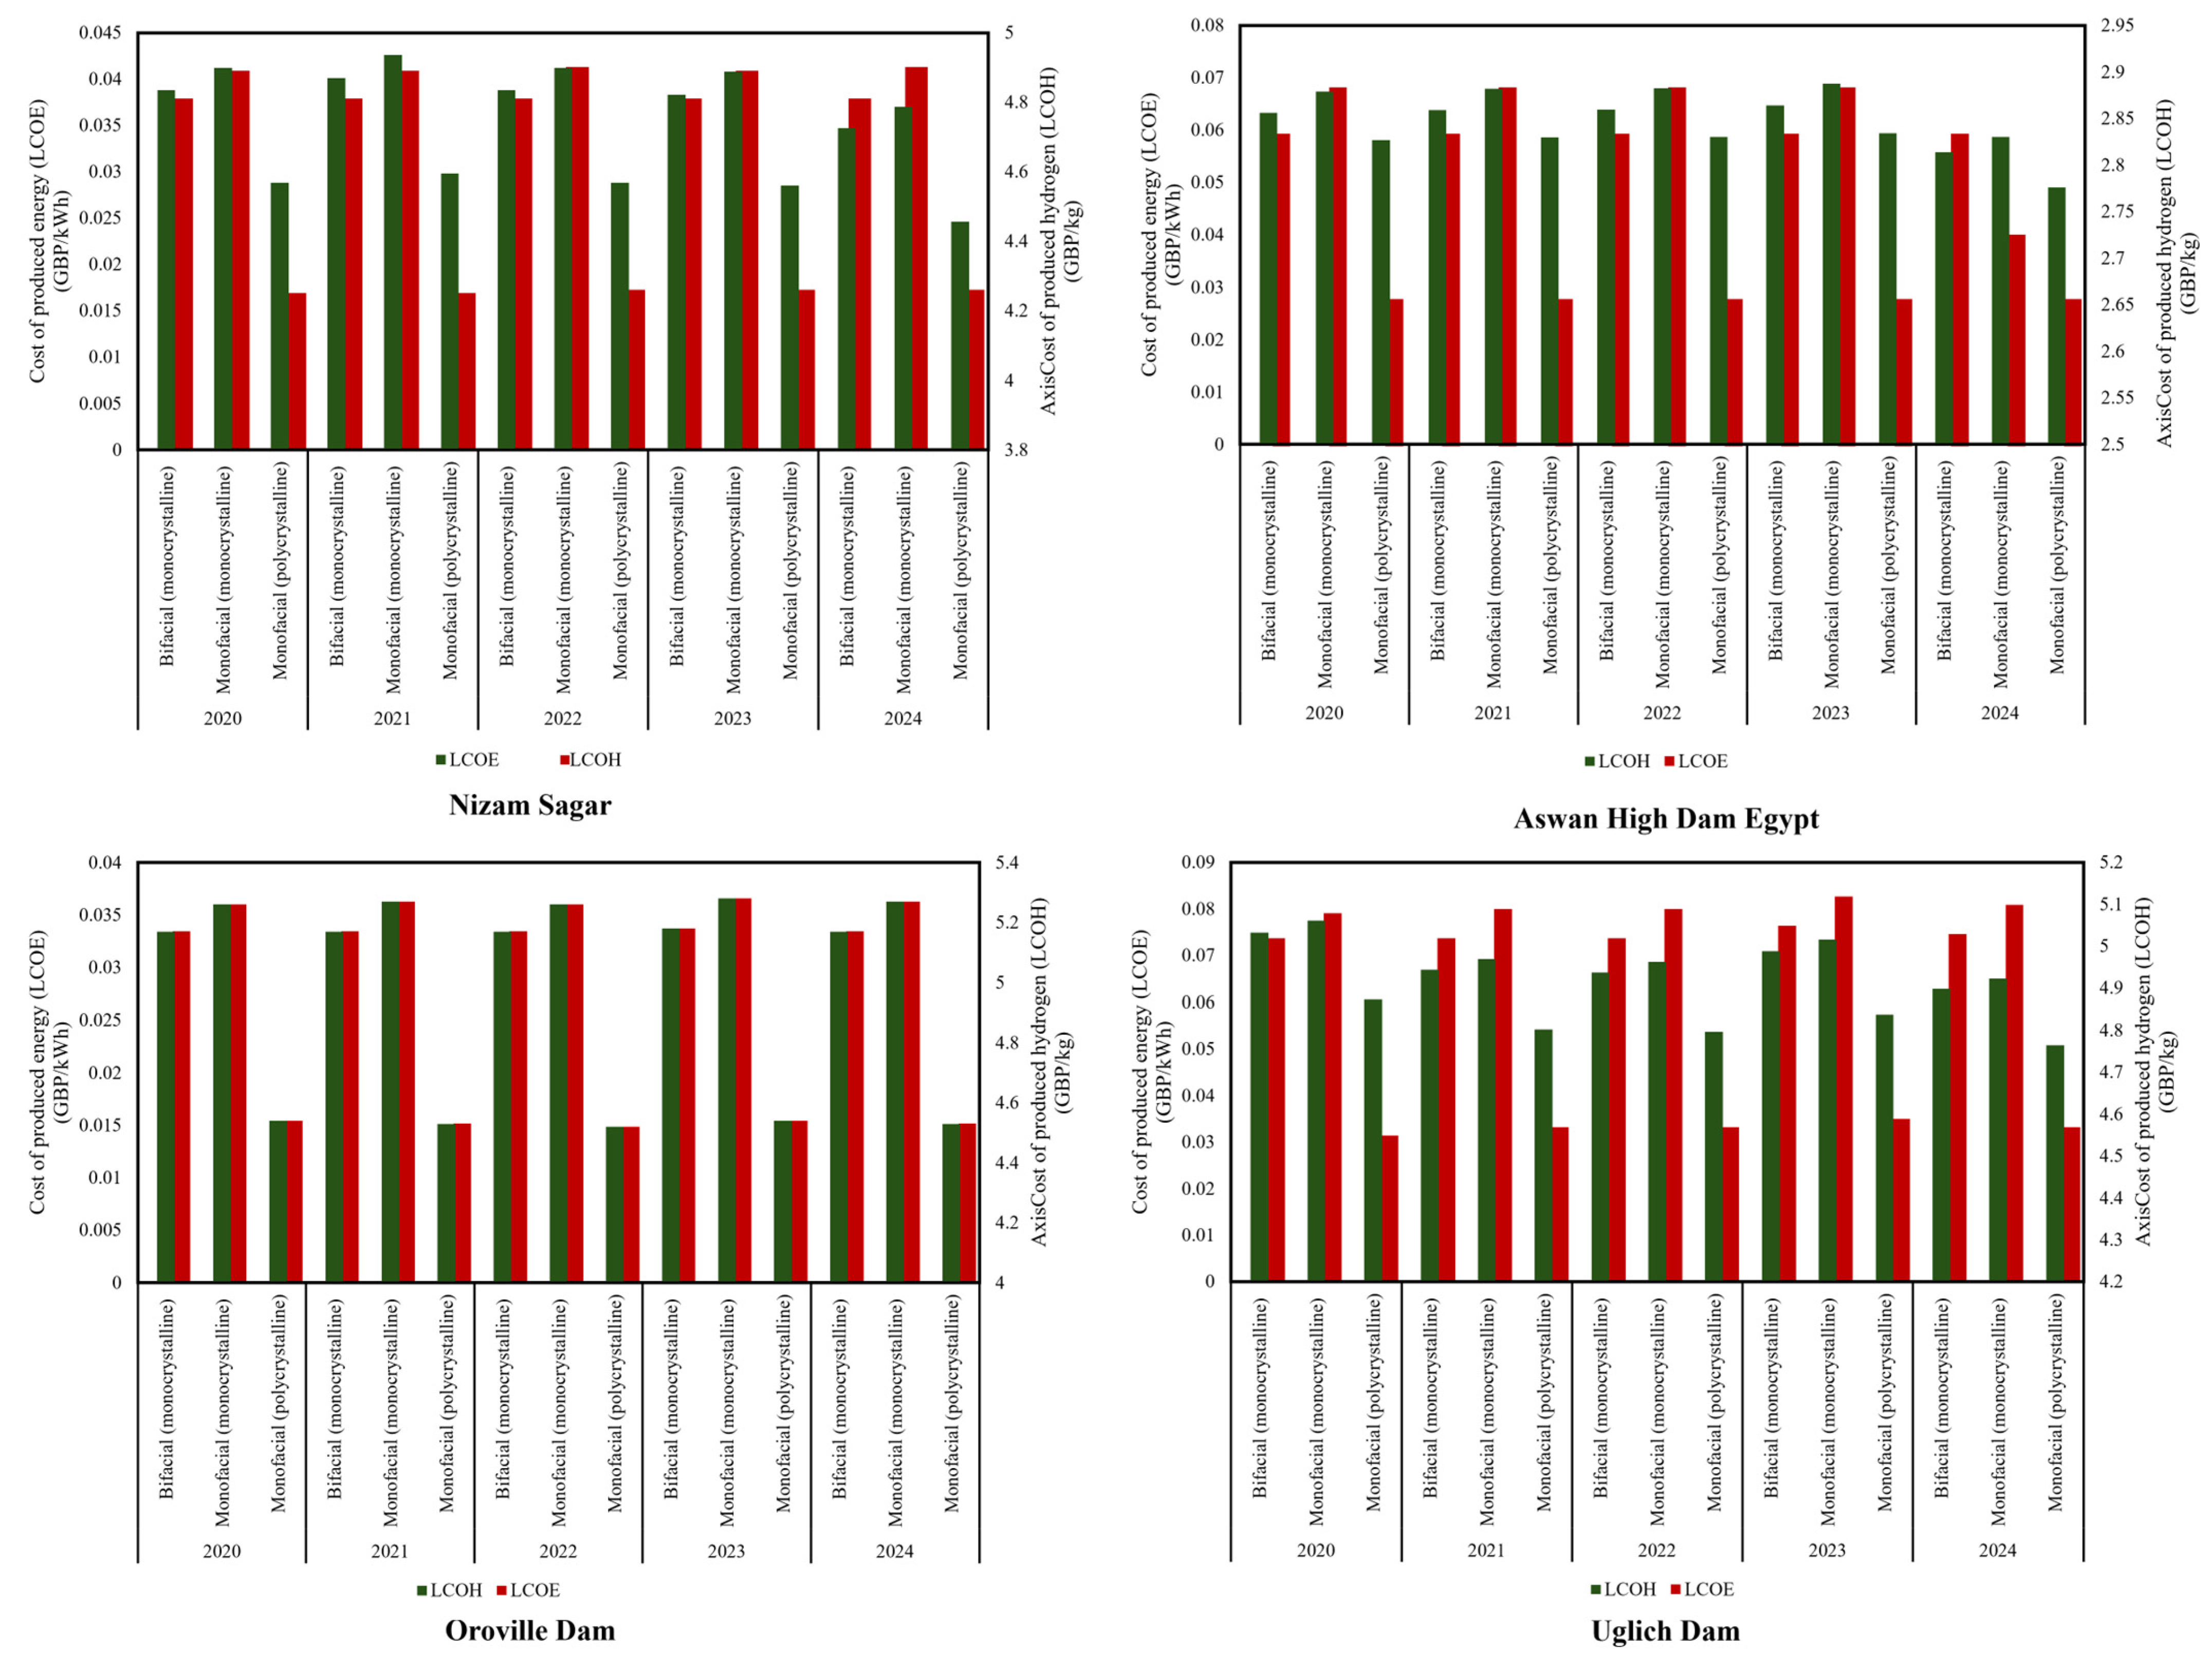
Figure 16 represents the LCOE and the LCOH estimated based on the meteorological data from 2020 to 2024. During this period, similar patterns were witnessed with monofacial (polycrystalline), with minimum levelized cost for both electricity and hydrogen, with less than 5% variation in the values of LCOE and LCOH for different years. This is because, though the meteorological data was for different years, the weather pattern in those regions remained the same. This indicates that there might be a slight variation in the irradiance and temperature, along with other parameters of a location in different years, but overall, it tends to give similar electrical output, as these changes are not significant, due to which the levelized cost did not fluctuate drastically. Simultaneously, Oroville Dam continued to have the lowest LCOE in 2020, indicating the year when the cost of produced electricity was lowest, reaching as low as GBP 0.0249/kWh for monofacial (polycrystalline). Whereas, LCOH was lowest for the Aswan High Dam, with the highest being GBP 2.89/kg. To evaluate sensitivity, several parameters were varied individually while holding others constant. The discount rate was considered at 2%, 4%, and 6%, while electrolyzer efficiency was assessed at 75%, 80%, and 85% [7]. The CAPEX was varied ±20% based on the report, indicating a 20% fall for every time the global capacity [142]. It was found that a change in discount rate and CAPEX affected the LCOH. In the case of the Aswan High Dam, 2% and 4% discount rates resulted in 24% and 12%, respectively, with respect to a 6% discount rate. A 20% reduction in CAPAX resulted in a 3% decrease in LCOH, whereas a 20% increase in CAPEX resulted in a 4.1% increase. A change in the electrolyzer efficiency to 80% resulted in a reduction of 57 kg/year, while 75% resulted in 114 kg/year.
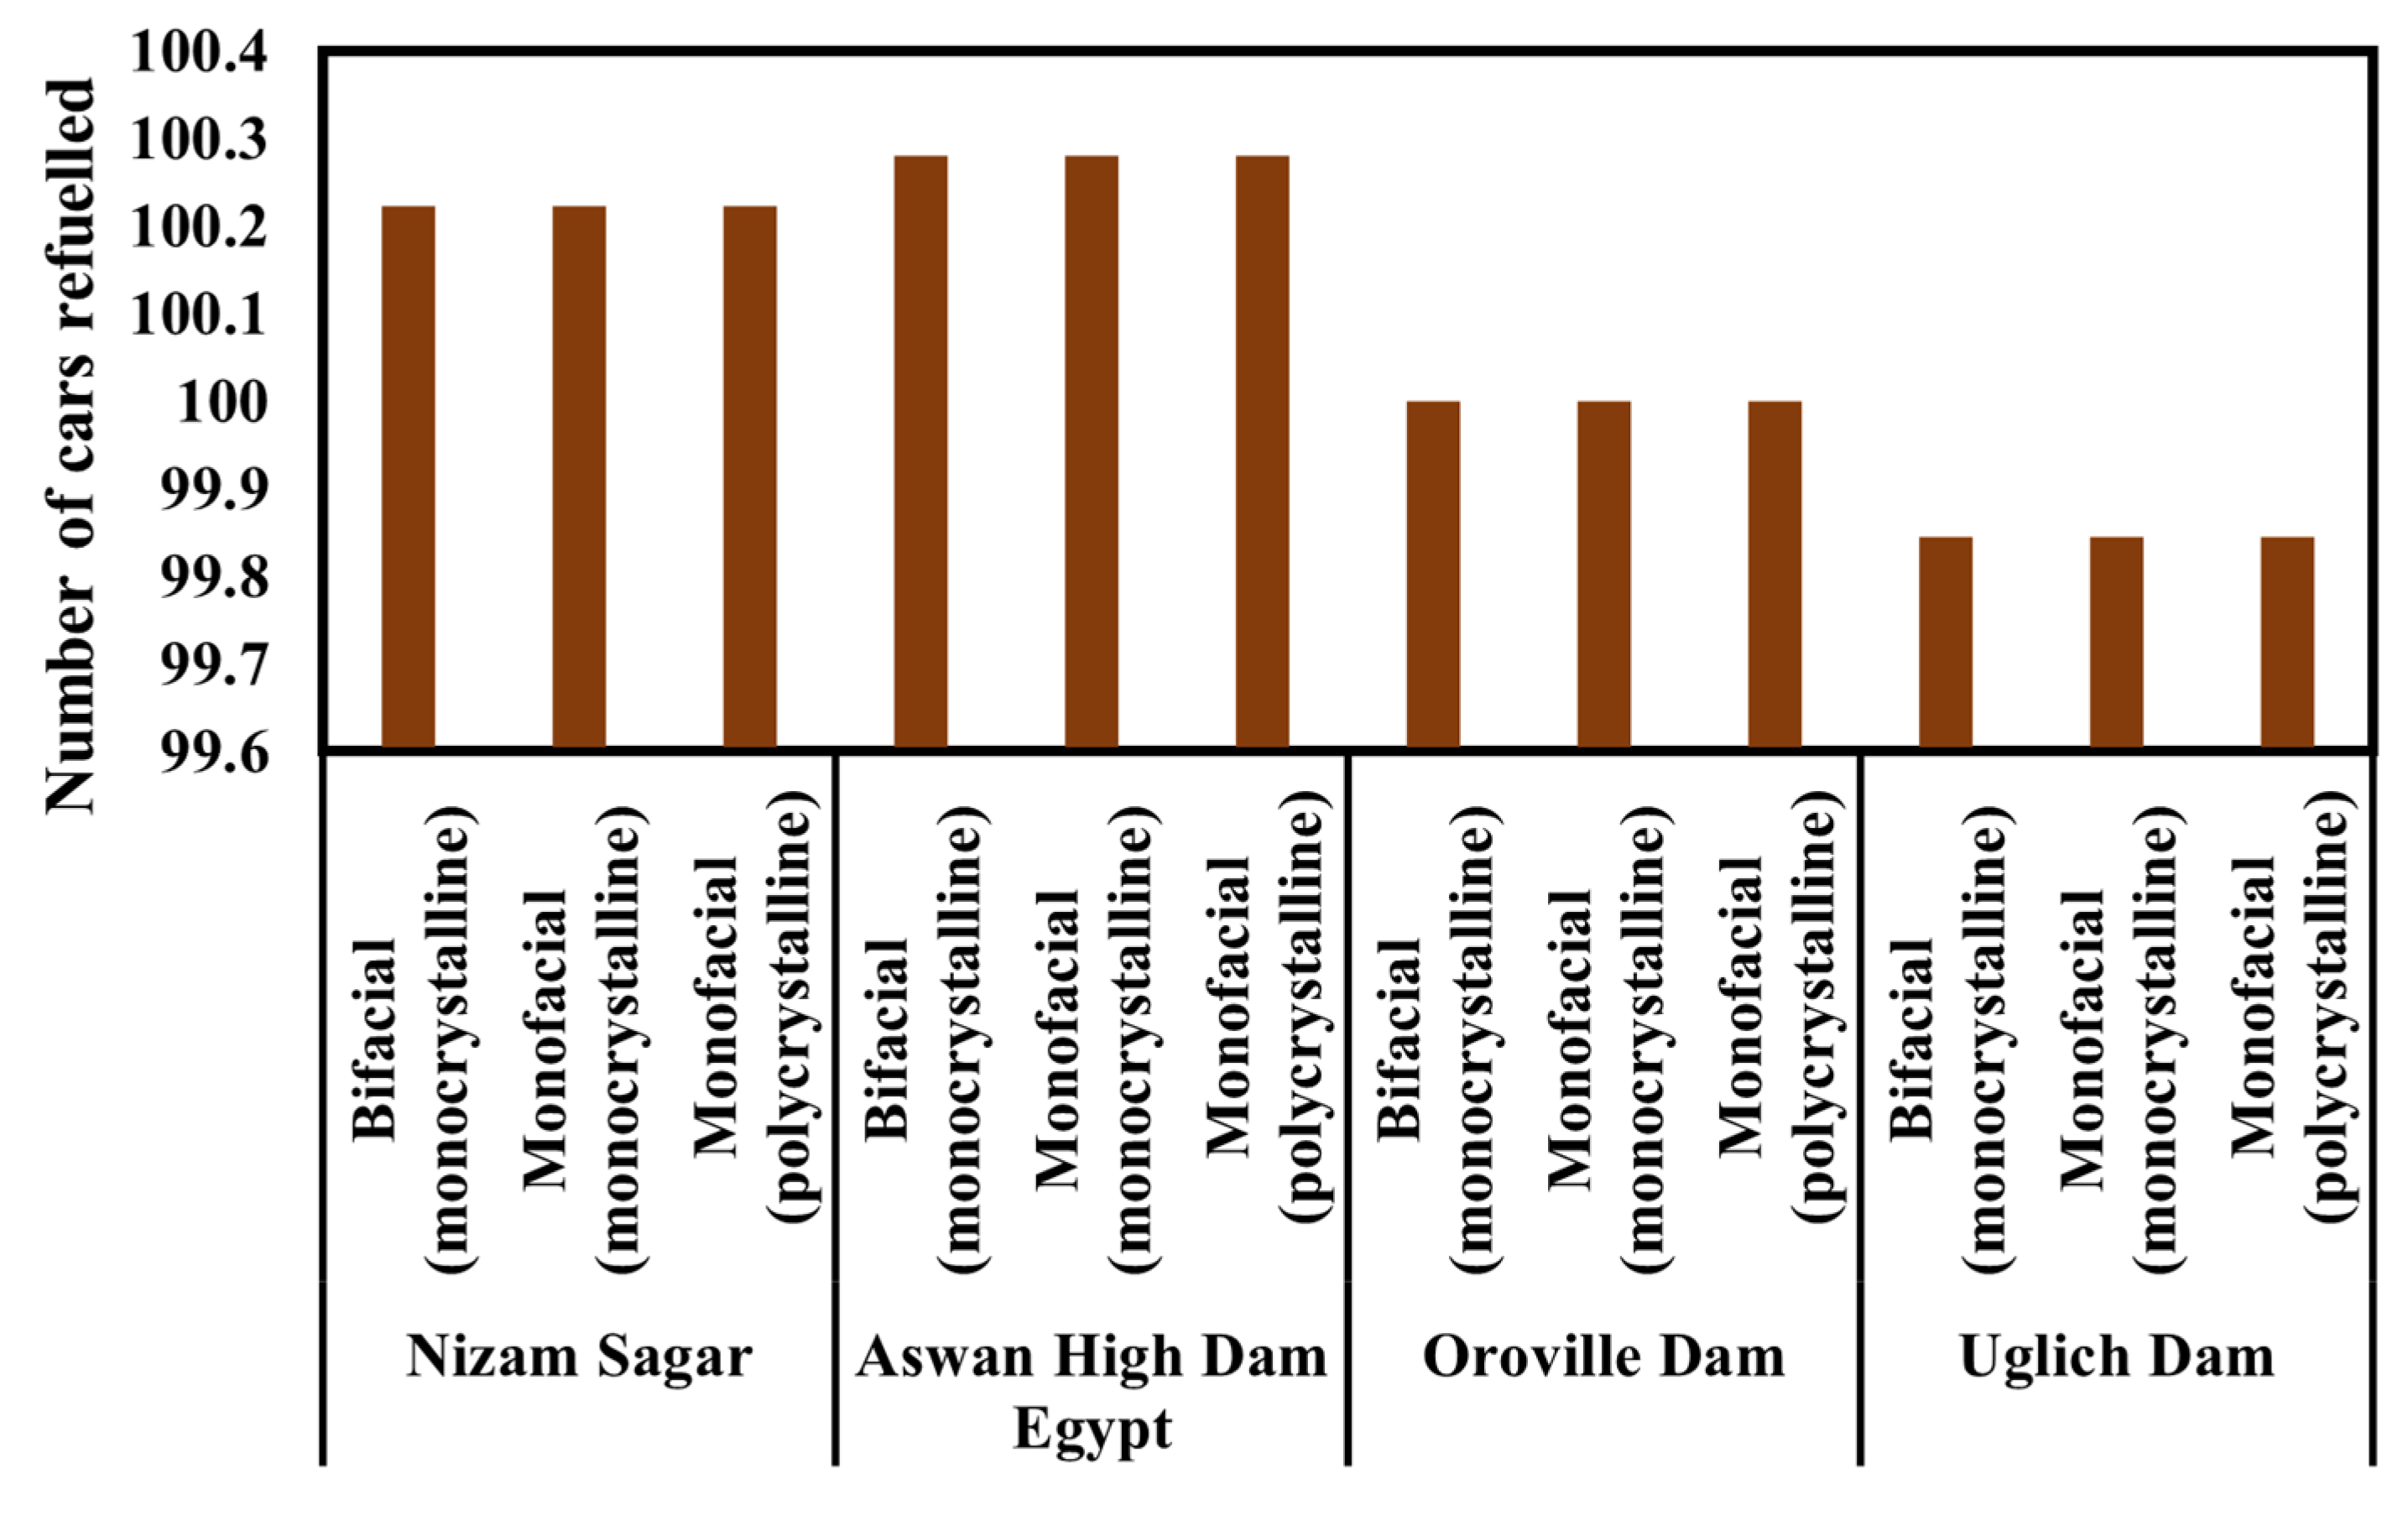
Figure 17 demonstrates the number of cars that can be refueled at different locations per day according to the amount of hydrogen produced, with Aswan High Dam’s location showing the most promising results, especially for the bifacial array at 100.2798. Not surprisingly, polycrystalline had the lowest number of vehicles that could be refueled.
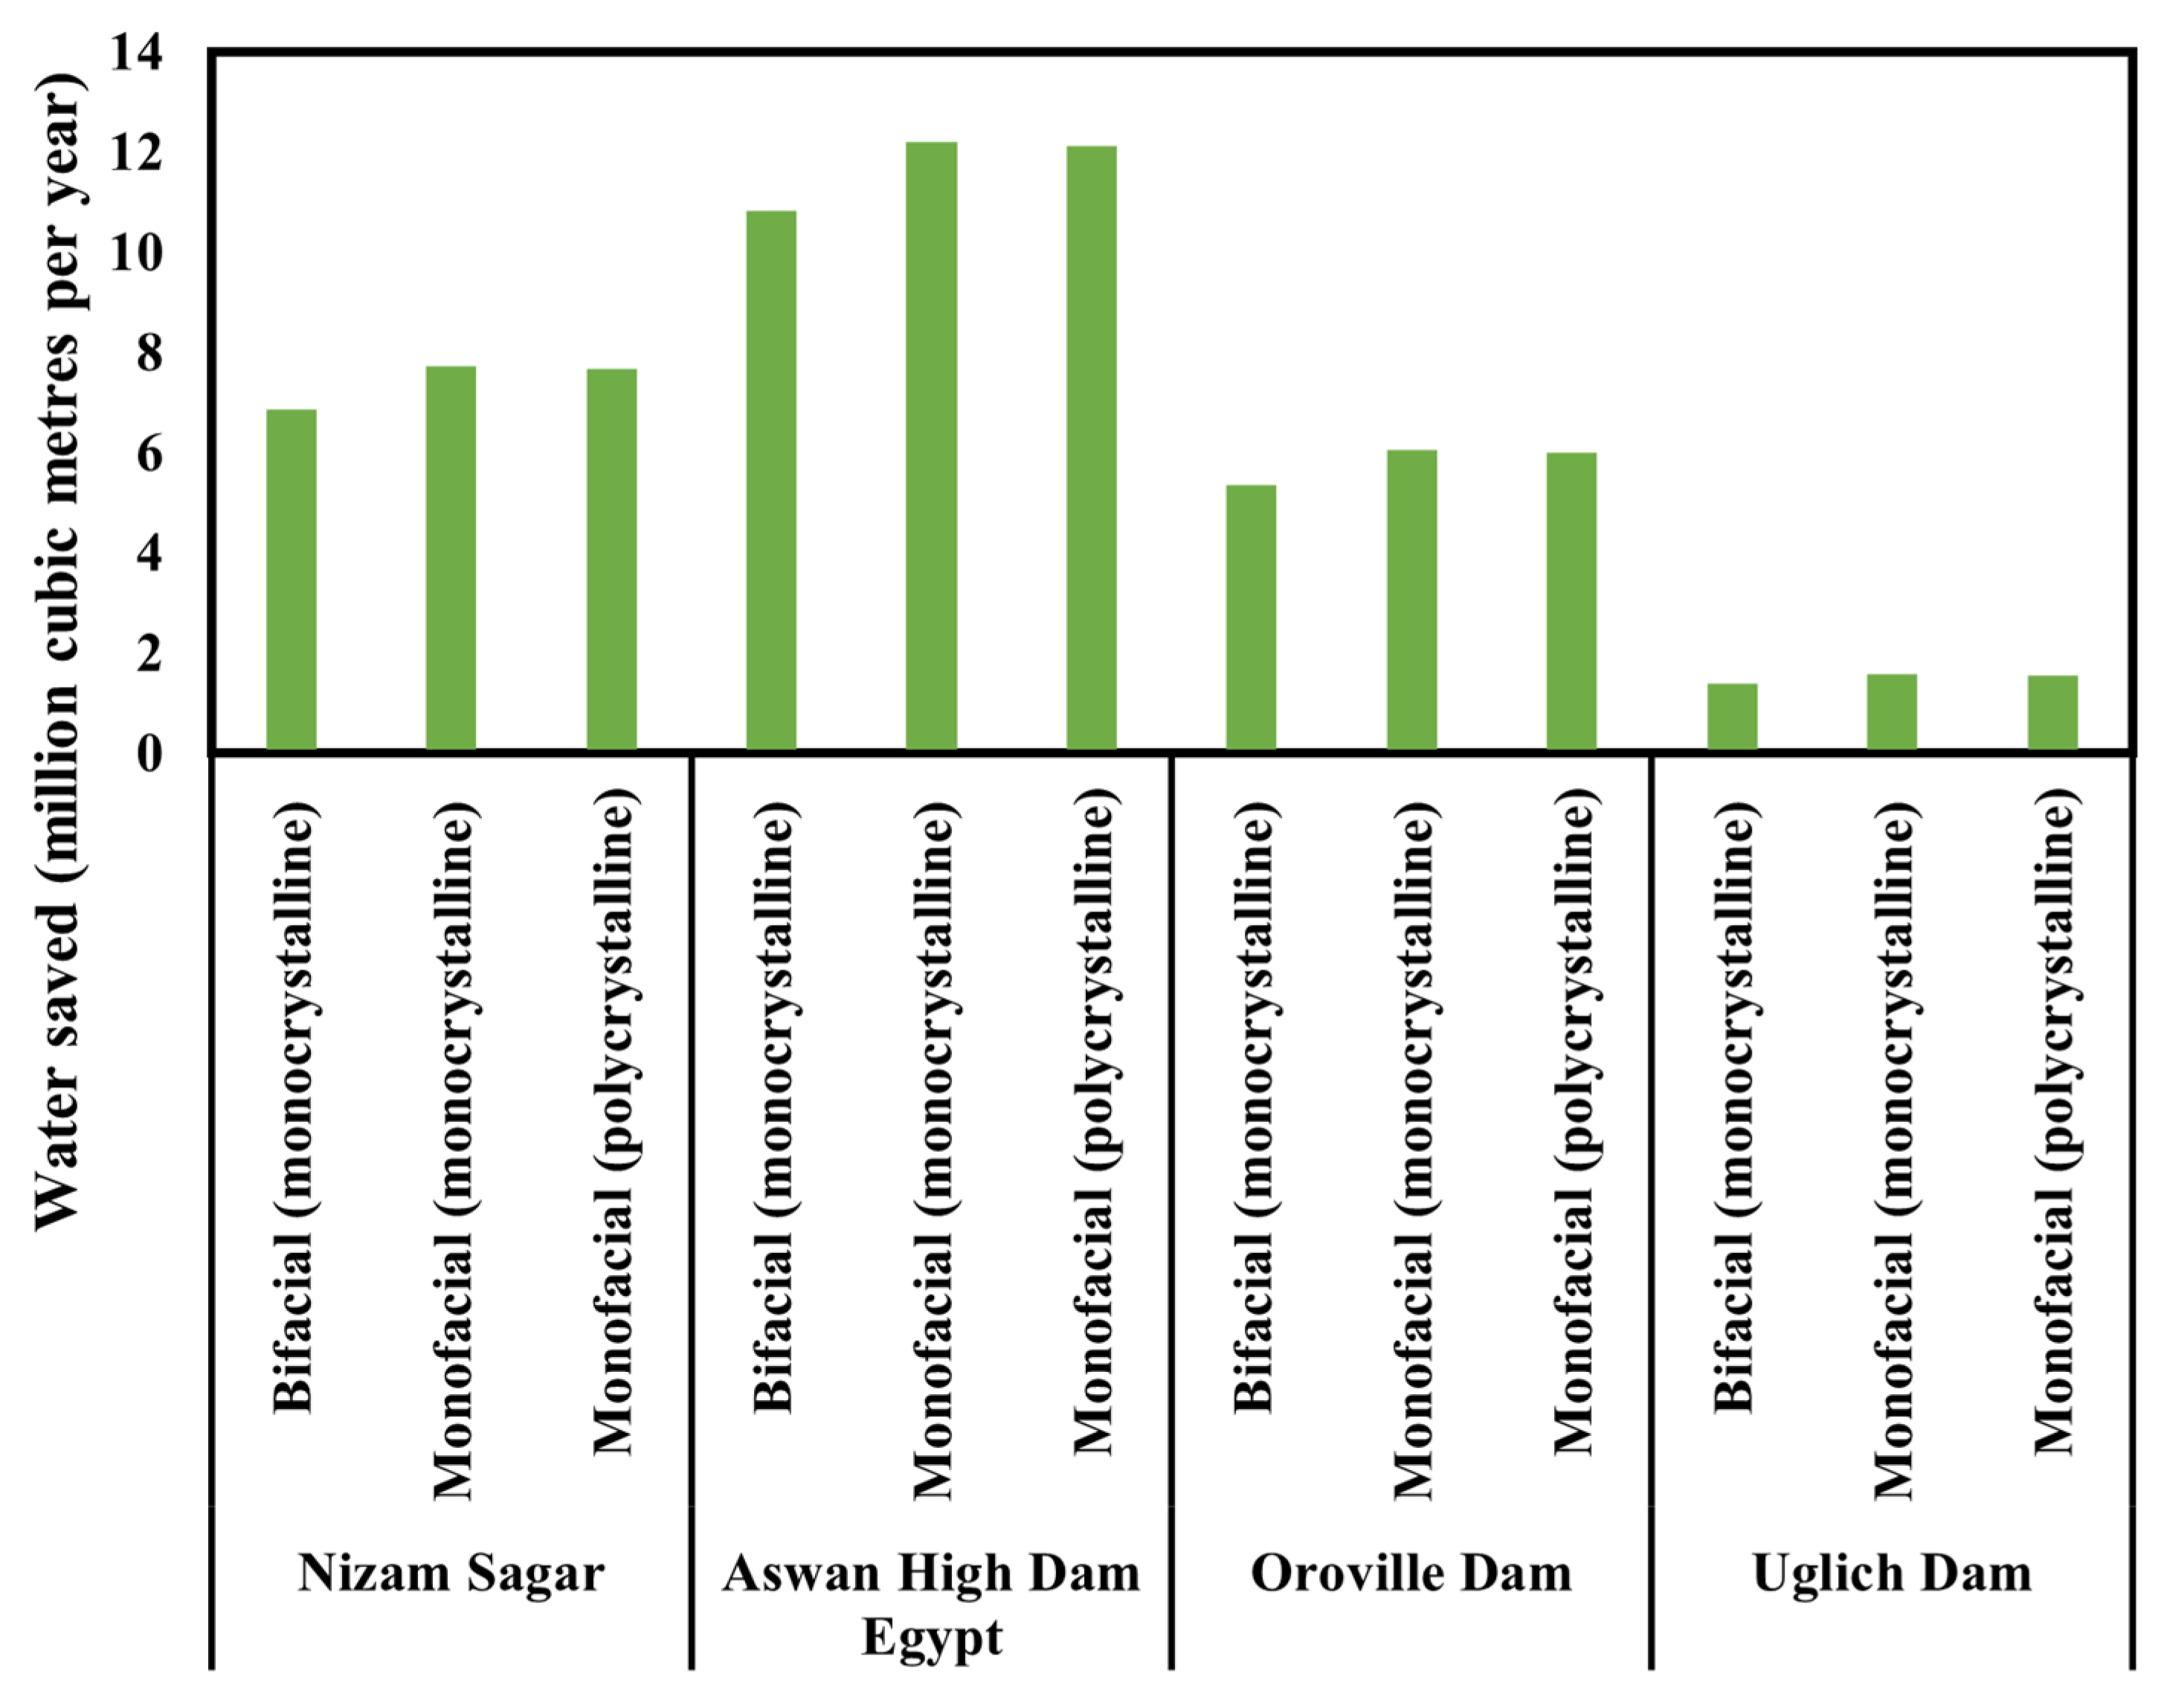
Figure 18 represents the water saved due to the presence of a floating photovoltaic system per year, with the Aswan High Dam location showing the most promising results, 12.20 million cubic meters per year with the monofacial (monocrystalline) system. Whereas, bifacial (monocrystalline) for Uglich Dam can save only 1.57 million cubic meters of water per year, considering the reduced evaporation at the location due to low temperature and solar radiation, contrary to the dry Koppen climate. Nizam Sagar Dam can save as much as 7.74 million cubic meters of water per year, while Oroville dam is able to save 6.05 million cubic meters per year. These correspond to the available research [143,144].

4. Discussion

The above proposed system gives a clear picture of the feasibility of this technology for almost all the Koppen climates, suggesting a mild temperate climate as the optimal choice due to environmental favorability leading to enhanced system efficiency. Though a tropical and dry climate also has reasonable economic feasibility, a snow climate does not depict much favorability. This system not just caters to the requirement of clean green hydrogen but also addresses several UN sustainability goals, including SDG 7 (affordable and clean energy), SDG 9 (industry, innovation, and infrastructure), SDG 13 (climate action), and SDG 15 (life on land).
For every technology, the impact on the environment is an important aspect without which the assessment cannot be completed. The FPV provides a shield for the waterbodies, protecting them from the exposure of direct solar radiation. This reduces the increase in temperature of the water surface; as a result, a decrease in the evaporation rate has been observed. This is beneficial for places facing water scarcity, especially during the summer months. The intensity of photosynthesis in the aquatic environment has been impacted, reducing the algae bloom and improving the water quality index [145].
Different floating projects have been launched in the last few years; however, the projects integrating hydrogen and floating PV are yet to find their momentum. SolarDuck (Rotterdam, Netherlands), with the support of RWE in the Netherlands, is on the path to integrating floating PV and hydrogen, along with floating wind turbines in the North Sea, in a pilot project to advance the hydrogen economy [146]. Sinopac (Beijing, China) is attempting to explore the benefit of on-site solar energy to reduce the transmission cost of electricity while using open water and free space on water bodies for the production of hydrogen with 23 MW floating PV to support a green hydrogen system in Qingdao refinery in China [147]. Simultaneously, Repsol in Madrid, Spain, also announced a EUR 4.5 million pilot project to be developed to produce hydrogen with FPV, which was supposed to be completed by the end of 2023 [148]. These pilot projects highlight the changing trend of integrating FPV with hydrogen production along with other renewable energies to produce green hydrogen due to its economic efficiency and environmental impact for a sustainable future. There is a significant possibility of integrating this technology not just with solar and wind, but also with tidal energy to produce green hydrogen, which can, in the future, make production even more economically efficient. However, there are limitations due to current technologies, especially in the deployment of FPV when it comes to water bodies experiencing high currents, changes in the degradation of the system over time, and integrating the system into the grid. Projects like the one in the North Sea are a model of the ongoing research to overcome such limitations and integrate different technologies.

5. Conclusions

The global rise in energy demand, the economic conditions in nations, and environmental challenges pave the way for generating electricity differently from the traditional method. The world is struggling to meet the escalating annual consumption and is compelled to meet the energy needs through solar power. Given the widespread support for installing large-scale PV plants to accelerate urbanization growth, floating photovoltaic technology offers a suitable alternative for generating clean energy sustainably.
For a better understanding, a 10 MW floating photovoltaic system was designed and simulated for various dam locations under different Köppen climate conditions, and a techno-economic analysis was conducted. It was observed that the temperate and dry zones have huge potential to generate electricity from floating photovoltaics; even though the soiling percentage is higher than in other regions, the output is still substantial. The designed floating photovoltaic requires 51,895 m2 of land, which requires a huge capital and can be a challenge in some countries. However, the water body eliminates this cost and provides additional benefits such as cooling. On average, the payback period is around 11.98 years for bifacial and 13.66 years for monofacial monocrystalline systems for the first three regions. Whereas, the highest amount of electricity was generated from the Aswan High Dam site, accounting for 18,829,587 kWh with bifacial modules, thus suggesting that a dry climate is the most suitable for photovoltaic electricity generation, while a continental climate resulted in being unfeasible, with the highest payback period of over 25 years. In terms of hydrogen production, the Nizam Sagar Dam location showed better results with the bifacial system refueling over 100.22 cars per day. Simultaneously, the floating photovoltaic helps in the conservation of water and land, reducing water evaporation by up to 12.2 million cubic meters per year and algae bloom, hence enhancing the water quality and conserving ecological equilibrium. The integration of FPV with a hydropower plant will increase power generation, confirming the excessive potential for electricity generation and balancing ecosystems while addressing SDG 7, SDG 9, SDG 13, and SDG 15.

Author Contributions

Conceptualization, S.N.H. and A.G.; methodology, S.N.H. and A.G.; software, S.N.H. and A.G.; validation, S.N.H. and A.G.; formal analysis, S.N.H. and A.G.; investigation, S.N.H. and A.G.; resources, S.N.H. and A.G.; data curation, S.N.H. and A.G.; writing—original draft preparation, S.N.H. and A.G.; writing—review and editing, S.N.H. and A.G.; visualization, S.N.H. and A.G.; supervision, A.G.; project administration, A.G.; funding acquisition, A.G. All authors have read and agreed to the published version of the manuscript.

Funding

This research received no external funding.

Data Availability Statement

The original contributions presented in this study are included in the article. Further inquiries can be directed to the corresponding author(s).

Acknowledgments

Authors would like to thank Hydrogen MDPI for this opportunity.

Conflicts of Interest

The authors declare no conflicts of interest.

Abbreviations

The following abbreviations are used in this manuscript:
Alatitude
A r e s reservoir surface area
CAPEXCapital Expenditure
C a n n , t o t total annualized cost
C R F capital recovery factor
E 0 daily evaporation rate
EarrMPPenergy generated by PV array at maximum power point
E d e f deferrable load
E g r i d , s a l e s total energy sold to the grid
FPVFloating Photovoltaics
GPVGround Photovoltaics
HFCVHydrogen Fuel Cell Vehicles
iAnnual real discount rate
ILPmaxPower loss due to maximum load
LCOELevelized Cost of Electricity
LCOHLevelized Cost of Hydrogen
M h y d r o g e n total hydrogen production
PEMProton Exchange Membrane
PVPhotovoltaic
R p r o j Project lifetime
Tmean temperature
T d dew point temperature
T m adjusted temperature
SDGSustainable Development Goal
ν e l e c value of electricity
W l o s s annual evaporation rate
σ c o v e r a g e surface covered by floating photovoltaics
βevaporation reduction rate

References

  1. Impact of Transport Infrastructure Investment on Regional Development. 2002. Available online: www.copyright.com (accessed on 1 August 2025).
  2. Ausubel, J.H.; Marchetti, C.; Meyer, P.S. Toward green mobility: The evolution of transport. Eur. Rev. 1998, 6, 137–156. [Google Scholar] [CrossRef]
  3. International—U.S. Energy Information Administration (EIA). Available online: https://www.eia.gov/international/analysis/country/jpn (accessed on 20 October 2023).
  4. U.S. Department of Energy, Alternative Fuels Data Center. Arizona Transportation Data for Alternative Fuels and Vehicles. Available online: https://afdc.energy.gov/states/az (accessed on 8 April 2024).
  5. U.S. Department of Energy. 5 Fast Facts About Hydrogen and Fuel Cells. 2017. Available online: https://www.energy.gov/eere/articles/5-fast-facts-about-hydrogen-and-fuel-cells (accessed on 8 January 2025).
  6. Fuchs, A.; Lohmann, A.; Gebremedhin, A. Transitioning Towards a Sustainable Energy System: A Case Study of Baden-Württemberg. Int. J. Innov. Technol. Interdiscip. Sci. 2024, 7, 157–197. [Google Scholar] [CrossRef]
  7. Tashie-Lewis, B.C.; Nnabuife, S.G. Hydrogen Production, Distribution, Storage and Power Conversion in a Hydrogen Economy—A Technology Review. Chem. Eng. J. Adv. 2021, 8, 100172. [Google Scholar] [CrossRef]
  8. Kumar, S.S.; Himabindu, V. Hydrogen Production by PEM Water Electrolysis—A Review. Mater. Sci. Energy Technol. 2019, 2, 442–454. [Google Scholar] [CrossRef]
  9. SENZA. PEM Hydrogen Generator vs Alkaline Hydrogen Generator. Available online: https://senzahydrogen.com/pem-hydrogen-generator-vs-alkaline-hydrogen-generator/ (accessed on 30 August 2025).
  10. Heena Singh. Explore PEM Electrolyzer Market—With Key Players & Market Trends. BBC Research. 2024. Available online: https://blog.bccresearch.com/explore-pem-electrolyzer-market-with-key-players-market-trends (accessed on 30 August 2025).
  11. Badruzzaman, A.; Karagoz, S.; Eljack, F. Sustainable-Green Hydrogen Production Through Integrating Electrolysis, Water Treatment and Solar Energy. Front. Chem. Eng. 2025, 7, 1526331. [Google Scholar] [CrossRef]
  12. Nnabuife, S.G.; Hamzat, A.K.; Whidborne, J.; Kuang, B.; Jenkins, K.W. Integration of Renewable Energy Sources in Tandem with Electrolysis: A Technology Review for Green Hydrogen Production. Int. J. Hydrogen Energy 2024, 107, 218–240. [Google Scholar] [CrossRef]
  13. Guerrero-Lemus, R.; Vega, R.; Kim, T.; Kimm, A.; Shephard, L. Bifacial Solar Photovoltaics—A Technology Review. Renew. Sustain. Energy Rev. 2016, 60, 1533–1549. [Google Scholar] [CrossRef]
  14. Garrod, A.; Ghosh, A. A Review of Bifacial Solar Photovoltaic Applications. Front. Energy 2023, 17, 704–726. [Google Scholar] [CrossRef]
  15. Essak, L.; Ghosh, A. Floating Photovoltaics: A Review. Clean. Technol. 2022, 4, 752–769. [Google Scholar] [CrossRef]
  16. Medonna, A.; Ghosh, A. Harvesting sun Amplified: A Comprehensive Review of Agrivoltaics and Floatovoltaics with a Focus on India’s POTENTIAL. Sol. Compass 2025, 15, 100132. [Google Scholar] [CrossRef]
  17. Ghosh, A. Fenestration Integrated BIPV (FIPV): A Review. Sol. Energy 2022, 237, 213–230. [Google Scholar] [CrossRef]
  18. Reasoner, M.; Ghosh, A. Agrivoltaic Engineering and Layout Optimization Approaches in the Transition to Renewable Energy Technologies: A Review. Challenges 2022, 13, 43. [Google Scholar] [CrossRef]
  19. Garrod, A.; Hussain, S.N.; Ghosh, A. The Technical and Economic Potential for Crop Based Agrivoltaics in the United Kingdom. Sol. Energy 2024, 277, 112744. [Google Scholar] [CrossRef]
  20. Hussain, S.N.; Ghosh, A. Evaluating Tracking Bifacial Solar PV Based Agrivoltaics System across the UK. Sol. Energy 2024, 284, 113102. [Google Scholar] [CrossRef]
  21. Hwang, S.; Lee, H.-S.; Kang, Y. Energy Yield Comparison Between Monofacial Photovoltaic Modules with Monofacial and Bifacial Cells in a Carport. Energy Rep. 2023, 9, 3148–3153. [Google Scholar] [CrossRef]
  22. Jawad, A.; Hasan, S.; Faruqui, F.I.; Masood, N.-A. Small-Scale Floating Photovoltaic Systems in University Campus: A Pathway to Achieving SDG 7 Goals in Bangladesh. Energy Convers. Manag. 2023, 297, 117722. [Google Scholar] [CrossRef]
  23. Sen, A.; Mohankar, A.S.; Khamaj, A.; Karmakar, S. Emerging OSH Issues in Installation and Maintenance of Floating Solar Photovoltaic Projects and Their Link with Sustainable Development Goals. Risk Manag. Health Policy 2021, 14, 1939–1957. [Google Scholar] [CrossRef]
  24. Anabih, A. Sustainable Innovation: Floating Solar PV in Coal Post-Mining Restoration. Heliyon 2024. [CrossRef]
  25. Ghosh, A. A Comprehensive Review of Water Based PV: Flotavoltaics, under Water, Offshore & Canal Top. Ocean Eng. 2023, 281, 115044. [Google Scholar] [CrossRef]
  26. Kjeldstad, T.; Lindholm, D.; Marstein, E.; Selj, J. Cooling of Floating Photovoltaics and the Importance of Water Temperature. Sol. Energy 2021, 218, 544–551. [Google Scholar] [CrossRef]
  27. Farrar, L.W.; Bahaj, A.S.; James, P.; Anwar, A.; Amdar, N. Floating Solar PV to Reduce Water Evaporation in Water Stressed Regions and Powering Water Pumping: Case Study Jordan. Energy Convers. Manag. 2022, 260, 115598. [Google Scholar] [CrossRef]
  28. Mose Solar Manufacturing. Floating Solar PV Systems: A Smart Solution for Water Conservation in Solar Parks. 2025. Available online: https://www.moserbaersolar.com/sustainability-and-environmental-impact/floating-solar-pv-systems-a-smart-solution-for-water-conservation-in-solar-parks/ (accessed on 24 August 2025).
  29. Vourdoubas, J. Assessment of the Potential of Installing Floating Photovoltaic Systems in Existing Water Reservoirs in Greece. Eur. J. Energy Res. 2023, 3, 17–23. [Google Scholar] [CrossRef]
  30. Sahu, A.; Yadav, N.; Sudhakar, K. Floating Photovoltaic Power Plant: A Review. Renew. Sustain. Energy Rev. 2016, 66, 815–824. [Google Scholar] [CrossRef]
  31. Liu, H.; Krishna, V.; Leung, J.L.; Reindl, T.; Zhao, L. Field Experience and Performance Analysis of Floating PV Technologies in the Tropics. Prog. Photovolt. Res. Appl. 2018, 26, 957–967. [Google Scholar] [CrossRef]
  32. González, R.C.; Sarmiento-Laurel, C.; Alcayaga, H.; Díaz, A.J.; Pizarro, A.; Fuentes, J.C.; Caro, A.M.; Páez, C.V.; Olavarría, F.B.; Boscolo, R.; et al. Exploring Climate-Driven Performance of Floating Photovoltaic Systems: Energy Production Enhancement and Evaporation Reduction. Appl. Energy 2025, 386, 125556. [Google Scholar] [CrossRef]
  33. Semba, T. Corrosion Mechanism Analysis of the Front-Side Metallization of a Crystalline Silicon PV Module by a High-Temperature and High-Humidity Test. Jpn. J. Appl. Phys. 2020, 59, 054001. [Google Scholar] [CrossRef]
  34. Hendarti, R.; Linggarjati, J.; Kurnia, J.C.; Arkan Hanan H, R. Influence of Humidity on the Performance of Floating Photovoltaic Systems over Ponds in a Tropical Urban Environment. IOP Conf. Ser. Earth Environ. Sci. 2024, 1375, 012015. [Google Scholar] [CrossRef]
  35. Sharma, P.; Sahoo, D.; Saini, K.K.; Mathur, H.D. Effect of Environmental Parameters on Performance of Solar Photovoltaic System in Western India. In Proceedings of the IECON 2023—49th Annual Conference of the IEEE Industrial Electronics Society, Singapore, 16–19 October 2023; pp. 1–6. [Google Scholar]
  36. Sher, A.A.; Ahmad, N.; Sattar, M.; Ghafoor, U.; Shah, U.H. Effect of Various Dusts and Humidity on the Performance of Renewable Energy Modules. Energies 2023, 16, 4857. [Google Scholar] [CrossRef]
  37. Ayadi, F.; Colak, I.; Genc, N.; Bulbul, H.I. Impacts of Wind Speed and Humidity on the Performance of Photovoltaic Module. In Proceedings of the 2019 8th International Conference on Renewable Energy Research and Applications (ICRERA), Brasov, Romania, 3–6 November 2019; pp. 229–233. [Google Scholar]
  38. Dahham, I.A.; Zainuri, M.A.A.M.; Abdullah, A.A.; Fauzan, M.F. Modeling the Effect of Dust and Wind Speed on Solar Panel Performance in Iraq. Energies 2023, 16, 6397. [Google Scholar] [CrossRef]
  39. Teo, J.C.; Tan, R.H.G.; Mok, V.H.; Ramachandaramurthy, V.K.; Tan, C. Impact of Partial Shading on the P-V Characteristics and the Maximum Power of a Photovoltaic String. Energies 2018, 11, 1860. [Google Scholar] [CrossRef]
  40. Mamun, M.A.A.; Hasanuzzaman, M.; Selvaraj, J. Experimental Investigation of the Effect of Partial Shading on Photovoltaic Performance. IET Renew. Power Gener. 2017, 11, 912–921. [Google Scholar] [CrossRef]
  41. Sepúlveda-Oviedo, E.H. Impact of Environmental Factors on Photovoltaic System Performance Degradation. Energy Strat. Rev. 2025, 59, 101682. [Google Scholar] [CrossRef]
  42. Micheli, L. The temperature of Floating Photovoltaics: Case Studies, Models and Recent Findings. Sol. Energy 2022, 242, 234–245. [Google Scholar] [CrossRef]
  43. Garrod, A.; Hussain, S.N.; Ghosh, A.; Nahata, S.; Wynne, C.; Paver, S. An Assessment of Floating Photovoltaic Systems and energy Storage Methods: A Comprehensive Review. Results Eng. 2024, 21, 101940. [Google Scholar] [CrossRef]
  44. Deng, J.; Bae, C.; Denlinger, A.; Miller, T. Electric Vehicles Batteries: Requirements and Challenges. Joule 2020, 4, 511–515. [Google Scholar] [CrossRef]
  45. IEA. Global EV Outlook 2023. Paris. 2023. Available online: https://www.iea.org/reports/global-ev-outlook-2023 (accessed on 8 January 2025).
  46. Ghosh, A. Solar-Powered Green Hydrogen from Electrolyzer (PV-H2): A Review. Sol. RRL 2025, 9, 2500150. [Google Scholar] [CrossRef]
  47. Regulators’ Guide to Permitting Hydrogen Technologies. Hydrogen, Fuel Cells, and Infrastructure; US Department of Energy: Washington, DC, USA, 2004.
  48. Land Use Statistics and Indicators|Global, Regional and Country Trends 1990–2019|Food and Agriculture Organization of the United Nations. Available online: https://openknowledge.fao.org/server/api/core/bitstreams/04f2740a-d8d2-40fa-8b08-4e0198e604b0/content (accessed on 8 January 2025).
  49. Luboń, W.; Pełka, G.; Janowski, M.; Pająk, L.; Stefaniuk, M.; Kotyza, J.; Reczek, P. Assessing the Impact of Water Cooling on PV Modules Efficiency. Energies 2020, 13, 2414. [Google Scholar] [CrossRef]
  50. Al Saadi, K.; Ghosh, A. Investigating the Integration of Floating Photovoltaics (FPV) Technology with Hydrogen (H2) Energy for Electricity Production for Domestic Application in Oman. Int. J. Hydrogen Energy 2024, 80, 1151–1163. [Google Scholar] [CrossRef]
  51. Ilgen, K.; Schindler, D.; Wieland, S.; Lange, J. The Impact of Floating Photovoltaic Power Plants on Lake Water Temperature and Stratification. Sci. Rep. 2023, 13, 7932. [Google Scholar] [CrossRef]
  52. Pouran, H.M.; Lopes, M.P.C.; Nogueira, T.; Branco, D.A.C.; Sheng, Y. Environmental and Technical Impacts of Floating Photovoltaic Plants as an Emerging Clean Energy Technology. iScience 2022, 25, 105253. [Google Scholar] [CrossRef]
  53. Gökçek, M.; Kale, C. Techno-Economical Evaluation of a Hydrogen Refuelling Station Powered by Wind-PV Hybrid Power System: A Case Study for İzmir-Çeşme. Int. J. Hydrogen Energy 2018, 43, 10615–10625. [Google Scholar] [CrossRef]
  54. Temiz, M.; Javani, N. Design and Analysis of a Combined Floating Photovoltaic System for Electricity and Hydrogen Production. Int. J. Hydrogen Energy 2020, 45, 3457–3469. [Google Scholar] [CrossRef]
  55. Temiz, M.; Dincer, I. Techno-Economic Analysis of Green Hydrogen Ferries with a Floating Photovoltaic Based Marine Fueling Station. Energy Convers. Manag. 2021, 247, 114760. [Google Scholar] [CrossRef]
  56. Pal, P.; Mukherjee, V. Off-Grid Solar Photovoltaic/Hydrogen Fuel Cell System for Renewable Energy Generation: An Investigation Based on Techno-Economic Feasibility Assessment for the Application of End-User Load Demand in North-East India. Renew. Sustain. Energy Rev. 2021, 149, 111421. [Google Scholar] [CrossRef]
  57. Gökçek, M.; Kale, C. Optimal design of a Hydrogen Refuelling Station (HRFS) Powered by Hybrid Power System. Energy Convers. Manag. 2018, 161, 215–224. [Google Scholar] [CrossRef]
  58. Micena, R.P.; Llerena-Pizarro, O.R.; de Souza, T.M.; Silveira, J.L. Solar-Powered Hydrogen Refueling Stations: A Techno-Economic Analysis. Int. J. Hydrogen Energy 2020, 45, 2308–2318. [Google Scholar] [CrossRef]
  59. Barhoumi, E.M.; Okonkwo, P.C.; Ben Belgacem, I.; Zghaibeh, M.; Tlili, I. Optimal Sizing of Photovoltaic Systems Based Green Hydrogen Refueling Stations Case Study Oman. Int. J. Hydrogen Energy 2022, 47, 31964–31973. [Google Scholar] [CrossRef]
  60. Bamisile, O.; Acen, C.; Cai, D.; Huang, Q.; Staffell, I. The Environmental Factors Affecting Solar Photovoltaic Output. Renew. Sustain. Energy Rev. 2024, 208, 115073. [Google Scholar] [CrossRef]
  61. Describe Latitudinal Distribution of Köppen’s Classification of World Climate. 2024. Available online: https://civilprep.in/b-describe-latitudinal-distribution-of-koppens-classification-of-world-climate-15-marks-pyq-2024/ (accessed on 29 July 2025).
  62. Mazzeo, D.; Herdem, M.S.; Matera, N.; Wen, J.Z. Green Hydrogen Production: Analysis for Different Single or Combined Large-scale Photovoltaic and Wind Renewable Systems. Renew. Energy 2022, 200, 360–378. [Google Scholar] [CrossRef]
  63. Jaszczur, M.; Hassan, Q.; Sameen, A.Z.; Salman, H.M.; Olapade, O.T.; Wieteska, S. Massive Green Hydrogen Production Using Solar and Wind Energy: Comparison Between Europe and the Middle East. Energies 2023, 16, 5445. [Google Scholar] [CrossRef]
  64. Femin, V.; Veena, R.; Petra, M.I.; Mathew, S. Comparative Analysis of Different PV Technologies under the Tropical Environments. Sci. Rep. 2025, 15, 16371. [Google Scholar] [CrossRef]
  65. Adouane, M.; Al-Qattan, A.; Alabdulrazzaq, B.; Fakhraldeen, A. Comparative Performance Evaluation of Different Photovoltaic Modules Technologies under Kuwait Harsh Climatic Conditions. Energy Rep. 2020, 6, 2689–2696. [Google Scholar] [CrossRef]
  66. Kamil, K.R.; Samuel, B.O.; Khan, U. Green Hydrogen Production from Photovoltaic Power Station as a Road Map to Climate Change Mitigation. Clean. Energy 2024, 8, 156–167. [Google Scholar] [CrossRef]
  67. Mazzeo, D.; Baglivo, C.; Matera, N.; Congedo, P.M.; Oliveti, G. Impact of Climatic Conditions of Different World Zones on the Energy Performance of the Photovoltaic-Wind-Battery Hybrid System. IOP Conf. Ser. Earth Environ. Sci. 2020, 410, 012044. [Google Scholar] [CrossRef]
  68. Matera, N.; Mazzeo, D.; Longo, M.; Miraftabzadeh, S.M.; Leva, S. Towards Sustainable Hydrogen Mobility: Evaluating Renewable Energy Systems for Green Hydrogen Generation. In Proceedings of the 2024 International Conference on Smart Energy Systems and Technologies (SEST), Torino, Italy, 10–12 September 2024; pp. 1–6. [Google Scholar]
  69. Hernández-Nochebuena, M.A.; Cervantes, I.; Araujo-Vargas, I. The Effect of the Energy Interchange Dynamics on the Zero-Energy Hydrogen Economy of Households with FC Hybrid Electric Vehicles. Int. J. Hydrogen Energy 2021, 46, 21160–21181. [Google Scholar] [CrossRef]
  70. A Dictionary of Earth Sciences; Oxford University Press (OUP): Oxford, UK, 2008. [CrossRef]
  71. Wang, M.; Overland, J.E. Detecting Arctic Climate Change Using Köppen Climate Classification. Clim. Change 2004, 67, 43–62. [Google Scholar] [CrossRef]
  72. NIZAM Sagar Project. Available online: https://irrigation.telangana.gov.in/img/projectspdf/nizamsagar.pdf (accessed on 21 August 2025).
  73. Negm, A.; Elsahabi, M.; Tayie, M.S. An Overview of Aswan High Dam and Grand Ethiopian Renaissance Dam. In Grand Ethiopian Renaissance Dam Versus Aswan High Dam. The Handbook of Environmental Chemistry; Springer: Cham, Switzerland, 2018; pp. 3–17. [Google Scholar] [CrossRef]
  74. The Editors of Encyclopaedia Britannica. Oroville Dam. 2024. Available online: https://www.britannica.com/topic/Oroville-Dam (accessed on 21 August 2025).
  75. C.J., R.; Lim, K.H.; Kurnia, J.C.; Roy, S.; Bora, B.J.; Medhi, B.J. Towards Sustainable Power Generation: Recent Advancements in Floating Photovoltaic Technologies. Renew. Sustain. Energy Rev. 2024, 194, 114322. [Google Scholar] [CrossRef]
  76. Kakoulaki, G.; Sanchez, R.G.; Amillo, A.G.; Szabo, S.; De Felice, M.; Farinosi, F.; De Felice, L.; Bisselink, B.; Seliger, R.; Kougias, I.; et al. Benefits of Pairing Floating Solar Photovoltaics with Hydropower Reservoirs in Europe. Renew. Sustain. Energy Rev. 2022, 171, 112989. [Google Scholar] [CrossRef]
  77. Ghosh, A. Soiling Losses: A Barrier for India’s Energy Security Dependency from Photovoltaic Power. Challenges 2020, 11, 9. [Google Scholar] [CrossRef]
  78. Solar, A. Understanding PV System Losses, Part 3: Soiling, Snow, System Degradation. Available online: https://aurorasolar.com/blog/understanding-pv-system-losses-part-3-soiling-snow-system-degradation/ (accessed on 19 August 2025).
  79. Solas, Á.F.; Riedel-Lyngskær, N.; Hanrieder, N.; Santos, F.N.; Wilbert, S.; Riise, H.N.; Polo, J.; Fernández, E.F.; Almonacid, F.; Talavera, D.L.; et al. Photovoltaic Soiling Loss in Europe: Geographical Distribution and Cleaning Recommendations. Renew. Energy 2024, 239, 122086. [Google Scholar] [CrossRef]
  80. Chepp, E.D.; Gasparin, F.P.; Krenzinger, A. Improvements in Methods for Analysis of Partially Shaded PV Modules. Renew. Energy 2022, 200, 900–910. [Google Scholar] [CrossRef]
  81. NASA Technical Reports Server (NTRS). Surface Meteorology and Solar Energy. Available online: https://ntrs.nasa.gov/citations/20080012200 (accessed on 8 January 2025).
  82. Zhang, T.; Stackhouse, P.W.; Chandler, W.S.; Westberg, D.J. Application of a Global-to-Beam Irradiance Model to the NASA GEWEX SRB Dataset: An Extension of the NASA Surface Meteorology and Solar Energy Datasets. Sol. Energy 2014, 110, 117–131. [Google Scholar] [CrossRef]
  83. Meteo Database > Import Meteo Data > NASA-SSE Satellite Data. Available online: https://www.pvsyst.com/help-pvsyst7/meteo_source_nasa.htm (accessed on 8 January 2025).
  84. Polaris Market Research & Consulting Inc. Market Research Reports, Custom Reports and Industry in 2023. Available online: https://www.polarismarketresearch.com/ (accessed on 28 July 2025).
  85. Project Design > Grid-Connected System Definition > PNom Ratio–DC:AC. Available online: https://www.pvsyst.com/help-pvsyst7/pnomratio.htm (accessed on 8 January 2025).
  86. Yadav, S.K.; Kumar, N.M.; Ghosh, A.; Bajpai, U.; Chopra, S.S. Assessment of Soiling Impacts and Cleaning Frequencies of a Rooftop BAPV System in Composite Climates of India. Sol. Energy 2022, 242, 119–129. [Google Scholar] [CrossRef]
  87. Elminir, H.K.; Ghitas, A.E.; Hamid, R.; El-Hussainy, F.; Beheary, M.; Abdel-Moneim, K.M. Effect of Dust on the Transparent Cover of Solar Collectors. Energy Convers. Manag. 2006, 47, 3192–3203. [Google Scholar] [CrossRef]
  88. Kimber, A.; Mitchell, L.; Nogradi, S.; Wenger, H. The Effect of Soiling on Large Grid-Connected Photovoltaic Systems in California and the Southwest Region of the United States. In Proceedings of the 2006 IEEE 4th World Conference on Photovoltaic Energy Conference, Waikoloa, HI, USA, 7–12 May 2006; pp. 2391–2395. [Google Scholar]
  89. PVsyst Forum. EArray < EOutInv–Simulations. 2022. Available online: https://forum.pvsyst.com/topic/2894-earray-eoutinv/ (accessed on 28 July 2025).
  90. Mgsolar. LG Solar LG Neon 2 Black 355Wp Solar Panel LG355N1K-N5, Monocrystalline. Available online: https://www.mg-solar-shop.com/lg-solar-lg-neon-2-black-355wp-solar-panel-lg355n1k-n5-monocrystalline (accessed on 28 August 2025).
  91. Solar Electric Supply, Inc. LG LG280S1C-B3 Solar Panel. Available online: https://www.solarelectricsupply.com/lg-lg280s1c-b3-solar-panel?srsltid=AfmBOop7keUTm4M4tYNq6g2pUM40vpWEJcU7ZnQk7pjTB9gBC1LhtPpV (accessed on 24 August 2025).
  92. City plumbing.co.uk. Solfex Amerisolar 280WP Polycrystalline Pv Module AS-6P30-280W. Available online: https://www.cityplumbing.co.uk/p/solfex-amerisolar-280wp-polycrystalline-pv-module-as-6p30-280w/p/471596?srsltid=AfmBOoqMCQeMrcYbhQDqD5zr7E6_dxcL5JBeI0M6gs8Y0bzkSZGFa6Ez (accessed on 24 August 2025).
  93. DASS Tech. DSP-3375K. Available online: http://www.dasstech.com/kor/introduce-product/dsp-33100k/ (accessed on 18 September 2025).
  94. Ramasamy, V.; Margolis, R. Floating Photovoltaic System Cost Benchmark: Q1 2021 Installations on Artificial Water Bodies. 2021. Available online: https://research-hub.nrel.gov/en/publications/floating-photovoltaic-system-cost-benchmark-q1-2021-installations (accessed on 30 January 2024).
  95. Bru, J.; Seland, T.S.; Dai, J.; Jiang, Z. Life Cycle Cost Analysis of an Offshore Floating Photovoltaic Concept in the North Sea. Renew. Energy 2025, 249, 122981. [Google Scholar] [CrossRef]
  96. Kumar, J.C.R.; Majid, M. Floating Solar Photovoltaic Plants in India—A Rapid Transition to a Green Energy Market and Sustainable Future. Energy Environ. 2021, 34, 304–358. [Google Scholar] [CrossRef]
  97. Moqulo, R.C. Design and Analysis for a Feasibility Study of a Floating Solar PV Power System for Metolong Dam. Master’s Thesis, National University of Lesotho, Roma, Lesotho, 2022. [Google Scholar]
  98. Martins, B.P. Techno-Economic Evaluation of a Floating PV System for a Wastewater Treatment Facility. Environ. Sci. Eng. Econ. 2019. [Google Scholar]
  99. Pv Magazine India. Are Robot Solar Panel Cleaners Worth the Cost and Time? 2025. Available online: https://www.pv-magazine-india.com/2025/04/25/are-robot-solar-panel-cleaners-worth-the-cost-and-time/ (accessed on 19 August 2025).
  100. Ravichandran, N.; Fayek, H.H.; Rusu, E. Emerging Floating Photovoltaic System—Case Studies High Dam and Aswan Reservoir in Egypt. Processes 2021, 9, 1005. [Google Scholar] [CrossRef]
  101. Ramasamy, V.; Zuboy, J.; O’shaughnessy, E.; Feldman, D.; Desai, J.; Woodhouse, M.; Basore, P.; Margolis, R. Q1-2022 U.S. Solar Photovoltaic System and Energy Storage Cost Benchmarks With Minimum Sustainable Price Analysis Data File. Available online: https://data.nrel.gov/submissions/202 (accessed on 19 August 2025).
  102. Chawla, K.; Aggarwal, M. Anatomy of a Solar Tariff: Understanding the Decline in Solar Bids Globally; Council on Energy, Environment and Water: New Delhi, India, 2016; Available online: https://www.ceew.in/publications/anatomy-solar-power-feed-in-tariff-decline-in-solar-bids-india (accessed on 21 August 2025).
  103. Pv Magazine International. Egyptian Solar Set to Expand beyond the Massive 1.8 GW Benban PV Project. 2024. Available online: https://www.pv-magazine.com/2024/04/13/weekend-read-take-off-at-last-for-egyptian-pv/ (accessed on 21 August 2025).
  104. DSIRE. Renewable Market Adjusting Tariff (ReMAT). 2024. Available online: https://programs.dsireusa.org/system/program/detail/5665 (accessed on 21 August 2025).
  105. World Population Review. Cost of Electricity by Country 2025. Available online: https://worldpopulationreview.com/country-rankings/cost-of-electricity-by-country (accessed on 21 August 2025).
  106. Statista. Inflation in India 2030. 2025. Available online: https://www.statista.com/statistics/271322/inflation-rate-in-india/ (accessed on 21 August 2025).
  107. Statista. Egypt-Inflation Rate 2030. 2025. Available online: https://www.statista.com/statistics/377354/inflation-rate-in-egypt/ (accessed on 21 August 2025).
  108. The Bureau of Labor Statistics CPI. USD Inflation Since 2020. 2025. Available online: https://www.officialdata.org/us/inflation/2020?amount=418&endYear=2024#citation (accessed on 21 August 2025).
  109. Statista. Russia: Inflation Rate from 1997 to 2030. 2025. Available online: https://www.statista.com/statistics/271376/inflation-rate-in-russia/ (accessed on 21 August 2025).
  110. UL Solutions HOMER® Front Software Adds Frequency Regulation Modeling for Utility-Scale Battery Storage|UL Solutions. Available online: https://www.ul.com/news/ul-solutions-homer-front-software-adds-frequency-regulation-modeling-utility-scale-battery (accessed on 8 January 2025).
  111. Gahleitner, G. Hydrogen from Renewable Electricity: An International Review of Power-to-Gas Pilot Plants for Stationary Applications. Int. J. Hydrogen Energy 2013, 38, 2039–2061. [Google Scholar] [CrossRef]
  112. Selamet, Ö.F.; Becerikli, F.; Mat, M.D.; Kaplan, Y. Development and Testing of a Highly Efficient Proton Exchange Membrane (PEM) Electrolyzer Stack. Int. J. Hydrogen Energy 2011, 36, 11480–11487. [Google Scholar] [CrossRef]
  113. Aijun, C.; Jun, P.; Hang, Z.; Keying, F.; Xubin, L. Experimental Investigation of Hydrogen Production Performance of PEM Electrolyze. Sci. Rep. 2025, 15, 23230. [Google Scholar] [CrossRef]
  114. Barlaz, F.; Akıl, Y.; Haydaroglu, C.; Kılıç, H. Renewable Energy and Hydrogen Storage System Analysis for Carbon Neutral Campuses with HOMER. Türk Doğa Ve Fen Derg. 2025; 14, 136–145. [Google Scholar] [CrossRef]
  115. Green Hydrogen Cost Reduction Scaling Up Electrolysers to Meet the 1.5 °C Climate Goal H2 O2. Available online: www.irena.org/publications (accessed on 8 January 2025).
  116. Hayibo, K.S.; Antonini, G.; Rahman, M.; Pearce, J.M. Experimental Integration of a Foam-Based Floating Photovoltaic (Floatovoltaic) System with an Anion Exchange Membrane Electrolyzer for 5 kW-Scale Green Hydrogen Production. Int. J. Hydrogen Energy 2025, 138, 260–272. [Google Scholar] [CrossRef]
  117. U.S. Department of Energy. Fuel Cells. Available online: https://www.energy.gov/eere/fuelcells/fuel-cells (accessed on 28 July 2025).
  118. Kapen, P.T.; Nouadje, B.A.M.; Chegnimonhan, V.; Tchuen, G.; Tchinda, R. Techno-Economic Feasibility of a PV/Battery/Fuel Cell/Electrolyzer/Biogas Hybrid System for Energy and Hydrogen Production in the Far North Region of Cameroon by Using HOMER pro. Energy Strat. Rev. 2022, 44, 100988. [Google Scholar] [CrossRef]
  119. FASTECH. How Does Hydrogen Fuel Cell (HFC) Efficiency Stack Up? 2025. Available online: https://www.fastechus.com/blog/hydrogen-fuel-cell-efficiency (accessed on 22 August 2025).
  120. Plug Power. Fuel Cell Benefits. Available online: https://www.plugpower.com/fuel-cell-power/fuel-cell-benefits/ (accessed on 22 August 2025).
  121. Abdulateef, A.M.; Jaszczur, M.; Hassan, Q.; Anish, R.; Niyas, H.; Sopian, K.; Abdulateef, J. Enhancing the melting of phase change material using a fins–nanoparticle combination in a triplex tube heat exchanger. J. Energy Storage 2021, 35, 102227. [Google Scholar] [CrossRef]
  122. Total Annualized Cost. Available online: https://homerenergy.com/products/pro/docs/3.15/total_annualized_cost.html (accessed on 11 March 2025).
  123. HOMER Pro. Levelized Cost of Hydrogen. HOMER Pro 3.15. Available online: https://www.homerenergy.com/products/pro/docs/3.15/levelized_cost_of_hydrogen.html (accessed on 11 March 2025).
  124. Hydrogenation Reaction Professional Technical Hydrogen Fuel Cell Pem Production. Available online: https://auyantech.en.made-in-china.com/product/yOGtNwfcrqpi/China-Hydrogenation-Reaction-Professional-Technical-Hydrogen-Fuel-Cell-Pem-Production.html (accessed on 25 August 2025).
  125. Baker, J.; Guler, M.; Medonna, A.; Li, Z.; Ghosh, A. Analysis of Large-Scale (1GW) Off-Grid Agrivoltaic Solar Farm for Hydrogen-Powered Fuel Cell Electric Vehicle (HFCEV) Charging Station. Energy Convers. Manag. 2024, 323, 119184. [Google Scholar] [CrossRef]
  126. Kulat, M.I.; Tosun, K.; Karaveli, A.B.; Yucel, I.; Akinoglu, B.G. A Sound Potential against Energy Dependency and Climate Change Challenges: Floating Photovoltaics on Water Reservoirs of Turkey. Renew. Energy 2023, 206, 694–709. [Google Scholar] [CrossRef]
  127. Alam, M.; Gul, M.S.; Muneer, T. Performance Analysis and Comparison between Bifacial and Monofacial Solar Photovoltaic at Various Ground Albedo Conditions. Renew. Energy Focus 2023, 44, 295–316. [Google Scholar] [CrossRef]
  128. Porter, W. Bifacial Modules: There Are Two Sides to Every Solar Panel; Burns & McDonnell: Kansas City, MO, USA, 2019. [Google Scholar]
  129. Mussard, M.; Amara, M. Performance of Solar Photovoltaic Modules under Arid Climatic Conditions: A Review. Sol. Energy 2018, 174, 409–421. [Google Scholar] [CrossRef]
  130. Abeni, M. Do Solar Panels Fail in Hot Weather? Sunsave. 2025. Available online: https://www.sunsave.energy/solar-panels-advice/how-solar-works/hot-weather (accessed on 28 July 2025).
  131. Amoah, M. Geographical and Climate Change Implications on Solar Photovoltaic Performance; University of Staffordshire: Stoke-on-Trent, UK, 2022. [Google Scholar]
  132. International Energy Agency. Managing Seasonal and Interannual Variability of Renewables. Available online: www.iea.org (accessed on 29 August 2025).
  133. PVsyst Documentation. Performance Ratio PR. Available online: https://www.pvsyst.com/help/project-design/results/performance-ratio-pr.html (accessed on 28 July 2025).
  134. Rodríguez-Gallegos, C.D.; Liu, H.; Gandhi, O.; Singh, J.P.; Krishnamurthy, V.; Kumar, A.; Stein, J.S.; Wang, S.; Li, L.; Reindl, T.; et al. Global Techno-Economic Performance of Bifacial and Tracking Photovoltaic Systems. Joule 2020, 4, 1514–1541. [Google Scholar] [CrossRef]
  135. Bellini, E. Single-Axis Bifacial PV Offers Lowest LCOE in 93.1% of World’s Land Area–Pv Magazine International. PV Magazine. 2020. Available online: https://www.pv-magazine.com/2020/06/05/single-axis-bifacial-pv-offers-lowest-lcoe-in-93-1-of-worlds-land-area/ (accessed on 28 July 2025).
  136. Drury, E.; Denholm, P.; Margolis, R. The Impact of Different Economic Performance Metrics on the Perceived Value of Solar Photovoltaics. 2011. Available online: http://www.osti.gov/bridge (accessed on 29 August 2025).
  137. Zubair, M.; Abbas, G. Optimization of Bifacial PV Panels in a Residential Sector for Maximum Economic Benefits Based on Load Profile. Energy Rep. 2025, 13, 5252–5265. [Google Scholar] [CrossRef]
  138. Frimannslund, I.; Thiis, T.; Aalberg, A.; Thorud, B. Polar Solar Power Plants—Investigating the Potential and the Design Challenges. Sol. Energy 2021, 224, 35–42. [Google Scholar] [CrossRef]
  139. Habour, R.M.; Benyounis, K.Y.; Carton, J.G. Green Hydrogen Production from Renewable Sources for Export. Int. J. Hydrogen Energy 2025, 128, 760–770. [Google Scholar] [CrossRef]
  140. Hydrogen Council; McKinsey & Company. Hydrogen Insights 2023. An Update on the State of the Global Hydrogen Economy, with a Deep Dive into Renewable Hydrogen Cost Evolution. 2023. Available online: www.hydrogencouncil.com (accessed on 21 July 2025).
  141. Zun, M.T.; McLellan, B.C. Cost Projection of Global Green Hydrogen Production Scenarios. Hydrogen 2023, 4, 932–960. [Google Scholar] [CrossRef]
  142. Our World in Data. Solar Panel Prices Have Fallen by around 20% Every Time Global Capacity Doubled. Global Change Data Lab. Available online: https://ourworldindata.org/data-insights/solar-panel-prices-have-fallen-by-around-20-every-time-global-capacity-doubled (accessed on 11 September 2025).
  143. Ilgen, K.; Schindler, D.; Armbruster, A.; Ladwig, R.; de Zarate, I.E.R.; Lange, J. Evaporation Reduction and Energy Generation Potential Using Floating Photovoltaic Power Plants on the Aswan High Dam Reservoir. Hydrol. Sci. J. 2024, 69, 709–720. [Google Scholar] [CrossRef]
  144. Lopes, M.P.C.; de Andrade Neto, S.; Branco, D.A.C.; de Freitas, M.A.V.; da Silva Fidelis, N. Water-Energy Nexus: Floating Photovoltaic Systems Promoting Water Security and Energy Generation in the Semiarid Region of Brazil. J. Clean. Prod. 2020, 273, 122010. [Google Scholar] [CrossRef]
  145. Liu, Z.; Ma, C.; Li, X.; Deng, Z.; Tian, Z. Aquatic Environment Impacts of Floating Photovoltaic and Implications for Climate Change Challenges. J. Environ. Manag. 2023, 346, 118851. [Google Scholar] [CrossRef]
  146. RWE. SolarDuck and RWE Successfully Install Offshore Floating Solar Pilot Merganser off Dutch Coast. 2025. Available online: https://www.rwe.com/en/press/rwe-offshore-wind-gmbh/2024-07-04-solarduck-and-rwe-successfully-install-offshore-floating-solar-pilot-meganser/ (accessed on 24 August 2025).
  147. Tina Casey. Sinopec Launches New Cost-Cutting Floating Solar Project. 2025. Available online: https://cleantechnica.com/2025/07/07/sinopec-launches-new-floating-solar-project-with-green-hydrogen-in-play/ (accessed on 24 August 2025).
  148. Molina, P.S. Offshore Hydrogen Production Powered by Floating PV. Pv Magazine International. 2021. Available online: https://www.pv-magazine.com/2021/01/15/offshore-hydrogen-production-powered-by-floating-pv/ (accessed on 24 August 2025).
Figure 1. Floating photovoltaic systems with different mooring setups [43].
Hydrogen 06 00073 g001
Figure 2. Schematic diagram summarizing the overall system.
Hydrogen 06 00073 g002
Figure 3. Köppen climate classification on map using QGIS.
Hydrogen 06 00073 g003
Figure 4. Overall system design includes site selection, technical design, and economic analysis.
Hydrogen 06 00073 g004
Figure 5. Schematic system design in HOMER Pro.
Hydrogen 06 00073 g005
Figure 6. Ambient temperature of different locations around the year.
Hydrogen 06 00073 g006
Figure 7. Global horizontal irradiation of different locations around the year.
Hydrogen 06 00073 g007
Figure 8. Effective energy at the output of the array at different locations around the year.
Hydrogen 06 00073 g008
Figure 9. Annual effective energy at the output of the array at different locations around the year.
Hydrogen 06 00073 g009
Figure 10. PR ratio of different locations over the year.
Hydrogen 06 00073 g010
Figure 11. Cost of energy produced (LCOE) for different locations over the year.
Hydrogen 06 00073 g011
Figure 12. Return on investment in different locations over the year.
Hydrogen 06 00073 g012
Figure 13. Payback period in different locations around the year.
Hydrogen 06 00073 g013
Figure 14. Hydrogen production for different locations around the year.
Hydrogen 06 00073 g014
Figure 15. Levelized cost of hydrogen for different locations around the year.
Hydrogen 06 00073 g015
Figure 16. Levelized cost of electricity and hydrogen between 2020 and 2024.
Hydrogen 06 00073 g016
Figure 17. Number of cars refueled for different locations around the year.
Hydrogen 06 00073 g017
Figure 18. Water saved due to floating photovoltaic system per year.
Hydrogen 06 00073 g018
Table 1. Comparison of different types of Köppen climate.
TypeDescriptionCriteria
ATropical Rainy ClimatesMinimum temperature ≥ 18 °C.
B Dry ClimatesAnnual mean precipitation ≤ dryness threshold
CMild Temperate Climates−3 °C ≤ Monthly mean temperature of the coldest month < +18 °C.
DSnow ClimatesMonthly mean temperature of the coldest month < −3 °C, and monthly mean temperature of the warmest month < −3 °C.
EPolar ClimatesMonthly mean temperature of the warmest month < 10 °C.
Table 2. Sites selected for floating photovoltaics and green hydrogen production based on the Koppen climate.
Nizam Sagar DamAswan High DamOroville DamUglich Dam
Type of climateAwBWhCsaDfb
CountryIndiaEgypt United StatesRussia
Situated onNizam SagarLake NaseerFeather River Volga River
Coordinates18.20, 77.9223.97, 32.8739.53, −121.4857.52, 38.29
Soiling loss10% [77]17% [6]4% [78]1.84 [79]
Table 3. Technical specifications of different modules in the system.
LG 355 n1k-n6LG 280 S1C-B3 AS6P30-280
Nominal power (Pmax) 355 W280 W280 W
Open circuit voltage (VOC) 41.6 V38.8 V38.6 V
Short circuit voltage (ISC) 10.84 A9.33 A9.31 A
MPP voltage (Vmpp) 34.3 V31.9 V31.5 V
MPP current (Impp) 10.84 A7.00 A8.89 A
Module efficiency (%)19.617.117.21
Nominal operating cell temperature (NOCT)42 ± 3 °C45.0 ± 2 °C45 °C ± 2 °C
Operating temperature −40 ~ +85 °C−40 ~ +90 °C−40 °C to +85 °C
Cell typeMonocrystallineMonocrystallinePolycrystalline
Module typeBifacialMonofacialMonofacial
Table 4. Cost of different major components of the system.
Components Size Cost (GBP)
LG 355 n1k-n6 209.93 per unit [90]
LG 280 S1C-B3179 per unit [91]
AS6P30-28077.28 per unit [92]
DSP-3375K 2684.1 per unit [93]
Wiring56,110 [94]
Combiner box1804 [95]
Table 5. Variation in the parameter values based on the location.
Nizam Sagar DamAswan High DamOroville DamUglich Dam
Installation2% of capital [96]GBP 0.0574/Wp [97]GBP 0.293/Wp [98]2% of capital cost [96]
CleaningGBP 0.004242/W [99]1% of CAPEX [100]USD 0.26/m2 [101]1% of CAPEX [100]
Feed-in tariffGBP 0.053/kWh [102]GBP 0.0622/kWh [103]GBP 0.0454/kWh [104]GBP 0.0466/kWh [105]
Inflation5.7% [106]15.27% [107]4.18% [108]7.64% [109]
Table 6. Sizing parameters of different components for the hybrid system considered in HOMER Pro.
Components Size Scenario 1Scenario 2Scenario 3
PV10,00010,00010,000
Electrolyzer (kW)600060006000
Fuel cell (kW)130013001300
Converter (kW)100010001000
Hydrogen tanks (kg)10,00010,00010,000
Table 7. Cost of different parameters used for economic analysis.
ComponentsCostReplacement CostOPEX
Electrolyzer 1100 per kW [56]825 [56]10 [56]
Hydrogen tank100 per unit [121]100 per unit [121]5 per unit [121]
Fuel cellGBP 2418.20 [118,124]2418.20 [118,124]0.01 [118,124]
Converter450 per kW400 per kW10 per kW
Disclaimer/Publisher’s Note: The statements, opinions and data contained in all publications are solely those of the individual author(s) and contributor(s) and not of MDPI and/or the editor(s). MDPI and/or the editor(s) disclaim responsibility for any injury to people or property resulting from any ideas, methods, instructions or products referred to in the content.