Abstract
The increasing interest in off-grid green hydrogen production has elevated the importance of reliable techno-economic assessment (TEA) tools to support investment and planning decisions. However, limited operational data and inconsistent modeling approaches across existing tools introduce significant uncertainty in cost estimations. This study presents a comprehensive review and comparative analysis of seven TEA tools—ranging from simplified calculators to advanced hourly based simulation platforms—used to estimate the Levelized Cost of Hydrogen (LCOH) in off-grid Hydrogen Production Plants (HPPs). A standardized simulation framework was developed to input consistent technical, economic, and financial parameters across all tools, allowing for a horizontal comparison. Results revealed a substantial spread in LCOH values, from EUR 5.86/kg to EUR 8.71/kg, representing a 49% variation. This discrepancy is attributed to differences in modeling depth, treatment of critical parameters (e.g., electrolyzer efficiency, capacity factor, storage, and inflation), and the tools’ temporal resolution. Tools that included higher input granularity, hourly data, and broader system components tended to produce more conservative (higher) LCOH values, highlighting the cost impact of increased modeling realism. Additionally, the total project cost—more than hydrogen output—was identified as the key driver of LCOH variability across tools. This study provides the first multi-tool horizontal testing protocol, a methodological benchmark for evaluating TEA tools and underscores the need for harmonized input structures and transparent modeling assumptions. These findings support the development of more consistent and reliable economic evaluations for off-grid green hydrogen projects, especially as the sector moves toward commercial scale-up and policy integration.
1. Introduction
The world is increasingly showing strong signs of climate change. According to a recent report by IRENA and GRA [1], following discussions at COP28, nations have collectively committed to limiting global temperature rise to 1.5 °C. Achieving this goal will require a transformative shift in the global energy system, which remains heavily reliant on fossil fuels. In 2020, approximately 80% of global energy consumption came from coal, natural gas, and oil [2]. Projections from the Stated Policies Scenario (STEPS) [3] suggest that, even by 2030, fossil fuels could still account for 73% of the global energy mix [4].
While renewable energy sources such as wind and solar are expanding, additional solutions are needed to enhance the resilience of energy systems. According to Kouchaki-Penchah [5], strategies to reduce carbon emissions involve improving energy efficiency, decarbonizing electricity generation, increasing electrification, deploying negative emissions technologies, and integrating hydrogen into the energy mix. Hydrogen stands out as a versatile energy carrier, offering significant potential for large-scale decarbonization. Producing green hydrogen via water electrolysis not only provides a low-carbon fuel [6] but also addresses the intermittency challenges of renewables by enabling seasonal energy storage [7,8].
Although hydrogen is already well established in industrial sectors, as of 2022, only 1% was produced using low-emission methods [9]. Its role in achieving net-zero targets extends beyond serving as a new energy vector [10]; hydrogen can also help decarbonize existing hydrogen production used in refineries and chemical industries [11]. While its precise role in future energy systems remains uncertain, hydrogen is expected to contribute significantly to deep decarbonization and energy system flexibility [12,13].
Sustainable hydrogen production predominantly relies on electrolysis technologies, such as polymer electrolyte membranes (PEMs), alkaline (ALK), and solid oxide electrolyzers (SOEs) [13]. However, the techno-economic feasibility of green off-grid Hydrogen Production Plants (HPPs) remains underexplored, with political and economic barriers limiting large-scale deployment [14]. Comprehensive techno-economic analyses (TEAs) are essential to assess the investment viability of such projects. These analyses must consider factors like renewable resource availability, energy supply variability, technological efficiency, financing models, and project lifespan [15,16].
The Levelized Cost Of Hydrogen (LCOH) is widely recognized as the key indicator for comparing hydrogen production costs across different technologies and geographies. However, the LCOH is highly sensitive to variables such as capital expenditures (CAPEX) and energy input costs [17,18].
This study compares seven TEA tools to evaluate the techno-economic viability of off-grid green Hydrogen Production Plants. Each tool simulates HPP operation under standardized technical, economic, and financial inputs to assess discrepancies in LCOH estimates. Beyond comparing the LCOH outputs, this study analyzes the underlying assumptions and input requirements of each tool, such as CAPEX and renewable energy source characterization.
Despite growing interest in green hydrogen, few studies systematically compare the performance and assumptions of existing TEA tools. Most research focuses on isolated case studies using a single tool, limiting broader assessments of consistency and reliability across platforms. Moreover, the lack of standardized input scenarios hinders the development of a unified framework for evaluating HPP feasibility [19].
This study addresses these gaps by providing, to the best of our knowledge, the first systematic comparison of multiple TEA tools under harmonized conditions. The findings offer a methodological benchmark for future techno-economic evaluations of off-grid green Hydrogen Production Plants.
2. Bibliographic Revision
2.1. Green Off-Grid Hydrogen Production Plant (HPP)
A transition to environmentally friendly ways of producing hydrogen is needed. The present section analyzes the results from studies of the renewable hydrogen off-grid power plant scheme. An example of an HPP is provided in Figure 1.

Figure 1.
Hydrogen Production Plant scheme.
A renewable Hydrogen Production Plant is composed of the following:
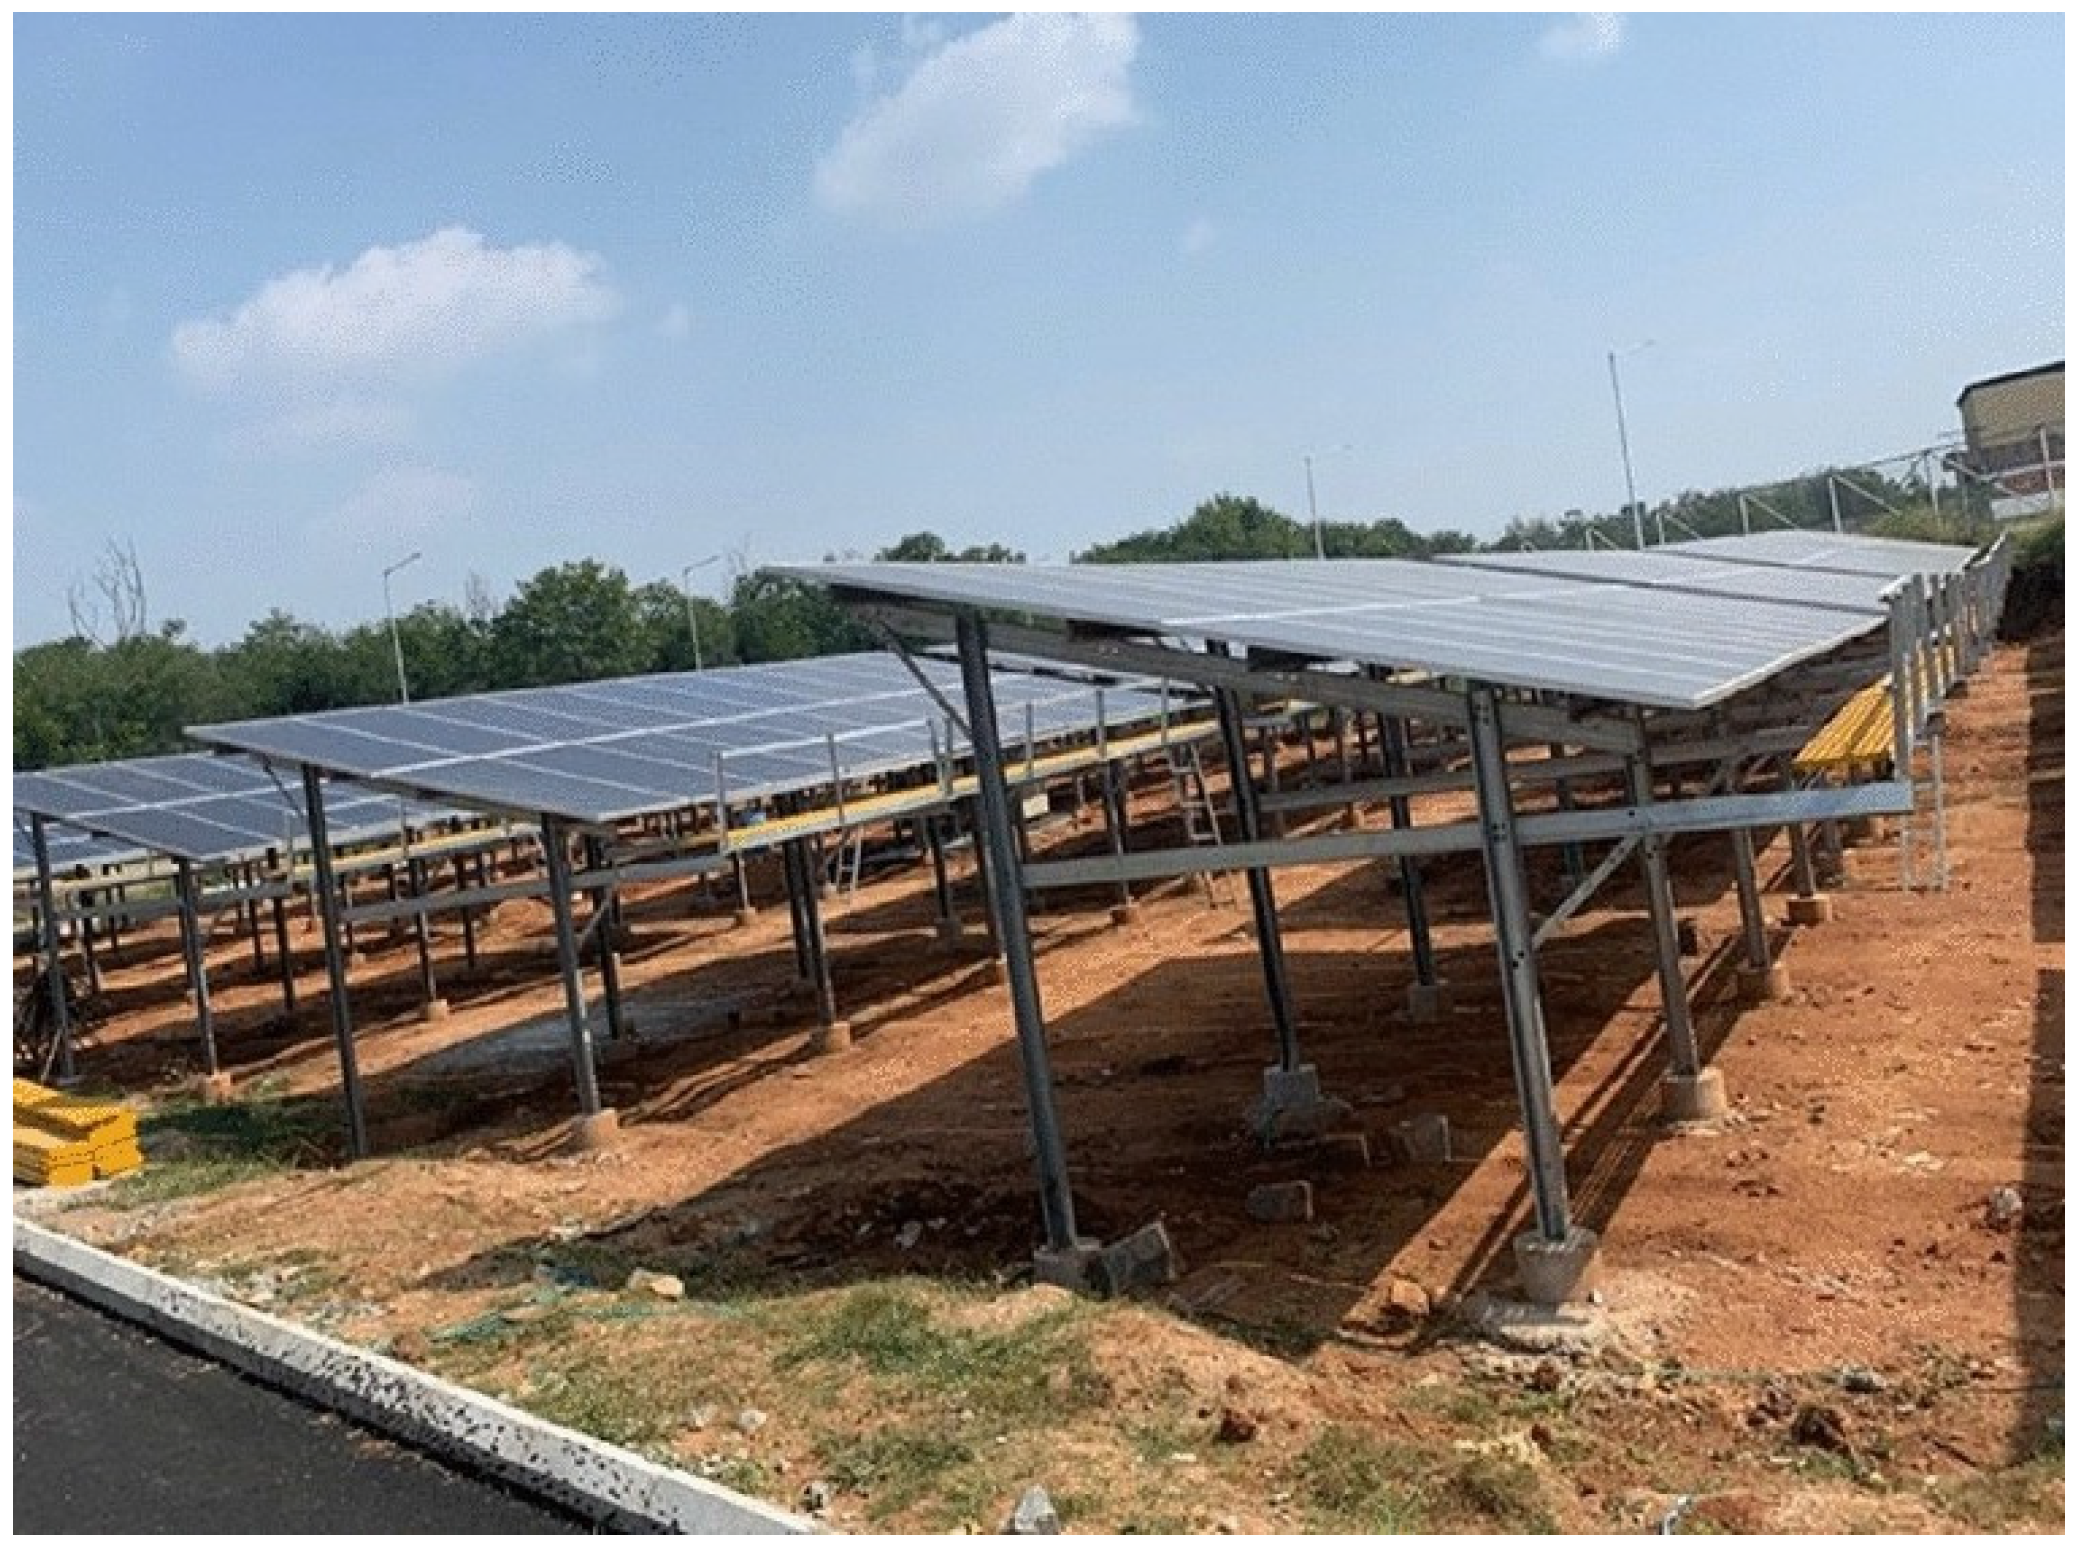
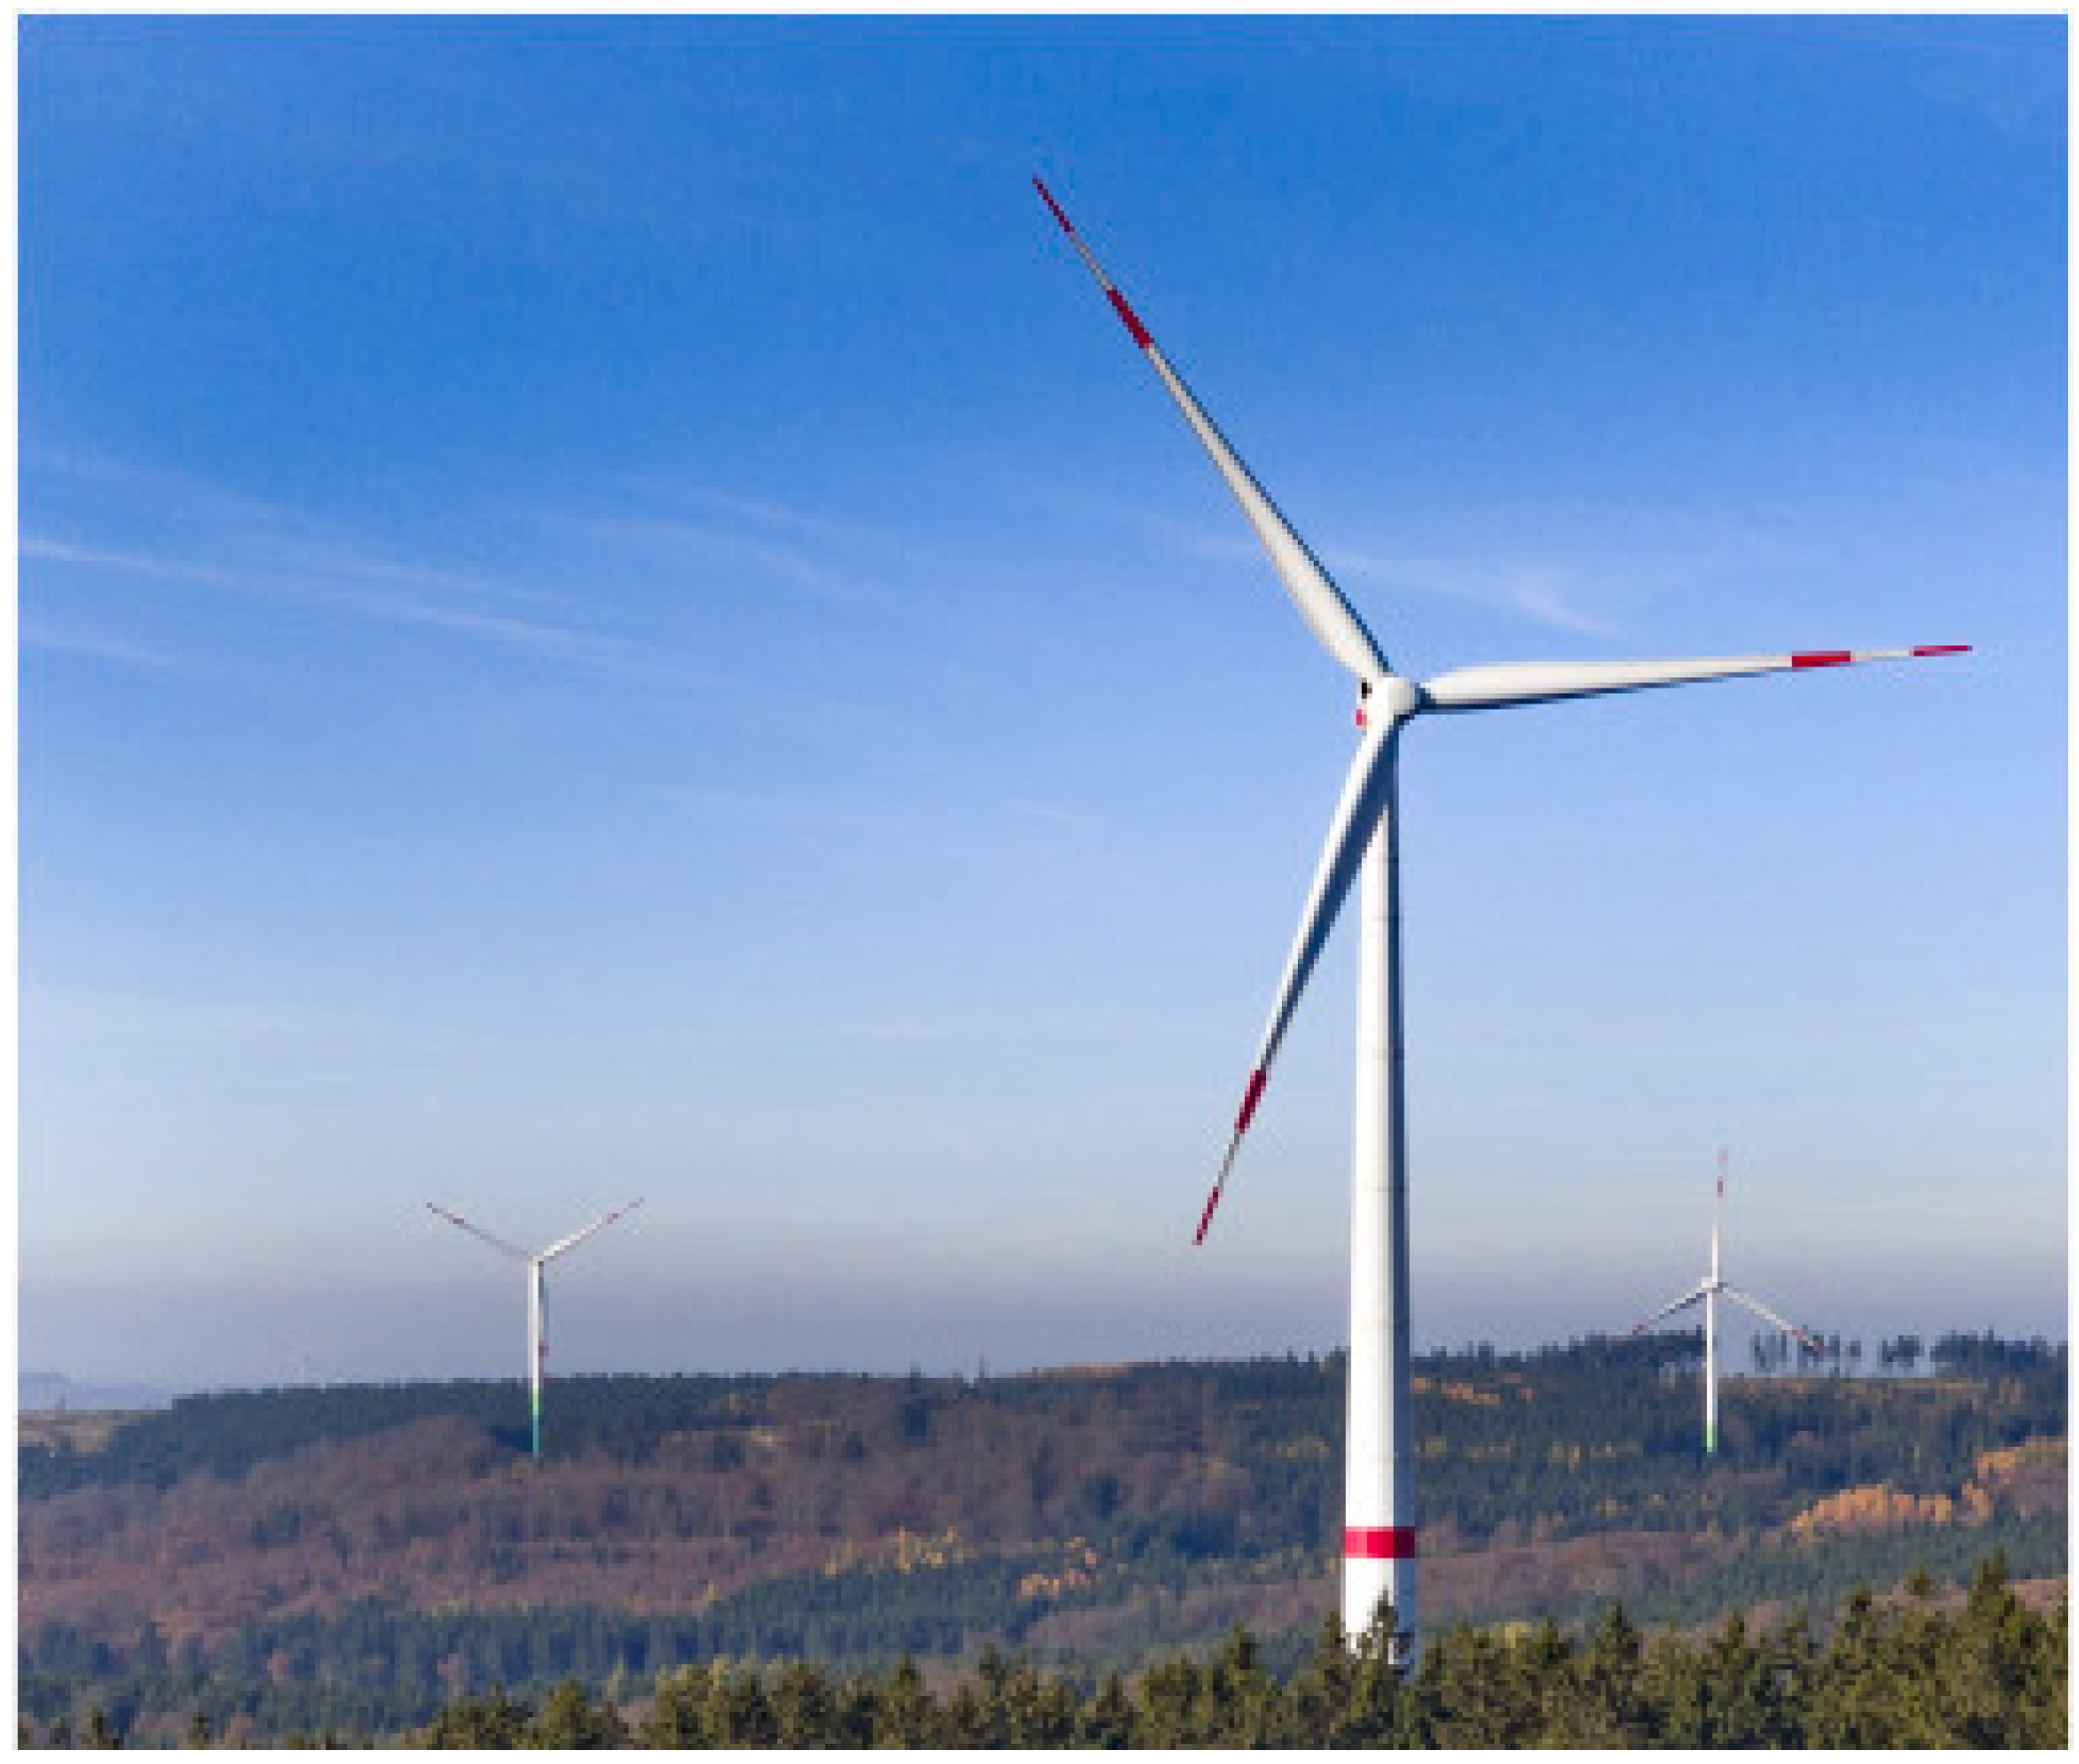
Renewable electrical energy source: A renewable base source must be ensured to supply the plant with the necessary amount of electricity required for conventional production. The cost-effectiveness is certainly one of the more important factors, but it is also important to consider the consistency of the energy source. The efficiency of the electrolyzer is deeply dependent on this [20]. In Figure 2 there is an example of a PV solar farm, and, in Figure 3, there are some wind turbines presented.
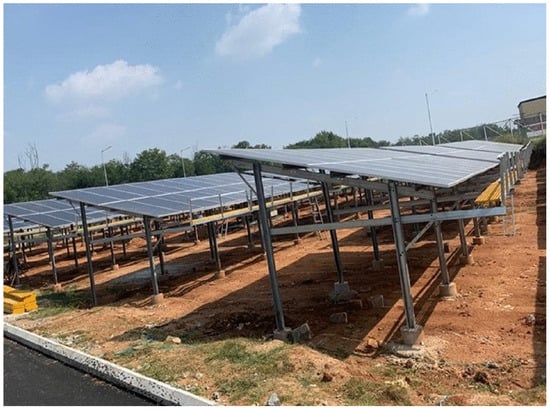
Figure 2.
Solar PV plant [21].
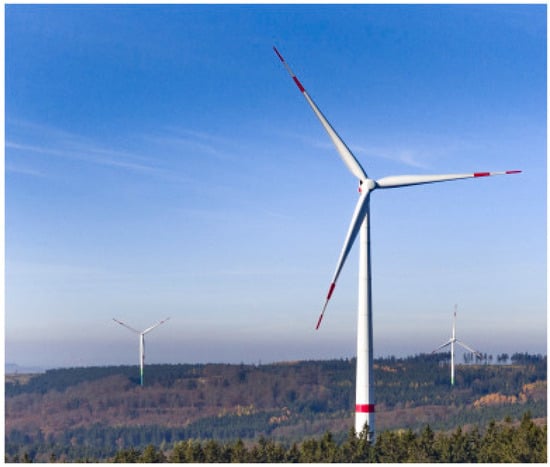
Figure 3.
Wind turbines [22].
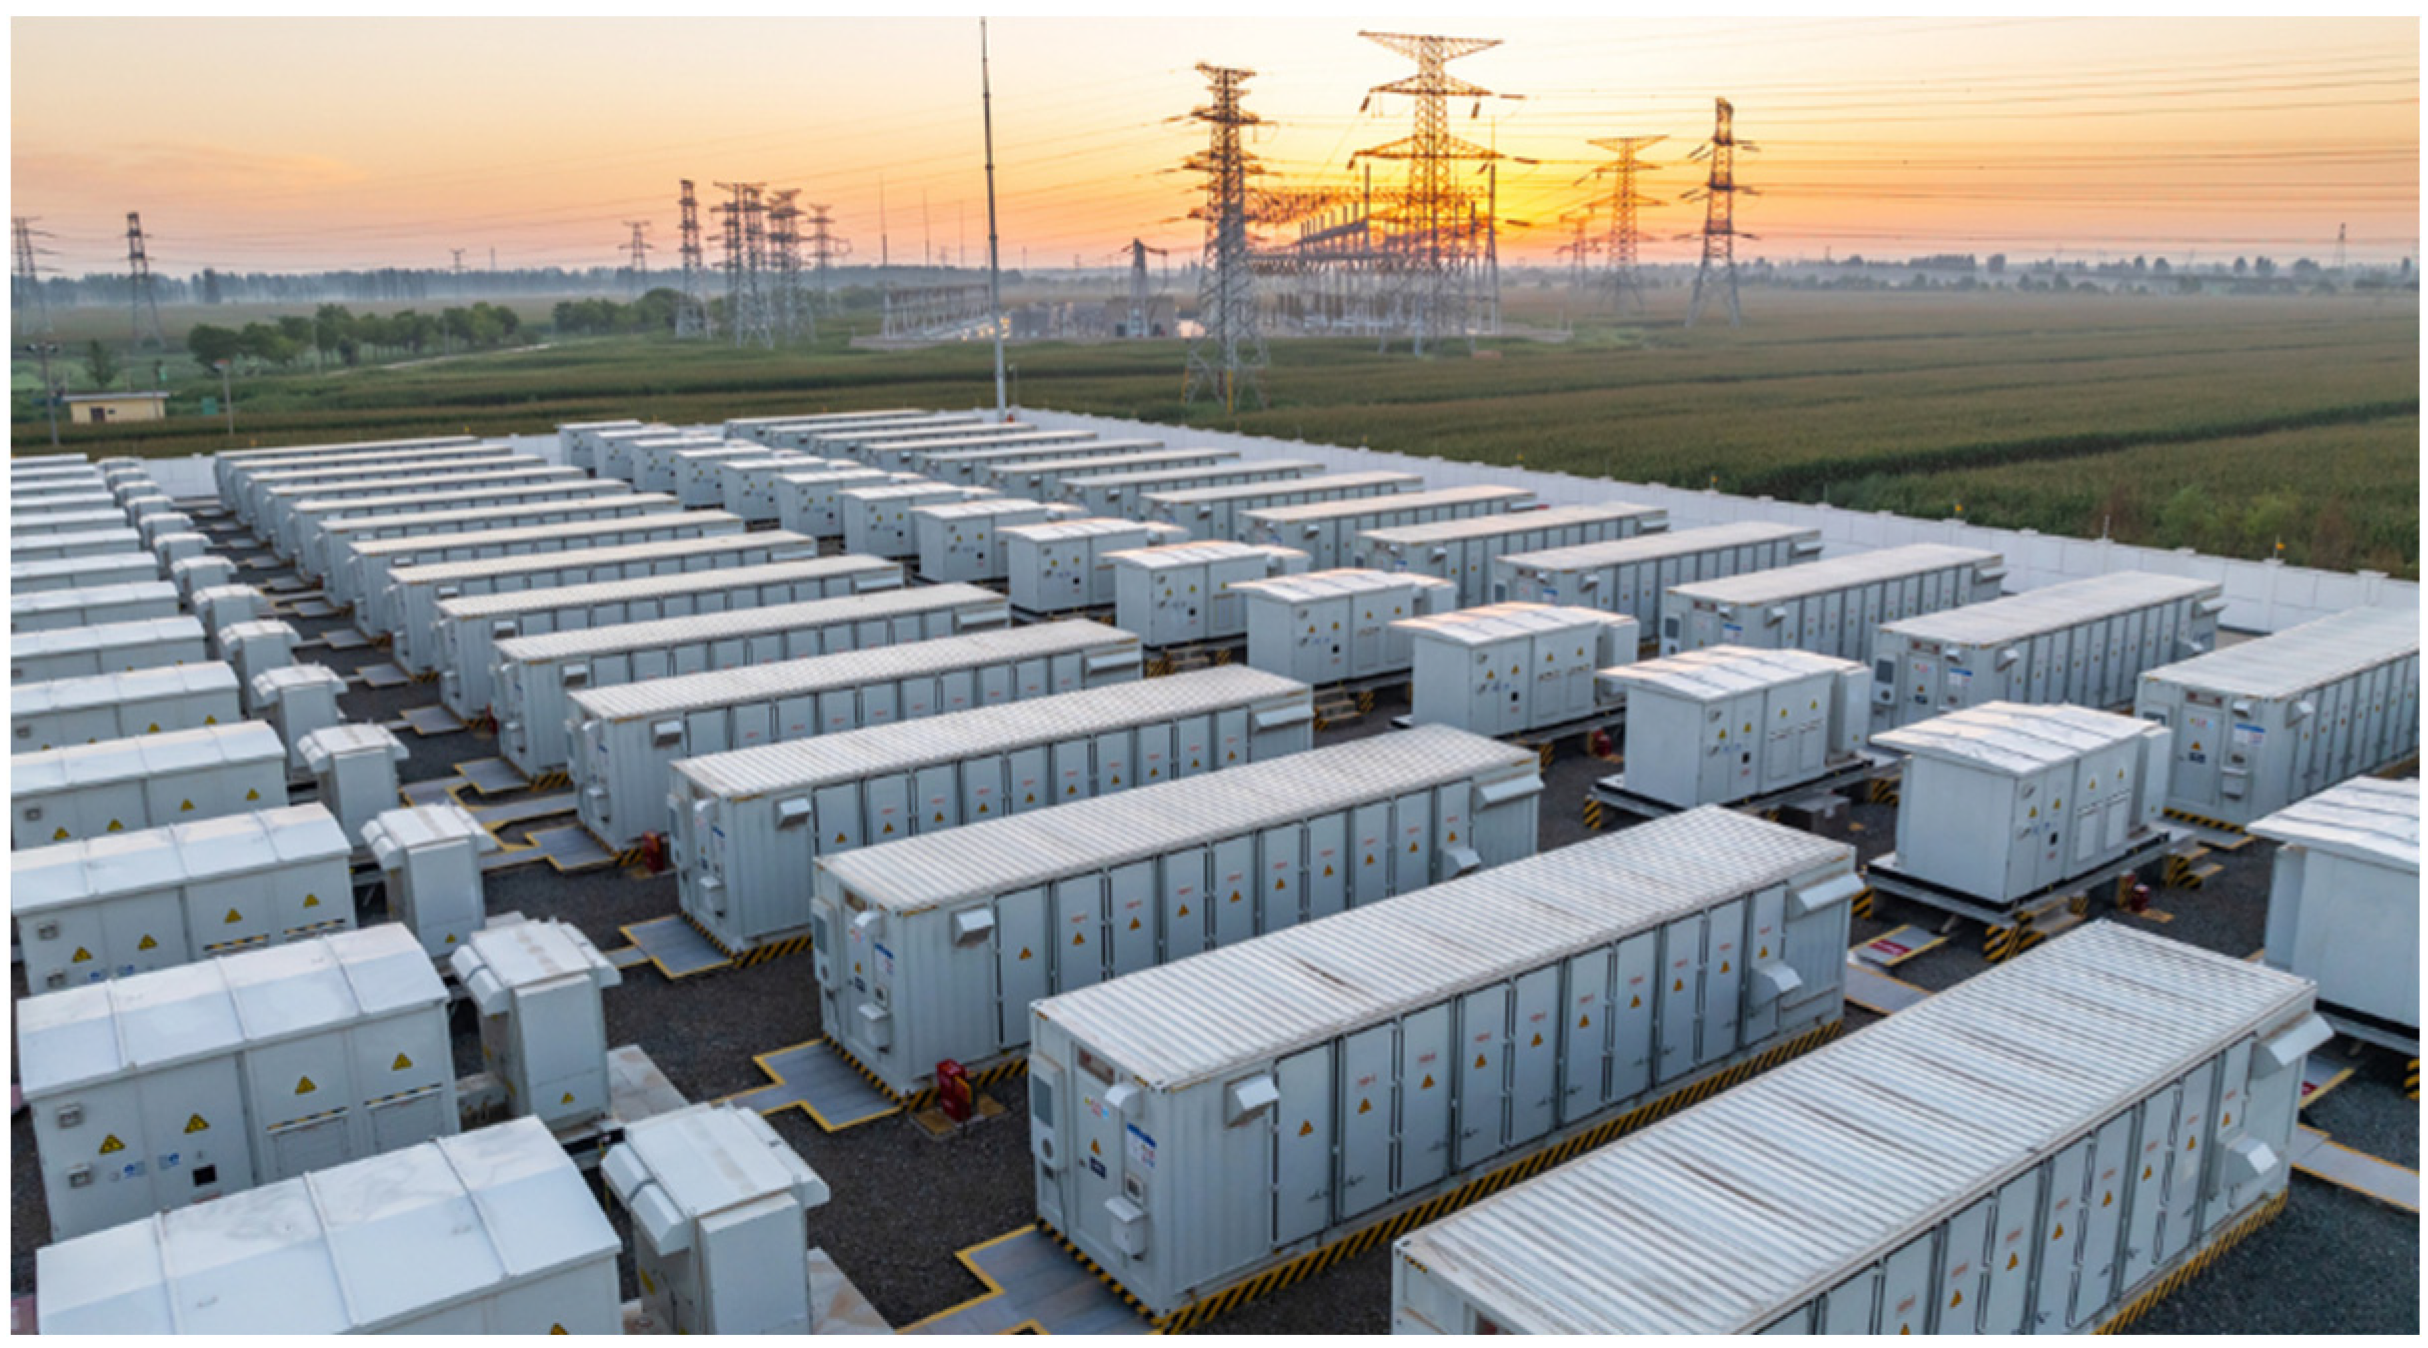
Electric energy storage (battery) [Optional]: For increased resilience in supplying electrical energy to the system and to counter the natural intermittence of renewable energy production, the use of batteries for storing excess electrical energy for consumption during periods of low or no production can be considered [23]. In Figure 4, an electric energy battery facility is shown.
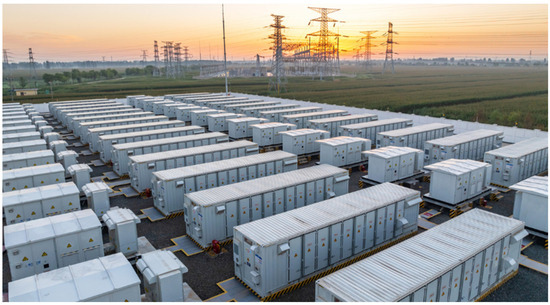
Figure 4.
Electric energy storage facility [24].
Water Supply: Water is an absolute necessity for hydrogen production through electrolysis. It can be supplied to the system from an aquifer, well, or local water reserve. A high degree of water purity is required for the electrolyzer, and it is important to note that the water treatment process must be carried out before its supply [25]. Impurities can seriously affect the electrochemical reaction by depositing on the electrolyzer, the anode surface, or the membrane [26]. Water quality requirements typically depend on the electrolyzer specifications. In most cases, deionized water is required, and many commercial electrolyzers already include a deionization step [27]. Potential water sources include seawater, estuarine water, surface water, groundwater, rainwater, municipal water supplies, urban wastewater, industrial wastewater, and cooling tower blowdown. Each source presents different water qualities and therefore requires different treatment processes—for example, seawater desalination, which involves associated operating costs, including electricity consumption. Common treatment methods include fine screening, coagulation–flocculation followed by filtration, ultrafiltration, and reverse osmosis [28,29,30].
Electrolysis: The electrolysis system is one of the most crucial aspects of the project, starting from selecting the most suitable system to its sizing. In this system, powered by water and electrical energy, hydrogen production takes place. Parameters such as its power, operating temperature, output pressure, and lifespan of the stacks must be taken into account. Some electrolysis systems—AEL, PEM—have achieved enough technological maturity to be commercialized; on the other hand, systems like AEM and SOEC still are in the research phase [31,32]. A summary of the existing technologies available and main information is presented in Table 1.

Table 1.
Resume of types of electrolyzers [12].
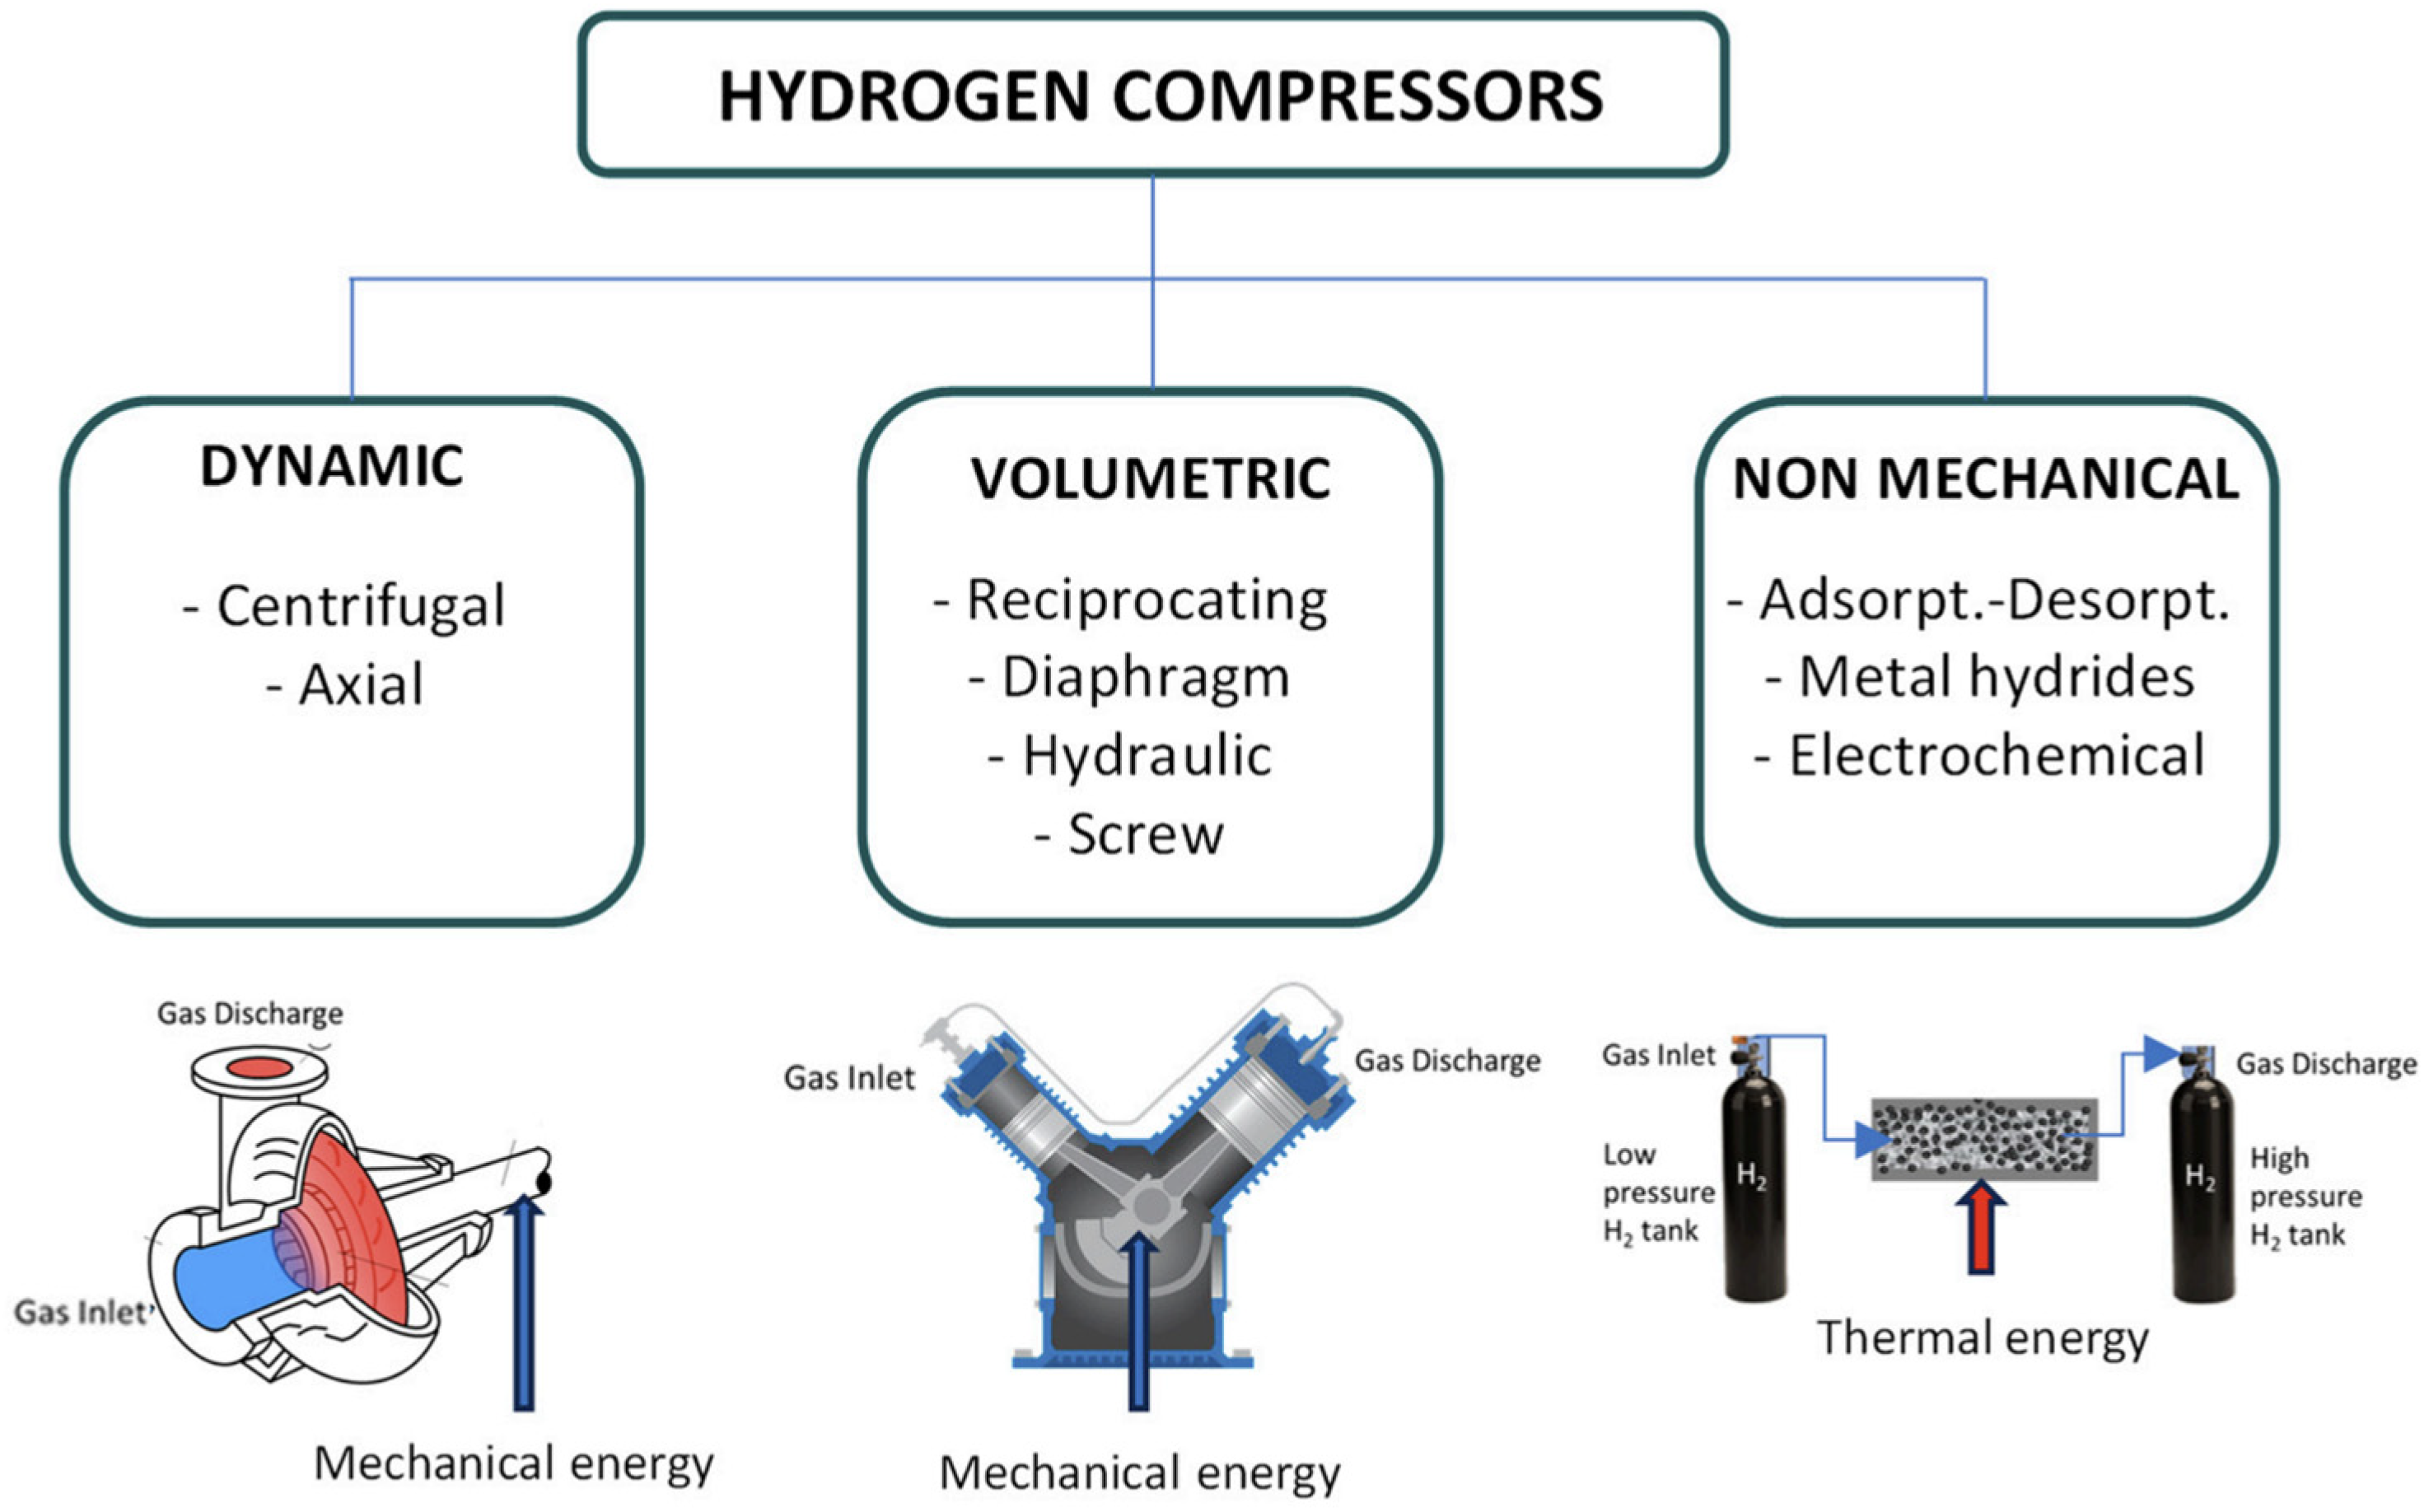
Compression: The hydrogen at the outlet of the electrolyzer is at a relatively low pressure. Depending on the type of electrolyzer and its use, compression might be needed at a higher pressure to supply to the consumer, either to an industry or to be injected into the grid. In both these applications, the pressure needs are possibly different. There is also the possibility of storing this hydrogen, which will probably require even higher pressures [33,34]. In Figure 5, some different types of compressors used to compress hydrogen are shown.
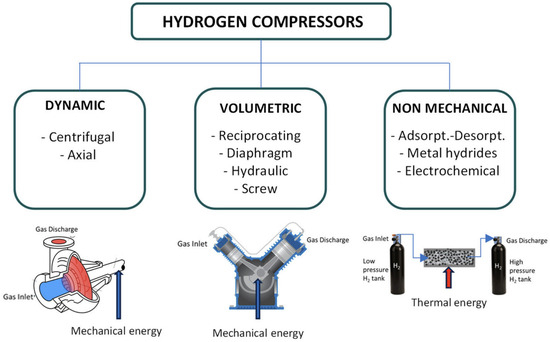
Figure 5.
Types of hydrogen compressors [35].
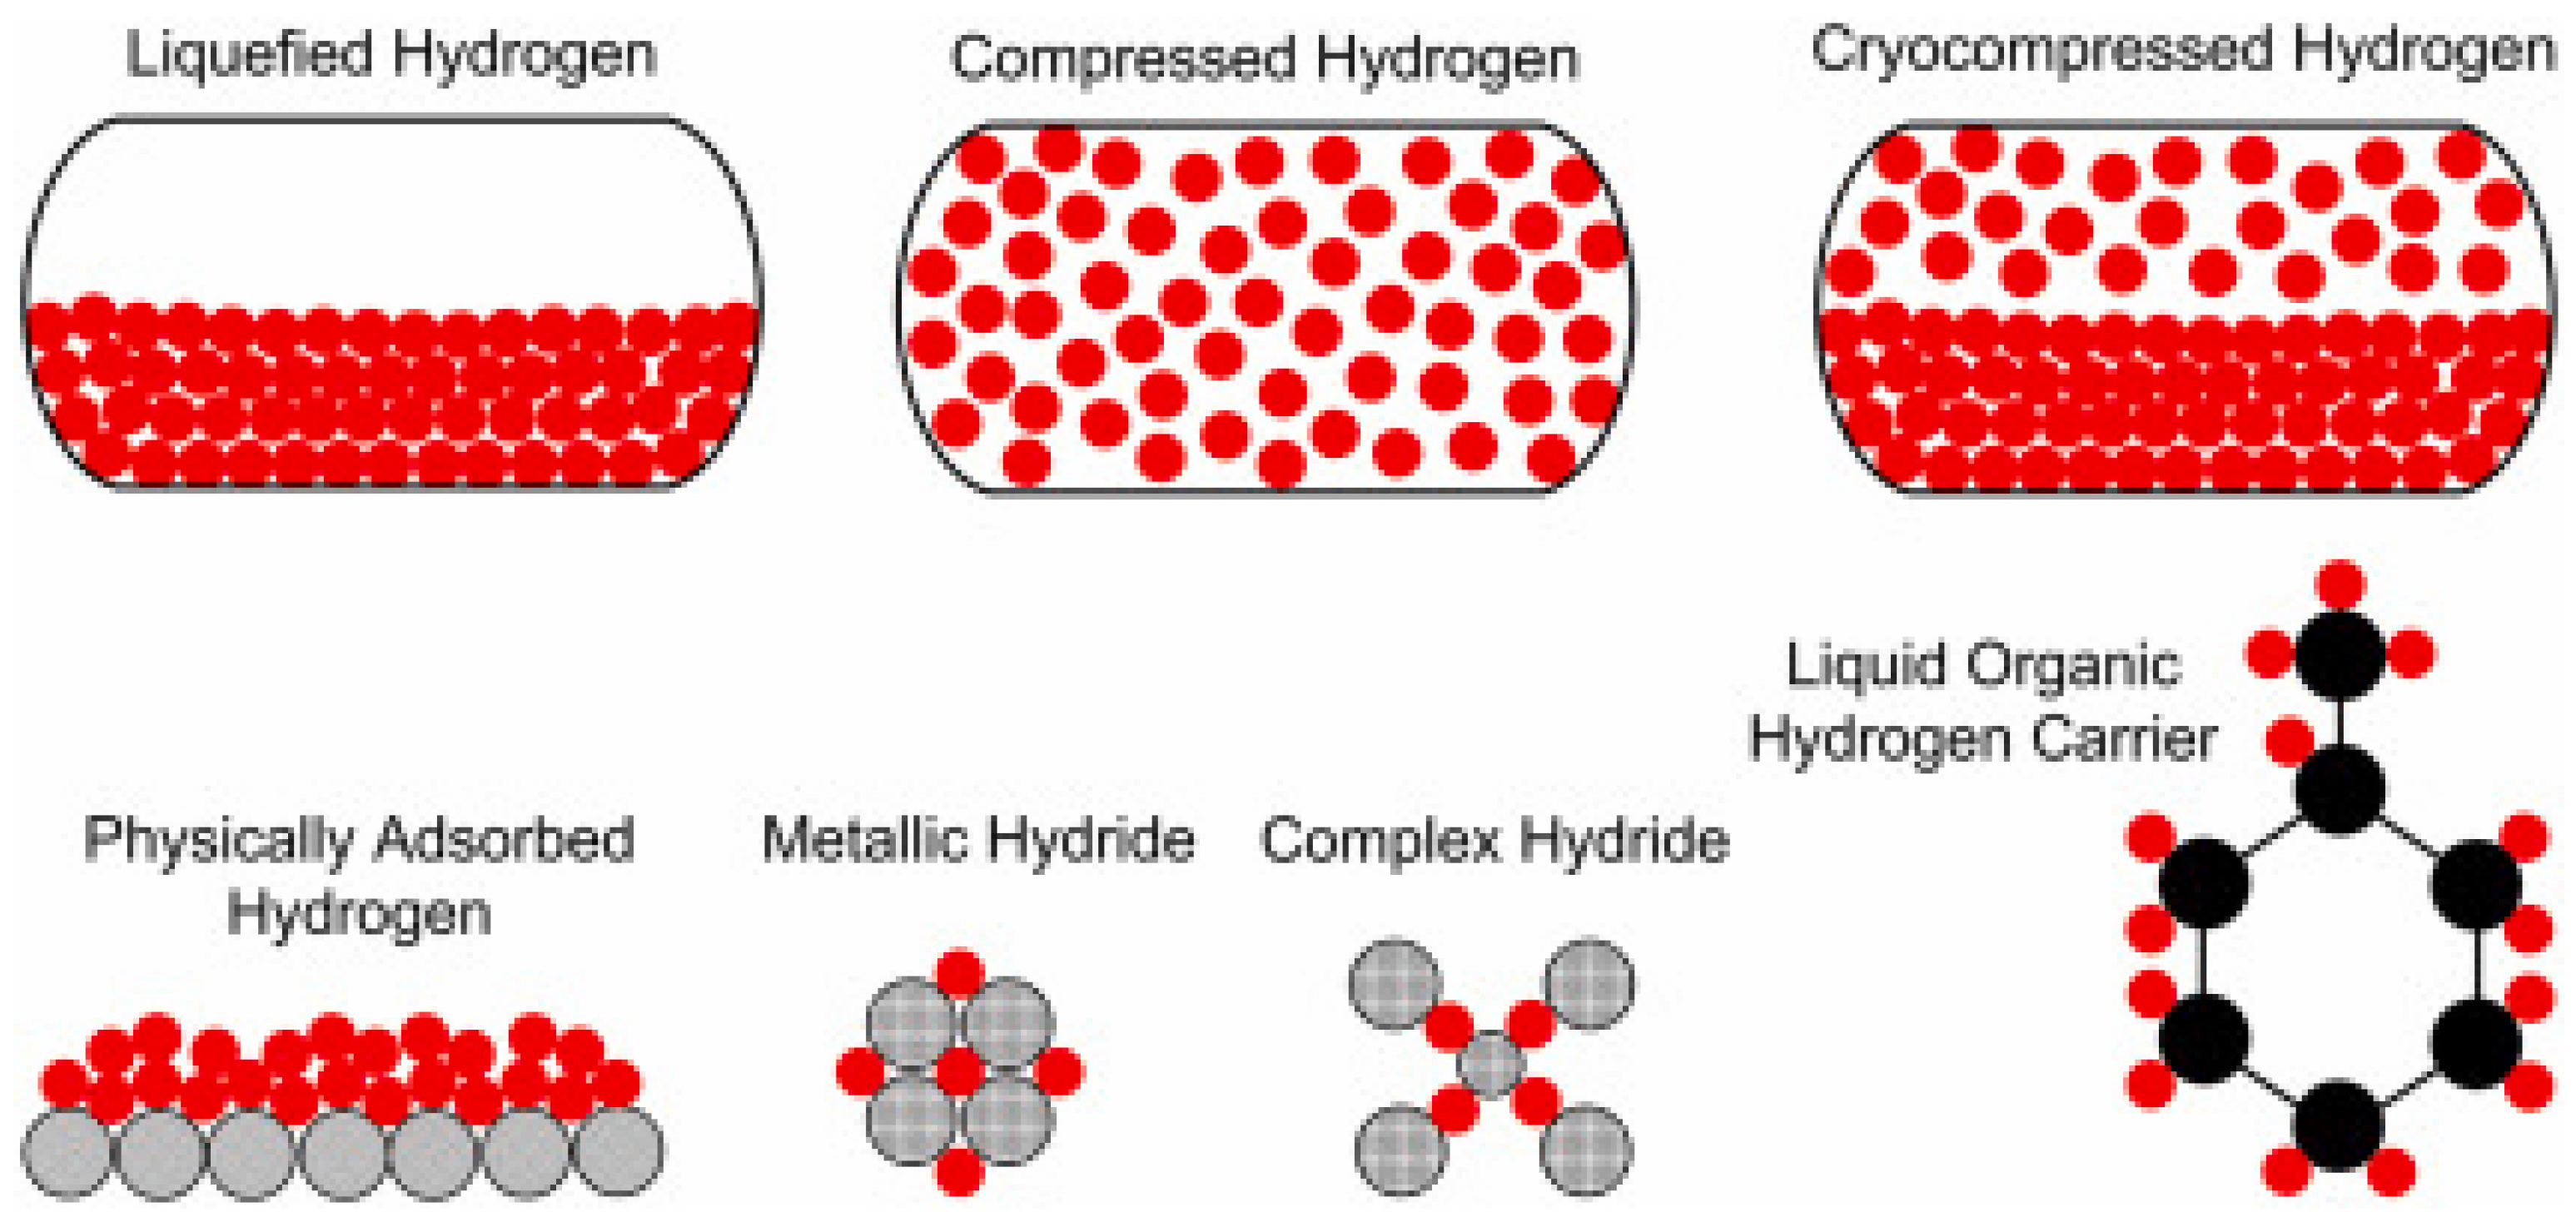
Storage: The hydrogen might be stored to create resilience of the system and to allow the system to still deploy hydrogen, even when not powered by renewable electricity. The same can be said for situations where the power supplied will result in higher hydrogen production than the demand. The storage functions as a way of giving flexibility and inertia to the system [36,37]. In Figure 6, there are some different types of hydrogen storage exposed.
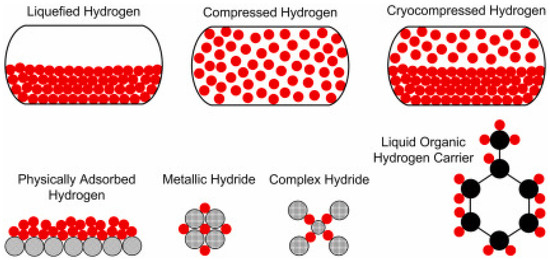
Figure 6.
Types of hydrogen storage [38].
Complementary Systems: Other systems necessary for the operation of the central system can be included, such as purifiers, dryers, cleaning systems, cooling, and security, among others [39].
2.2. TEA Analysis
2.2.1. LCOH
The Levelized Cost Of Hydrogen is a good metric to summarize the cost of production of hydrogen and compare it with other projects’ values in different geographies, with different energy resources or with different economic statuses. The LCOH accounts for capital costs (CAPEX) and operational costs (OPEX) to produce hydrogen and, therefore, allows the calculation to be performed on a common basis and the result to be compared for different paths of production. There are various ways of calculating the LCOH, dependent on the user’s perspective, details of the project, or the data available. The general concept is the following:
LCOH [EUR/Kg] = (Total cost of project)/(Total hydrogen production)
The LCOH is based on the premise of the cost of hydrogen per unit of mass produced, calculated over the entire project lifetime. This represents a limitation, as it requires estimating the total hydrogen production and associated costs over the full operational lifespan of the project [40]. As mentioned earlier, the lack of data from existing Hydrogen Production Plants (HPPs) limits the accuracy of such lifetime predictions [41].
At first glance, considering only the LCOH values, it might appear that viability analyses would yield similar results due to the relatively narrow range of these values. However, this assumption is incorrect. The LCOH accounts only for the cost of producing hydrogen (EUR/kg) and variable costs, excluding depreciation, interest, and other fixed costs. Therefore, while the LCOH is a useful metric to estimate the production cost per kilogram of hydrogen—providing an initial reference point for setting a potential selling price—it is important to remember that it is not a comprehensive economic viability indicator. Relying solely on the LCOH can be misleading when making investment decisions if not complemented by other economic assessment tools [42].
2.2.2. TEA Factor Analysis
The techno-economic assessment (TEA) is the most commonly used approach to evaluate the viability of a Hydrogen Production Plant (HPP) project, with the Levelized Cost Of Hydrogen (LCOH) typically serving as the primary comparative indicator to assess the project’s economic dimension [43,44]. However, as seen in various studies, LCOH values can vary significantly. While factors such as the project’s geographic location have a major impact on the final LCOH, it is not uncommon to find studies reporting widely differing LCOH estimates for projects with similar specifications and locations [45]. For instance, Correa et al. [46] estimated an LCOH of EUR 12.46/kg in Italy, whereas Superchi et al. [47] projected a minimum LCOH of EUR 5.7/kg for similar conditions.
As TEA is essentially a prediction of the future performance of an HPP, its outcomes depend heavily on the depth of system characterization and the use of realistic assumptions to generate pragmatic projections of future operations. The limited availability of operational data from off-grid green hydrogen projects remains a significant concern and may substantially affect the reliability of TEA results.
Electrolyzer Efficiency
Electrolyzer efficiency is one of the factors that most significantly affect the final LCOH value. Since efficiency depends on the electrolyzer load and gradually degrades over time, its modulation is not straightforward. Moreover, no studies have yet investigated how the efficiency curve evolves over the electrolyzer’s lifespan, beyond the general understanding that efficiency declines over time [48,49].
Rezaei et al. [50] conducted a techno-economic study of an off-grid green HPP project in Queensland, Australia, incorporating both economies of scale and learning effects, alongside a sensitivity analysis. The inclusion of a power-dependent electrolyzer efficiency was sufficient to reduce the LCOH by 10–20%, highlighting that assuming constant efficiency typically leads to an overestimation of the LCOH. Srettiwat et al. [51] assessed potential LCOH values for green hydrogen production from solar PV in Belgium, compared to importing hydrogen from Namibia or Morocco. In their analysis, electrolyzer capacities ranged from 90 to 100 MW, coupled with a PV plant of 700 MW for Belgium, and between 350 and 400 MW for Namibia and Morocco. Their sensitivity analysis identified electrolyzer efficiency as the most influential factor on the LCOH: varying efficiency by ±20% resulted in an LCOH range difference of nearly EUR 2/kg. Similarly, Gül et al. [52] evaluated the economic feasibility of green hydrogen production in Turkey, across three locations with capacity factors between 15.4% and 18.9%. With a 5 MW solar plant and a 1 MW PEM electrolyzer, the best projected LCOH for 2023 was USD 6.80/kgH2 at 70% electrolyzer efficiency; increasing efficiency to 80% reduced the LCOH to USD 5.87/kgH2. Khatiwada et al. [53] performed a global analysis of costs, barriers, and challenges for decarbonizing the Portuguese natural gas sector, also conducting a sensitivity analysis where electrolyzer efficiency was identified as one of the four key drivers influencing the LCOH. Finally, Rezaei et al. [54] explored the impact of factors such as PV capacity factor, electrolyzer efficiency, nominal interest rate, and inflation rate on the LCOH in solar PV-supplied green hydrogen projects. In this study, a 20% increase in electrolyzer efficiency alone resulted in a 12.5% reduction in the LCOH.
Capacity Factor
The capacity factor is another factor worthy of being analyzed and concerns the local climate and the portion of natural resources that are used to produce energy [AG, AH].
A pertinent example of the influence that the capacity factor has on the LCOH is the study developed by Correa et al. [46]. They studied possible future solutions for green hydrogen production in Italy. The analysis covers the totality of the supply chain, from the production of hydrogen to the supply of the HRSs (hydrogen refueling stations). Two scenarios are analyzed: the possibility of producing the hydrogen in Italy or producing it in Patagonia, Argentina, and importing it to Italy. The best LCOH achieved was for the Patagonia case, with an LCOH of EUR 8.6/kgH2 against the EUR 12.46/kgH2 of the Italian case. The authors justify this difference with the fact that liquefying hydrogen in Italy is expensive and with the astonishing difference in renewable resources. The Patagonia weather allows a capacity factor of 50% for the wind source, and the Italian weather only allows a capacity factor of 25%. The study developed by Rezaei et al. [54], already described in the electrolyser efficiency section allowed for the discovery that the increase in the capacity factor from 15% to 30% was significant and resulted in a 50% decrease in the LCOH, meaning that the proper choice of the renewable source location is critical to an economically viable green hydrogen project. Shin et al. [55] performed a sensitivity analysis on the green hydrogen production in South Korea using two different electrolyzers (PEM and ALK) and three different forms of renewable energy sources: onshore wind, offshore wind, and solar PV. The lowest LCOH obtained was for onshore wind and ALK technology with an LCOH of USD 7.25/kgH2. The sensitivity analysis showed that the capacity factor of the renewable source is the most impactful factor on the final LCOH, followed by the CAPEX and the OPEX.
CAPEX and OPEX
Capital expenditure (CAPEX) and operational expenditure (OPEX) are also key factors that significantly influence the final LCOH value, as noted by Shin et al. [55]. These costs represent a major portion of the overall investment in a Hydrogen Production Plant (HPP) and are central to the LCOH calculation. It is also important to consider replacement expenditure (REPEX), as electrolyzer stacks typically need to be replaced after approximately 10 years of operation—a cost that is far from negligible.
Superchi et al. [47] examined the decarbonization of hard-to-abate industries, specifically the production of green hydrogen for the steelmaking sector in Italy. The authors analyzed different plant sizing strategies to determine the most profitable configuration. A sensitivity analysis was also performed to assess the impact of various component costs on the final LCOH. The study identified equipment costs—particularly the electrolyzer price—as the most influential factor. A 70% reduction in electrolyzer price was shown to reduce the final LCOH by approximately EUR 1/kg.
Sadiq et al. [56] analyzed the LCOH under varying conditions, including different locations, PV technologies, electrolyzer technologies, and daily production rates. Their findings emphasize that economies of scale could substantially reduce hydrogen production costs, as OPEX accounted for 41% of the LCOH and CAPEX—primarily the cost of electrolyzer stacks—accounted for 31%.
Financial Parameters
Financial parameters, such as inflation and interest rates, can also significantly affect the final LCOH value [57,58]. As mentioned in Section Electrolyzer Efficiency, Rezaei et al. [54] conducted a sensitivity analysis on solar PV-supplied green hydrogen projects to evaluate the influence of various factors on the LCOH, including financial parameters. Their results highlighted the importance of maintaining a low inflation rate. For instance, assuming a fixed interest rate of 7%, increasing the inflation rate from 0% to 10% led to an approximate 70% increase in the LCOH. Conversely, fixing the inflation rate at 2% and increasing the interest rate from 0% to 12% resulted in a 42.6% increase in the LCOH.
Other Parameters
Rezaei et al. [54] incorporated learning effects and economies of scale to improve the reliability of their simulation. Scaling up the project contributed significantly to reducing the LCOH. The use of overload capacity (150% for a limited time) was also considered, with the authors concluding that it can further decrease the LCOH.
Dos Santos et al. [59] studied LCOH values for green hydrogen production from solar PV or offshore wind in Bahia, Brazil. They analyzed two scenarios using PEM electrolyzers with capacities of 50 MW and 100 MW. The lowest LCOH values were achieved in the larger-scale case (100 MW), reinforcing the positive impact of scaling up on reducing the LCOH.
Hofrichter et al. [60] analyzed the relationship between electrolyzer power and the energy power source (Ely-RES ratio). Three different locations were evaluated: one with high, one with low full-load hours from the selected renewable source (wind or solar), and one location in Germany. According to the authors, there is no ideal Ely-RES ratio, as the optimal range appears to be relatively broad. However, for solar energy, an Ely-RES ratio between 20% and 30% resulted in the lowest LCOH values. It was also observed that, as project power capacity increases, the Ely-RES ratio becomes less influential.
Ourya et al. [61] examined the LCOH of various off-grid hydrogen projects in Moroccan cities, using a hybrid supply of PV and wind energy. They found that the cost of water desalination could be considered negligible, as it represented only 0.12% to 0.35% of total net present costs. On the other hand, flexibility in hydrogen supply—achieved through the installation of hydrogen storage tanks—could reduce the overall LCOH by approximately 17%, making such installations beneficial.
Park et al. [62] investigated the optimization of solar-powered green hydrogen projects across different locations worldwide. Their study assessed the LCOH, annual hydrogen production, and electrolyzer capacity ratios, based on a fixed 100 MW solar power input while varying electrolyzer capacity and battery storage. The target regions included the USA, Australia, South Korea, and China. The use of batteries increased the electrolyzer’s capacity factor and hydrogen production; however, from an economic perspective, it was not favorable, as it led to an increase in the LCOH.
2.3. Techno-Economic HPP Tools
2.3.1. Levelized Cost of Hydrogen Calculator
Introduction
«The Levelized Cost of Hydrogen (LCOH) Calculator allows the calculation of hydrogen production costs via low-temperature water electrolysis in the different EU27 countries, Norway, or the UK. A selection of four different electricity sources is provided in the calculator (Wholesale, PV, Onshore, or Offshore wind) [63]».
The Levelized Cost of Hydrogen Calculator was developed and is available in the European Hydrogen Observatory in the form of a web-based graphic interface.
Main features
- ▪
- Many locations available to define the project and the option to use solar, wind, hybridization, or grid electricity.
- ▪
- Friendly user application due to its simplicity.
- ▪
- Considers variable electrolyzer efficiency due to degradation.
Limitations
- ▪
- The tool has an informative and pedagogical character but is not very detailed or complex.
- ▪
- It is not possible to input the user’s renewable energy data, and the temporal base of analysis is annual.
- ▪
- There is a disregard for other components of the HPP otherwise than the electrolyzer.
- ▪
- The economic indicators are not explored deeply, besides subsidies or taxes on electricity. Economy of scale or a learning rate to predict price variation is not considered.
- ▪
- Since the temporal basis of analysis is annual, the tool is not sensitive to a variable electrolyzer efficiency due to different load charges.
- ▪
- A hydrogen demand input is not considered to condition the LCOH value calculation.
2.3.2. H2A Lite
Introduction
«The model uses a generally accepted accounting principles analysis framework and provides annual projections of income statements, cash flow statements, and balance sheets. H2A Lite allows users to generate a side-by-side scenario analysis, where a base system can be tested by varying key operating or financing parameters. Detailed capital structure, taxation, and incentives are included. The model has built-in risk analysis allowing impact assessment of parameters bearing user-specified uncertainty ranges. Financial articulation is presented in graphical and tabular format for the user-specified analysis period. The model is self-documented, with embedded help functions and annotation of input parameters [64]».
H2A Lite is a tool developed by the National Renewable Energy Laboratory (NREL) to calculate the LCOH, and its main feature is the detailed economic model used to predict the costs and earnings through the years concerning the functioning of an HPP. The tool is available online in the form of an Excel file.
Main features
- ▪
- Economic analysis is very detailed and complete.
- ▪
- There is the possibility of choosing many forms of energy to supply the HPP.
- ▪
- Sensitivity analysis is integrated in the simulation calculus of the LCOH.
- ▪
- There is a section labeled Overrides that allows the definition of individual parameters to be input on an annual temporal basis. This includes data from energy to economic parameters.
- ▪
- Graphical outputs make it possible to have a great and intuitive visualization of the economic viability of the project. One example is a graph that enables the perception of what year the breakeven point is, which is achieved by showing annual results of cash flow balance.
Limitations
- ▪
- Temporal basis defined to analyze the inputs of the project is annual.
- ▪
- The electrolyzer efficiency is not variable with the load charge variation nor with degradation (even though the tool predicts the stack substitutions on a 10-year interval basis).
- ▪
- It is not possible to input the user’s renewable energy data, and the temporal base of analysis is annual.
- ▪
- There is a disregard for components of the HPP other than the electrolyzer. From a technical standpoint, the tool does not perform a technical characterization of the HPP in depth, as it does with the economic parameters.
- ▪
- It does not consider a hydrogen demand input to condition the LCOH value calculation.
2.3.3. HyJack
Introduction
HyJack is an online platform that makes possible the calculation of the LCOH, among other project characterization indicators, to study the techno-economic viability of a green hydrogen production project. The project is still in development with some modules already available to characterize the functioning of an HPP. Modules of renewables other than solar are promised to be included as well, such as biofuels. The tool is completely modular, which means that it is possible to create the functioning layout of the HPP as wished. Most of the calculation is performed under assumptions that are made by the creators and assumed as default; nevertheless, most of this can be edited.
The HyJack tool is an online open-source tool available in a web-based format [65].
Main features
- ▪
- Friendly user application with intuitive layout construction and module personalization.
- ▪
- The tool is modularized, allowing the personalization of the functioning layout as wished.
- ▪
- The tool includes several modules of functioning, like the compressor, water purifier, and storage, among others.
- ▪
- There is simple but sufficiently good and extensive economic characterization of all the activities of the HPP project.
Limitations
- ▪
- Even though the tool is modularized, the modules are not linked or related, which means that the tool does not restrain different or displaced variables between connecting modules. The inputs are completed individually in each module and do not condition the previous or following ones in the chain.
- ▪
- The electrolyzer efficiency is considered in terms of load or degradation, but, since the temporal analysis basis is annual, the efficiency regarding the load variation is constant, since this load is considered stagnant.
- ▪
- The operation cost prediction is not detailed but rather rough. The cost is based on an annual average energy input.
- ▪
- An economy of scale or a learning rate is not considered to predict the equipment price drop.
- ▪
- Does not consider hydrogen demand to condition the calculus of LCOH and economic viability of the HPP project.
2.3.4. EH2 Analytics Suite
Introduction
«A detailed Levelized Cost of Hydrogen tool incorporating a comprehensive set of plant and operational parameters like hybrid solar and wind power supply, renewable capacity over-sizing, water supply cost, support mechanisms (grants and tax credits), and storage sizing and costing [66]».
The EH2 Analytics suite is a tool available online, and it is shown in the form of a web-based interface.
Main features
- ▪
- Considers the input of variable hydrogen demand.
- ▪
- The temporal basis of analysis is hourly.
- ▪
- The efficiency of the electrolyzer is variable either with the degradation factor and either with the load charge variation. Since the renewable energy input is given on an hourly temporal basis, this efficiency is updated hourly.
- ▪
- Considers solar, wind, hybridization, and grid aid in the energy supply.
- ▪
- The energy supply can be added as a function of the local coordinates of the power source on an hourly basis.
- ▪
- Considers the several stages of hydrogen production and processing of an HPP.
- ▪
- The graphical output is very pertinent to understanding the hourly variation implications in the yearly production.
Limitations
- ▪
- Does not consider economy of scale or learning rate to predict price reduction in equipment.
- ▪
- Fixed Layout.
2.3.5. HySupply Cost Calculator
Introduction
«The HySupply Cost Analysis Tool is a Microsoft Excel Workbook developed to model the hydrogen output and costs involved in the production of green hydrogen from solar, wind, and combined solar and wind (referred to as hybrid) power plants in Australia. The tool extends beyond current state-of-the-art models, by providing the user the complete freedom to define their desired plant capacities and design a wide variety of configurations to integrate the electrolyzer and the renewable power plant, which include options for a grid-connected, off-grid, and battery connectivity [67]».
The HySupply cost calculator is a techno-economic tool to analyze the viability of an off-grid green HPP, and it is available in the form of an Excel file on the GlobH2E website page.
Main features
- ▪
- The temporal basis of analysis is hourly.
- ▪
- The efficiency of the electrolyzer is variable either with the degradation factor and either with the load charge variation. The efficiency is updated hourly.
- ▪
- Considers solar, wind, hybridization (several different combinations), and grid aid in the energy supply.
- ▪
- Considers economy of scale.
- ▪
- Considers the use of electric batteries.
- ▪
- Detailed considerations on economic parameters like loan share details, detailed breakdown of costs, for example, with salvage and decommissioning costs, and economy of scale.
Limitations
- ▪
- Non-modularized (the HPP characterization relies exclusively on the power source and electrolyzer modules).
- ▪
- Fixed layout of the HPP.
- ▪
- Hydrogen storage possibilities are not considered.
- ▪
- Does not consider hydrogen demand to condition the calculus of LCOH and economic viability of the HPP project.
2.3.6. Galway University Tool
Introduction
«The tool calculates technical, economic, and environmental parameters, including optimal electrolyzer capacity, the LCOH, and the equivalent CO2 emissions avoided through the use of hydrogen instead of fossil fuels. The model takes hourly wind, solar, and electricity market price data as inputs, as well as the hourly demand profile for hydrogen over a full year. Based on user-defined storage size, the model makes an hourly decision whether to operate the electrolyzer at full load, partial load, or shut down, aiming to maximize the use of VRE, dispatch down, or cheap electricity to meet hydrogen demand [68]».
This is a tool developed in an academic environment, more concretely in Galway University, and it was developed in an Excel file. It is not currently available to the public, since its main purpose of creation was the scientific dissemination of techno-economic viability studies on hydrogen hubs.
Main features
- ▪
- The techno-economic analysis is very complete, covering not only the productive process but also extending the analysis to the storage and distribution of hydrogen.
- ▪
- The temporal basis of analysis is hourly.
- ▪
- The economic parameters and costs were studied and substantiated by the authors.
Limitations
- ▪
- Does not consider variable electrolyzer efficiency, nor load variation or depreciation.
- ▪
- The depreciation is not accounted for.
- ▪
- The layout is fixed.
- ▪
- The tool is not modularized, and, even though it considers the extension of an entire hydrogen hub when characterizing the project, there is a lack of description of other elements like compressors and water purifiers.
Future features
Since this is still a tool in development, its developers are considering the future improvement of the tool with the inclusion of the following features:
- ▪
- Developing the tool in Python 3.11 or MATLAB 2023a to extend the future span of possible features to be included. As far as the researchers linked with this tool are concerned, the tool has achieved its limited potential within the frontiers of Excel development.
- ▪
- A statistical analysis concerning how many years of data on renewable energy are needed to perform the most accurate simulation is being studied. Most tools rely on one year of data and multiply it by the number of years of operation.
2.3.7. Hydra H2 Tool
Introduction
«A techno-economic tool was developed in order to optimize the green hydrogen system sizing to cover a hydrogen demand. The analyzed system consists of the following: an off-grid renewable energy power plant; an electrolyzer; hydrogen conversion/processing facilities; and hydrogen storage and transport facilities. The cost related to each subsystem is considered to determine the Total Levelized Cost of Hydrogen (LCOHT), which is used as a unique parameter to compare the different sizing configurations. The LCOHT includes hydrogen production, conversion/processing, storage, and transportation costs [69]».
This tool is being developed in Argentina by a group of researchers connected with the Catamarca University. The tool does not yet have a graphical interface but has already been tested and used to publish scientific content. It is important to note that one of the main purposes of developing this tool was to add an optimization functionality, so other features like the modularization of the tool are difficult to implement and may not be relevant for the general purpose of the tool.
Main features
- ▪
- It is the only tool in this exposition that provides an optimization feature that allows the user to size the power source and the electrolyzer in function of the LCOH.
- ▪
- The use of economies of scale is considered.
- ▪
- The economic parametrization is detailed.
- ▪
- The hydrogen demand is accounted for and possible to be set as a variable.
- ▪
- The temporal basis is hourly.
- ▪
- Renewable energy can be provided on an hourly basis.
- ▪
- The use of learning rates for future cost prediction.
Limitations
- ▪
- The electrolyzer efficiency is not variable with load (the implementation has not been performed due to the lack of knowledge on the variation in the load curve over the years and consequent degradation).
- ▪
- The tool is not modularized, and some of the components of the HPP are overlooked, like the compressor.
Future features
- ▪
- Development of a software application.
- ▪
- Carbon emissions—comparison of emissions for cases where the exportation is considered.
- ▪
- Consideration of synthetic combustible fuels like ammonia, methanol, among others.
2.4. Tool Comparison
The tools were compared using features that are not easy to implement and can easily differentiate them from each other. In Table 2, the tool comparison mentioned is presented. It is important to state that the purpose of the tools in analysis is similar, not equal. It should be reinforced that some of these tools are more targeted to the user’s control, by giving them the total freedom to input all the data needed. Others are targeted to the input of more general inputs, suggesting more specific inputs like the prices of technology, and others like the Hydra H2 Tool also have the purpose of optimizing parameters of operation to produce the lowest LCOH possible.

Table 2.
Tool feature comparison.
The tools were classified according to four different indicators: specification, related to the degree of specification and characterization of each tool of the functioning of an HPP; modularity, if the tool is modular and presents itself disaggregated in different modules like the electrolyzer or compression; optimization, the capability of the tool to optimize project power capacities to generate the best LCOH value possible; and temporal basis, related to the read and processed data rate on the HPP functioning, like energy supply information. In Table 3, the classification of the TEA tools is shown. The methodology used to define the degree of specification was used with two parameters: economic specification (a good number of economic parameters to specify the HPP functioning); hourly basis of work (resolution of energy data should be hourly). Tools with 0 of these parameters fulfilled are rated with a low specification degree, tools with 1 of these parameters fulfilled are rated as medium specification, and tools with 2 of these parameters fulfilled are rated with a high specification degree.

Table 3.
Classification of the TEA tools.
3. Case Study
The main objective of this study is to evaluate some TEA tools on off-grid green hydrogen projects that are currently available to use or are under development. A simulation guide was developed to standardize the input of all the tools and analyze the results and their differences. There are seven different tools under analysis in this study: the Levelized Cost of Hydrogen Calculator, H2A Lite, HyJack, HySupply cost tool, EH2 Analytics Suite, a tool developed at Galway University, and Hydra H2. The Galway University tool will not be part of the simulation study, since it is still under development. The vast variety of ways to describe or characterize an HPP functioning is acknowledged here. The developers of the tools in analysis took distinct approaches to the problem, considering different and, in some cases, unique variables. Nevertheless, a homogenization of the characterization of the HPP is elaborated, considering the diverse detail specification levels of the tools.
Simulation Guide
A simulation guide was prepared to perform a unique case study simulation with all the tools (except the tool developed by Galway University, since it is still under development) and with the same input values. The objective is to understand the effect that the overspecification or underspecification of values of a functioning HPP will have on the LCOH value. In Table 4, Table 5 and Table 6, it is possible to observe the defined technical inputs, economic inputs, and financial inputs. The inputs were defined based on a real case scenario HPP specifications.

Table 4.
Technical inputs.

Table 5.
Economic inputs.

Table 6.
Financial inputs.
4. Results and Discussion
The simulations for each of the selected tools were conducted following the simulation guidelines outlined in the Methodology Section, with minor adjustments or exclusions made for tools that do not account for specific variables in their characterization.
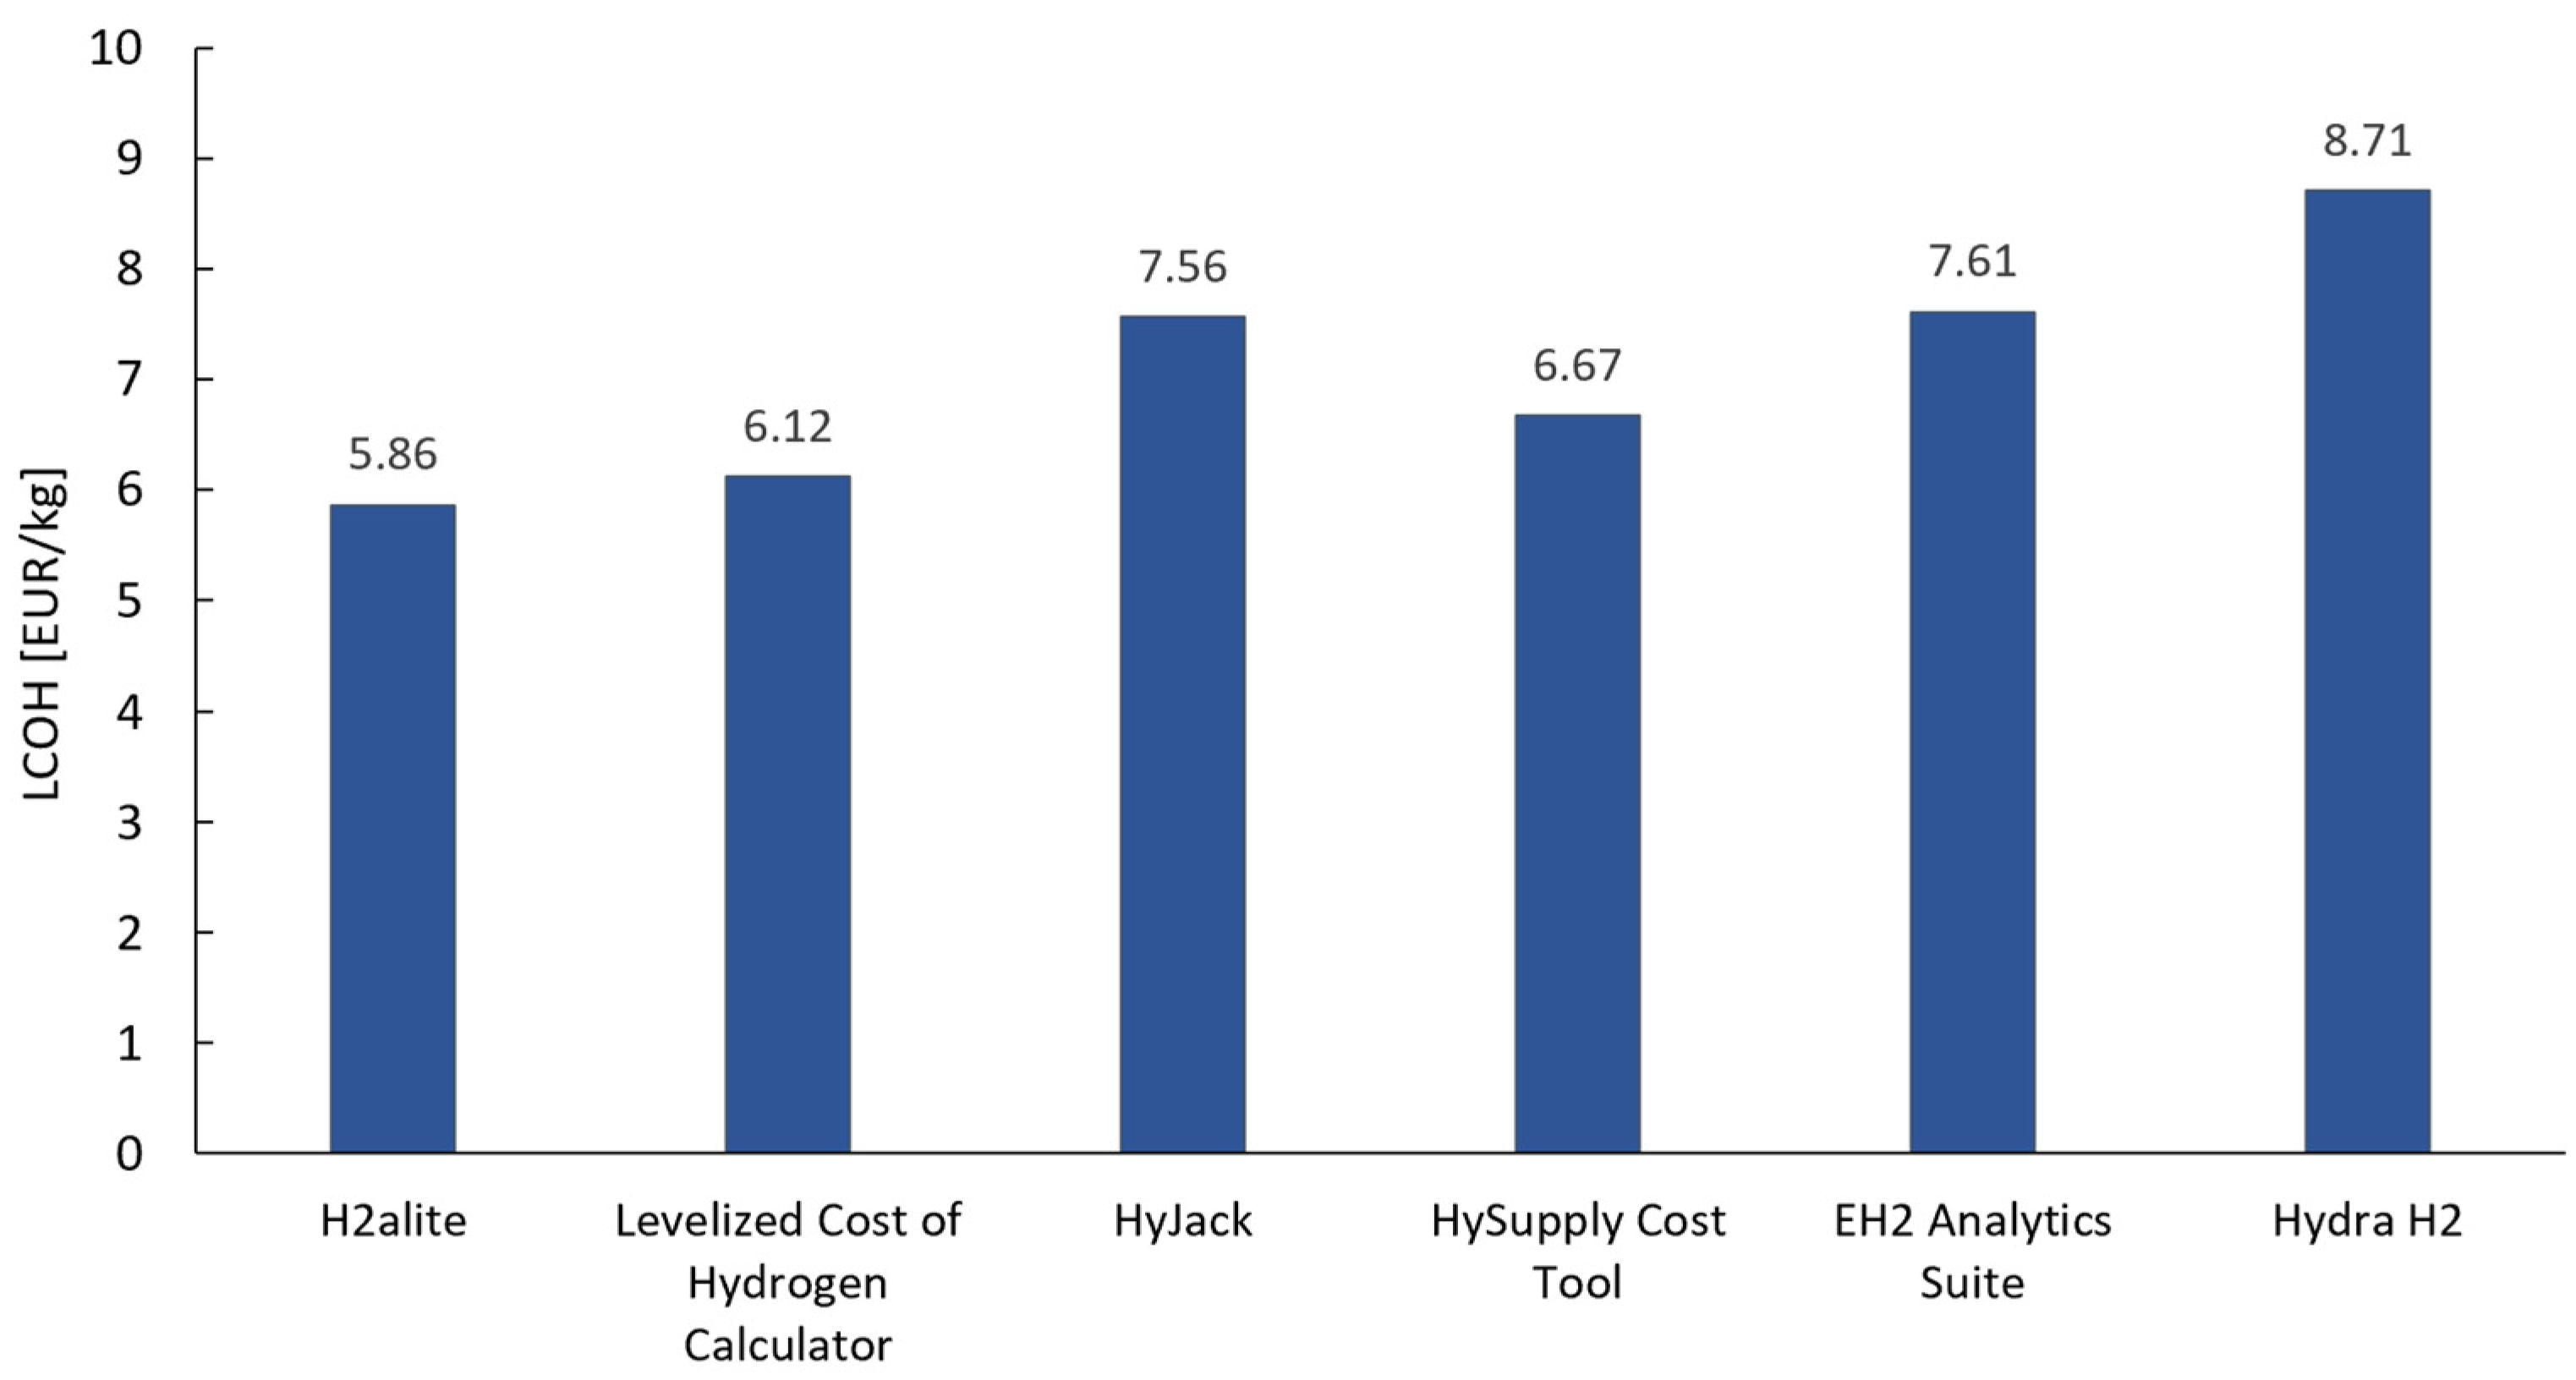
As can be seen in Figure 7, the results of the simulations performed in each selected tool are exposed. The LCOH values obtained showed dispersion with a range of EUR 2.85/kg. The dispersion of LCOH values is the result of the different methods linked with each of the tools and with the different factors accounted for in some of the tools, like the temporal basis of simulation, energy source, electrolyzer characterization, and financial and economic parameters.
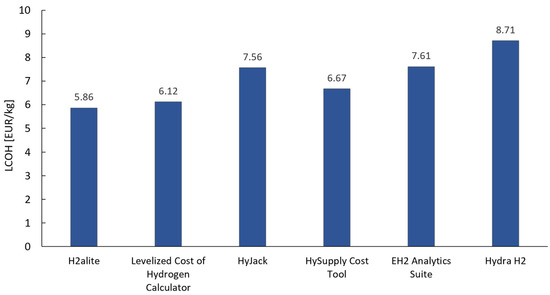
Figure 7.
LCOH results from the simulations performed for each of the tools selected.
The Levelized Cost of Hydrogen Calculator is a tool with fewer input spaces and with the simplest calculus method. The general costs calculated are related to the electrolyzer and the energy cost used. The input for the energy modulus selected initially was only CAPEX and OPEX. Since the Levelized Cost Of Hydrogen Calculator relies only on the LCOE, its calculation was made based on a prediction of the energy produced, energy unused, and on the total value spent on the PV farm (CAPEX and OPEX). The value calculated was EUR 40.7/MWh (considering only the energy used by the electrolyzer). The LCOH calculated was EUR 6.12/kg.
The H2A lite presents a EUR 5.86/kg LCOH value. Like the Levelized Cost Of Hydrogen Calculator, this tool is very simplified in the technical inputs with total production of hydrogen, total production of energy, and cost of energy. Even though the tool is very rich in financial detailing, the simplification of technical costs calculations and the consideration of a yearly temporal basis of analysis contribute to a more optimistic prediction of the LCOH. The fact that the data is not tracked hourly might be one of the indicators impacting the lack of precision.
The HySupply Cost tool presents a EUR 6.67/kg LCOH value. This value is very close to the mean of all values calculated. The tool allows a complete characterization of the electrolyzer functioning and the energy source, with hourly data available. The input related to storage or compression is nonexistent, so it is the main gap of the tool.
The EH2 Analytics Suite presents a EUR 7.25/kg LCOH value. Similarly, the HySupply Cost tool allows a complete characterization of the energy source module and the electrolyzer settings. The primary difference was linked with the capacity input of the electrolyzer, which was not given in power but in hydrogen produced per day. The compressing and storage units’ inputs are not considered.
The HyJack presents an LCOH of EUR 7.56/kg. This tool presents a different structure for cost calculation. The CAPEX values are not user input, and the calculation method is different, relying on the extreme months of performance (minimum and maximum) to proceed with the calculation of a possible range of values. There are some additional factors to increase the base cost of the basic components of the HPP.
The Hydra H2 tool presents an EUR 8.71/kg LCOH value, way above the other prices calculated. The Hydra H2 tool made a higher prediction of costs in all the sections calculated and even added storage costs to the mix. For example, based on the energy inputs established in the Methodology Section, we have estimated a EUR 40.7/MWh LCOE, and the tool estimated this value to be around EUR 50.3/MWh. The characterization of all the modules is very complete, and the accountability of extra data like civil work or processing is indicative of a higher LCOH estimation. The main objective of the tool is to perform optimization of the dimensions of the modules of the HPP, and, based on that, the tool also proposes a new HPP power setting with a lower LCOH. So, according to the results, if the project were adjusted to a 120 MW electrolyzer and a 221 MW solar farm, the LCOH could drop to EUR 7.73/kg. The demand constraint imposed in the tool enables identifying that the demand established was too high and that only 80% of that was being fulfilled.
After analyzing the different LCOH values, it is essential to conduct a more thorough analysis of the composition of the LCOH value. Table 7 shows the lifetime production of hydrogen calculated per tool, the lifetime cost of the project, and the variation in these values when compared with the average value of all tools considered. Considering the lifetime production of hydrogen is important to note that there are three tools with a lower value than the average (Levelized Cost of Hydrogen Calculator, H2aLite, HyJack), 7 to 11%, and the other three tools have a reasonably higher prediction of hydrogen production, 5 to 15% higher values. This can be explained by the fact that the three tools with a higher hydrogen production are related to an hourly analysis on solar power and hydrogen production, which shows to have a higher prediction of hydrogen production than other tools with monthly (HyJack) or annual resolution. Regarding the project lifetime costs, the differences in estimation are considerably higher. The deviation of project cost from the average is about 23% for H2aLite and the Levelized Cost of Hydrogen Calculator, below average. HyJack and HySupply Cost Tool have values closer to the average, around −4% and 0.3%, respectively. EH2 Analytics Suite and Hydra H2 made the higher project cost predictions with 23% and 28% values, above the average. Both Hydra H2 and EH2 Analytics Suite account for the daily demand of hydrogen, and this is a constraint that limits the sale of all the hydrogen produced, increasing the levelized cost of the hydrogen of the project.

Table 7.
Hydrogen production prediction and total cost estimated per tool.
Project cost has a much higher variability when it comes to predicting its value. Therefore, it is the variable that contributes a larger scale to the higher variability of the LCOH value displayed by the tools evaluated (can show % variability values).
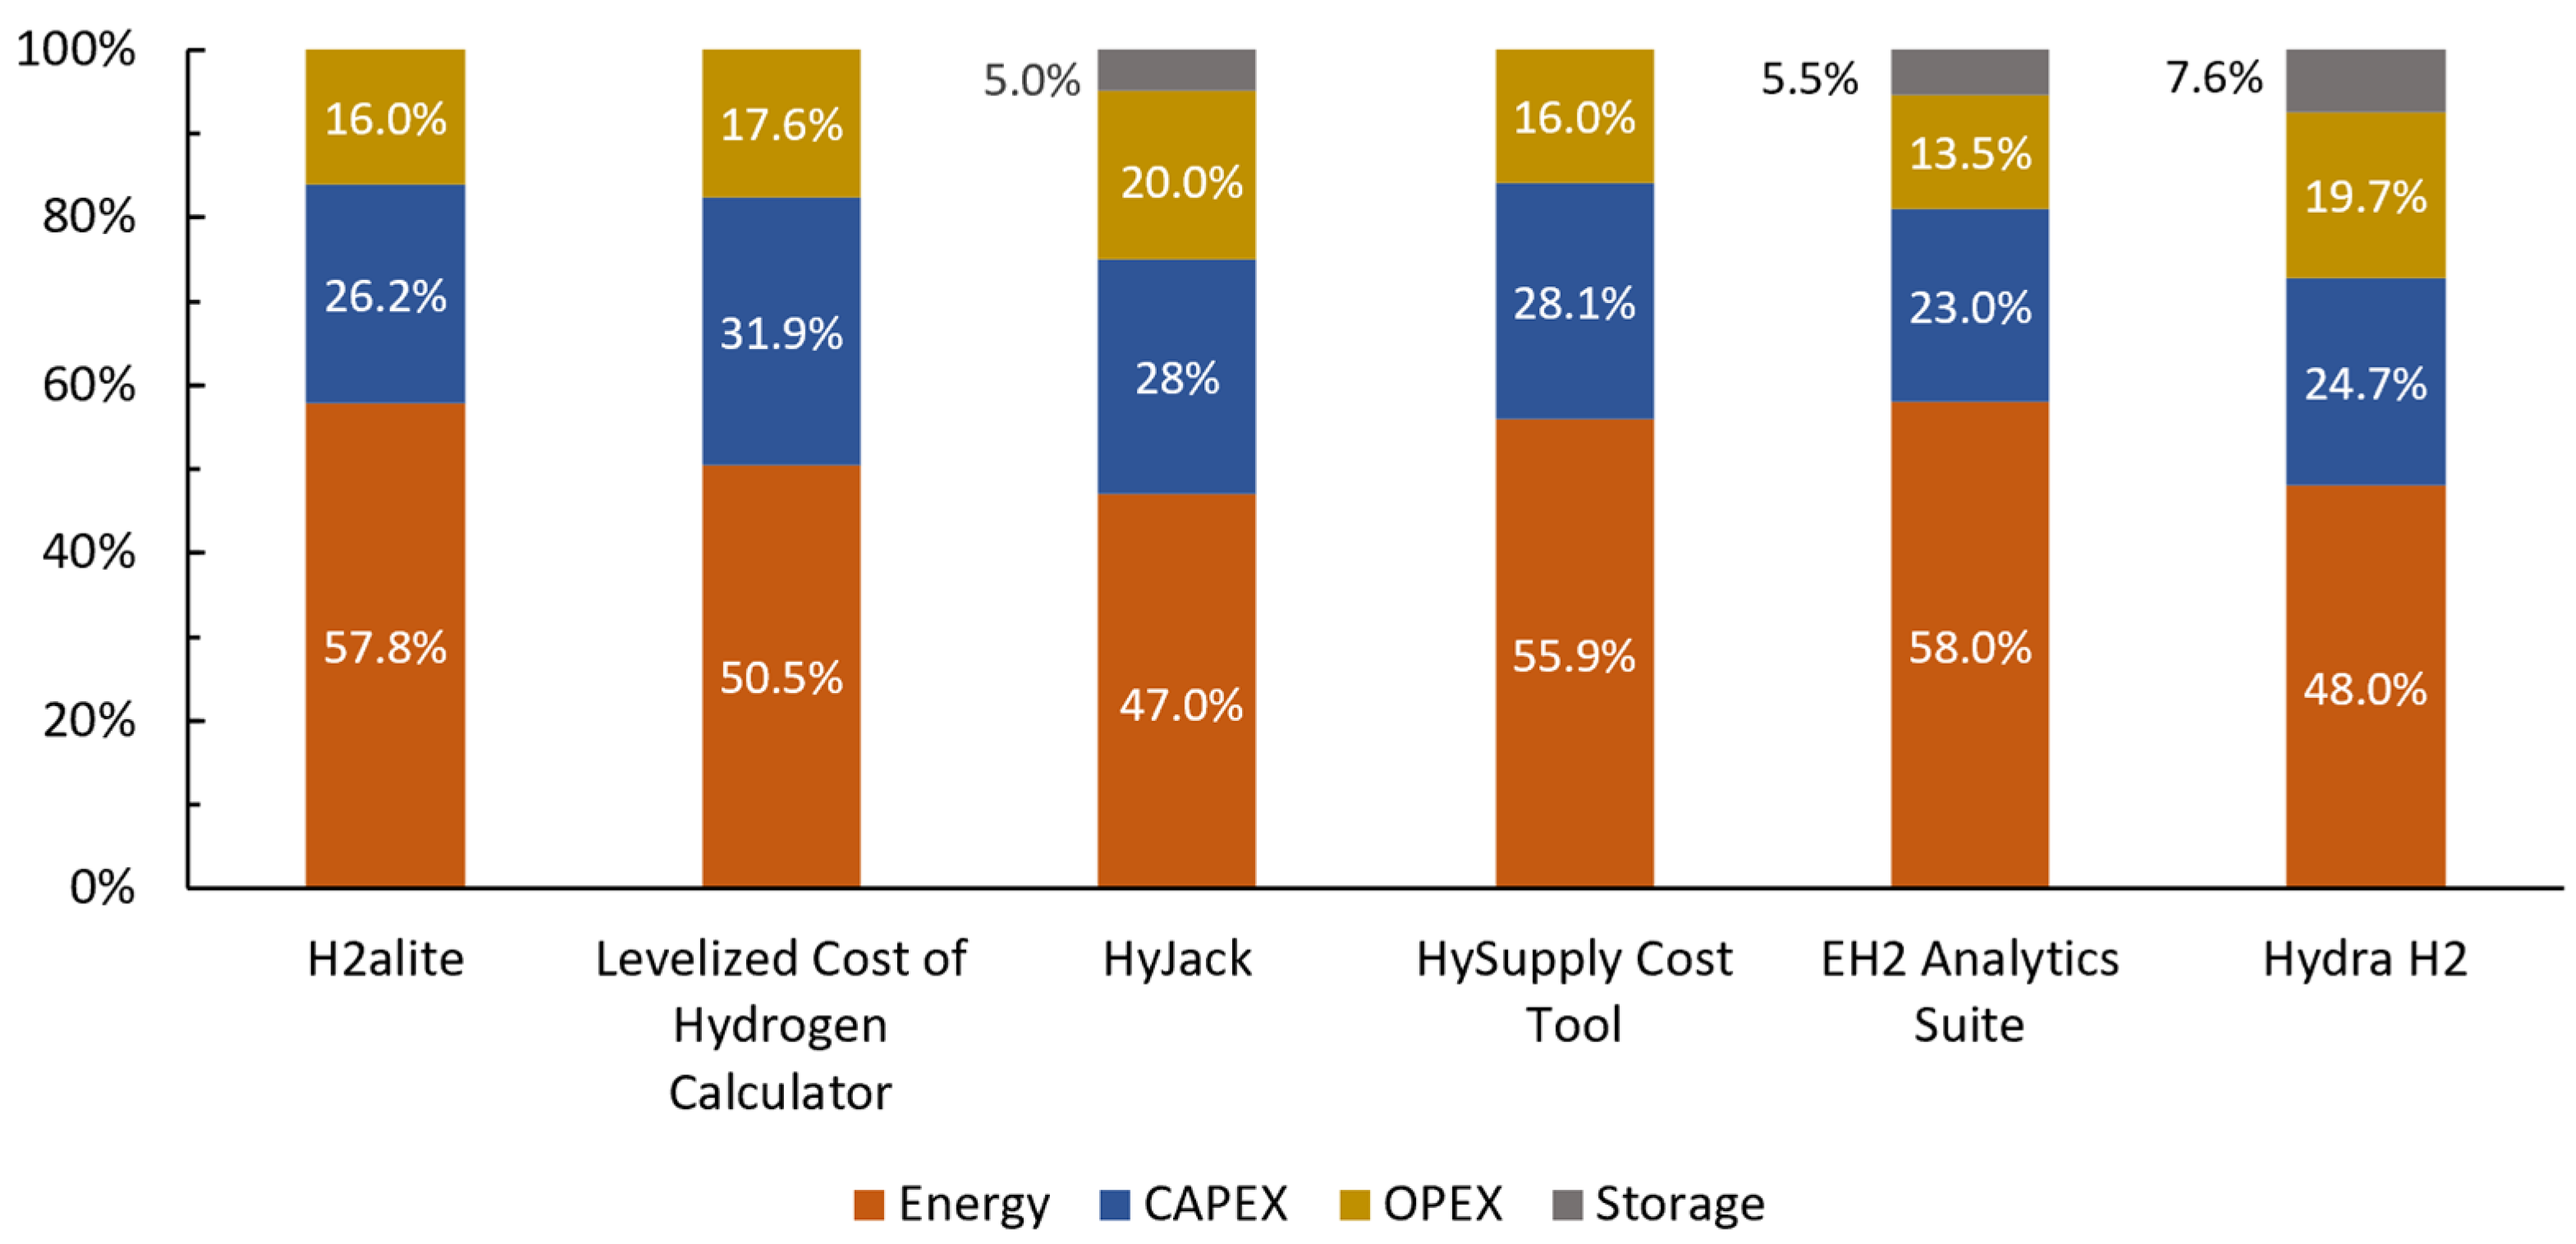
Figure 8 shows the partition of the costs of the different tools. It is possible to see a trend in cost partitioning. The energy portion is the bigger portion with a range of results of 46.7% to 58%, the CAPEX portion comes next with an interval of values of 22.9% to 34.3%, and the OPEX is the other portion with an interval of 13.5% and 20%. The CAPEX is the value corresponding to the electrolyzer cost and other features like the compressor, the OPEX contains all the operation costs plus the REPEX (cost value of the substitution of the electrolyzer stacks), and, in the energy portion, the CAPEX cost of the PV solar farm and respective OPEX. We note that only three tools account for storage, with their portion ranging between 5% and 7.6%.
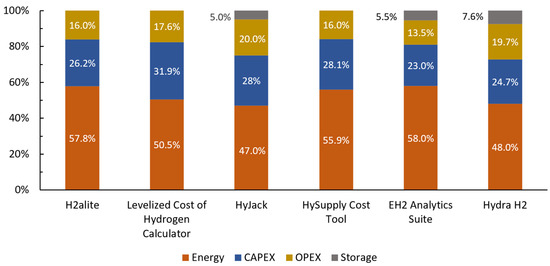
Figure 8.
LCOH breakdown for the different tools’ calculations.
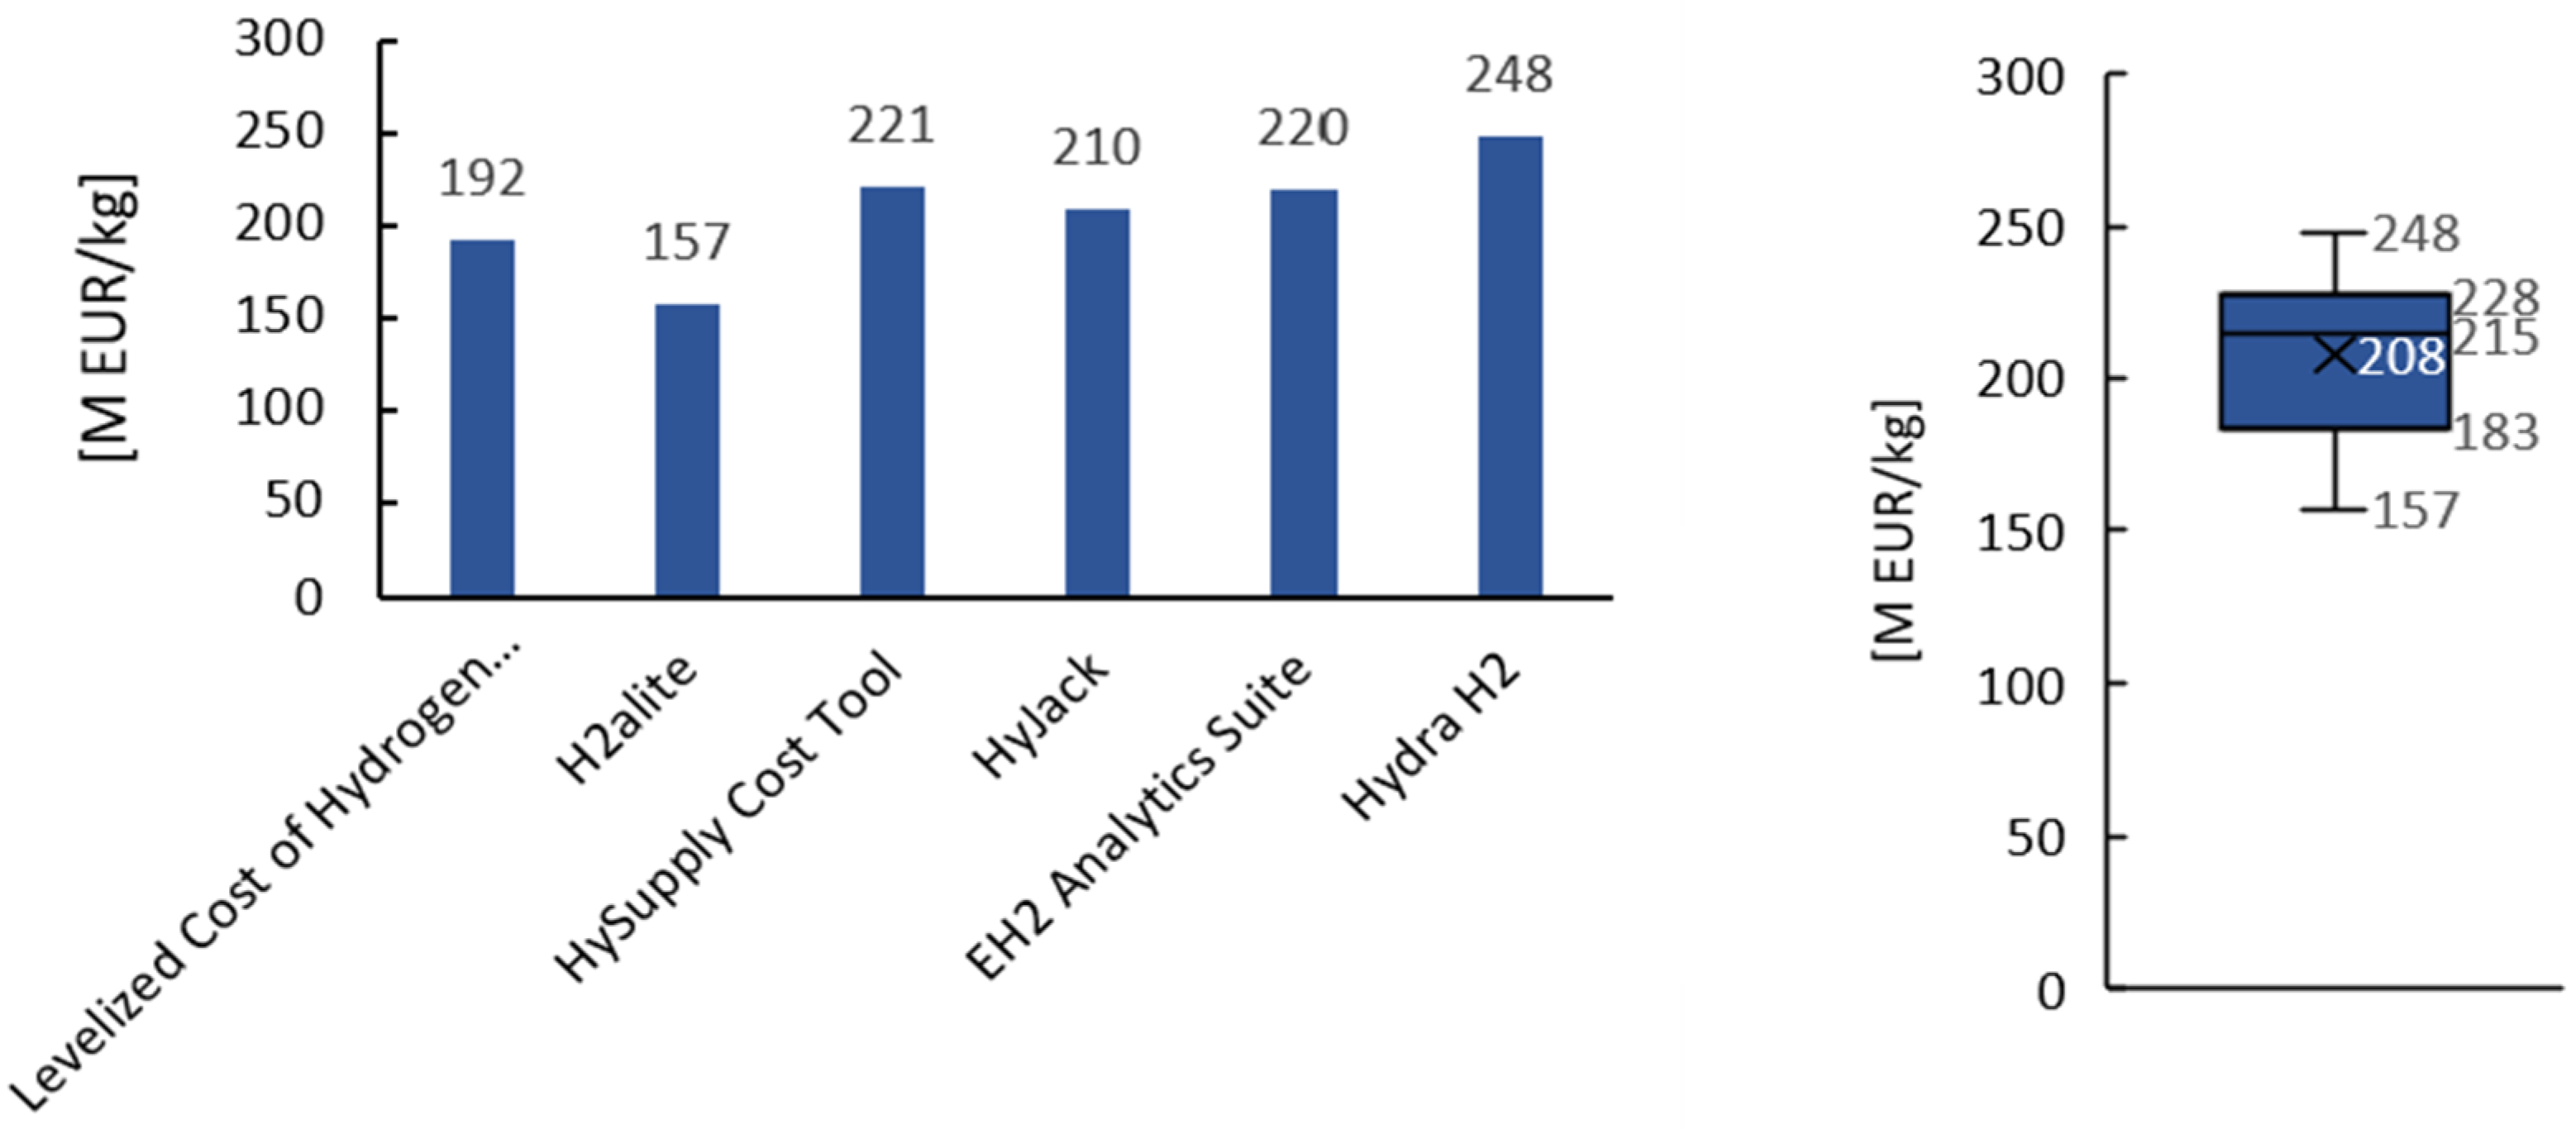
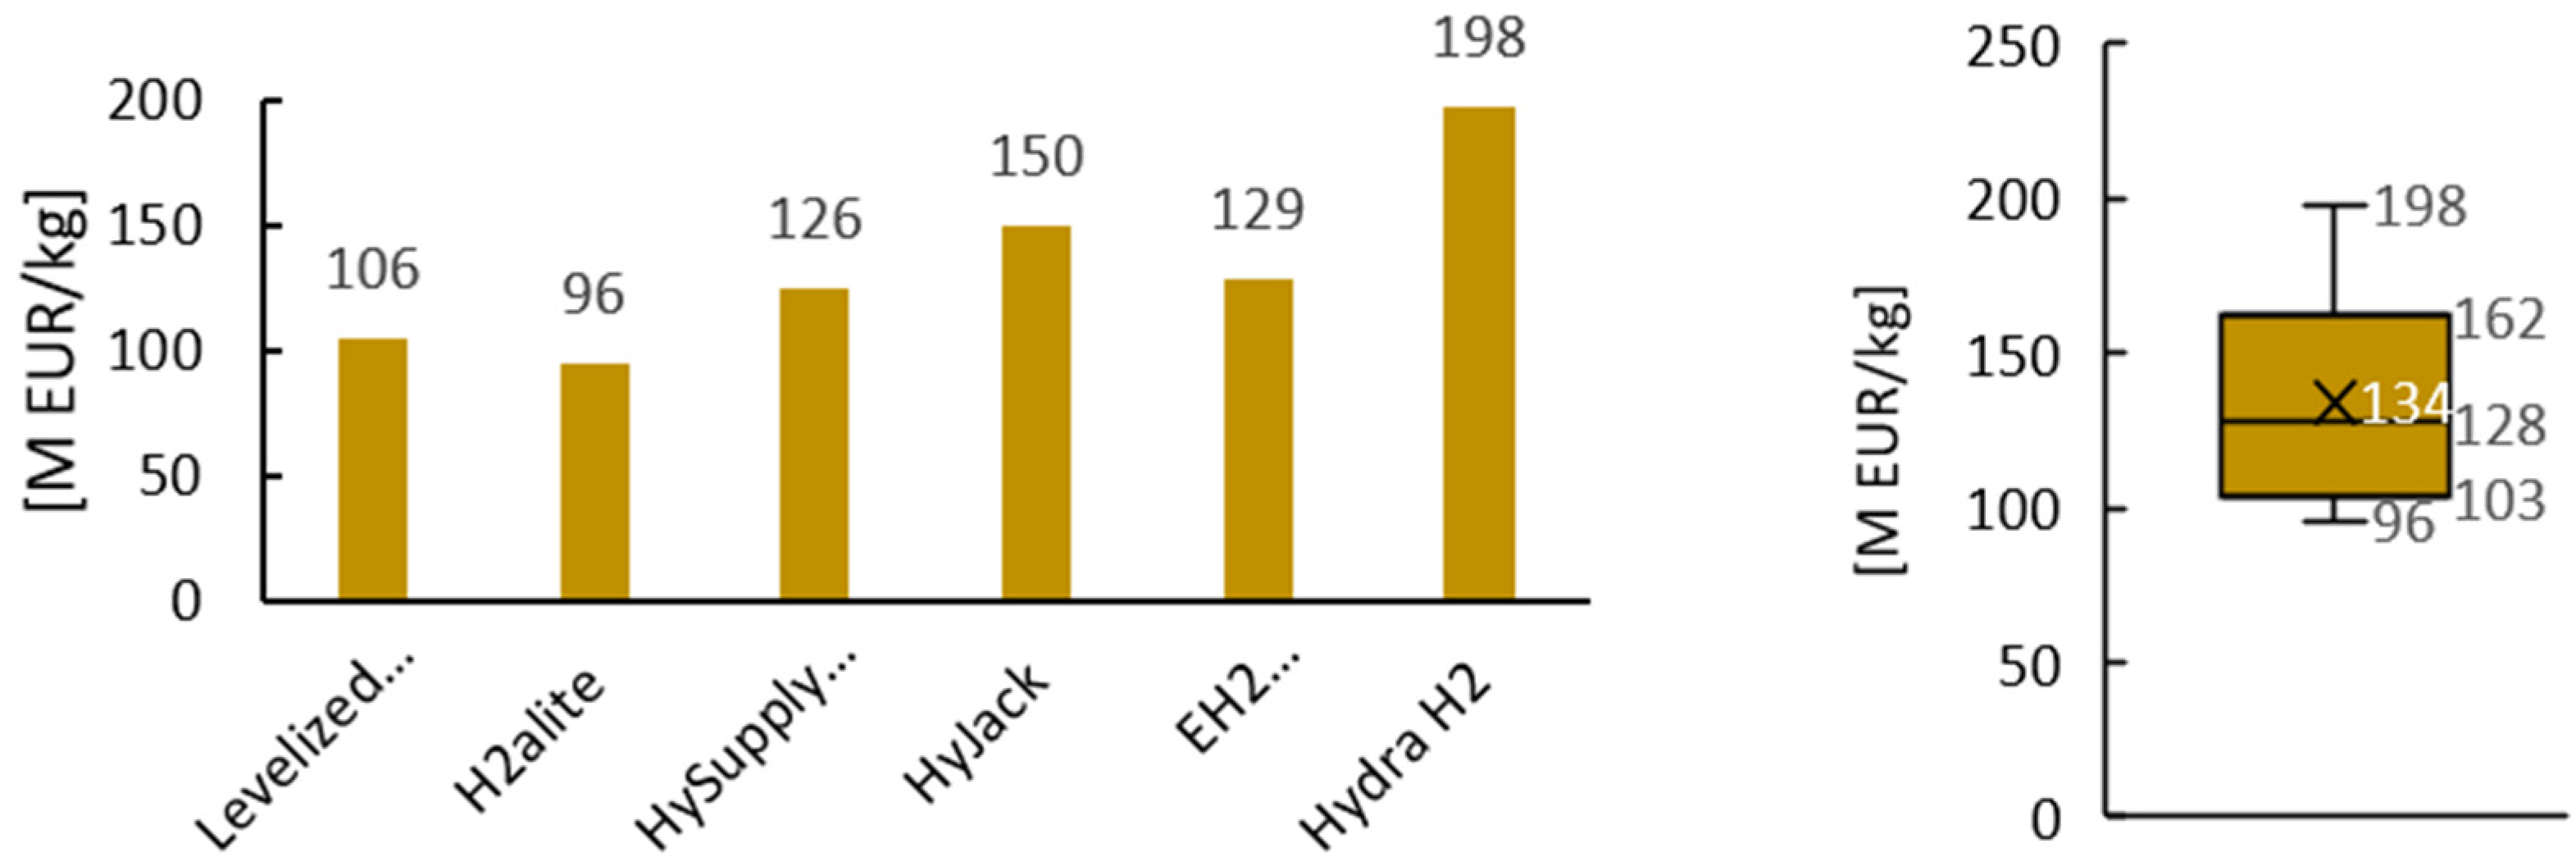
The different values of contribution of CAPEX in the final LCOH value calculated for each tool are displayed in Figure 9. Tool H2alite and the Levelized Cost of Hydrogen Calculator only account for the value of the electrolyzer as CAPEX, and that is what justifies the lower price contribution. The other tools, for example, all account for compressing costs.
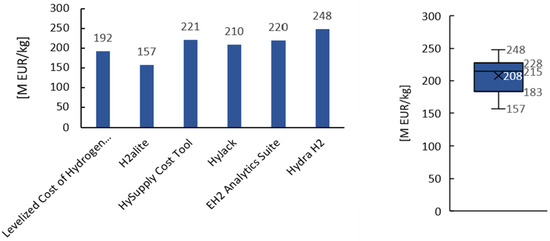
Figure 9.
CAPEX total cost for the different tools analyzed.
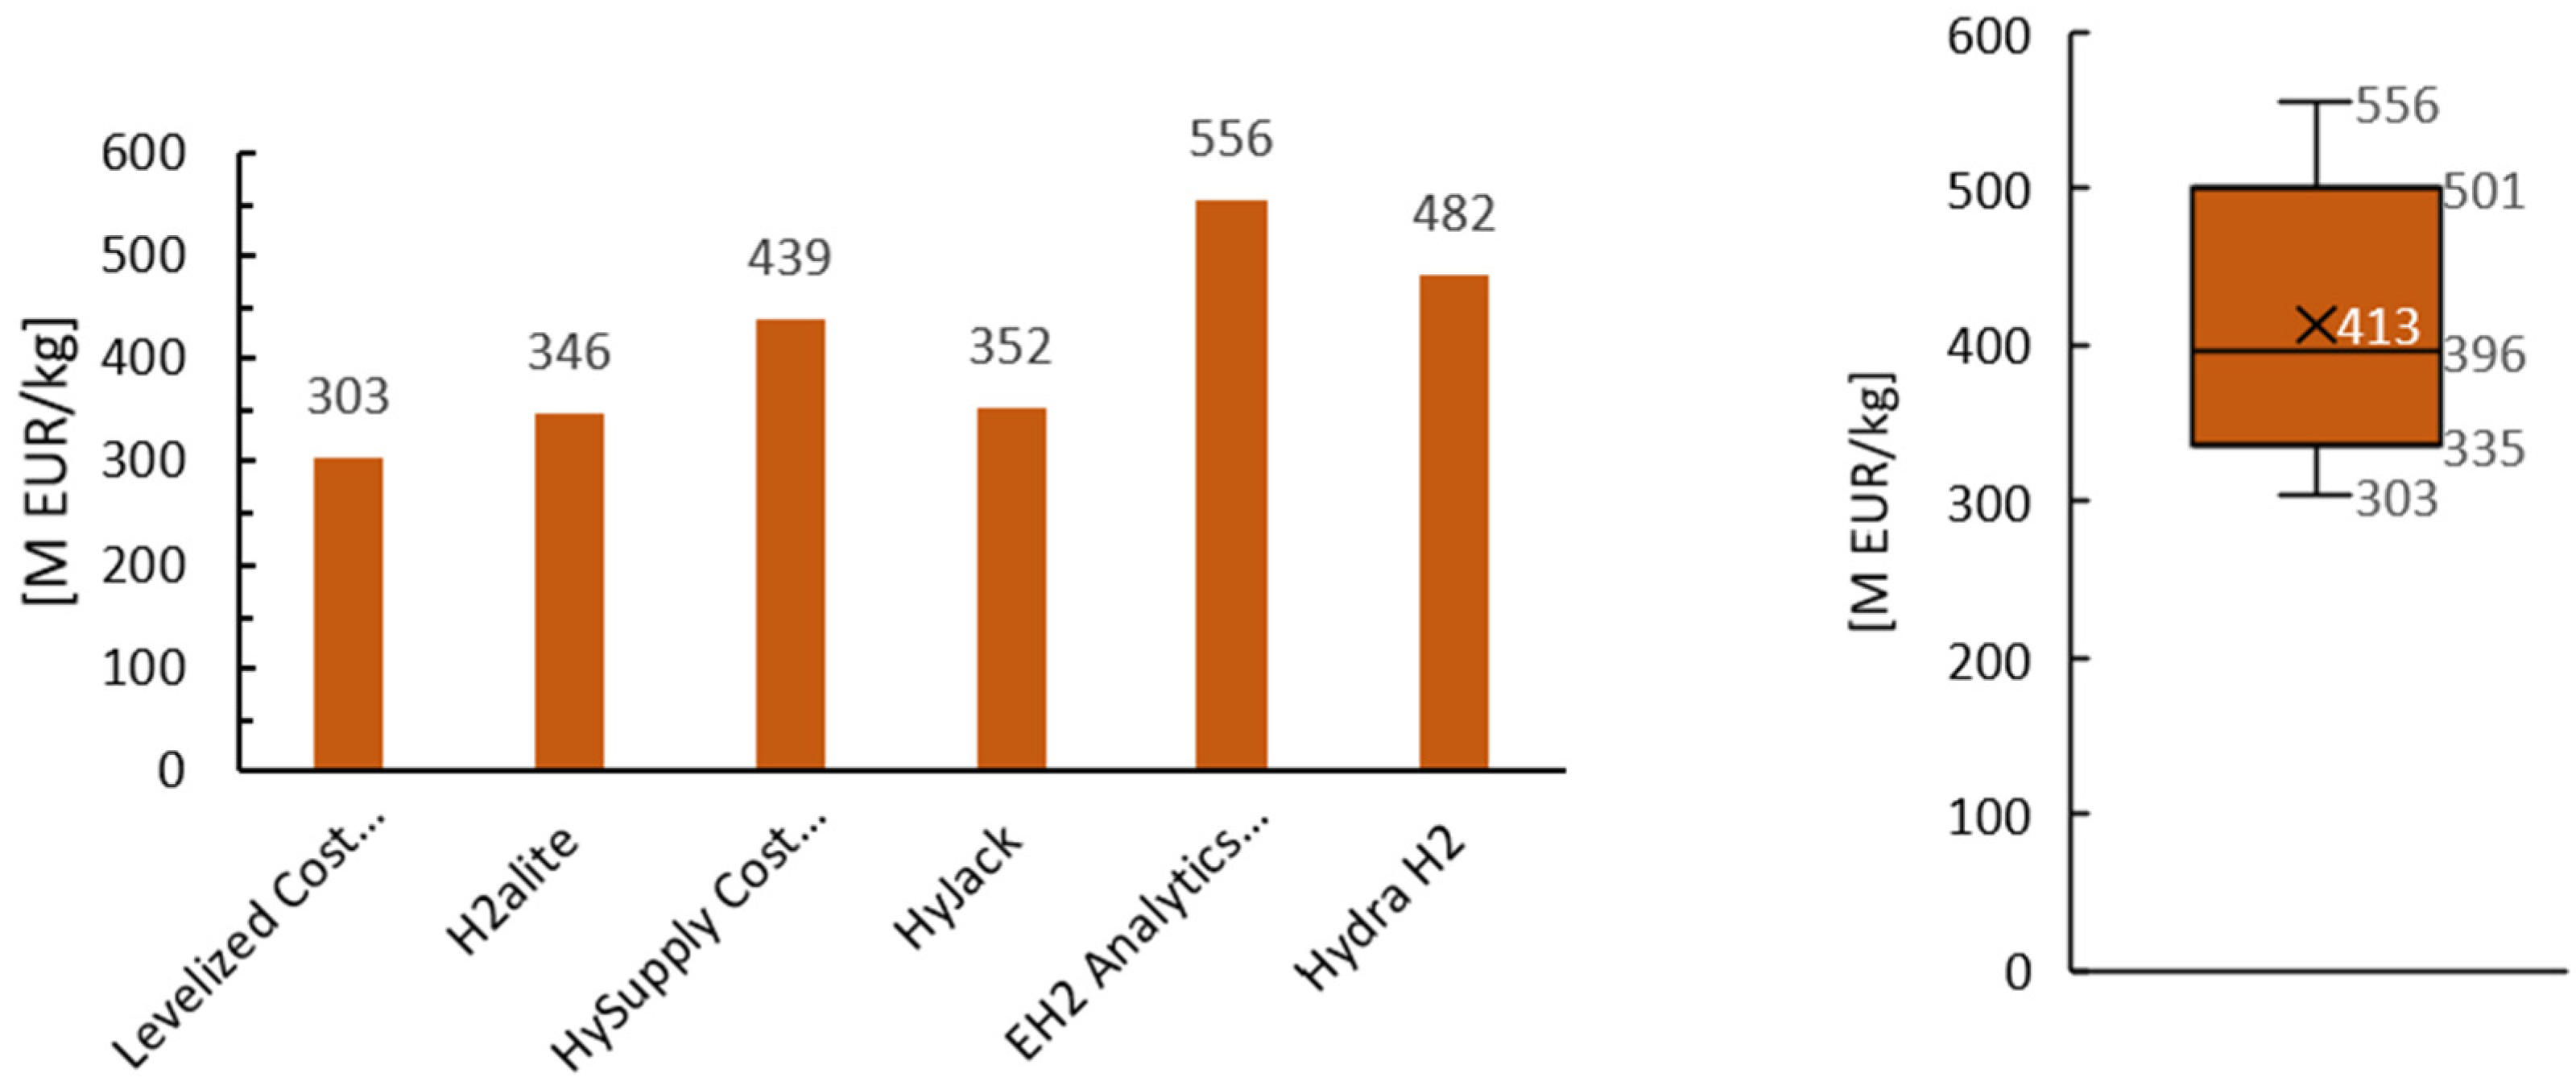
Figure 10 illustrates the varying OPEX contributions of each tool for the final LCOH. It is important to note that the OPEX was defined as an annual rate of 4% the value of CAPEX and also has the influence of the annual value defined for inflation. The OPEX of Hydra and HyJack also accounts for the cost of civil work, and that is what increases the value of OPEX. Inflation also plays a significant role in increasing the OPEX cost of HySupply Cost Tool, HyJack, EH2 Analytics Suite, and Hydra H2. As said previously the REPEX cost was accounted here in the OPEX value, and, for example, the Levelized Cost Of Hydrogen calculator and H2aLite do not consider this value, which is a reinforcement of why this value is substantially lower besides being a percentage of its CAPEX, which is already lower.
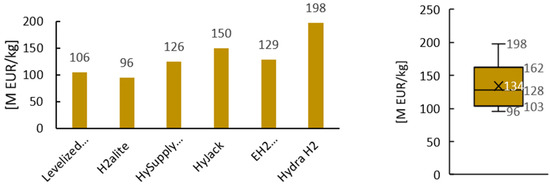
Figure 10.
OPEX total cost for the different tools analyzed.
Figure 11 shows the cost value of energy taken in each different tool calculation. EH2 Analytics Suite energy value is that much higher because of the accounting of energy produced and not used (about 40% of the total energy produced). HyJack has its values for energy costs, which are underestimated when compared with the values assumed for the simulation.
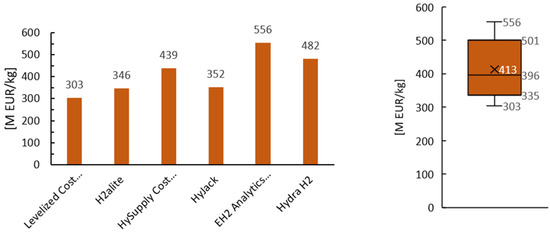
Figure 11.
Energy total cost for the different tools analyzed.
As can be seen by Figure 8, Figure 9, Figure 10 and Figure 11, the results obtained were very dispersed, which means that the value of the LCOH varied in a large amplitude of values, between EUR 5.01/kg and EUR 8.7/kg. However, with the analysis carried out, it was possible to input the same HPP parameters in all the tools, given the restrictions. One of the parameters that escaped from this homogenization of variables was the electrolyzer efficiency, since most of the tools admitted their values of efficiency as a fixed input. Electrolyzer efficiency, as stated in the bibliographic review [52,54,55], can be a very impactful value on the final LCOH. One factor that was accounted for in a few tools, HyJack, HySupply, and H2A Lite, was inflation. Inflation is a factor that can have a great impact on the LCOH, according to results obtained, which showed that the second (EUR 7.61/kg) and third (EUR 7.56/kg) most expensive LCOH values considered inflation, but so did the second (EUR 5.86/kg) lowest LCOH calculated. Another factor to consider is storage. Only the three tools that obtained the highest LCOH cost (H2 Hydra, EH2 Analytics Suite, and HyJack) considered the existence of hydrogen storage and its cost. There are numerous variables and different methods considered, so it is complex to track which variables or details determine the differences in the LCOH values calculated. However, a tendency can be outlined that higher LCOHs obtained are related to more specifications considered in the tools. A more detailed breakdown of technical inputs and economic inputs leads to higher LCOH values, since there is a more detailed accounting of all the parameters that can influence the cost of the operation.
5. Conclusions
5.1. Main Findings
This study highlights the complexity and variability inherent in the techno-economic assessment (TEA) of off-grid green Hydrogen Production Plants (HPPs). Through the application of a standardized simulation guide across seven TEA tools, it was possible to evaluate how differences in structural design, input granularity, and functional capabilities influence the Levelized Cost of Hydrogen (LCOH). The results demonstrated a wide LCOH range, from EUR 5.86/kg to EUR 8.71/kg—a 49% spread—which underlines the critical importance of tool selection and input specification in techno-economic modeling.
One of the most relevant findings was the strong correlation between tool complexity (i.e., number of input parameters, hourly simulation capability, inclusion of storage, and degradation effects) and higher LCOH values. Tools such as Hydra H2, EH2 Analytics Suite, and HyJack, which incorporate modules for storage, variable electrolyzer efficiency, and inflation, consistently predicted higher hydrogen costs. Conversely, simpler tools such as H2A Lite and the Levelized Cost of Hydrogen Calculator, which operate on an annual resolution and consider limited subsystems, delivered lower and potentially over-optimistic LCOH values.
The analysis revealed that lifetime project cost was the most variable component across tools—showing up to a 28% deviation from the average—which contributed more substantially to LCOH dispersion than differences in predicted hydrogen production. This variation was primarily due to differences in how tools account for factors such as stack replacement (REPEX), storage infrastructure, civil works, inflation, and taxes. Notably, the three tools that included hydrogen storage were also those with the highest LCOH estimates, indicating the considerable cost impact of this component when properly modeled.
Additionally, tools that simulated hydrogen production with hourly temporal granularity (e.g., HySupply and EH2 Suite) predicted higher total hydrogen output compared to those using monthly or annual resolution. This suggests that detailed temporal modeling not only affects cost estimation but also influences perceived system productivity and efficiency.
Another key insight was the importance of demand-constrained modeling. Only two tools (Hydra H2 and EH2 Suite) allowed the user to input a variable hydrogen demand, enabling a more realistic alignment between production and marketable output. This had a direct effect on the LCOH, especially in scenarios where overproduction led to unused capacity or increased storage needs.
Collectively, these findings highlight the need for transparent assumptions, consistent input frameworks, and modular, interoperable tool design to support robust and comparable TEA studies. The disparity in results reinforces the notion that TEA tools should not be treated as black boxes and that their methodological underpinnings must be clearly understood before drawing investment or policy conclusions.
5.2. Limitations
The main limitation of this study lies in the relatively small sample size of the tools evaluated. Although these tools are widely cited or in development, other emerging models—especially those tailored for newer technologies like Anion Exchange Membrane (AEM) electrolyzers—were not included due to a lack of accessibility or documentation. Moreover, certain inputs such as degradation curves, hourly demand dynamics, and energy storage behavior could not be uniformly applied across all tools, potentially influencing the comparability of results. These limitations reflect the broader challenge of standardizing TEA methodologies in a rapidly evolving sector.
5.3. Future Work
Future studies should expand the toolset to include models optimized for hybrid and multi-energy complementary systems (e.g., solar + wind + battery storage). The integration of machine learning algorithms could also offer dynamic sensitivity analysis, parameter optimization, and even intelligent tool selection based on project conditions. Furthermore, collaboration among tool developers and researchers is essential to advance toward modular, interoperable TEA frameworks with consistent input–output structures. These efforts will strengthen the reliability and comparability of future Hydrogen Production Plant assessments.
Author Contributions
Conceptualization, L.F., L.M. and F.M.; methodology, L.F.; software, L.F.; validation, A.F., L.M. and F.M.; formal analysis, L.M.; investigation, L.F. and F.M.; resources, L.F. and F.M.; data curation, L.F.; writing—original draft preparation, L.F.; writing—review and editing, L.F., F.M. and L.M.; visualization, A.F.; supervision, L.M.; project administration, A.F.; funding acquisition, A.F. All authors have read and agreed to the published version of the manuscript.
Funding
This project was co-financed by the PRR—Recovery and Resilience Plan by the European Union, in particular, the Mobilizing Agenda “Moving2Neutrality” (Project no. 32, with reference no C644927397-00000038).
Conflicts of Interest
A.F. was employed by the company Galp. The remaining authors declare that the research was conducted in the absence of any commercial or financial relationships that could be construed as a potential conflict of interest.
Abbreviations
The following abbreviations are used in this manuscript:
| TEA | Techno-Economic Analysis |
| HPP | Hydrogen Production Plant |
| LCOH | Levelized Cost of Hydrogen |
| STEPS | Stated Policies Scenario |
| PEM | Polymer Electrolyte Membrane |
| AEL | Alkaline Electrolyzer |
| SOE | Solid Oxide Electrolyzers |
| CAPEX | Capital Expenditures |
| OPEX | Operational Expenditures |
| AEM | Anion Exchange Membrane |
| HRS | Hydrogen Refueling Station |
| REPEX | Replacement Expenditure |
| LCOE | Levelized Cost of Electricity |
References
- IRENA; GRA. Tripling Renewable Power Capacity and Doubling Energy Efficiency by 2030: Crucial Steps Toward 1.5 °C; IRENA: Masdar, United Arab Emirates, 2023. [Google Scholar]
- RFF. Global Energy Outlook; RFF: Washington, DC, USA, 2022. [Google Scholar]
- IEA. Stated Policies Scenario (STEPS); IEA: Paris, France, 2023. [Google Scholar]
- IEA. World Energy Outlook; IEA: Paris, France, 2023. [Google Scholar]
- Kouchaki-Penchah, H.; Bahn, O.; Bashiri, H.; Bedard, S.; Bernier, E.; Elliot, T.; Hammache, A.; Vaillancourt, K.; Le-vasseur, A. The role of hydrogen in a net-zero emission economy under alternative policy scenarios. Int. J. Hydrogen Energy 2024, 49, 173–187. [Google Scholar] [CrossRef]
- Li, X.; Ye, T.; Meng, X.; He, D.; Li, L.; Song, K.; Jiang, J.; Sun, C. Advances in the Application of Sulfonated Poly(Ether Ether Ketone) (SPEEK) and Its Organic Composite Membranes for Proton Exchange Membrane Fuel Cells (PEMFCs). Polymers 2024, 16, 2840. [Google Scholar] [CrossRef] [PubMed]
- Ruihan, L.; Feng, H.; Ting, X.; Yongzhi, L.; Xin, Z.; Jiaqi, Z. Progress in the application of first principles to hydrogen storage materials. Int. J. Hydrogen Energy 2024, 56, 1079–1091. [Google Scholar] [CrossRef]
- Zenith, F.; Flote, M.N.; Santos-Mugica, M.; Duncan, C.S.; Mariani, V.; Marcantoni, C. Value of green hydrogen when curtailed to provide grid balancing services. Int. J. Hydrogen Energy 2022, 47, 35541–35552. [Google Scholar] [CrossRef]
- IEA. Global Hydrogen Review; IEA: Paris, France, 2023. [Google Scholar]
- Pleshivtseva, Y.; Derevyanov, M.; Pimenov, A.; Rapoport, A. Comparative analysis of global trends in low carbon hydrogen production towards the decarbonization pathway. Int. J. Hydrogen Energy 2023, 48, 32191–32240. [Google Scholar] [CrossRef]
- IEA. Net Zero by 2050; IEA: Paris, France, 2021. [Google Scholar]
- Escamilla, A.; Sánchez, D.; García-Rodríguez, L. Assessment of power-to-power re-newable energy storage based on the smart integration of hydrogen and micro gas turbine technologies. Int. J. Hydrogen Energy 2022, 47, 17505–17525. [Google Scholar] [CrossRef]
- Arsad, S.; Arsad, A.; Ker, P.J.; Hannan, M.; Tang, S.G.; Goh, S.; Mahlia, T. Recent advancement in water electrolysis for hydrogen production: A comprehensive bibliometric analysis and technology updates. Int. J. Hydrogen Energy 2024, 60, 780–801. [Google Scholar] [CrossRef]
- Macingwane, Z.; Schönborn, A. Techno-Economic Analysis of Green Hydrogen Production as Maritime Fuel from Wave Energy. Energies 2024, 17, 4683. [Google Scholar] [CrossRef]
- Agajie, T.F. A comprehensive review on techno-economic analysis of hybrid renewable energy power production systems. Energies 2023, 16, 642. [Google Scholar] [CrossRef]
- Renewable Energy Assessments. Comprehensive Guide to Renewable Energy Project Evaluation; Renewable Energy Institute: London, UK, 2022; pp. 10–75. [Google Scholar]
- Topsoe. Levelized Cost—Blue Hydrogen. Topsoe. 2024. Available online: https://www.topsoe.com/blue-hydrogen/levelized-cost (accessed on 22 July 2025).
- Galevskiy, S.; Qian, H. A Binary Discounting Method for Economic Evaluation of Hydrogen Projects: Applicability Study Based on Levelized Cost of Hydrogen (LCOH). Energies 2025, 18, 3839. [Google Scholar] [CrossRef]
- Matute, G.; Yusta, J.M.; Naval, N. Techno-economic model and feasibility assessment of green hydrogen projects based on electrolysis supplied by photovoltaic PPAs. Int. J. Hydrogen Energy 2023, 48, 5053–5068. [Google Scholar] [CrossRef]
- Anastasiadis, A.G.; Papadimitriou, P.; Vlachou, P.; Vokas, G.A. Management of Hybrid Wind and Photovoltaic System Electrolyzer for Green Hydrogen Production and Storage in the Presence of a Small Fleet of Hydrogen Vehicles—An Economic Assessment. Energies 2023, 16, 7990. [Google Scholar] [CrossRef]
- Shaik, F.; Lingala, S.S.; Veeraboina, P. Effect of various parameters on the performance of solar PV power plant: A review and the experimental study. Sustain. Energy Res. 2023, 10, 6. [Google Scholar] [CrossRef]
- Rehling, F.; Delius, A.; Ellerbrok, J.; Farwig, N.; Peter, F. Wind turbines in managed forests partially displace common birds. J. Environ. Manag. 2023, 328, 116968. [Google Scholar] [CrossRef]
- Gutiérrez-Martín, F.; Amodio, L.; Pagano, M. Hydrogen production by water electrolysis and off-grid solar PV. Int. J. Hydrogen Energy 2021, 46, 29038–29048. [Google Scholar] [CrossRef]
- DCS Legal. What Is Battery Energy Storage? DCS Legal. Available online: https://www.dcslegal.com/news-insights/what-is-battery-energy-storage/ (accessed on 22 July 2025).
- U.S. Department of Energy. Water Electrolysis. Office of Energy Efficiency & Renewable Energy. 2021. Available online: https://www.energy.gov/eere/fuelcells/hydrogen-production-electrolysis (accessed on 22 July 2025).
- Zeng, K.; Zhang, D. Recent progress in alkaline water electrolysis for hydrogen production and applications. Prog. Energy Combust. Sci. 2010, 36, 307–326. [Google Scholar] [CrossRef]
- Simões, S.G.; Catarino, J.; Picado, A.; Lopes, T.F.; di Bernardino, S.; Amorim, F.; Gírio, F.; Rangel, C.; de Leão, T.P. Water availability and water usage solutions for electrolysis in hydrogen production. J. Clean. Prod. 2021, 315, 128124. [Google Scholar] [CrossRef]
- Zhang, Y.; Zhang, Y.; Li, Z.; Yu, E.; Ye, H.; Li, Z.; Guo, X.; Zhou, D.; Wang, C.; Sha, Q.; et al. A Review of Hydrogen Production via Seawater Electrolysis: Current Status and Challenges. Catalysts 2024, 14, 691. [Google Scholar] [CrossRef]
- Mika, Ł.; Sztekler, K.; Bujok, T.; Boruta, P.; Radomska, E. Seawater Treatment Technologies for Hydrogen Production by Electrolysis—A Review. Energies 2024, 17, 6255. [Google Scholar] [CrossRef]
- Kumar, P.; Date, A.; Mahmood, N.; Das, R.K.; Shabani, B. Freshwater supply for hydrogen production: An underestimated challenge. Int. J. Hydrogen Energy 2024, 78, 202–217. [Google Scholar] [CrossRef]
- Zuo, X.; Toam, Q.; Zhong, Y. Comparative analysis of hydrogen production methods: Environmental impact and efficiency of electrochemical and thermochemical processes. Int. J. Hydrogen Energy 2025, 118, 426–440. [Google Scholar] [CrossRef]
- Al-Douri, A.; Groth, K.M. Hydrogen production via electrolysis: State-of-the-art and research needs in risk and reliability analysis. Int. J. Hydrogen Energy 2024, 63, 775–785. [Google Scholar] [CrossRef]
- Zou, J.; Han, N.; Yan, J.; Feng, Q.; Wang, Y.; Zhao, Z.; Fan, J.; Zeng, L.; Li, H.; Wang, H. Electrochemical Compression Technologies for High-Pressure Hydrogen: Current Status, Challenges and Perspectives. Electrochem. Energy Rev. 2020, 3, 227–249. [Google Scholar] [CrossRef]
- Tholen, L.; Leipprand, A.; Kiyar, D.; Maier, S.; Küper, M.; Adisorn, T.; Fischer, A. The Green Hydrogen Puzzle: Towards a German Policy Framework for Industry. Sustainability 2021, 13, 12626. [Google Scholar] [CrossRef]
- Franco, A.; Giovannini, C. Hydrogen Gas Compression for Efficient Storage: Balancing Energy and Increasing Density. Hydrogen 2024, 5, 293–311. [Google Scholar] [CrossRef]
- Reigstad, G.A.; Roussanaly, S.; Straus, J.; Anantharaman, R.; de Kler, R.; Akhurst, M.; Sunny, N.; Goldthorpe, W.; Avignon, L.; Pearce, J.; et al. Moving toward the low-carbon hydrogen economy: Experiences and key learnings from national case studies. Adv. Appl. Energy 2022, 8, 100108. [Google Scholar] [CrossRef]
- IEA (International Energy Agency). The Future of Hydrogen: Seizing Today’s Opportunities; IEA: Paris, France, 2019; Available online: https://www.iea.org/reports/the-future-of-hydrogen (accessed on 22 July 2025).
- Usman, M.R. Hydrogen storage methods: Review and current status. Renew. Sustain. Energy Rev. 2022, 167, 112743. [Google Scholar] [CrossRef]
- Buttler, A.; Spliethoff, H. Current Status of Water Electrolysis for Energy Storage, Grid Balancing and Sector Coupling via Power-to-Gas and Power-to-Liquids: A Review. Renew. Sustain. Energy Rev. 2018, 82, 2440–2454. [Google Scholar] [CrossRef]
- Zun, M.T.; McLellan, B.C. Cost Projection of Global Green Hydrogen Production Scenarios. Hydrogen 2023, 4, 932–960. [Google Scholar] [CrossRef]
- Maleki, F.; Ledari, M.B.; Fani, M.; Kamelizadeh, D. Sustainable hydrogen supply chain development for low-carbon transportation in a fossil-based port region: A case study in a tourism hub. Int. J. Hydrogen Energy 2024, 65, 95–111. [Google Scholar] [CrossRef]
- Arcos, J.M.M.; Santos, D.M.F. The Hydrogen Color Spectrum: Techno-Economic Analysis of the Available Technologies for Hydrogen Production. Gases 2023, 3, 25–46. [Google Scholar] [CrossRef]
- Lei, J.; Zhang, H.; Pan, J.; Zhuo, Y.; Chen, A.; Chen, W.; Yang, Z.; Feng, K.; Li, L.; Wang, B.; et al. Techno-Economic Assessment of a Full-Chain Hydrogen Production by Offshore Wind Power. Energies 2024, 17, 2447. [Google Scholar] [CrossRef]
- Pinheiro, F.P.; Gomes, D.M.; Tofoli, F.L.; Sampaio, R.F.; Melo, L.S.; Gregory, R.C.F.; Sgrò, D.; Leão, R.P.S. Techno-Economic Analysis of Green Hydrogen Generation from Combined Wind and Photovoltaic Systems Based on Hourly Temporal Correlation. Int. J. Hydrogen Energy 2025, 97, 690–707. [Google Scholar] [CrossRef]
- Hosseinzadeh, A.; Zhou, J.L.; Li, X.; Afsari, M.; Altaee, A. Techno-economic and environmental impact assessment of hydrogen production processes using bio-waste as renewable energy resource. Renew. Sustain. Energy Rev. 2022, 156, 111991. [Google Scholar] [CrossRef]
- Correa, G.; Volpe, F.; Marocco, P.; Muñoz, P.; Falaguerra, T.; Santarelli, M. Evaluation of levelized cost of hydrogen produced by wind electrolysis: Argentine and Italian production scenarios. J. Energy Storage 2022, 52 Pt B, 105014. [Google Scholar] [CrossRef]
- Superchi, F.; Mati, A.; Carcasci, C.; Bianchini, A. Techno-economic analysis of wind-powered green hydrogen pro-duction to facilitate the decarbonization of hard-to-abate sectors: A case study on steelmaking. Appl. Energy 2023, 342, 121198. [Google Scholar] [CrossRef]
- Agora Energiewende. Levelised Cost of Hydrogen; Agora Energiewende: Bangkok, Thailand, 2022. [Google Scholar]
- Hydrogen Tech World. Electrolysis Technologies and LCOH: Current State and Prospects for 2030; Hydrogen Tech World: Düsseldorf, Germany, 2023. [Google Scholar]
- Rezaei, M.; Akimov, A.; Gray, E.M. Economics of renewable hydrogen production using wind and solar energy: A case study for Queensland, Australia. J. Clean. Prod. 2024, 435, 140476. [Google Scholar] [CrossRef]
- Srettiwat, N.; Safari, M.; Olcay, H.; Malina, R. A techno-economic evaluation of so-lar-powered green hydrogen production for sustainable energy consumption in Belgium. Int. J. Hydrogen Energy 2023, 48, 39731–39746. [Google Scholar] [CrossRef]
- Gul, M.; Akyuz, E. Techno-economic viability and future price projections of photovoltaic-powered green hydrogen production in strategic regions of Turkey. J. Clean. Prod. 2023, 430, 139627. [Google Scholar] [CrossRef]
- Khatiwada, D.; Vasudevan, R.A.; Santos, B.H. Decarbonization of natural gas systems in the EU—Costs, barriers, and constraints of hydrogen production with a case study in Portugal. Renew. Sustain. Energy Rev. 2022, 168, 112775. [Google Scholar] [CrossRef]
- Rezaei, M.; Akimov, A.; Gray, E.M. Economics of solar-based hydrogen production: Sensitivity to financial and technical factors. Int. J. Hydrogen Energy 2022, 47, 27930–27943. [Google Scholar] [CrossRef]
- Shin, H.; Jang, D.; Lee, S.; Cho, H.-S.; Kim, K.-H.; Kang, S. Techno-economic evaluation of green hydrogen production with low-temperature water electrolysis technologies directly coupled with renewable power sources. Energy Convers. Manag. 2023, 286, 117083. [Google Scholar] [CrossRef]
- Sadiq, M.; Alshehhi, R.J.; Urs, R.R.; Mayyas, A.T. Techno-economic analysis of Green-H2@Scale production. Renew. Energy 2023, 219 Pt 1, 119362. [Google Scholar] [CrossRef]
- Georgopoulos, G.; Papadopoulos, P.; Mitkidis, G.; Giannissi, S.G. Active Trading and Regulatory Incentives Lower the Levelized Cost of Green Hydrogen in Greece. Commun. Earth Environ. 2025, 6, 370. [Google Scholar] [CrossRef]
- Habour, R.M.; Benyounis, K.Y.; Carton, J.G. Green hydrogen production from renewable sources for export. Int. J. Hydrogen Energy 2025, 128, 760–770. [Google Scholar] [CrossRef]
- dos Santos, G.D.S.; Marinho, C.D.B.; Santana, L.O.S.; Bispo, A.S.; Pessoa, F.L.P.; Almeida, J.L.G.; Calixto, E.E.S. Hydrogen production using renewable energy: Solar PV and offshore wind power—An economic evaluation in Bahia. Comput. Aided Chem. Eng. 2023, 52, 2947–2952. [Google Scholar] [CrossRef]
- Hofritcher, A.; Rank, D.; Heberl, M.; Sterner, M. Determination of the optimal power ratio between electrolysis and renewable energy to investigate the effects on the hydrogen production costs. Int. J. Hydrogen Energy 2023, 48, 1651–1663. [Google Scholar] [CrossRef]
- Ourya, I.; Nabil, N.; Abderafi, S.; Boutammachte, N.; Rachidi, S. Assessment of green hydrogen production in Morocco, using hybrid renewable sources (PV and wind). Int. J. Hydrogen Energy 2023, 48, 37428–37442. [Google Scholar] [CrossRef]
- Park, J.; Kang, S.; Kim, S.; Cho, H.-S.; Heo, S.; Lee, J.H. Techno-economic analysis of solar-powered green hydrogen system based on multi-objective optimization of economics and productivity. Energy Convers. Manag. 2024, 299, 117823. [Google Scholar] [CrossRef]
- European Hydrogen Observatory. Levelized Cost of Hydrogen Calculator. 2022. Available online: https://observatory.clean-hydrogen.europa.eu/tools-reports/levelised-cost-hydrogen-calculator (accessed on 22 July 2025).
- NREL. H2A-Lite: Hydrogen Analysis Lite Production Model. Available online: https://www.nrel.gov/hydrogen/h2a-lite.html (accessed on 25 March 2025).
- HyJack. Available online: https://www.h2helium.com/post/hyjack-plataforma-de-c%C3%A1lculo-de-projetos-de-h2 (accessed on 22 March 2025).
- Eletric Hydrogen. EH2’s Suite of Electrolysis Analytics Tools. Available online: https://eh2.com/toolkit/ (accessed on 25 March 2025).
- GlobH2E. HySupply Cost Tool. 2023. Available online: https://www.globh2e.org.au/hysupply-cost-tool (accessed on 25 March 2025).
- Moran, C.; Moylan, E.; Reardon, J.; Gunawan, T.A.; Deane, P.; Yousefian, S.; Monaghan, R.F. A flexible techno-economic analysis tool for regional hydrogen hubs—A case study for Ireland. Int. J. Hydrogen Energy 2023, 48, 28649–28667. [Google Scholar] [CrossRef]
- Ibagon, N.; Muñoz, P.; Correa, G. Techno-economic analysis tool for the sizing and optimization of an off-grid hydrogen hub. J. Energy Storage 2023, 73 Pt A, 108787. [Google Scholar] [CrossRef]
Disclaimer/Publisher’s Note: The statements, opinions and data contained in all publications are solely those of the individual author(s) and contributor(s) and not of MDPI and/or the editor(s). MDPI and/or the editor(s) disclaim responsibility for any injury to people or property resulting from any ideas, methods, instructions or products referred to in the content. |
© 2025 by the authors. Licensee MDPI, Basel, Switzerland. This article is an open access article distributed under the terms and conditions of the Creative Commons Attribution (CC BY) license (https://creativecommons.org/licenses/by/4.0/).


