Article

From the Last Interglacial Period to the 2070s: Long-Term Spatiotemporal Dynamics of Sophora alopecuroides L., a Dominant Desert-Steppe Herb in China


1
School of Life Sciences, Qinghai Normal University, Xining 810008, China
2
Key Laboratory of Biodiversity Formation Mechanism and Comprehensive Utilization of the Qinghai-Xizang Plateau in Qinghai Province, Qinghai Normal University, Xining 810008, China
3
Academy of Plateau Science and Sustainability, Qinghai Normal University, Xining 810016, China
4
Guangdong Provincial Key Laboratory of Marine Disaster Prediction and Prevention, Institute of Marine Sciences, Shantou University, Shantou 515063, China
5
State Key Laboratory of Biocontrol, School of Ecology, Shenzhen Campus, Sun Yat-Sen University, Shenzhen 518107, China
6
College of Agriculture and Animal Husbandry, Qinghai University, Xining 810016, China
*
Authors to whom correspondence should be addressed.
These authors contributed equally to this work.
Ecologies 2026, 7(3), 75; https://doi.org/10.3390/ecologies7030075
Submission received: 15 June 2026 / Revised: 16 July 2026 / Accepted: 20 July 2026 / Published: 3 August 2026

Abstract

Understanding the spatiotemporal dynamics of dominant desert-steppe species under climate change is critical for sustainable management of arid ecosystems. Sophora alopecuroides L., a perennial drought-tolerant leguminous herb with substantial medicinal and forage value, is an important component of these ecosystems. Based on 137 occurrence records and 10 environmental variables, we applied the MaxEnt model and ArcGIS to simulate suitable habitats and range shifts of S. alopecuroides across multiple periods, including the Last Interglacial (LIG), Last Glacial Maximum (LGM), Mid-Holocene (MH), present, and the 2050s and 2070s under four representative concentration pathways (RCP 2.6, 4.5, 6.0, and 8.5). The model showed high predictive performance, with an area under the receiver operating characteristic curve (AUC) greater than 0.9. Temperature annual range (Bio7), elevation, precipitation of the warmest quarter (Bio18), mean temperature of the driest quarter (Bio9), and annual mean temperature (Bio1) were identified as key environmental drivers, indicating that the distribution of this species is mainly shaped by temperature regimes, seasonal water availability, and topography. Under current conditions, the total suitable habitat accounts for 28.9% of China’s territory, closely matching the known distribution. Since the LIG, the total suitable area has fluctuated slightly, being larger during the LIG and LGM, smaller during the MH, and close to the present level thereafter. The distribution centroid remained within the Jinta Basin of the Hexi Corridor, Gansu Province, with only limited displacement from the LIG to the present, suggesting that this area, together with the Tianshan–Junggar Basin margins and the Alxa Plateau–Helan Mountain region, constitute key topographically and climatically inferred potential refugial areas for S. alopecuroides. Future projections indicate that suitable habitat may expand slightly under low-emission scenarios but contract under medium- to high-emission scenarios, with centroid shifts varying among pathways. These findings highlight the potential importance of such bioclimatically inferred putative refugia in maintaining the distribution of dominant dryland herbs and provide a spatially explicit basis for monitoring, germplasm conservation, and adaptive management of S. alopecuroides under ongoing climate change.

1. Introduction

Climate change exerts a profound influence on plant growth and geographical distribution [1,2]. Since the Quaternary period, climatic fluctuations, particularly the pronounced glacial-interglacial cycles, have driven the contraction and expansion of vegetation zones across the Northern Hemisphere [3,4]. These changes have resulted in the loss of localized suitable habitats for certain plant communities while facilitating species migration, thereby gradually shaping contemporary distribution patterns [5]. In the arid northwestern regions of China, Quaternary glacial climates and intensified aridification caused the contraction and fragmentation of suitable habitats for xerophytic plants. As the climate gradually warmed, the suitable ranges of these xerophytes underwent further transformation [6]. Since the 20th century, extreme weather events triggered by global climate change have become increasingly frequent, and the warming trend has continued to intensify. According to the Sixth Assessment Report (AR6) of the Intergovernmental Panel on Climate Change (IPCC), the global surface temperature is projected to reach or exceed 1.5 °C of warming in the near term (2021–2040) across most assessed emission scenarios [7]. Climate change has been shown to modify the environment to the point that it can cause the loss of suitable habitats for plants, which is one of the main reasons for species endangerment, extinction, and loss of genetic diversity [8]. Previous studies have shown that the geographical distribution of most plants would shift to high-elevation areas, reducing their suitable habitat, while a few tolerant species might increase their range [9]. Therefore, compiling this valuable historical information can be critical to designing effective management plans for habitats and species [10].
Evaluating habitat suitability based on species distribution models (SDMs) has become a pivotal tool in ecology and biogeography [11]. These models quantify the relationship between species occurrence records and environmental variables, thereby identifying the limiting factors and habitat preferences that shape a species’ distribution [12,13,14]. While contemporary macroecological literature increasingly emphasizes ensemble modeling approaches that integrate multiple algorithms (e.g., Random Forest, Boosted Regression Trees, and MaxEnt), individual Maximum Entropy (MaxEnt) modeling remains a highly reliable and widely preferred method for presence-only occurrence datasets due to its computational efficiency, operational simplicity, and stable performance [15,16,17,18,19]. MaxEnt has been widely used in species habitat assessments [20], potential distribution predictions [21], alien species evaluations [22], pedigree geographical reconstructions [23] and other research fields [24,25]. Moreover, by projecting species-climate relationships onto past climate scenarios, it can aid in reconstructing historical distribution changes, testing systematic biogeographical hypotheses, and identifying key climatic refuges for species survival during glacial periods.
Sophora alopecuroides L. (Papilionoideae) is a perennial herbaceous legume mainly distributed in the arid and semi-arid regions of the Asian continent, particularly in the northwestern regions of Xinjiang, Qinghai, Ningxia, and Xizang in China [26,27]. Due to its developed underground root system and nitrogen-fixation ability, S. alopecuroides contributes significantly to soil stabilization and ecosystem protection across northwest China [28,29,30,31]. The economic value of S. alopecuroides derives from its pharmaceutical and pesticidal properties, making it an important medicinal plant in traditional Chinese medicine, and is a valuable source of livestock forage, green manure, windbreak, and nectar for bees [26,32,33]. However, its wild populations have declined sharply in recent years due to overharvesting and overgrazing [34]. The geographic distribution of S. alopecuroides under climate change has been previously simulated at national [35] and global scales [36], primarily focusing on future habitat changes using standard bioclimatic variables. However, these studies did not account for deep-time historical fluctuations or integrate local topographic constraints. Our study expands on these works by reconstructing the species’ distribution across both paleoclimatic periods (LIG, LGM, and MH) and future scenarios up to the 2070s under four representative concentration pathways (RCP 2.6, 4.5, 6.0, and 8.5) of the CCSM4 model. Methodologically, we refined the prediction process by filtering out highly correlated variables, integrating elevation as a topographic constraint, and employing a rigorous 10-replicate subsampling validation to minimize model overfitting. This approach allows us to trace the complete spatiotemporal evolutionary dynamics and stable refugial patterns of the species, offering a more robust foundation for its germplasm conservation. Specifically, this study aimed to (i) reconstruct the historical distribution patterns of S. alopecuroides since the LIG; (ii) identify the potential glacial refugia and evaluate their future stability; and (iii) determine the key environmental drivers shaping the geographical distribution of this species. Our findings identify potential historically stable refugial areas and project future range dynamics, thereby providing a scientific foundation for designating priority protection areas and developing climate-resilient conservation strategies for S. alopecuroides. This is crucial for safeguarding its genetic diversity and ensuring the sustainable utilization of its resources under a changing climate.

2. Materials and Methods

2.1. Occurrence Records and Environmental Variables

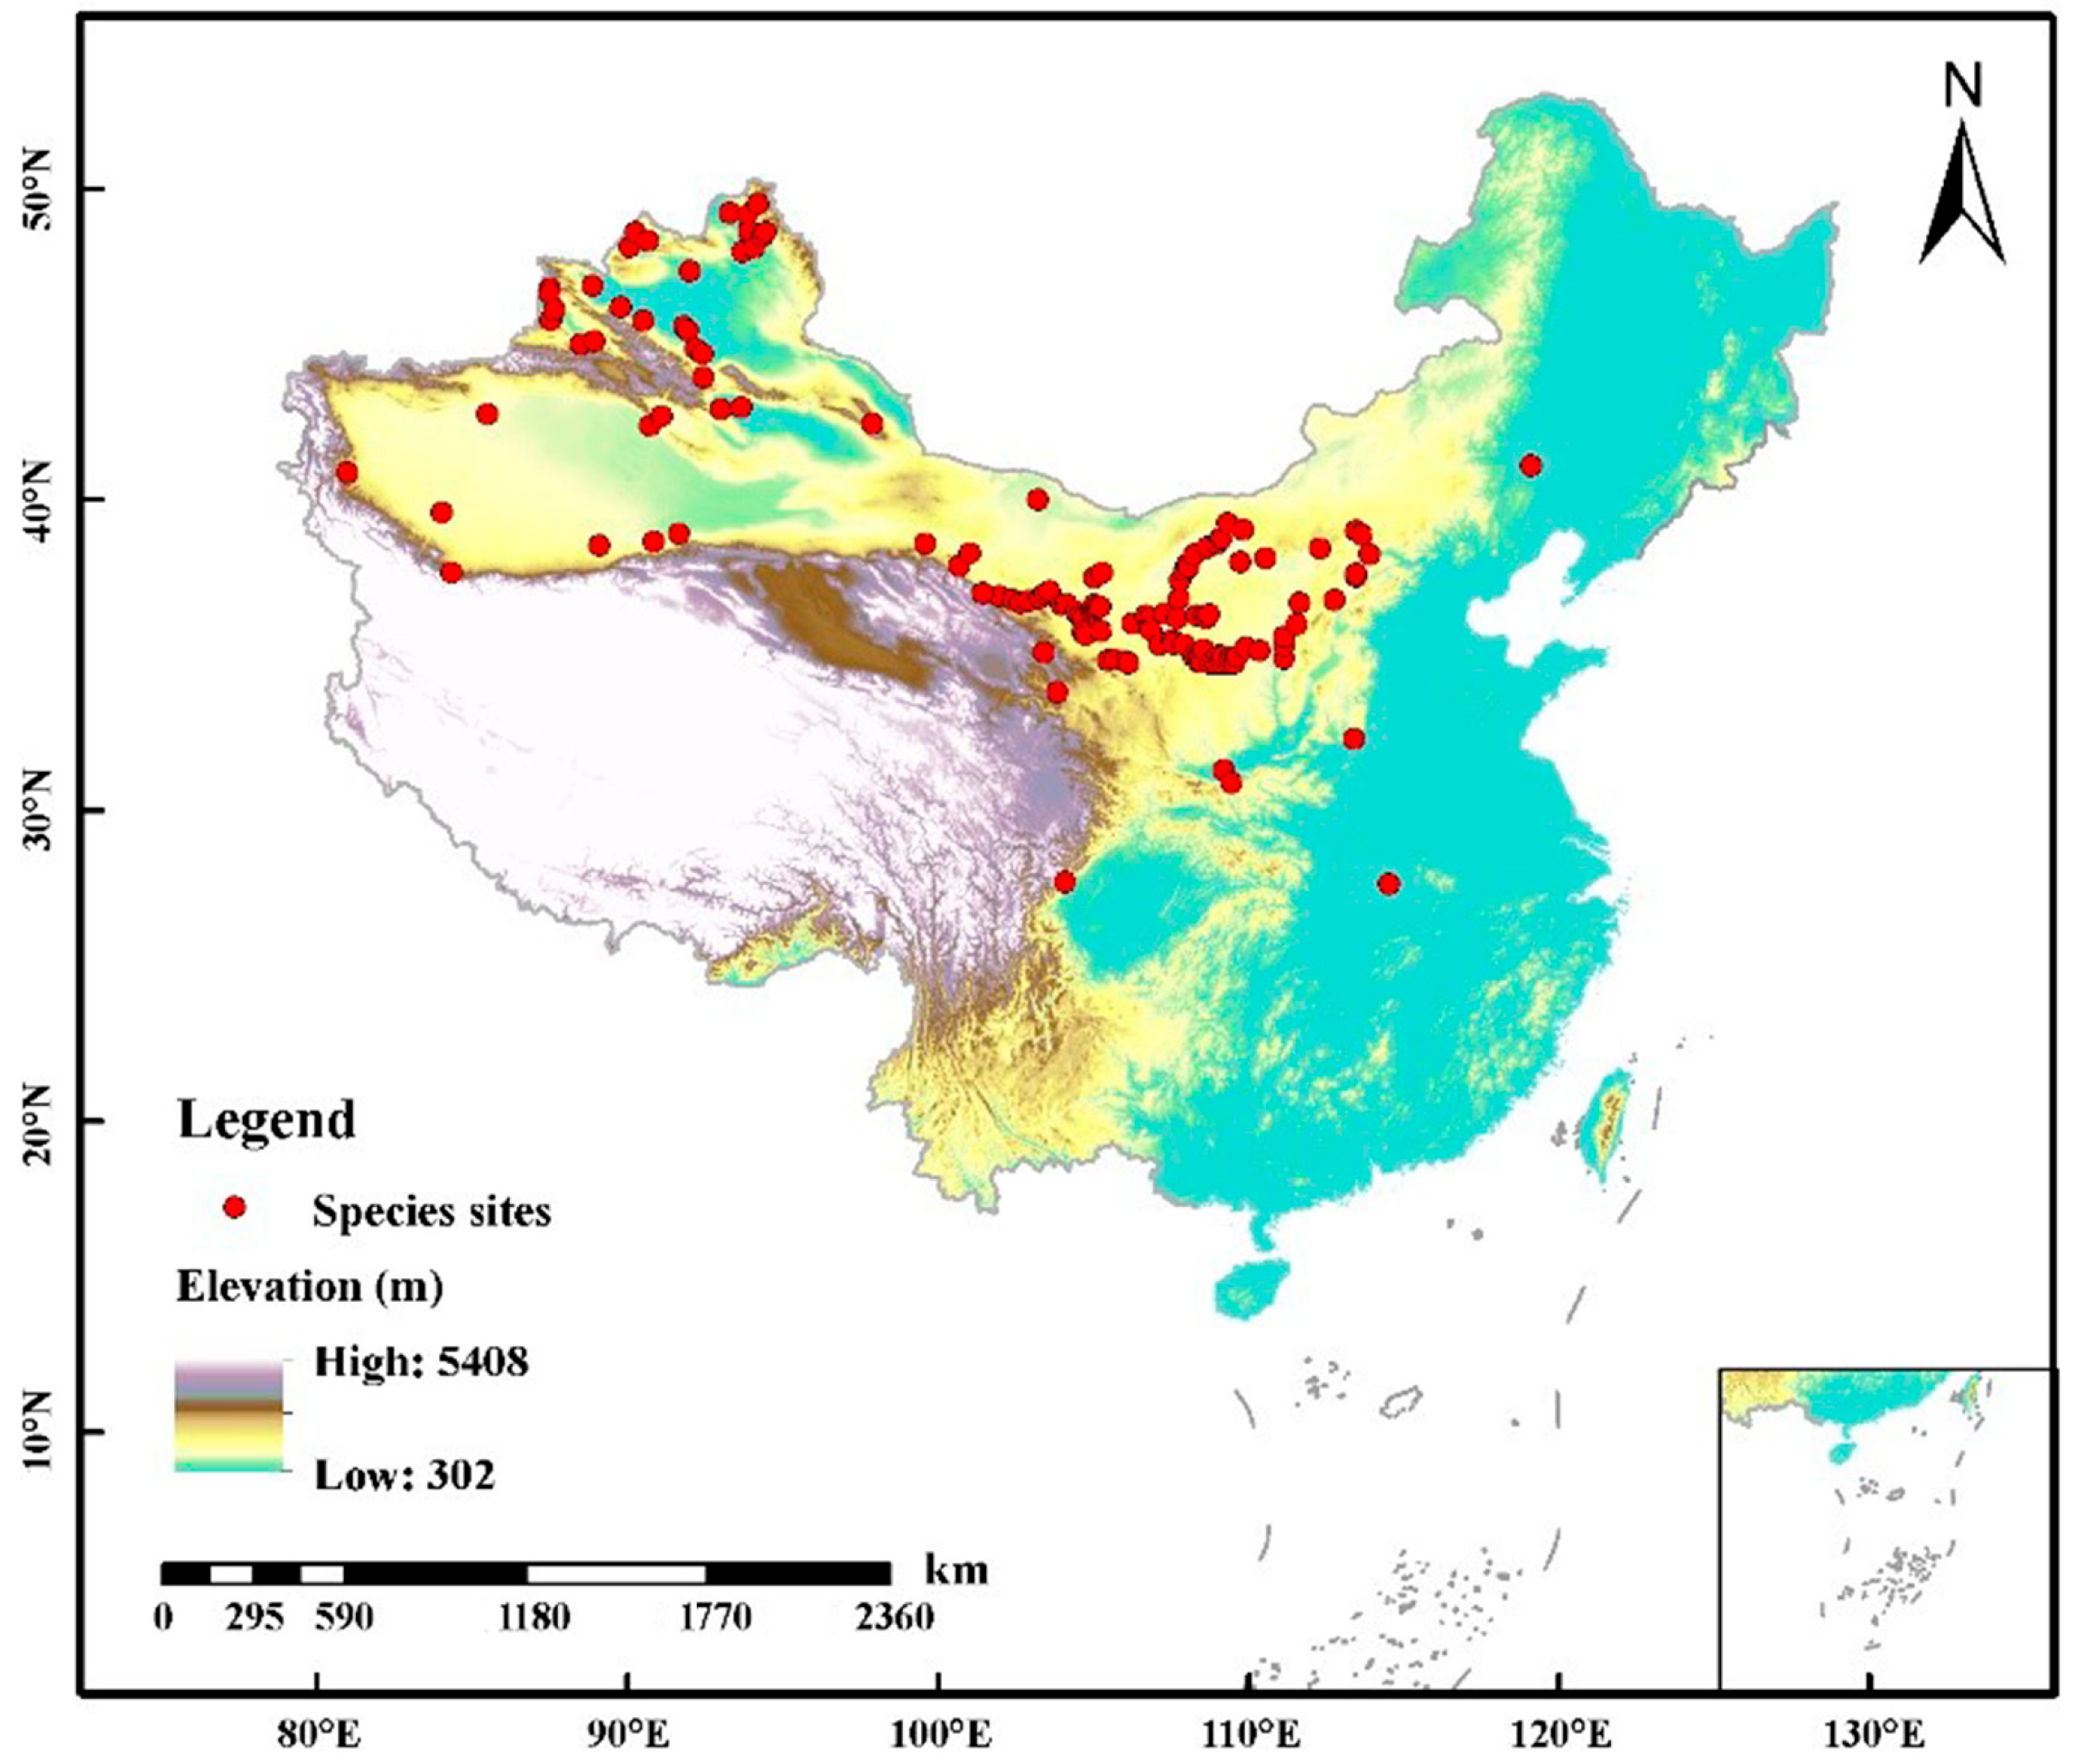
The study area was located in China, where S. alopecuroides is mainly distributed in the northwestern regions of the country. Occurrence records of S. alopecuroides in China were obtained from field investigations conducted over three years (2021–2023), as well as from multiple online databases, including the Chinese Virtual Herbarium, the Global Biodiversity Information Facility, the National Specimen Information Infrastructure, and the Teaching Specimen Resource Sharing Platform. After removing records with identification errors and vague locality descriptions, we performed grid-cell level spatial filtering by removing duplicate records within the same grid cell (at a 2.5 arc-minute resolution, approx. 5 km) to mitigate sampling bias and spatial autocorrelation. As a result, a total of 137 spatially independent occurrence points were retained for niche modeling (Figure 1).
To predict the effects of Quaternary climatic oscillations on the geographic distribution of S. alopecuroides, we used 19 bioclimatic variables and one topographic variable, elevation (Table 1). Bioclimatic variables were downloaded from the WorldClim dataset and covered the following periods: the Last Interglacial (LIG, ca. 120–140 ka BP), the Last Glacial Maximum (LGM, ca. 22 ka BP), the Mid-Holocene (MH, ca. 6 ka BP), the present period (1960–1990), and future periods represented by the 2050s and 2070s. For future climate projections, we selected the CCSM4 model and four representative concentration pathways: RCP 2.6, RCP 4.5, RCP 6.0, and RCP 8.5. In addition, elevation data were extracted from topographic maps at a spatial resolution of 2.5 arc-minutes.

2.2. Screening and Correlation Analysis of Environmental Variables

To minimize multicollinearity among environmental variables and reduce the risk of model overfitting, we assessed correlations among the environmental variables before building the MaxEnt model [37]. Preliminary models were run in MaxEnt v3.4.4 using all variables, and those with zero contribution rates were removed. Pairwise correlation analyses were then performed at the 137 occurrence points and across the entire study area. To ensure local modeling accuracy, variable screening was strictly based on the correlation matrix calculated at occurrence points. For pairs with high correlation coefficients (|r| ≥ 0.8), only one variable was retained based on its relative contribution, ecological relevance, and interpretability, while the other was excluded. This process resulted in the final selection of ten environmental variables for modeling [38,39].

2.3. Maximum Entropy Modeling and Model Evaluation

A MaxEnt approach was adopted to predict the potential distribution of S. alopecuroides across different periods in China [40]. For this analysis, occurrence records of S. alopecuroides and the ten selected environmental variables were imported into MaxEnt v3.4.4. The occurrence records were divided into two groups: 75% of the data were used to train the model, and 25% were used to test model performance [41,42]. The number of iterations was set to 500, the convergence threshold to 0.0001, the maximum number of background points to 10,000, and the output format to logistic; ten replicate runs were performed. Default feature classes and the default regularization multiplier were used in MaxEnt v3.4.4.
After model runs were completed, prediction accuracy was evaluated using the area under the receiver operating characteristic curve (AUC). AUC values typically range from 0 to 1.0, with values closer to 1.0 indicating higher model prediction accuracy; the classification standard used to interpret AUC values is shown in Table 2 [43]. To assess the effects of environmental variables on the potential distribution of S. alopecuroides, a jackknife test was used to evaluate variable importance [42,44]. Higher jackknife gain values indicate that the corresponding environmental variables have stronger influence on the potential distribution of the species [45].

2.4. Analysis of Model Predictions

To estimate the potential distribution area of S. alopecuroides during different time periods, MaxEnt v3.4.4 output files were converted into raster format and reclassified in ArcGIS v.10.4. Habitat suitability was divided into four categories using the Jenks natural breaks method implemented in ArcGIS v.10.4: highly suitable habitat (0.89 ≤ p < 1.00), moderately suitable habitat (0.53 ≤ p < 0.89), low-suitability habitat (0.29 ≤ p < 0.53), and unsuitable habitat (0.10 ≤ p < 0.29). These thresholds were generated from the distribution of predicted suitability values using the natural breaks classification. Areas with p < 0.10 were considered non-suitable and were excluded from suitable-habitat area calculations. The reclassified raster layers were then used to visualize the potential distribution of S. alopecuroides across different periods. Finally, the number of grid cells in each suitability category was counted to calculate the area and proportion of each habitat-suitability class in each time period [37].

2.5. Calculating Changes in the Distribution of Species

After modeling the suitable habitat area of S. alopecuroides for different time periods, we calculated the changes in potential distribution areas using the “Distribution changes between binary SDMs” tool available in ArcGIS v.10.4. To further explore the dynamic migration paths of S. alopecuroides, we estimated the centroid of this species from its historical distribution to its future distribution using the centroid change (line) tool from the SDMs toolbox of ArcGIS v.10.4 [46]. The analysis of core distributional shifts was mainly conducted to focus the species distribution on an independent central point and to create a vector file describing the magnitude and direction of changes over time [46,47]. Therefore, we were able to investigate the migration trend of S. alopecuroides by observing centroid shifts among different periods.

3. Results

3.1. Model Performance and Key Environmental Drivers

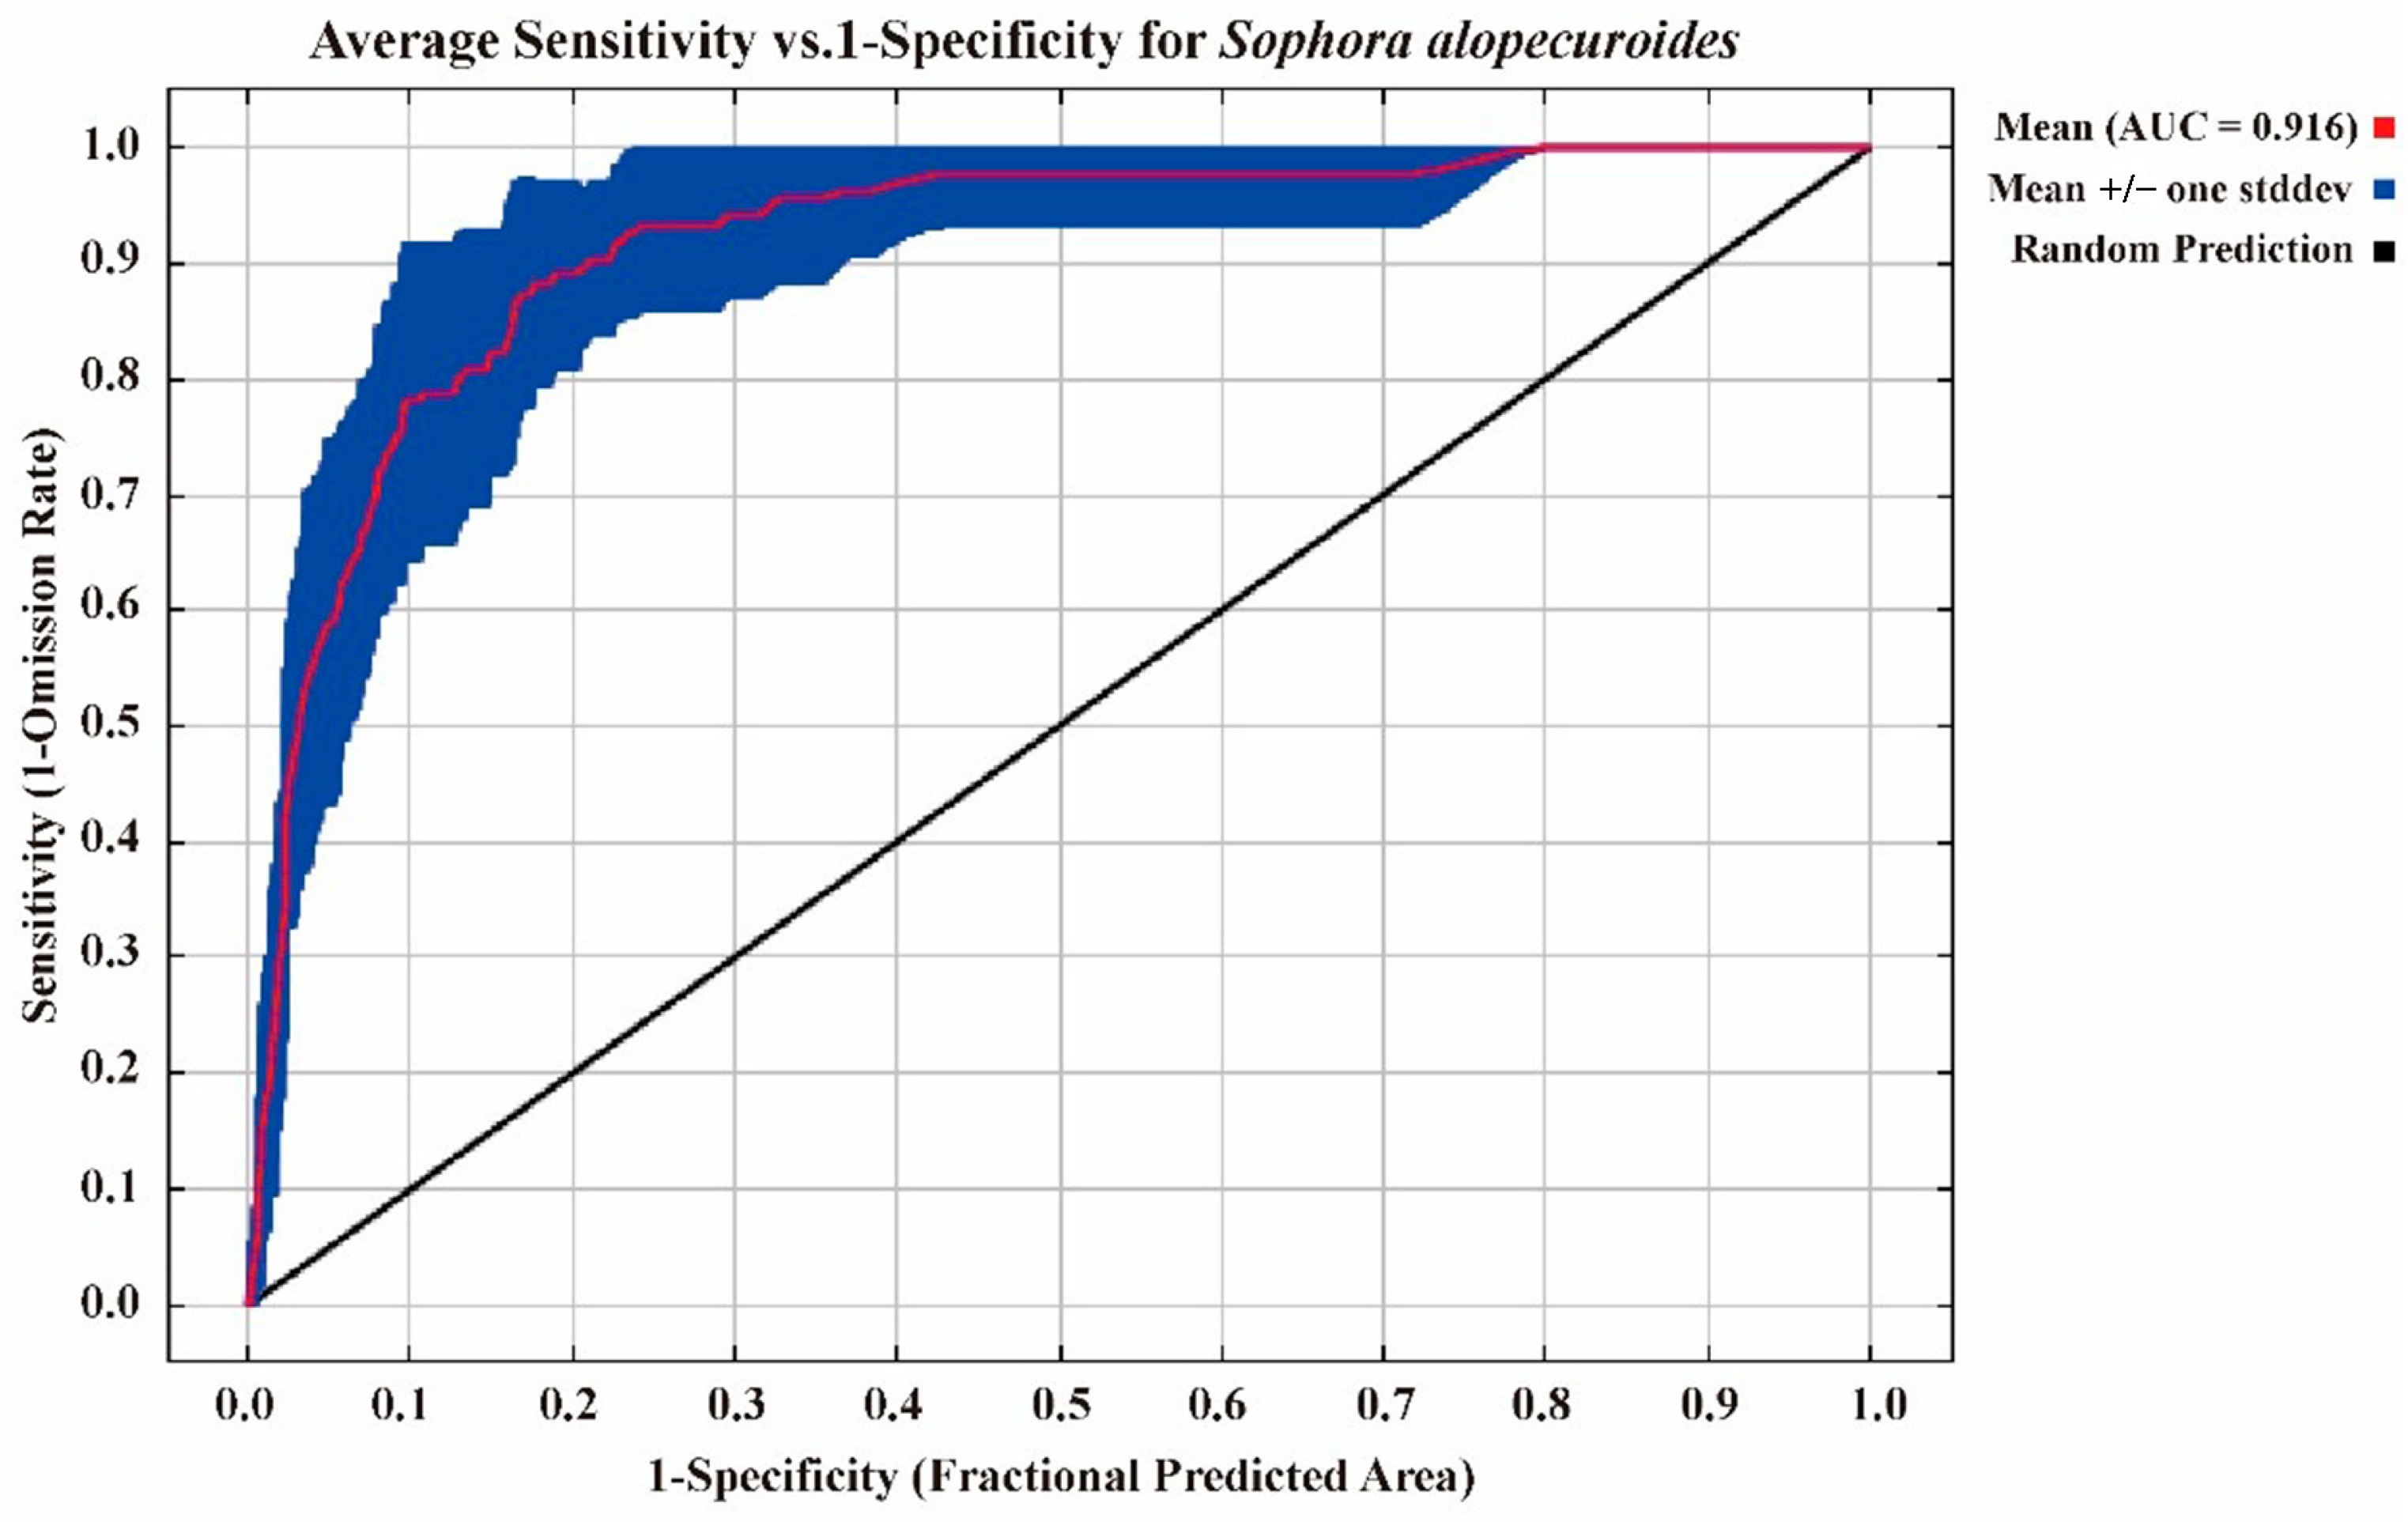
The ROC curve generated by the MaxEnt model showed that the average AUC value obtained from 10 replicate runs exceeded 0.9 (Figure 2), specifically, the average testing AUC values for S. alopecuroides under different climate scenarios ranged from 0.905 to 0.927, with the standard deviation (SD) across 10 repetitions remaining below 0.03. According to the AUC classification standard, this level of performance is considered optimal (Table 2), indicating high predictive performance and reliability. We conducted a two-level correlation analysis of all environmental variables (Table 3). Based on the correlation matrix calculated at the 137 occurrence points (lower-left triangle of Table 3), the correlation between bio16 and bio18 was the highest (r = 0.997), and that between bio3 and bio12 was the lowest (r = 0.006). Meanwhile, based on the correlation matrix calculated across the entire study area (upper-right triangle of Table 3), the correlation between bio14 and bio17 was the highest (r = 0.993), and that between bio7 and bio10 was the lowest (r = −0.014). Finally, we screened ten environment variables for model prediction, namely bio1, bio3, bio7, bio8, bio9, bio12, bio15, bio17, bio18, and elevation. Based on the relative contribution of the ten environmental variables to model prediction, the four most important variables were temperature annual range (Bio7; 28.2%), elevation (14.8%), precipitation of the warmest quarter (Bio18; 14.6%), and mean temperature of the driest quarter (Bio9; 14.5%), with a cumulative contribution rate of 72.1% (Table 4).
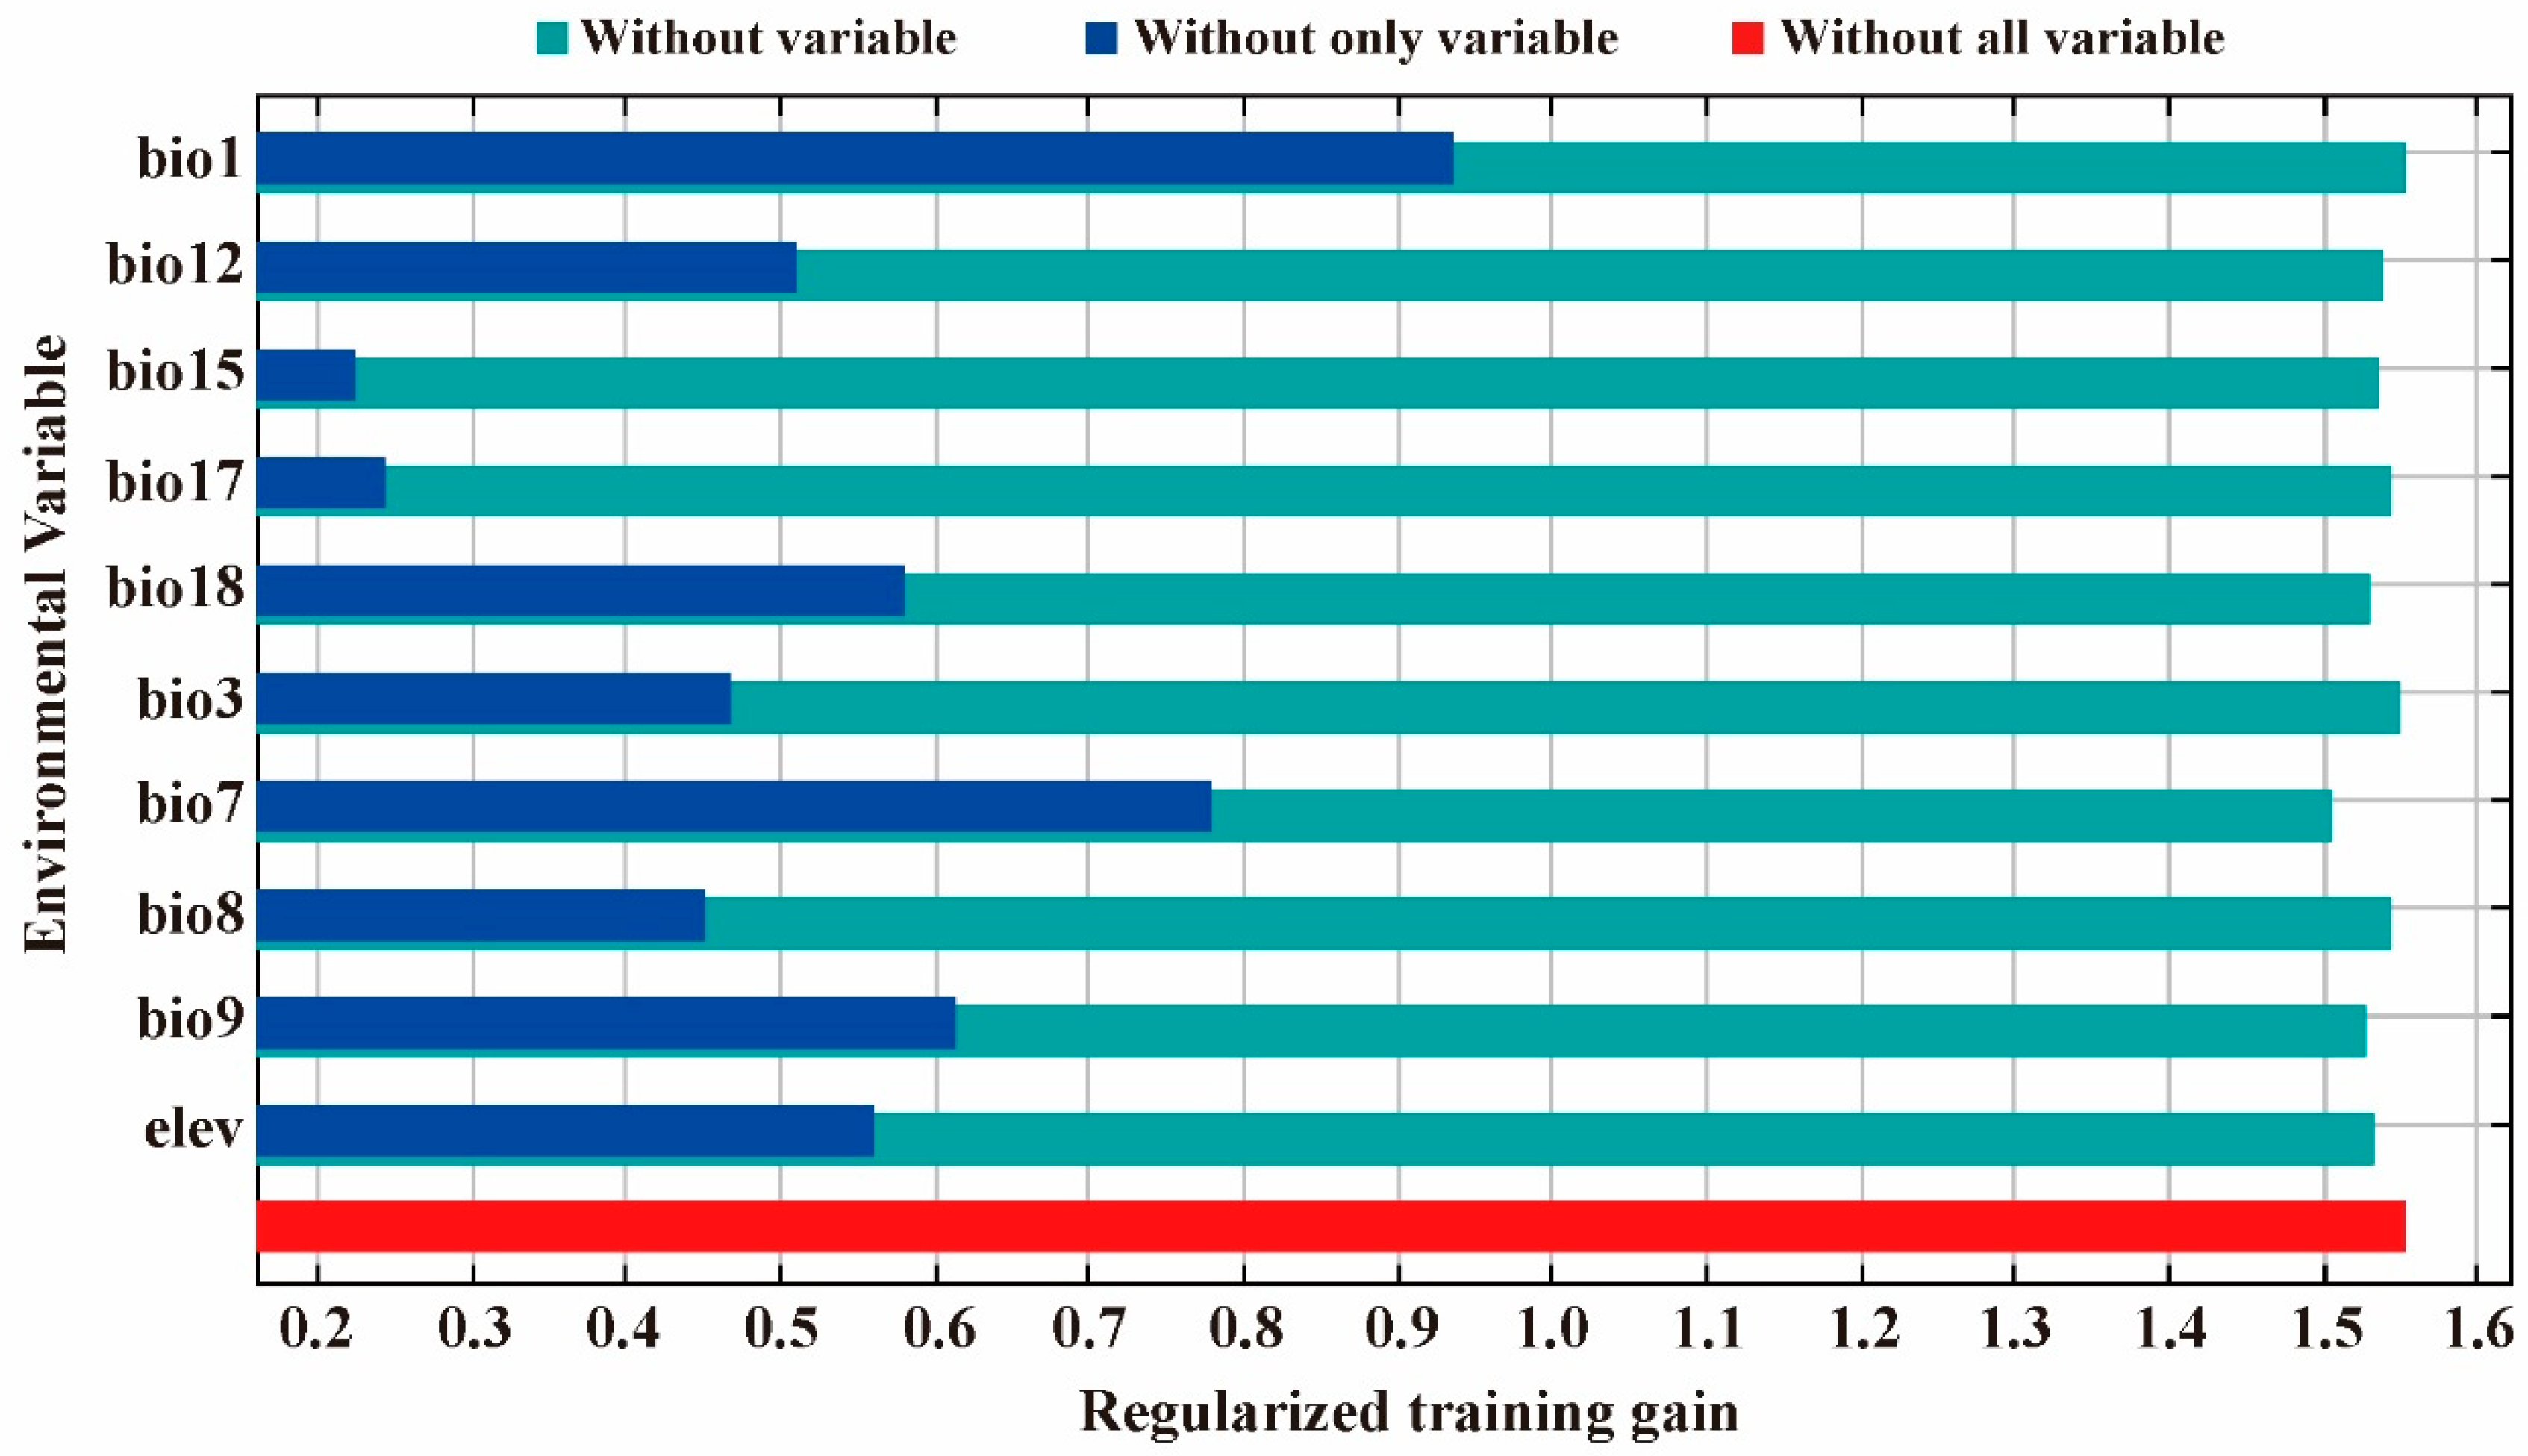
The jackknife analysis further indicated that annual mean temperature (Bio1), temperature annual range (Bio7), mean temperature of the driest quarter (Bio9), and elevation were the most influential environmental variables, with the gain values for Bio1 and Bio7 in the “with only variable” condition exceeding 0.7 (Figure 3). Although Bio18 had a high percentage contribution, the jackknife test emphasized the independent explanatory power of Bio1, Bio7, Bio9, and elevation, indicating that different importance metrics captured complementary aspects of environmental limitation. These ranking discrepancies among percent contribution, permutation importance, and jackknife gains reflect the inherent methodological uncertainty of the model, suggesting that variable importance should not be interpreted as definitive evidence of a single dominant driver.
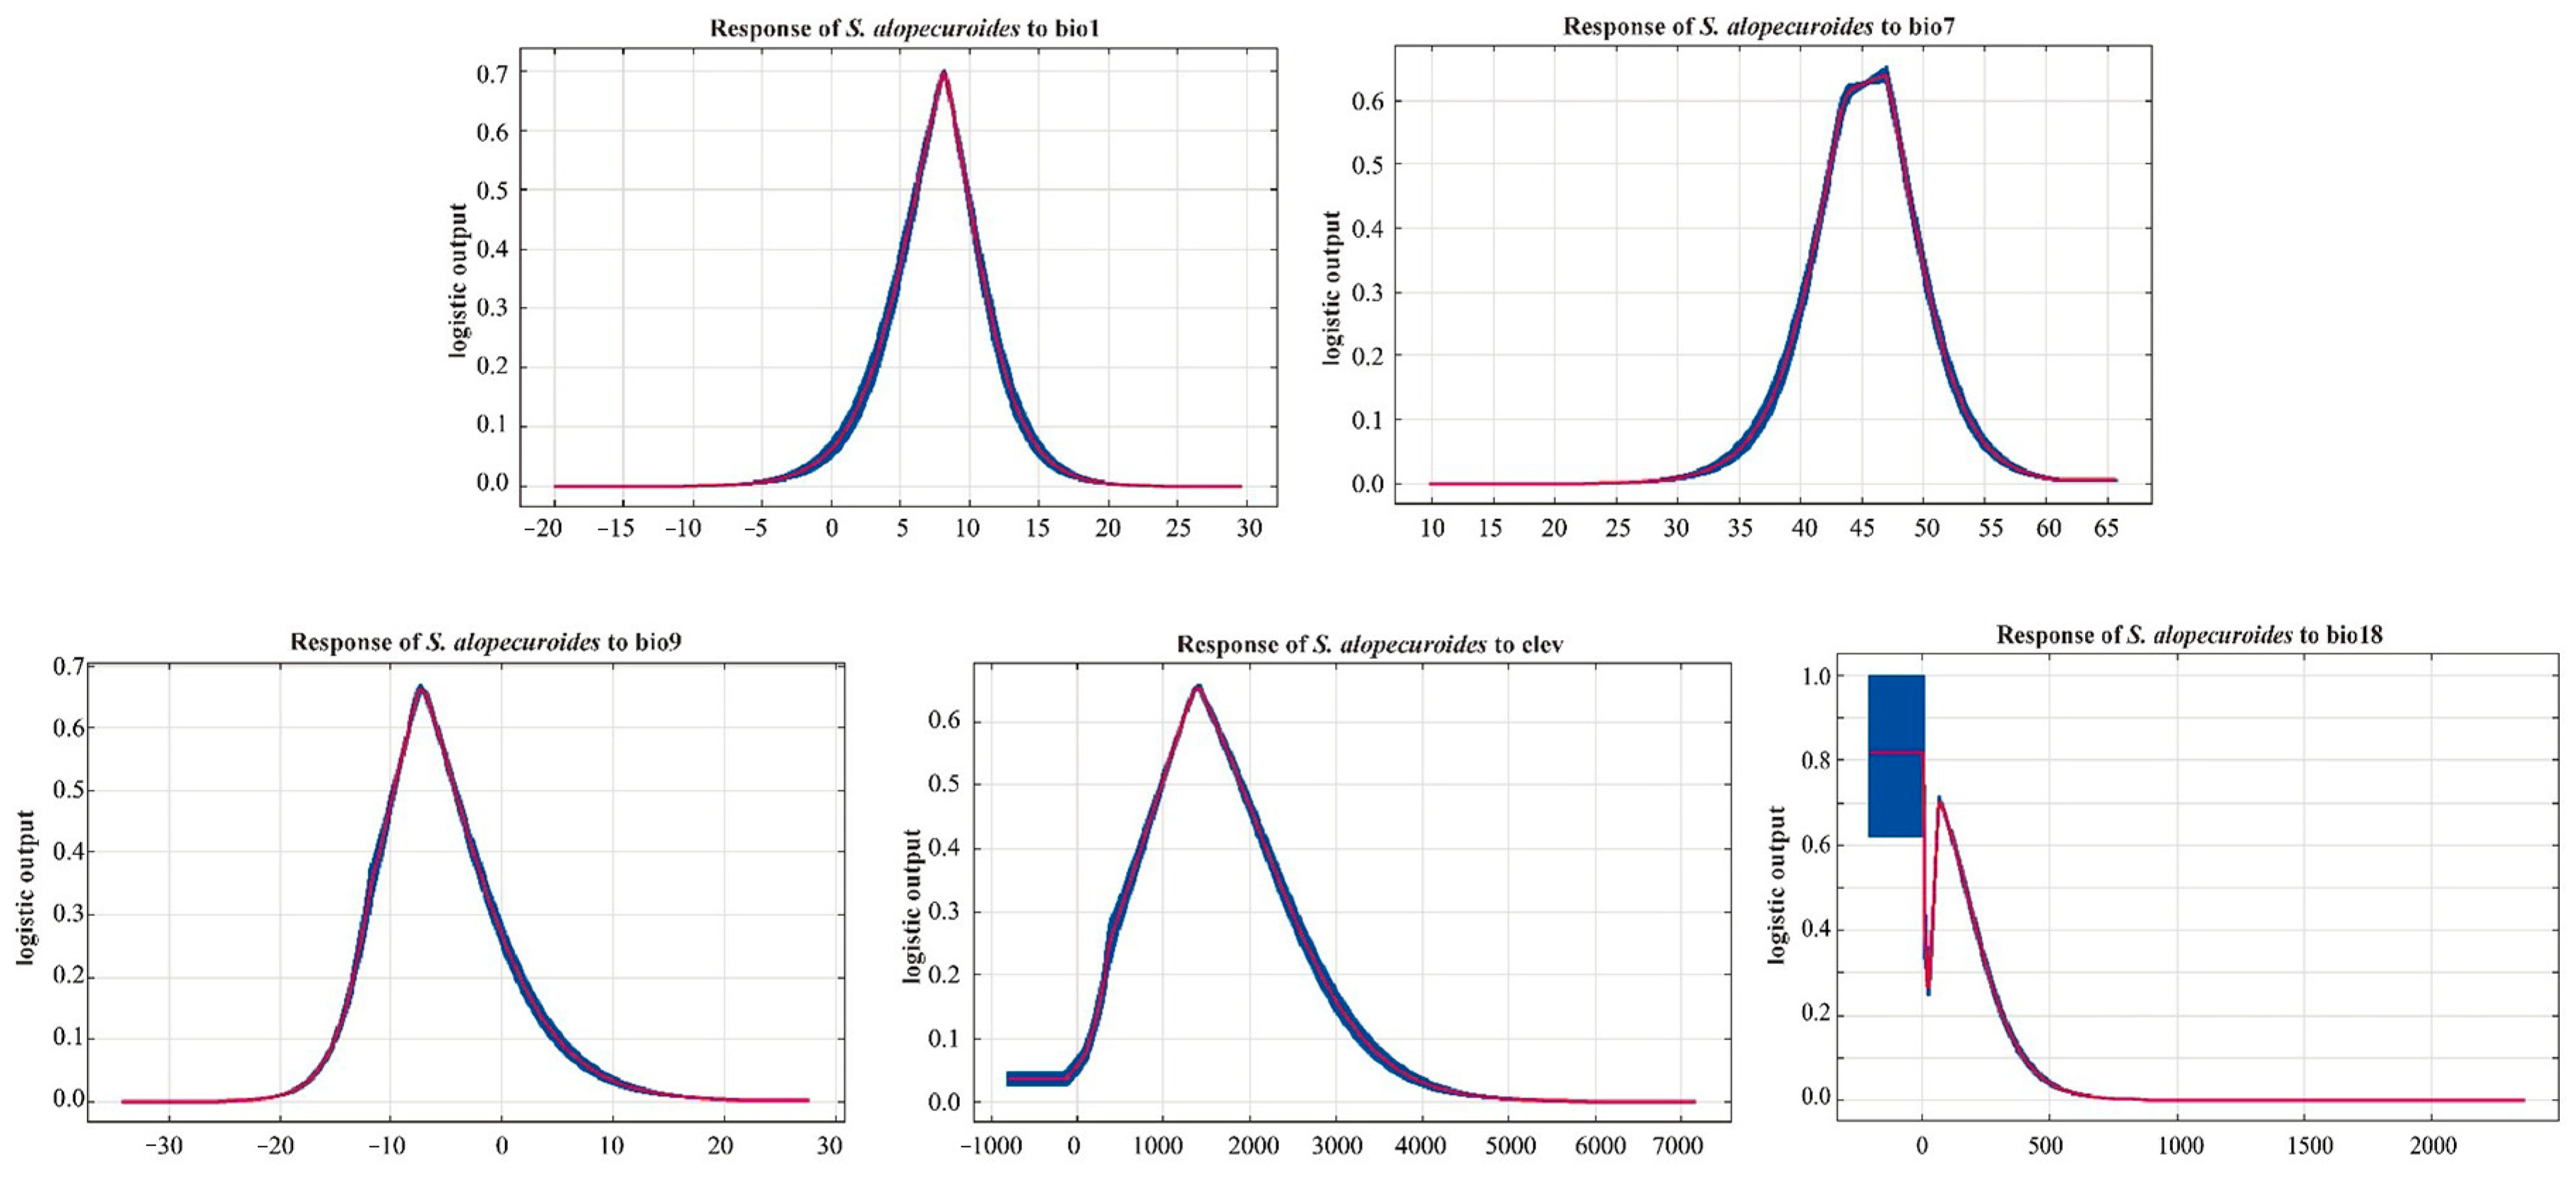
Analysis of the response curves showed that Bio1, Bio7, Bio9, Bio18, and elevation were the main environmental factors limiting the distribution of S. alopecuroides. When the distribution probability (P) was greater than 0.5 [48], the suitable environmental ranges were as follows: temperature annual range of 42.4–48.5 °C, mean temperature of the driest quarter of −9.9 to −4.1 °C, elevation of 950–1948 m, and annual mean temperature of 6.1–9.8 °C. In addition, precipitation during the warmest quarter was generally less than 174 mm, with the highest distribution probability occurring when precipitation was below 14 mm (Figure 4).

3.2. Historical Dynamics of Potential Suitable Habitat for S. alopecuroides

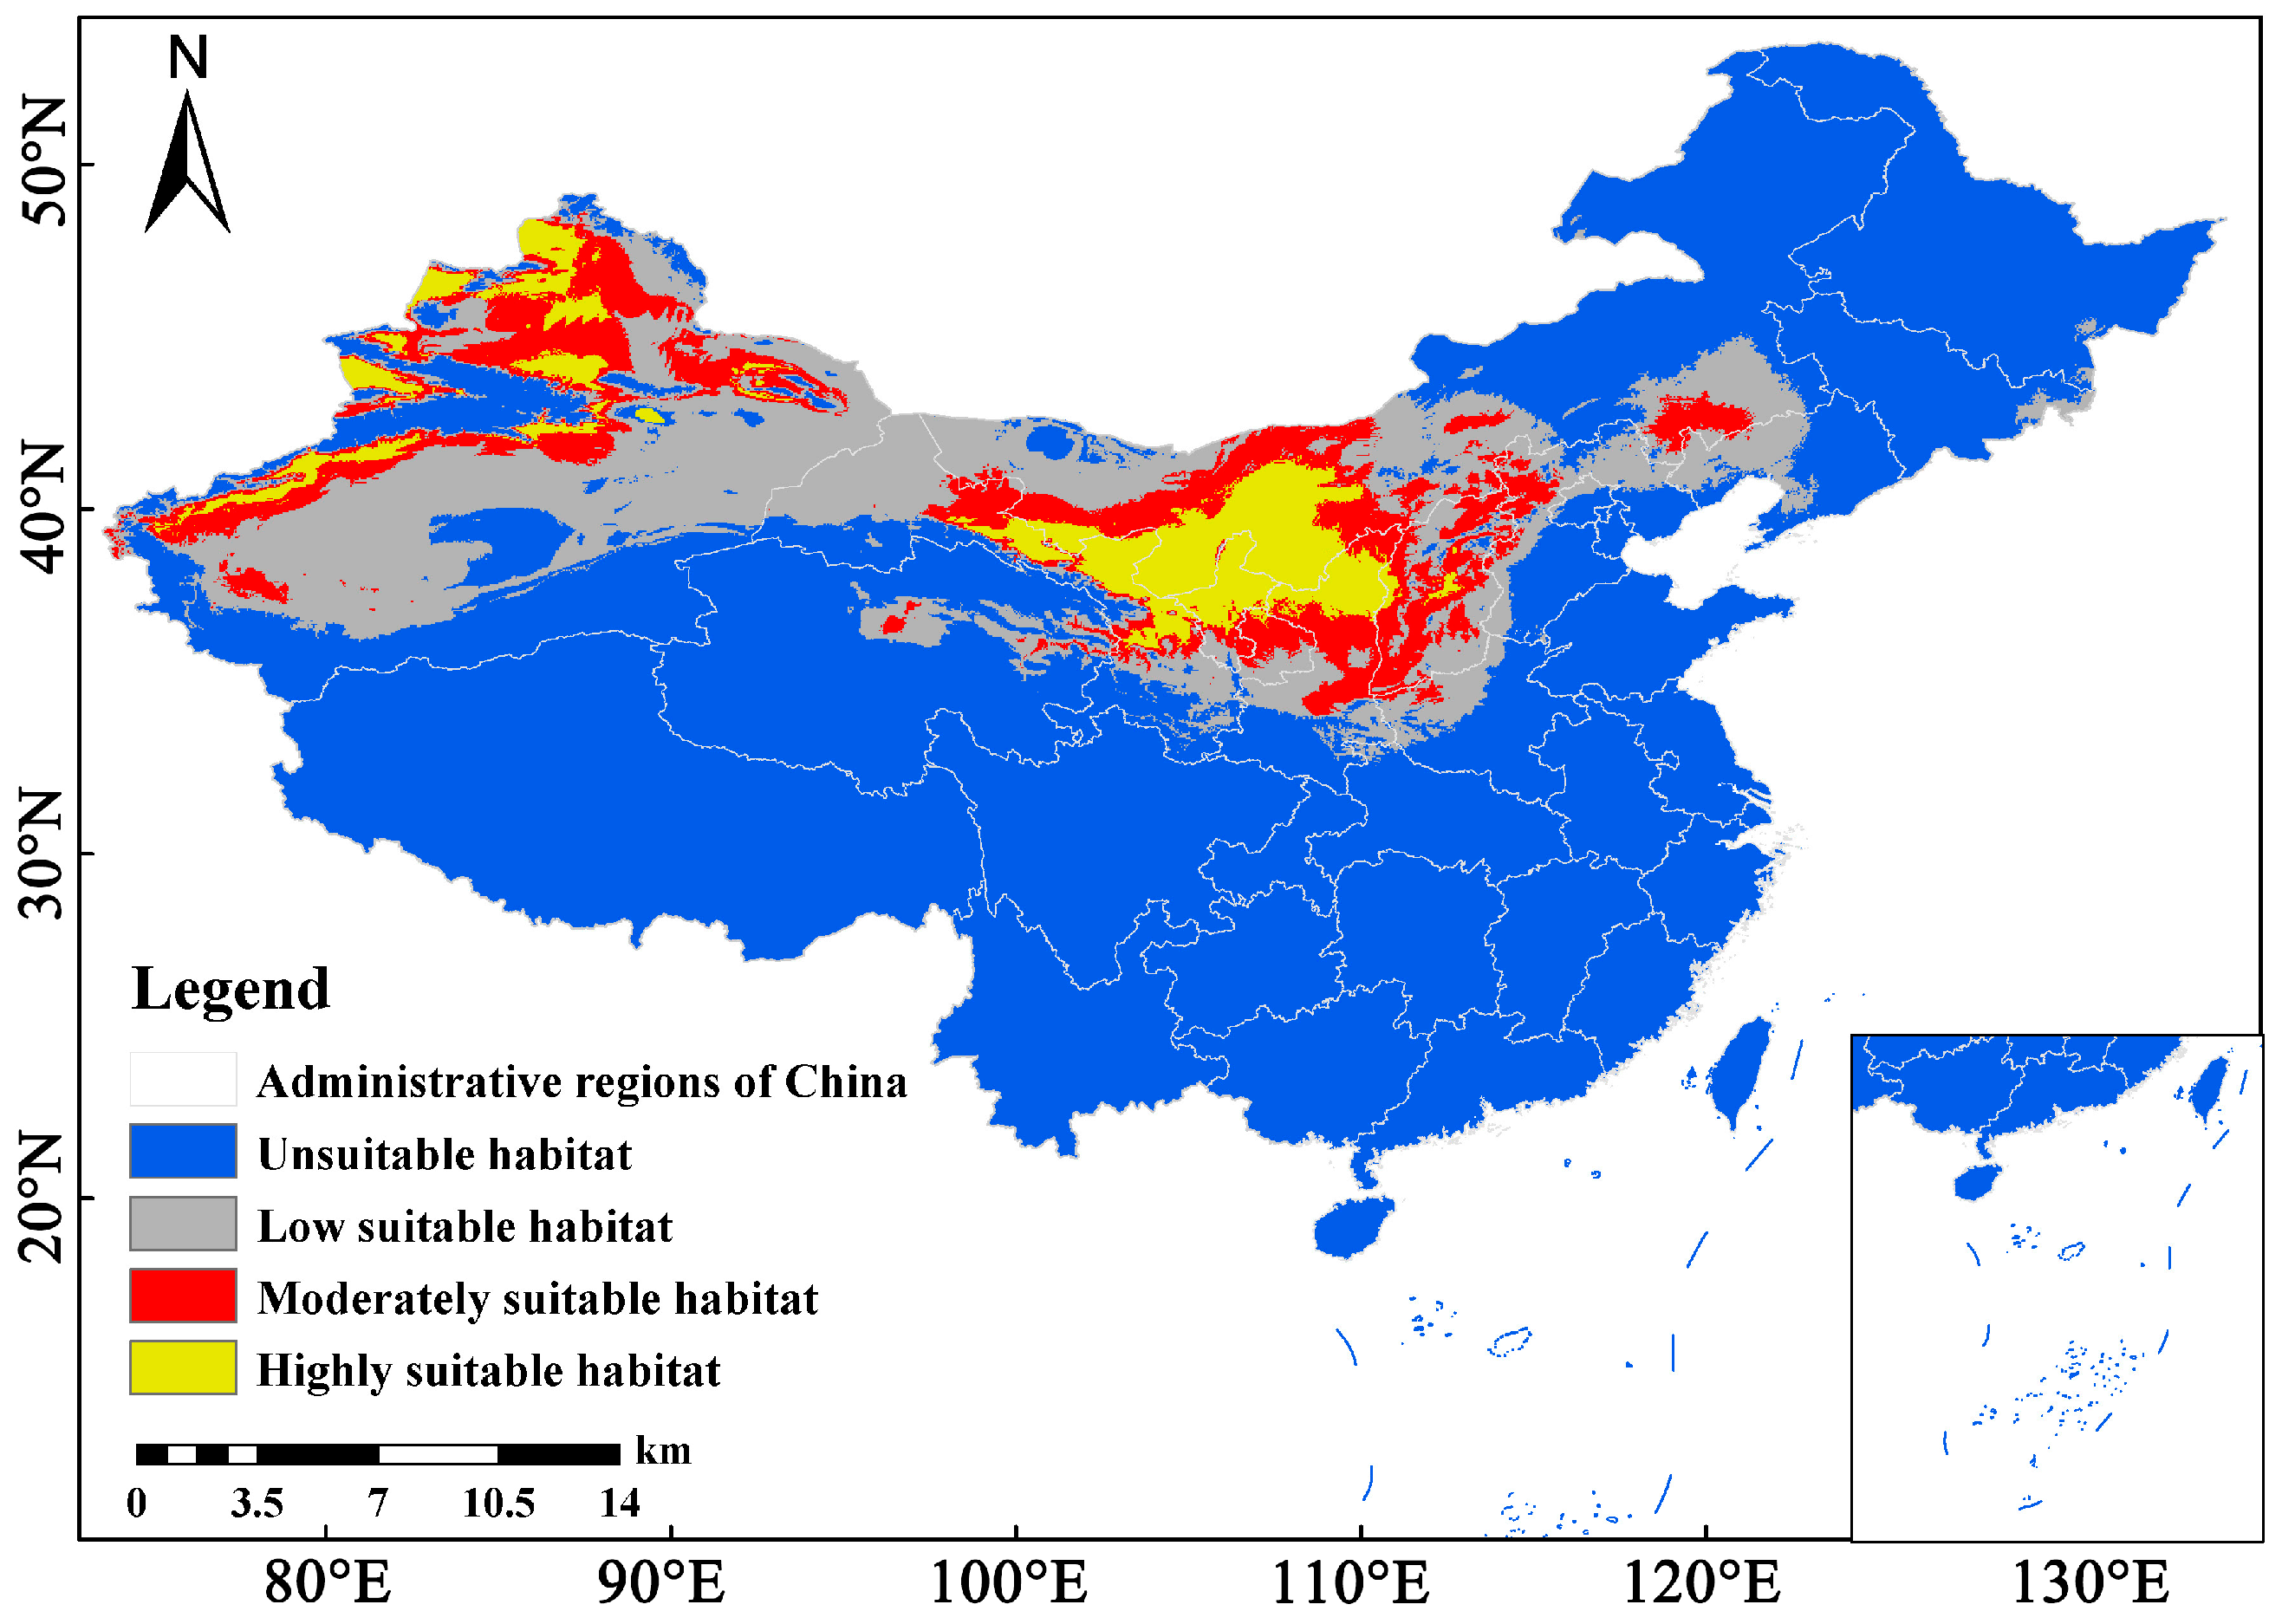
The current total suitable habitat of S. alopecuroides predicted by MaxEnt v3.4.4 showed a discontinuous and patchy distribution pattern across northwestern China, broadly consistent with the known current distribution of the species (Figure 5). The total suitable habitat under current climatic conditions covered 2.77 × 10⁶ km2 (Table 5). Highly suitable habitats were mainly concentrated in the Badain Jaran Desert, Tengger Desert, Ordos Plateau, Hetao Plain, southern Altai Mountains, southeastern Junggar Basin, and Ili River Valley (Figure 5), covering an estimated area of 4.19 × 10⁵ km2 (Table 5).
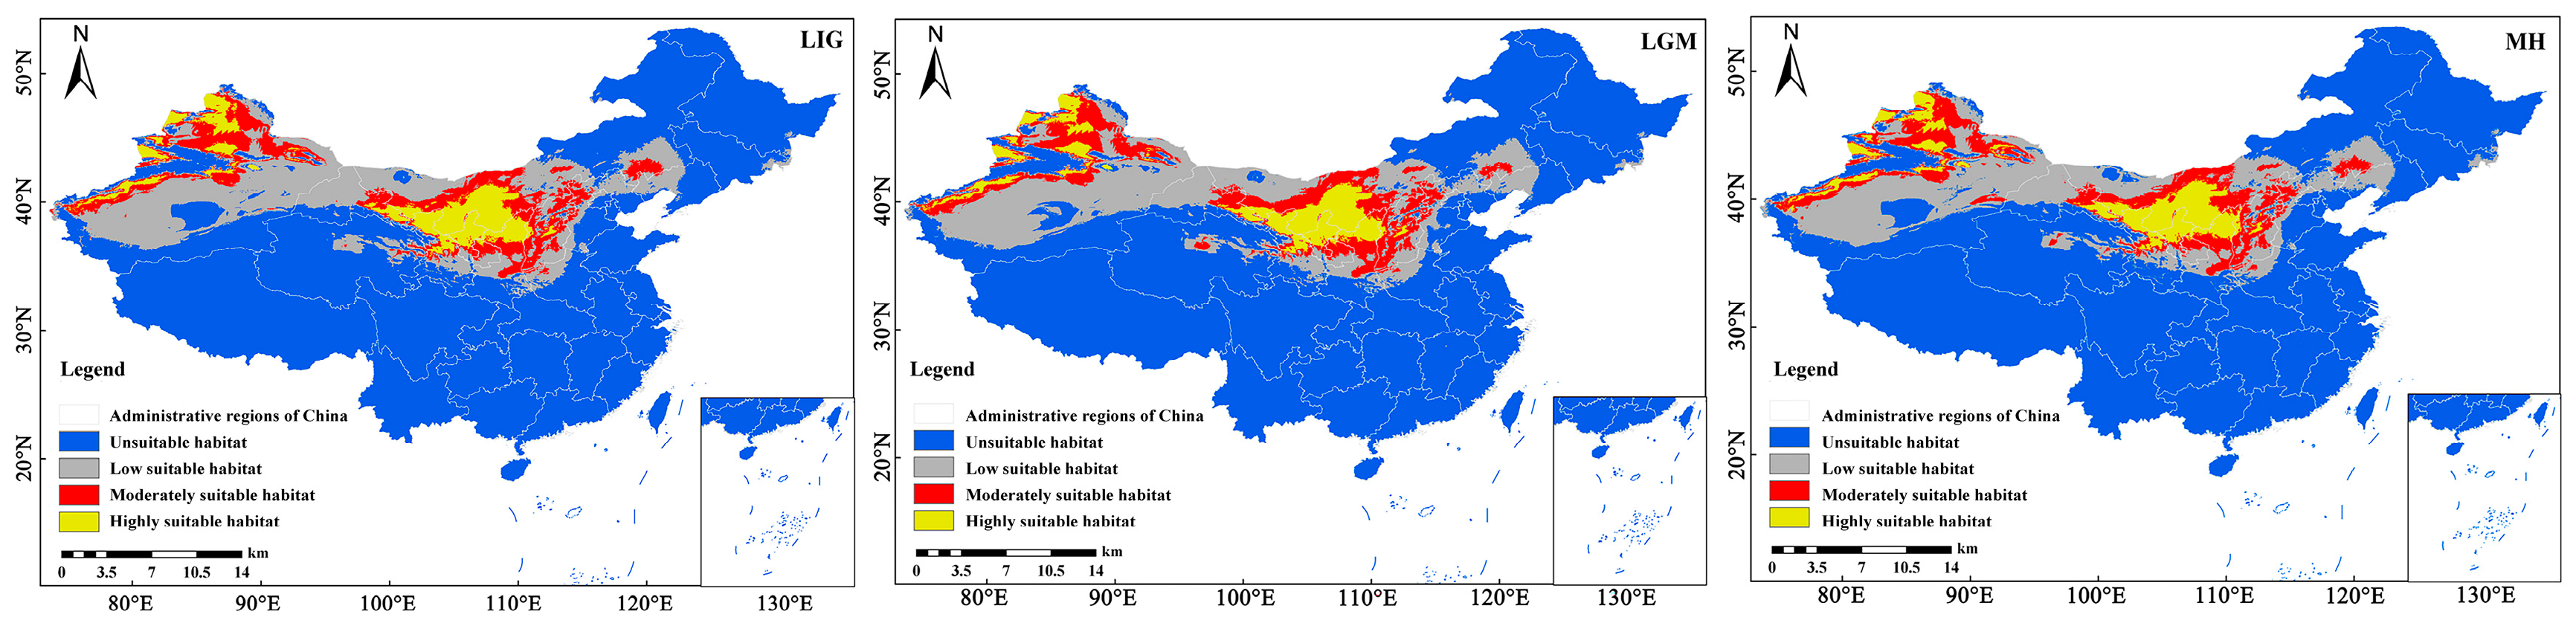
From the LIG to the MH, the total suitable habitat area of S. alopecuroides showed a general declining trend (Table 5). However, these minor variations remain within the range of model uncertainty (SD < 0.03), indicating a high level of long-term distribution stability rather than significant range shifts. Compared with the present, the highly suitable habitat during the LIG expanded by 1.95 × 10⁴ km2, extending toward northern Inner Mongolia, the northern Hexi Corridor, and central Shanxi. Overall, the total suitable range expanded in areas south of the Altai Mountains, north of the Tianshan Mountains, the Hexi Corridor, the Alxa Plateau, and the Ordos Plateau. In contrast, contractions occurred in the Junggar Basin, Turpan Basin, Tarim Basin, areas north of the Taklamakan Desert, and the Mu Us Desert.
The area of highly suitable habitat during the LGM decreased by 1.80 × 10⁴ km2 compared with the LIG. Portions of highly suitable habitat in the southern Altai Mountains of Xinjiang, the Junggar Basin, the Hexi Corridor of Gansu, and the Alxa Grassland of Inner Mongolia shifted to moderately suitable habitat. By the MH, the highly suitable habitat area had recovered, increasing by 0.96 × 10⁴ km2 compared with the LGM. This recovery mainly involved the reclassification of some moderately suitable areas south of the Altai Mountains in Xinjiang into highly suitable habitats.
During both the LGM and MH, the total suitable range expanded in parts of the Gurbantunggut Desert, the Tianshan Mountains, areas west of the Lüliang Mountains, and the Mu Us Desert. Conversely, contractions occurred south of the Altai Mountains, in parts of the Tianshan Mountains, on the Alxa Plateau, and south of the Baiyu Mountains. Overall, the current suitable habitat of S. alopecuroides was largely consistent with its historically projected potential suitability, and the most significant change in potential suitable areas occurred in the western Tarim Basin (Figure 6).

3.3. Future Distribution Responses of S. alopecuroides to Climate Scenarios

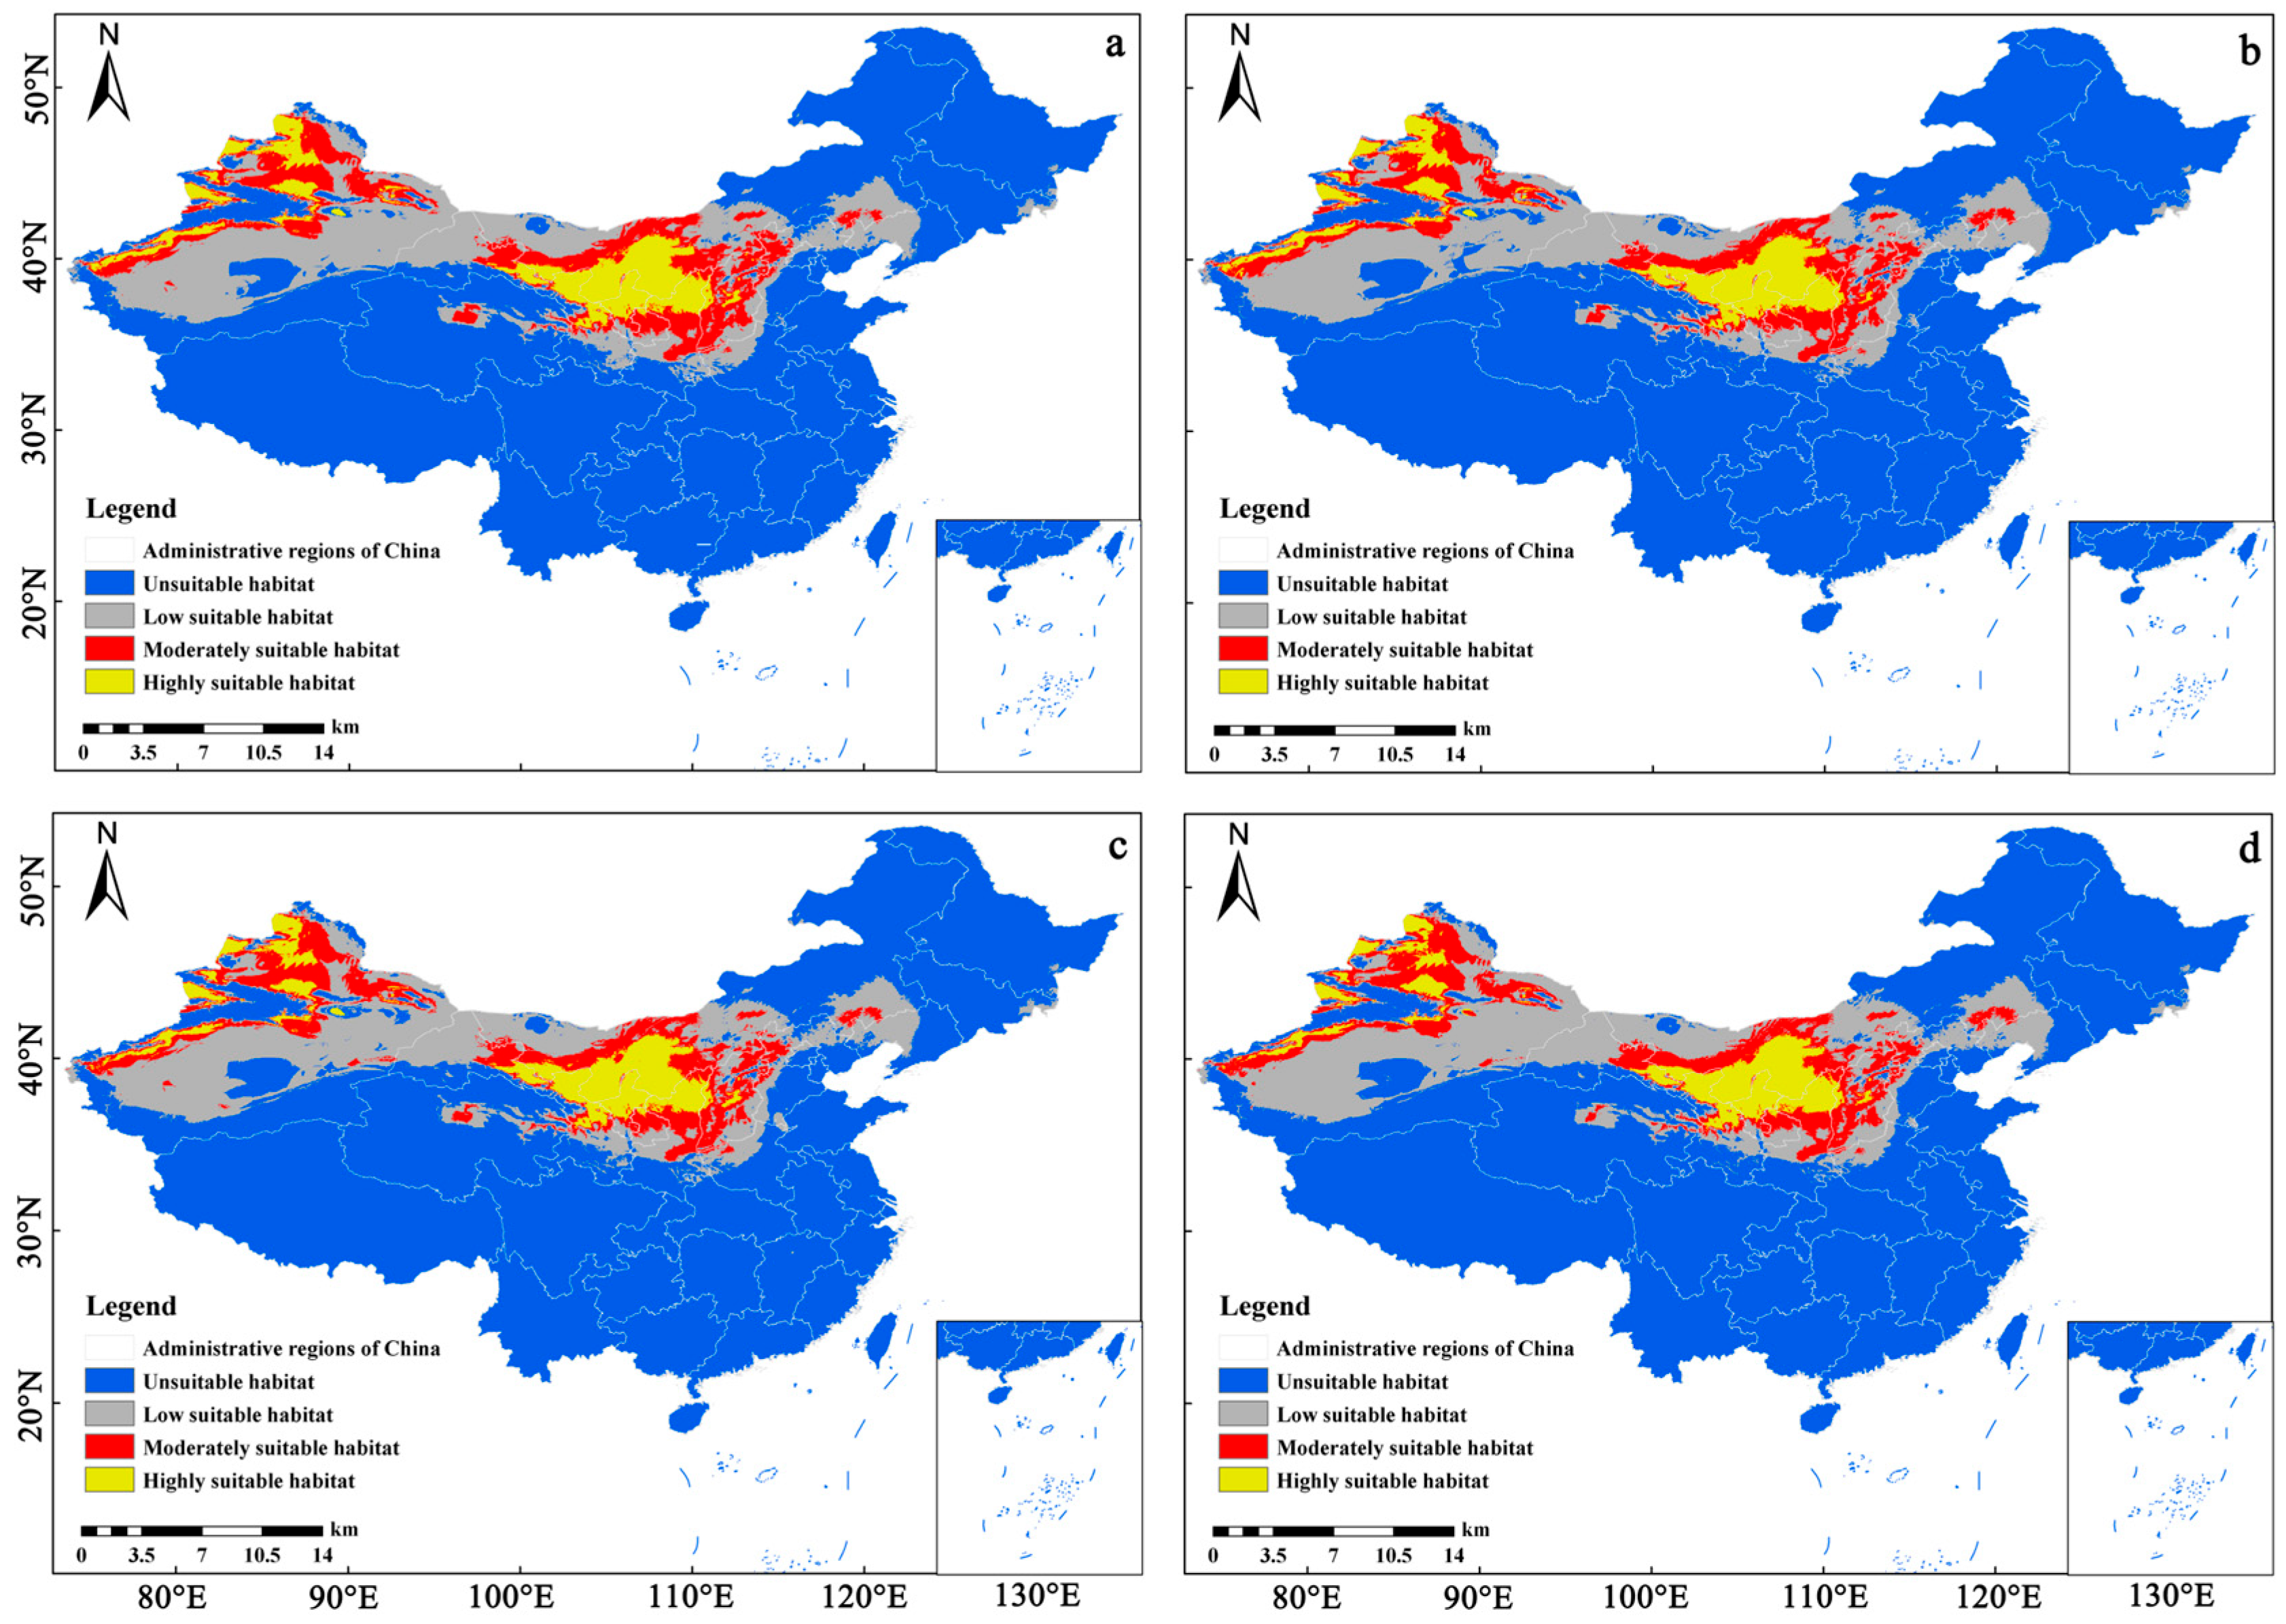
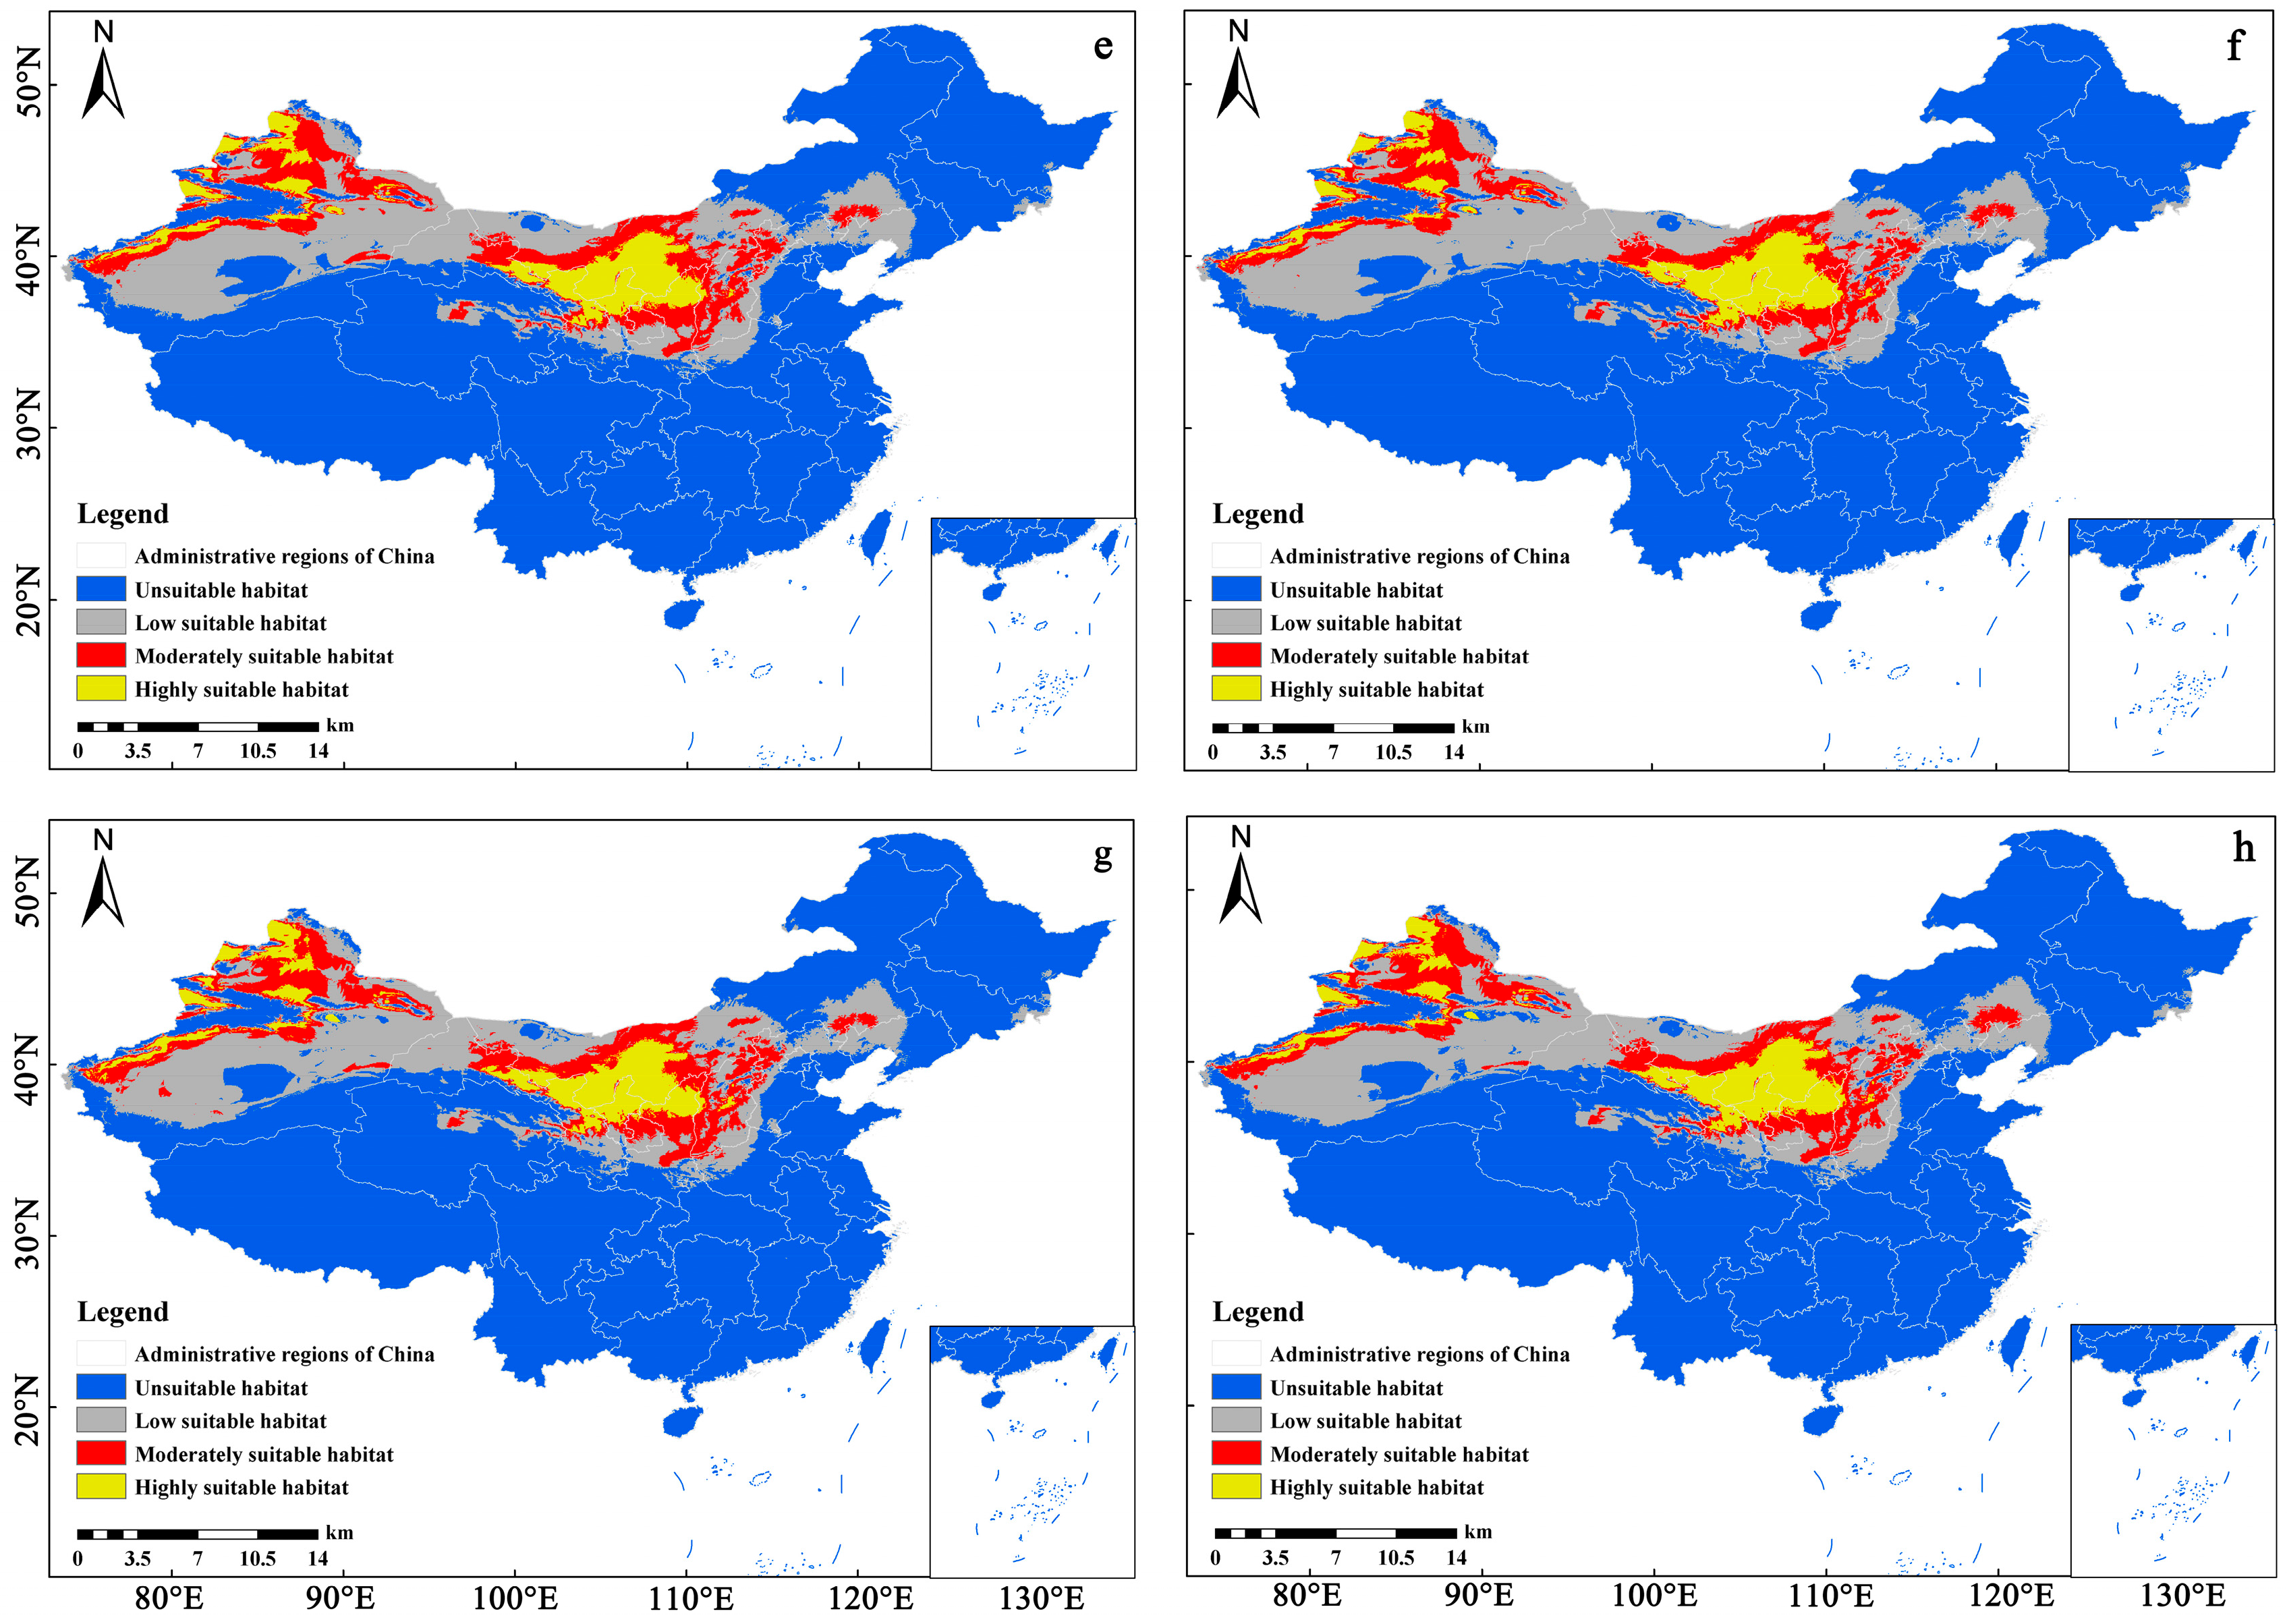
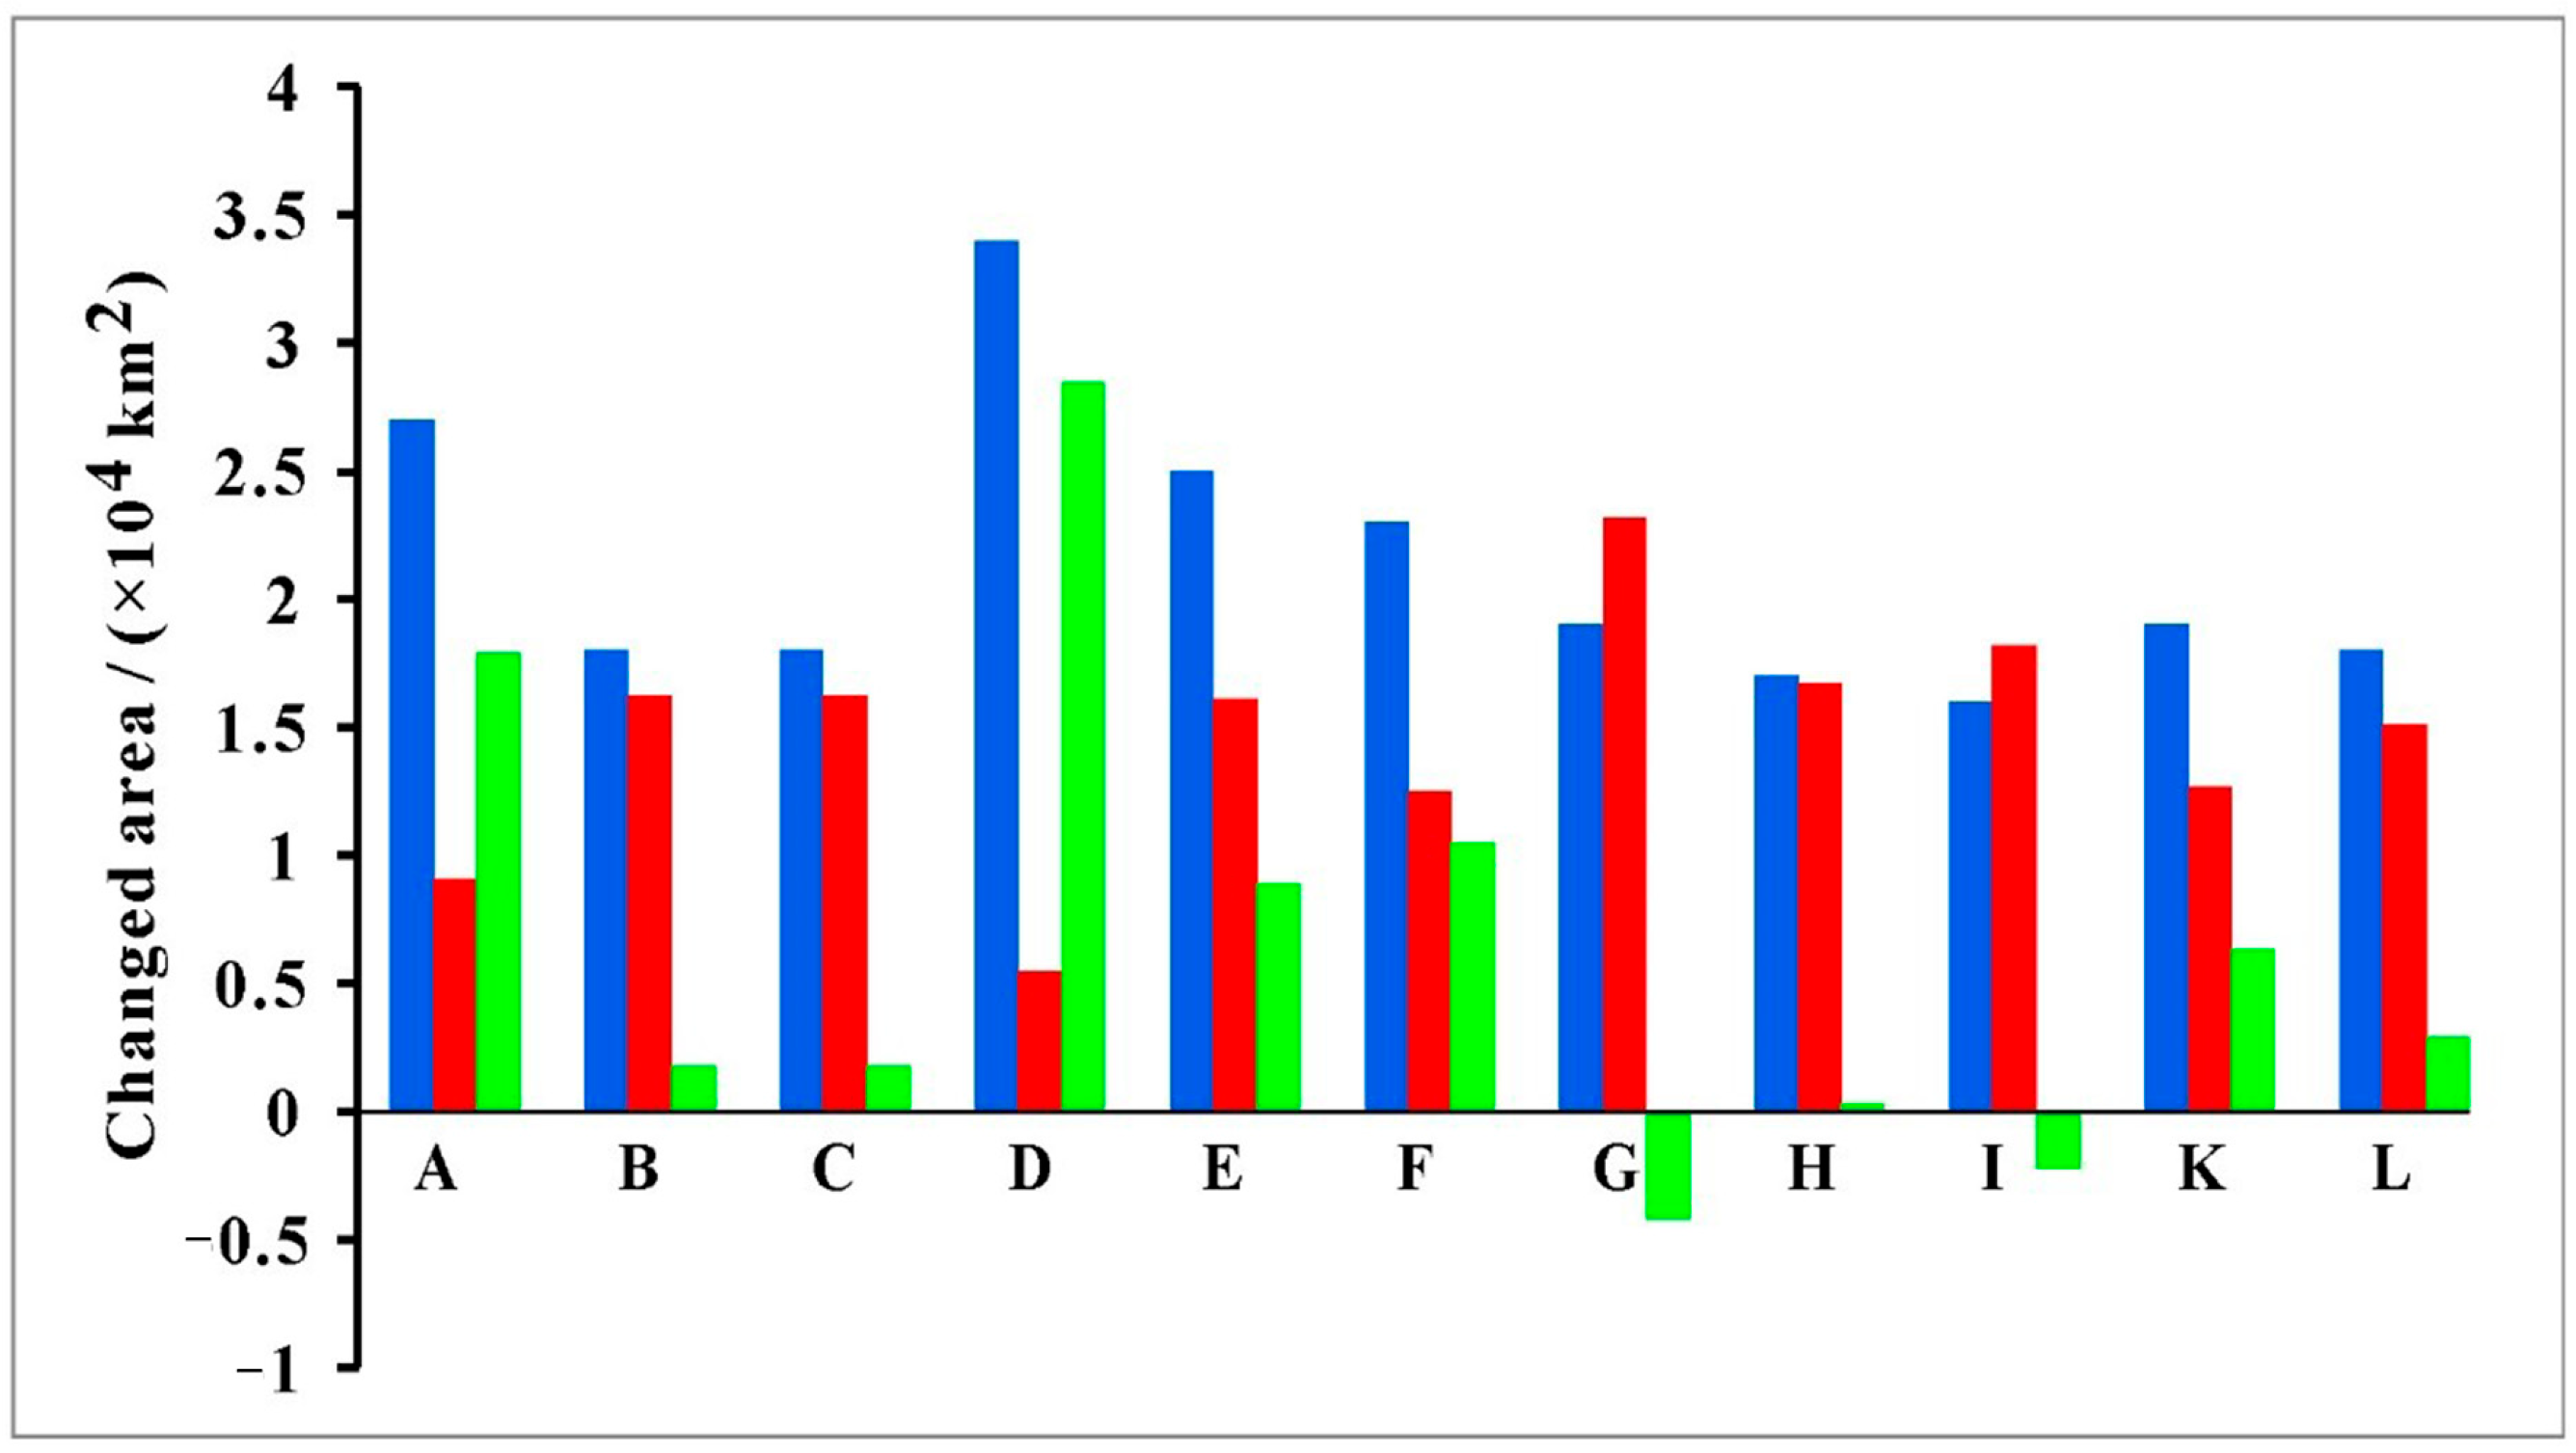
Under future climate scenarios (2050s and 2070s), the potential suitable habitat of S. alopecuroides is projected to remain broadly stable but exhibit clear scenario-specific adjustments (Figure 7; Table 5). Under the low-emission scenario (RCP 2.6), the total suitable area expands slightly, peaking in the 2050s with highly suitable habitat increasing by 2.98 × 10⁴ km2 relative to the present. Conversely, under medium- to high-emission scenarios (RCP 4.5, 6.0, and 8.5), the total suitable habitat experiences varying degrees of contraction and fragmentation, with the minimum area occurring under RCP 4.5 in the 2050s (Table 5; Figure 8).
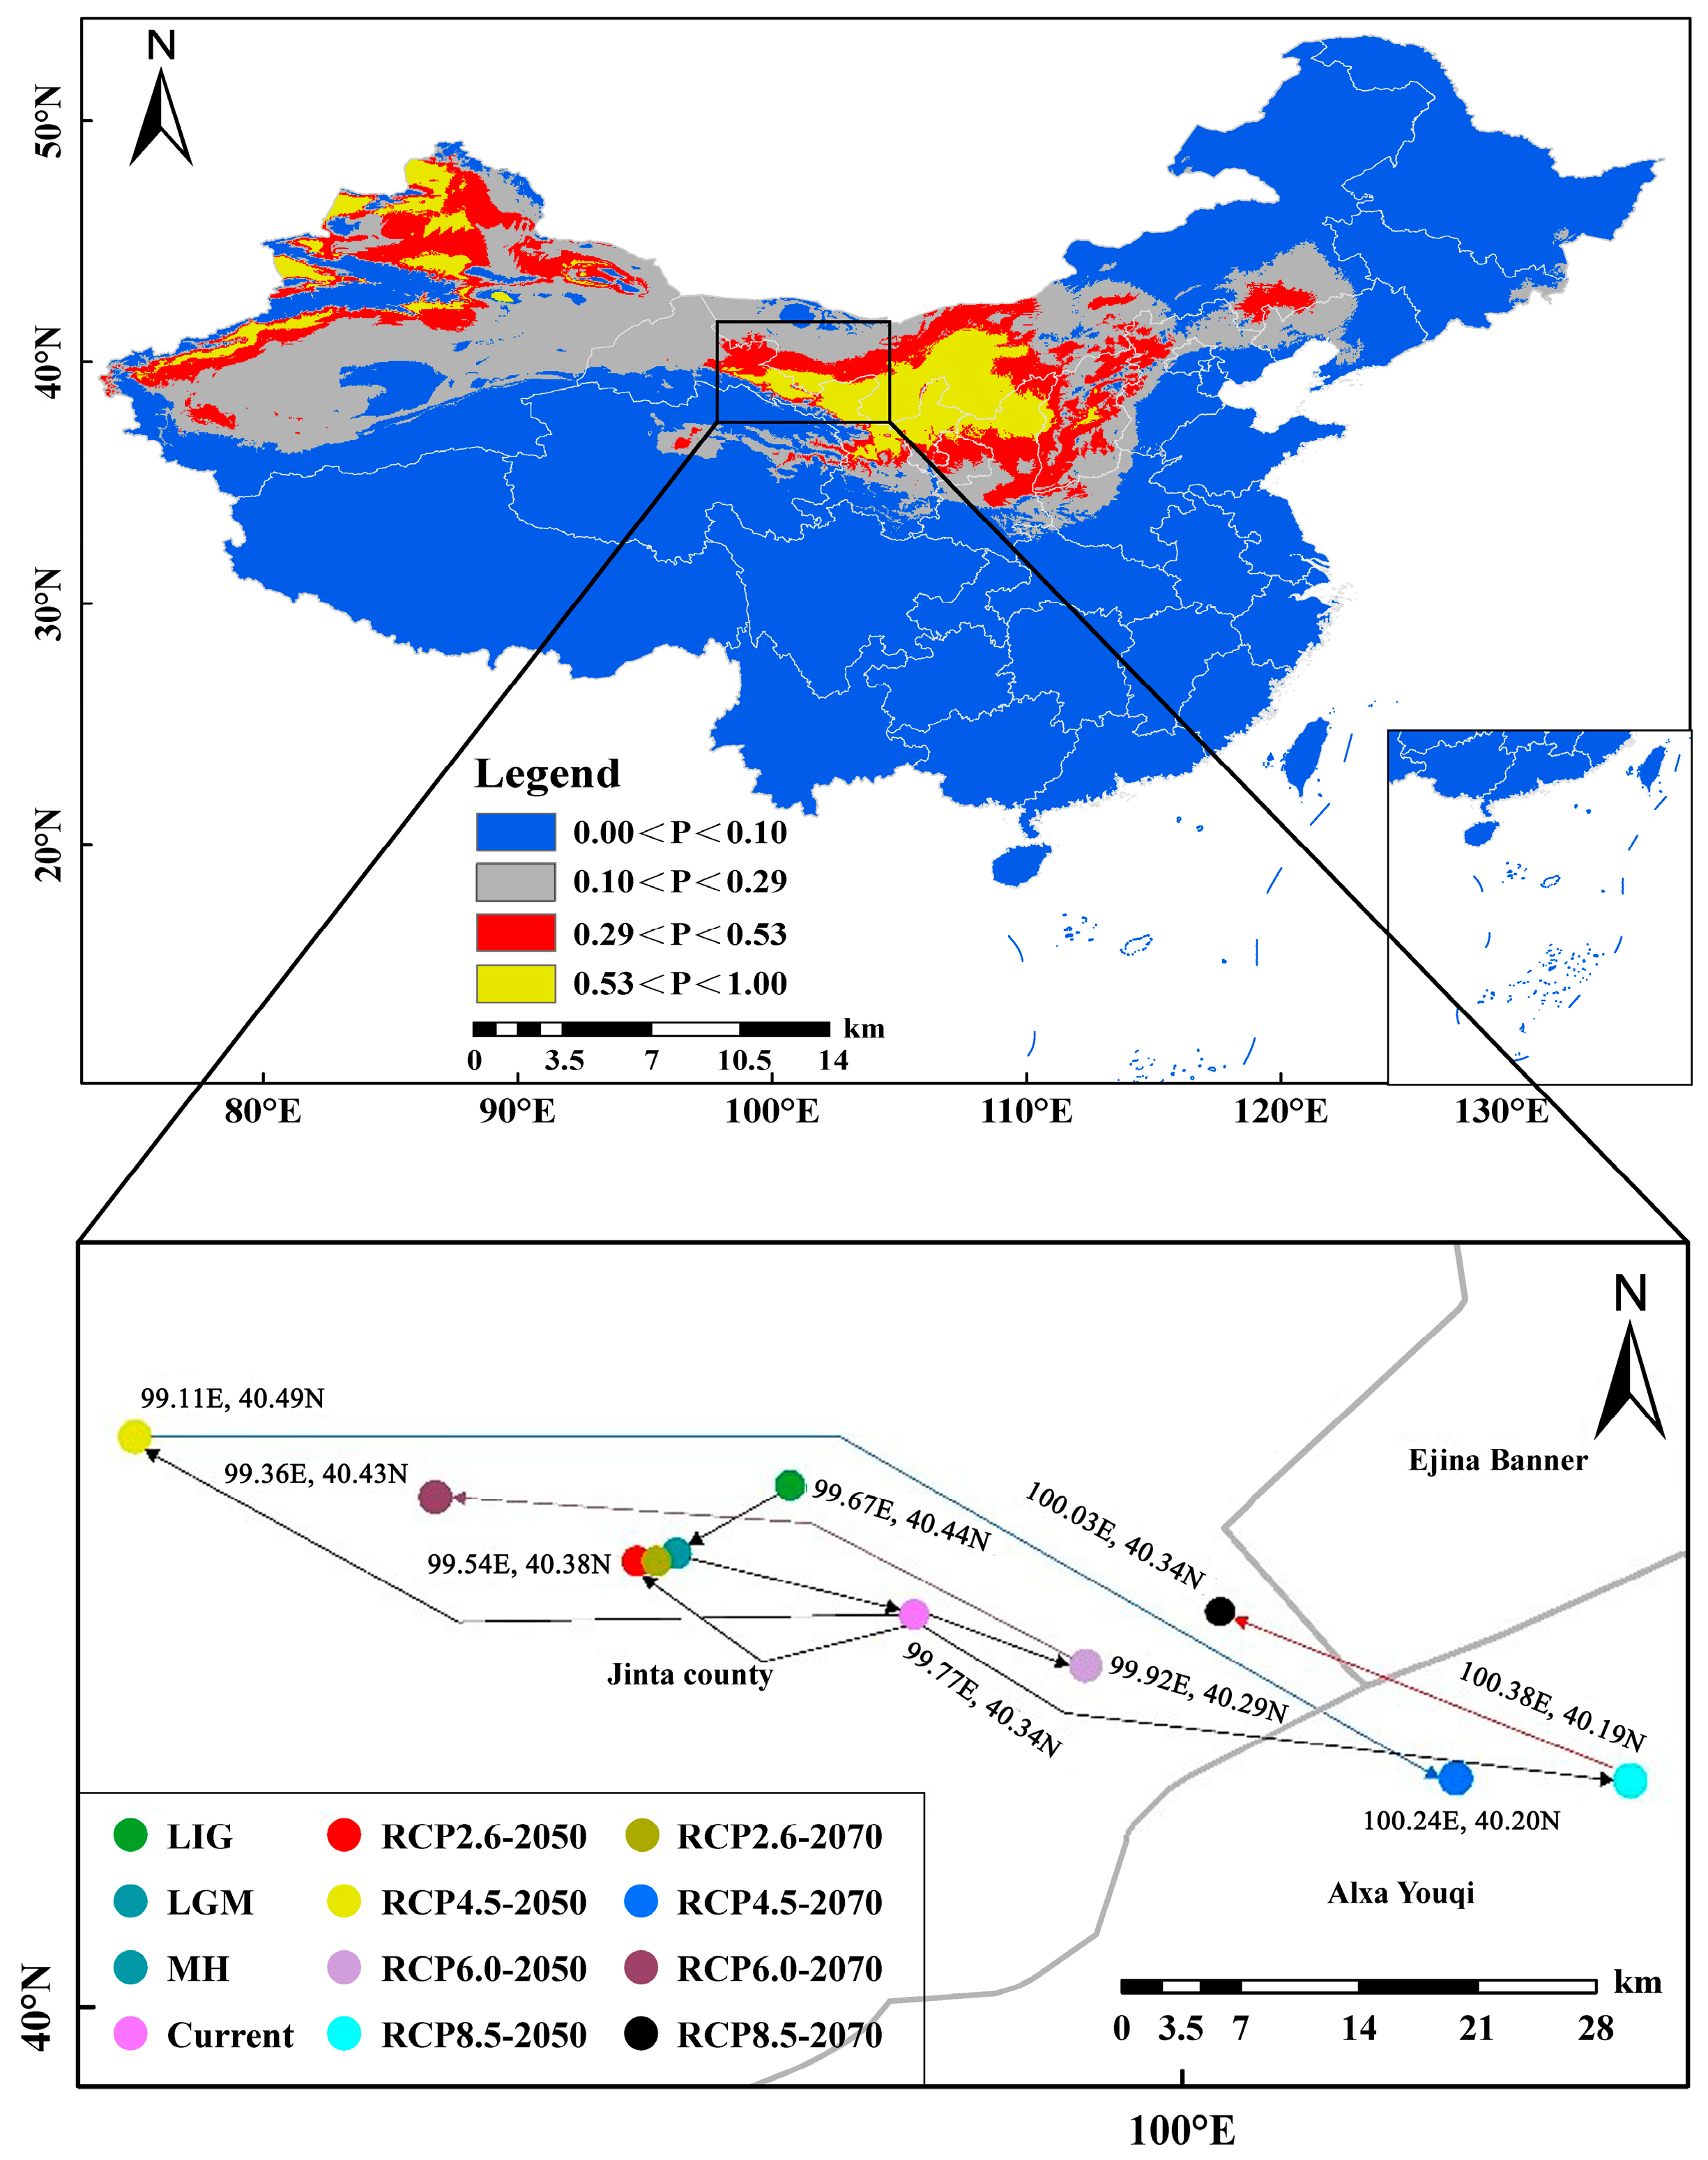
Spatially, future habitat expansion hotspots are primarily restricted to arid and semi-arid regions such as the Tianshan Mountains, Alxa Plateau, and Ordos Plateau. Meanwhile, habitat contraction and fragmentation persistently affect marginal zones like northern Ningxia, the eastern Hexi Corridor, and the Loess Plateau (Figure 7). Notably, despite these fluctuations, the distribution centroids show limited latitudinal variation (Figure 9), remaining in close proximity to the historically identified core refugia.

3.4. Centroid Shifts in the Potential Distribution of S. alopecuroides

The centroid of the current suitable distribution of S. alopecuroides was located in eastern Jinta County, Gansu Province (40.34° N, 99.77° E; Figure 9). During past climatic periods, the distribution centroids were located between 40.34° N–40.44° N and 99.57° E–99.77° E, remaining primarily within Jinta County (Figure 9). Under the future RCP 2.6 scenario, the centroids were also relatively stable, occurring at 40.38° N, 99.54° E in the 2050s and 40.38° N, 99.55° E in the 2070s, both at elevations of approximately 1200 m (Figure 9).
Under RCP 4.5, the centroid shifted from western Jinta County in the 2050s (40.49° N, 99.11° E; 1479 m) to Alxa Youqi in the 2070s (40.20° N, 100.24° E; 1271 m). Under RCP 6.0, the centroid was located at 40.29° N, 99.92° E at an elevation of 1140 m in the 2050s and shifted to 40.49° N, 99.11° E at an elevation of 1363 m in the 2070s. Under RCP 8.5, the centroid was located at 40.19° N, 100.38° E at an elevation of 1311 m in the 2050s and shifted to 40.34° N, 100.03° E at an elevation of 1149 m in the 2070s (Figure 9). Despite these centroid shifts, the overall suitable distribution of S. alopecuroides showed only minor latitudinal variation under several climate scenarios. These directional vectors, represented by the arrows in Figure 9, clearly demonstrate that the displacement magnitude is highly restricted, oscillating locally within Jinta County or shifting slightly toward the adjacent Alxa Youqi.

4. Discussion

4.1. Model Performance and Ecological Implications of Dominant Climatic Drivers

The reliability of SDM simulations depends largely on sampling range and sample size [49]. In this study, the 137 occurrence records of S. alopecuroides were derived mainly from field sampling conducted by the research team in Inner Mongolia, Gansu, Ningxia, Shanxi, and Shaanxi, supplemented by database records, providing empirical support for the baseline distribution data. The MaxEnt model yielded a high AUC value, indicating high predictive reliability. To improve model performance and reduce the risk of overfitting caused by multicollinearity, we combined contribution-based preliminary screening with correlation analyses calculated at occurrence points using SPSS v27.0and ENMTools.pl v1.4 [50]. This approach helped retain variables that were both ecologically meaningful and statistically suitable for model construction.
Climatic factors are key drivers influencing large-scale species distribution patterns [13,51,52]. Among all of the variables, temperature-related factors showed consistently higher cumulative contributions than precipitation, suggesting that temperature exerts a stronger influence on the distribution of S. alopecuroides. This finding is consistent with studies in arid and semi-arid regions, where species distributions are jointly constrained by water and thermal regimes [53,54,55], Notably, S. alopecuroides exhibits high sensitivity to Bio7 (annual temperature range). Its optimal habitat is characterized by a typical continental climate: large annual temperature amplitude, moderate elevation (approximately 950–1850 m), low precipitation during the warmest season, and cold, dry conditions in the driest quarter. Such preferences align with previous reports on other xerophytic species, such as Oplopanax elatus and Sophora davidii, which are also primarily limited by temperature and humidity [56,57].
While this study did not empirically collect physiological data, insights from the existing literature provide independent ecological context that aligns with these habitat preferences. Seeds of S. alopecuroides can maintain germination and radicle growth under simulated drought stress up to 40% PEG-6000 [58], and seedlings exhibit morphological plasticity under mild drought, such as increased stem thickness [59]. In mature plants, low leaf water potential and high water saturation deficit reflect a drought-tolerant dehydration strategy, allowing tissues to maintain water uptake from arid soils by sustaining low osmotic potential. In addition, proline accumulation and high superoxide dismutase activity may contribute to osmotic adjustment and antioxidant defense under dehydration stress [60]. These physiological and ecological traits are consistent with the modeled habitat characteristics and help explain why S. alopecuroides is mainly distributed in arid and semi-arid continental environments.
The SDM results are consistent with the known physiological and ecological characteristics of S. alopecuroides. At the landscape scale, the model indicates that suitable habitats are concentrated in regions with strong continentality, seasonal drought, and suitable elevation ranges. At the individual level, physiological drought tolerance, osmotic regulation, and antioxidant protection help us to explain how the species persists under these environmental conditions. Together, these findings support the formation and maintenance of the current geographical distribution pattern of S. alopecuroides. However, given the divergent rankings among different importance metrics, these ecological implications should be interpreted with caution as a combination of multi-faceted environmental constraints rather than definitive proof of any single climatic factor. Additionally, the inherent limitations of using a single MaxEnt algorithm must be acknowledged. As a presence-only modeling technique, MaxEnt is sensitive to sampling bias and spatial autocorrelation, which can occasionally lead to localized overfitting or overestimation of habitat boundaries. Although our occurrence records were carefully filtered at a 2.5 arc-minute grid resolution to minimize spatial autocorrelation, a formal quantitative test to evaluate the exact influence of residual spatial bias on our predictions was not performed. Consequently, while this upfront filtering effectively buffers severe sampling bias, future studies should explicitly quantify these effects using empirical bias files, or apply more rigorous spatial thinning or employ multi-algorithm ensemble platforms (such as Random Forest and Boosted Regression Trees) to cross-verify these predictions and minimize single-model algorithmic uncertainties.

4.2. Spatiotemporal Dynamics of S. alopecuroides Distribution Since the Last Interglacial

The genetic structure and geographical distribution patterns of plants in the arid region of Northwest China have been profoundly influenced by Quaternary glacial–interglacial cycles [61]. For many species, historical changes in suitable habitats follow a pattern of contraction during glacial periods and expansion during interglacial periods [62]. However, contraction and expansion patterns are strongly influenced by mountain topography, and many plants respond to glaciation by shifting their latitudinal and altitudinal ranges [63].
In this study, we reconstructed the potential distribution areas of S. alopecuroides during the LIG, LGM, and MH using the MaxEnt model. By integrating changes in suitable habitat area and centroid migration trajectories, we revealed the response characteristics of S. alopecuroides to Quaternary climate fluctuations. The total suitable area reached its maximum during the LIG (2.80 × 10⁶ km2), experienced a slight contraction during the LGM (2.79 × 10⁶ km2), reached its minimum during the MH (2.75 × 10⁶ km2), and then recovered to 2.77 × 10⁶ km2 at present. This pattern indicates that, as a dominant xerophytic species in desert and semi-desert regions, S. alopecuroides has long been adapted to arid environments and shows strong tolerance to Quaternary cold–warm climatic fluctuations. Even under the cold-dry conditions of glacial periods, its suitable habitat remained relatively stable, without large-scale reduction.
Similar patterns have been reported for other plant species in arid Northwest China. For example, Li [64] showed that Clematis sect. Fruticella s. str. expanded significantly during the LGM to near-present levels, a pattern closely related to its cold-adapted and drought-tolerant ecological characteristics. The cold, dry, and relatively stable glacial climate, combined with desert-steppe environments, may have provided favorable conditions for such xerophytic plants. Bai [65] also found that the distribution area of Allium wallichii during the LGM was larger than at present, a pattern similar to some alpine plants but contrary to the typical glacial contraction pattern of most temperate plants. In the present study, the total suitable area and highly suitable area during the LGM were only slightly larger than those at present, suggesting relative stability rather than strong glacial expansion.
In terms of dynamic changes in suitable habitats from the LIG to the present, expansion areas of S. alopecuroides were mainly distributed south of the Altai Mountains, north of the Tianshan Mountains, in the Hexi Corridor, and in the Alxa–Ordos Plateau region of Inner Mongolia, whereas contraction areas were concentrated in the Junggar Basin, Tarim Basin, and Mu Us Sandy Land. Notably, from the LGM to the MH, expansion areas persisted along the southern margin of the Junggar Basin, south of the Tianshan Mountains, and in the western Hexi Corridor, indicating that these regions maintained relatively high habitat suitability throughout glacial–interglacial transitions.
This pattern is broadly consistent with studies of other xerophytic or arid-region species. Yan [66] found that suitable areas of Amygdalus pedunculata contracted northwestward from the LIG to the LGM but expanded southeastward after the LGM, with the Yinshan Mountains and the margins of the Mu Us Sandy Land serving as important migration corridors. The continuous distribution of S. alopecuroides in the Hexi Corridor and Alxa Plateau is consistent with this regional migration pattern. Similarly, Jiang [67] reported that the highly suitable areas of Medicago archiducis-nicolai remained in the Longzhong Basin since the LIG, with only minor centroid shifts, resembling the stable distribution of S. alopecuroides around the Jinta Basin. Xu [62] found that suitable areas of Gymnocarpos przewalskii shifted northwestward along the Qilian, Tianshan, and Altun mountains during the LGM, while highly suitable areas remained stable in the central-western Hexi Corridor of Gansu. Duan [68] also showed that although the total suitable area of Ammopiptanthus decreased during the LGM, highly suitable areas increased in regions such as Ordos in Inner Mongolia and Shizuishan in Ningxia.
Taken together, these findings suggest that highly suitable areas of S. alopecuroides and several other xerophytic plants did not disappear during glacial periods, but instead persisted in stable piedmont and basin-margin habitats. The spatial positions of these stable patches, including the northern slope of the Tianshan Mountains, the central Hexi Corridor, and the Alxa–Helan Mountain area, closely coincide with the long-term centroid residence area of S. alopecuroides. These regions therefore constitute the core framework of the Quaternary distribution pattern of this species.

4.3. Identification of Potential Glacial Refugia from Historical Range Stability

Glacial refugia refer to core areas where a species persists under harsh glacial climates and from which it may expand outward after environmental conditions improve [69]. By projecting species–environment relationships onto past climate scenarios, SDMs have proven effective for identifying paleo-refugia of relict and desert plants in arid Northwest China [66,70]. However, because SDMs rely purely on climatic suitability patterns, these predictions should be interpreted cautiously as putative bioclimatic refugia. Although phylogeographic and molecular data for S. alopecuroides are not yet available to genetically validate these areas, comparative support can be drawn from established phylogeographic patterns of other dryland taxa in the region. In this study, we integrated spatiotemporal habitat dynamics with centroid migration trajectories to infer putative Quaternary refugia for S. alopecuroides.
The migration trajectory of the suitable-habitat centroid can provide useful evidence for identifying potential refugia. Gavin [71] suggested that refugia often exhibit limited centroid displacement during glacial–interglacial cycles. In this study, the centroid of suitable habitat for S. alopecuroides remained consistently in Jinta County, Jiuquan City, Gansu Province, with a geographical displacement of less than 20 km since the LIG. This high spatial stability suggests that the Jinta Basin may have functioned as a long-term refugium for S. alopecuroides during Quaternary climatic fluctuations. This inference is consistent with studies on the sympatric xerophytic plant G. przewalskii, which also identified the Jinta Basin as an important glacial refugium [62]. Moreover, the Jinta Basin is located near the alluvial fan edge of the lower Heihe River. Even under intensified glacial aridity, locally high groundwater levels and oasis microenvironments may have provided buffering conditions that exceeded the regional climatic background, potentially supporting continuous populations of S. alopecuroides.
Beyond the Jinta Basin, two additional areas functioned as persistent refugia: the margins of the Tianshan Mountains–Junggar Basin, and the Alxa Plateau–Helan Mountain area. In the Tianshan-Junggar region, highly suitable habitat remained continuously distributed on the northern piedmont of the Tianshan Mountains and the southern margin of the Junggar Basin throughout the LGM. The core mechanism is vertical climatic buffering: complex topography and large elevation range allow plants to track suitable hydrothermal combinations over short vertical distances. During the LGM, high-altitude mountains received more precipitation due to orographic lifting, serving as “humid refugia”. This is supported by phylogeographic evidence from Capparis spinosa [72] and Haloxylon ammodendron [73], confirming the Tianshan-Junggar area as a shared refugium for multiple arid-land species.
The Alxa Plateau–Helan Mountain area forms the third core refugium. The Helan Mountains, as an important ecological barrier, receive relatively more precipitation on their eastern windward slope due to the monsoon marginal effect, creating a unique “oasis effect” that provides relatively humid microhabitats. Phylogeographic studies of Zygophyllum xanthoxylon [74] and G. przewalskii [62] have also identified this region as a glacial refugium. The Alxa–Helan area is not only a plant diversity hotspot but also an important center of endemism in arid Northwest China.
However, even these long-term refugia face increasing threats from modern anthropogenic disturbances. After incorporating human activity factors, Rong [35] found that the predicted area of highly suitable habitat decreased sharply, particularly in the Alxa region, where some highly suitable areas degenerated into low-suitability or unsuitable areas. This warns that although S. alopecuroides possesses exceptional ability to survive glacial periods, it cannot withstand modern high-intensity disturbances such as overgrazing and land reclamation. Therefore, the three refugia identified here should be designated as priority germplasm resource protection areas and subjected to strict in situ conservation measures.

4.4. Projected Changes in the Suitable Habitat of S. alopecuroides Under Future Scenarios

Our future projections indicate that S. alopecuroides will exhibit a non-monotonic response to upcoming global warming, characterized by expansion under low emission (RCP 2.6) and varying degrees of contraction or fragmentation under higher emissions (Table 5). This general trend aligns with the global-scale projections by Yang [36] and national-scale models by Rong [35], which predicted localized suitable habitat degradation under medium- to-high-emission pathways. Furthermore, while our study utilizes CMIP5 scenarios, recent CMIP6 projections for dryland vegetation show highly consistent macro-ecological trends, with minor local variations arising from the newer models’ refined spatial resolution and updated climate sensitivities in Northwest China. However, rather than simply replicating future range predictions, the primary ecological significance of our future modeling lies in validating the long-term buffering capacity and future stability of the historically identified paleo-refugia. Spatially, key regions such as the Jinta Basin and the northern slopes of the Tianshan Mountains exhibit remarkable persistent suitability across all future RCP scenarios (Figure 7), suggesting their potential role as putative evolutionary safe havens. However, in the absence of genetic structure or palaeoecological data, these bioclimatically Inferred refugia must be presented as hypotheses that require independent validation in future studies.
The simulated fluctuations under high-emission scenarios (e.g., RCP 8.5) reflect the complex interaction between temperature increases and precipitation changes, which may periodically exceed or align with the physiological tolerance thresholds of S. alopecuroides. As a highly drought-tolerant xerophyte, its seedlings maintain osmotic regulation and antioxidant defense under severe dehydration stress. Under intensive future warming, the creation of newly suitable habitats at higher latitudes or elevations may partially compensate for losses in the original southern distribution range. This biological plasticity explains the spatial shifts observed in our model, demonstrating that the species’ future distribution is constrained by its inherent physiological adaptation limits.
Based on the intersection of historical stability and future dynamics, targeted conservation strategies can be formulated. First, low-migration and high-stability overlapping regions, such as the Jinta Basin and the northern Tianshan slopes, must be prioritized as core in situ germplasm protection areas. Second, the newly emerging suitable areas around Alxa Right Banner associated with centroid shifts under medium emissions warrant active monitoring. While assisted migration could be considered as a prospective long-term option for these areas, we emphasize that such active measures should not be recommended or implemented without prior, rigorous research on the species’ dispersal capacity, genetic diversity, demographic viability, and habitat connectivity. Third, long-term monitoring is essential in highly fragmented future patches like northern Ningxia to mitigate localized extinction risks. While a limitation of this study is the reliance on a single GCM (CCSM4) for future projections, it is critical to acknowledge that future habitat trajectories could differ substantially across alternative GCMs due to varied climate sensitivities in arid regions. Nevertheless, our combined spatiotemporal approach provides a solid baseline for the climate-resilient management of this vital dryland herb.

5. Conclusions

This study identified the key environmental factors driving the distribution of S. alopecuroides and reconstructed its spatiotemporal dynamics from LIG to the end of the 21st century. The results show that temperature annual range (Bio7), elevation, precipitation of the warmest quarter (Bio18), mean temperature of the driest quarter (Bio9), and annual mean temperature (Bio1) were important environmental drivers, indicating that the distribution of this species is mainly shaped by temperature regimes, seasonal water availability, and topography. Model simulations suggested that the Jinta Basin–Hexi Corridor, the Tianshan–Junggar Basin margins, and the Alxa Plateau–Helan Mountain region may represent potential long-term stable refugial areas for S. alopecuroides during Quaternary climatic fluctuations, with the distribution centroid shifting only slightly from the LIG to the present. Future projections indicated that the total suitable area may expand slightly under low-emission scenarios but contract under medium- to high-emission scenarios, while highly suitable habitats may become increasingly concentrated and fragmented. These findings highlight the potential importance of bioclimatically projected refugia in maintaining the distribution of dominant dryland herbs and provide a preliminary, spatially explicit basis for monitoring, germplasm conservation, and adaptive management of S. alopecuroides under ongoing climate change.

Author Contributions

Y.Z. collected and processed the data used in this study and drafted the manuscript. Y.L. (Yuping Liu) provided valuable comments on the manuscript. M.M.N. and A.A. contributed to manuscript revision. Y.L. (Yang Lv), T.L., Y.W., Z.C., J.L., X.G., K.W. and X.F. contributed to statistical analysis and data collection. X.S. conceived the study and supervised and revised the manuscript. All authors have read and agreed to the published version of the manuscript.

Funding

This work was financially supported by the Natural Science Foundation of Qinghai Province (Grant No. 2022-ZJ-913) and the National Natural Science Foundation of China (Grants No. 32160297 and 31960052).

Data Availability Statement

The original contributions presented in this study are included in the article. Further inquiries can be directed to the corresponding authors.

Conflicts of Interest

The authors declare no conflicts of interest.

References

  1. Mao, P.; Zeng, M.; Lv, J.; Wei, J.; Feng, Q.; Shu, Y.; Ma, Y. Paleodistribution of Cercidiphyllaceae and future habitat prediction for Cercidiphyllum japonicum under climate change. Ecol. Evol. 2026, 16, e72940. [Google Scholar] [CrossRef] [Scilit] [PubMed]
  2. Panero, I.; Santangelo, A.; Strumia, S.; Aronne, G.; Buonanno, M.; Fabrini, G.; Cambria, V.E.; Fanelli, G.; La Montagna, D.; Attorre, F.; et al. Iconic, rare, endemic and threatened: Macroecological insights to support conservation and management of Primula palinuri. Biodivers. Conserv. 2026, 35, 115. [Google Scholar] [CrossRef] [Scilit]
  3. Hewitt, G. The genetic legacy of the Quaternary ice ages. Nature 2000, 405, 907–913. [Google Scholar] [CrossRef] [Scilit] [PubMed]
  4. Hewitt, G.M. Genetic consequences of climatic oscillations in the Quaternary. Philos. Trans. R. Soc. B Biol. Sci. 2004, 359, 183–195. [Google Scholar] [CrossRef] [Scilit] [PubMed]
  5. Zou, X.; Peng, Y.; Wang, L.; Li, Y.; Zhang, W.-X.; Liu, X. Impact of climate change on the distribution pattern of Malus baccata (L.) Borkh. in China since the Last Glacial Maximum. Plant Sci. J. 2018, 36, 676–686. [Google Scholar] [CrossRef]
  6. Xu, Z.; Zhang, M.L. Phylogeography of the arid shrub Atraphaxis frutescens (Polygonaceae) in northwestern China: Evidence from cpDNA sequences. J. Hered. 2015, 106, 184–195. [Google Scholar] [CrossRef] [Scilit] [PubMed]
  7. IPCC. Climate Change 2021: The Physical Science Basis: Working Group I Contribution to the 6th Assessment Report of the Intergovernmental Panel on Climate Change; Cambridge University Press: Cambridge, UK, 2021. [Google Scholar]
  8. Thomas, C.D.; Cameron, A.; Green, R.E.; Bakkenes, M.; Beaumont, L.J.; Collingham, Y.C.; Erasmus, B.F.N.; Ferreira de Siqueira, M.; Grainger, A.; Hannah, L.; et al. Extinction risk from climate change. Nature 2004, 427, 145–148. [Google Scholar] [CrossRef] [Scilit] [PubMed]
  9. Bertrand, R.; Lenoir, J.; Piedallu, C.; Riofrío-Dillon, G.; de Ruffray, P.; Vidal, C.; Pierrat, J.-C.; Gégout, J.-C. Changes in plant community composition lag behind climate warming in lowland forests. Nature 2011, 479, 517–520. [Google Scholar] [CrossRef] [Scilit] [PubMed]
  10. Chen, D.M.; Kang, H.Z.; Liu, C.J. An overview on the potential Quaternary glacial refugia of plants in China mainland. Bull. Bot. Res. 2011, 31, 623–632. [Google Scholar] [CrossRef]
  11. Yang, X.Q.; Kushwaha, S.P.S.; Saran, S.; Xu, J.; Roy, P.S. Maxent modeling for predicting the potential distribution of medicinal plant, Justicia adhatoda L. in Lesser Himalayan Foothills. Ecol. Eng. 2013, 51, 83–87. [Google Scholar] [CrossRef] [Scilit]
  12. Guisan, A.; Zimmermann, N.E. Predictive habitat distribution models in ecology. Ecol. Model. 2000, 135, 147–186. [Google Scholar] [CrossRef] [Scilit]
  13. Zhu, G.P.; Liu, G.Q.; Bu, W.J.; Gao, Y.B. Ecological niche modeling and its applications in biodiversity conservation. Biodivers. Sci. 2013, 21, 90–98. [Google Scholar] [CrossRef] [Scilit]
  14. Guo, F.L.; Xu, G.B.; Mou, H.L.; Li, Z. Simulation of potential spatiotemporal population dynamics of Bretschneidera sinensis Hemsl. based on MaxEnt model. Plant Sci. J. 2020, 38, 185–194. [Google Scholar] [CrossRef]
  15. Stockwell, D. The GARP modelling system: Problems and solutions to automated spatial prediction. Int. J. Geogr. Inf. Sci. 1999, 13, 143–158. [Google Scholar] [CrossRef] [Scilit]
  16. Phillips, S.J.; Anderson, R.P.; Schapire, R.E. Maximum entropy modeling of species geographic distributions. Ecol. Model. 2006, 190, 231–259. [Google Scholar] [CrossRef] [Scilit]
  17. Merow, C.; Smith, M.J.; Silander, J.A. A practical guide to MaxEnt for modeling species’ distributions: What it does, and why inputs and settings matter. Ecography 2013, 36, 1058–1069. [Google Scholar] [CrossRef] [Scilit]
  18. Dolgener, N.; Freudenberger, L.; Schluck, M.; Schneeweiss, N.; Ibisch, P.L.; Tiedemann, R. Environmental niche factor analysis (ENFA) relates environmental parameters to abundance and genetic diversity in an endangered amphibian, the fire-bellied-toad (Bombina bombina). Conserv. Genet. 2014, 15, 11–21. [Google Scholar] [CrossRef] [Scilit]
  19. Semwal, D.P.; Pandey, A.; Gore, P.G.; Ahlawat, S.P.; Yadav, S.K.; Kumar, A. Habitat prediction mapping using Bioclim model for prioritizing germplasm collection and conservation of an aquatic cash crop ‘makhana’ (Euryale ferox Salisb.) in India. Genet. Resour. Crop Evol. 2021, 68, 3445–3456. [Google Scholar] [CrossRef] [Scilit]
  20. Zhang, Q.; Shen, X.; Jiang, X.; Fan, T.; Liang, X.; Yan, W. MaxEnt modeling for predicting suitable habitat for endangered tree Keteleeria davidiana (Pinaceae) in China. Forests 2023, 14, 394. [Google Scholar] [CrossRef] [Scilit]
  21. Zhang, Q.; Zhang, D.F.; Wu, M.L.; Guo, J.; Sun, C.Z.; Xie, C.X. Predicting the global areas for potential distribution of Gastrodia elata based on ecological niche models. Chin. J. Plant Ecol. 2017, 41, 770–778. [Google Scholar] [CrossRef] [Scilit]
  22. Verbruggen, H.; Tyberghein, L.; Belton, G.S.; Mineur, F.; Jueterbock, A.; Hoarau, G.; Gurgel, C.F.D.; De Clerck, O. Improving transferability of introduced species’ distribution models: New tools to forecast the spread of a highly invasive seaweed. PLoS ONE 2013, 8, e68337. [Google Scholar] [CrossRef] [Scilit] [PubMed]
  23. Chan, L.M.; Brown, J.L.; Yoder, A.D. Integrating statistical genetic and geospatial methods brings new power to phylogeography. Mol. Phylogenet. Evol. 2011, 59, 523–537. [Google Scholar] [CrossRef] [Scilit] [PubMed]
  24. Bosso, L.; Fichera, G.; Mucedda, M.; Pidinchedda, E.; Veith, M.; Smeraldo, S.; De Pasquale, P.P.; Mori, E.; Ancillotto, L. Island life and interspecific dynamics influence body size, distribution and ecological niche of Long-Eared Bats. J. Biogeogr. 2026, 53, e70071. [Google Scholar] [CrossRef] [Scilit]
  25. Liu, B.; Lin, M.; Liu, S.; Ye, X.; Chen, S. National-Scale conservation gaps and priority areas for invasive plant control in China: An integrated MaxEnt-InVEST framework. Plants 2026, 15, 898. [Google Scholar] [CrossRef] [Scilit] [PubMed]
  26. Zhao, L.; Deng, Z.; Yang, W.; Cao, Y.; Wang, E.; Wei, G. Diverse rhizobia associated with Sophora alopecuroides grown in different regions of Loess Plateau in China. Syst. Appl. Microbiol. 2010, 33, 468–477. [Google Scholar] [CrossRef] [Scilit] [PubMed]
  27. Zha, X.; Wang, X.; Li, J.; Gao, F.; Zhou, Y. Complete chloroplast genome of Sophora alopecuroides (Papilionoideae): Molecular structures, comparative genome analysis and phylogenetic analysis. J. Genet. 2020, 99, 13. [Google Scholar] [CrossRef] [Scilit]
  28. Iinuma, M.; Ohyama, M.; Tanaka, T. Six flavonostilbenes and a flavanone in roots of Sophora alopecuroides. Phytochemistry 1995, 38, 519–525. [Google Scholar] [CrossRef] [Scilit]
  29. Tanaka, T.; Ohyama, M.; Iinuma, M.; Shirataki, Y.; Komatsu, M.; Burandt, C.L. Isoflavonoids from Sophora secundiflora, S. arizonica and S. gypsophila. Phytochemistry 1998, 48, 1187–1193. [Google Scholar] [CrossRef] [Scilit]
  30. Liang, L.; Wang, X.Y.; Zhang, X.H.; Ji, B.; Yan, H.C.; Deng, H.Z.; Wu, X.R. Sophoridine exerts an anti-colorectal carcinoma effect through apoptosis induction in vitro and in vivo. Life Sci. 2012, 91, 1295–1303. [Google Scholar] [CrossRef] [Scilit] [PubMed]
  31. Chang, A.; Cai, Z.; Wang, Z.; Sun, S.K. Extraction and isolation of alkaloids of Sophora alopecuroides and their anti-tumor effects in H22 tumor-bearing mice. Afr. J. Tradit. Complement. Altern. Med. 2014, 11, 245–248. [Google Scholar] [CrossRef] [Scilit] [PubMed]
  32. Wang, Y.; Zhou, T.T.; Li, D.H.; Zhang, X.H.; Yu, W.W.; Cai, J.F.; Wang, G.B.; Guo, Q.R.; Yang, X.M.; Cao, F.L. The genetic diversity and population structure of Sophora alopecuroides (Faboideae) as determined by microsatellite markers developed from transcriptome. PLoS ONE 2019, 14, e0226100. [Google Scholar] [CrossRef] [Scilit] [PubMed]
  33. Duan, N.; Deng, Y.; Liu, Y.; Zhang, Y.; Zhang, L.G.; Wang, C.Y.; Liu, B.B. The complete chloroplast genome of Sophora alopecuroides (Fabaceae). Mitochondrial DNA Part B 2019, 4, 1336–1337. [Google Scholar] [CrossRef] [Scilit]
  34. Wang, R.; Deng, X.; Gao, Q.; Wu, X.; Han, L.; Gao, X.; Zhao, S.; Chen, W.; Zhou, R.; Li, Z.; et al. Sophora alopecuroides L.: An ethnopharmacological, phytochemical, and pharmacological review. J. Ethnopharmacol. 2020, 248, 112172. [Google Scholar] [CrossRef] [Scilit] [PubMed]
  35. Rong, W.; Huang, X.; Hu, S.; Zhang, X.; Jiang, P.; Niu, P.; Su, J.; Wang, M.; Chu, G. Impacts of climate change on the habitat suitability and natural product accumulation of the medicinal plant Sophora alopecuroides L. based on the MaxEnt model. Plants 2024, 13, 1424. [Google Scholar] [CrossRef] [Scilit] [PubMed]
  36. Yang, Z.; Ma, F.; Luo, C.; Pang, K.; Yang, Z.; Wang, M.; Huang, X. Study on the change of global suitable area of Sophora alopecuroides and its sustainable ecological restoration based on the MaxEnt model. Sustainability 2025, 17, 8486. [Google Scholar] [CrossRef] [Scilit]
  37. Lv, Y.; Cairang, Z.X.; Sun, C.L.; Su, X.; Liu, Y.P.; Zhou, Y.H.; Wei, K.Y.; Feng, X.; Lei, J.Q.; Zheng, Y.H. Predicting the implications of climatic alterations on the distribution of endangered species: A case study of Saxifragaceae on the Qinghai-Xizang Plateau. Ecol. Evol. 2025, 15, e71899. [Google Scholar] [CrossRef] [Scilit] [PubMed]
  38. Yan, H.Y.; Feng, L.; Zhao, Y.F.; Feng, L.; Zhu, C.P.; Qu, Y.F.; Wang, H.Q. Predicting the potential distribution of an invasive species, Erigeron canadensis L., in China with a maximum entropy model. Glob. Ecol. Conserv. 2020, 21, e00822. [Google Scholar] [CrossRef] [Scilit]
  39. Hu, H.W.; Wei, Y.Q.; Wang, W.Y.; Suo, N.J.; Wang, S.X.; Chen, Z.; Guan, J.H.; Deng, Y.F. Richness and distribution of endangered orchid species under different climate scenarios on the Qinghai-Tibetan Plateau. Front. Plant Sci. 2022, 13, 948189. [Google Scholar] [CrossRef] [Scilit] [PubMed]
  40. Phillips, S.J.; Dudík, M. Modeling of species distributions with Maxent: New extensions and a comprehensive evaluation. Ecography 2008, 31, 161–175. [Google Scholar] [CrossRef] [Scilit]
  41. Yi, Y.J.; Cheng, X.; Yang, Z.F.; Zhang, S.H. Maxent modeling for predicting the potential distribution of endangered medicinal plant (H. riparia Lour) in Yunnan, China. Ecol. Eng. 2016, 92, 260–269. [Google Scholar] [CrossRef] [Scilit]
  42. Jiang, F.; Zhang, J.J.; Gao, H.M.; Cai, Z.Y.; Zhou, X.W.; Li, S.Q.; Zhang, T.Z. Musk deer (Moschus spp.) face redistribution to higher elevations and latitudes under climate change in China. Sci. Total Environ. 2019, 704, 135335. [Google Scholar] [CrossRef] [Scilit] [PubMed]
  43. Lompo, O.; Dimobe, K.; Mbayngone, E.; Savadogo, S.; Sambaré, O.; Thiombiano, A.; Ouédraogo, A. Climate influence on the distribution of the yellow plum (Ximenia americana L.) in Burkina Faso. Trees For. People 2021, 4, 100072. [Google Scholar] [CrossRef] [Scilit]
  44. Johnson, T.L.; Bjork, J.K.H.; Neitzel, D.F.; Dorr, F.M.; Schiffman, E.K.; Eisen, R.J. Habitat suitability model for the distribution of Ixodes scapularis (Acari: Ixodidae) in Minnesota. J. Med. Entomol. 2016, 53, 598–606. [Google Scholar] [CrossRef] [Scilit] [PubMed]
  45. Wang, R.L.; Li, Q.; Feng, C.H.; Shi, Z.P. Predicting potential ecological distribution of Locusta migratoria tibetensis in China using MaxEnt ecological niche modeling. Acta Ecol. Sin. 2017, 37, 8556–8566. [Google Scholar] [CrossRef] [Scilit]
  46. Cong, M.Y.; Xu, Y.Y.; Tang, L.Y.; Yang, W.J.; Jian, M.F. Predicting the dynamic distribution of Sphagnum bogs in China under climate change since the last interglacial period. PLoS ONE 2020, 15, e0230969. [Google Scholar] [CrossRef] [Scilit] [PubMed]
  47. Hu, X.G.; Jin, Y.Q.; Wang, X.R.; Mao, J.F.; Li, Y. Predicting impacts of future climate change on the distribution of the widespread conifer Platycladus orientalis. PLoS ONE 2015, 10, e0132326. [Google Scholar] [CrossRef] [Scilit] [PubMed]
  48. Xia, X.; Yang, X.; Li, S.; Xiang, W.; He, L.; Luo, Z. From glacial refugia to future shifts: Unraveling the spatiotemporal dynamics of endangered Acer sutchuenense Franch. under climate change. Biology 2026, 15, 397. [Google Scholar] [CrossRef] [Scilit] [PubMed]
  49. Zhuang, H.F.; Zhang, Y.B.; Wang, W.; Ren, Y.H.; Liu, F.Z.; Du, J.H.; Zhou, Y. Optimized hot spot analysis for probability of species distribution under different spatial scales based on MaxEnt model: Manglietia insignis case. Biodivers. Sci. 2018, 26, 931–940. [Google Scholar] [CrossRef] [Scilit]
  50. Warren, D.L.; Glor, R.E.; Turelli, M. ENMTools: A toolbox for comparative studies of environmental niche models. Ecography 2010, 33, 607–611. [Google Scholar] [CrossRef] [Scilit]
  51. Fialas, P.C.; Santini, L.; Russo, D.; Amorim, F.; Rebelo, H.; Novella-Fernandez, R.; Marques, F.; Domer, A.; Vella, A.; Martinoli, A.; et al. Changes in community composition and functional diversity of European bats under climate change. Conserv. Biol. 2025, 39, e70025. [Google Scholar] [CrossRef] [Scilit] [PubMed]
  52. Wanghe, K.; Ahmad, S.; Zhang, A.; Li, K.; Jian, S.; Chen, J.; Hu, F.; Bosso, L.; Strelnikov, I.I.; Guo, X. Climate change drives rapid and asymmetric niche divergence in high-altitude freshwater fishes: Insights from niche3D. Glob. Ecol. Conserv. 2026, 69, e04300. [Google Scholar] [CrossRef] [Scilit]
  53. Han, D.Y.; Niu, Z.Z.; Wu, Y.M.; Gao, J. Spatial distribution pattern of wetland plant species richness driven by water and heat conditions collectively in Xinjiang. Arid Land Geogr. 2023, 46, 86–93. [Google Scholar] [CrossRef]
  54. Al-Kindi, K.M.; Al-Lawati, A.H. Climate change and its impact on wheat distribution in semi-arid ecosystems: A case study from the Sultanate of Oman. PLoS ONE 2025, 20, e0326198. [Google Scholar] [CrossRef] [Scilit] [PubMed]
  55. Yousefi, M.; Nezami, B.; Asgari, F.; Illanloo, S.S.; Alemohammad, S.; Bosso, L. Climate Change Reduces Habitat Suitability of the Endemic Iranian Ground-Jay (Podoces pleskei): Spatial Analyses to Guide Conservation Strategies. Ecol. Evol. 2026, 16, e73637. [Google Scholar] [CrossRef] [Scilit] [PubMed]
  56. Du, F.G.; Wang, M.F.; Lan, X.H.; Yu, Z.C.; Li, L.M.; Tan, T.T.; Yuan, M.Q. Oplopanax elatus Nakai prediction of potential suitable distribution areas in China based on MaxEnt model. J. Beihua Univ. (Nat. Sci.) 2022, 23, 721–725. [Google Scholar] [CrossRef]
  57. Wang, L.L.; Yilihamu, Y. Prediction of potential suitable areas for a Chinese endemic shrub Sophora davidii using the MaxEnt model. Chin. J. Ecol. 2021, 40, 3114–3124. [Google Scholar] [CrossRef]
  58. Gao, Y.Q.; Liu, B.B. Effects of simulated drought stress on seed germination and seedling growth of Sophora alopecuroides. Chin. Agric. Sci. Bull. 2025, 41, 82–87. [Google Scholar] [CrossRef]
  59. Zhao, J.D.; Shi, C.Y.; Wang, L.; Han, X.J.; Zhu, Y.J.; Liu, J.K.; Yang, X.H. Functional trait responses of Sophora alopecuroides L. seedlings to diverse environmental stresses in the desert steppe of Ningxia, China. Plants 2024, 13, 69. [Google Scholar] [CrossRef] [Scilit] [PubMed]
  60. Hou, P.; Baidurela, A.; Dong, Y.T.; Wang, Z.X.; Luo, Q.H.; He, M.; Li, F.; Qin, Y. Adaptability of typical sand-fixing plants to multiple abiotic stresses at the edge of the Taklamakan Desert. J. Northeast For. Univ. 2026, 54, 46–57, 83. [Google Scholar] [CrossRef]
  61. Meng, H.H.; Gao, X.Y.; Huang, J.F.; Zhang, M.L. Plant phylogeography in arid Northwest China: Retrospectives and perspectives. J. Syst. Evol. 2015, 53, 33–46. [Google Scholar] [CrossRef] [Scilit]
  62. Xu, Z.P.; Zhang, J.Q.; Wan, T.; Cai, P.; Yi, W.D. Study on the history distribution pattern of Gymnocarpos przewalskii and refuge area. Acta Botan. Boreali-Occident. Sin. 2017, 37, 2074–2081. [Google Scholar] [CrossRef]
  63. Davis, M.B.; Shaw, R.G. Range shifts and adaptive responses to Quaternary climate change. Science 2001, 292, 673–679. [Google Scholar] [CrossRef] [Scilit] [PubMed]
  64. Li, M.Y.; He, J.; Zhao, Z.; Lyu, R.; Yao, M.; Cheng, J.; Xie, L. Predictive modelling of the distribution of Clematis sect. Fruticella s. str. under climate change reveals a range expansion during the Last Glacial Maximum. PeerJ 2020, 8, e8729. [Google Scholar] [CrossRef] [Scilit] [PubMed]
  65. Bai, J.; Xie, D.F.; Zhou, S.D.; He, X.J. Responses of the distribution pattern of Allium wallichii to climate change following the Last Glacial Maximum. Acta Botan. Boreali-Occident. Sin. 2018, 38, 176–182. [Google Scholar] [CrossRef]
  66. Yan, H.; Ma, S.M.; Wei, B.; Zhang, H.X.; Zhang, D. Historical distribution patterns and environmental drivers of relict shrub Amygdalus pedunculata. Chin. J. Plant Ecol. 2022, 46, 766–774. [Google Scholar] [CrossRef] [Scilit]
  67. Jiang, Y.Q.; Wang, X.; Jia, X.X.; Li, Y.Q.; Fang, Q.E. Geographical distribution pattern and prediction of potential suitable areas of Medicago archiducis-nicolai under climate change. Acta Botan. Boreali-Occident. Sin. 2022, 42, 1611–1620. [Google Scholar] [CrossRef]
  68. Duan, Y.Z.; Wang, C.; Wang, H.T.; Du, Z.Y.; He, Y.M.; Chai, G.Q. Predicting the potential distribution of Ammopiptanthus species in China under different climates using ecological niche models. Acta Ecol. Sin. 2020, 40, 7668–7680. [Google Scholar] [CrossRef] [Scilit]
  69. Xu, L.; Wang, H.; La, Q.; Lu, F.; Sun, K.; Fang, Y.; Yang, M.; Zhong, Y.; Wu, Q.H.; Chen, J.K. Microrefugia and shifts of Hippophae tibetana (Elaeagnaceae) on the north side of Mt. Qomolangma (Mt. Everest) during the last 25000 years. PLoS ONE 2014, 9, e97601. [Google Scholar] [CrossRef] [Scilit] [PubMed]
  70. Liu, X.; Huang, H.; Meng, X.; Li, M.; Qin, Z. The past, present, and future distribution of Sargentodoxa: Perspectives from fossil record and species distribution models. Ecol. Evol. 2025, 15, e71831. [Google Scholar] [CrossRef] [Scilit] [PubMed]
  71. Gavin, D.G.; Fitzpatrick, M.C.; Gugger, P.F.; Heath, K.D.; Rodríguez-Sánchez, F.; Dobrowski, S.Z.; Hampe, A.; Hu, F.S.; Ashcroft, M.B.; Bartlein, P.J. Climate refugia: Joint inference from fossil records, species distribution models and phylogeography. New Phytol. 2014, 204, 37–54. [Google Scholar] [CrossRef] [Scilit] [PubMed]
  72. Wang, Q.; Zhang, M.L.; Yin, L.K. Phylogeographic structure of a Tethyan relict Capparis spinosa (Capparaceae) traces Pleistocene geologic and climatic changes in the western Himalayas, Tianshan Mountains, and adjacent desert regions. BioMed Res. Int. 2016, 2016, 5792708. [Google Scholar] [CrossRef] [Scilit] [PubMed]
  73. Chen, Y.; Ma, S.; Zhang, D.; Wei, B.; Huang, G.; Zhang, Y.; Ge, B. Diversification and historical demography of Haloxylon ammodendron in relation to Pleistocene climatic oscillations in northwestern China. PeerJ 2022, 10, e14476. [Google Scholar] [CrossRef] [Scilit] [PubMed]
  74. Shi, X.J.; Zhang, M.L. Phylogeographical structure inferred from cpDNA sequence variation of Zygophyllum xanthoxylon across north-west China. J. Plant Res. 2015, 128, 269–282. [Google Scholar] [CrossRef] [Scilit] [PubMed]
Figure 1. Distribution of 137 occurrence records of S. alopecuroides used for niche modeling.
Ecologies 07 00075 g001
Figure 2. Receiver Operating Characteristic (ROC) curve of distribution prediction model for S. alopecuroides.
Ecologies 07 00075 g002
Figure 3. Importance ranking of environmental variables for S. alopecuroides based on a jackknife analysis.
Ecologies 07 00075 g003
Figure 4. Response curve between dominant environmental variables and the probability of existence for S. alopecuroides. Note: The red curve represents the mean response, and the blue shading represents the mean ± one standard deviation across the MaxEnt replicate runs.
Ecologies 07 00075 g004
Figure 5. Potential suitable habitat of S. alopecuroides in the current climate.
Ecologies 07 00075 g005
Figure 6. Potential suitable habitat of S. alopecuroides during past climates.
Ecologies 07 00075 g006
Figure 7. Potential suitable habitat of S. alopecuroides in future climates. (a) 2050s-RCP 2.6; (b) 2050s-RCP 4.5; (c) 2050s-RCP 6.0; (d) 2050s-RCP 8.5; (e) 2070s-RCP 2.6; (f) 2070s-RCP 4.5; (g) 2070s-RCP 6.0; (h) 2070s-RCP 8.5.
Ecologies 07 00075 g007aEcologies 07 00075 g007b
Figure 8. Levels of suitable habitat fluctuation of S. alopecuroides under different climatic scenarios in China. Blue, red, and green bars represent increases, decreases, and total of the changed area (×104 km2), respectively. Bars from A to L depict LIG, LGM, MH, RCP2.6-2050, RCP4.5-2050, RCP6.0-2050, RCP8.5-2050, RCP2.6-2070, RCP4.5-2070, RCP6.0-2070, and RCP8.5-2070, respectively.
Ecologies 07 00075 g008
Figure 9. Variation in the gravity center of suitable distribution areas for S. alopecuroides under different climatic scenarios. Note: The centroid points of LGM and MH have identical coordinates and completely overlap in the figure; therefore, they are represented by the same symbol and color in the legend.
Ecologies 07 00075 g009
Table 1. The 20 environmental variables used to evaluate the geographic distribution of S. alopecuroides.
Data AbbreviationDescriptionUnit
bio1Annual mean temperature°C
bio2Mean diurnal range°C
bio3Isothermality-
bio4Temperature seasonality°C
bio5Max temperature of warmest month°C
bio6Min temperature of coldest month°C
bio7Temperature annual range°C
bio8Mean temperature of wettest quarter°C
bio9Mean temperature of driest quarter°C
bio10Mean temperature of warmest quarter°C
bio11Mean temperature of coldest quarter°C
bio12Annual precipitationmm
bio13Precipitation of wettest monthmm
bio14Precipitation of driest monthmm
bio15Precipitation seasonality-
bio16Precipitation of wettest quartermm
bio17Precipitation of driest quartermm
bio18Precipitation of warmest quartermm
bio19Precipitation of coldest quartermm
elevElevation°
Table 2. AUC values used to evaluate the classification standard of model prediction accuracy.
Range of AUC ValuesScore
0–0.6Failed
0.6–0.7Bad
0.7–0.8Commonly
0.8–0.9Excellent
0.9–1.0Optimal
Table 3. Pearson correlation matrix of the 19 bioclimatic variables at occurrence points (lower-left triangle) and across the entire study area (upper-right triangle).
bio1bio2bio3bio4bio5bio6bio7bio8bio9bio10bio11bio12bio13bio14bio15bio16bio17bio18bio19
bio11.000−0.649−0.121−0.3330.8150.916−0.4630.8490.8950.8860.9140.6530.5780.633−0.5420.5910.6230.5540.596
bio20.0311.0000.3070.388−0.365−0.7470.600−0.429−0.620−0.499−0.670−0.806−0.735−0.7720.591−0.742−0.767−0.707−0.733
bio30.0660.6481.000−0.719−0.5290.131−0.547−0.4650.223−0.4880.2100.0200.033−0.1780.2380.073−0.1570.095−0.126
bio4−0.0960.010−0.7411.0000.261−0.6630.9680.182−0.6750.139−0.686−0.531−0.456−0.3860.216−0.504−0.400−0.488−0.406
bio50.7970.208−0.2550.4881.0000.5280.1290.9690.5150.9840.5170.2880.2400.383−0.4220.2290.3650.1950.337
bio60.832−0.2400.236−0.5490.3581.000−0.7740.5860.9710.6400.9920.7600.6630.705−0.5510.6910.7020.6510.682
bio7−0.0760.396−0.4320.9160.529−0.6031.0000.038−0.751−0.014−0.773−0.673−0.595−0.5370.329−0.636−0.549−0.615−0.545
bio80.7990.095−0.2530.4110.9190.4330.3921.0000.5550.9800.5770.3600.3450.374−0.3700.3290.3530.3200.319
bio90.7820.1100.361−0.3820.4710.806−0.3300.5241.0000.6090.9810.6800.5710.651−0.5300.6040.6520.5600.644
bio100.8640.045−0.3030.4100.9760.4880.3910.9390.5201.0000.6250.4260.3830.482−0.4620.3720.4650.3400.433
bio110.8330.0230.461−0.6260.3570.957−0.5650.4060.8280.4541.0000.7320.6420.660−0.5100.6710.6580.6350.641
bio120.143−0.5960.006−0.541−0.3100.512−0.730−0.1880.142−0.1350.4121.0000.9520.844−0.4760.9710.8470.9360.833
bio130.093−0.4150.166−0.594−0.3610.439−0.708−0.2200.094−0.1950.4050.9351.0000.703−0.2700.9910.7040.9800.690
bio140.071−0.602−0.4520.063−0.0060.192−0.179−0.0470.0100.0720.0130.5180.2331.000−0.6430.7220.9930.6400.975
bio15−0.0110.4290.619−0.461−0.2210.081−0.262−0.1120.050−0.2050.2570.0710.358−0.6741.000−0.318−0.648−0.258−0.629
bio160.098−0.4730.131−0.595−0.3660.461−0.732−0.2200.112−0.1960.4070.9660.9910.3010.2861.0000.7240.9850.710
bio170.122−0.602−0.4280.0220.0160.253−0.217−0.0170.0600.1020.0770.5500.2640.989−0.6230.3321.0000.6410.983
bio180.066−0.4660.134−0.589−0.3910.432−0.727−0.2340.089−0.2230.3790.9560.9910.2820.3060.9970.3131.0000.619
bio190.086−0.603−0.4590.0680.0120.207−0.179−0.0220.0380.0920.0260.5150.2260.989−0.6620.2940.9940.2761.000
Note: Values in the lower-left triangle represent Pearson correlation coefficients calculated from environmental values extracted at the 137 occurrence points. Values in the upper-right triangle represent correlation coefficients calculated across the entire study area of China. Bold and underlined values indicate strong correlations (|r| > 0.800).
Table 4. Environmental variables and percentage contribution of S. alopecuroides used for niche modeling.
Climatic FactorsContribution (%)Permutation Importance
bio728.220.1
elev14.813.8
bio1814.616.7
bio914.519.1
bio1213.315.1
bio111.60.9
bio151.81.8
bio170.98.5
bio80.23.7
bio30.10.4
Table 5. Predicted areas with suitable habitat for S. alopecuroides during multiple periods of time.
PeriodPrediction Area (×104 km2)
Highly Suitable HabitatModerately Suitable HabitatLow Suitable HabitatUnsuitable HabitatTotal Suitable Habitat
LIG43.80672.691163.846679.656280.344
LGM42.00672.731163.825681.437278.563
MH42.96570.345161.285685.404274.596
Current41.85272.050163.354682.745277.255
2050s-RCP 2.644.82871.753161.450681.969278.031
2050s-RCP 4.542.85266.515159.162691.470268.530
2050s-RCP 6.042.92068.852160.820687.407272.593
2050s-RCP 8.541.32868.479165.277684.916275.084
2070s-RCP 2.641.93272.402162.190683.477276.523
2070s-RCP 4.541.56668.446165.438684.550275.450
2070s-RCP 6.042.51873.813160.182683.487276.513
2070s-RCP 8.542.07770.246162.301685.375274.625
Disclaimer/Publisher’s Note: The statements, opinions and data contained in all publications are solely those of the individual author(s) and contributor(s) and not of MDPI and/or the editor(s). MDPI and/or the editor(s) disclaim responsibility for any injury to people or property resulting from any ideas, methods, instructions or products referred to in the content.