Article

Analysis of Glucose in Brain Cells and Body Fluids Using Skin Tattoo Painting Wearalble Circuit with Modified Carbon Nanotube Microprobes

1
Biosensor Research Institute, Seoul National University of Science & Technology, Seoul 01881, Republic of Korea
2
The Faculty of General Education, Smart Convergence Technology Research Institute, Sahmyook University, 815 Hwarang-ro, Nowon-gu, Seoul 01795, Republic of Korea
*
Author to whom correspondence should be addressed.
Biophysica 2026, 6(4), 65; https://doi.org/10.3390/biophysica6040065
Submission received: 23 May 2026 / Revised: 14 July 2026 / Accepted: 15 July 2026 / Published: 24 July 2026

Abstract

In-vivo diabetes detection of glucose was sought using square-wave anodic stripping voltammetry (SW), with bismuth-immobilized carbon nanotube paste electrode (BCE), and skin tattoo painted wearable circuits. The optimum analytical results indicated sensitivity of 0.0781 μg/L peak signals on the BCE. The raw voltammogram was approached within the in vivo detection ranges of 10–90 μg/L, with preconcentration times of 50 s attained. The relative standard deviation was micro ranges under optimum conditions. The analytical detection limit (S/N) was attained at a nano range of 5.5 nM. The handmade microsensor was directly used in vivo on the living fish brain and human urine. The method was applied at real time in vivo, without requiring any pretreatment and other ionic electrolyte solutions. It can be used for medicinal and other materials requiring biological-fluid detection in real time. This study was designed to be suitable for real-time unmanned remote diagnosis and therapeutic drug injection into the body, micro-needle long-term administration, wearable artificial skin tattoo sensor, and real-time control. In addition, the glasses monitor was designed to be suitable for multitasking and multi-user control sensing.

1. Introduction

Among the in vivo metabolites, glucose is the main substrate for organic energy [1,2]. Muscle sympathetic nerve activity [3] and body cells that generate energy [4] and that contain metabolites are associated with diabetes and vascular disease, cell growth [5], and physiological fluids [6] and are fuel-cyclic-efficient. Heart deficiency or excess of glucose in vivo is the cause of all diseases. It is also an essential condition for life maintenance and activity, and it dominates behavior at every moment. Therefore, maintaining a precise concentration range is an essential condition for maintaining life. Therefore, sensitive analytical detection techniques have become an object of considerable interest in biological in vivo or in vitro systems [7], such as clinical applications for selective capillary electrophoretic methods [8], high-performance liquid chromatography with refractive index detection [9], and in vivo near-infrared (NIR) noninvasive blood glucose assay [10]. Spectrophotometrics are in demand for pretreated sample preparation and electric detection systems, but better, simpler, faster, and inexpensive electrochemical techniques have been developed, such as those involving the use of the photopolymeric membrane amperometric biosensor [11], copper based alloy electrodes [12], nickel copper alloy electrodes [13], graphite epoxy screen printable biocomposite sensor [14], ferrocene monocarboxylic-acid composite sol-gel glass electrode [15], and other modified sensors [16,17]. Most of these devices, however, are used only under laboratory conditions and are not usable for in vivo direct assay. In this study, a simpler, more sensitive, and inexpensive square-wave anodic stripping voltammetry (SWASV) method was sought. The objective of the study was to determine the effects of bismuth immobilized onto a carbon nanotube (CNT) structure. CNT can serve as a metal semiconductor and is also called an “electrochemical capacitor [18]. It can perform electron transfer with bio molecules, which have large cylindrical surface areas. Thus, a number of investigations of CNT for catalyst support and electronic equipment have been conducted [19]. In this study, CNT was used for electrical support. Moreover, the outermost electrons of bismuth cause a chelating effect and act as a redox catalyst. While the bismuth reactor is also an acid-base stable and reacts sensitively to electron transfer, here the bismuth immobilized [20] techniques have already been employed for electrochemical measurements of metal and other bio molecules assay [21]. As such, CNT-based bismuth [22] paste was prepared for the trace detection of glucose. This method is very simple and can detect low concentration ranges within fast accumulation times. This experiment did not need complicated equipment but only a small electric circuit. It also had a very short accumulation time of only 350 s and easily detected the metabolites. It can thus be used to detect biological in vivo and other materials requiring glucose analysis. Also, glucose is related to cancer cell growth. Unlike normal cells, which mainly use glucose in the energy metabolism process, cancer cells use entirely fatty acids and use oxygen in mitochondria to create adenosine triphosphate ATP. If the use of fatty acids is blocked in the presence of glucose, ATP rapidly drops, and only cancer cells die. In addition, animal experiments using mouse cancer models have shown that cancer growth under high-fat diet conditions is 5 times higher than growth under low-fat diet (high-carbohydrate diet) conditions in a calorie-balanced diet with the same total calories. For this reason, we have searched for real-time diagnostic analysis of glucose in vivo or in vitro that can prevent, treat, or block diseases such as: muscle control, cranial nerve paralysis, diabetes, cancer, hypertension, stroke, dementia, epilepsy, Parkinson’s disease, etc. In addition, methods developed here of in vivo and in vitro sensors can be used for wearable remote diagnostic treatment, and can allow real-time self-diagnosis of the following trace amounts of biological substances and viruses detection [23,24].

2. Materials and Methods

2.1. Apparatus and Reagents

All voltammetric measurements were carried out using a CHI660A Instruments electrochemical workstation (CH Instruments Inc., Cordova, TN, USA). A three-electrode system was used to monitor the SWASV signal. BCE was used as the working electrode, with saturated Ag/AgCl as the reference electrode (3 molL−1 KCl). Platinum wire was used as the auxiliary electrode. The working electrode was made of paste, which is a mixture of CNT (Nanostructured and Amorphous Materials, Inc., Katy, TX, USA), bismuth standard (Aldrich 1000 ppm), and mineral oil, in the ratio of 60:30:10. A small amount of mixed paste was inserted into a plastic-needle-type capillary tube with a 1.5 mm diameter and 5 cm length, using a 0.5 m diameter copper wire connected to the measurement system. All the systems were subjected to room temperature (24 ± 2 °C). The reagent solution was prepared from doubly distilled water (18 Mohm.cm). The conventional paste electrode was prepared by mixing 70% graphite powder with 30% mineral oil. This mixture was homogenized in a mortar for 30 min. The mixed paste was inserted into a plastic syringe needle with a diameter of 3.0 mm, and a copper wire was connected to the electric system. In the in vivo insertion experiment, bacterial growth and interference conditions were blocked through alcohol disinfection, sterilization conditions, high purity compounds, heat sterilization, etc.

2.2. Experimental Procedure

Several electrolyte solutions of acid, base, and buffer (all in 0.1 M) were initially examined with sulfuric acid, nitric acid, hydrochloric acid, acetic acid, and 0.1 M~0.01 M electrolyte, as well as the 0.1 M~0.01 M potassium oxide, sodium hydroxide, and ammonia solution. However, the peak size was not clear. Ammonium phosphoric-acid solution was found to be a suitable electrolyte, yielding the best peak separation from the background currents. The effect of the phosphoric-acid concentration was examined within the range of 0.01–0.3 M. In the 0.1 M solution, the pH of 4.69 was found to be sensitive. Under this condition, the cyclic peak potential and peak sensitivity were examined using BCE and the common-type CNT paste electrode. Another requirement of stripping voltammetry is that variables such as initial potential, final potential, square-wave amplitude, frequency, switching time, and current sensitivity are selectively used at intermediate median values possible under optimal conditions. To block errors, a 45-degree concentration gradient condition was used by repeating the process 3 to 5 times under optimal conditions. Another error was eliminated by using the standard addition method.

2.3. Animal Testing

Food fish are not subject to animal testing and protection laws. However, it was tested with animal protection approval according to school regulations. This study was conducted in a laboratory with the consent of the Animal Ethics Committee of the Biosensor Research Institute, Seoul National University of Science and Technology (SNUT.BIO.2014.02). The experimental procedures were performed in accordance with the standards of the Guide for the Care and Use of Laboratory Animals. Body weight: 10–20 g male fish, two carp were used. The carp were kept in a 100 cm × 100 cm × 100 cm aquarium. They were fed ad libitum until anesthesia. The in vivo implantation of the microsensor was according to the published paper. In vivo signal detection also followed the insertion reference paper. Fish experiment: Male edible carp 12 cm long, 12 g mass (see attached photo) was used. Fish were cultured in a natural environment and tested in a transparent tank. The brain implantable working sensor used a 3 mm microtube with a length of 10 mm. The tube was filled with a working sensor. The fish was anesthetized with a 95% ether solution. The skin surface was sterilized with a 100% ethyl alcohol solution. A 100 mm deep hole was drilled in the center of the top of the head with a 5 mm drill. The sensor was inserted and fixed with adhesive. The counter electrode and the reference electrode were embedded in the left and right dorsal fins in the same way. Voltage and current measurements could be measured in real time without interference under normal activity conditions [25]. The electrode life was 15 to 30 days without replacement. Urine experiment: 500 mL of the experimenter’s own urine was placed in a distilled water bottle without pretreatment and stored in the refrigerator. Urine experiment: 500 mL of the experimenter’s own urine was placed in a distilled water bottle without pretreatment and stored in the refrigerator.

3. Results and Discussion

3.1. Cyclic Voltammetric Property of BCE

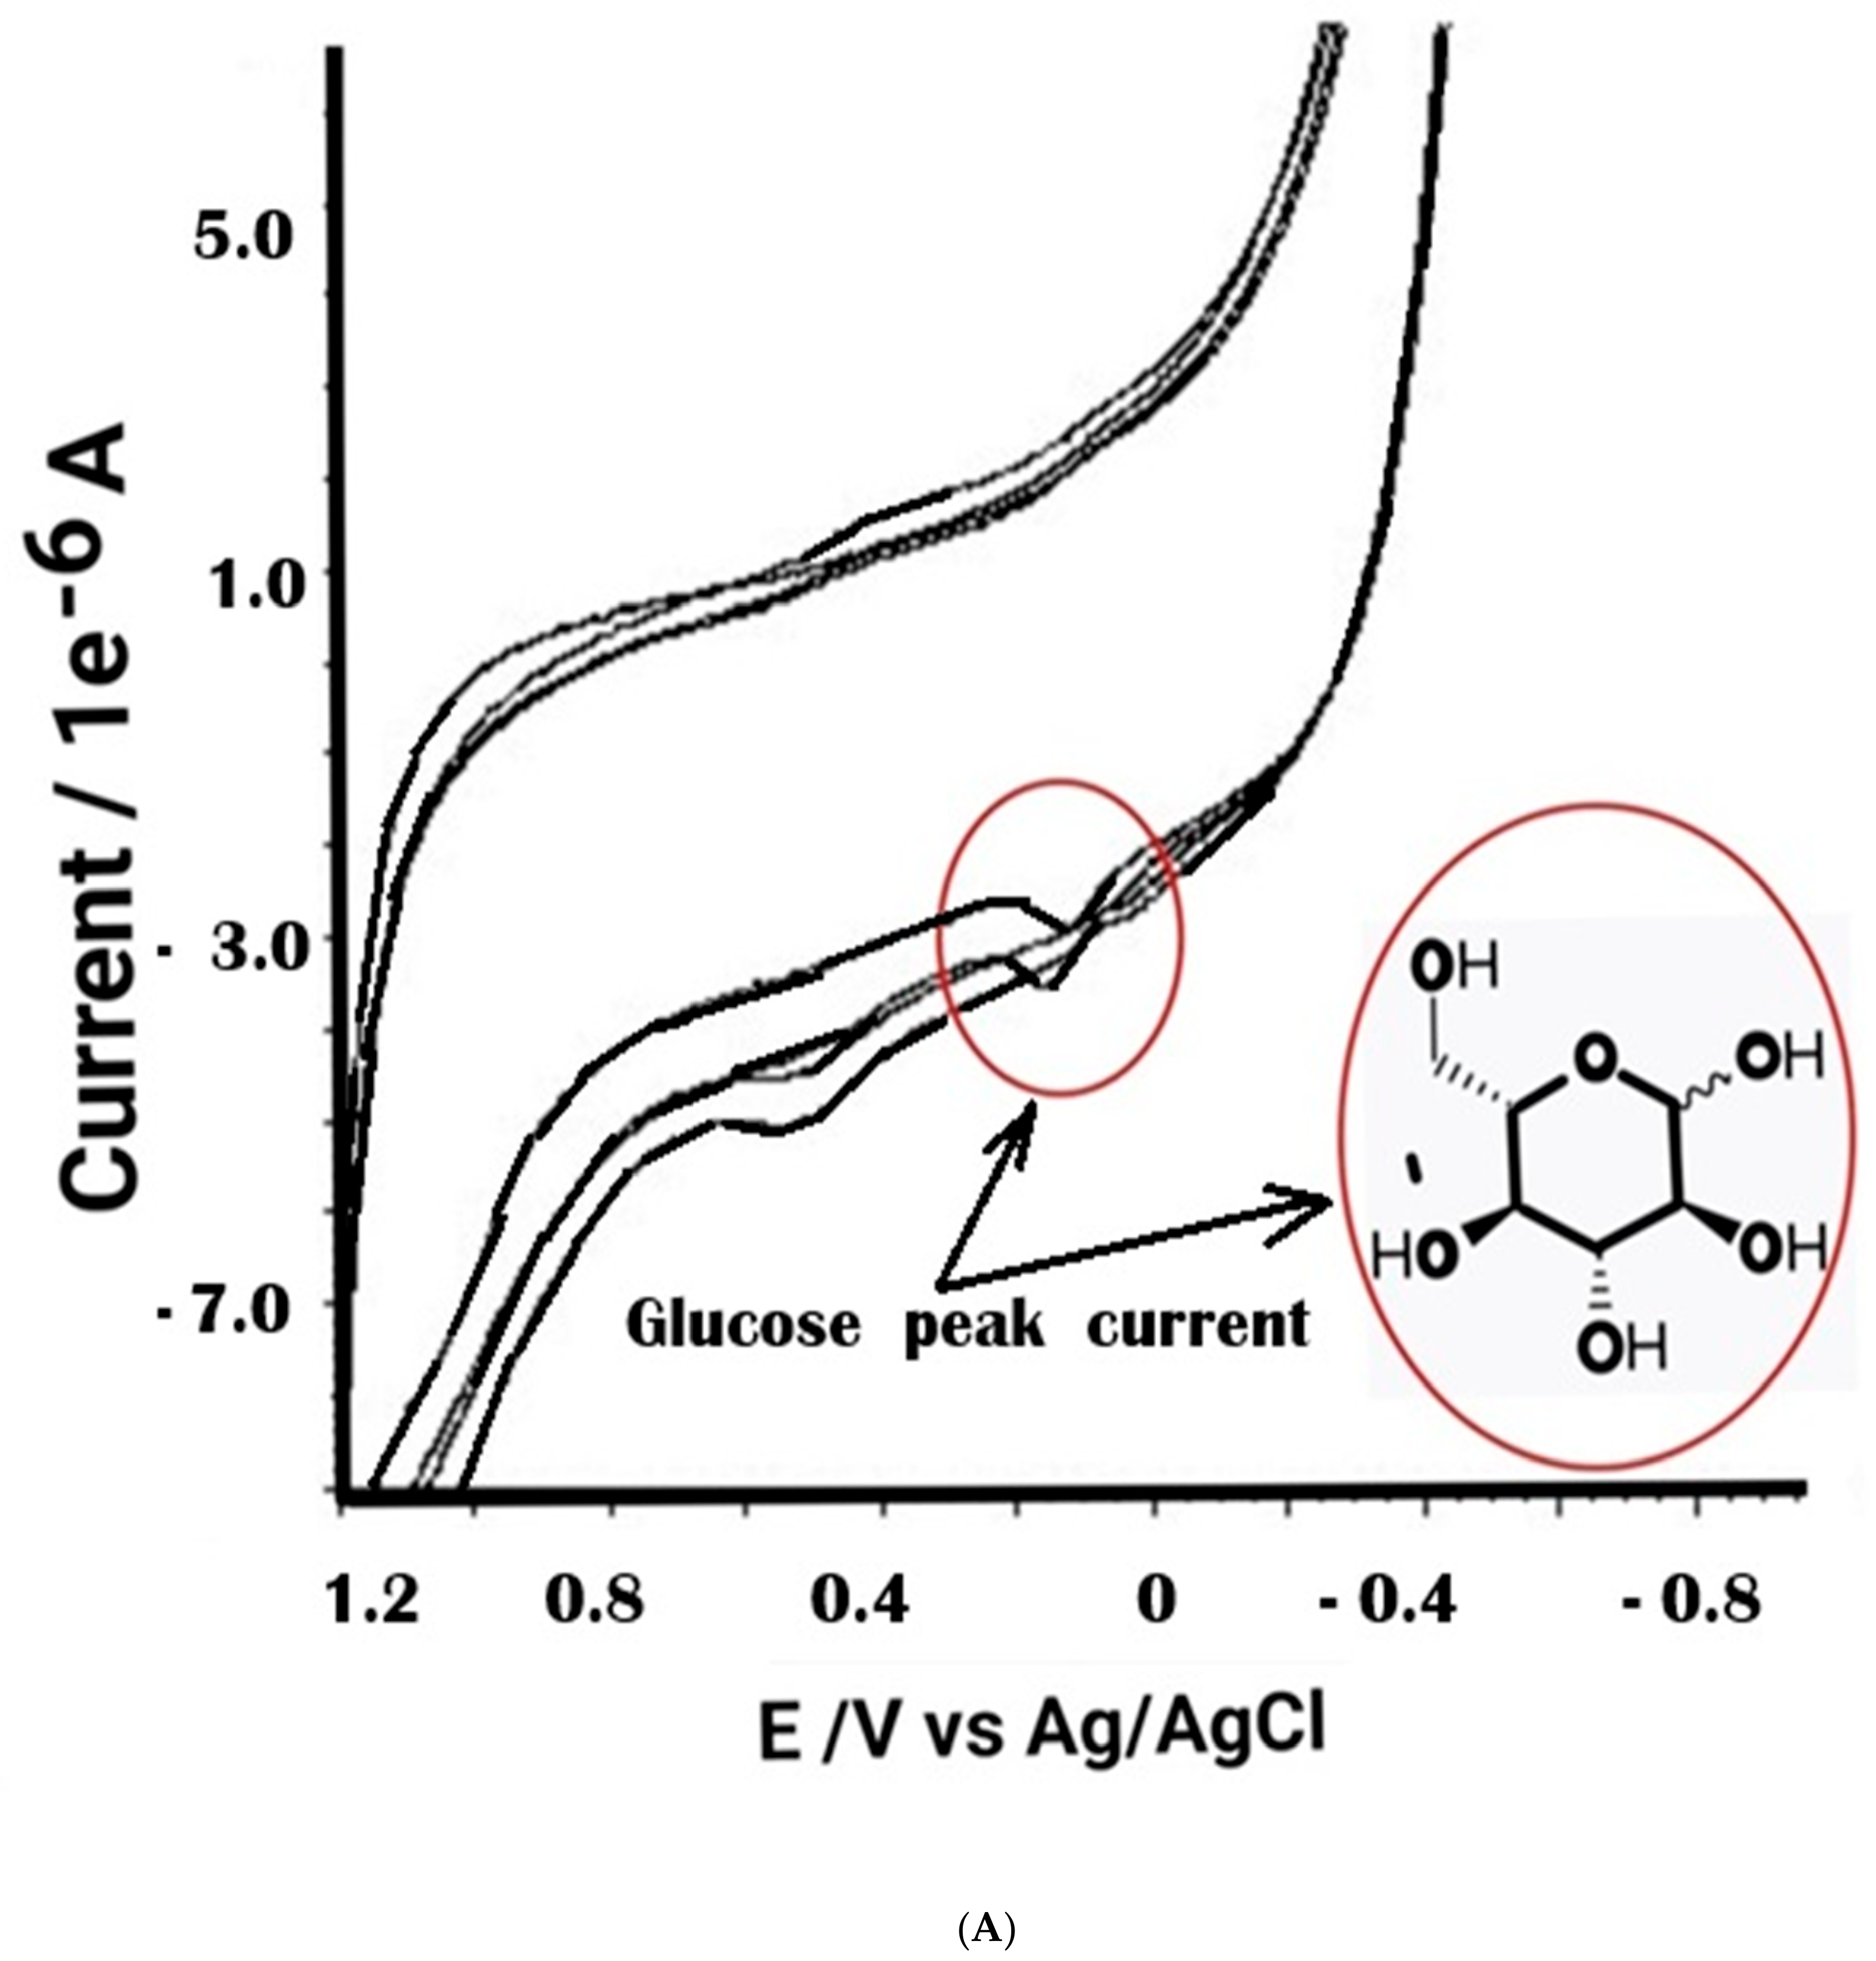
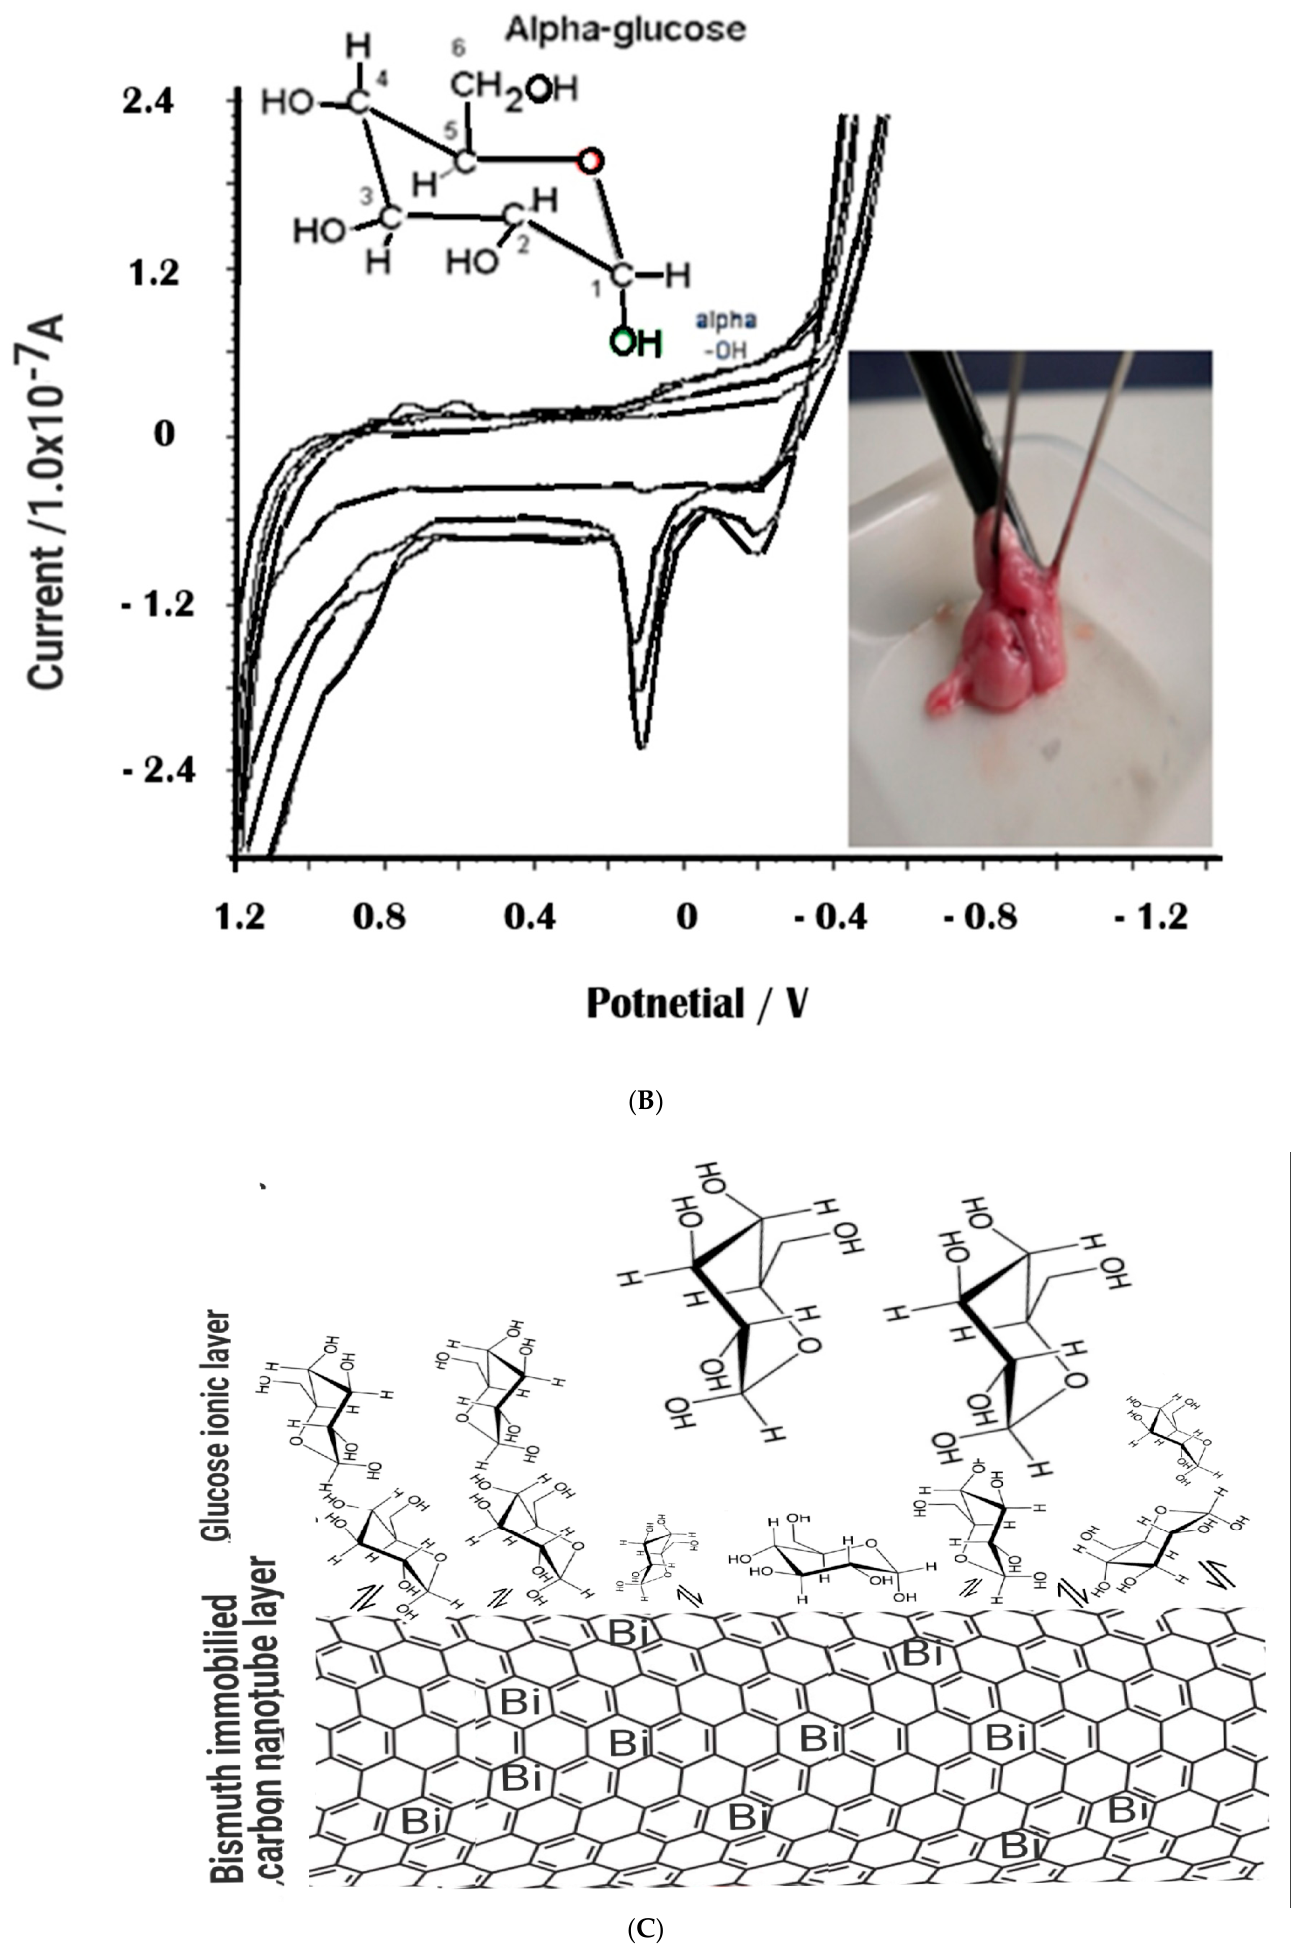
The unit mgL−1 indicated noise signals on the graphite electrode, but the definite peak current on BCE was found to be around 0.1 V. As shown in the bigger graph in the same figure, the currents from BCE grew regularly and visually with 8.78, 12.07, 16.18 × 10⁻⁶ A, and close to a direct proportional graph, whereas the currents from the graphite electrode grew differently from BCE. The peak currents on the graphite electrode grew only slightly at Figure 1A. Although the graph does not show this, the CNT that was modified through the previous method was also tested for mercury and was electric-metal-immobilized, but the BCE current was more gradual than the other peaks. Through this experiment, BCE was determined to be an effective electrode for the detection of glucose. Figure 1B shows cyclic peak at brain cell of fish. Using BCE, more sensitive SW optimization was performed. Figure 1C: The picture shows. Redox electron transfer phenomenon can be seen between the bismuth immobilized carbon nanotube layer, and the glucose ion film adsorbed on the electrode surface. Stripping voltammetry amplifies neutralizing electrons with an exponential function. On the electrode surface, the catalytic effect of nanotubes, the time amplification effect of adsorption and peeling, and the instantaneous reversible oxidation-reduction reaction can occur quickly.

3.2. SW Optimization for BCE

Stripping voltammetry requires optimal state testing. Under optimal conditions, the detection limit can be lowered. Therefore, four condition experiments were conducted.
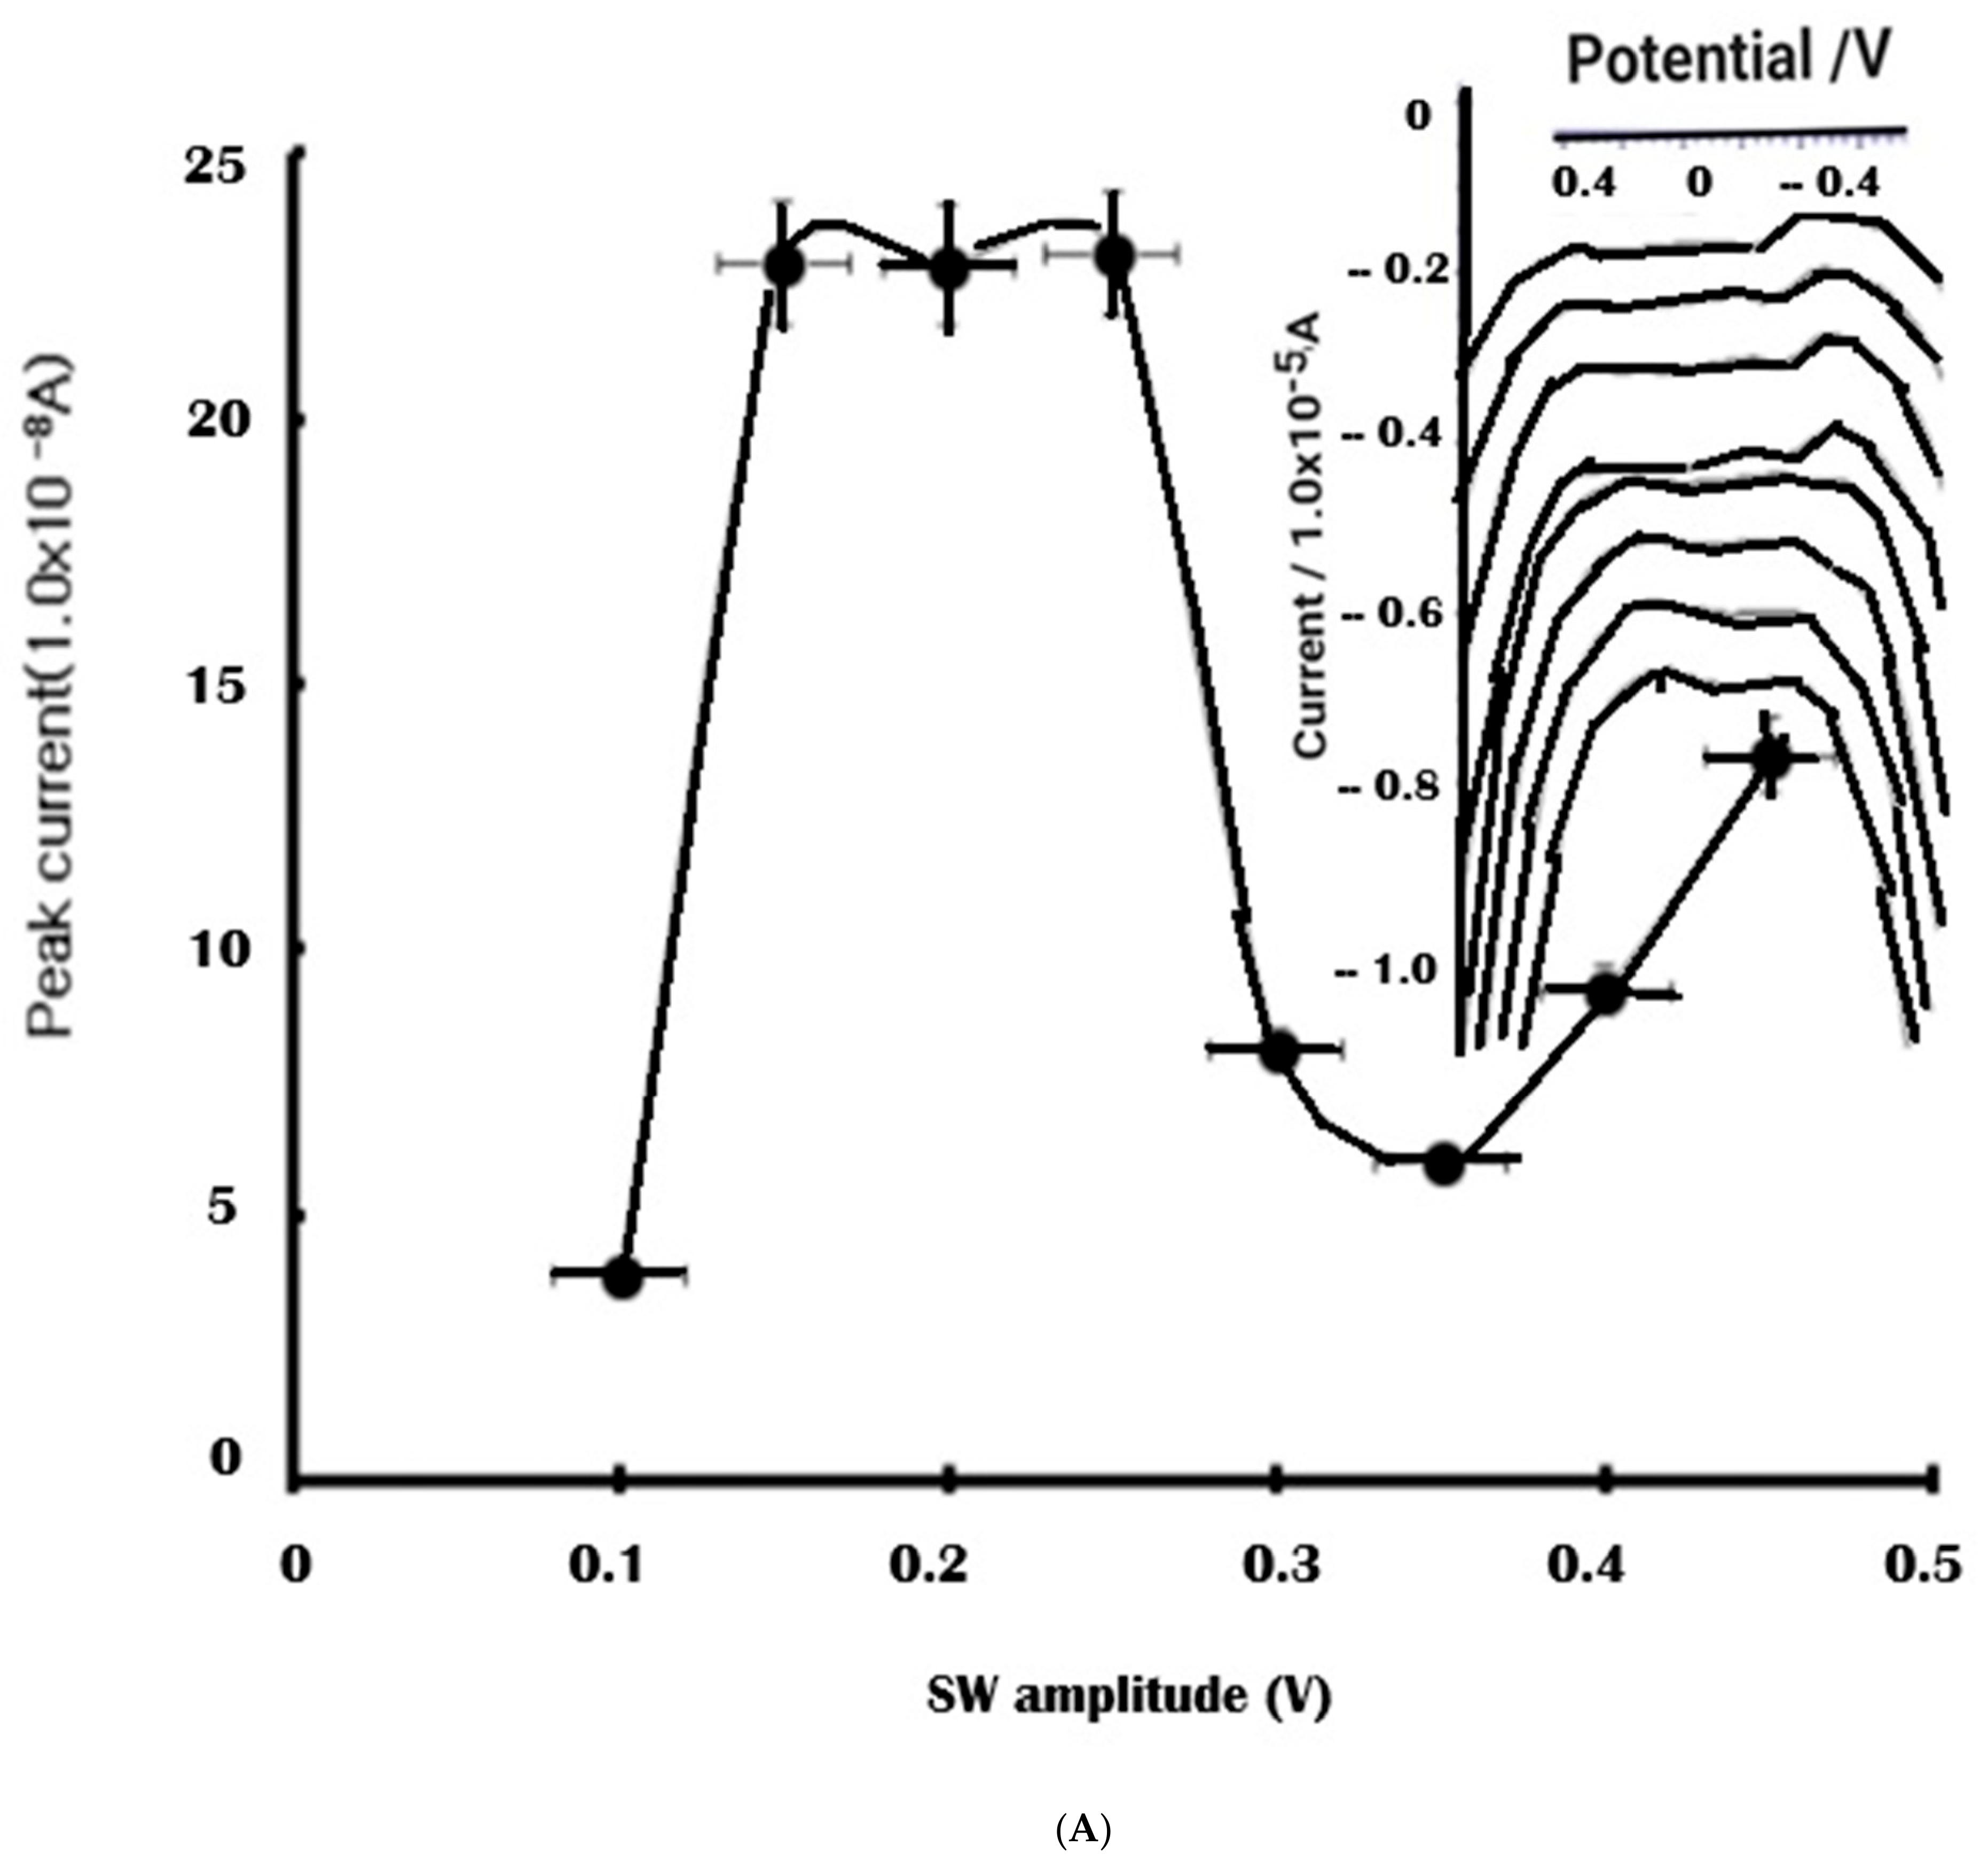
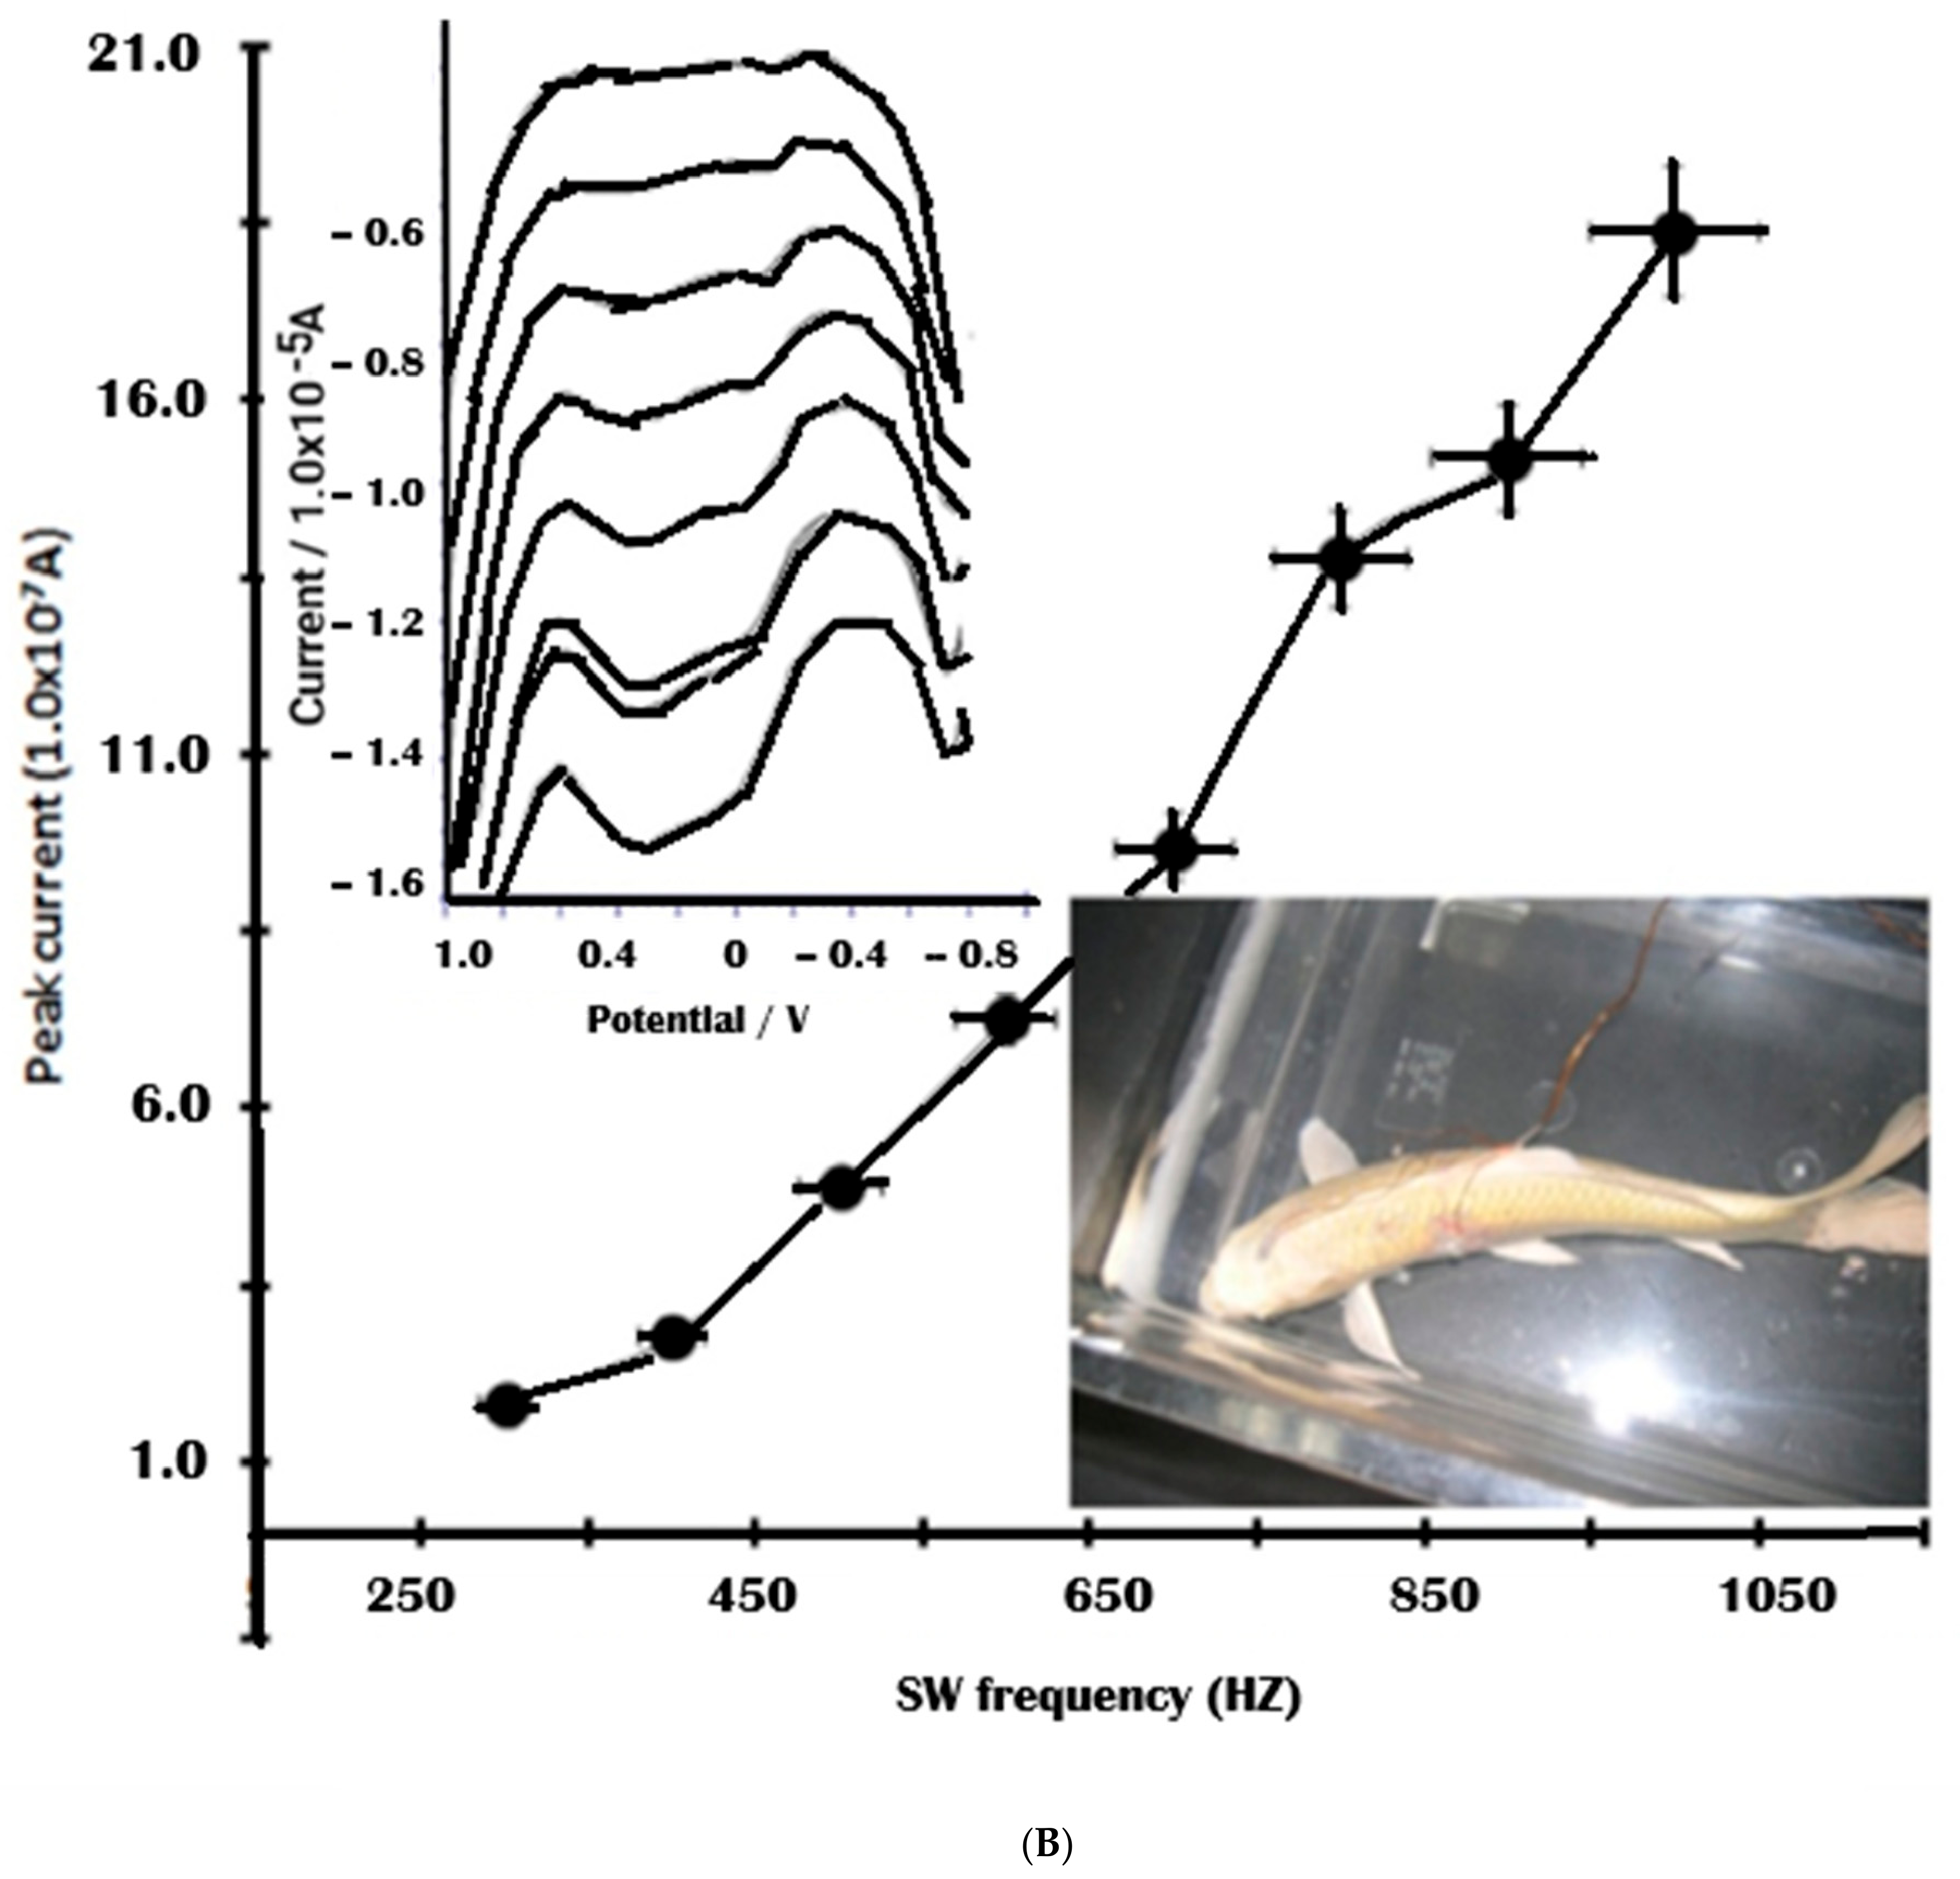
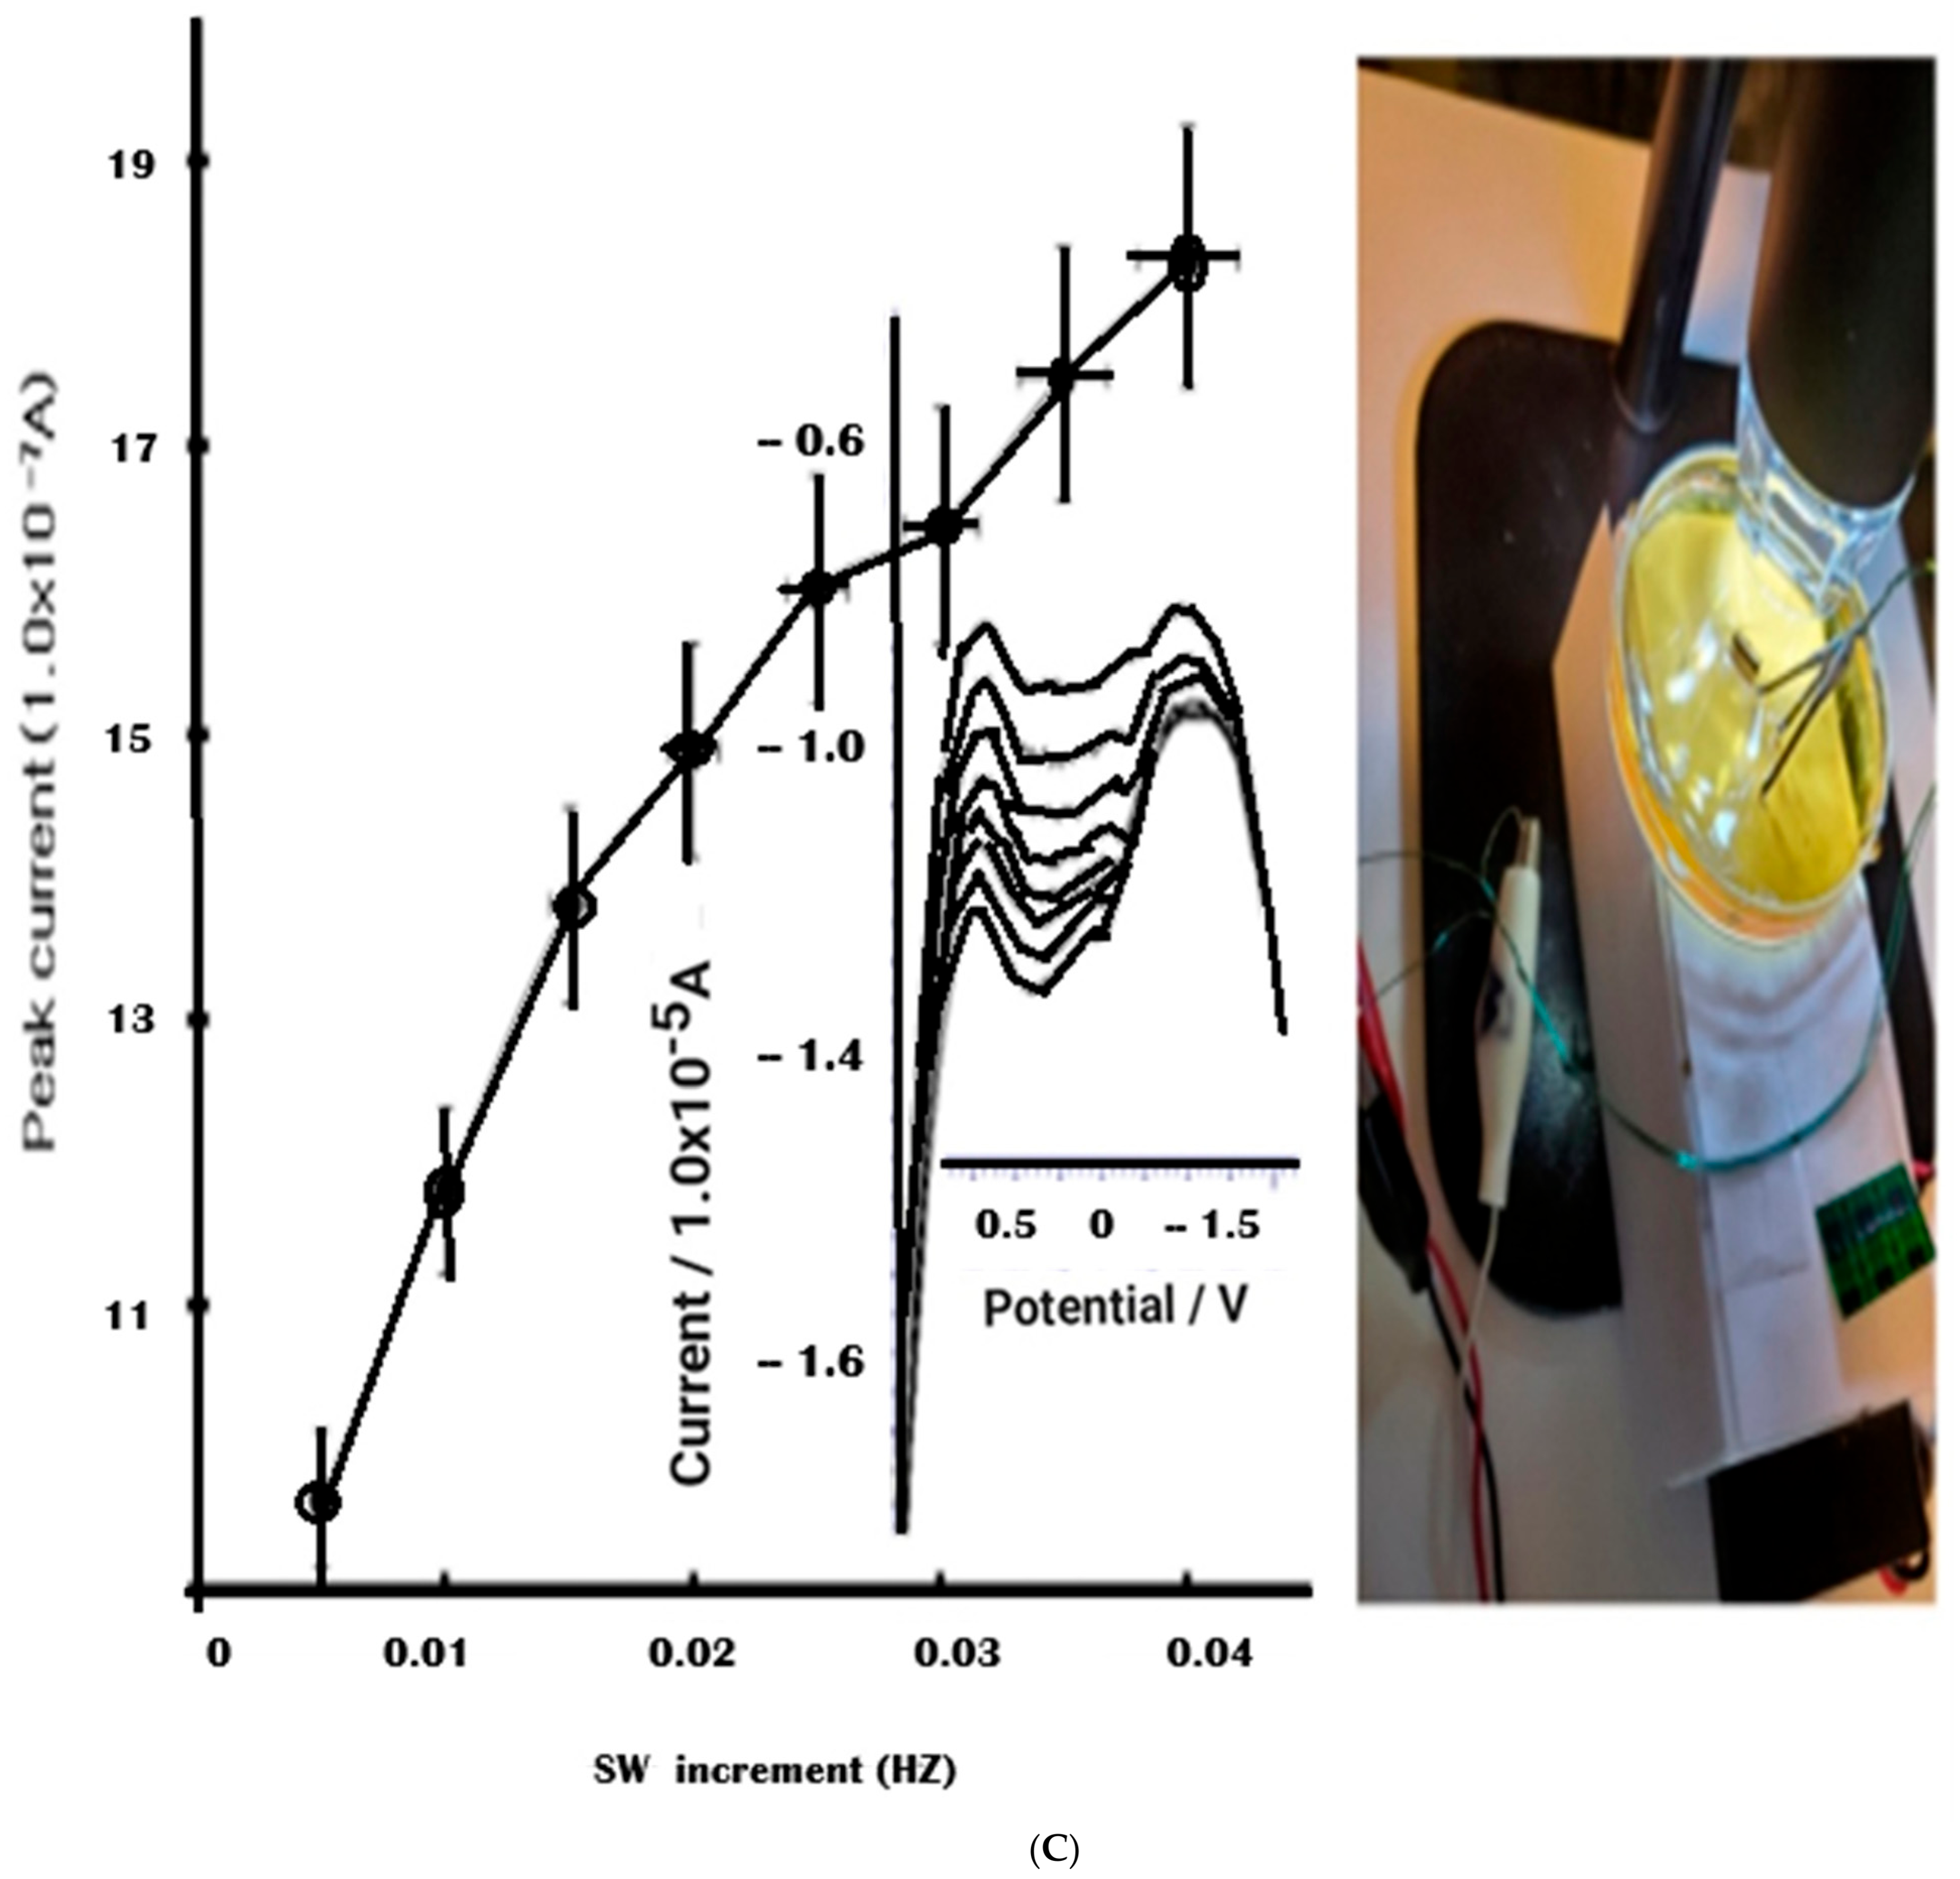
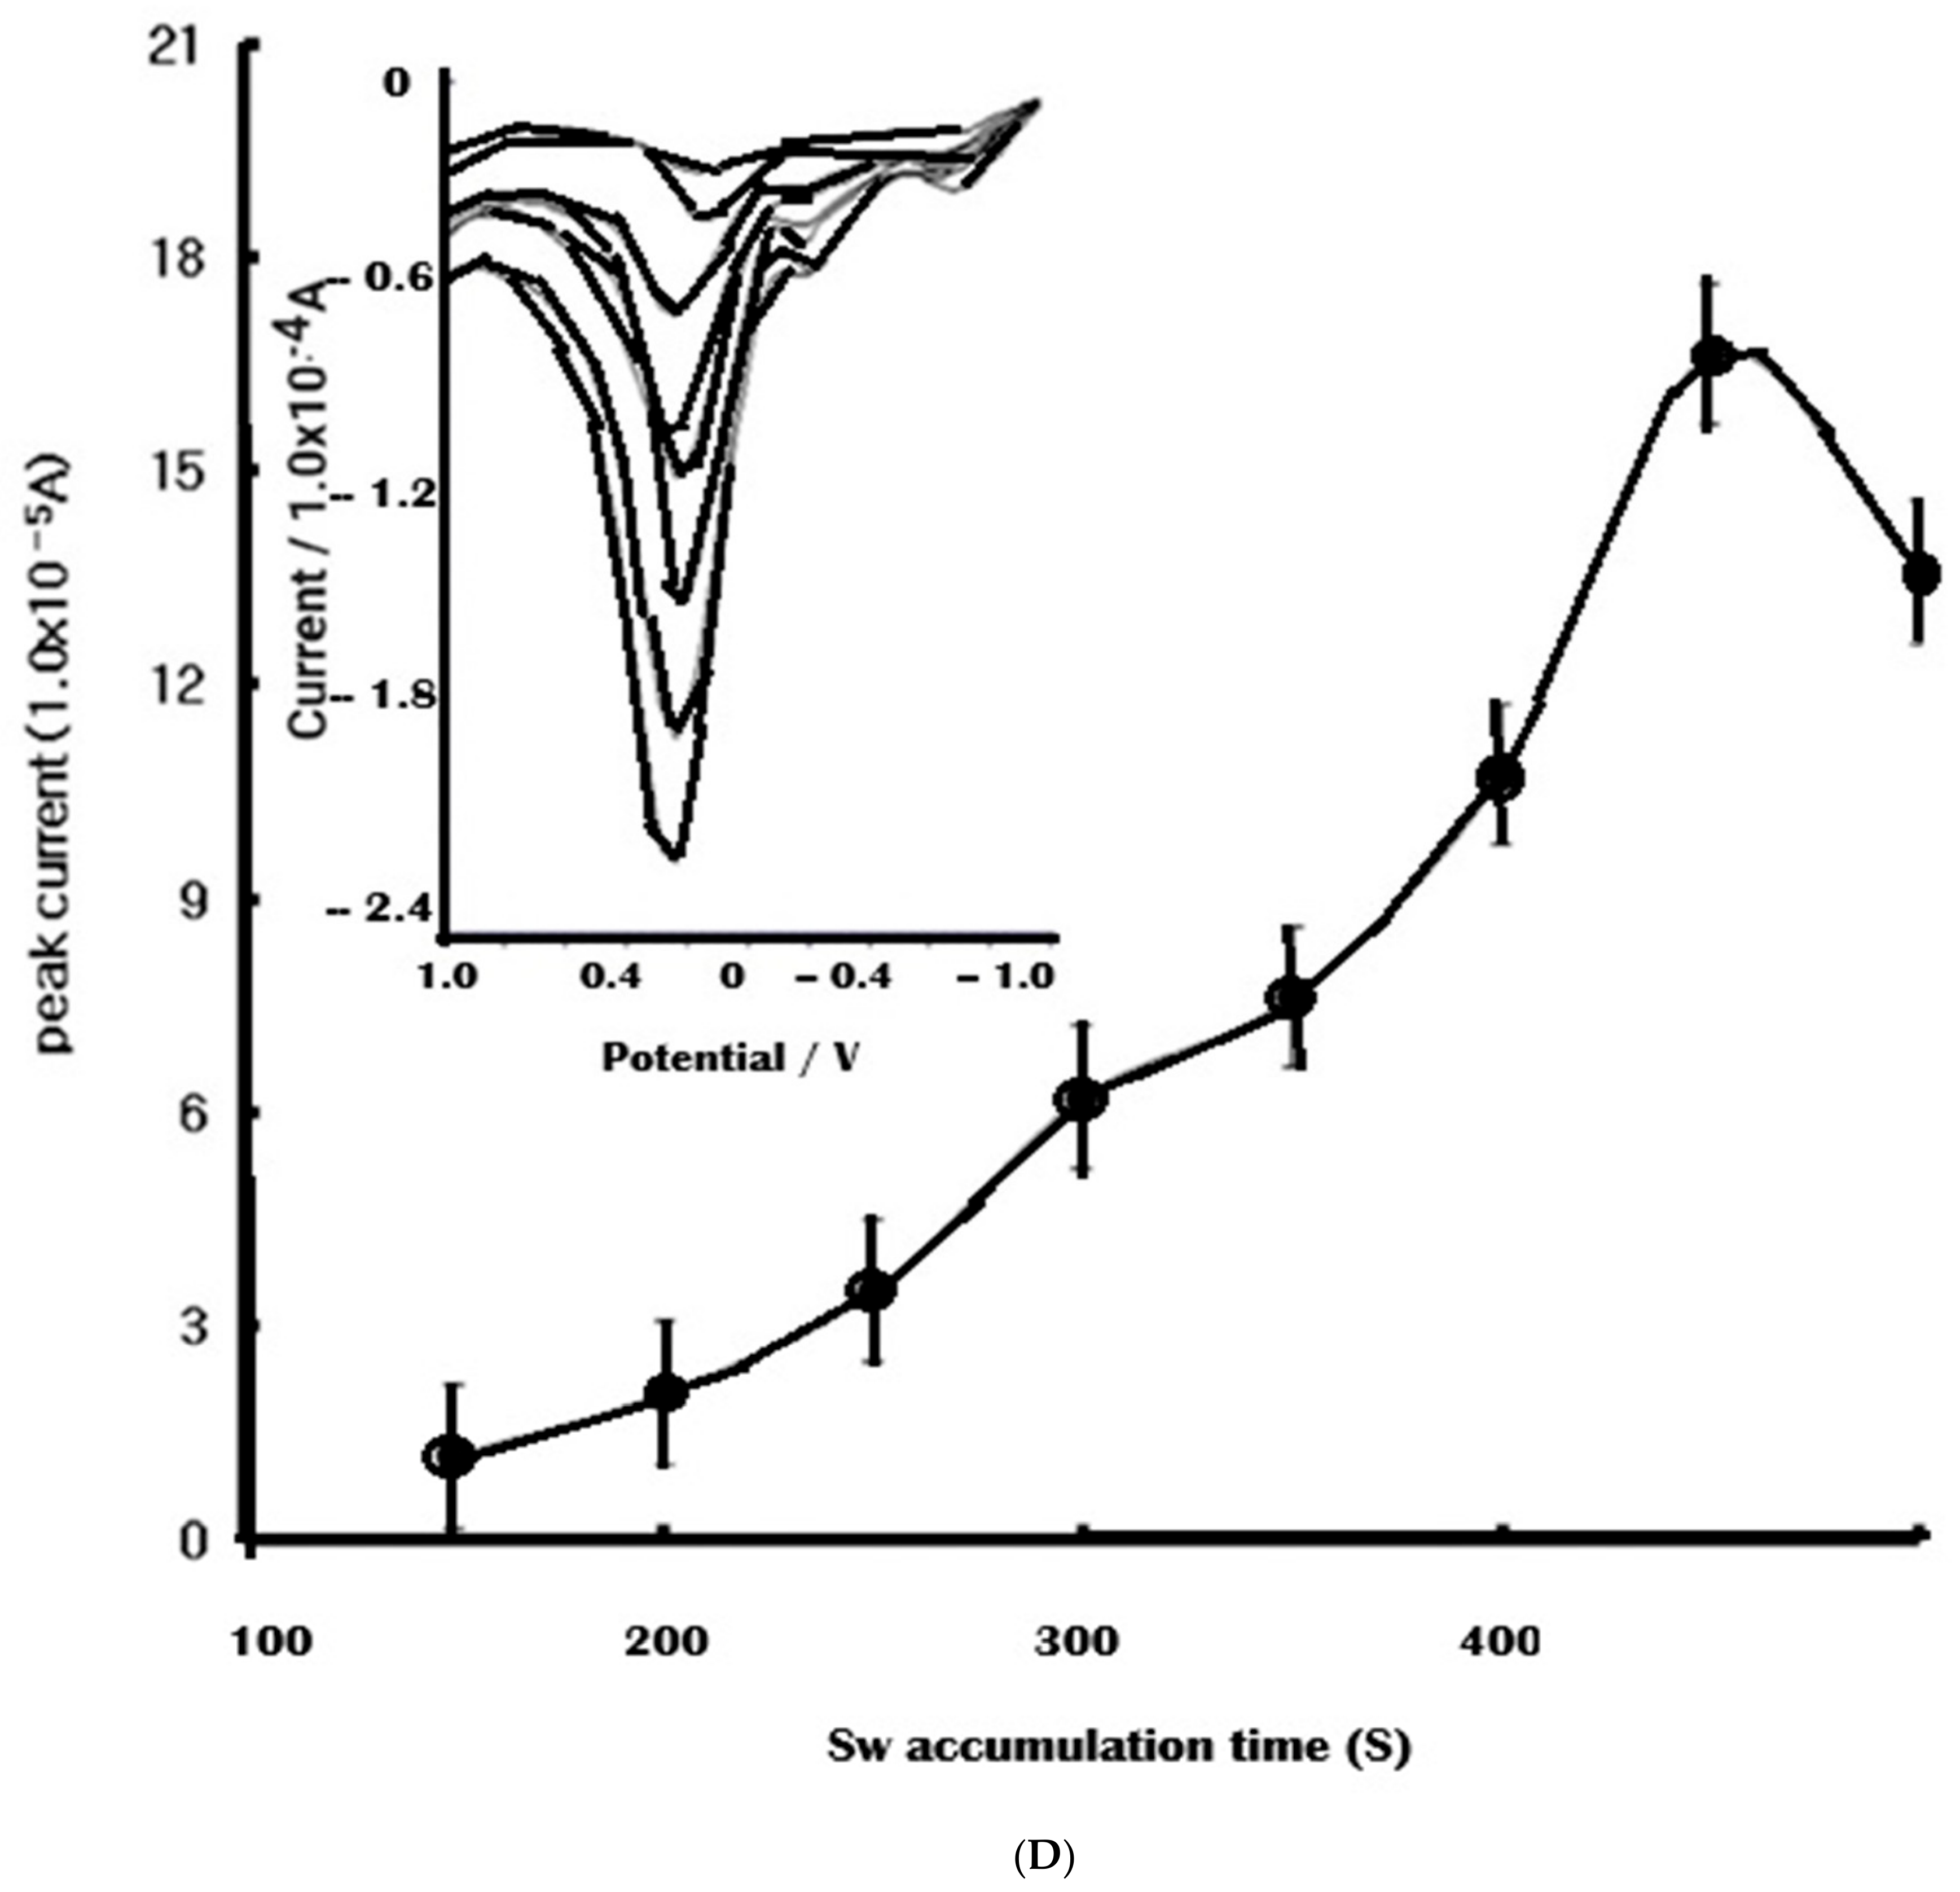
Figure 2A illustrates the voltammetric peak current in a 1 mgL−1 glucose concentration as a function of varying square-wave amplitudes. The amplitude range increased very quickly from 0.1 to 0.15 V, while the 0.15–0.25 V peak remained very high. The peak, however, again rapidly decreased to 8.11 × 10⁻⁸ A, then once again increased to 0.35–0.45 V. At this amplitude, a glucose peak ratio of 23.12 × 10⁻⁵ A:3.85 × 10⁻⁵ A appeared. Here, 0.2 V was fixed. Using this result, the square-wave frequencies for Figure 2B were tested at fish brain cell real, and the results within the range gradually increased, except at 800–900 Hz, where the peak decreased from 13.76 to 15.19 × 10⁻⁷ A. The peak current range was 1.83–18.37 × 10⁻⁷. As such, the optimum frequency was 1000 Hz. Under these conditions, Figure 2C shows the results that exhibit the square-wave step potential. The range was 9.63–18.33 × 10⁻⁷ A, and the highest peak was 0.04 V. The square-wave accumulation time test was also carried out. Figure 2D shows the accumulation time test consequence. The test was conducted for 30 s. Up to 350 s, the peak current rose, but at 400 s, the peak current decreased to 13.58. At 300–350 s, the peak current went up rapidly from 10.75 to 16.64 × 10⁻⁵ A. The range of increase was 1.17–16.64 × 10⁻⁵ A. Therefore, the best peak current was shown to be at 350 s, by 16.64 × 10⁻⁵ A. The pH was also tested. The peak current was highly movable upward and downward. It was tested eight times, at 2.89, 3.33, 4.06, 4.69, 5.11, 6, 6.61, and 7.19 pH. From pH 3.33 to 4.69, the peak current grew steadily, but it rapidly declined at pH 5.11 by 0.6161 × 10−6. pH 4.69 was found to be suitable by 2.257 × 10⁻⁶. As such, through this procedure, the optimum conditions of 0.25 V amplitude, 300 Hz frequency, 0.04 V step potential, 350 s accumulation time, and 4.69 pH were arrived at. Using these conditions, analytical linear ranges and statistic applications were performed.

3.3. Analytical Working Ranges, Interference, Statistics, and Application

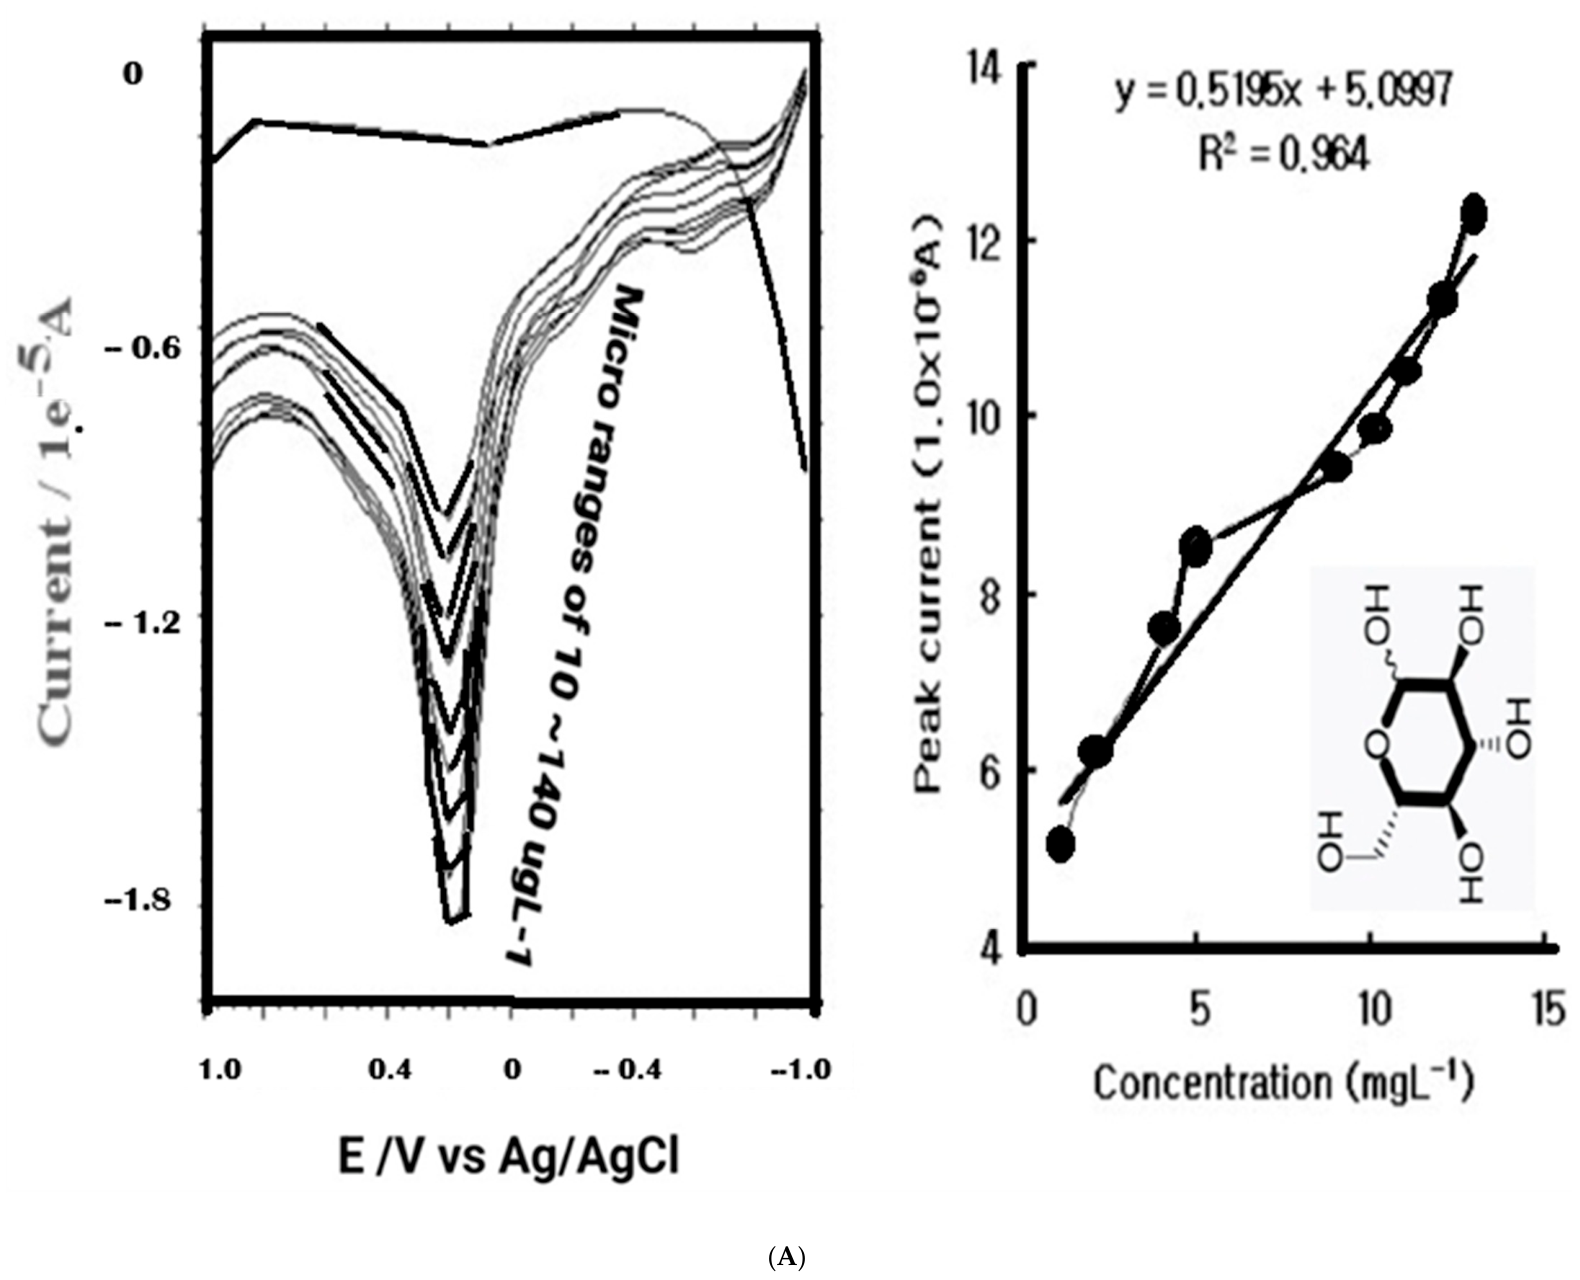
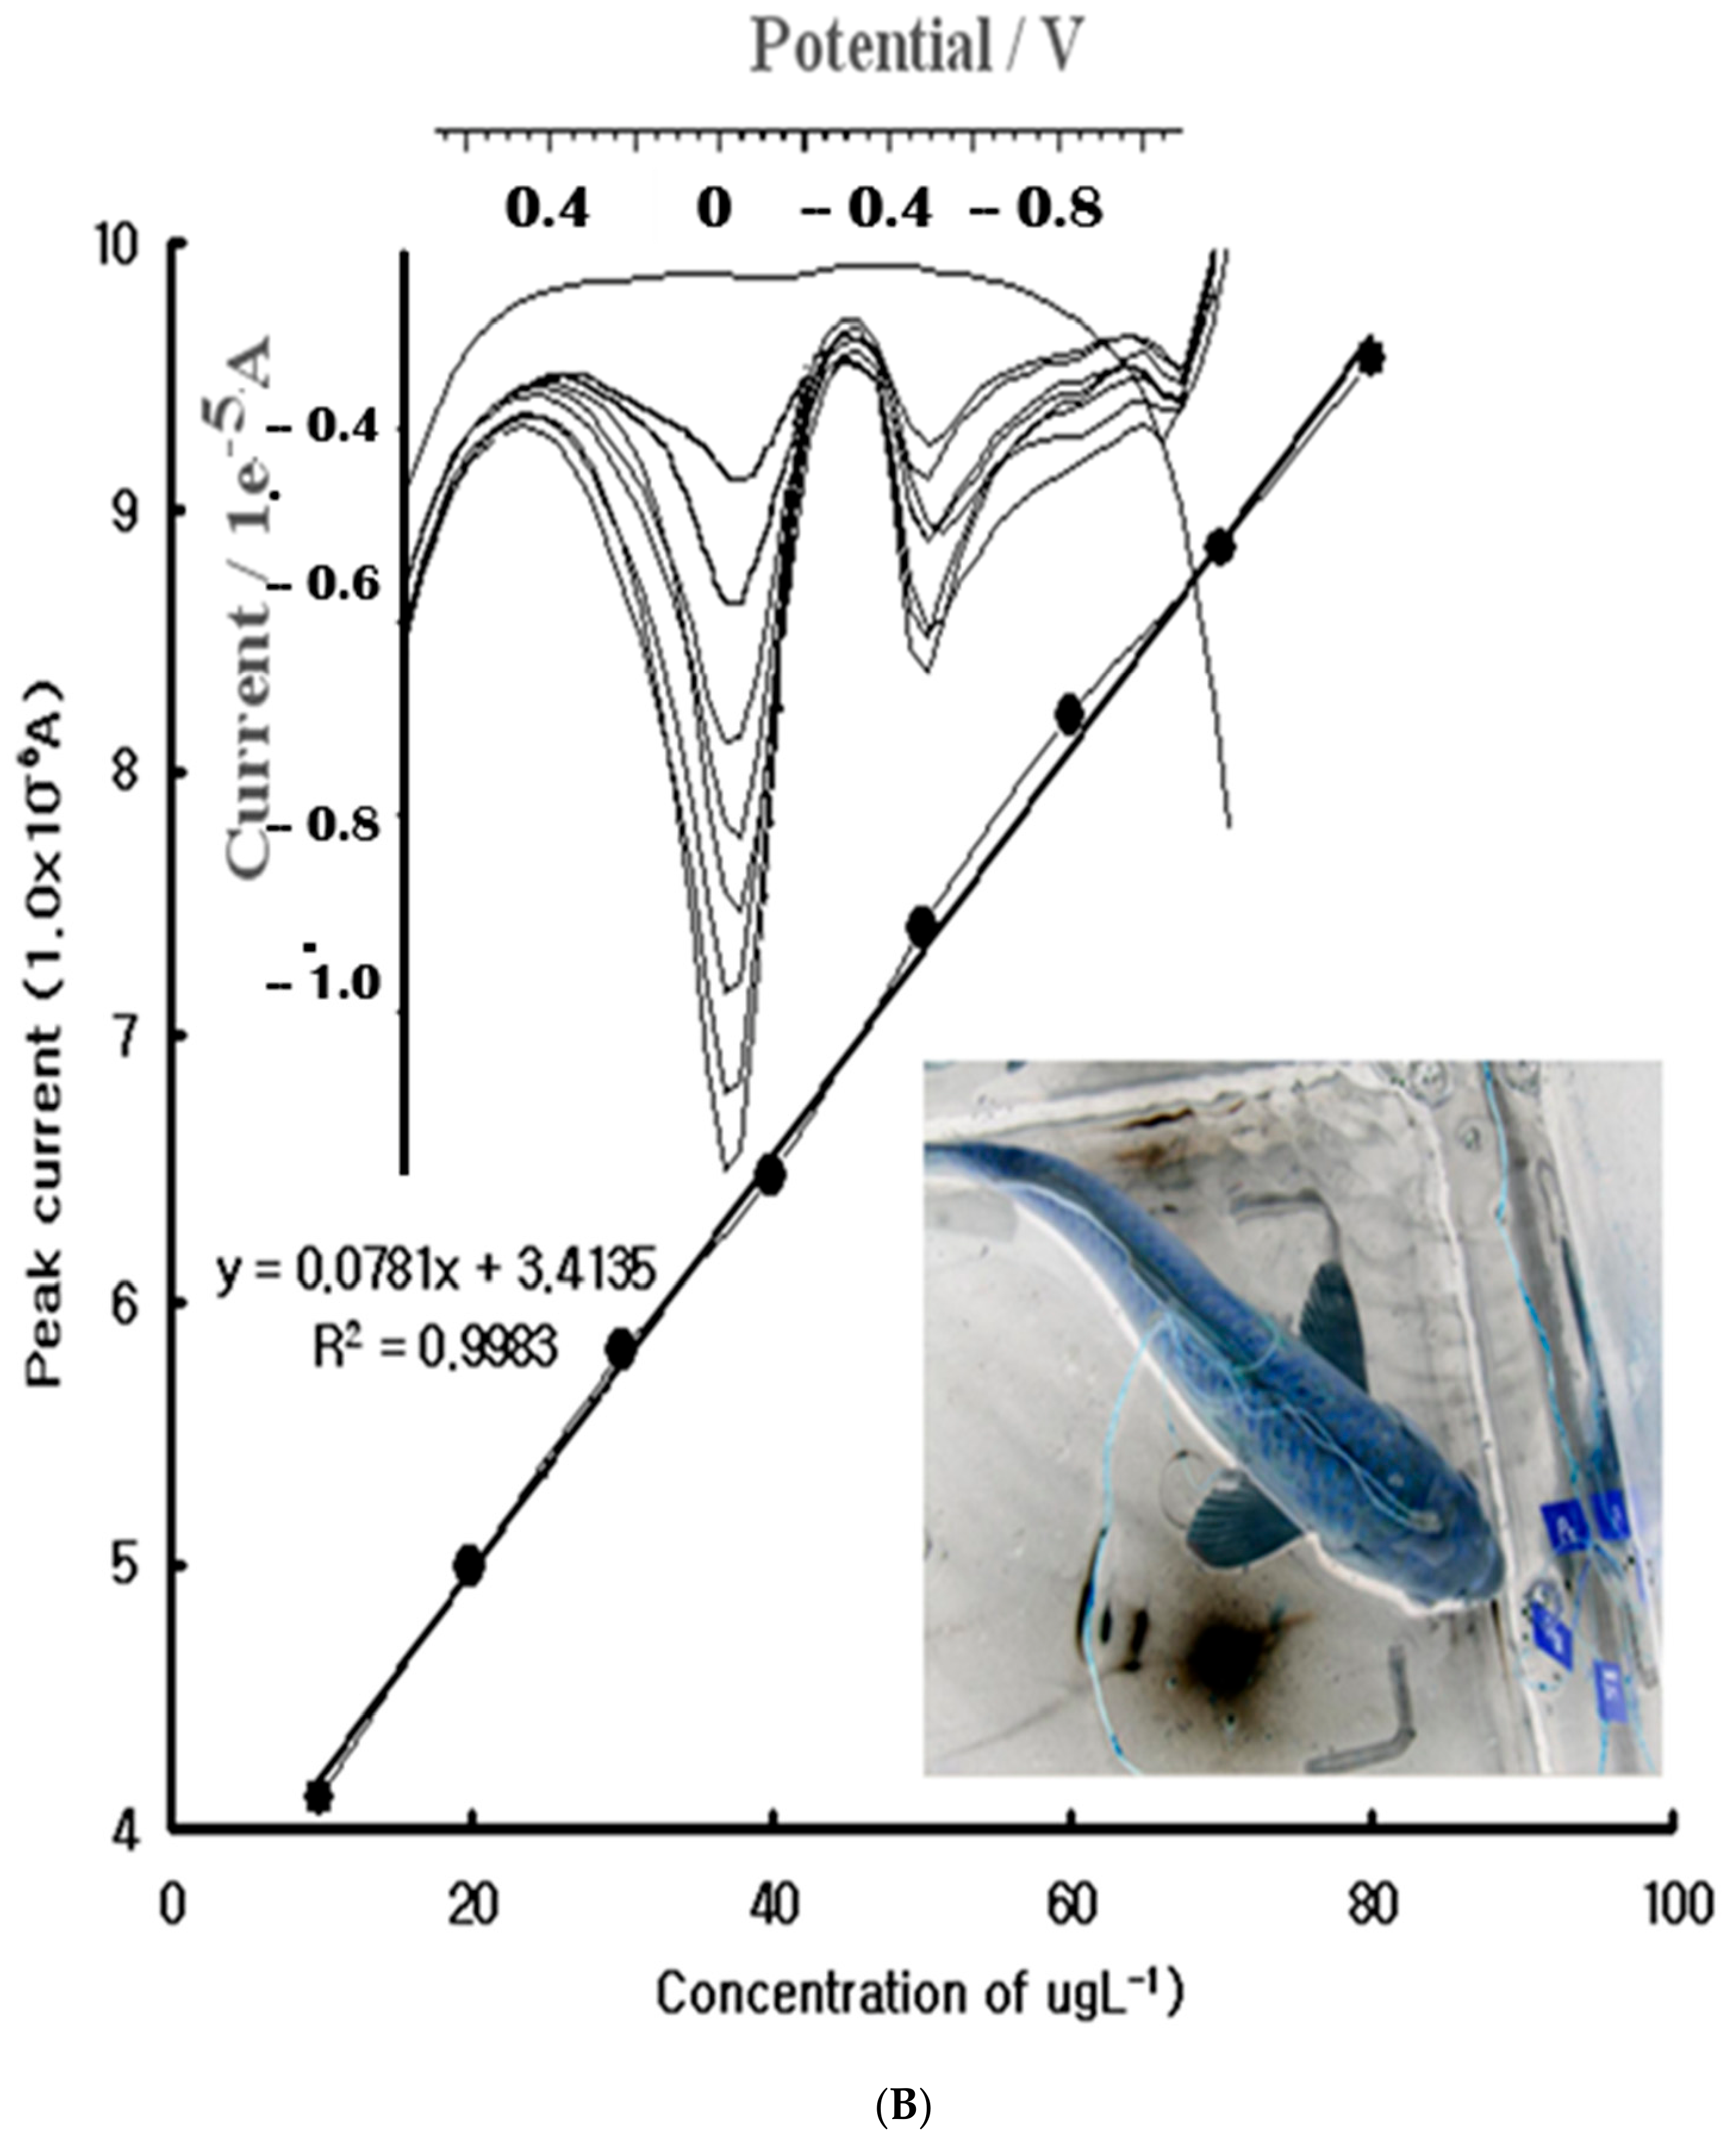
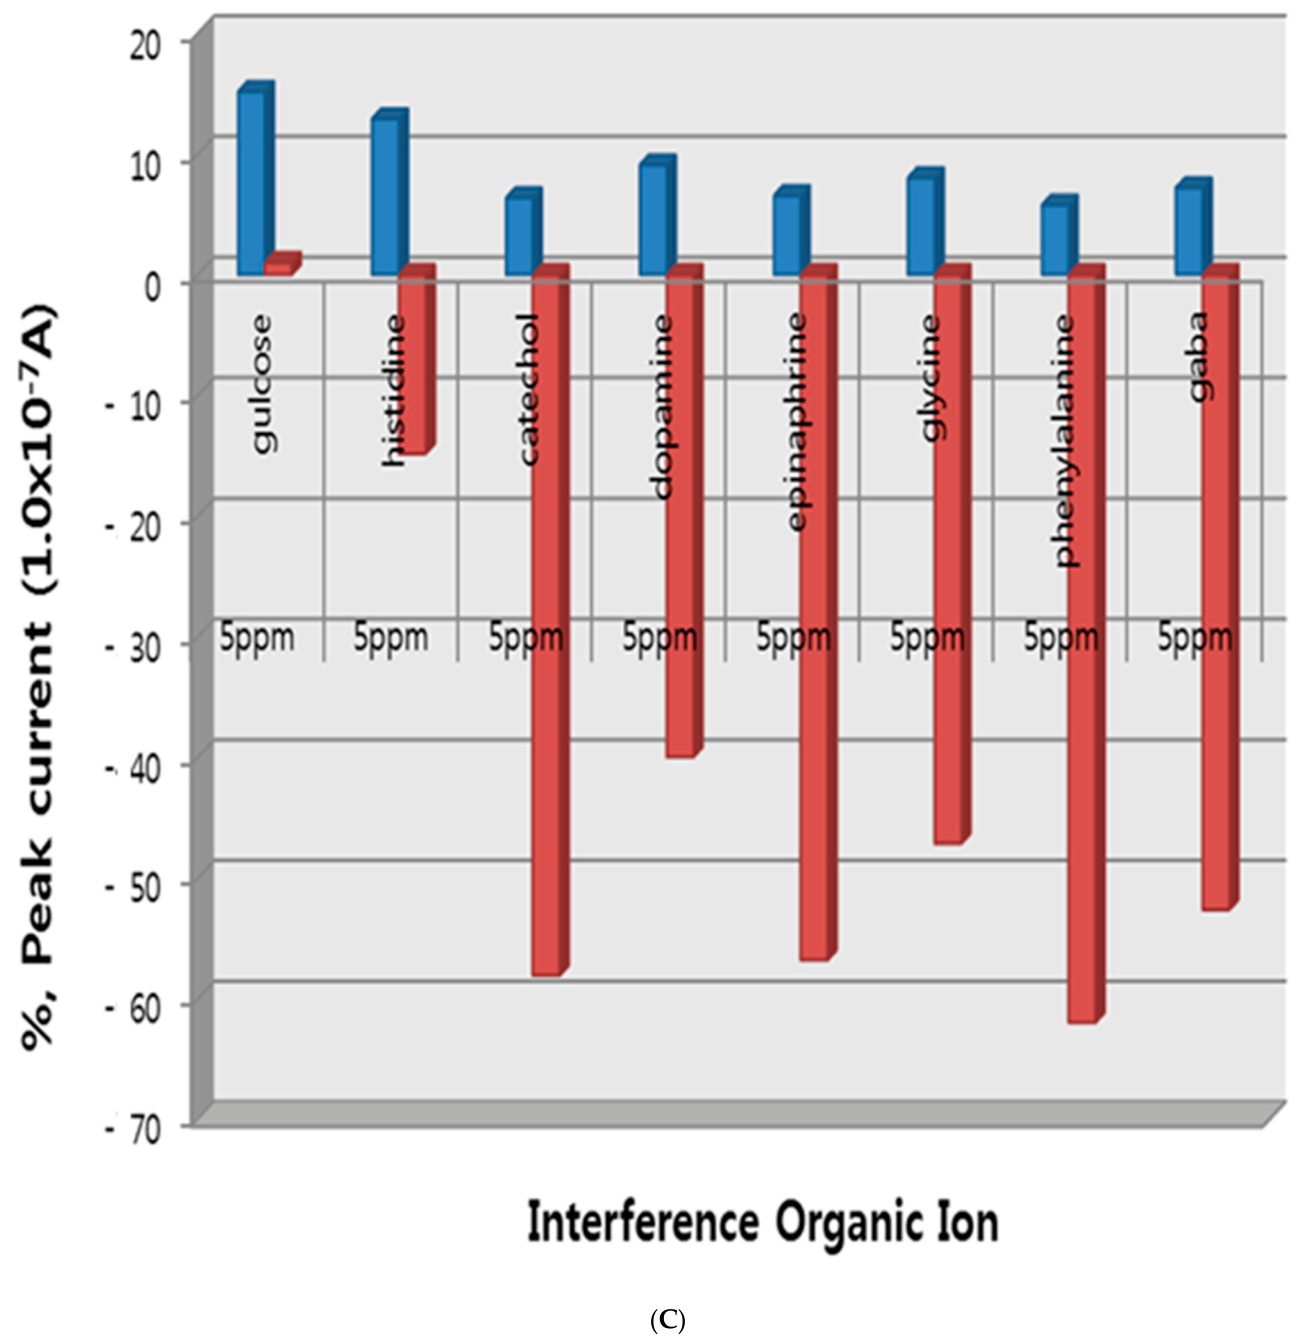
In Figure 3A, the first curve is shown to have a 100 s accumulation time and an electrolyte blank. In this experiment, 100 s was used to reduce the experimental time. The peak current clearly appeared at around 0.1 V and regularly grew henceforth. The graph is also close to a straight line because each signal gradually increased within the range of 5.11–12.33 × 10⁻⁶ A. The linear equation is attached to the figure. Additionally, the relative standard deviation is also attached. Therefore, the diagnostic error was extremely small. Also, there was no interference error. In Figure 3B, glucose was also detected in the lower 0.5 μgL−1detection limits in the subsequent examination. The last concentration examination was carried out in the mgL−1 concentration. The deposition time was 200 s. Micro ranges were recognized, which can be applied to in vivo fish brain at real or in vitro cells. After the completion of all the concentration tests, analogy interference tests were carried out. In Figure 3C, the deposition time for such tests was 50 s. In this experiment, 50 s was used to reduce the experimental time, and the reagents that were used were histidine, catechol, dopamine, epinephrine, glycine, phenylalanine, and gaba, in the ratio of 5:5 mgL−1. The reagents influenced the concentration of glucose by 100%, −14.84%, −58.08%, −39.97%, −56.81%, −47.14%, −61.98%, and −52.63%, respectively. Phenylalanine had the strongest effect on glucose. The presence of other ions was also effectively corrected using standard addition methods.

3.4. Statistics and Application

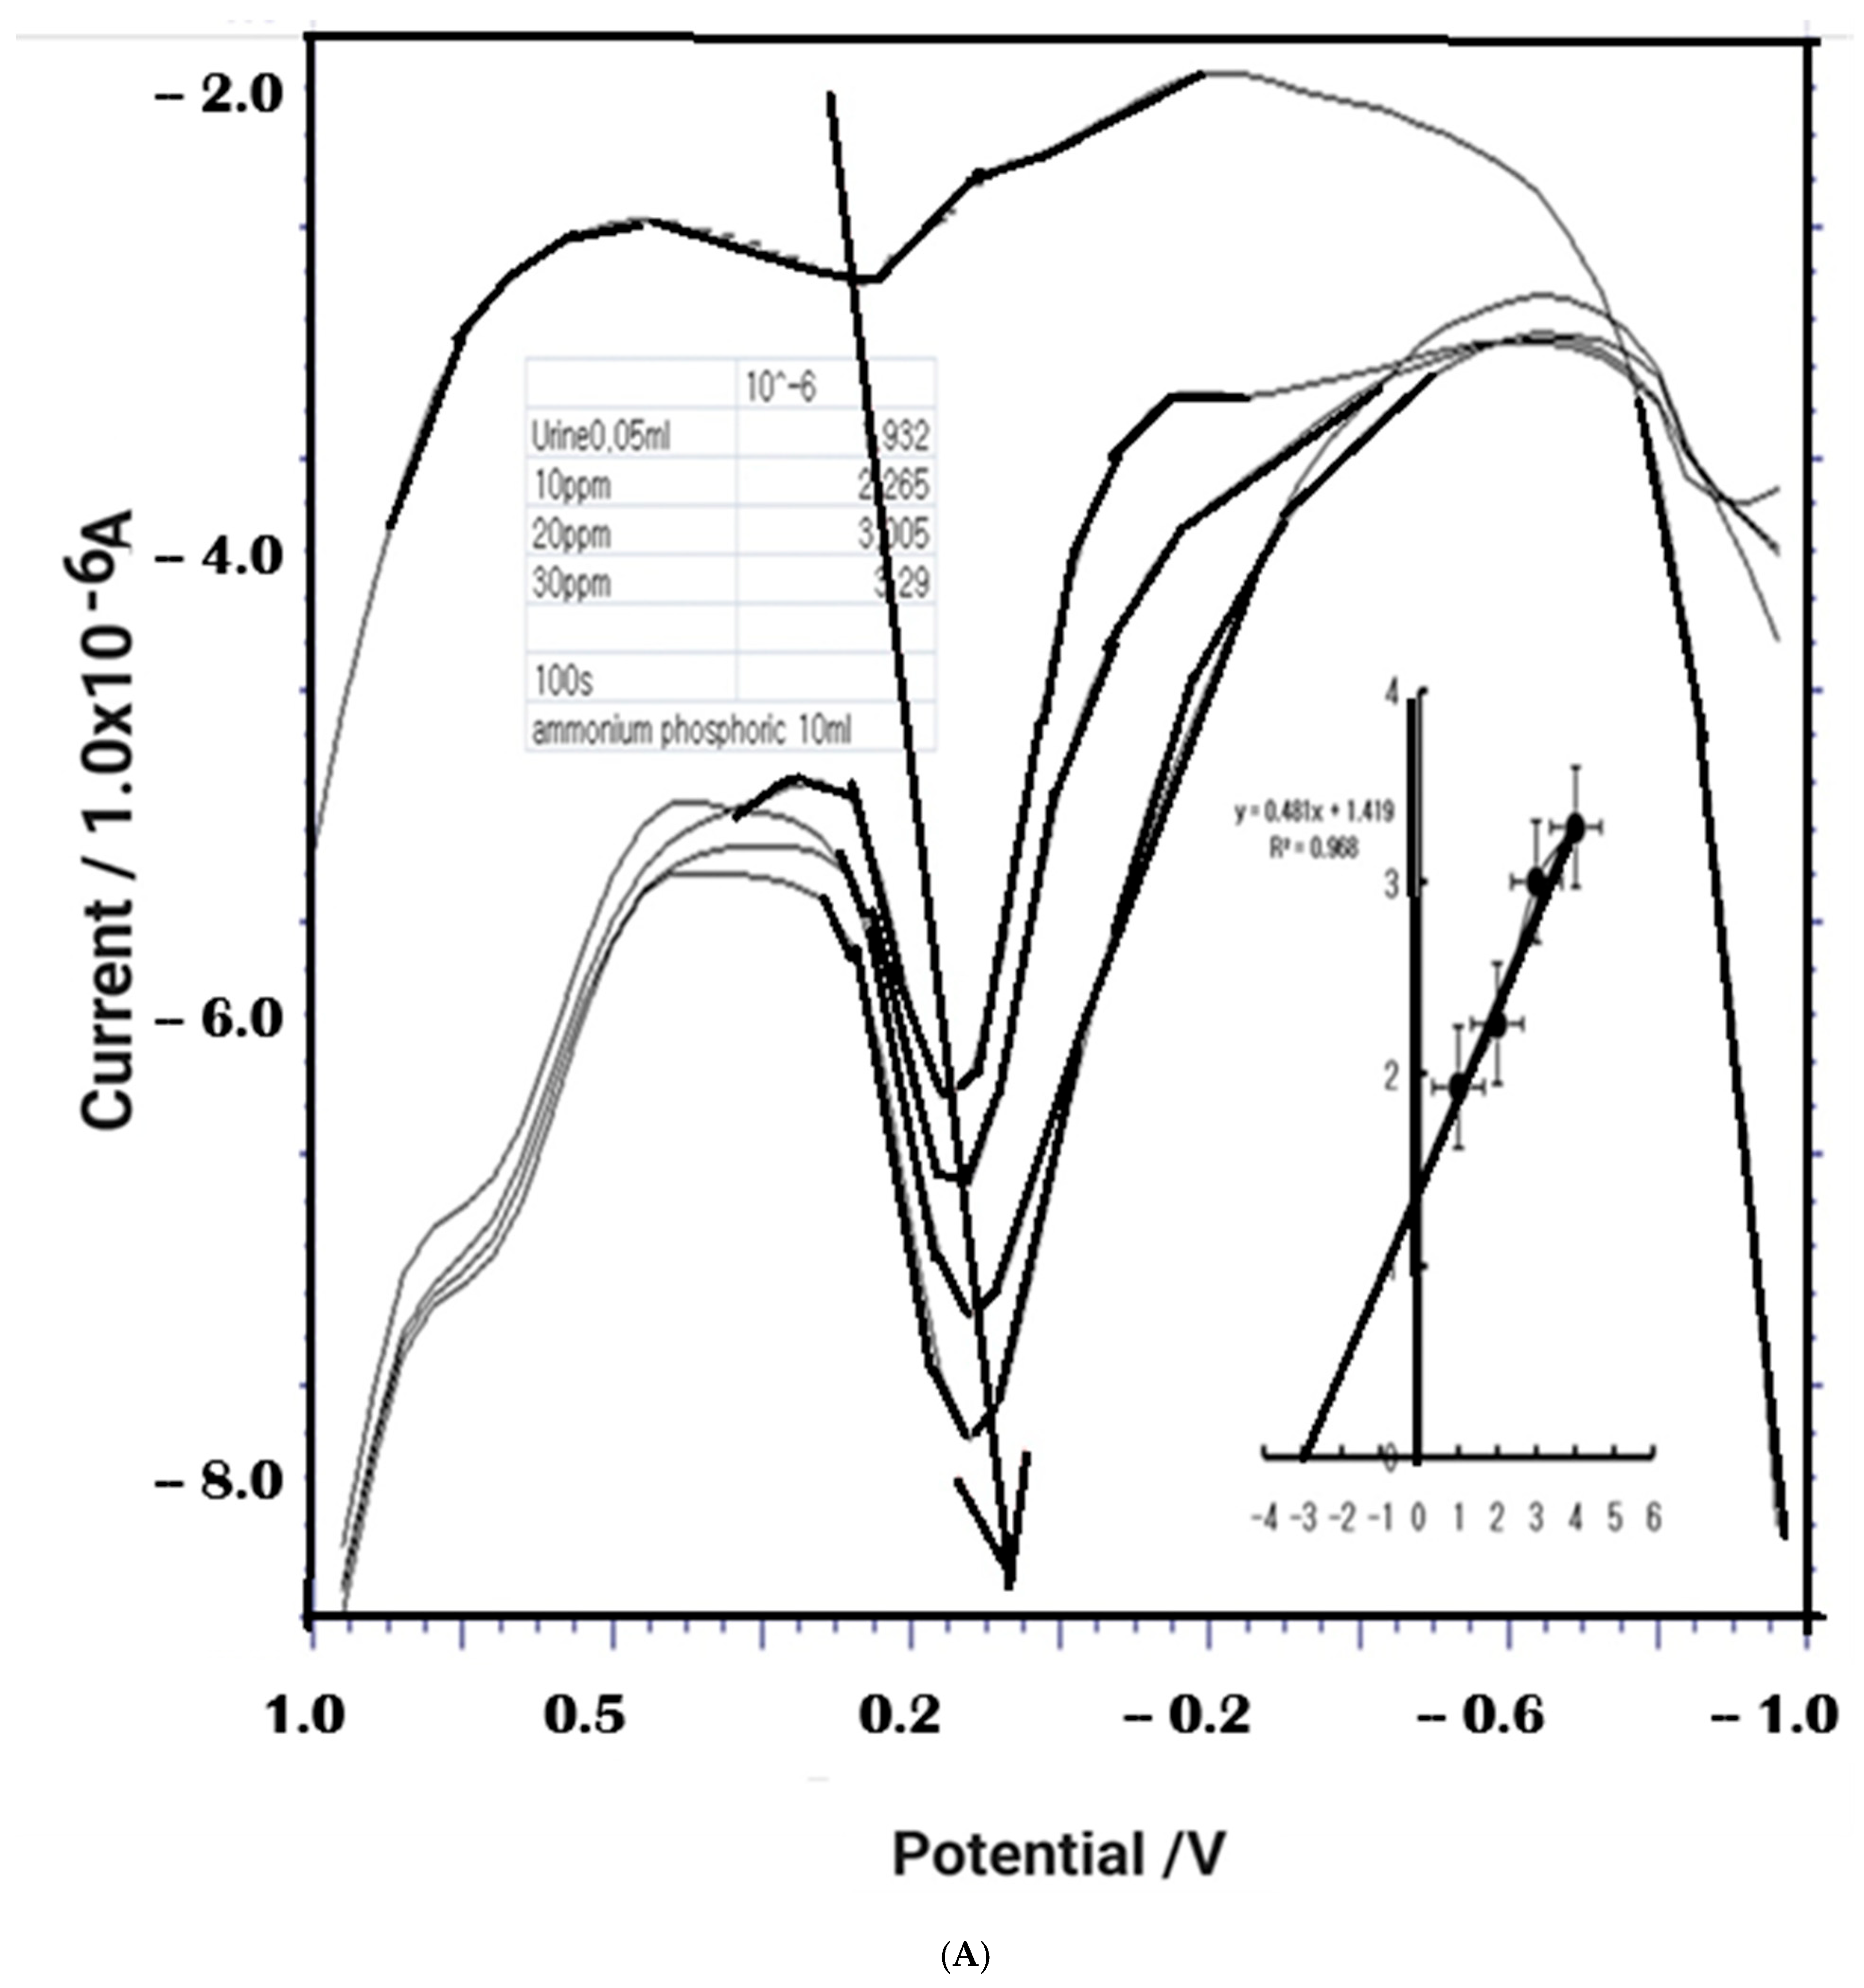
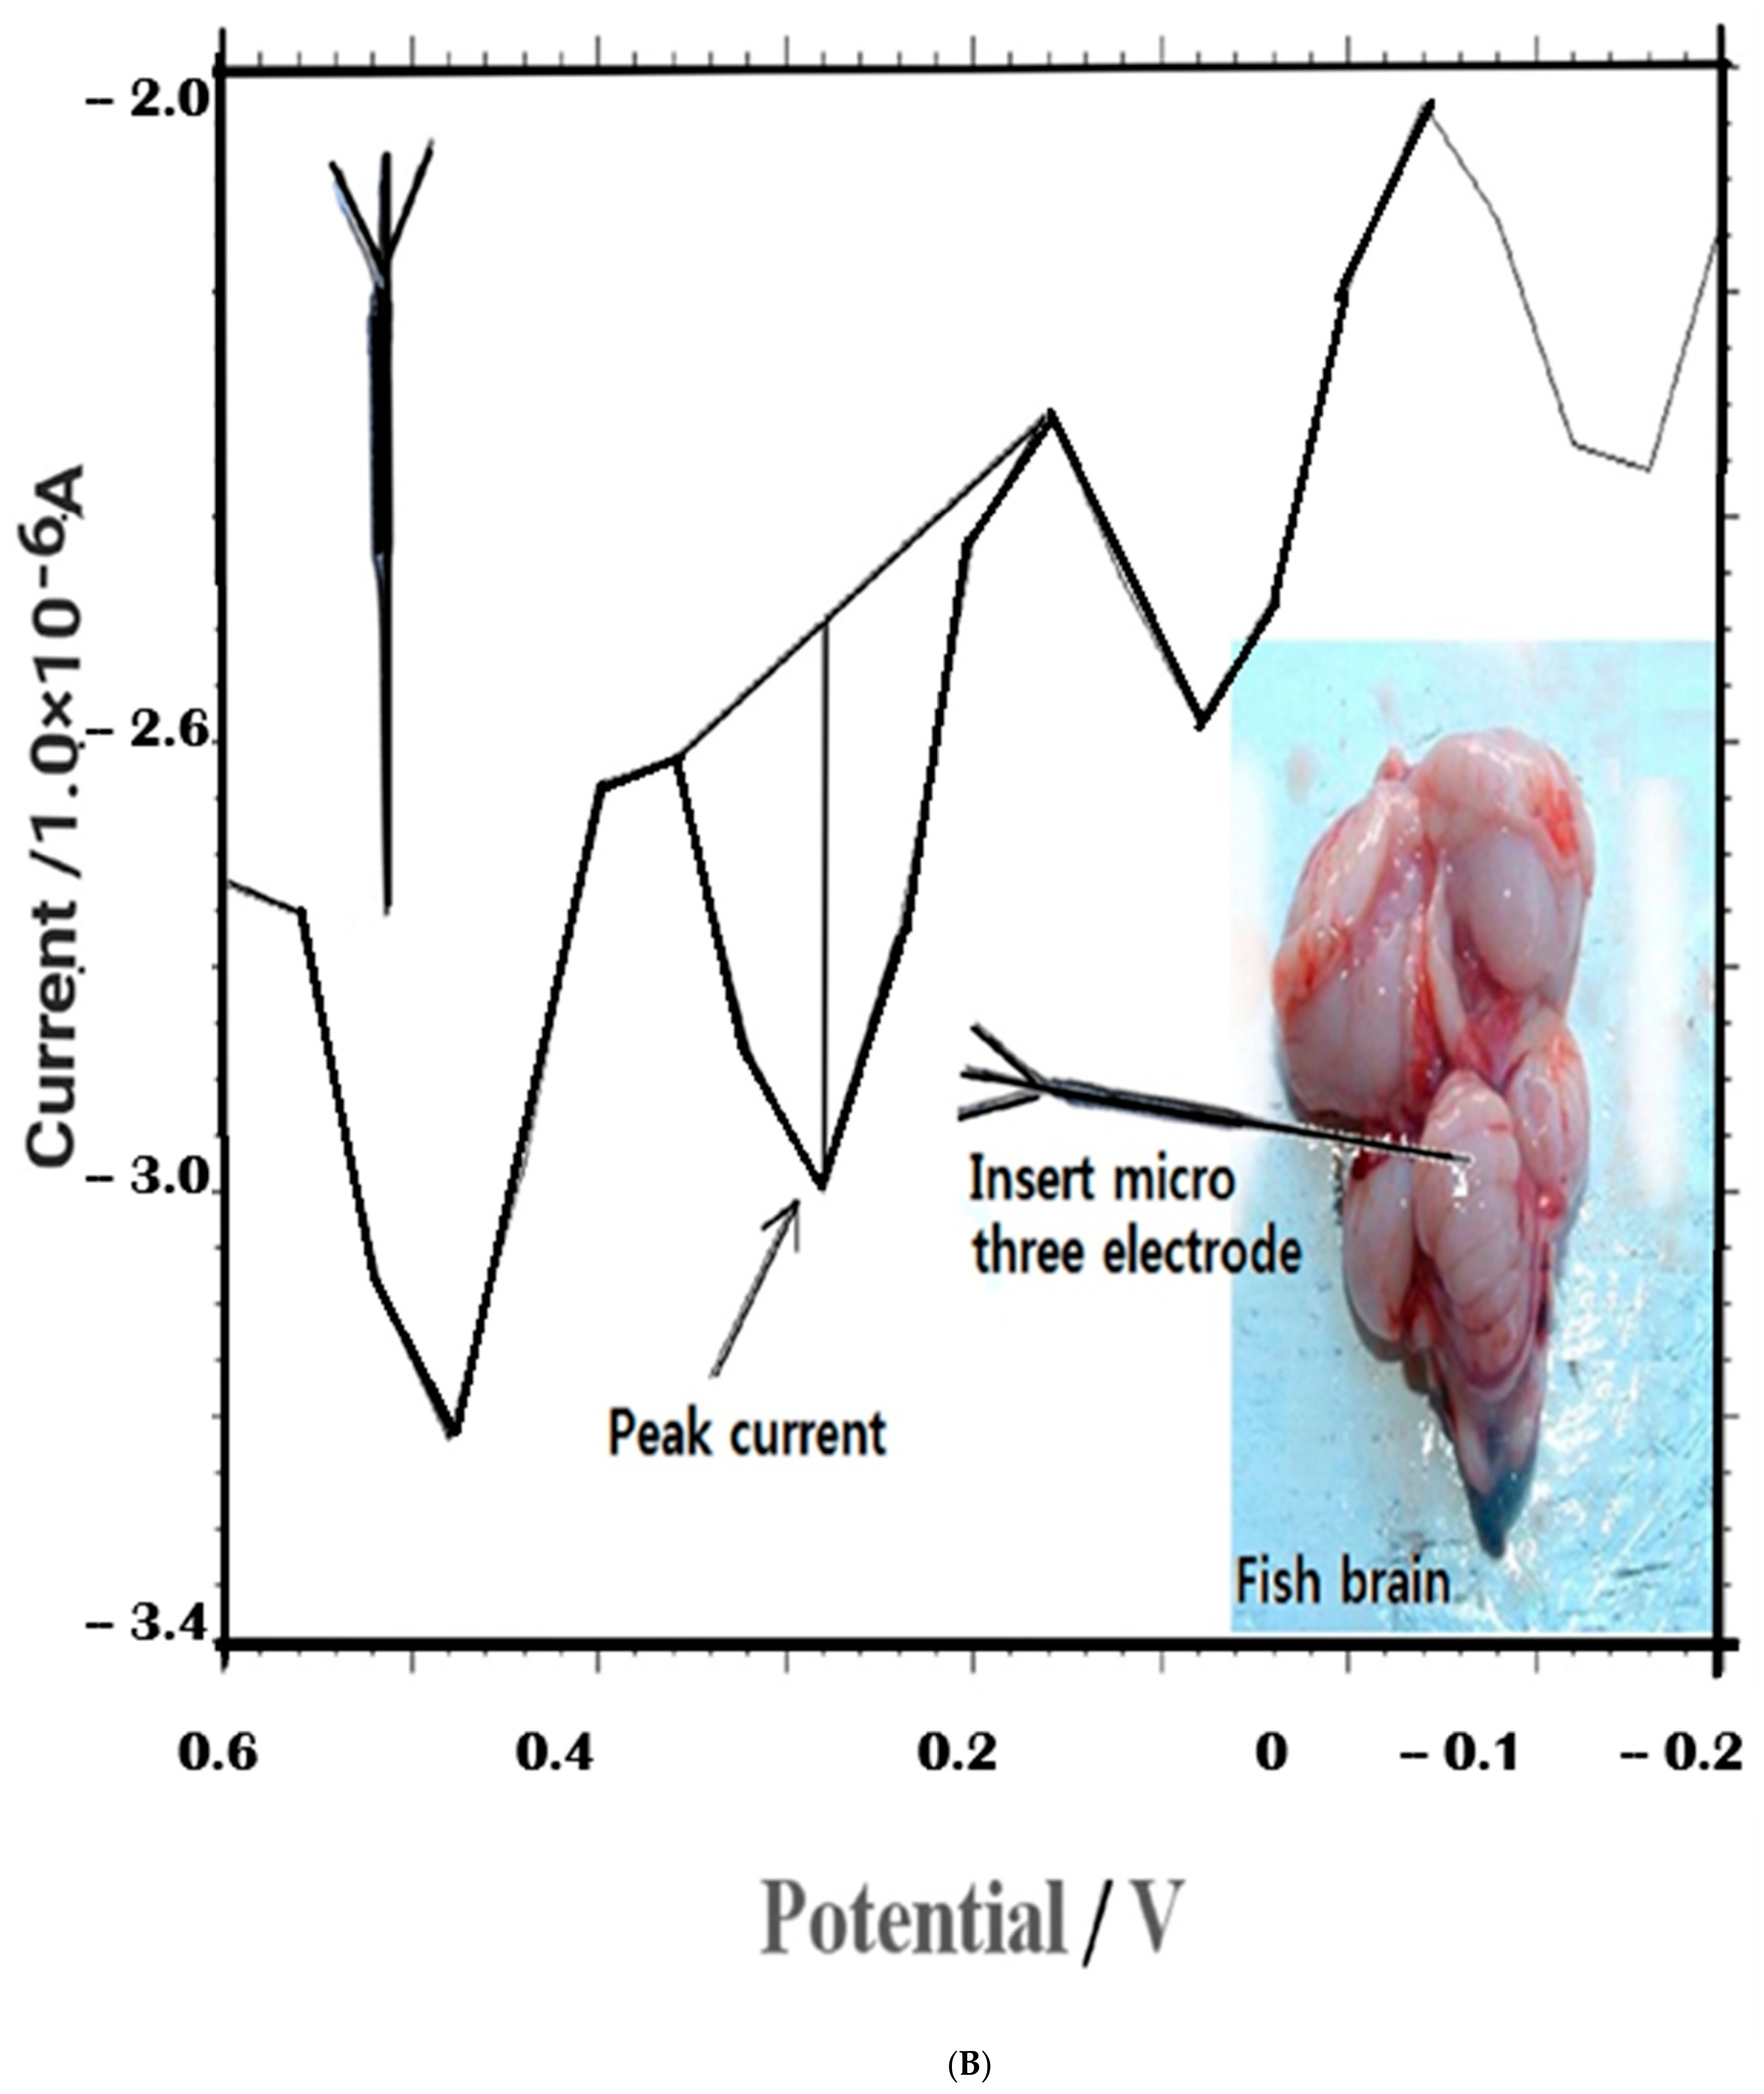
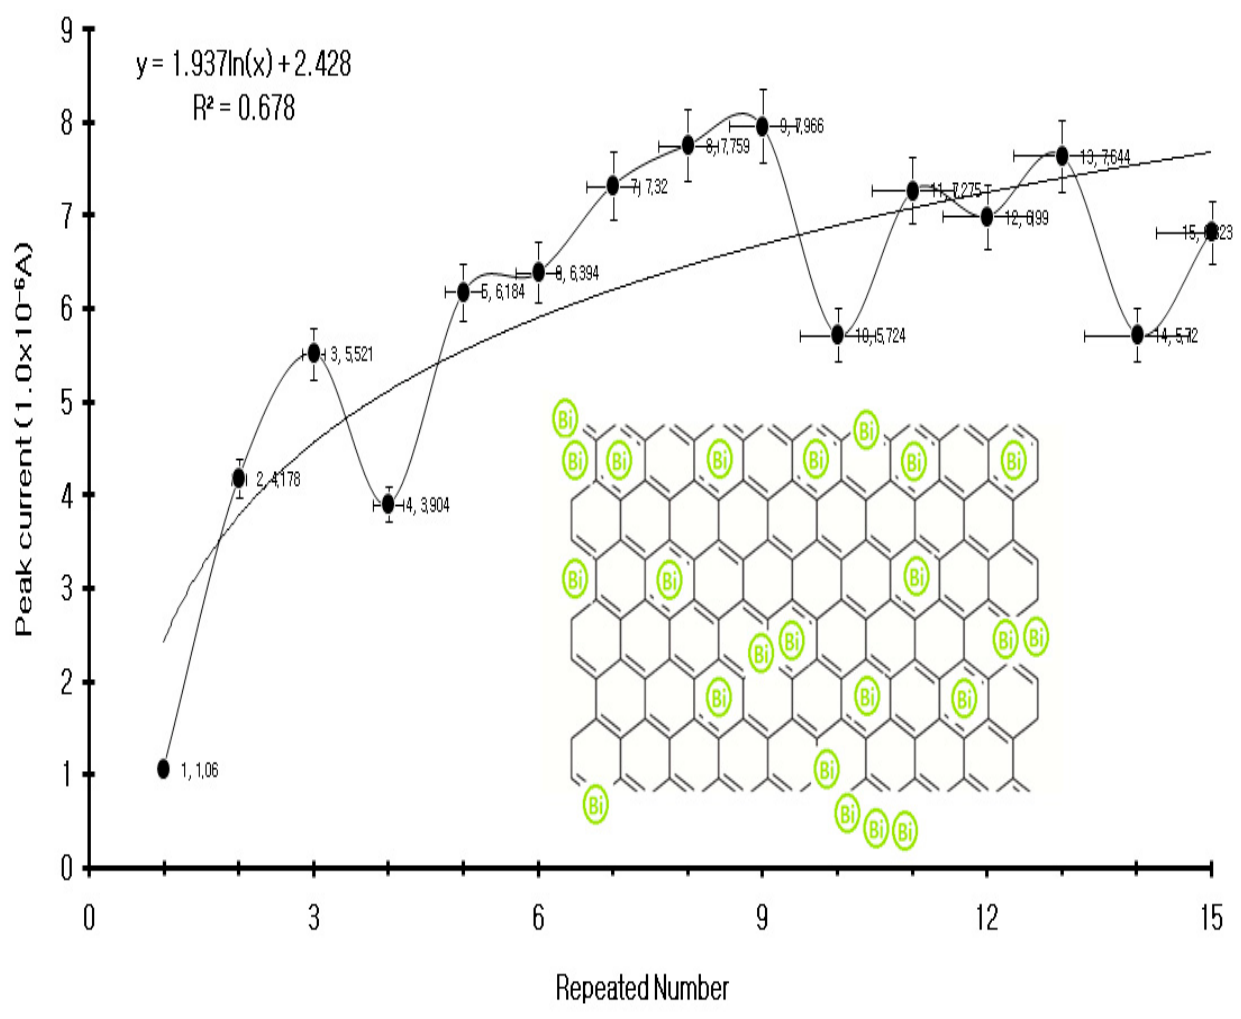
Before the experiments shown in Figure 4A were conducted, glucose detection statistics were obtained. At first, detection was performed in 0.1 M ammonium phosphoric electrolyte acid without any glucose, with a deposition time of 50 s as blank. After that, a 1000 mgL−1 glucose solution of 10 mgL−1 was spiked, and glucose was examined 15 times, with a deposition time of 50 s. These statistics were gathered to prove that the response of BCE was effective through RSD. The peak current signal clearly appeared at −0.1 V and grew closely and in an orderly way. According to this experiment, the RSD was 0.02. The last experiments were applications of this study. Figure 4A shows the human-urine result. Blank solutions are shown, which manifest that no noise signal was obtained and that glucose peak currents were obtained. First of all, human urine’s peak currents were checked. The peak current of the 0.05 mL urine appeared at around 0.1 V, and whenever a 10 ppm reagent was added, the peak current was rechecked. After the addition of a reagent, the peak current check was calibrated three times shown by the graph, the peak currents grew one after the other. This first application experiment result shows peak currents of 1.932, 2.265, 3.005, and 3.290 × 10⁻⁶ A. Therefore, glucose can be easily detected by using a small amount of urine. The human urine experiment was conducted five times to confirm only qualitative analysis. The error range was 0.5%. Also Figure 4A shows the representative experimental results. At this time, the standard deviation was confirmed as R2 = 0.0988, slope = 2.062, y-axis intercept = 6.496, and average content = 80 μg/L. However, it was not compared with other standard equipment for quantitative analysis. It is possible to reach the μg/L level by comparing chromatography, mass spectrometry, neutralization titration analysis, etc. Therefore, a complex equipment comparison was not conducted. The next test involved the application of plant cells for in vivo implanted sensors, as shown in Figure 4B. This figure shows the one whose peak currents grew the most in many of the tests. The graph also grew at the same position (around 0.1 V and 0.25 V). This experiment was carried out by putting an electrode in the plant cell and fish brain. This test can also detect glucose very precisely at between 0.1 and 0.2 V. In the in vivo experiment, there was a +0.5 V shift due to the pH change. Since the pH shift is a change in hydrogen ion concentration, a voltage shift can occur. Herein, glucose was very easily detected in fish and plant tissue even with a very small solution amount. A statistical test of sensor reproducibility and repeated error is shown in Figure 5. Ammonium phosphate 10 mL electrolyte buffer was used, 25 °C room temperature, and 1ppb glucose spike, electrolyte pH = 4.79, accumulation stripping time = 50 s was used, at the same solution was repeated 15 times. Linear equation: y = 1.937ln (x) + 2.428, relative standard deviation R2 = 0.678, and error range for each measurement is shown in the figure. Therefore, it can be seen that the sensor can be used repeatedly and continuously for several days. The fabricated sensor can be used continuously for three weeks at room temperature. If washed with distilled water and stored, it can be reused for up to three months.
Results of in vivo detection applications from our lab include the following: Amplification circuit: A coin-sized microcircuit was fabricated and programmed for quantitative Y-axis current, and qualitative X-axis potential on a 2D plane [26]. Extraction of aquatic poisons: Puffer fish tetrodotoxin extraction experiment, the puffer fish liver was extracted and purified five times, repeated recrystallization was extracted up to the 10−6 impurity level, and animal nerve anesthesia for toxicity application tests of the purified product was confirmed [27]. Oculus 3D glasses monitor control: It was linked with self-made Oculus monitor glasses. Designed with a portable 10-volt built-in battery and Virtual in vivo micro diagnostics [28] and Mimic skin tattoo sensors [29]: Here, related research is applied technology [30,31,32,33] that has already been published in papers. These are summarized in the results.
Therefore, it shows that the diagnosis and treatment of disease can be predicted on one’s own. This study was applied based on an already published paper [23,24,25]. A comparison of detection limits of existing methods is shown in Table 1 and the reference.

3.5. Application of Skin Tattoo Circuits, and Future Prospects

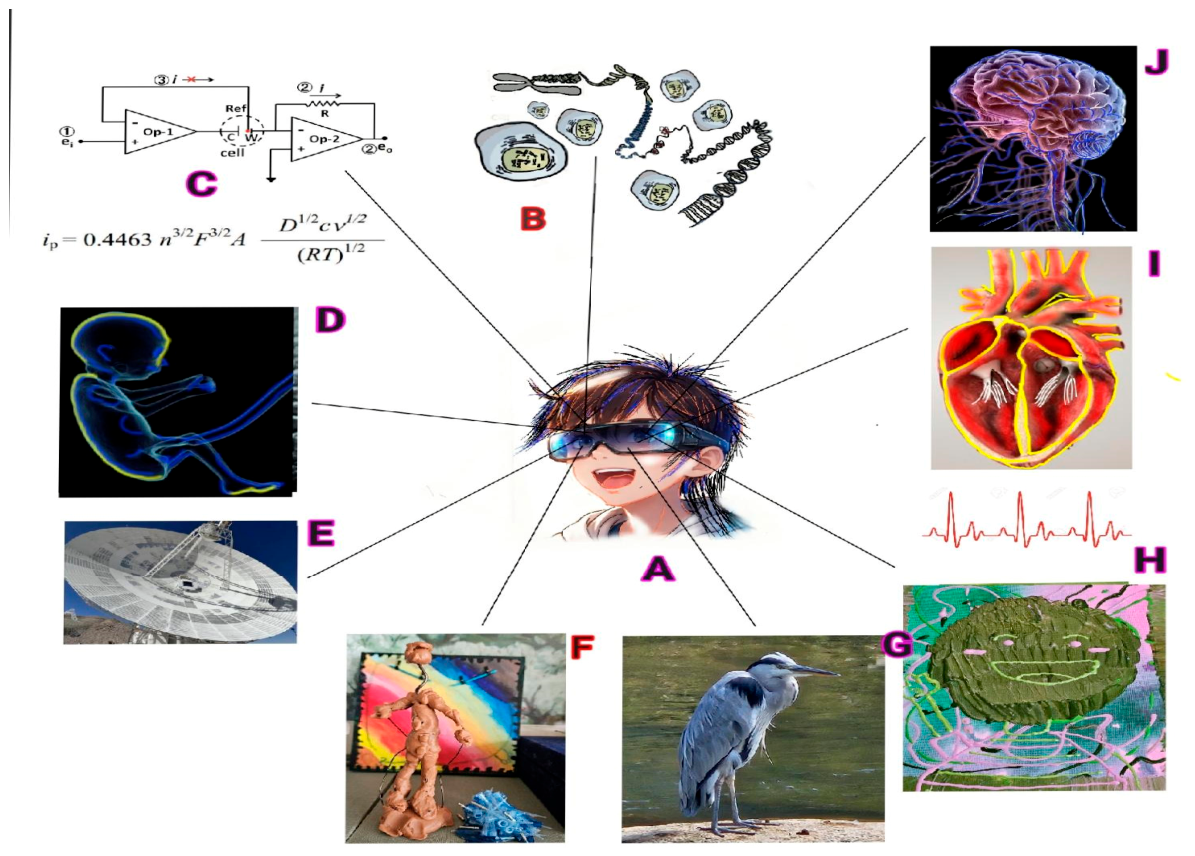
An applicable example picture is illustrated in Figure 6. Also, the A~J application displays the paper pictures already applied by our research team, and the literature was not marked to avoid duplicate citations.

4. Conclusions

The developed methods were fabricated with bismuth-immobilized carbon nanotube paste electrodes using square-wave stripping voltammetry. Which bismuth–carbon nanotube synthesis is known to have a great catalytic effect through the following experiments, such as scanning, transmission electron microscopy (SEM, TEM) [30], X-ray photoelectron spectroscopy (XPS) [31], energy dispersive X-ray (EDX) [32], FT IR [33]. This type of spectroscopic diagnosis has disadvantages such as complex design, large volume structure, long experimental time, and expensive analysis equipment. However, here paste modified method is very sensitive, because it does not need pretreatment and diverse equipment. Also, it has the advantage of being fast in diagnosis, small in equipment, requiring no advanced skills, and allowing anyone to perform detection in an instant. Thus, the test para conditions was carried out at an accumulation time of 350 s, at an amplitude of 0.25 V, at a frequency of 1000 Hz, and at a step potential of 0.04 V. The electrode response was linearly related to the glucose concentration, which ranged from 10–80 μgL−1 to 10–130 ngL−1 and 10–90 mgL−1. The peak currents reached the maximum at a phosphate buffer electrolyte solution pH of 4.8, and various interference ions were removed using standard addition methods. As the method that was used in this study had a lower detection limit, the analytical applications of human urine, fish cell, and plant tissue were examined. The proposed method can also be applied in other fields requiring glucose detection. Additionally, an artificial skin tattoo sensor was used in the manufactured circuit, and we used wearable circuits. Therefore, it has become possible to diagnose and treat oneself anytime, anywhere, regardless of time and space. In addition, program control was designed so that physical examination results can be judged at the level of an artificial intelligence doctor of medicine. Which can be usable for oculus glasses monitor control.

Author Contributions

S.Y.L.: An electrochemical optimization experiment was performed and K.L., K.J.C., J.P.: Sentence writing, graphic production, reference exploration, performed and approved the final manuscript. All authors have read and agreed to the published version of the manuscript.

Funding

This research received no external funding.

Institutional Review Board Statement

The animal study protocol was approved by the Animal Ethics Committee of the Biosensor Research Institute, Seoul National University of Science and Technology (protocol code: SNUT.BIO.2014.02 and date of approval: 1 February 2014). All experiments were performed according to established guidelines for ethical use.

Informed Consent Statement

Not applicable.

Data Availability Statement

The original contributions presented in this study are included in the article material. Further inquiries can be directed to the corresponding author.

Conflicts of Interest

The authors declare no conflicts of interest.

Abbreviations

SWAVsquare-wave anodic stripping voltammetry
BCEbismuth-immobilized carbon nanotube paste electrode
CNTcarbon nanotube
NIRnear-infrared

References

  1. Zhu, H.; Zhao, Y.; Mi, M.; Zhang, Q.; Fu, X.; Zheng, Y.; Qin, G.; Pan, L.; Bao, N. Effects of glucose release kinetics of extruded-maize diet on energy utilization of growing pigs. Anim. Feed Sci. Technol. 2023, 304, 115747. [Google Scholar] [CrossRef] [Scilit]
  2. Huang, C.; Zhang, M.; Li, C. A novel non-enzymatic electrochemical glucose sensors based on graphene oxide nanoribbons: Tracking energy expenditure and nutritional intake in sports. Alex. Eng. J. 2024, 89, 184–194. [Google Scholar] [CrossRef] [Scilit]
  3. Ren, W.; Chen, J.; Wang, W.; Li, Q.; Yin, X.; Zhuang, G.; Zhou, H.; Zeng, W. Sympathetic nerve-enteroendocrine L cell communication modulates GLP-1 release, brain glucose utilization, and cognitive function. Neuron 2024, 112, 972–990. [Google Scholar] [CrossRef] [Scilit] [PubMed]
  4. Zhu, Q.; Du, J.; Li, Y.; Qin, X.; He, R.; Ma, H.; Liang, X. Downregulation of glucose-energy metabolism via AMPK signaling pathway in granulosa cells of diminished ovarian reserve patients. Gene 2025, 933, 148979. [Google Scholar] [CrossRef] [Scilit] [PubMed]
  5. Zhang, F.; Tian, J.; Wang, L.; He, P.; Chen, Y. Correlation between cell growth rate and glucose consumption determined byelectrochemical monitoring. Sens. Actuators B Chem. 2011, 156, 416–422. [Google Scholar] [CrossRef] [Scilit]
  6. Graaf, R.A.; Dijkhuizen, R.M.; Biessels, G.J.; Braun, K.P.J.; Nicolay, K. In Vivo Glucose Detection by Homonuclear Spectral Editing. Magn. Reson. Med. 2000, 43, 621–626. [Google Scholar] [CrossRef] [Scilit] [PubMed]
  7. Vojinovic, V.; Azevedo, A.M.; Martins, V.C.B.; Cabral, J.M.S.; Gibson, T.D.; Fonseca, L.P. Assay of H2O2 by HRP catalysed co-oxidation of phenol-4-sulphonic acid and 4-aminoantipyrine: Characterisation and optimisation. J. Mol. Catal. B Enzym. 2004, 28, 129–135. [Google Scholar]
  8. Cortacero, S.R.; Segura, A.C.; Cruces, C.B.; Hernainz, M.B.C.; Fernandez, A.G. Analysis of carbohydrates in beverages by capillary electrophoresis with precolumn derivatization and UV detection. Food Chem. 2004, 87, 471–476. [Google Scholar] [CrossRef] [Scilit]
  9. Chávez-Servín, J.L.; Castellote, A.I.; López-Sabater, M.C. Analysis of mono- and disaccharides in milk-based formulae by high-performance liquid chromatography with refractive index detection. J. Chromatograpy 2004, 1043, 211–215. [Google Scholar] [CrossRef] [Scilit]
  10. Maruo, K.; Tsurugi, M.; Chin, J.; Ota, T.; Arimoto, H.; Yamada, Y.; Tamura, M.; Ishii, M.; Ozaki, Y. Noninvasive Blood Glucose Assay Using a Newly Developed Near-Infrared System. IEEE J. Sel. Top. Quant. 2003, 9, 322–330. [Google Scholar] [CrossRef] [Scilit]
  11. PuigLleixa, C.; Jimenez, C.; Bartroli, J. Acrylated polyurethane Ð photopolymeric membrane for amperometric glucose biosensor construction. Sens. Actuators B Chem. 2001, 72, 56–62. [Google Scholar]
  12. Yeo, I.H.; Johnson, D.C. Anodic response of glucose at copper-based alloy electrodes. J. Electroanal. Chem. 2000, 484, 157–163. [Google Scholar] [CrossRef] [Scilit]
  13. Yeo, I.H.; Johnson, D.C. Electrochemical response of small organic molecules at nickel–opper alloy electrodes. J. Electroanal. Chem. 2001, 495, 110–119. [Google Scholar] [CrossRef] [Scilit]
  14. Galán-Vidal, C.A.; Muñoz, J.; Domínguez, C.; Alegret, S. Glucose biosensor based on a reagentless graphite-epoxy screen-printable biocomposite. Sens. Actuators B Chem. 1997, 45, 55–62. [Google Scholar] [CrossRef] [Scilit]
  15. Pandey, P.C.; Upadhyay, S.; Pathak, H.C. A new glucose sensor based on encapsulated glucose oxidase within organically modified sol-gel glass. Sens. Actuators B Chem. 1999, 60, 83–89. [Google Scholar] [CrossRef] [Scilit]
  16. Suye, S.; Matsuura, T.; Kimura, T.; Zheng, H.; Hori, T.; Amano, Y.; Katayama, H. Amperometric DNA sensor using gold electrode modified with polymerized mediatorby layer-by-layer adsorption. Microelectron. Eng. 2005, 81, 441–447. [Google Scholar] [CrossRef] [Scilit]
  17. Chuang, C.L.; Wang, Y.J.; Lan, H.L. Amperometric glucose sensors based on ferrocene-containing B-polyethylenimine and immobilized glucose oxidase. Anal. Chim. Acta 1997, 353, 37–44. [Google Scholar] [CrossRef] [Scilit]
  18. Kay, H.A.; Won, S.K.; Young, S.P.; Jeong, M.M.; Dong, J.B.; Seong, C.L.; Young, S.L.; Young, H.L. Electrochemical Properties of High-Power Supercapacitors Using Single-Walled Carbon Nanotube Electrodes. Adv. Funct. Mater. 2001, 11, 387–392. [Google Scholar]
  19. Eugenii, K.; Itamar, W. Biomolecule-Functionalized Carbon Nanotubes: Applications in Nanobioelectronics. ChemPhysChem 2004, 5, 1084–1104. [Google Scholar] [CrossRef] [Scilit]
  20. Shoemaker, E.L.; Choong, U.K.; Vogt, M.C. CO2 sensing mechanisms of an electrocatalytic sensor based on a tungsten-stabilized bismuth oxide solid electrolyte and cyclic voltammetry measurement techniques. Sens. Actuators B Chem. 2005, 110, 89–100. [Google Scholar] [CrossRef] [Scilit]
  21. Emily, A.H.; Samo, B.H.; Lea, M.; Bozidar, O. Bismuth film electrode for anodic stripping voltammetric determination of tin. Anal. Chim. Acta 2006, 580, 244–250. [Google Scholar] [CrossRef] [Scilit]
  22. Gunther, W.; Axel, S.; Rudiger, S.; Gerhard, W. Glucose oxidation at bismuth-modified platinum electrodes. J. Electroanal. Chem. 1998, 444, 61–73. [Google Scholar] [CrossRef] [Scilit]
  23. Cho, I.H.; Choi, K.J.; Kim, J.H.; Lee, K.; Ly, S.Y. Analysis of Staphylococcus aureus Molecules in Non-Treated Blood Using Mercury Immobilized Carbon Nanotube Sensor. Molecules 2022, 27, 1837. [Google Scholar] [CrossRef] [Scilit] [PubMed]
  24. Lee, K.; Kim, D.H.; Jun, S.; Oh, Y.; Oh, Y.J.; Lee, S.J.; Kim, K.; Ly, S.Y. Diagnostic In Vivo Sensing of COVID-19 Antibody Detection Using DNA-Linking Graphene Oxide Synthetic Mimic Skin Tattoo Probes. Microorganisms 2025, 13, 354. [Google Scholar] [CrossRef] [Scilit] [PubMed]
  25. Ly, S.Y.; Heo, H.J.; Kim, M.J. Real Time Analysis of Neurotransmitters in the Brain Using a Micro-Electrode. Curr. Neurovasc. Res. 2010, 7, 32–38. [Google Scholar] [CrossRef] [Scilit] [PubMed]
  26. Lee, K.; Jun, S.; Oh, Y.; Lee, S.; Oh, Y.J.; Kim, K.S.; Young, S. Pathological In Vivo Analysis of Helicobacter DNA Infection in Stomach Cells Using Carbon Nanotube Microsensor. Microorganisms 2024, 12, 2531. [Google Scholar] [CrossRef] [Scilit] [PubMed]
  27. Hong, H.J.; Ly, S.Y. Voltammetric Detection of Tetrodotoxin Real-Time In Vivo of Mouse Organs using DNA-Immobilized Carbon Nanotube Sensors. Curr. Anal. Chem. 2019, 15, 567–574. [Google Scholar] [CrossRef] [Scilit]
  28. Ly, S.Y.; Lee, C.; Kim, Y.J.; Won, M.J.; Jun, S.Y.; Hwang, Y.J.; Kim, S.K.; Lee, S.J.; Lee, K. In-Vivo Assay of Escherichia coli Microorganisms in a Live Organ Using Voltammetric Microprobe. Int. J. Curr. Microbiol. Appl. Sci. 2019, 8, 231–240. [Google Scholar] [CrossRef] [Scilit]
  29. Kim, D.H.; Choi, J.; Park, H.J.; Kim, J.S.; Lee, K.; Ly, S. Virtual Rapid Sensing of COVID-19 Virus Antibodies in Patients Blood by Using Platinized Antigen Linking Graphene Probe. Biomed. J. Sci. Tech. Res. 2022, 42, 34021–34028. [Google Scholar] [CrossRef] [Scilit]
  30. Bielicka–Giełdon, A.; Wilczewska, P.; Paszkiewicz, M.; Malankowska, A.; Szczodrowski, K.; Ryl, J.; Siedlecka, E.M. Effect of multi-walled carbon nanotubes properties on the photocatalytic activity of bismuth-based composites synthesised via an imidazolium ionic liquid. Appl. Surf. Sci. 2024, 663, 160214. [Google Scholar] [CrossRef] [Scilit]
  31. Verma, S.; Mili, M.; Sharma, C.; Bajpai, H.; Pal, K.; Qureshi, D. Advanced X-ray shielding and antibacterial smart multipurpose fabric impregnated with polygonal shaped bismuth oxide nanoparticles in carbon nanotubes via green synthesis. Green Chem. Lett. Rev. 2021, 30, 272–285. [Google Scholar] [CrossRef] [Scilit]
  32. Hwang, J.-Y.; Kumar, R.; Kim, H.M.; Alfaruqi, M.H.; Kim, J.; Sun, Y. Investigation of K-ion storage performances in a bismuth sulfide-carbon nanotube composite anode. RSC Adv. 2020, 10, 6536–6539. [Google Scholar] [CrossRef] [Scilit] [PubMed]
  33. Chipeture, A.T.; Apath, D.; Moyo, M.; Shumba, M. Multiwalled carbon nanotubes decorated with bismuth (III) oxide for electrochemical detection of an antipyretic and analgesic drug paracetamol in biological samples. J. Anal. Sci. Technol. 2019, 10, 22. [Google Scholar] [CrossRef] [Scilit]
  34. Zheng, W.; Han, B.; Siyu, E.; Sun, Y.; Li, X.; Cai, Y.; Zhang, Y.-N. Highly-sensitive and reflective glucose sensor based on optical fiber surface plasmon resonance. Microchem. J. 2020, 157, 105010. [Google Scholar] [CrossRef] [Scilit]
  35. Mittelmaier, S.; Funfrocken, M.; Fenn, D.; Fichert, T.; Pischetsrieder, M. Identification and quantification of the glucose degradation product glucosone in peritoneal dialysis fluids by HPLC/DAD/MSMS. J. Chromatogr. B Anal. Technol. Biomed. Life Sci. 2010, 878, 877–882. [Google Scholar] [CrossRef] [Scilit]
  36. Gao, Y.; Zhang, C.; Yang, Y.; Yang, N.; Lu, S.; You, T.; Yin, P. A high sensitive glucose sensor based on Ag nanodendrites/Cu mesh substrate via surface-enhanced Raman spectroscopy and electrochemical analysis. J. Alloys Compd. 2021, 863, 158758. [Google Scholar] [CrossRef] [Scilit]
  37. Chen, C.; Ran, R.; Yang, Z.; Lv, R.; Shen, W.; Kang, F.; Huang, Z. An efficient flexible electrochemical glucose sensor based on carbon nanotubes/carbonized silk fabrics decorated with Pt microspheres. Sens. Actuators B Chem. 2018, 256, 63–70. [Google Scholar] [CrossRef] [Scilit]
  38. Tang, J.; Wei, L.; He, S.; Li, J.; Nan, D.; Ma, L.; Shen, W.; Kang, F.; Lv, R.; Huang, Z. A Highly Sensitive Electrochemical Glucose Sensor Based on Room Temperature Exfoliated Graphite-Derived Film Decorated with Dendritic Copper. Materials 2021, 14, 5067. [Google Scholar] [CrossRef] [Scilit] [PubMed]
Figure 1. Cyclic effects of BCE. (A) Various concentration effects of 0, 10, 20, and 30 mgL−1 glucose using cyclic voltammogram, The red circle is the glucose molecular structure and reduction peak. (CV) as graphite common pencil electrode. (B) BCE at a 0.5 V scan rate, in a 0.1 M ammonium phosphate electrolyte solution and extracted brain of fish. (C) Bismuth immobilized Carbon nanotube electrode and glucose layer redox titration reacting simulation picture.
Biophysica 06 00065 g001aBiophysica 06 00065 g001b
Figure 2. (A) SW anodic peak currents for the amplitude variations of 0.1, 0.15, 0.2, 0.25, 0.3, 0.35, 0.4, and 0.45 (V). (B) SW frequencies of 300, 400, 500, 600, 700, 800, 900, and 1000 (Hz). (C) SW step potentials of 0.005, 0.01, 0.015, 0.02, 0.025, 0.03, 0.035, and 0.04 (V). (D) SW accumulation times of 50, 100, 150, 200, 250, 300, 350, and 400 (s).
Biophysica 06 00065 g002aBiophysica 06 00065 g002bBiophysica 06 00065 g002cBiophysica 06 00065 g002d
Figure 3. (A) SW voltammograms of the 1, 2, 3, 4, 6, 8, 10, 12, and 14 mgL−1 variations. (B) Micro ranges of 10, 20, 40, 60, 80, 100, 120, and 140 μgL−1 with 100 s accumulation time and calibration curves, in deep brain fish at real, (C) Interference effects.
Biophysica 06 00065 g003aBiophysica 06 00065 g003bBiophysica 06 00065 g003c
Figure 4. (A) Analytical application of human-urine spike. (B) Assay of real-time live in vivo tissue.
Biophysica 06 00065 g004aBiophysica 06 00065 g004b
Figure 5. Ammonium phosphate 10 mL electrolyte pH = 4.79, buffer, 25 °C room temperature, 1 ppb glucose, accumulation stripping time = 50 s, repetition 15 times.
Biophysica 06 00065 g005
Figure 6. Application of the skin tattoo circuit. It can be linked with A to J application. A: Multi-tasking, multi-user analysis connected to the Oculus glasses monitor. Related applications are described in B to J. B: In vivo human DNA analysis, cell growth analysis, virus amplification analysis, antigen antibody redox neutralization reaction. C: Thermodynamic reaction of extinction of human cell growth depending on the Nernst equation. And computation, amplification, and simulation of semiconductor electronic circuit design. D: in vivo physiological response, fetal growth, blood movement, heart, stomach, colon, small intestine, activity, etc. E: In vivo, extracorporeal, radio signals, spectral energy ion amplification, cosmic energy wave redox amplification. F: Painting color spectroscopic energy art, sonic vibration energy analysis. G: Natural living environment, underwater living environment, redox environment. H: An energy analysis of the music waveform of science and art. I: Artificial heart. Artificial organ activity diagnosis. J: Brain waves, neurotransmitter ion amplification control.
Biophysica 06 00065 g006
Table 1. Comparison of different types of glucose sensors.
TypesLiner RangeDetection LimitSensitivityReference
Optical glucose sensor0–0.5 mg/mLNot reported85.4 mg/mL[34]
Liquid chromatography1.1–113.9/µM1.1 µMNot reported[35]
Raman sensor0.5–5.0 mM0.005 mMNot reported[36]
Electrochemical enzyme0–5.0 mM0.05 mM288.86 µA/mM/cm2[37]
Electrochemical0.025–1.0 mM0.68 µM23.237 mA/mM/cm2[38]
Non enzyme1.0–2.7 mM0.68 µM10.098 mA/mM/cm2[38]
This Modified method10–90 μg/L5.5 nM0.0781μg/L
Disclaimer/Publisher’s Note: The statements, opinions and data contained in all publications are solely those of the individual author(s) and contributor(s) and not of MDPI and/or the editor(s). MDPI and/or the editor(s) disclaim responsibility for any injury to people or property resulting from any ideas, methods, instructions or products referred to in the content.