Article

Computational Analysis of Microtubule-Mediated Saltatory Neuroelectrical Transmission: A Theoretical Exploration


Shenzhen Key Laboratory of Steroid Drug Discovery and Development, School of Medicine, The Chinese University of Hong Kong, Shenzhen 518172, China
*
Author to whom correspondence should be addressed.
Biophysica 2026, 6(4), 61; https://doi.org/10.3390/biophysica6040061
Submission received: 13 April 2026 / Revised: 11 June 2026 / Accepted: 30 June 2026 / Published: 10 July 2026
(This article belongs to the Topic New Insights into Cytoskeleton)

Abstract

It was recently postulated that neural microtubules (neuro-MTs), which are densely packed inside axons and dendrites, are vacuum cylindrical nanotubes that can mediate neuroelectrical transmission with a unique form of quasi-superconductivity. In this work, the behaviors of free electrons inside a theoretical neuro-MT are modeled using computational analysis and calculations. We reveal that neuro-MTs can function as nanosized physiological devices that mediate neuroelectrical transmission with a super-high energy efficiency in a quasi-superconducting manner. Under physiologically relevant conditions, the binding of cytosolic cations (e.g., K+ and Na+) to the surface residues of a neuro-MT triggers its transition from a resting state to an active state, and the rapid dissociation of these cations triggers the opposite. The dipole ring structures of a neuro-MT will help terminate the free electron conduction inside the vacuum tunnel with high efficiency. The proposed neuro-MT-mediated electrical transmission offers a potential mechanistic explanation for the saltatory conduction of action potentials along an axon or a dendrite. This theoretical exploration also offers unique insights into the rational design of biomimetic room-temperature quasi-superconducting materials, such as carbon or silicone-based quasi-superconducting nanotubes.

1. Introduction

The nervous system, the human brain in particular, conducts massive amount of neuroelectrical transmission nearly all the time, even during sleep. Distinct from artificial electronic hardware such as conventional computers, it seems that the biological neural systems rarely experience thermal overheating despite their persistent overwhelming amount of neuroelectrical activities. This remarkable thermal stability of the brain may be partly due to its unique anatomical structure and design which enable its super-effective dissipation of heat during neuroelectrical transmission. The other potential reason for this unique phenomenon may lie in the super energy efficiency during the process of neuroelectrical transmission. In recent years, an intriguing hypothesis was put forward which postulates that neuroelectrical transmission in the central nervous system may involve a mechanism of quasi-superconductivity occurring under physiological body temperature and in vivo conditions [1]. Should this hypothesis be proven correct, it will certainly provide a perfect explanation for the unique phenomenon (i.e., thermal stability) associated with brain neuroelectrical transmission.
The widely-accepted Bardeen–Cooper–Schrieffer (BCS) theory serves as the foundation and theoretical framework that accounts for superconducting behaviors of metallic and composite superconducting materials, which almost exclusively occur under extremely low cryogenic temperatures [2]. Complementing this traditional superconductivity theory, recently a thought-provoking hypothesis concerning the physical and micro-structural properties or requirements of superconducting materials was proposed [3]. It was postulated that for superconductivity (i.e., with zero electrical resistivity) to occur, the conductor must have nanosized straight vacuum tunnels inside with a radius size large enough to allow the passage of free conduction electrons (likely moving in a ballistic manner) without collisions with the composite atoms of the conductor. In addition, some of the composite atoms should be able to readily release free electrons to form the conduction band. The rationality of the proposed structural criterion is partially supported by some preliminary experimental observations available in the literature (discussed in ref. [3]). Furthermore, this theory offers a potential explanation for the emergent quasi-superconducting performance of silicone or carbon-based nanotubes and graphene sheets under highly specific physical conditions, as the intrinsic hollow vacuum cavities of these low-dimensional nanomaterials may enable nearly collision-free electron migration along the conduction axis [3].
The above hypothesis on the superconductivity structural requirements has also led to the speculation that the neuro-MTs, which are major structural components of axons and dendrites, may function as unique nanosized biodevices that can mediate electrical transmission with a quasi-superconducting property [1]. Structurally, MTs are hollow cylindrical nanotubes polymerized from tubulin monomers, composed of repeating α-tubulin and β-tubulin heterodimer subunits [4,5,6]. A standard mature microtubule usually consists of 13 to 15 parallel protofilaments (PFs) assembled by end-to-end tubulin heterodimers; adjacent PFs are laterally bonded to form a closed tubular nanostructure [7,8,9,10]. Inside the cytoplasm of axons and dendrites of some neurons, there are large numbers of densely-packed MTs, forming a distinct intracellular conductive scaffold. It was hypothesized in 2022 that MTs may be involved in neuroelectrical transmission, and these special MTs are termed “neuro-MTs” [1]. The core structural assumption of this theory lies in the intrinsic hollow vacuum lumen of neuro-MTs (discussed later), which provides a confined cavity for ultra-low-speed, collision-free directional migration of free conduction electrons inside neurons.
Over the past three decades, the structural characteristics of MTs and their binding proteins have been resolved via high-resolution detection approaches including X-ray crystallography and cryogenic electron microscopy (cryo-EM) [5,11,12,13]. Meanwhile, a growing number of research have investigated some of the unique electrostatic and electromagnetic properties of MTs [1,14,15,16,17,18,19,20,21,22,23,24,25,26,27,28,29,30,31,32,33,34,35,36,37,38,39,40,41,42]. Nevertheless, quantitative computational simulations focusing on electron dynamic behaviors and intracavity electric field (EF) distribution within intact neuro-MTs remain lacking. The present theoretical exploration, therefore, adopts the computational modeling approach to simulate intraluminal EF distribution and free electron migration patterns within seamless intact neuro-MTs. On the basis of the quantitative simulation results, a tentative theoretical model is tendered here to explain neuro-MT-mediated saltatory neuroelectrical transmission.

2. Materials and Methods

2.1. Rationale for Using Seamless 15-PF MTs for Modeling Analysis

In this study, the seamless 15-PF MTs were selected for computational modeling analysis. As a non-canonical MT lattice variant, 15-PF MTs possess unique structural features that distinguish them from the prevalent 13-PF MTs. Structurally, the increased number of circumferential tubulin subunits endows 15-PF MTs with a larger outer diameter of approximately 28–29 nm. Compared with 13-PF MTs, individual tubulin dimers in 15-PF MTs exhibit greater lateral bending curvature and higher intrinsic lattice strain. Unlike canonical 13-PF MTs, which adopt straight, non-supercoiled PF arrangements, 15-PF MTs display a prominent right-handed supertwist along the longitudinal axis with a tighter helical pitch than 14-PF MTs. Notably, 15-PF MT lattices are generally seam-free, featuring uniform canonical B-type lateral αβ heterotypic interactions at all adjacent protofilament interfaces. This structural uniformity eliminates the homotypic αα/ββ interfacial discontinuity (lattice seam) that constitutes the inherent structural defect of conventional 13-PF MTs.
Here, it is of note that in non-neuronal cells, MTs primarily function as core cytoskeletal components responsible for intracellular cargo transport. However, the pronounced supertwist of 15-PF MTs impedes the long-range linear movement of kinesin motors, rendering these MTs incompetent for conventional intracellular cargo transport. Furthermore, 15-PF MTs exhibit superior structural and mechanical stability. Collectively, these unique properties seem to make 15-PF MTs better neuro-MT candidates for neuroelectrical transmission. Somewhat in line with the above suggestion, it is of interest to note that bundles of 15-PF MTs have been identified in specialized mammalian inner ear cells. It is speculated that these 15-PF MT bundles may function analogously to axonal MT assemblies, mediating the propagation of electrical signals from inner ear cells to adjacent neurons and other target cells.
Therefore, the above two structural properties of 15-PF MTs, i.e., seam-free lattice architecture and non-cargo-transporting functionality, make them more suitable than the conventional 13-PF and 14-PF MTs as a candidate for modeling analysis of neuroelectrical transmission mediated by neuro-MTs.
Specifically, the experimentally resolved cryo-EM structure of the 15-PF MT reported by Benoit et al. [11] was adopted for modeling analysis in this study. The corresponding structural file (PDB ID: 6B0I; CIF file: 6b0i-assembly1.cif) was downloaded from the RCSB Protein Data Bank (https://www.rcsb.org/) [43]. The unresolved C-terminal segments of α-tubulin (residues 442–451) and β-tubulin (residues 430–445) in the original cryo-EM structure were supplemented using AlphaFold-predicted structural models [44]. The reliability of these supplemented structural fragments was evaluated via the per-residue predicted local distance difference test (pLDDT), with an average pLDDT score of 48.6 ± 8.7. This relatively low pLDDT value is biologically reasonable, as the supplemented fragments correspond to the flexible C-terminal tails of tubulin subunits, which are localized on the outermost periphery of MT structures. Despite the low prediction confidence for these flexible regions, the modeled tail conformations are unlikely to interfere with the internal core structure of MTs. Moreover, the present coarse-grained modeling simplifies each amino acid residue as a discrete point charge. Accordingly, subtle variations in the side-chain and backbone conformations of residues within these flexible terminal segments are not expected to fundamentally alter the computational results of the overall EF distribution and electron movements inside a neuro-MT lumen.

2.2. Estimation of the Electric Field (EF) Direction and Its Relative Intensity

In order to estimate the EF direction and relative intensity inside a theoretical MT tunnel, the atomic charges in the MT structure are assigned based on the CHARMM36m force field [45] using CHARMM-GUI (http://www.charmm-gui.org) [46]. CHARMM36m is an optimized version of the CHARMM force field specifically refined for biomolecular simulations [45]. The parameters have been thoroughly benchmarked in numerous previous studies for proteins, peptides, and related biomolecular assemblies, showing reliable performance in describing structural properties, electrostatic distribution, and intermolecular interactions [45]. In addition, it is of note that the molecular components in our system are standard biological building blocks fully covered by the standard CHARMM36m parameter set, with no custom or modified parameters used in this work. All residues, atomic partial charges, van der Waals, and bonded parameters used in this work adopt the original standard CHARMM36m parameters, without any manual modification.
The length of a theoretical MT was expanded to a micrometer scale by repeating the coordinates of the known structures along the central axis. For ease of calculation, each amino acid residue, GDP, or GTP in the MT structure is individually represented using the geometric center of the corresponding molecule, and the charge is the sum of all atomic charges. The EF direction and relative intensity are estimated according to the Coulomb electrostatic interactions. The relative intensity and direction of the summated EF at a given point inside the MT tunnel is calculated using the following equation:
E = c o n s t a n t ×   q r 2 r
Here, E and q are the relative EF intensity and the charge of a residue, respectively. r is the vector from the geometric center of a residue to the given point. ∑ represents the sum traversing all the charged residues in an MT, plus all GDP (–2), GTP (–3) and Mg2+ (+2).

2.3. Simulating the Movement of a Free Electron Inside a Neuro-MT

The force exerted on a free electron inside a neuro-MT is computed using the following formula:
F = E q
Here, F , q, and E refer to the force, charge of the electron, and the EF intensity, respectively. The charge of the electron is defined as 1 relative charge unit. When a free electron moves along inside the MT tunnel, its relative velocity is calculated according to Newton’s second law, which is expressed as follows:
F = m a
Here, F , m, and a are the force, mass, and accelerated velocity of the charged particle, respectively. The mass (m) of the electron is defined as 1 relative mass unit.
When the displacement distance ( | s | ) and time (Δt) are very small, the instantaneous accelerated velocity can be regarded as a constant and represented using the velocity at the initial position. Assuming that the charged particle moves from the initial position s 1 to position s 2 , the time (Δt), the instantaneous speeds at the two positions ( v s 1 and v s 2 ), the acceleration velocity ( a s 1 ), and the displacement vector ( s ) (from the positions s 1 to s 2 ) satisfy the following quantitative relationships:
v s 2 = v s 1 + a s 1 · t
s 2 = s 1 + v s 1 · t + a s 1 · t 2 2
v s 1 2 v s 2 2 = 2 a s 1 · s
Here, the direction of the instantaneous speeds ( v s 1 and v s 2 ), the acceleration velocity ( a ), and the displacement vector ( s ) are on the same straight line. The instantaneous positions along the trajectory of the kinetic mass point are derived from the above equations. Most of the variables used in this computational modeling analysis are in relative units, for ease of extracting the general principles and information concerning the EF distribution and the direction of electron movements inside a putative neuro-MT.

3. Results and Discussion

3.1. Overall Structure and Charge Distribution of a Neuro-MT

At present, the complete structure of a neuro-MT is still unclear. The 15-PF seamless MT [11] was adopted in this study as a prototype neuro-MT for modeling analysis of its biophysical properties. The 15-PF MT structure is shown in Figure S1A (side view) and Figure S1B (top view). Two chains of the αβ dimers intertwine each other, which are somewhat similar to the two chains in the double helical DNA structure (Figure S1A). The vertical length of two αβ dimers is approximately 165 Å (Figure S1A), and the inside diameter of the tunnel of a 15-membered MT is approximately 95 Å (Figure S1B).
According to the assigned charges, there are 103 charged amino acid residues (41 positive charges, 62 negative charges), one guanosine triphosphate (GTP, –3) and 1 Mg2+ (+2) in tubulin α; there are 99 charged residues (38 positive charges, 61 negative charges) and one guanosine diphosphate (GDP, –2) in tubulin β. Accordingly, the total net charges are −22 in tubulin α and −25 in tubulin β. The overall charge distributions are shown in Figure S1C (side view) and Figure S1D (top view). The overall distribution of the positive and negative charges is very similar for both tubulin α and β helical structures (Figure S2A,B). Notably, both tubulin α and β subunits contain markedly more negative-charged amino acids than positive-charged amino acids, and particularly, the outermost part of a neuro-MT contains mostly negative-charged amino acids (Figures S1D and S2C,D). This unique feature enables a neuro-MT to attract and bind intracellular cations (such as K+ and Na+) and thus become a reservoir (“sink”) for these cations.

3.2. A Theoretical Neuro-MT at the Resting State

It was recently suggested that a neuro-MT will allow the conduction of free electrons upon nerve stimulation [1]. In this study, we simulated the EF direction and relative intensity inside a neuro-MT according to Equation (1). During the initial modeling analysis, the length of a neuro-MT is expanded to the micrometer scale by repeating the MT period that contains 30 tubulin α and β subunits (as illustrated in Figure S1A) 100 times.
To analyze the effect of the MT’s charge distribution on the EF inside, the charge of the residues at the outer and inner regions of a neuro-MT is manually altered. Here, the outer surface region refers to the region with a radius > 140 Å; the inner surface region refers to the region with a radius < 110 Å; and the middle region refers to the region with a radius between 110 and 140 Å (depicted in Figure S1D).
Under normal physiological condition when a neuro-MT is at the resting state, it is believed that the EF intensities inside its tunnel theoretically should be very close to zero along the central axis such that all free electrons inside the tunnel will be static, likely attaching to the inner surface wall (explanation provided later). To model the EF intensities inside of a neuro-MT at the resting state, free electrons are placed at the inner surface region, and the net charge of all positive-charged positions at the inner surface region will become zero (i.e., they are neutralized by the free electrons present inside a neuro-MT). As for the sources of free electrons present inside a neuro-MT, it was postulated earlier that they are formed by tubulins using GTP molecules as the energy source [1] (detailed discussion provided in a latter section). Additionally, it should be noted that each negative-charged position at the outer surface region of a neuro-MT will be altered according to the change in the intraneuronal cation concentrations during an action potential (AP).
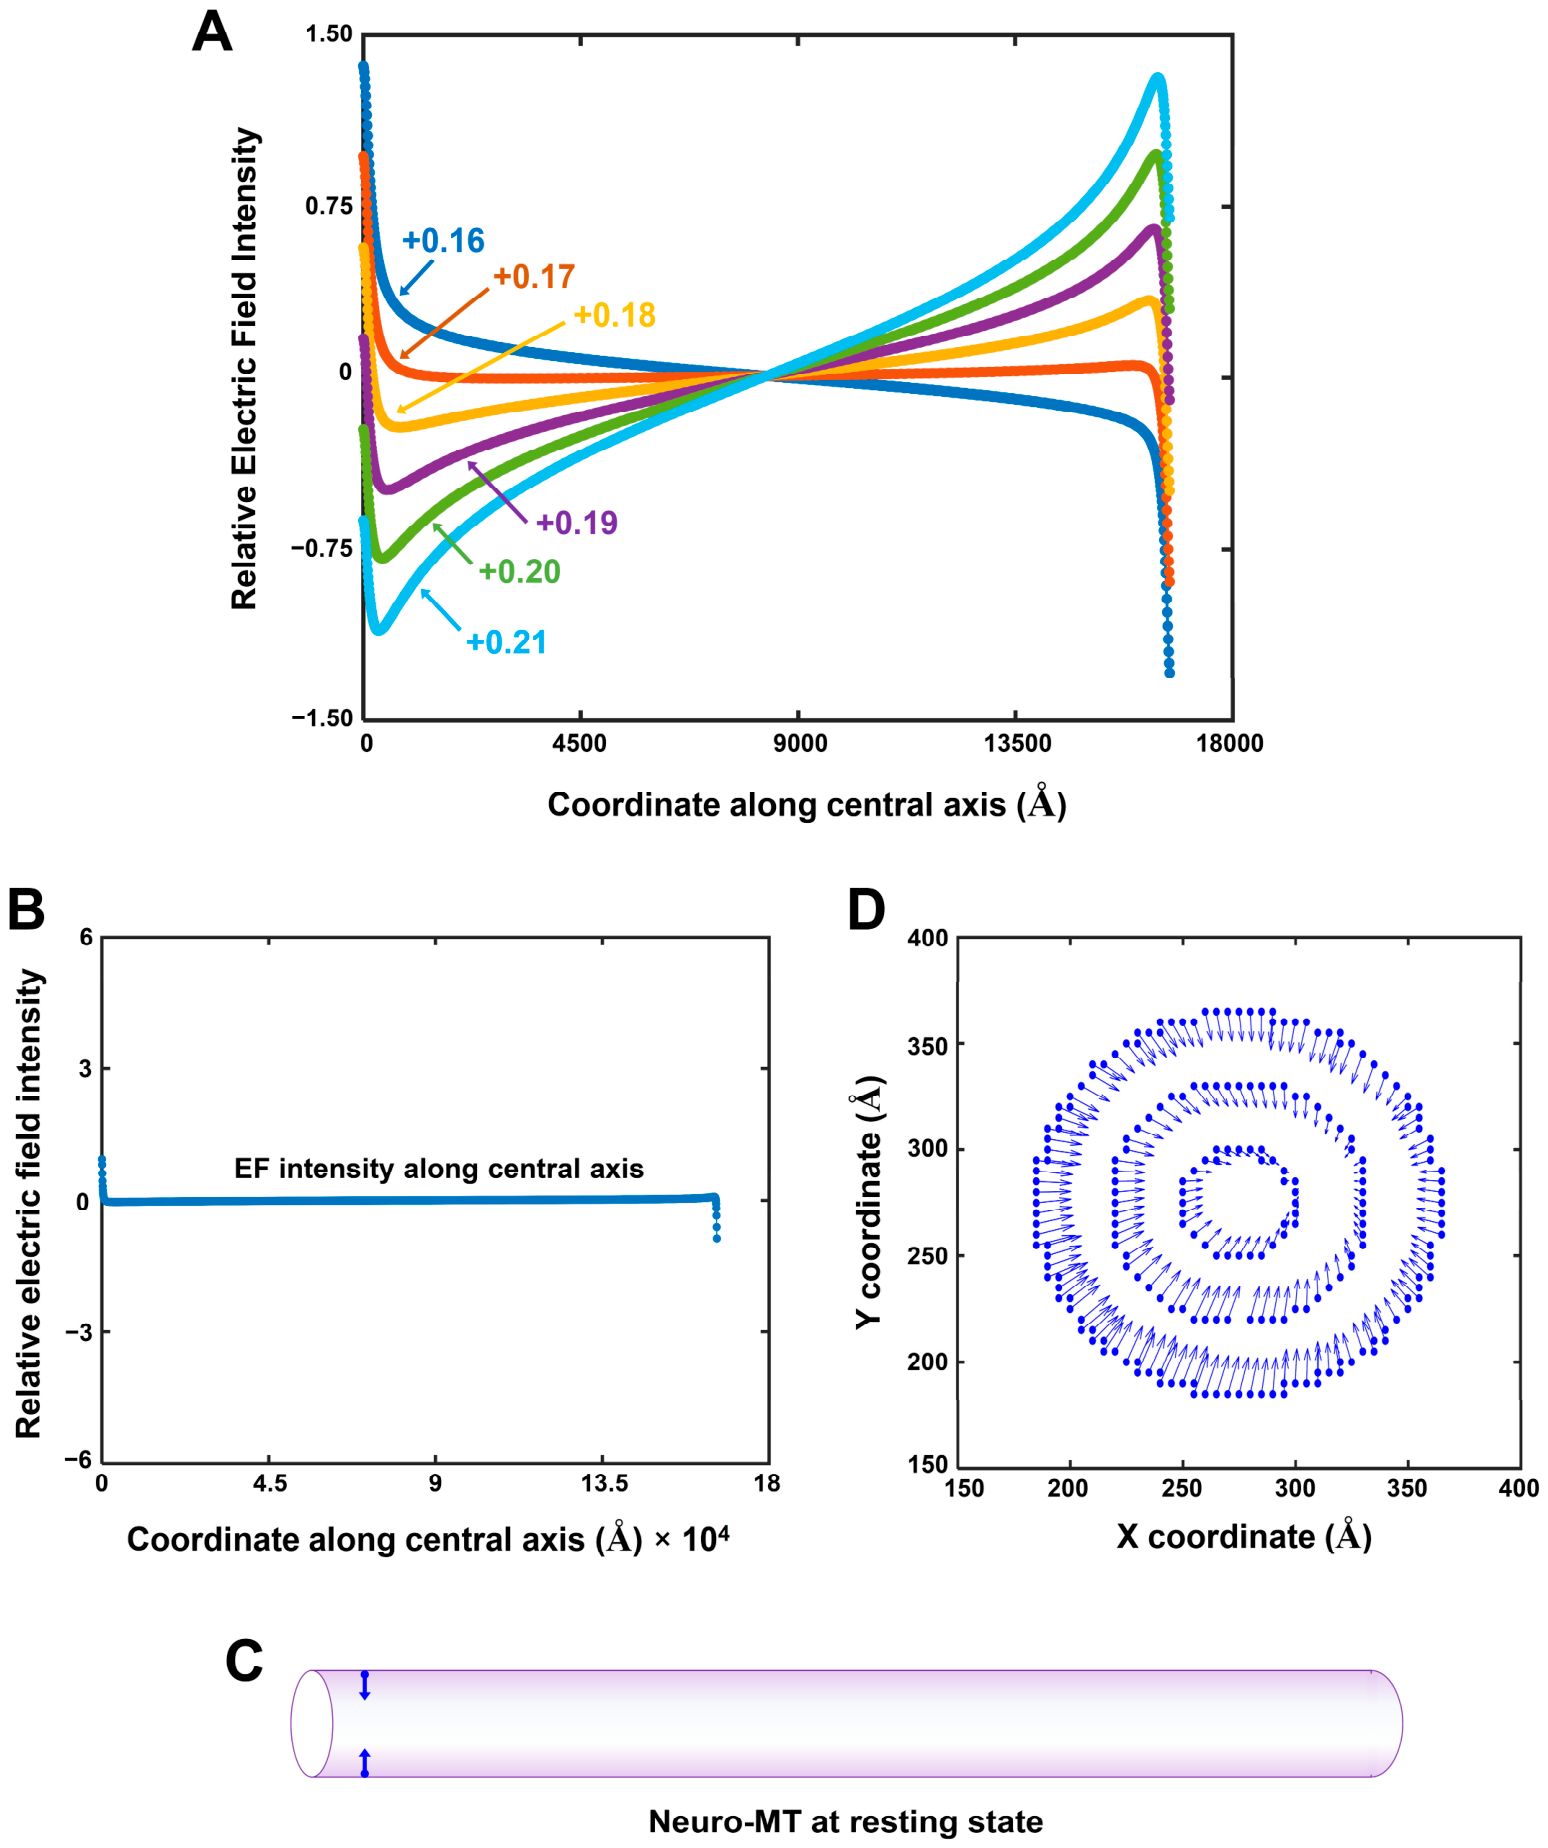
As shown in Figure 1A, a series of initial calculations were performed when each negative-charged position on the outer surface of a neuro-MT was assigned to carry a certain amount of charge (ranging from +0.16 to +0.21). We found that the EF intensities inside a neuro-MT’s tunnel will become near-zero along the central axis when each negative-charged position on the outer surface carries an average charge of +0.17 (Figure 1A). Notably, the average +0.17 charge would mean that roughly 17% of all negative-charged amino acid residues on the outer surface carry a net charge of +1 (such as carrying a K+ ion) while all other negative charged residues are neutralized by a cation such as K+ (i.e., carrying zero net charge). This condition is highly feasible and relevant physiologically. Indeed, after all negative-charged residues on the outer surface are neutralized and then an additional 17.0% (240/1412) of the residues at the outermost region of a neuro-MT are bound with a cation (such as K+ ion) and carry a net charge of +1, the EF intensities along the central axis become literally zero (Figure 1B,C). This modeling result reveals that under certain physiologically relevant conditions, the EF inside a neuro-MT will disappear along the central axis, which means that the free electrons inside a neuro-MT will be static (not moving in either direction). Notably, under this “resting state” condition, the modeling results show that there is still a small EF projected toward the central axis on the cross sections (i.e., the xy planes) (Figure 1D). This small EF on the cross section will force all free electrons (which carry a negative charge) to move toward the inner surface region, where they will be in close association with the positive-charged inner surface residues due to Coulomb interactions.

3.3. Electron Movements Inside a Theoretical Neuro-MT at the Active State

During neuroelectrical transmission, it is known that only a small segment of a myelinated axon (or dendrite), called the “node of Ranvier” (NR), will experience rapid influx of cations (mostly Na+ from the extracellular space) when an AP arrives at the NR. As such, only a small segment in the long neuro-MT will have additional cations placed at the outer surface residues during neurotransmission. Next, we choose to model the change in EF intensity and direction after we alter the outer surface charge in a small fraction of a neuro-MT by letting 36.4% (i.e., 514/1412) of the outer surface amino acid residues carry a net charge of +1 while the remainder residues are neutralized. For this modeling analysis, the length of the neuro-MT is enlarged by repeating the earlier segment (which produces the modeling data in Figure 1B–D) 10 times again. The mechanism of electrical transmission inside a neuro-MT is deduced by analyzing the EF and the conduction of free electrons inside a neuro-MT tunnel.
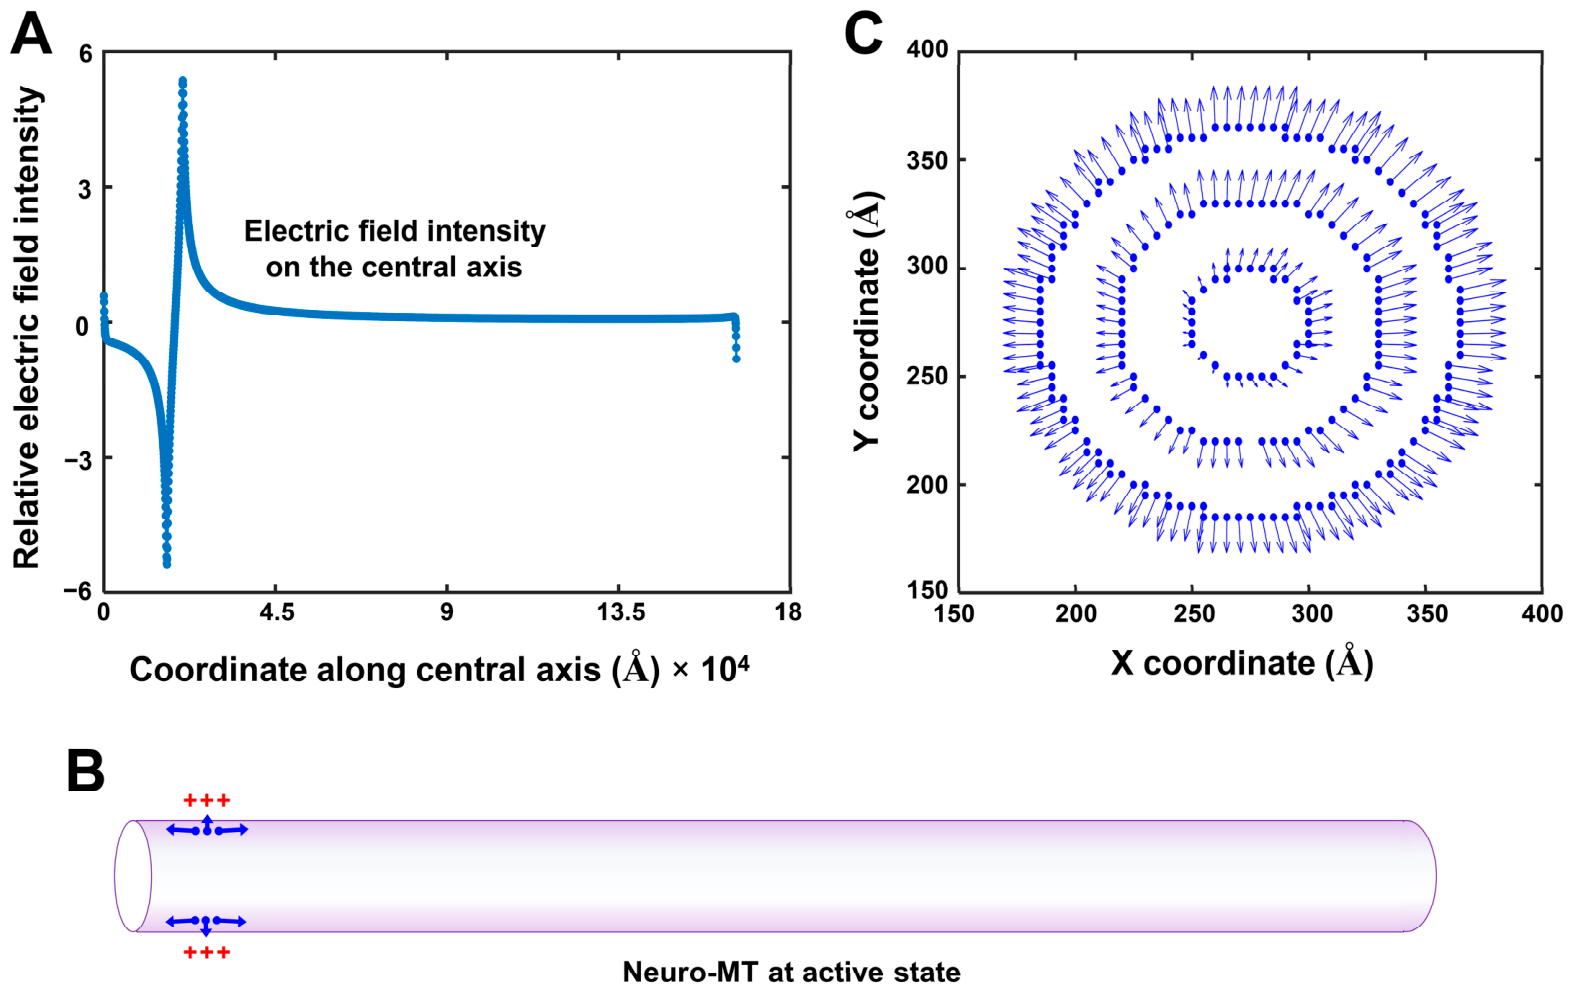
Based on computational modeling, there is an EF generated along the central axis during the active state (Figure 2A), and the EF points in the opposite directions on the central axis away from the “clamped” segment (depicted in Figure 2B). This means that the free electrons inside a neuro-MT will move toward the clamped segment (i.e., the segment which has cations placed on its outer surface). Additionally, there is an EF on the cross sections (i.e., the xy planes) of the neuro-MT, and its directions are projected away from the central axis (Figure 2C). This EF on the xy planes will force free electrons to leave the inner surface region and move toward the center region of the tunnel. Note that the above modeling analysis was also performed when different fractions of the negative-charged residues carry a + 1 positive charge (i.e., bound by a Na+ ion). We found that essentially the same observations are made when varying fractions of the negative-charged residues are carrying a positive charge.
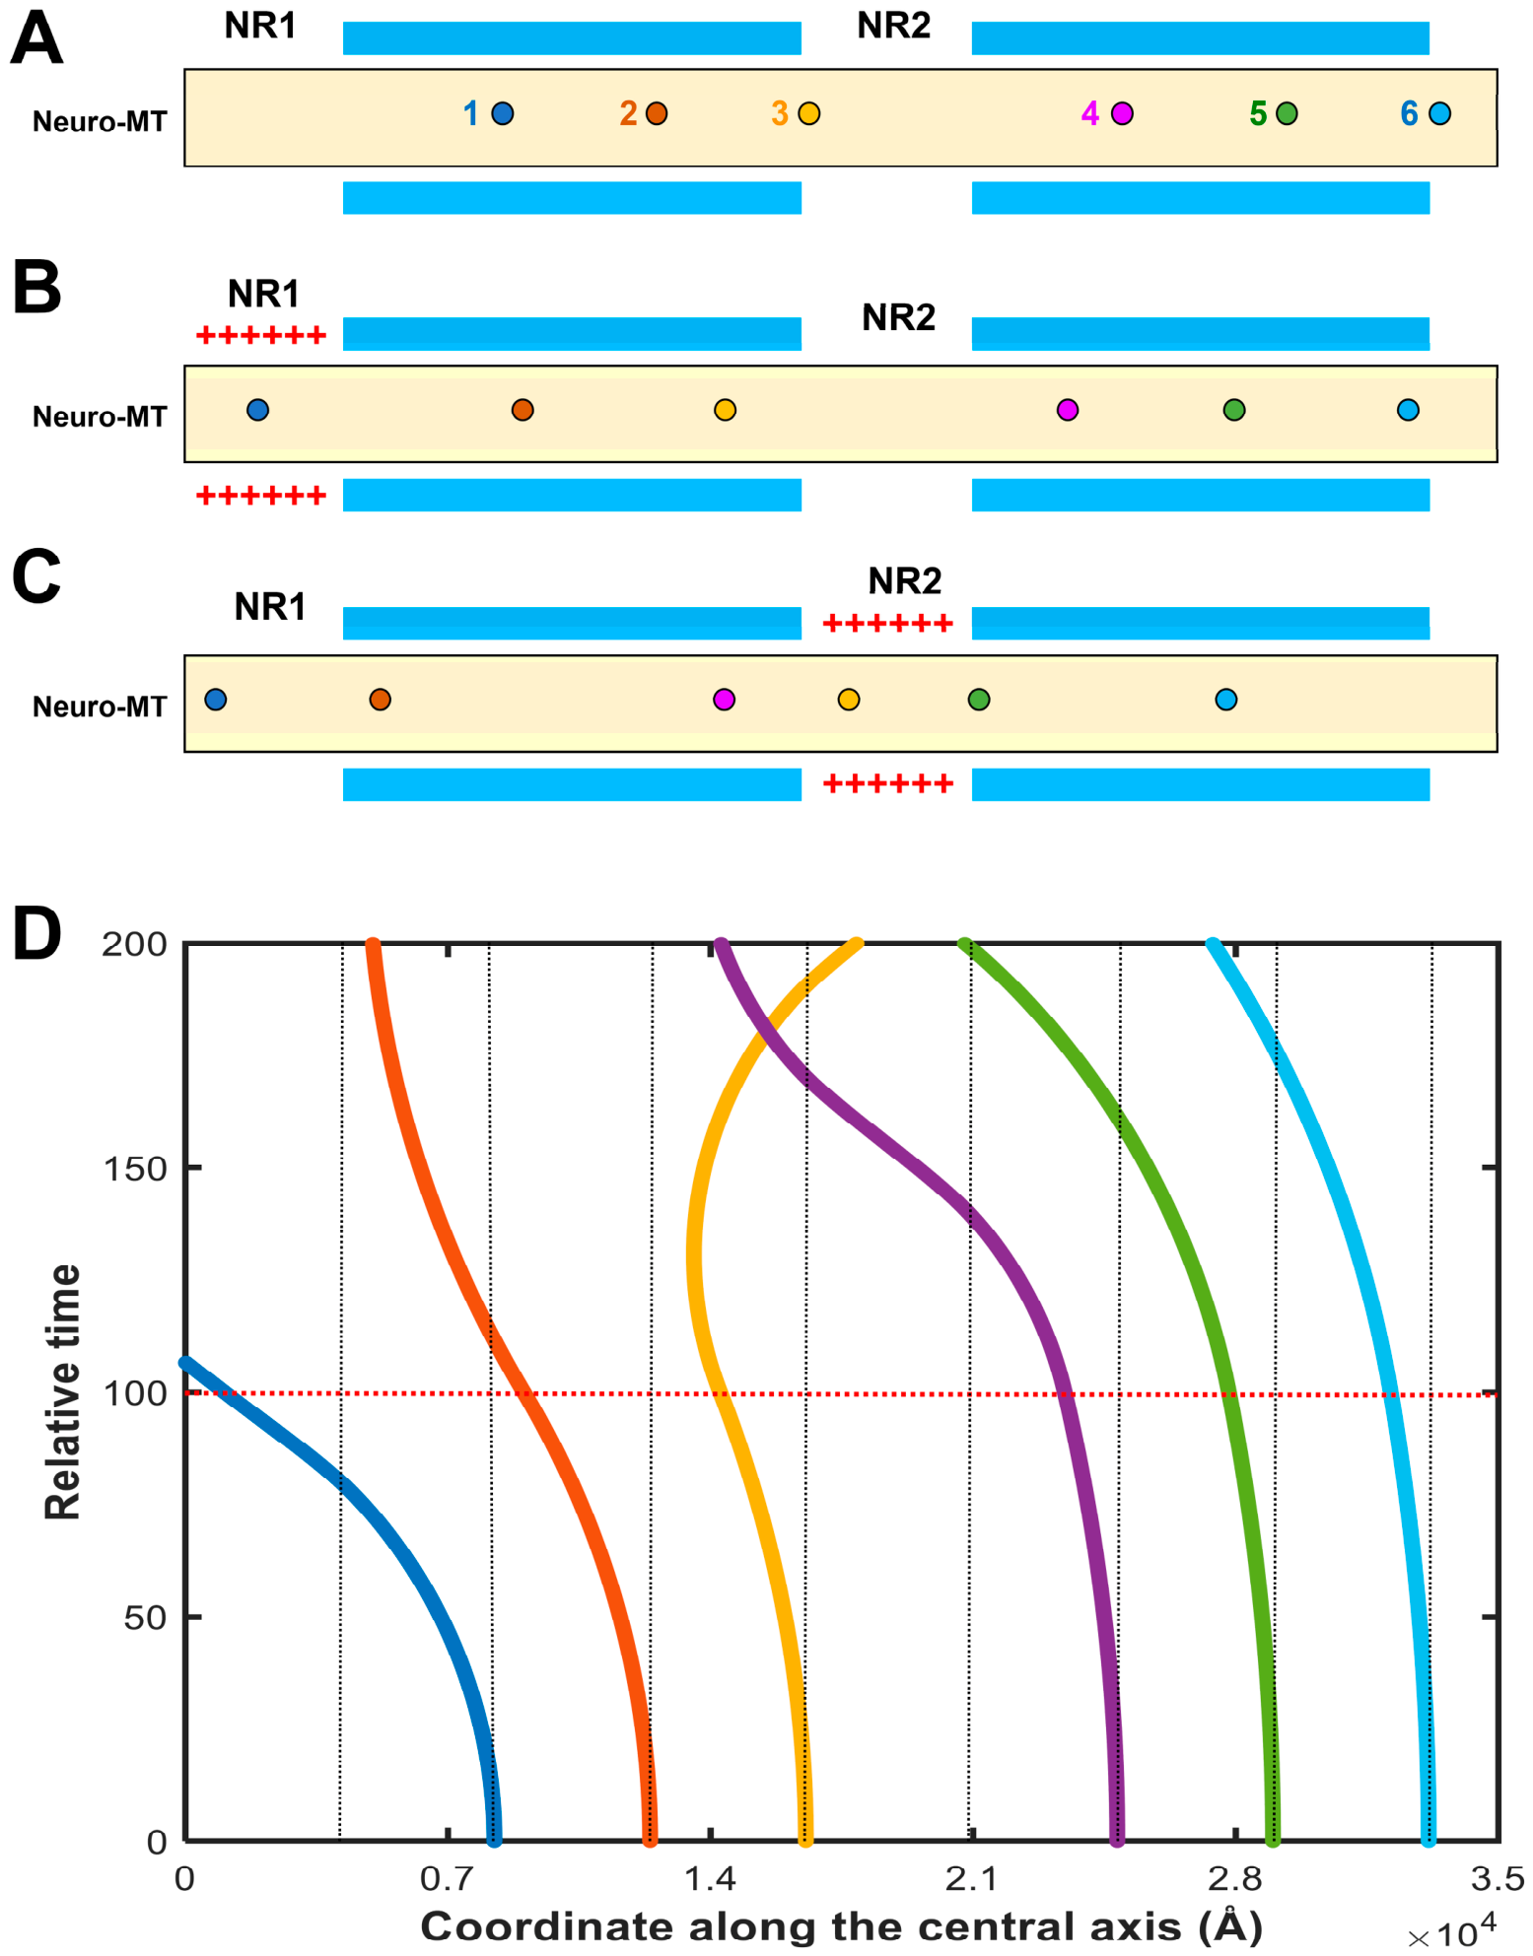
Next, we modeled the relative movements of six representative electrons with different initial positions along the central axis of a neuro-MT (depicted in Figure 3A) when the resting state is changed to the active state, i.e., when an AP is generated at NR1 first, and then passes along from NR1 to NR2 (Figure 3A). Here, we assume that all six electrons are static in their initial positions during the initial resting state (i.e., before the AP is generated at NR1). The velocity and relative positions of the free conduction electrons along the central axis are estimated according to Equations (4)–(6).
As depicted in Figure 3A, when cations (mostly Na+ and K+) are placed at the outer surface of a small fraction of a neuro-MT (such as NR1), it is just like placing a “clamping voltage” on this region of a neuro-MT, which mimicks the active state when an AP is generated at NR1. Understandably, the forces acting on the free electrons closer to the positive-charged region are bigger than the forces acting on the electrons farther away from the charged region. Therefore, when NR1 is activated and before it jumps to NR2 (here the relative action time is set to 100 relative time units for each NR activation) (Figure 3B,D), electron 1 moves toward NR1 fastest, electrons 2 and 3 move toward NR1 at reduced speeds, and electrons 4–6 may barely move (due to the weaker forces acting on them). When the activation reaches NR2 (assuming that the positive charges at NR1 will immediately disappear) (Figure 3C,D), electrons 1 and 2 may continue to move toward NR1 due to the residual momentum; for electron 3, it initially will still move toward NR1 but may quickly change its initial direction due to the positive charges of NR2. For electron 4, it will move toward NR2, in a similar manner as electron 1 when NR1 was activated. The movements of electrons 5 and 6 will be similar to the movements of electrons 2 and 3 when NR1 was activated.
Based on the above modeling analysis, it is understood that after the activation state (i.e., AP) disappears at NR1 or NR2, more free electrons will remain inside the segments of a neuro-MT corresponding to the NRs as the positive charges of these small segments will draw free electrons from both directions to these small segments.

3.4. Mechanism of Neuro-MT-Mediated Saltatory Neuroelectrical Transmission

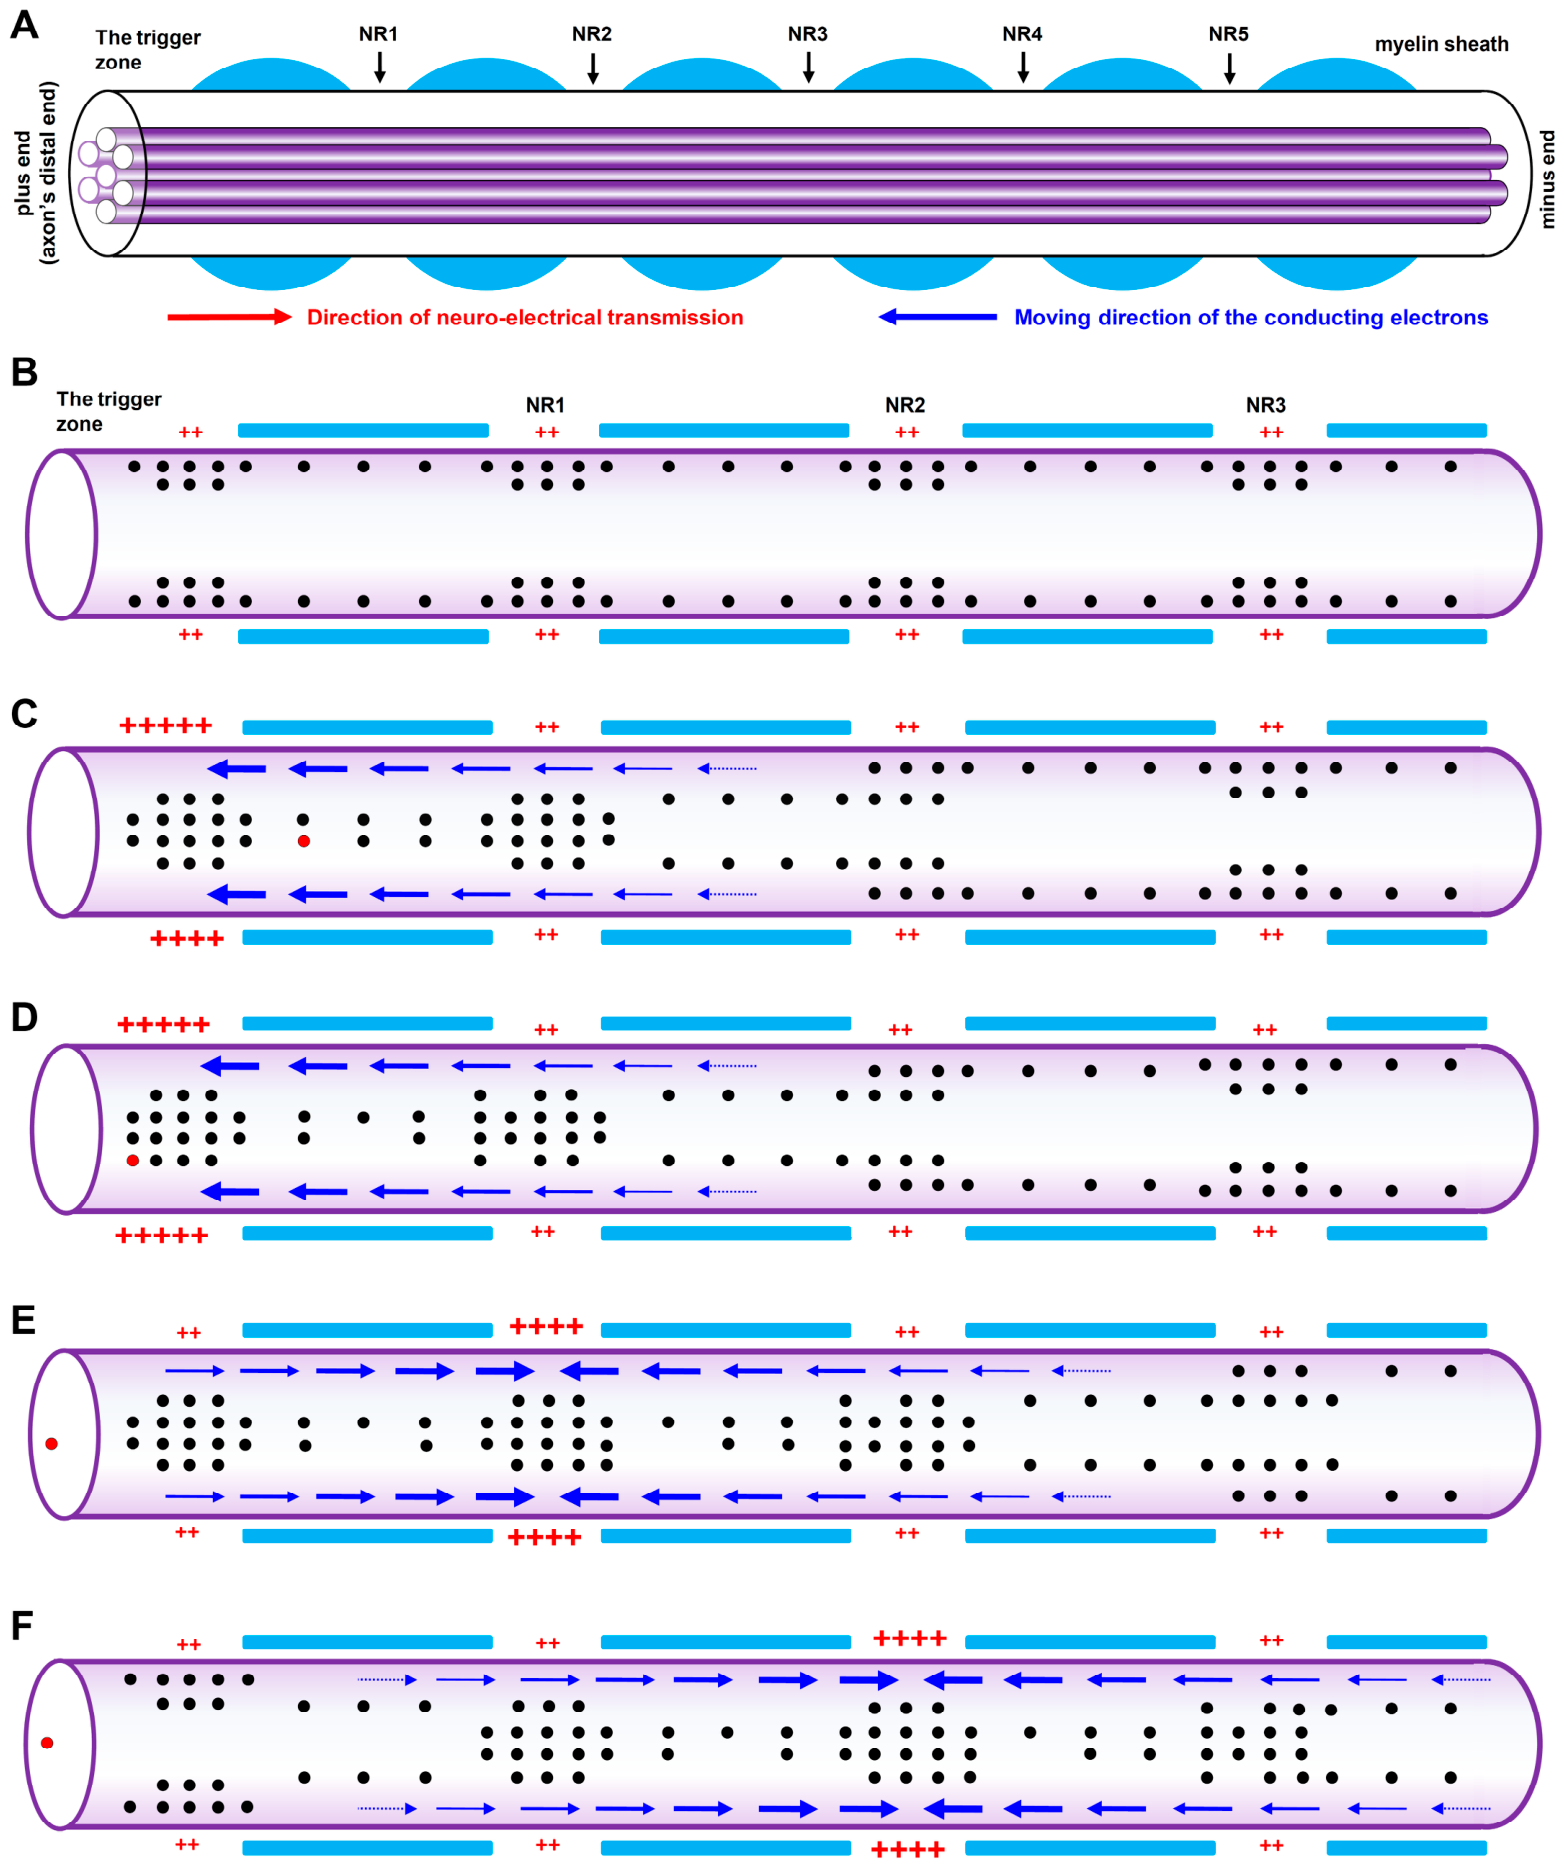
Based on the above analysis of the EFs and movements of free electrons inside the tunnel of a neuro-MT, the mechanism of neuro-MT-mediated salutatory neuroelectrical transmission is explained below. As schematically depicted in Figure 4A, an axon (which contain bundles of neuro-MTs inside) is often wrapped with a myelin sheath which is interspaced with NRs, and it is known that the APs are usually initiated at the trigger zone (i.e., the start region of an axon) and then transmitted in a salutatory manner through the NRs. As explained in the preceding section, prior to the generation of an AP at the trigger zone or NR (i.e., during the resting state), more free electrons are attracted to the inner surface regions of the neuro-MT segments corresponding to the NRs (depicted in Figure 4B). The generation of an AP at the trigger zone is caused by the rapid influx of extracellular Na+ through the opening of the voltage-gated fast Na+ channels. The rapid increase in cytosolic Na+ ions in this small segment of the axon will result in the binding of Na+ cations onto a fraction of the negative-charged residues on the outer surface of a neuro-MT, functionally similar to placing a “clamping voltage” on this segment of the neuro-MT. As such, EFs will be generated inside a neuro-MT immediately. First, on the cross sections (i.e., the xy planes), there is an EF with its directions projected away from the central axis (as shown in Figure 2C), which will force the free electrons to leave the inner surface region and move toward the center regions of the tunnel (depicted in Figure 4C). Second, there is an EF generated along the central axis, which points in the directions away from the positive charge-covered segment (depicted in Figure 2B). This EF will force the free electrons on the right (including those in NR1) to move toward the trigger zone (depicted in Figure 3; also explained in Figure 4C). The migration of free electrons inside a neuro-MT away from NR1 will result in the release of cytosolic cations (such as K+) that are attracted to the outer surface residues of that segment during the resting state. If an adequate amount of the cations is released as a result of the intraluminal free electron migration, it will cause a small increase in the intracellular resting potential (usually around −70 mV) in that segment. If this rise in the intracellular resting potential reaches a given threshold (usually around −50 to −55 mV), then it will activate the voltage-gated inward Na+ channels to trigger the generation of an AP in NR1 (AP peak voltage usually will reach +30 to +40 mV). The plasma membrane at the NRs is known to contain the highest density of voltage-gated Na+ channels [47,48,49]. The opening of these Na+ channels at NRs will be automatically inactivated (i.e., closed) when the intracellular potential reaches +5 to +10 mV, and in the meanwhile, the voltage-gated rectifier K+ channels (outward direction) will be activated (maximal activation seen at +30 to +40 mV) to efflux K+ until the intracellular potential reverts back to the original voltage [49]. Afterwards, the Na+/K+ ATPase is activated to restore the intracellular pools of Na+ and K+. An AP at each NR normally only exists for a very short duration (0.4–0.8 ms) and then disappears, due to the ultra-sensitive voltage-gated opening and closing of the fast Na+ and K+ channels.
Similarly, the AP generated at NR1 will serve as a clamping voltage and will draw the free electrons on the right (i.e., those at NR2) to move toward NR1 (Figure 4E), which will lead to the activation of the voltage-sensitive Na+ channels and generation of an AP at NR2 (Figure 4F). In the meanwhile, the clamping voltage will exert an opposite EF on the conduction electrons on the left of NR1 (which may continue to move toward the trigger zone), and this opposite force will either slow down their leftward movement or may even make the electrons move backward toward NR2.
As explained above, when the AP moves from the initial trigger zone to the next NR (i.e., NR1) in a salutatory manner, the clamping voltage in the preceding NR will quickly disappear and will return to the resting state, which is due to the closing of the inward voltage-gated Na+ channels and the opening of the outward voltage-gated K+ channels. As a result, the EF on the cross-section of the MT at the preceding NR will return to the initial resting state. Based on the modeling results shown in Figure 1D, the EF on the cross section during the resting state will attract the free electrons toward MT’s inner surface wall. Notably, the alternating positive- and negative-charged residues lining on the inner surface of a neuro-MT (shown in Figures S3A,B and S4) form the spiral dipole ring structures, which serve as effective “speed bumps” and will quickly halt the free electrons from moving in their original directions. After the free electrons come to a complete stop, it is expected that they will be restricted in narrow bands (spiral cycles) very close to the positive-charged residues. As such, free electrons are, in fact, sandwiched between two neighboring spiral bands containing negative-charged residues (Figure S3B).
The fact that the movements of free electrons inside the preceding segment(s) of a neuro-MT will be very quickly halted is very different from the conventional electrical transmission inside a metal wire which presumably has evenly distributed free electrons moving along the entire length of the wire. This unique mechanism will maximize energy saving by reducing the consumption of free conduction electrons during the process of neuroelectrical transmission. In addition, owing to the circular forces exerted nearly evenly on the free electrons moving inside the straight vacuum tunnel of a neuro-MT during neuroelectrical transmission, the conduction of these free electrons will be essentially without significant resistivity, i.e., they will be moving in a quasi-superconducting manner as proposed earlier [1].
It was speculated earlier [1] that a neuro-MT has a vacuum structure inside. Notably, many past studies have analyzed the “general MTs” present in non-neuronal cells, and they mostly serve as part of the cytoskeleton. In comparison, much less is known about the detailed structures of neuro-MTs, which are packed tightly inside axons and dendrites, and may serve the proposed function for neuroelectrical transmission. For these neuro-MTs, it is speculated that they have a mostly-hallow space inside, and this space is vacuum under normal conditions. While presently there lacks direct experimental evidence for this suggestion, there is, in fact, a unique phenomenon associated with these neuro-MTs, called “MT collapse”, which is worth mentioning here and may offer circumstantial support for this suggestion. MT collapse is a rapid, catastrophic disassembly process where stable MTs abruptly shrink, shorten, and depolymerize completely, which is very different from the normal slow process of MT depolymerization. This process is most commonly observed for neuronal MTs, which is often associated with neuronal damage, and linked to neurodegeneration. It is speculated that the trigger of MT collapse may involve the sudden loss of the vacuum state inside an intact neuro-MT.
While a neuro-MT is assumed to be vacuum inside, it appears that its luminal space is not completely hallow. Studies have shown that there are certain “lumen-resident” proteins present inside. For instance, MAP6 (stable tubule-only peptide) is a known luminal protein, which forms regular, ~100-nm spaced particles along the lumen [50,51]. Functionally, it was suggested to help stabilize MT structure against depolymerization. It is possible that this protein may also fulfill other important functions required for electron conduction, which are presently unknown to us. Despite the presence of the luminal proteins inside a neuro-MT, it is speculated that these protein molecules will not obstruct the general flow of free electrons inside a neuro-MT due to their size and biophysical properties. This suggestion is reasonable as we understand that during neuroelectrical transmission, the moving of free electrons inside a neuro-MT only occurs in a very small section at any given moment; stated differently, the free electrons inside most part of a neuro-MT are actually not moving along (i.e., static) during neuroelectrical transmission.
For the neuro-MTs to fulfill their proposed function in neuroelectrical transmission, one of the key requirements is the generation of free electrons inside the neuro-MTs. It was postulated earlier that free electrons are generated by the tubulins in a GTP-dependent manner [1]. Although direct experimental evidence for this speculation remains absent at present, there are solid biochemical foundations for the proposed hypothesis, as briefly elaborated below:
i. Tubulins possess a very high density of redox-active tyrosine (TYR) and tryptophan (TRP) residues, which endows them with the structural basis for electron generation. Structural analysis of tubulin (Figure S5A) shows that each αβ tubulin dimer contains 35 TYR residues, including 19 residues in tubulin α and 16 in tubulin β. In addition, the αβ dimer harbors eight TRP residues, with four residues in α-tubulin (W21, W346, W388, W407) and four in β-tubulin (W21, W101, W344, W397). Collectively, these aromatic redox-active residues sum to 43 per αβ dimer, accounting for approximately 10% of the total amino acid composition of the tubulin.
ii. The abundant TYR and TRP residues within αβ tubulin dimers confer robust potential for endogenous electron generation and transfer, which can be attributed to two key factors. First, TYR and TRP are canonical redox-active amino acids, and electron transfers among TYR and TRP has been well characterized in numerous redox enzymes, confirming their inherent electron transport capacity [20,52,53,54,55]. Second, TYR and TRP residues are densely distributed around GTP/GDP molecules within the neuro-MT structure (Figure S5A,B). Specifically, a total of nine TYR/TRP residues surround GTP/GDP ligands in α- and β-tubulin subunits, with the geometric center-to-center distances between these aromatic residues and GTP/GDP molecules below 20 Å. Furthermore, TYR/TRP residues form a highly compact and interconnected network in a neuro-MT, with the distances between adjacent coupled TYR/TRP pairs below 10 Å (and some even below 5 Å). These structural features collectively create an optimal microenvironment for efficient electron transfer and/or free electron generation.
iii. A prior hypothesis [1] suggested that tubulin-catalyzed GTP hydrolysis (conversion of GTP to GDP) releases chemical energy to initiate electron transfer and charge separation, ultimately generating free electrons along with the formation of TYR/TRP radicals. Admittedly, this mechanistic model remains hypothetical without definitive experimental validation. Nevertheless, some indirect experimental observations provide indirect support for the generation of free electrons within neuro-MTs under physiological conditions. For example, in vitro experiments have demonstrated that voltage-clamped MT bundles exhibit electrical oscillations (39 Hz) and support longitudinal electrical signal conduction under intracellular-mimicking conditions [16]. Consistent with these findings, voltage-clamped neurites of cultured mouse hippocampal neurons also generate electrical oscillations and mediate longitudinal electrical signal propagation [16].
Here, it is of note that the E-site (GTP-binding site) on β-tubulin is known to enable reversible GTP binding and subsequent GTP hydrolysis to GDP. Conventionally, α-tubulin is not considered to participate in direct GTP hydrolysis. However, it remains unclear whether free electron release in neuro-MTs is exclusively driven by β-tubulin-mediated GTP hydrolysis or synergistically contributed by GTP hydrolysis occurring on α-tubulin. It is highly plausible that α-tubulin might be actively involved in the hydrolysis of GTP and contribute to the generation of free electrons inside a neuro-MT.
Lastly, if we tentatively accept the above assumption that all αβ tubulin dimers across a neuro-MT have the same capability to generate and release free electrons inside, it is still woth mentioning that the released free electrons will not be evenly distributed along the inner surface of a neuro-MT at the resting state. This uneven distribution of electrons is due to the fact that the MT segments corresponding to the NRs have the ability to unevenly attract more electrons to gather in these regions during each neuroelectrical transmission (explained in Figure 4). In fact, this computational modeling prediction is actually in good agreement with earlier experimental findings showing that the NRs are special axonal segments possessing the highest capacitance [56].

4. Conclusions, Limitations, and Future Directions

Conclusions. The present computational modeling work reveals that neuro-MTs, which are distinct structures densely packed inside axons and dendrites, are nanosized biodevices that can mediate physiological neuroelectrical transmission. The migration of the released free electrons is essentially without any electrical resistivity, i.e., in a quasi-superconducting fashion. The binding of cations (such as the influxed Na+ during an AP) onto a neuro-MT’s outer surface residues at the segment of a NR will trigger its transition from a resting state to an active state, and the rapid dissociation of the bound cations will trigger the opposite. It should be noted that the circular dipole ring structures at the inner surface of a neuro-MT will serve as "speed bumps" and aid in effectively halting the movements of the conducting free electrons almost immediately after an AP disappears at the NR. The neuro-MT-mediated electrical transmission as characterized in this study offers a novel mechanistic explanation for the saltatory conduction of AP along an axon or a dendrite. Lastly, the findings of this modeling analysis illustrate a potential case of room-temperature quasi-superconductivity, and the knowledge and insights gained from this study also provide practical strategies for the rational design of biomimetic room-temperature superconducting materials (such as carbon or silicone-based nanotubes) in the future.
Limitations and Future Directions. The present theoretical exploration bears methodological limitations that may constrain the accuracy of quantitative estimation; they are acknowledged below to guide future investigations. i. The current computational model simplifies MT surface residues as discrete point charges positioned at their geometric centers. This approximation ignores the intrinsic spatial extension, irregular conformational geometry, and heterogeneous charge distribution of amino acid residues on neuro-MT surfaces. Such coarse-grained approximation may introduce minor quantitative deviations in computed intraluminal EF profiles and electron conduction efficiencies. ii. This study characterizes free electron transport within neuro-MTs using a purely classical physical framework, with quantum mechanical contributions left unaccounted for. Omission of quantum treatments precludes recapitulation of the quantum nature of electron conduction at the nanometer scale inside a neuro-MT.
Despite the drawbacks, these modeling shortcuts constitute pragmatic compromises essential for preliminary theoretical construction and semi-qualitative mechanistic exploration of the saltatory electrical conduction across a neuro-MT. Future work shall incorporate high-resolution residue charge topography alongside quantum mechanical formalisms to upgrade the existing computational architecture.

Supplementary Materials

The following supporting information can be downloaded at: https://www.mdpi.com/article/10.3390/biophysica6040061/s1. Figure S1. Computationally modeled structure of a seamless MT and its charge distribution. Figure S2. Charge distributions in a 15-PF tubulin α helix (A), a 15-PF tubulin β helix (B), a tubulin α subunit (C), and a tubulin β subunit (D). Figure S3. Alternative distribution of negative- and positive-charged amino acid residues on the inner surface of a neuro-MT. Figure S4. An enlarged view of the alternative distribution of negative and positive-charged amino acid residues on the inner surface of a neuro-MT. Figure S5. The distribution and location of TYR and TRP residues in tubulin α and β subunits in a neuro-MT.

Author Contributions

Conceptualization, B.T.Z.; methodology, Y.X.Y.; formal analysis, Y.X.Y. and B.T.Z.; investigation, Y.X.Y. and B.T.Z.; resources, B.T.Z.; data curation, Y.X.Y.; writing—original draft preparation, Y.X.Y. and B.T.Z.; writing—review and editing, Y.X.Y. and B.T.Z.; visualization, Y.X.Y. and B.T.Z.; supervision, B.T.Z.; project administration, B.T.Z.; funding acquisition, B.T.Z. All authors have read and agreed to the published version of the manuscript.

Funding

This research was supported, in part, by research funding from Shenzhen Key Laboratory of Steroid Drug Discovery and Development (grant number: ZDSYS20190902093417963).

Institutional Review Board Statement

Not applicable.

Informed Consent Statement

Not applicable.

Data Availability Statement

All the data presented in this study are already contained in the figures and Supplementary Data Files.

Conflicts of Interest

The authors declare no conflicts of interest.

Abbreviations

The following abbreviations are used in this manuscript:
MTmicrotubule
neuro-MTneuro-microtubule
EFelectrical field
APaction potential
NRnode of Ranvier
GDPguanosine diphosphate
GTPguanosine triphosphate
TYRtyrosine
TRPtryptophan

References

  1. Zhu, B.T. Role of microtubules in neuroelectrical transmission: A hypothesis. Brain Netw. Modul. 2022, 1, 155–165. [Google Scholar] [CrossRef]
  2. Bardeen, J.; Cooper, L.N.; Schrieffer, J.R. Theory of superconductivity. Phys. Rev. 1957, 108, 1175–1204. [Google Scholar] [CrossRef]
  3. Zhu, B.T. An important structural requirement for the superconductor material: A hypothesis. arXiv 2022, arXiv:2207.01226v2. [Google Scholar] [CrossRef]
  4. Li, H.; DeRosier, D.J.; Nicholson, W.V.; Nogales, E.; Downing, K.H. Microtubule structure at 8 Å resolution. Structure 2002, 10, 1317–1328. [Google Scholar] [CrossRef] [PubMed]
  5. Nogales, E.; Wolf, S.G.; Downing, K.H. Structure of the αβ tubulin dimer by electron crystallography. Nature 1998, 391, 199–203, Erratum in Nature 1998, 393, 191. [Google Scholar] [CrossRef] [PubMed]
  6. Löwe, J.; Li, H.; Downing, K.H.; Nogales, E. Refined structure of αβ-tubulin at 3.5 Å resolution. J. Mol. Biol. 2001, 313, 1045–1057. [Google Scholar] [CrossRef] [PubMed]
  7. Tilney, L.G.; Bryan, J.; Bush, D.J.; Fujiwara, K.; Mooseker, M.S.; Murphy, D.B.; Snyder, D.H. Microtubules: Evidence for 13 protofilaments. J. Cell Biol. 1973, 59, 267–275. [Google Scholar] [CrossRef] [PubMed]
  8. Unger, E.; Böhm, K.J.; Vater, W. Structural diversity and dynamics of microtubules and polymorphic tubulin assemblies. Electron Microsc. Rev. 1990, 3, 355–395. [Google Scholar] [CrossRef] [PubMed]
  9. Nogales, E.; Whittaker, M.; Milligan, R.A.; Downing, K.H. High-resolution model of the microtubule. Cell 1999, 96, 79–88. [Google Scholar] [CrossRef] [PubMed]
  10. Portet, S.; Tuszyński, J.A.; Hogue, C.W.; Dixon, J.M. Elastic vibrations in seamless microtubules. Eur. Biophys. J. 2005, 34, 912–920. [Google Scholar] [CrossRef] [PubMed]
  11. Benoit, M.P.M.H.; Asenjo, A.B.; Sosa, H. Cryo-EM reveals the structural basis of microtubule depolymerization by kinesin-13s. Nat. Commun. 2018, 9, 1662, Erratum in Nat. Commun. 2018, 9, 2748. [Google Scholar] [CrossRef] [PubMed]
  12. Kellogg, E.H.; Hejab, N.M.A.; Poepsel, S.; Downing, K.H.; DiMaio, F.; Nogales, E. Near-atomic model of microtubule-tau interactions. Science 2018, 360, 1242–1246. [Google Scholar] [CrossRef] [PubMed]
  13. Garnett, J.A.; Atherton, J. Structure determination of microtubules and Pili: Past, present, and future directions. Front. Mol. Biosci. 2022, 8, 830304. [Google Scholar] [CrossRef] [PubMed]
  14. Kalra, A.P.; Patel, S.D.; Bhuiyan, A.F.; Preto, J.; Scheuer, K.G.; Mohammed, U.; Lewis, J.D.; Rezania, V.; Shankar, K.; Tuszynski, J.A. Investigation of the electrical properties of microtubule ensembles under cell-like conditions. Nanomaterials 2020, 10, 265. [Google Scholar] [CrossRef] [PubMed]
  15. Priel, A.; Ramos, A.J.; Tuszynski, J.A.; Cantiello, H.F. A biopolymer transistor: Electrical amplification by microtubules. Biophys. J. 2006, 9, 4639–4643. [Google Scholar] [CrossRef]
  16. Cantero, M.D.R.; Villa Etchegoyen, C.; Perez, P.L.; Scarinci, N.; Cantiello, H.F. Bundles of Brain Microtubules Generate Electrical Oscillations. Sci. Rep. 2018, 8, 11899. [Google Scholar] [CrossRef] [PubMed]
  17. Cantero, M.D.R.; Perez, P.L.; Scarinci, N.; Cantiello, H.F. Two-Dimensional Brain Microtubule Structures Behave as Memristive Devices. Sci. Rep. 2019, 9, 12398. [Google Scholar] [CrossRef] [PubMed]
  18. Georgiev, D.D. Electric and Magnetic Fields Inside Neurons and Their Impact upon the Cytoskeletal Microtubules. In Rhythmic Oscillations in Proteins to Human Cognition; Bandyopadhyay, A., Ray, K., Eds.; Springer: Singapore, 2021; pp. 51–102. [Google Scholar]
  19. Gutierrez, B.C.; Cantiello, H.F.; Rocío Cantero, M.D. Electrical oscillations of isolated brain microtubules. Biophys. J. 2021, 120, 255a–256a. [Google Scholar] [CrossRef]
  20. Kalra, A.P.; Benny, A.; Travis, S.M.; Zizzi, E.A.; Morales-Sanchez, A.; Oblinsky, D.G.; Craddock, T.J.A.; Hameroff, S.R.; MacIver, M.B.; Tuszyński, J.A.; et al. Electronic energy migration in microtubules. ACS Cent. Sci. 2023, 9, 352–361. [Google Scholar] [CrossRef] [PubMed]
  21. Kalra, A.P.; Eakins, B.B.; Patel, S.D.; Ciniero, G.; Rezania, V.; Shankar, K.; Tuszynski, J.A. All wired Up: An exploration of the electrical properties of microtubules and tubulin. ACS Nano 2020, 14, 16301–16320. [Google Scholar] [CrossRef] [PubMed]
  22. Brown, J.A.; Tuszyński, J.A. Dipole interactions in axonal microtubules as a mechanism of signal propagation. Phys. Rev. E 1997, 56, 5834–5840. [Google Scholar] [CrossRef]
  23. Schoutens, J.E. Dipole-dipole interactions in microtubules. J. Biol. Phys. 2005, 31, 35–55. [Google Scholar] [CrossRef] [PubMed]
  24. Tuszyński, J.A.; Brown, J.A.; Crawford, E.; Carpenter, E.J.; Nip, M.L.A.; Dixon, J.M.; Satarić, M.V. Molecular dynamics simulations of tubulin structure and calculations of electrostatic properties of microtubules. Math. Comput. Model. 2005, 41, 1055–1070. [Google Scholar] [CrossRef]
  25. Luchko, T.; Huzil, J.T.; Stepanova, M.; Tuszynski, J. Conformational analysis of the carboxy-terminal tails of human beta-tubulin isotypes. Biophys. J. 2008, 94, 1971–1982. [Google Scholar] [CrossRef] [PubMed]
  26. Zeiger, A.S.; Layton, B.E. Molecular modeling of the axial and circumferential elastic moduli of tubulin. Biophys. J. 2008, 95, 3606–3618. [Google Scholar] [CrossRef] [PubMed]
  27. Satarić, M.V.; Ilić, D.I.; Ralević, N.; Tuszynski, J.A. A nonlinear model of ionic wave propagation along microtubules. Eur. Biophys. J. 2009, 38, 637–647. [Google Scholar] [CrossRef] [PubMed]
  28. Wells, D.B.; Aksimentiev, A. Mechanical properties of a complete microtubule revealed through molecular dynamics simulation. Biophys. J. 2010, 99, 629–637. [Google Scholar] [CrossRef] [PubMed]
  29. Freedman, H.; Rezania, V.; Priel, A.; Carpenter, E.; Noskov, S.Y.; Tuszynski, J.A. Model of ionic currents through microtubule nanopores and the lumen. Phys. Rev. E Stat. Nonlinear Soft Matter Phys. 2010, 81, 051912. [Google Scholar] [CrossRef]
  30. Freedman, H.; Luchko, T.; Luduena, R.F.; Tuszynski, J.A. Molecular dynamics modeling of tubulin C-terminal tail interactions with the microtubule surface. Proteins 2011, 79, 2968–2982. [Google Scholar] [CrossRef] [PubMed]
  31. Sekulić, D.L.; Satarić, B.M.; Tuszynski, J.A.; Satarić, M.V. Nonlinear ionic pulses along microtubules. Eur. Phys. J. E Soft Matter 2011, 34, 49. [Google Scholar] [CrossRef] [PubMed]
  32. Ayoub, A.T.; Staelens, M.; Prunotto, A.; Deriu, M.A.; Danani, A.; Klobukowski, M.; Tuszynski, J.A. Explaining the Microtubule Energy Balance, Contributions Due to Dipole Moments, Charges, van der Waals and Solvation Energy. Int. J. Mol. Sci. 2017, 18, 2042. [Google Scholar] [CrossRef] [PubMed]
  33. Hemmat, M.; Castle, B.T.; Sachs, J.N.; Odde, D.J. Multiscale Computational Modeling of Tubulin-Tubulin Lateral Interaction. Biophys. J. 2019, 117, 1234–1249. [Google Scholar] [CrossRef] [PubMed]
  34. Marracino, P.; Havelka, D.; Průša, J.; Liberti, M.; Tuszynski, J.; Ayoub, A.T.; Apollonio, F.; Cifra, M. Tubulin response to intense nanosecond-scale electric field in molecular dynamics simulation. Sci. Rep. 2019, 9, 10477. [Google Scholar] [CrossRef] [PubMed]
  35. Tong, D.; Voth, G.A. Microtubule Simulations Provide Insight into the Molecular Mechanism Underlying Dynamic Instability. Biophys. J. 2020, 118, 2938–2951. [Google Scholar] [CrossRef] [PubMed]
  36. Hemmat, M.; Odde, D.J. Atomistic basis of microtubule dynamic instability assessed via multiscale modeling. Ann. Biomed. Eng. 2021, 49, 1716–1734, Erratum in Ann. Biomed. Eng. 2021,49, 2672. [Google Scholar] [CrossRef] [PubMed]
  37. Průša, J.; Ayoub, A.T.; Chafai, D.E.; Havelka, D.; Cifra, M. Electro-opening of a microtubule lattice in silico. Comput. Struct. Biotechnol. J. 2021, 19, 1488–1496. [Google Scholar] [CrossRef] [PubMed]
  38. Pokorný, J.; Pokorný, J.; Vrba, J. Generation of electromagnetic field by microtubules. Int. J. Mol. Sci. 2021, 22, 8215. [Google Scholar] [CrossRef] [PubMed]
  39. Eakins, B.B.; Patel, S.D.; Kalra, A.P.; Rezania, V.; Shankar, K.; Tuszynski, J.A. Modeling Microtubule Counterion Distributions and Conductivity Using the Poisson-Boltzmann Equation. Front. Mol. Biosci. 2021, 8, 650757. [Google Scholar] [CrossRef] [PubMed]
  40. Shi, X.X.; Wang, P.Y.; Chen, H.; Xie, P. Studies of conformational changes of tubulin induced by interaction with kinesin using atomistic molecular dynamics simulations. Int. J. Mol. Sci. 2021, 22, 6709. [Google Scholar] [CrossRef] [PubMed]
  41. Kliuchnikov, E.; Klyshko, E.; Kelly, M.S.; Zhmurov, A.; Dima, R.I.; Marx, K.A.; Barsegov, V. Microtubule assembly and disassembly dynamics model, Exploring dynamic instability and identifying features of Microtubules’ Growth, Catastrophe, Shortening, and Rescue. Comput. Struct. Biotechnol. J. 2022, 20, 953–974. [Google Scholar] [CrossRef] [PubMed]
  42. Guo, W.; Ale, T.A.; Sun, S.; Sanchez, J.E.; Li, L.A. Comprehensive study on the electrostatic properties of tubulin-tubulin complexes in microtubules. Cells 2023, 12, 238. [Google Scholar] [CrossRef] [PubMed]
  43. Berman, H.M.; Westbrook, J.; Feng, Z.; Gilliland, G.; Bhat, T.N.; Weissig, H.; Shindyalov, I.N.; Bourne, P.E. The Protein Data Bank. Nucleic Acids Res. 2000, 28, 235–242. [Google Scholar] [CrossRef] [PubMed]
  44. Jumper, J.; Evans, R.; Pritzel, A.; Green, T.; Figurnov, M.; Ronneberger, O.; Tunyasuvunakool, K.; Bates, R.; Žídek, A.; Potapenko, A.; et al. Highly accurate protein structure prediction with AlphaFold. Nature 2021, 596, 583–589. [Google Scholar] [CrossRef] [PubMed]
  45. Huang, J.; Rauscher, S.; Nawrocki, G.; Ran, T.; Feig, M.; de Groot, B.L.; Grubmüller, H.; MacKerell, A.D., Jr. CHARMM36m: An improved force field for folded and intrinsically disordered proteins. Nat. Methods 2017, 14, 71–73. [Google Scholar] [PubMed]
  46. Jo, S.; Kim, T.; Iyer, V.G.; Im, W. CHARMM-GUI: A web-based graphical user interface for CHARMM. J. Comput. Chem. 2008, 29, 1859–1865. [Google Scholar] [CrossRef] [PubMed]
  47. Rosenbluth, J. Intramembranous particle distribution at the node of Ranvier and adjacent axolemma in myelinated axons of the frog brain. J. Neurocytol. 1976, 5, 731–745. [Google Scholar] [CrossRef] [PubMed]
  48. Ritchie, J.M.; Rogart, R.B. Density of sodium channels in mammalian myelinated nerve fibers and nature of the axonal membrane under the myelin sheath. Proc. Natl. Acad. Sci. USA 1977, 74, 211–215. [Google Scholar] [CrossRef] [PubMed]
  49. Hille, B. Ion Channels of Excitable Membranes; Sinauer Associates: Sunderland, MA, USA, 2001. [Google Scholar]
  50. Cuveillier, C.; Delaroche, J.; Seggio, M.; Gory-Fauré, S.; Bosc, C.; Denarier, E.; Bacia, M.; Schoehn, G.; Mohrbach, H.; Kulić, I.; et al. MAP6 is an intraluminal protein that induces neuronal microtubules to coil. Sci. Adv. 2020, 6, eaaz4344. [Google Scholar] [CrossRef] [PubMed]
  51. Prasad, A.R.; Luduena, R.F.; Horowitz, P.M. Detection of energy transfer between tryptophan residues in the tubulin molecule and bound bis(8-anilinonaphthalene-1-sulfonate), an inhibitor of microtubule assembly, that binds to a flexible region on tubulin. Biochemistry 1986, 25, 5638–5645. [Google Scholar] [CrossRef]
  52. Shih, C.; Museth, A.K.; Abrahamsson, M.; Blanco-Rodriguez, A.M.; Di Bilio, A.J.; Sudhamsu, J.; Crane, B.R.; Ronayne, K.L.; Towrie, M.; Vlcek, A.; et al. Tryptophan-accelerated electron flow through proteins. Science 2008, 320, 1760–1762. [Google Scholar] [CrossRef] [PubMed]
  53. Sardar, P.S.; Maity, S.S.; Das, L.; Ghosh, S. Luminescence studies of perturbation of tryptophan residues of tubulin in the complexes of tubulin with colchicine and colchicine analogues. Biochemistry 2007, 46, 14544–14556. [Google Scholar] [CrossRef] [PubMed]
  54. Aubert, C.; Mathis, P.; Eker, A.P.; Brettel, K. Intraprotein electron transfer between tyrosine and tryptophan in DNA photolyase from Anacystis nidulans. Proc. Natl. Acad. Sci. USA 1999, 96, 5423–5427. [Google Scholar] [CrossRef] [PubMed]
  55. Lacombat, F.; Espagne, A.; Dozova, N.; Plaza, P.; Müller, P.; Brettel, K.; Franz-Badur, S.; Essen, L.O. Ultrafast oxidation of a tyrosine by proton-coupled electron transfer promotes light activation of an animal-like cryptochrome. J. Am. Chem. Soc. 2019, 141, 13394–13409. [Google Scholar] [CrossRef] [PubMed]
  56. Tasaki, I. New measurements of the capacity and the resistance of the myelin sheath and the nodal membrane of the isolated frog nerve fiber. Am. J. Physiol. 1955, 181, 639–650. [Google Scholar] [CrossRef] [PubMed]
Figure 1. Modeling of the electric fields (EFs) inside a neuro-MT at the resting state. (A) Modeling of the relative magnitude of EFs on the central axis (z-axis) inside a neuro-MT. During the modeling analysis, each of the outside negative-charged amino acid residues is assigned to carry a certain amount of average charge ranging from +0.16 to +0.21), and then the relative magnitude and directions of the EF on the central axis are calculated. (B) Relative EF intensity on the central axis of a neuro-MT at the resting state where the negative-charged residues on the outer surface are neutralized and 17.0% (240/1412) of these residues are bound with a K+ ion (i.e., carrying a net charge of +1). (C) EF directions and relative intensities inside a neuro-MT at the resting state. The blue arrows depict the EF directions at relevant positions, and the arrow length represents the relative magnitude of the EF intensity. (D) EF directions and relative intensities (based on arrow length) on the cross-section at the resting state. Note that the relative EF intensity (y-axis) in panels (A,B) is theoretically proportional to the absolute ER intensity (in unit of V/Å), which can be derived from multiplying the relative EF intensity value with a constant specially adjusted for the modeling condition.
Biophysica 06 00061 g001
Figure 2. Modeling of the electric fields (EFs) inside a neuro-MT at the active state. (A) Relative EF intensities on the central axis of a neuro-MT during the active state. To mimic the active state, approximately 36% of the outer surface residues in a small fraction of a neuro-MT (i.e., the NR region) are allowed to carry a net charge of +1 while other remainder residues are neutralized (i.e., without carrying any charge). Note that the relative EF intensity (y-axis) in panel (A) is theoretically proportional to the absolute ER intensity (in unit of V/Å), which can be derived from multiplying the relative EF intensity value with a constant specially adjusted for the modeling condition. (B) Schematic depiction of the EF directions and relative intensities inside a neuro-MT during the active state. The blue arrows depict the EF directions at relevant positions, and the arrow length represents the relative magnitude of the EF intensity. (C) EF directions and relative intensities (based on arrow length) on the cross-section at the active state.
Biophysica 06 00061 g002
Figure 3. Modeling of the movement of free electrons inside the vacuum tunnel of a neuro-MT. (A) Schematic depiction of the six free electrons inside the vacuum tunnel of a neuro-MT at the initial resting state. The blue colored bars represent the regions where the myelin sheath is located. Two nodes of Ranvier (NR1 and NR2) are drawn. At the resting state, the EF is zero inside the neuro-MT tunnel, and the electrons are static. (B) When an action potential (AP) is generated at NR1, the clamping voltage will have a drawing force on all six free electrons in the same direction. The closer of the electron to the clamping voltage, the stronger the drawing force. (C) When the AP moves to NR2, the clamping voltage at NR1 is expected to disappear very quickly. The forces generated by the “clamping voltage” at NR2 will exert a drawing force on the free electrons on both sides of NR2 in opposite directions. (D) Quantitative analysis of the positions of the six free electrons inside the tunnel of a neuro-MT during the initial 200 relative time units (note that an AP will stay in a NR for only 100 relative time units and will then move to the next NR). Here, it should be noted that when the AP jumps to the next NRs, the disappearance of the clamping voltage at the preceding NR may quickly stop moving in either direction due to the EFs there which will force the free elections to move toward the inner surface and stay there. In the modeling results shown here, all the free electrons at the NR1 are still allowed to continue to move according to the forces acting on them when the AP jumps to NR2.
Biophysica 06 00061 g003
Figure 4. Proposed mechanism of neuro-MT-mediated saltatory neuroelectrical transmission. (A) Schematic illustration of an axon that contains bundles of neuro-MTs inside. The left side represents an axon’s distal end, which is close to the neuronal body (soma) and commonly referred to as the “plus end” of a neuro-MT. The right side is the minus end (close to the synapse) of a neuro-MT. The myelin sheath wrapping around the axon (in blue) is usually 1–2 mm in length and separated by a short space (1–5 μm) called “node of Ranvier” (NR). (B) Distribution of free electrons inside a neuro-MT under the resting condition. The blue colored bars represent the regions where the myelin sheath is located. As depicted, at the resting state, more free electrons gather inside the MT segments corresponding to the NRs, and the free electrons are closely attached to the inner surface region, supposedly in close contact with the positive-charged residues. (C,D) Movements of free conduction electrons inside a neuro-MT following the generation of an AP at the trigger zone. The formation of an AP in a small segment of a neuro-MT is associated with fast Na+ influx, and then the cations will bind to the outer surface of the neuro-MT in that segment, which is functionally similar to placing a “clamping voltage” there. Due to the EF formed on the cross-sections, the free electrons will move toward the center part of the tunnel (as depicted in (C)), and in the meantime, the free electrons on the right (including those at NR1) will begin to move toward the trigger zone (D). The migration of some free electrons inside a neuro-MT away from NR1 will result in the release of cations which are initially attracted to the outer surface of the neuro-MT in that segment. The released cations will then increase the free cation concentrations in that part of the cytosol, which will cause a small increase in the original resting potential (usually around –70 mV) inside the nerve terminal and thus trigger an AP (through activation of the voltage-sensitive fast Na+ channels in the NR1). Note that the blue arrows indicate the directions of free electron movements, and arrow thickness reflects the relative EF intensity exerted on the free electrons. (E) Movements of the free conduction electrons inside a neuro-MT when an AP is triggered at NR1. The clamping voltage at NR1 will draw the free electrons on the right continue to move toward NR1, which will lead to the generation of AP at the subsequent NR2. Meanwhile, the clamping voltage will also exert an opposite EF on the free conducting electrons on the left (they are still moving toward to the trigger zone), and this effect will either slow down their leftward movement or may even change the original direction of movement. As represented by the red electrons, after each neurotransmission, only a very small quantity of free conduction electrons is consumed, i.e., exiting the neuro-MT and reaching the end pool. (F) Movements of the free conduction electrons inside a neuro-MT when an AP is triggered at NR2. The sequence of events will be nearly identical to what are seen when an AP is generated at NR1 as described above for (E).
Biophysica 06 00061 g004
Disclaimer/Publisher’s Note: The statements, opinions and data contained in all publications are solely those of the individual author(s) and contributor(s) and not of MDPI and/or the editor(s). MDPI and/or the editor(s) disclaim responsibility for any injury to people or property resulting from any ideas, methods, instructions or products referred to in the content.