5.1. Engineering Geological Analysis
The study slope consists of an overlying Quaternary colluvial–talus block-stone layer and underlying limestone and shale, exhibiting a typical soil–rock binary structure. The slope is generally steep in the upper part and gentle in the lower part, with a large elevation difference and therefore high gravitational potential energy.
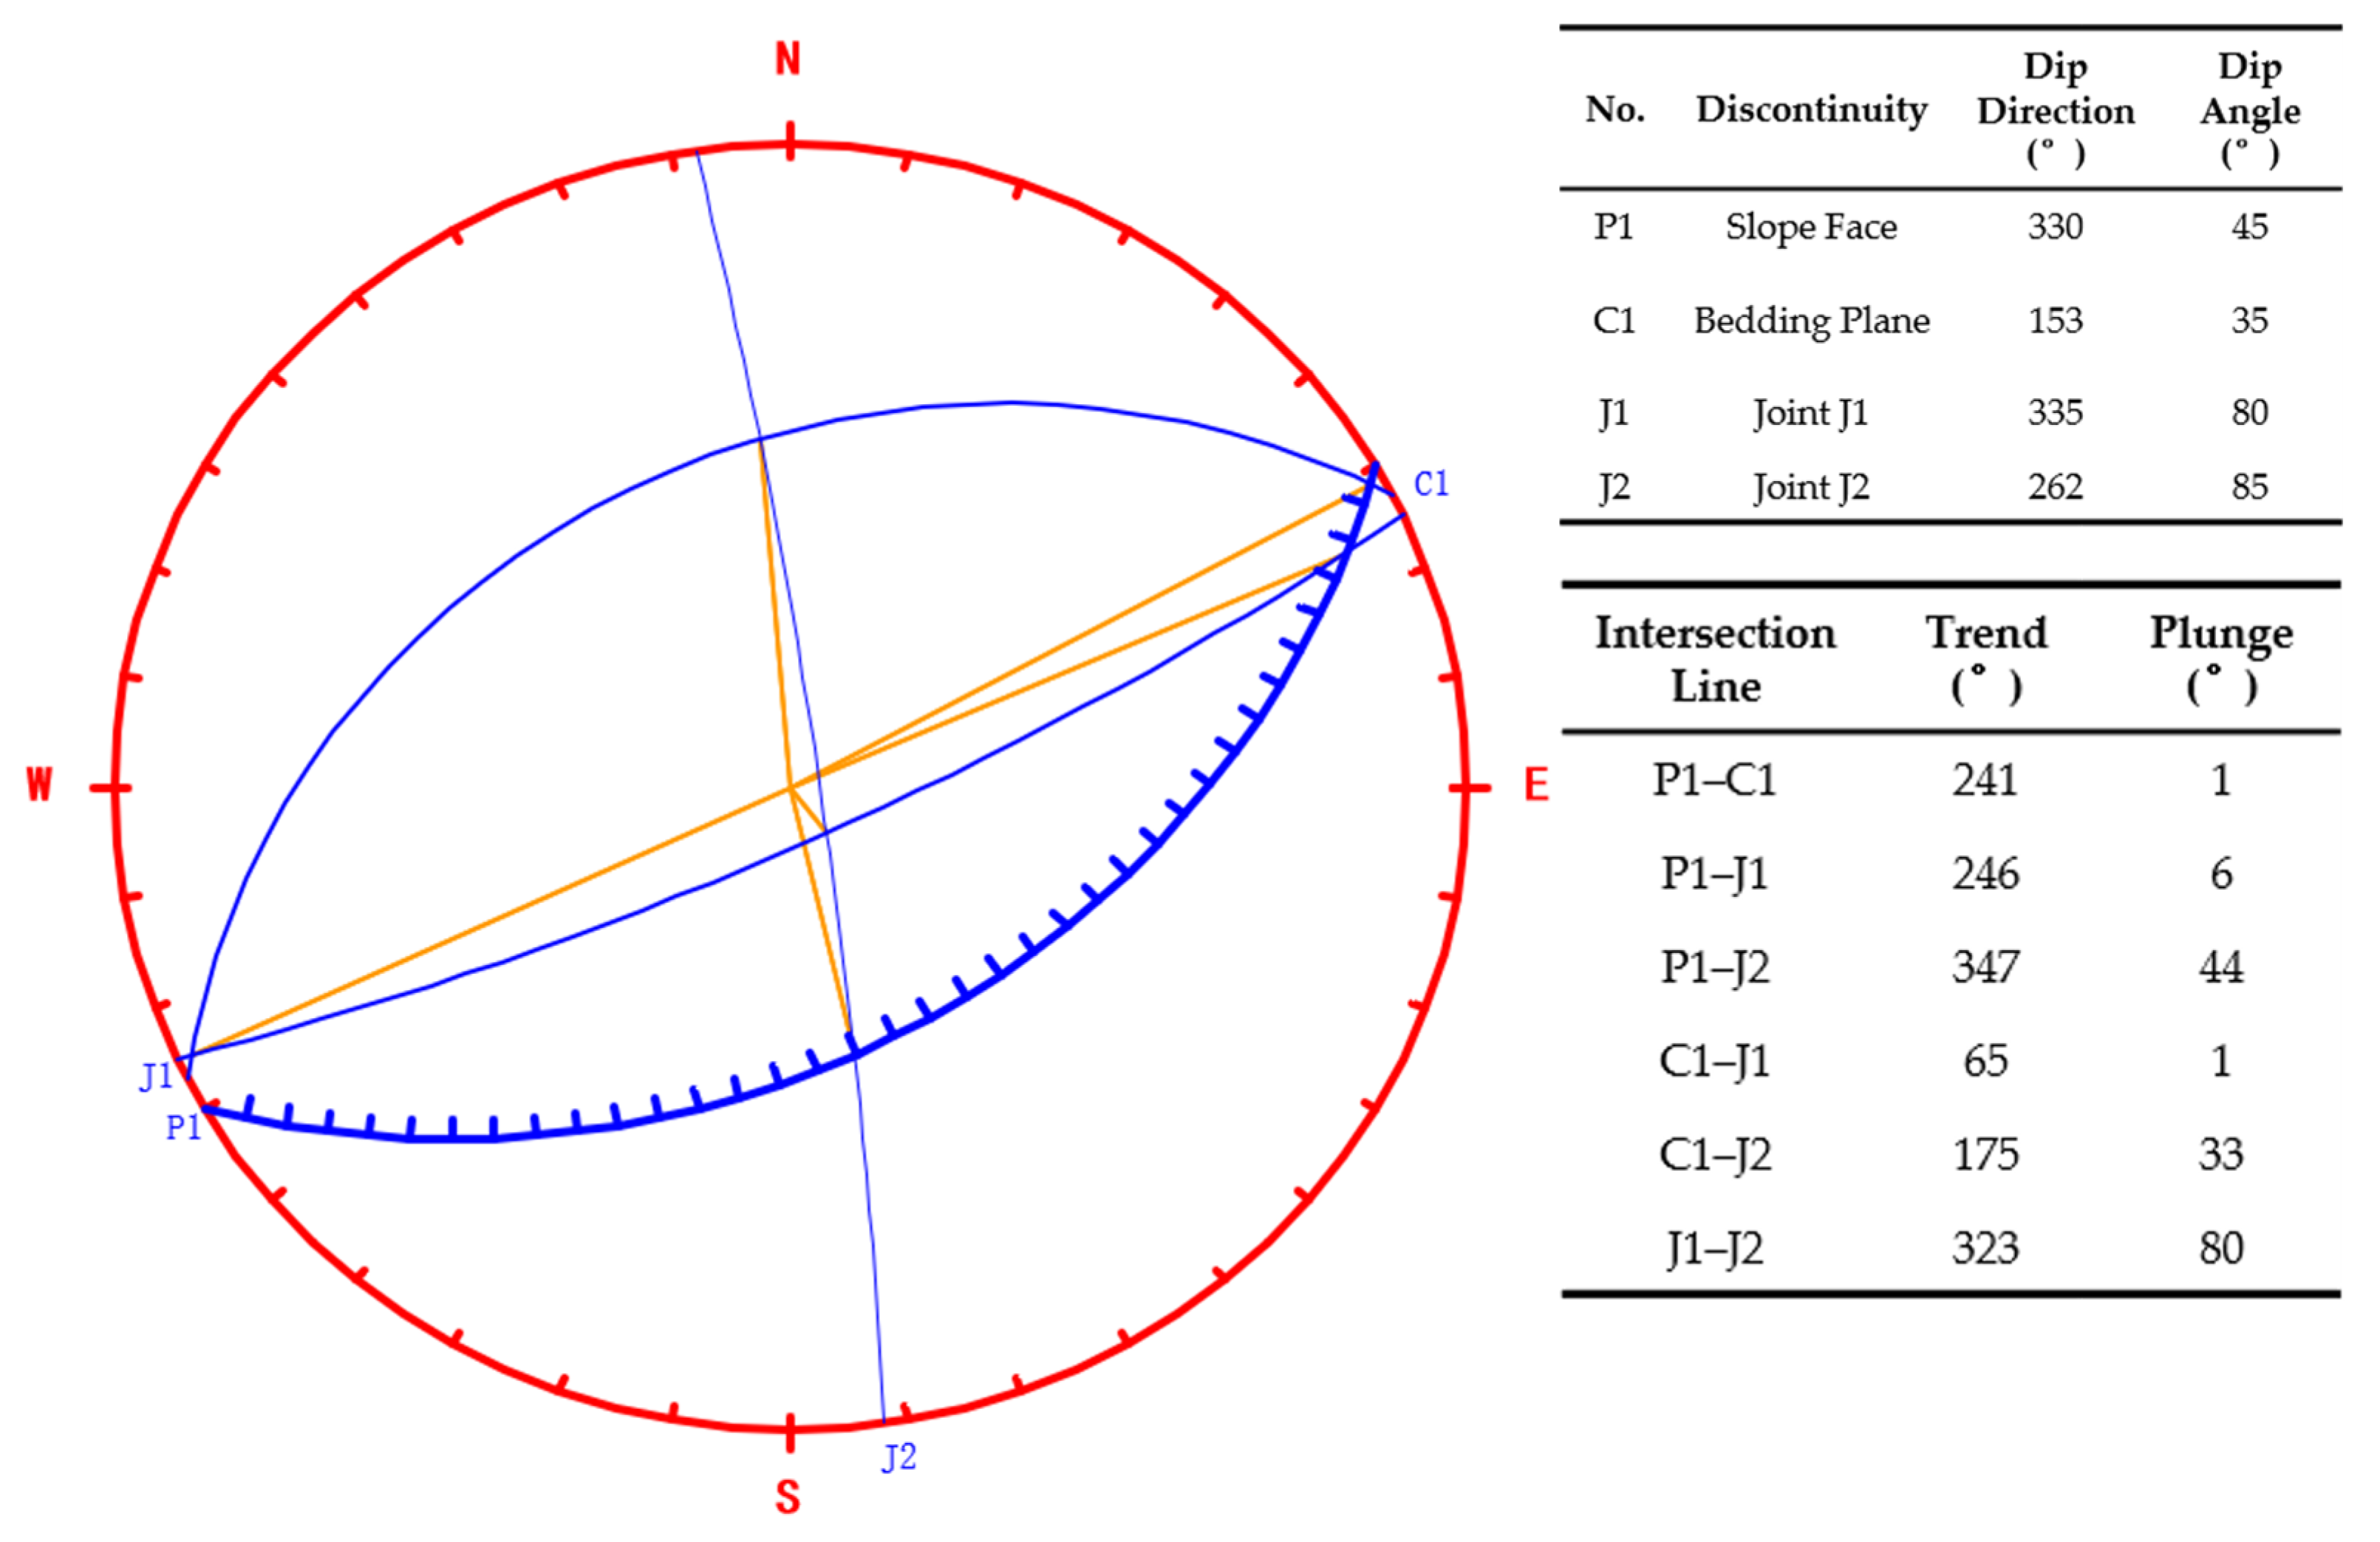
Field investigation and stereographic projection indicate that two dominant discontinuity sets are developed in the slope (
Figure 4). The bedding orientation is 153°∠35° and dips into the slope; the orientations of discontinuities J1 and J2 are 335°∠80° and 262°∠85°, respectively. The stereographic projection shows that J1 dips approximately in the slope direction and has a steep dip angle, creating favorable conditions for downslope deformation and making toppling–bending deformation likely under gravity and rainfall. J2 intersects the slope at a high angle and is comparatively favorable to overall stability. In addition, the intersection line of J1 and J2 trends approximately in the slope direction, indicating that local block sliding may occur. The discontinuity combination not only controls the subdivision of the rock mass into blocks but also provides preferential pathways for rainfall infiltration.
In terms of the soil–rock assemblage, the overlying block-stone layer is thick, uncemented, highly porous, and highly permeable. The underlying limestone contains well-developed joints and fractures that provide pathways for further downward infiltration, whereas the shale layer has markedly lower permeability and acts as a relative aquitard. Controlled by these permeability contrasts, rainfall can migrate rapidly downward through pores in the block-stone layer and the fracture network and then form a local perched-water zone near the top of the underlying low-permeability shale.
As rainfall continues, water infiltrates progressively deeper into the slope and accumulates near the strongly weathered shale interface. Owing to the hydraulic barrier effect of the underlying low-permeability shale, matric suction at the interface continuously decreases, pore-water pressure gradually rises, and a transient saturated zone forms. From an engineering-geological perspective, the strongly weathered shale is susceptible to softening and slaking upon wetting. In the present numerical model, however, the rainfall-induced response is primarily represented through changes in matric suction, pore-water pressure, and effective stress rather than through explicit moisture-dependent degradation of the shear-strength parameters. This simplification may underestimate the additional mechanical weakening associated with wetting-induced softening of the strongly weathered shale. Under prolonged heavy rainfall, pore-pressure accumulation and the associated reduction in effective stress further enhance the tendency for sliding along the weak interface.
The combined analysis shows that deformation and instability of the study slope are jointly controlled by topography, discontinuity combinations, and permeability contrasts among the strata. The topography provides the gravitational driving potential; rear-margin cracks and discontinuities form preferential infiltration pathways; the upper block-stone layer–strongly weathered limestone interface controls the principal deformation zone under natural conditions; and the deep strongly weathered shale interface controls the location of pore-pressure accumulation and the development of a potential sliding surface after rainfall.
5.2. Numerical Simulation Analysis
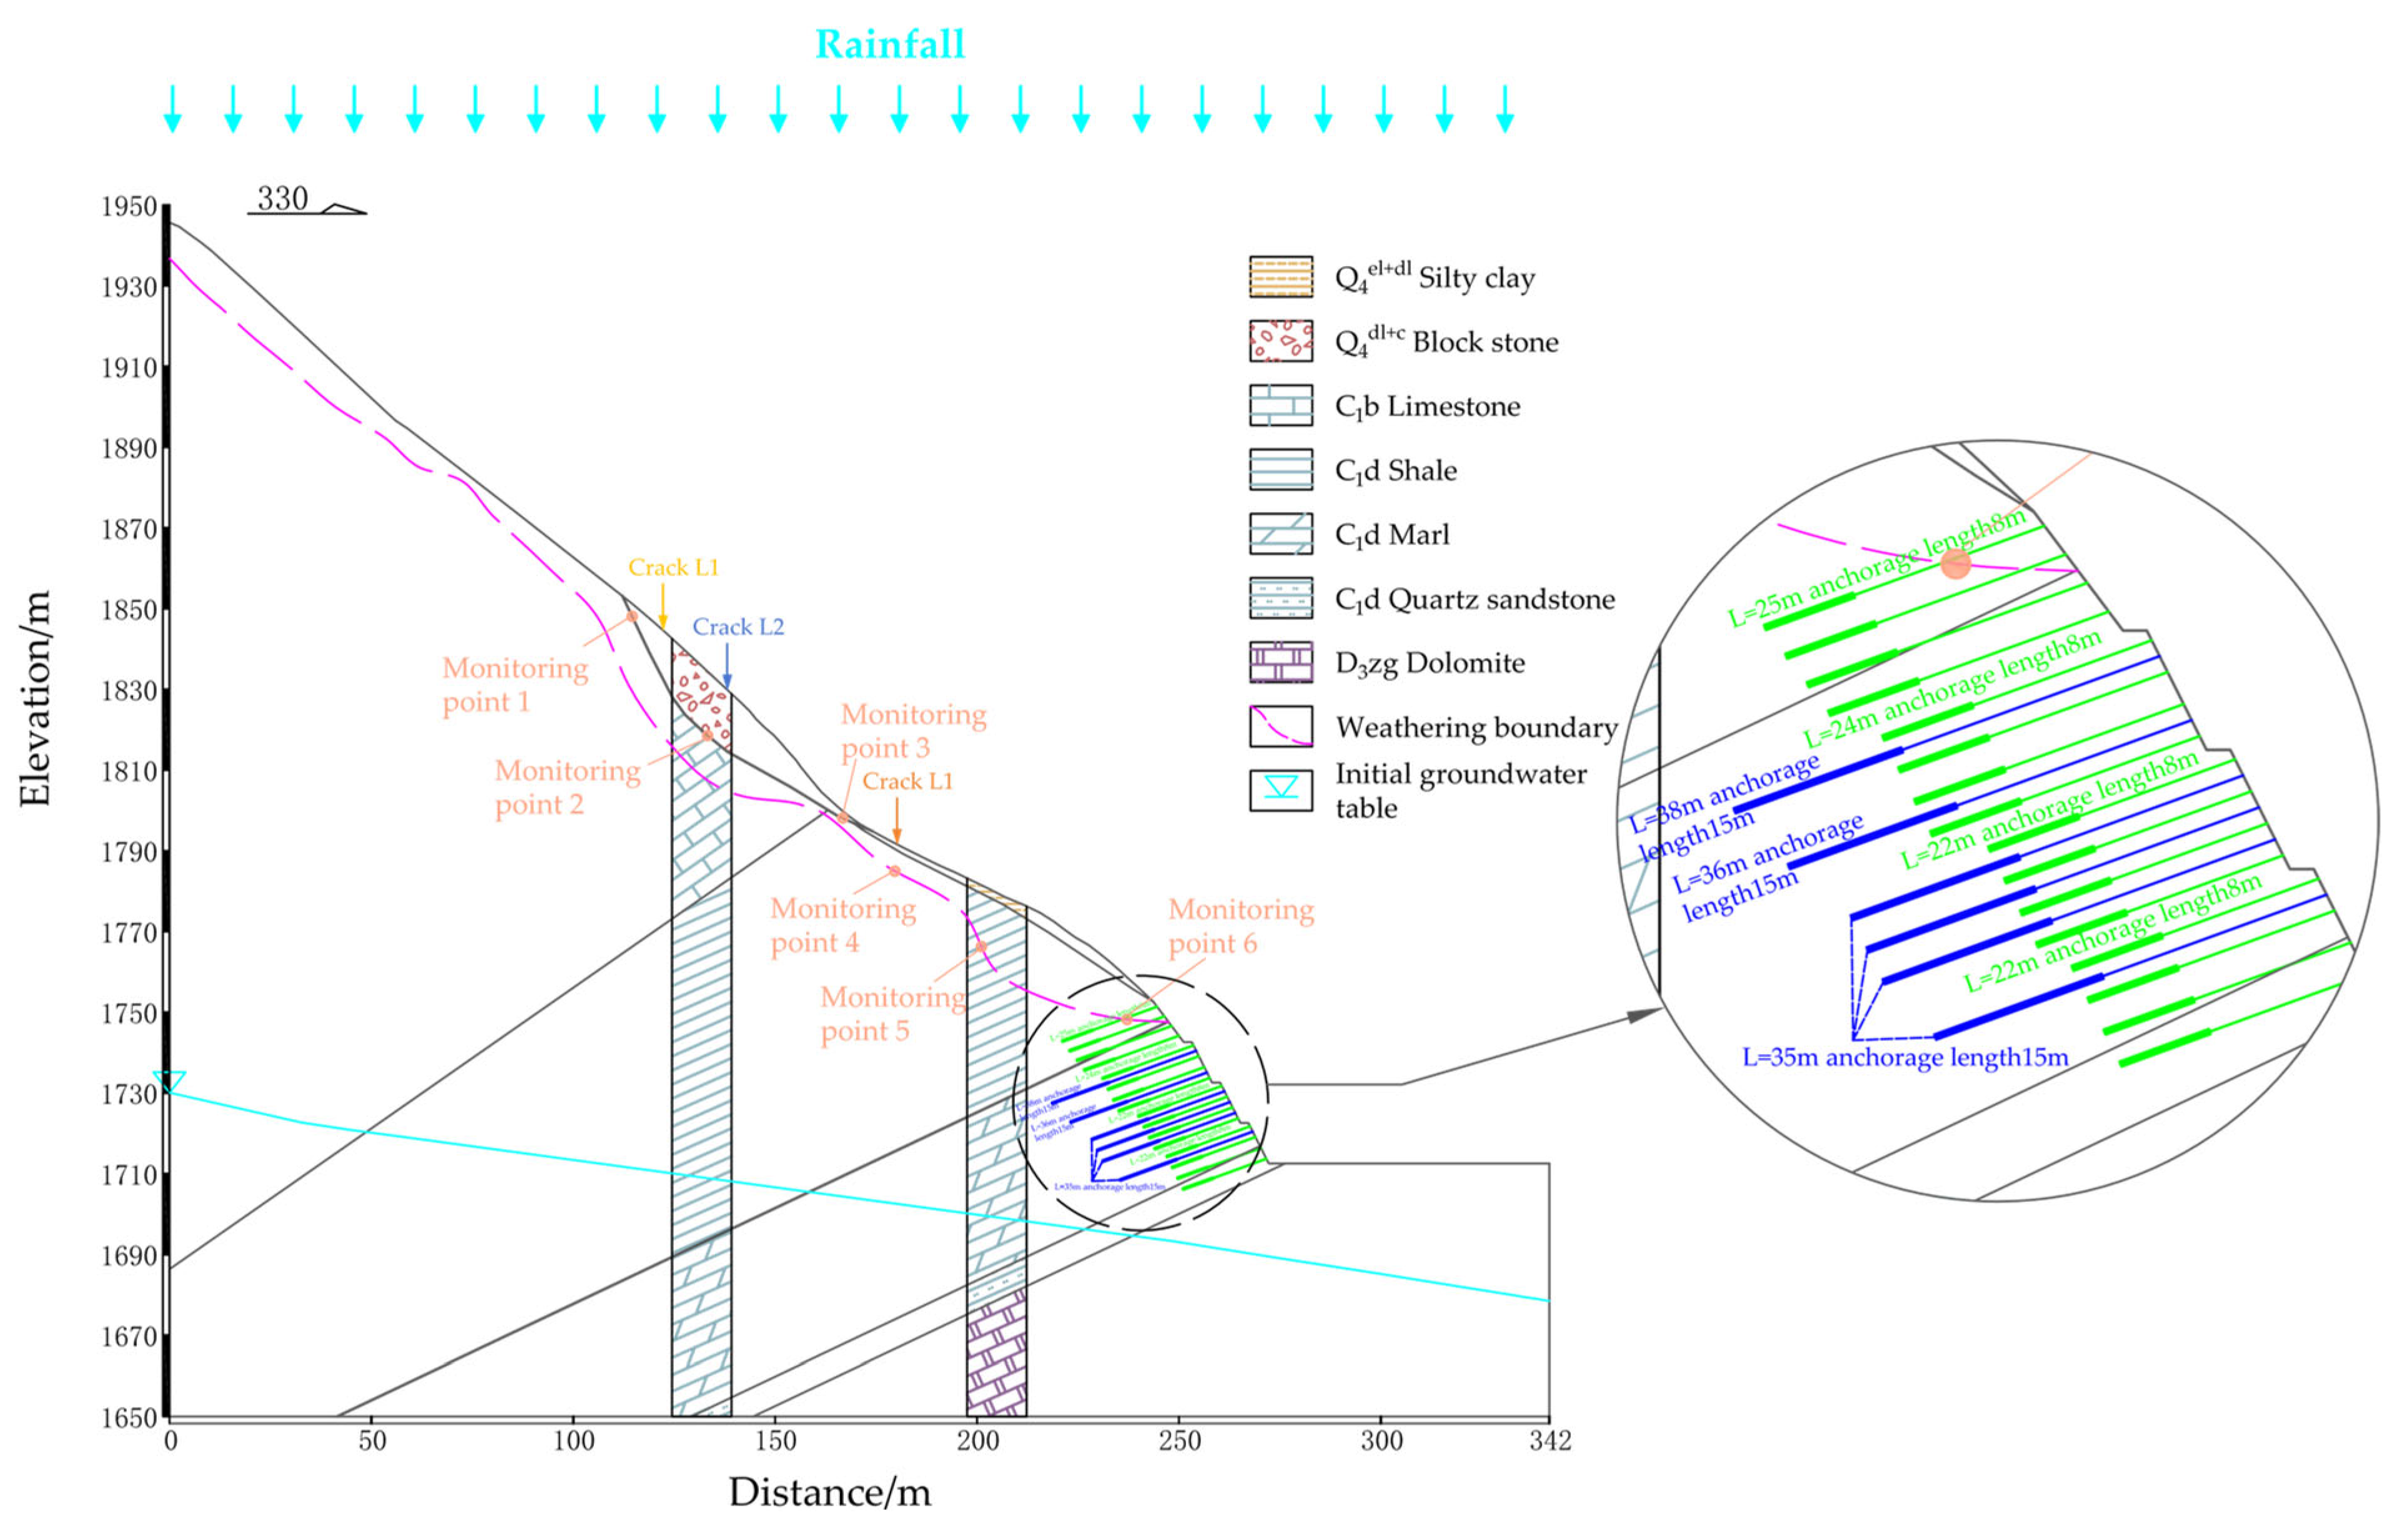
To investigate the deformation zoning and progressive instability of the soil–rock binary-structure slope under natural conditions and prolonged heavy rainfall, a representative geological section passing through the principal deformation zone and approximately aligned with the main slope direction was selected based on geological mapping, geophysical exploration, field investigation, and available geological data (
Figure 5). A geometrically simplified two-dimensional model was subsequently established in MIDAS GTS NX 2024. A plane-strain assumption and the Mohr–Coulomb constitutive model were adopted. At the engineering scale considered in this study, the weathered and fractured rock masses were treated as equivalent continua. The mapped J1 and J2 discontinuity sets were therefore not introduced as discrete joint elements; instead, their mechanical influence on rock-mass integrity was represented indirectly through reduced equivalent rock-mass parameters, while lithological contacts were represented by contrasts in material properties between adjacent strata. Accordingly, the model was intended to characterize the overall shear-yielding response and evolution of the potential failure zone rather than the opening or sliding of individual discontinuities. The two-dimensional model represents the dominant in-plane seepage and deformation response of the selected section, whereas out-of-plane deformation, lateral seepage, and the three-dimensional connectivity of individual discontinuities are not explicitly reproduced.
The baseline model contained 12,746 elements and 12,857 nodes. An element size of 1.0 m was adopted for the strongly weathered shale, strongly weathered limestone, block-stone layer, and silty clay, whereas the element size in the remaining strata gradually increased from 1.0 to 4.0 m. To assess mesh sensitivity, the four key strata were locally refined to 0.5 m while the mesh configuration of the remaining strata was kept unchanged, resulting in 28,821 elements and 28,946 nodes. The factors of safety obtained with the baseline and refined meshes were 1.1344 and 1.1407 under natural conditions and 0.9886 and 0.9989 after 72 h of rainfall, respectively, corresponding to relative differences of approximately 0.6% and 1.0%. The refined mesh also reproduced a similar spatial distribution and coalescence of the plastic zone along the strongly weathered shale interface after 72 h of rainfall. The small differences in the factor of safety, the unchanged stability classification, and the consistent plastic-zone pattern indicate that the main numerical results and the identified failure mechanism are not significantly affected by local mesh refinement.
The physical and mechanical parameters used in the numerical model were determined based on the lithological characteristics, weathering degree, rock-mass structure, and engineering geological conditions identified from the site investigation, together with the relative mechanical contrasts among the strata and engineering experience for comparable geological conditions. The displacement monitoring data were not used for parameter adjustment and were retained as an independent field dataset for subsequent evaluation of the modeled deformation pattern under natural conditions. The adopted material parameters are listed in
Table 2. The anchor cables in the reinforced cut slope were modeled using embedded truss elements with an elastic modulus of 195 GPa. According to the project design report, each anchor cable consists of four 15.2 mm low-relaxation steel strands with a tensile strength of 1860 MPa, and the design anchoring force of a single cable is 500 kN. For the mechanical boundary conditions, horizontal displacement was constrained along the left and right boundaries, whereas both horizontal and vertical displacements were constrained along the base.
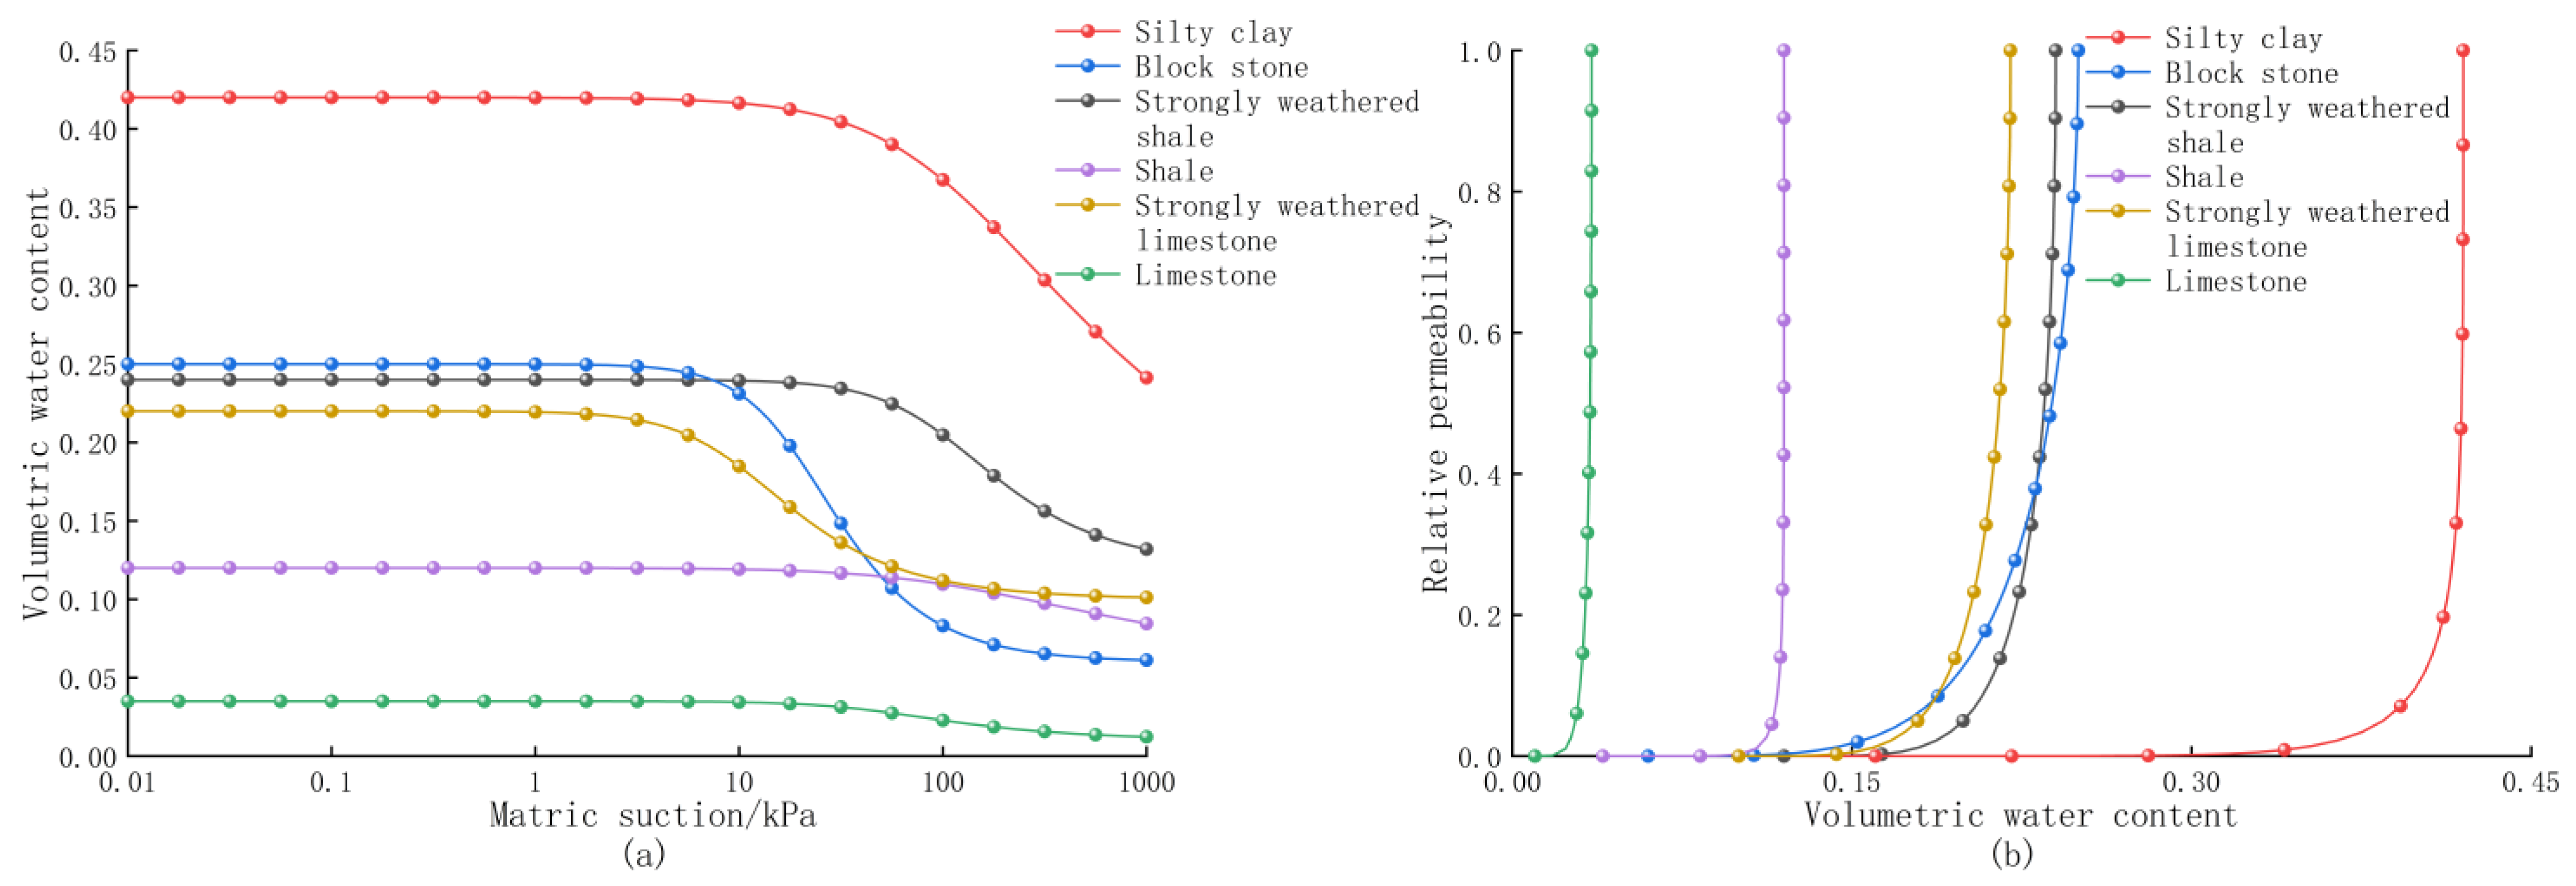
The numerical analysis comprised two stages. First, the initial geostress and seepage fields were established under natural conditions, and the corresponding deformation and stability state were evaluated. Second, the recorded maximum daily rainfall of 175.6 mm/d for the study area was continuously applied to the slope surface for 72 h to construct an idealized extreme prolonged-rainfall scenario and investigate the progressive response of the slope. The 72 h duration was adopted to examine the evolution from shallow rainfall infiltration to deep instability rather than to reproduce a specific historical three-day rainfall event. Transient coupled seepage–stress analysis was performed using the unsaturated hydraulic parameters in
Table 1 and the physical and mechanical parameters in
Table 2. Rainfall infiltration modifies the hydraulic state through changes in matric suction, permeability, and pore-water pressure, with the resulting variation in effective stress governing the mechanical response. Cohesion and friction angle were not varied with moisture conditions during the transient rainfall analysis. Pore-water pressure, displacement, plastic-zone development, and the factor of safety at different rainfall durations were subsequently used to characterize the progressive evolution from infiltration to overall instability.
For stability evaluation, the factor of safety was calculated using the strength reduction method (SRM) in MIDAS GTS NX. For a trial reduction factor F, the shear-strength parameters were reduced according to = c/F and tan = tan/F. The nonlinear iterations adopted a displacement-norm convergence criterion with a tolerance of 0.001. Numerical nonconvergence, together with the development of a continuous plastic zone, was used to identify the critical instability state. The corresponding critical reduction factor was taken as the factor of safety, while the displacement field was used as supplementary evidence for identifying the failure mode.
5.2.1. Stability Analysis Under Natural Conditions
To reproduce the initial stress state of the slope, stress–seepage equilibrium was first established under gravity loading, displacement boundary conditions, and the initial groundwater condition. The strength reduction method then yielded a factor of safety of 1.1344. According to the Specification for Investigation of Landslide Prevention and Control Engineering (GB/T 32864–2016) [
23], the stability state under natural conditions was classified using
Table 3, and the slope was found to be basically stable.
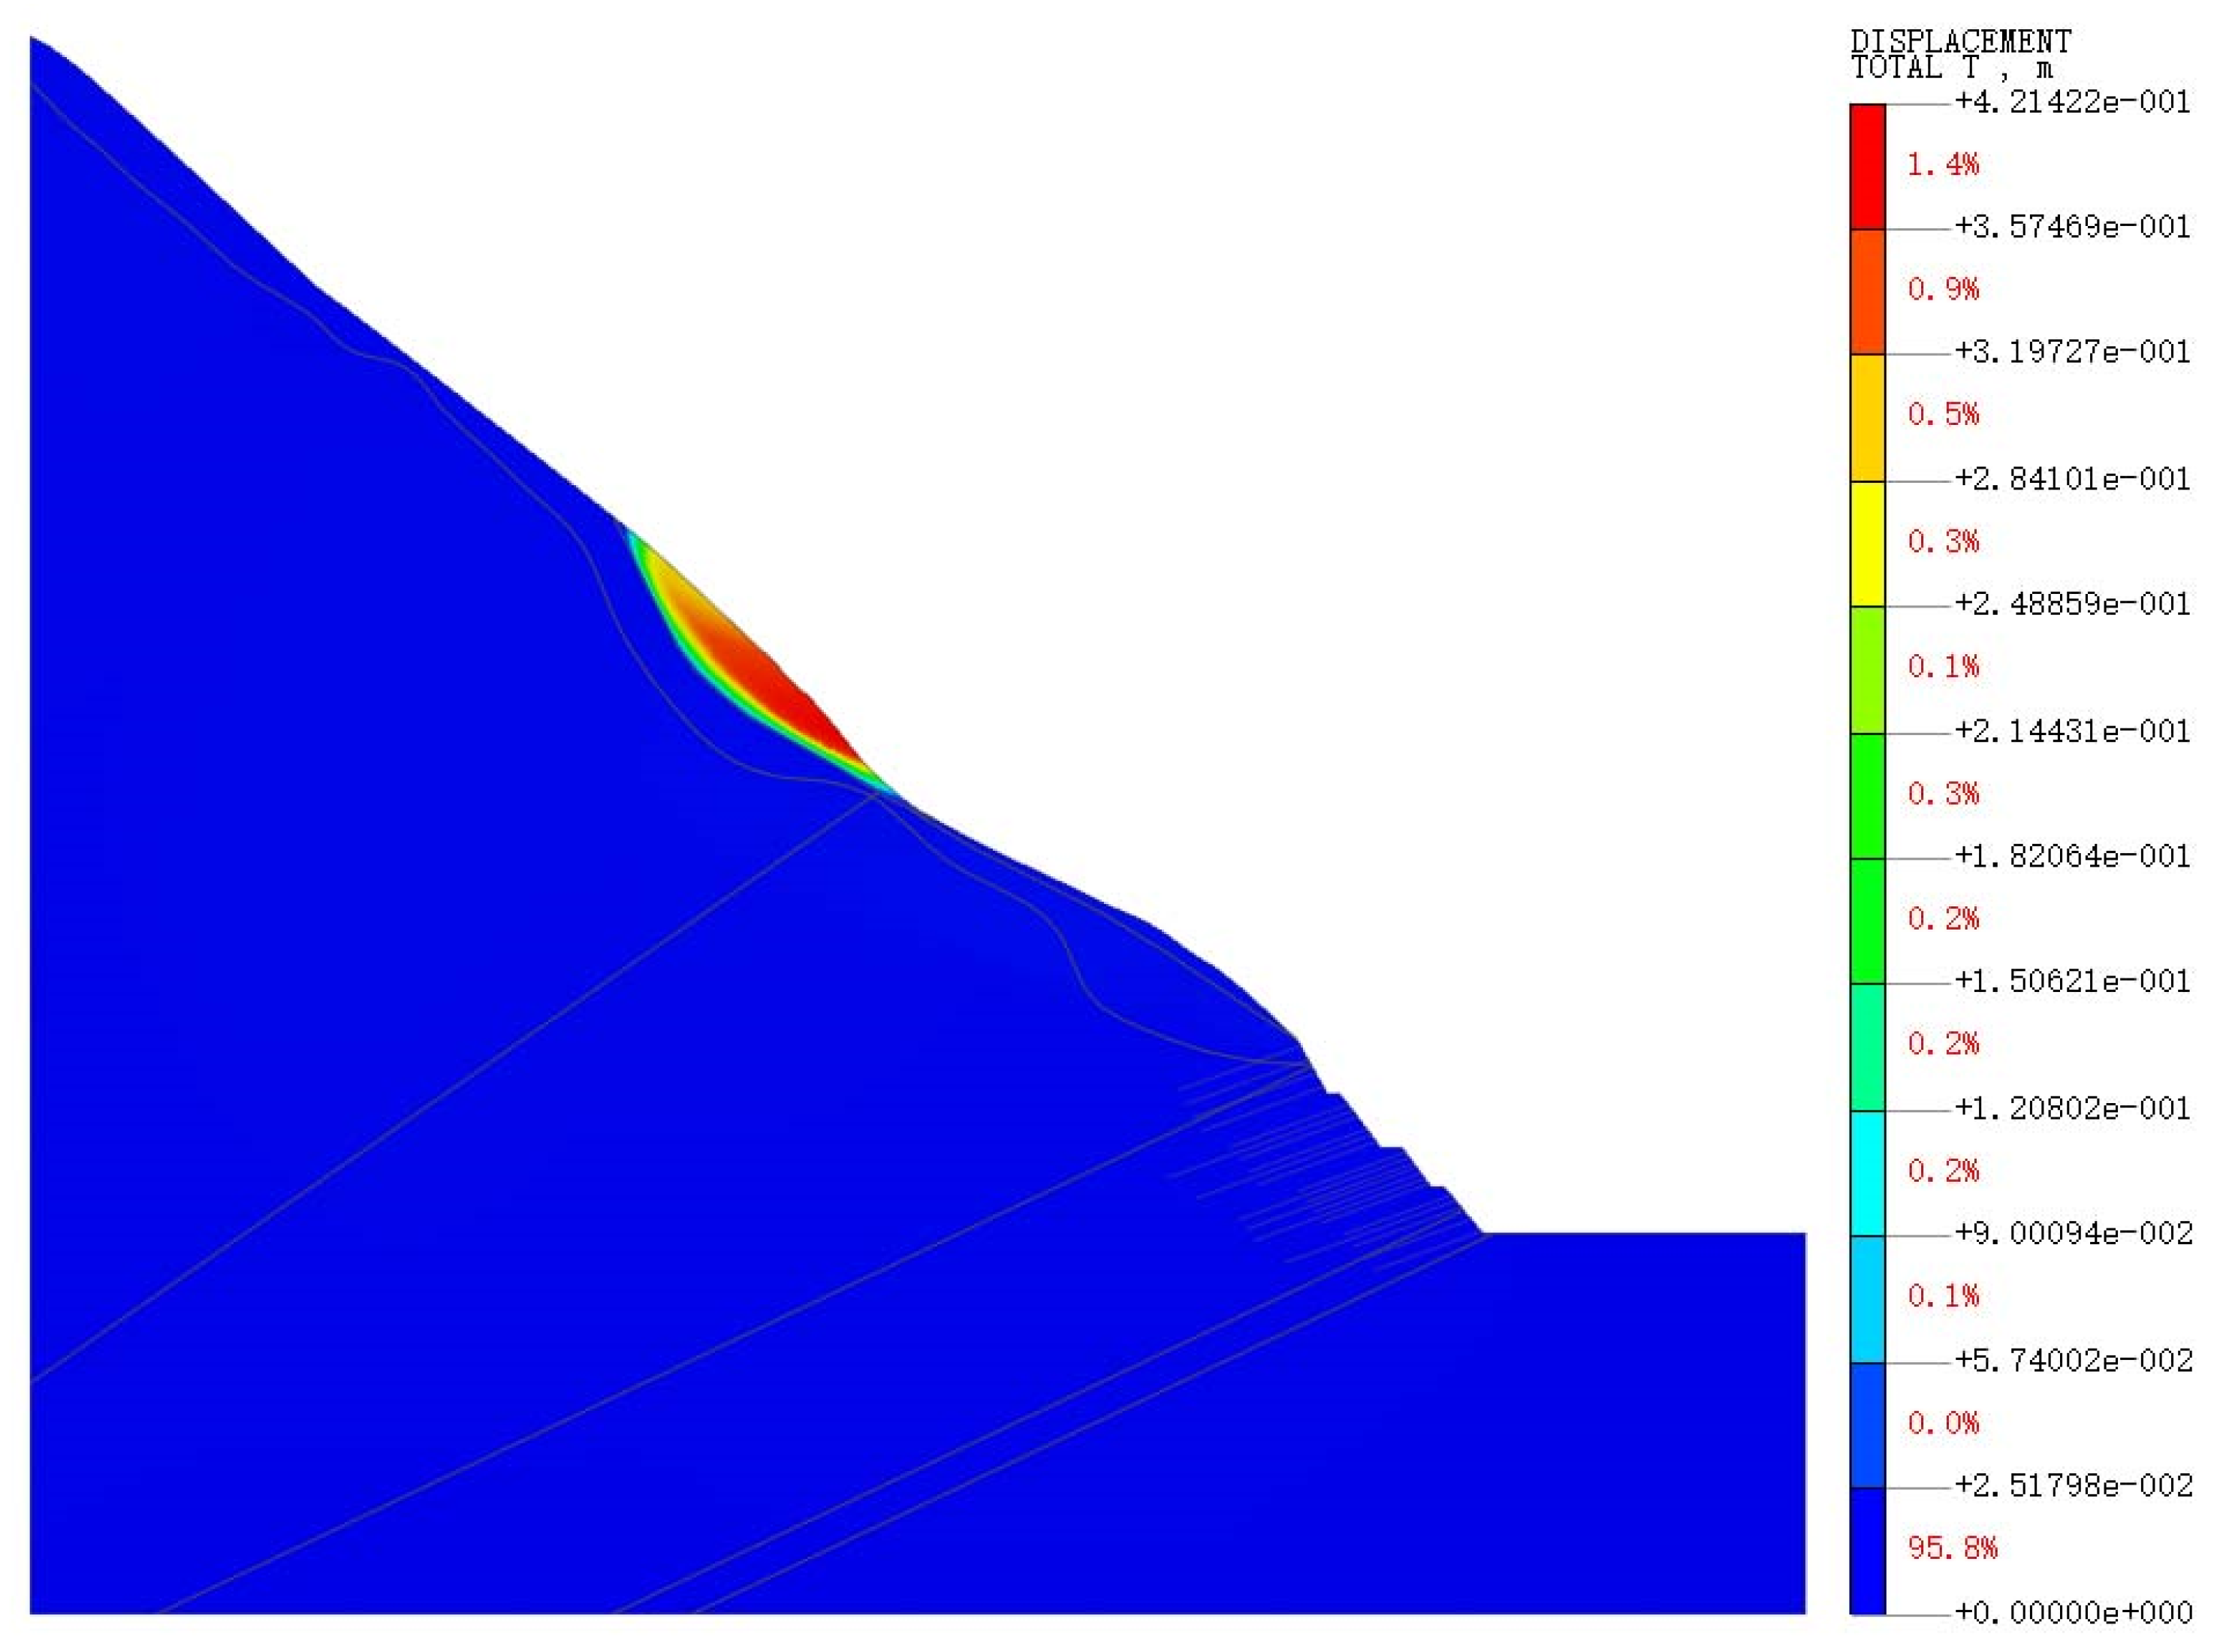
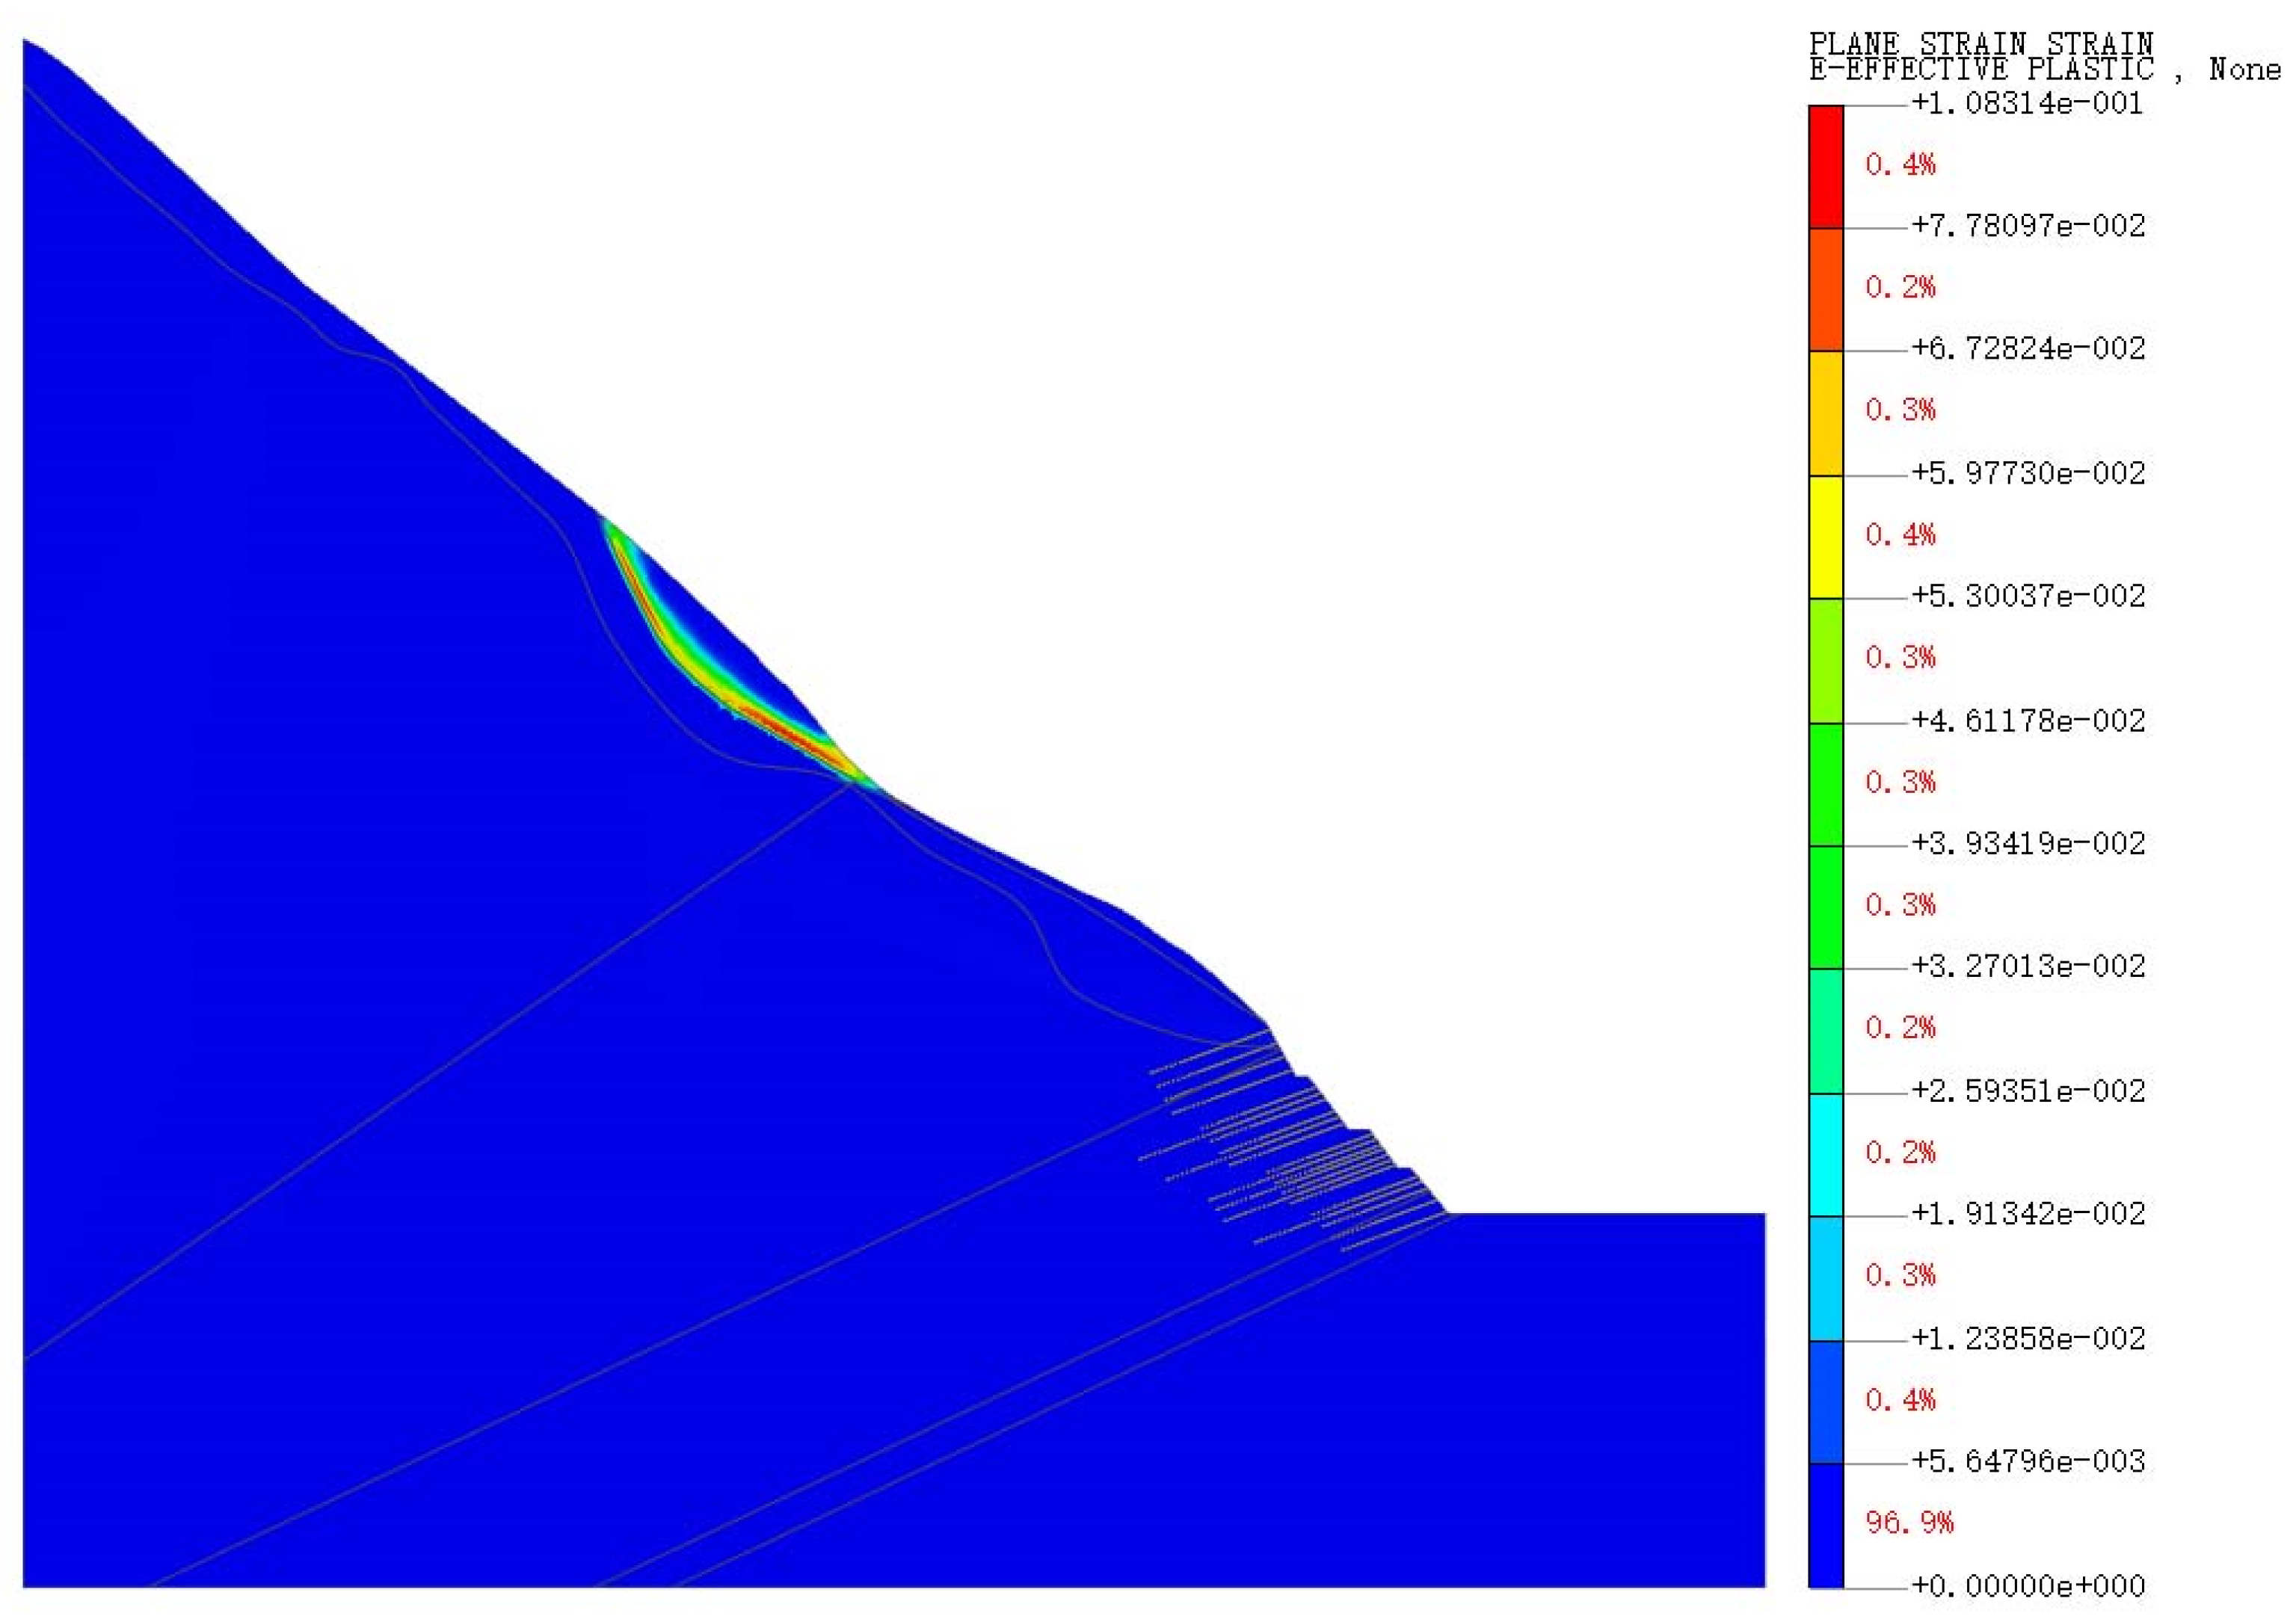
Figure 6 and
Figure 7 show the numerical displacement and plastic-zone distributions at the critical strength-reduction state under the natural hydraulic condition. These results are used to identify the potential deformation and failure pattern rather than to represent the actual field displacement under natural conditions. At this critical state, deformation and yielding are mainly concentrated near the upper block-stone layer–strongly weathered limestone interface. The maximum numerical displacement reaches 42.14 cm; this value corresponds to the critical state generated by the strength reduction analysis and should not be interpreted as the actual displacement of the slope under natural conditions. The plastic-zone map shows a continuous plastic zone along the interface, with the maximum plastic strain occurring in the middle segment of the interface and near the slope crest. These results indicate that the upper block-stone layer–strongly weathered limestone interface is the principal potential sliding surface under natural conditions, whereas displacement and plastic deformation in the lower slope are relatively limited.
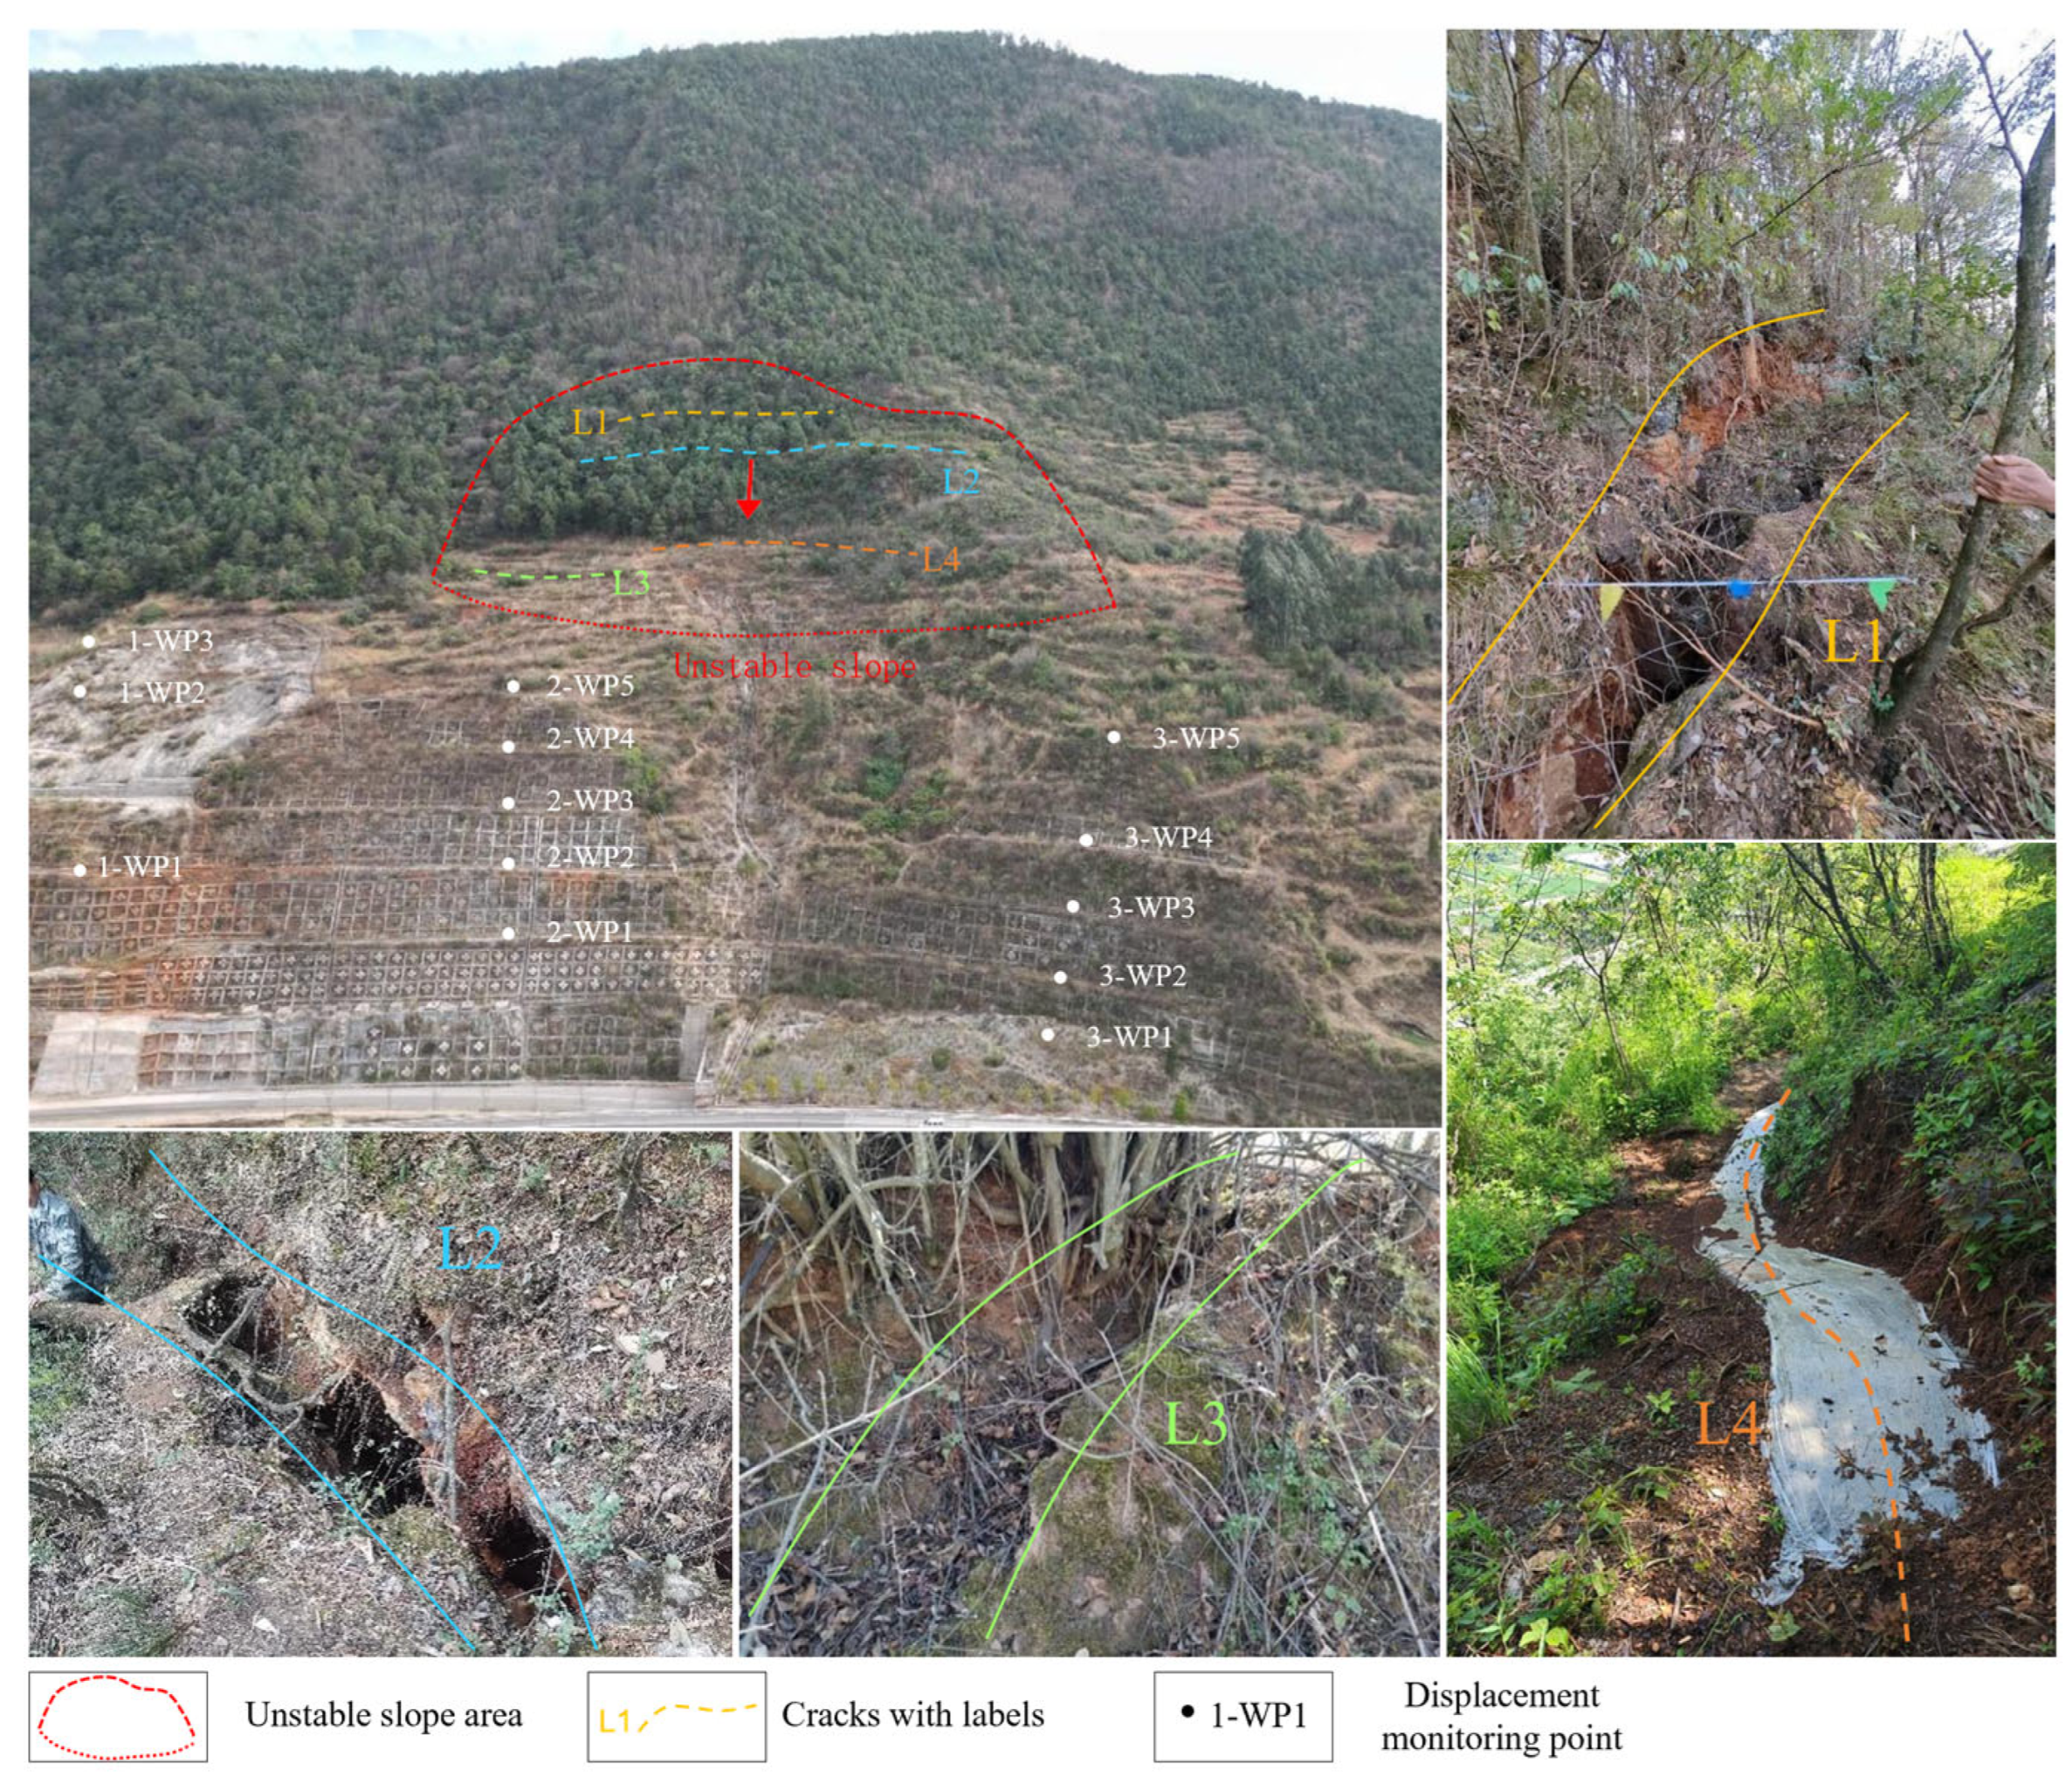
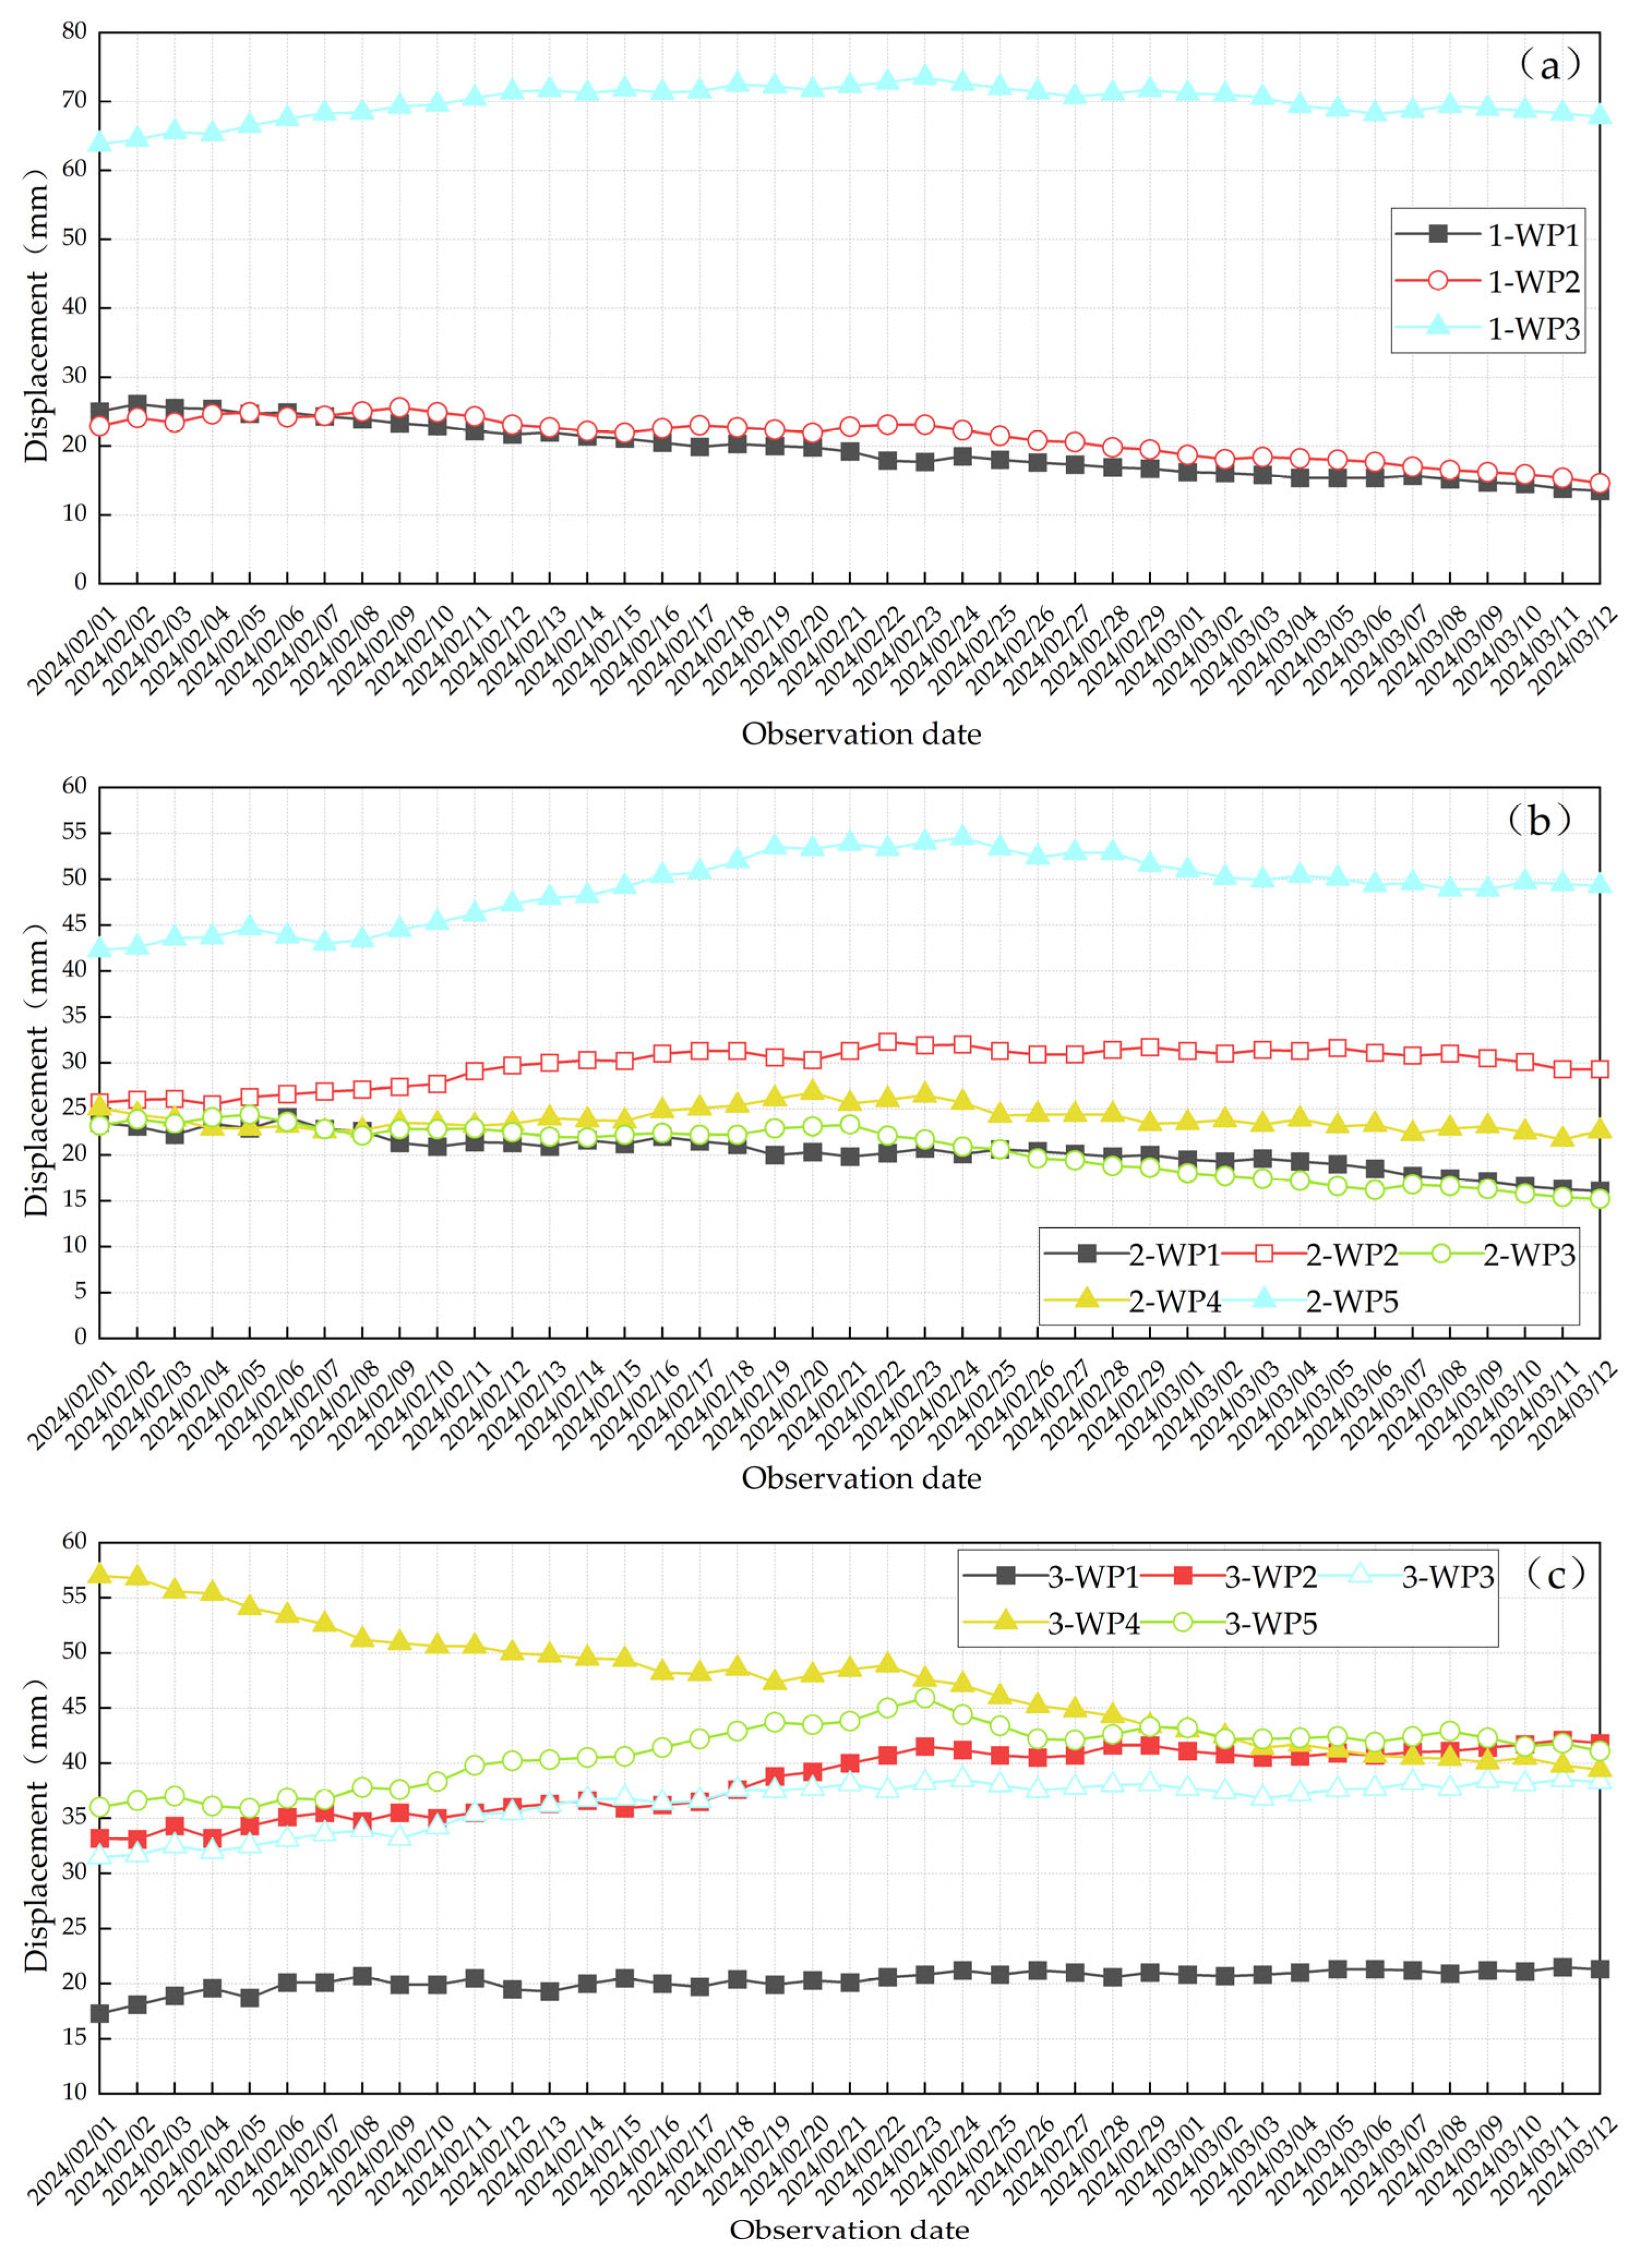
To evaluate the actual deformation of the reinforced cut slope at the toe, displacement monitoring data from Sections I, II, and III between 1 February and 12 March 2024 were analyzed (
Figure 8); the monitoring locations are shown in
Figure 2. Displacements at all monitoring points changed gradually during the monitoring period, with only small variations between successive measurements and no sustained acceleration. The maximum cumulative displacement at Section I was 73.5 mm at point 1-WP3; that at Section II was 54.5 mm at point 2-WP5; and that at Section III was 57.0 mm at point 3-WP4. Overall, displacements at the three monitoring sections fluctuated slightly or gradually stabilized, indicating that the reinforced cut slope at the toe remained stable.
Field investigation indicates that the principal deformation zone lies in the middle–rear portion of the slope, whereas displacement in the reinforced toe zone remained generally gradual during the 2024 monitoring period. The numerical model under the natural hydraulic condition reproduces the same overall spatial deformation pattern, with more pronounced deformation in the middle–rear slope and relatively limited response in the reinforced toe zone. Because the monitoring data in
Figure 8 were not used for parameter adjustment, the observed agreement provides an independent qualitative evaluation of the modeled deformation zoning. This comparison is limited to the spatial deformation characteristics and the absence of sustained accelerating deformation at the reinforced toe, rather than the absolute displacement magnitude. The monitored period did not correspond to the idealized 72 h extreme prolonged-rainfall scenario adopted in the numerical analysis; therefore, the field data are not used as direct validation of the predicted deep instability under that scenario.
In summary, under natural conditions the reinforced cut slope at the toe is stable, while the principal potential deformation zone lies along the block-stone layer–strongly weathered limestone interface in the middle–rear portion. The overall slope is basically stable, and the deep strongly weathered shale interface has not yet developed into the controlling sliding boundary.
5.2.2. Effect of Rainfall Infiltration on Pore-Water Pressure
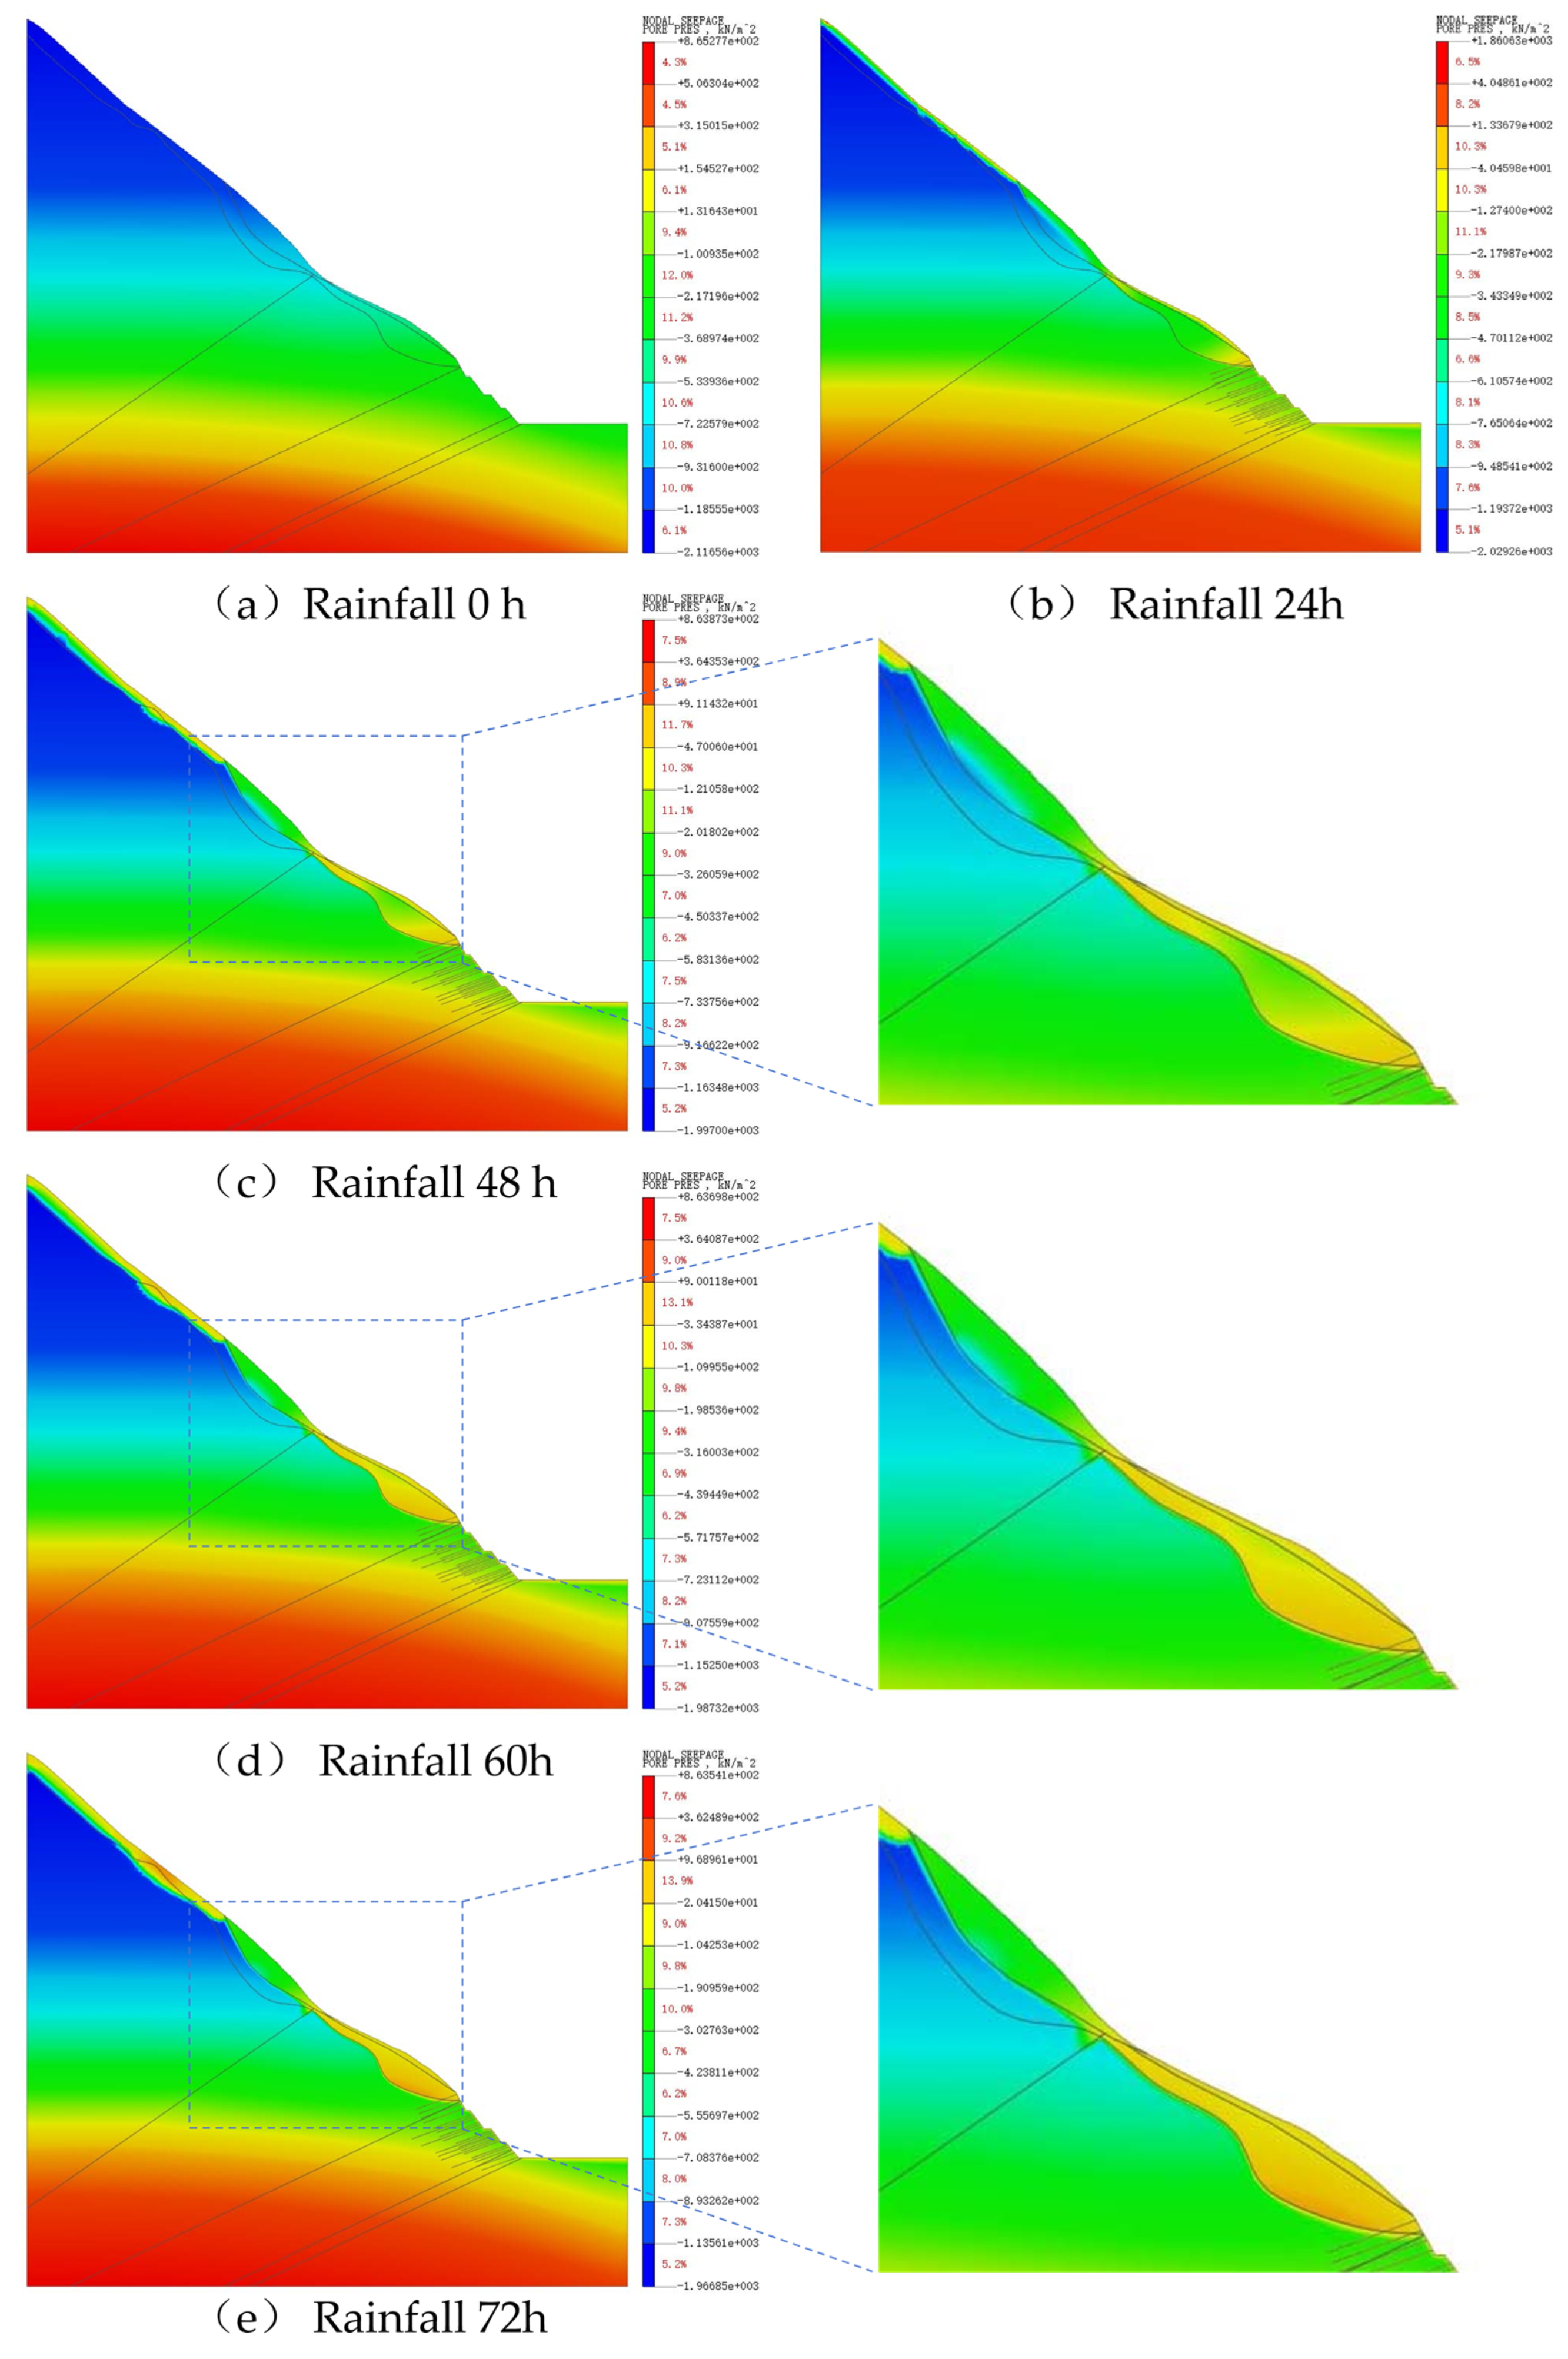
Under the 72 h prolonged-rainfall scenario defined in
Section 5.2, transient coupled seepage–stress analysis was performed to investigate the evolution of pore-water pressure at different rainfall durations (
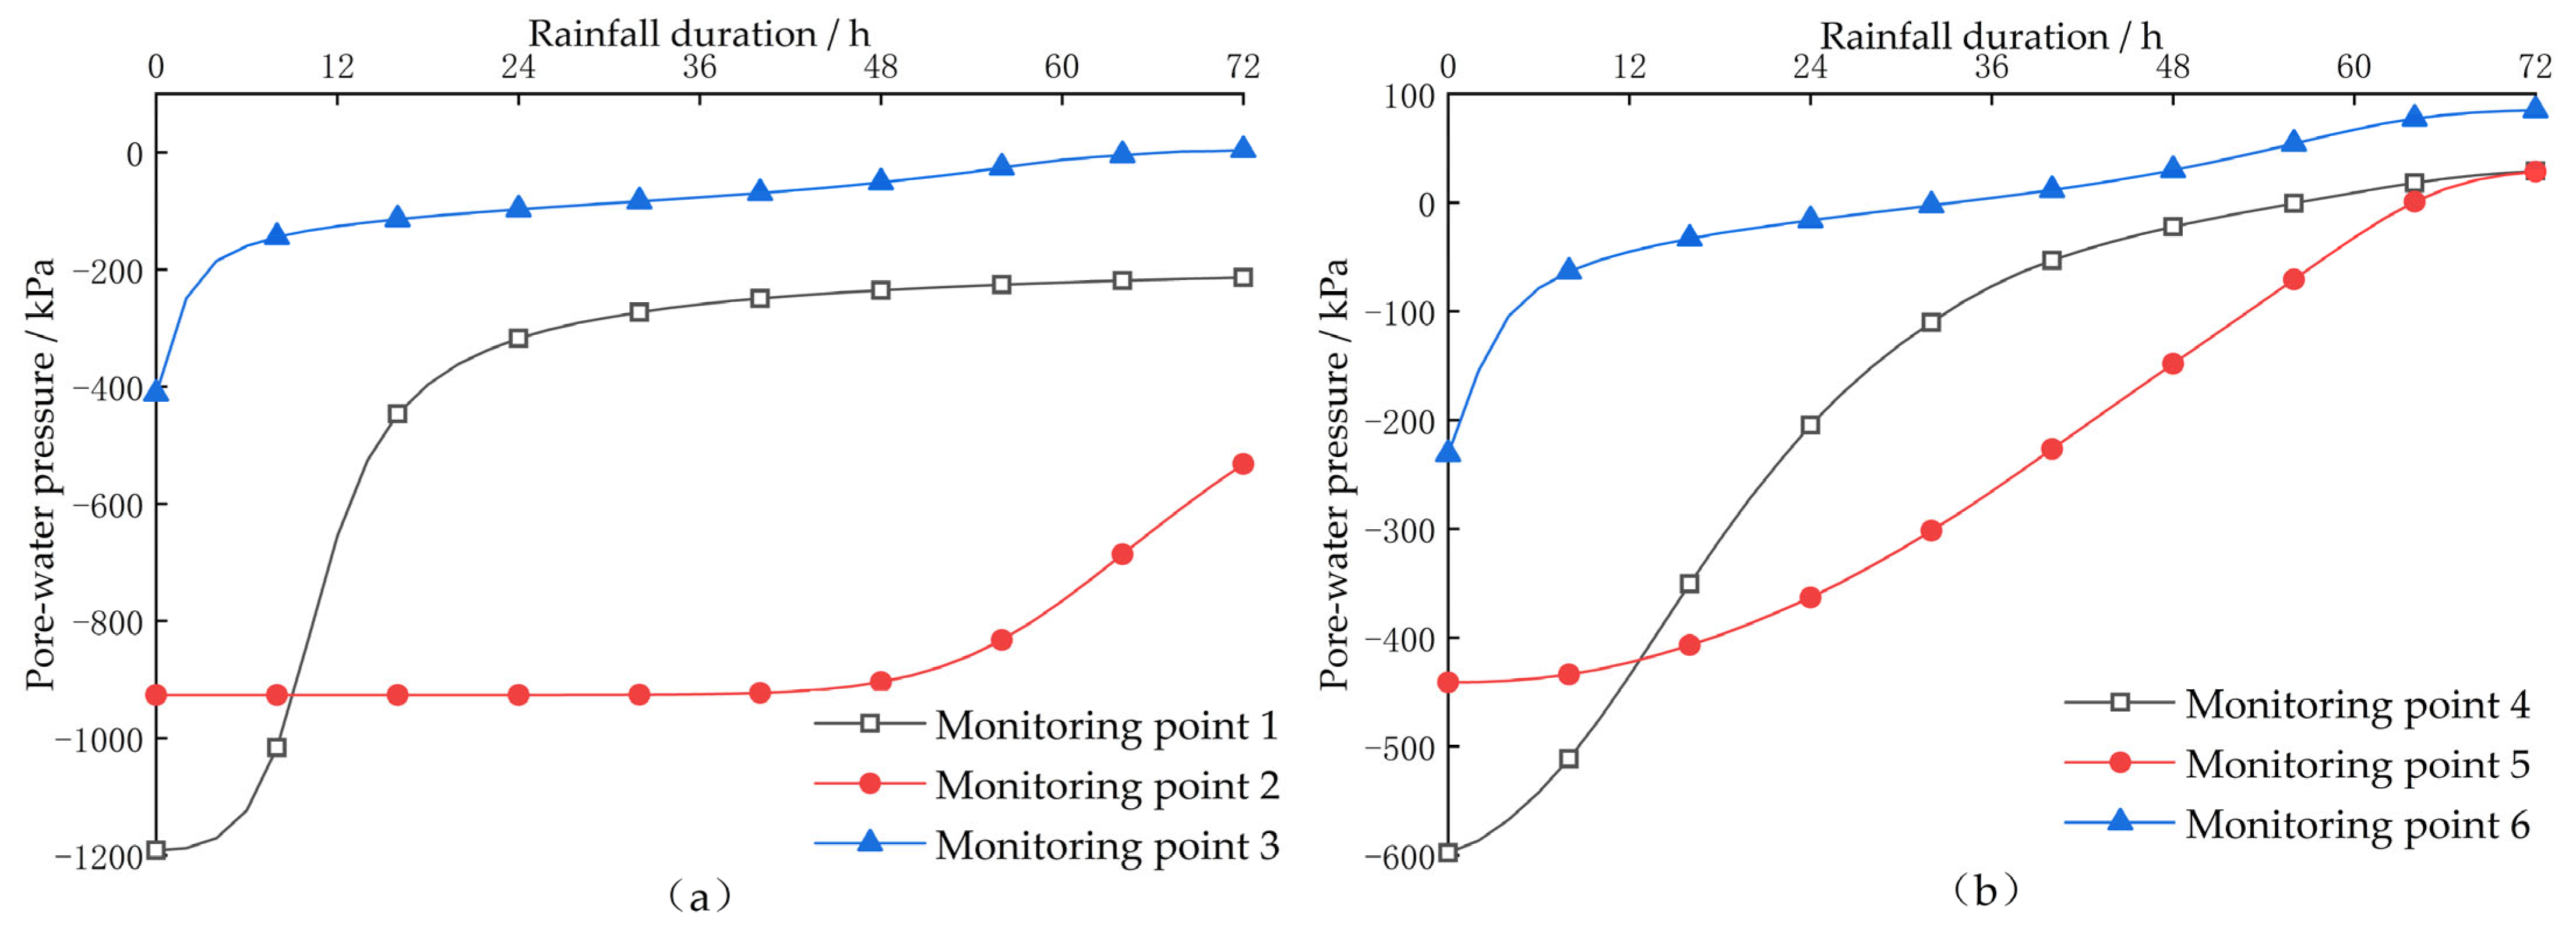
Figure 9). To characterize the pore-pressure time-history response of the two key interfaces, monitoring points 1–3 were arranged along the upper block-stone layer–strongly weathered limestone interface, and points 4–6 were arranged along the deep strongly weathered shale interface. Their locations are shown in
Figure 5, and the pore-pressure time histories are presented in
Figure 10. Negative pore pressures above the groundwater table in the plots are equivalent negative pore pressures calculated by the model, and their absolute magnitudes are influenced by the initial groundwater level and hydraulic-head field. Accordingly, the influence of rainfall infiltration on the seepage field is evaluated mainly from the temporal trends at the monitoring points, the transition from negative to positive pore pressure, and the spatial expansion of the positive pore-pressure zone.
As shown in
Figure 9, before rainfall, the pore-water pressure above the groundwater table is generally negative, and both the block-stone layer–strongly weathered limestone interface and the strongly weathered shale interface are unsaturated. During the initial stage of rainfall, water first wets the shallow surface layer, and pore-water pressure gradually increases from the slope surface inward; however, no distinct positive pore-pressure zone has yet formed within the slope. As rainfall continues, water migrates deeper along pores in the block-stone layer, fractures in the limestone, and soil–rock contacts, progressively enlarging the affected pore-pressure zone.
As shown in
Figure 10a, pore-water pressure along the upper block-stone layer–strongly weathered limestone interface generally increases with rainfall duration. Points 1 and 2 remain under negative pore pressure throughout the 72 h rainfall period, indicating that the corresponding portions of the upper interface remain predominantly unsaturated. In contrast, point 3, located near the downslope end of the interface, changes from negative to positive pore pressure during the late stage of rainfall, indicating localized water accumulation in this region. Overall, the upper interface primarily acts as a preferential pathway for downward water transmission, although local positive pore pressure can develop near its downslope end as rainfall persists.
In contrast, the lower strongly weathered shale interface responds much more strongly to rainfall. At approximately 34 h, monitoring point 6 near the slope toe is the first to change from negative to positive pore pressure, indicating that downward migration becomes impeded after the infiltrating water reaches the top of the shale and water begins to accumulate near the toe. At 48 h, positive pore pressure remains concentrated mainly in the lower toe segment. By 58–60 h, positive pore pressure has developed in the upper segment of the interface and at the toe, while the steep middle segment remains under negative pressure, producing a discontinuous pattern of “positive at both ends and negative in the middle.”
Figure 10b shows that point 4 becomes positive at approximately 56 h. Point 5, located in the steep middle segment where drainage is relatively favorable, responds later and becomes positive at approximately 64 h. By 72 h, points 4–6 all show positive pore pressure, and the positive-pressure zones expand from the toe and upper interface segment toward the middle, forming a continuous transient saturated zone along the strongly weathered shale interface.
Overall, the upper block-stone layer–strongly weathered limestone interface primarily serves as a preferential pathway for downward water transmission, with only localized positive pore pressure developing near its downslope end during the late stage of rainfall. In contrast, the strongly weathered shale interface is the principal zone of water retention, positive pore-pressure accumulation, and transient saturation owing to the hydraulic barrier effect of the underlying low-permeability shale. Interface geometry further controls the timing of positive-pressure development, with an earlier response in the gentle segments and a delayed response in the steep middle segment.
5.2.3. Displacement Response of the Slope After Rainfall
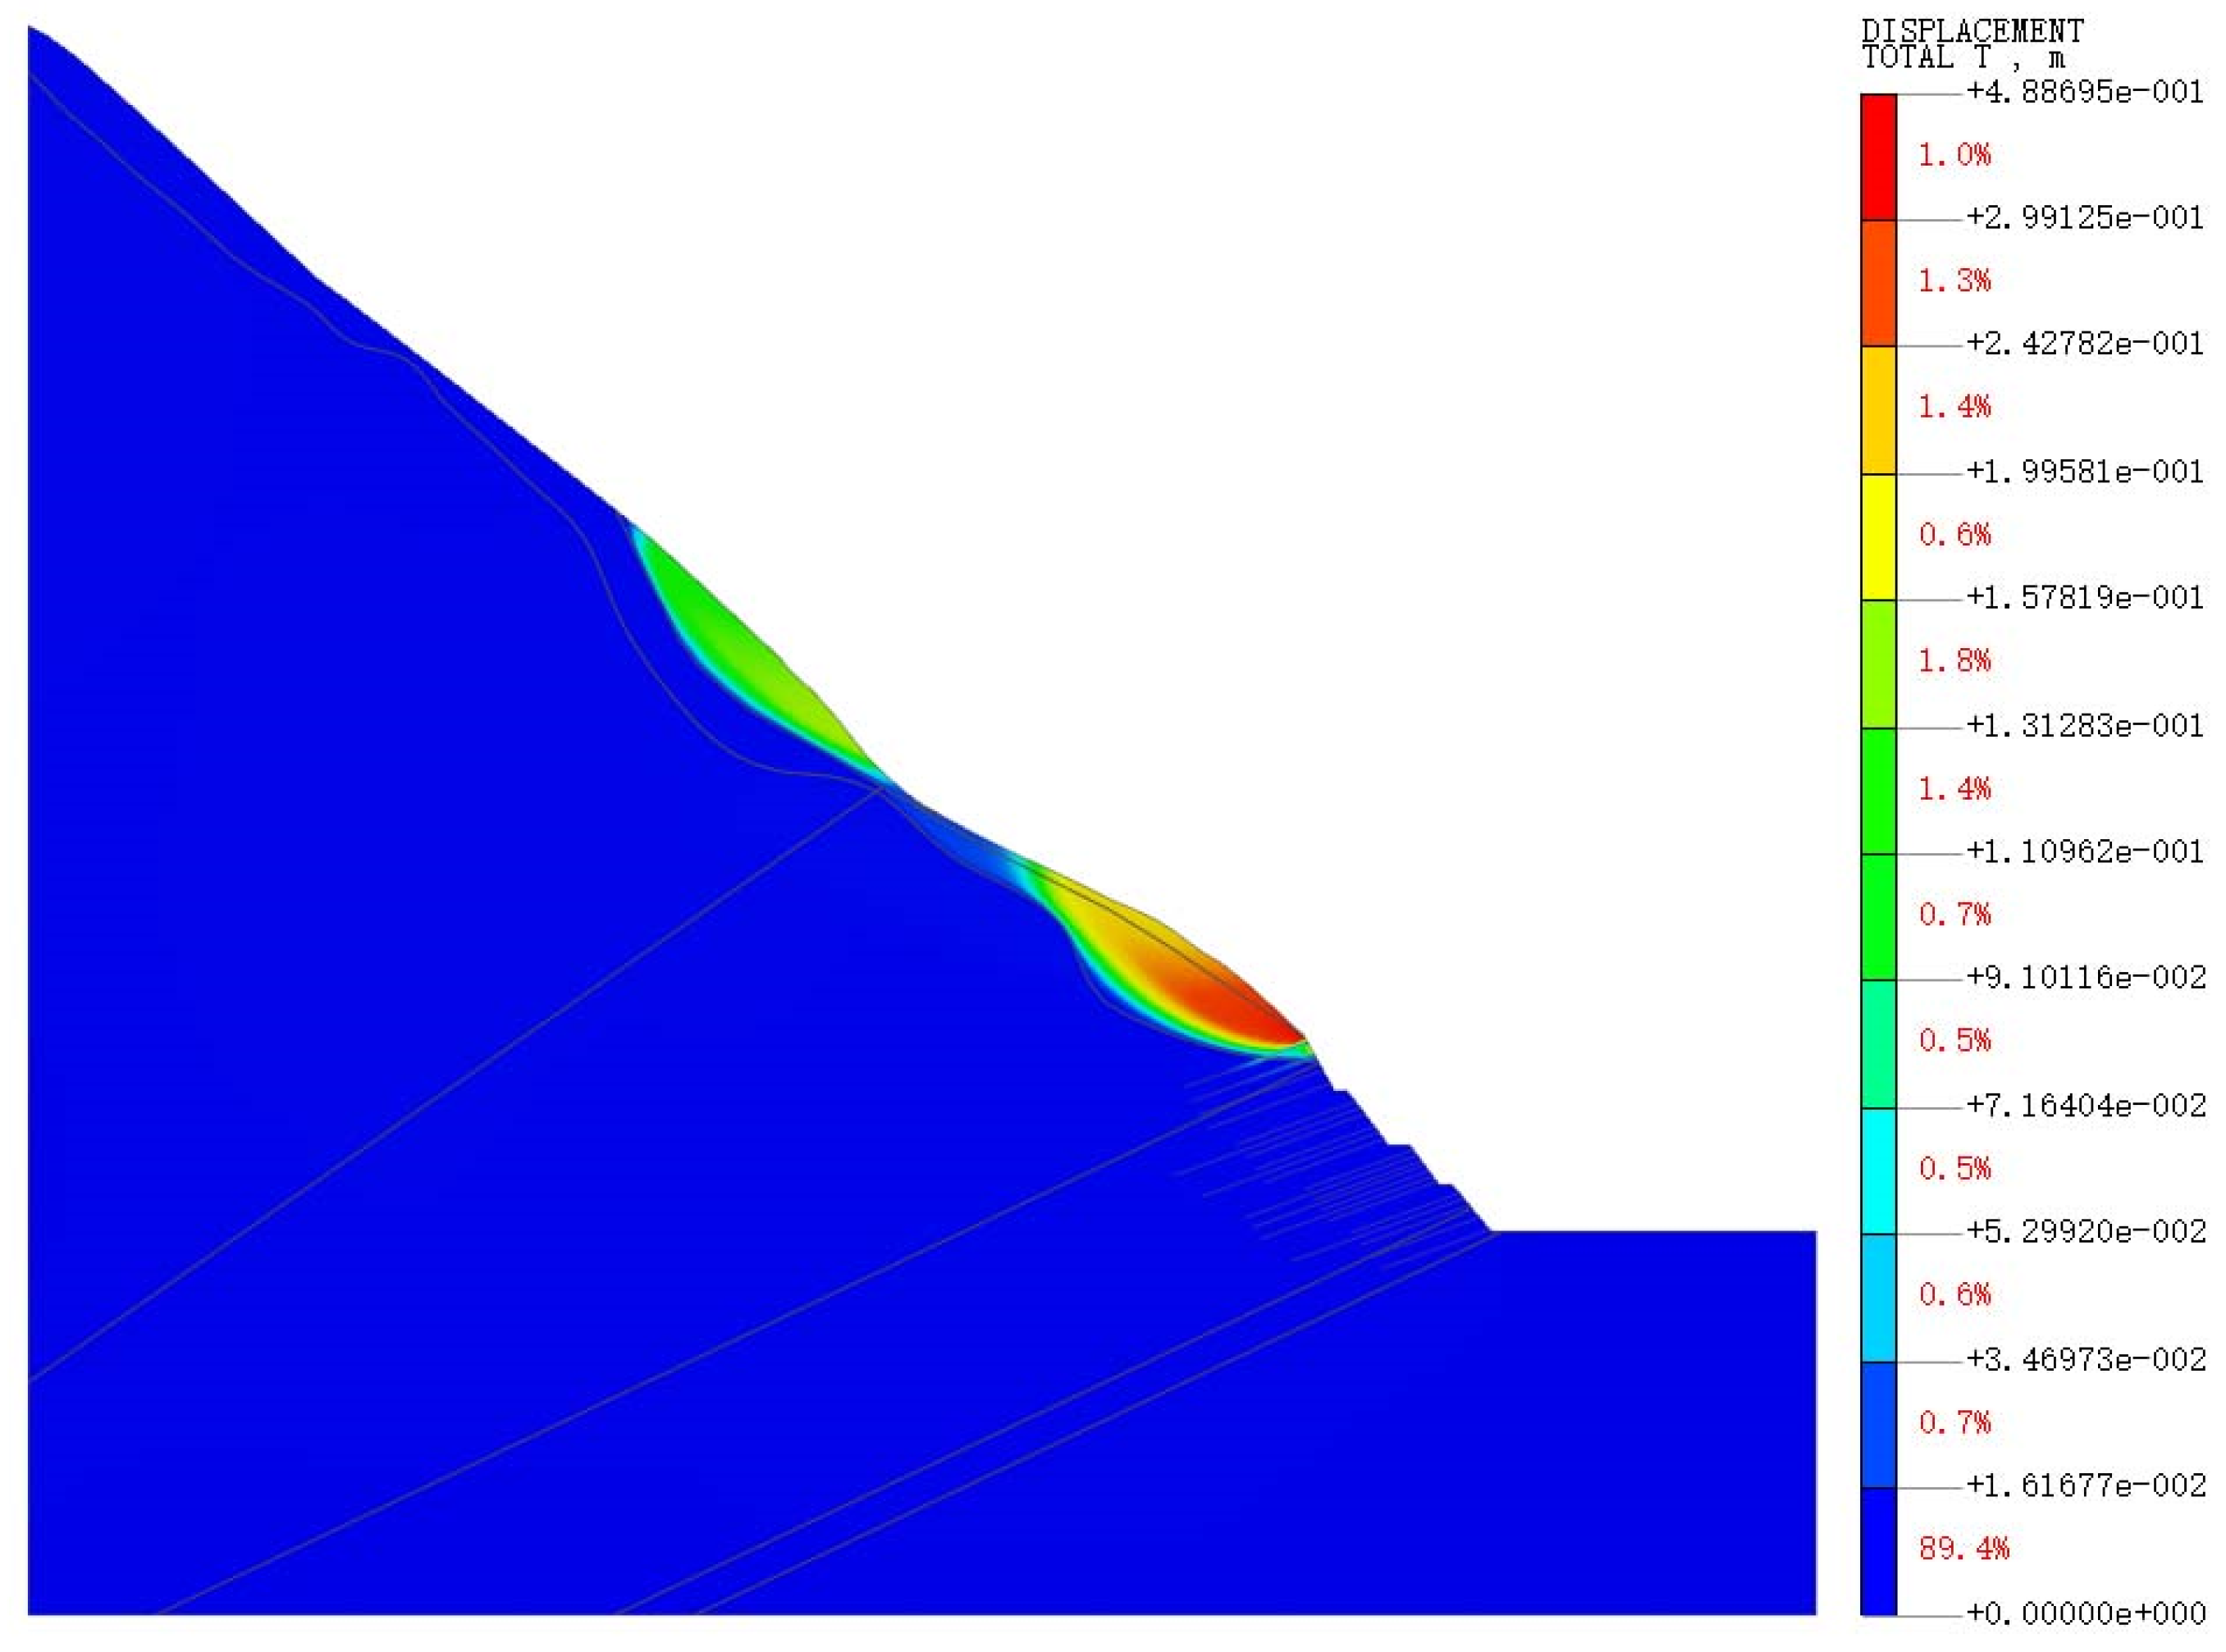
To further evaluate slope deformation under prolonged rainfall, the total-displacement contour after 72 h of rainfall was extracted, as shown in
Figure 11. The displacement field exhibits distinct zoning, with high-displacement areas near the upper block-stone layer–strongly weathered limestone interface and in the slope mass overlying the deep strongly weathered shale interface.
After 72 h of rainfall, the maximum total displacement is approximately 48.9 cm and occurs in the slope mass overlying the deep strongly weathered shale interface. Displacement contours extend from the middle slope toward the toe, indicating that continued infiltration shifts the controlling deformation zone from the upper shallow soil–rock interface toward the deep strongly weathered shale interface. Displacement in the deep bedrock beneath the affected sliding zone remains small, indicating that deformation is controlled primarily by the two interfaces with pronounced lithologic and permeability contrasts rather than developing uniformly throughout the bedrock.
Unlike the natural condition, in which displacement is mainly concentrated along the upper block-stone layer–strongly weathered limestone interface, after 72 h of rainfall a more pronounced displacement concentration develops in the slope mass overlying the strongly weathered shale interface. This change corresponds to the transition of pore-water pressure at the interface from negative to positive and to the formation of a continuous transient saturated zone. The underlying low-permeability shale impedes further downward drainage, causing water to accumulate near the interface, reducing matric suction, increasing pore-water pressure, and consequently decreasing effective stress. These hydraulic changes promote deformation concentration along the deep interface. Consequently, the deep strongly weathered shale interface gradually becomes the principal zone controlling slope deformation and sliding.
It should be noted that the displacement contour identifies the spatial concentration of slope deformation but cannot alone be used as the criterion for overall instability. The instability state must therefore be evaluated together with plastic-zone coalescence and the factor of safety obtained by the strength reduction method.
5.2.4. Evolution of the Plastic Zone Under Rainfall
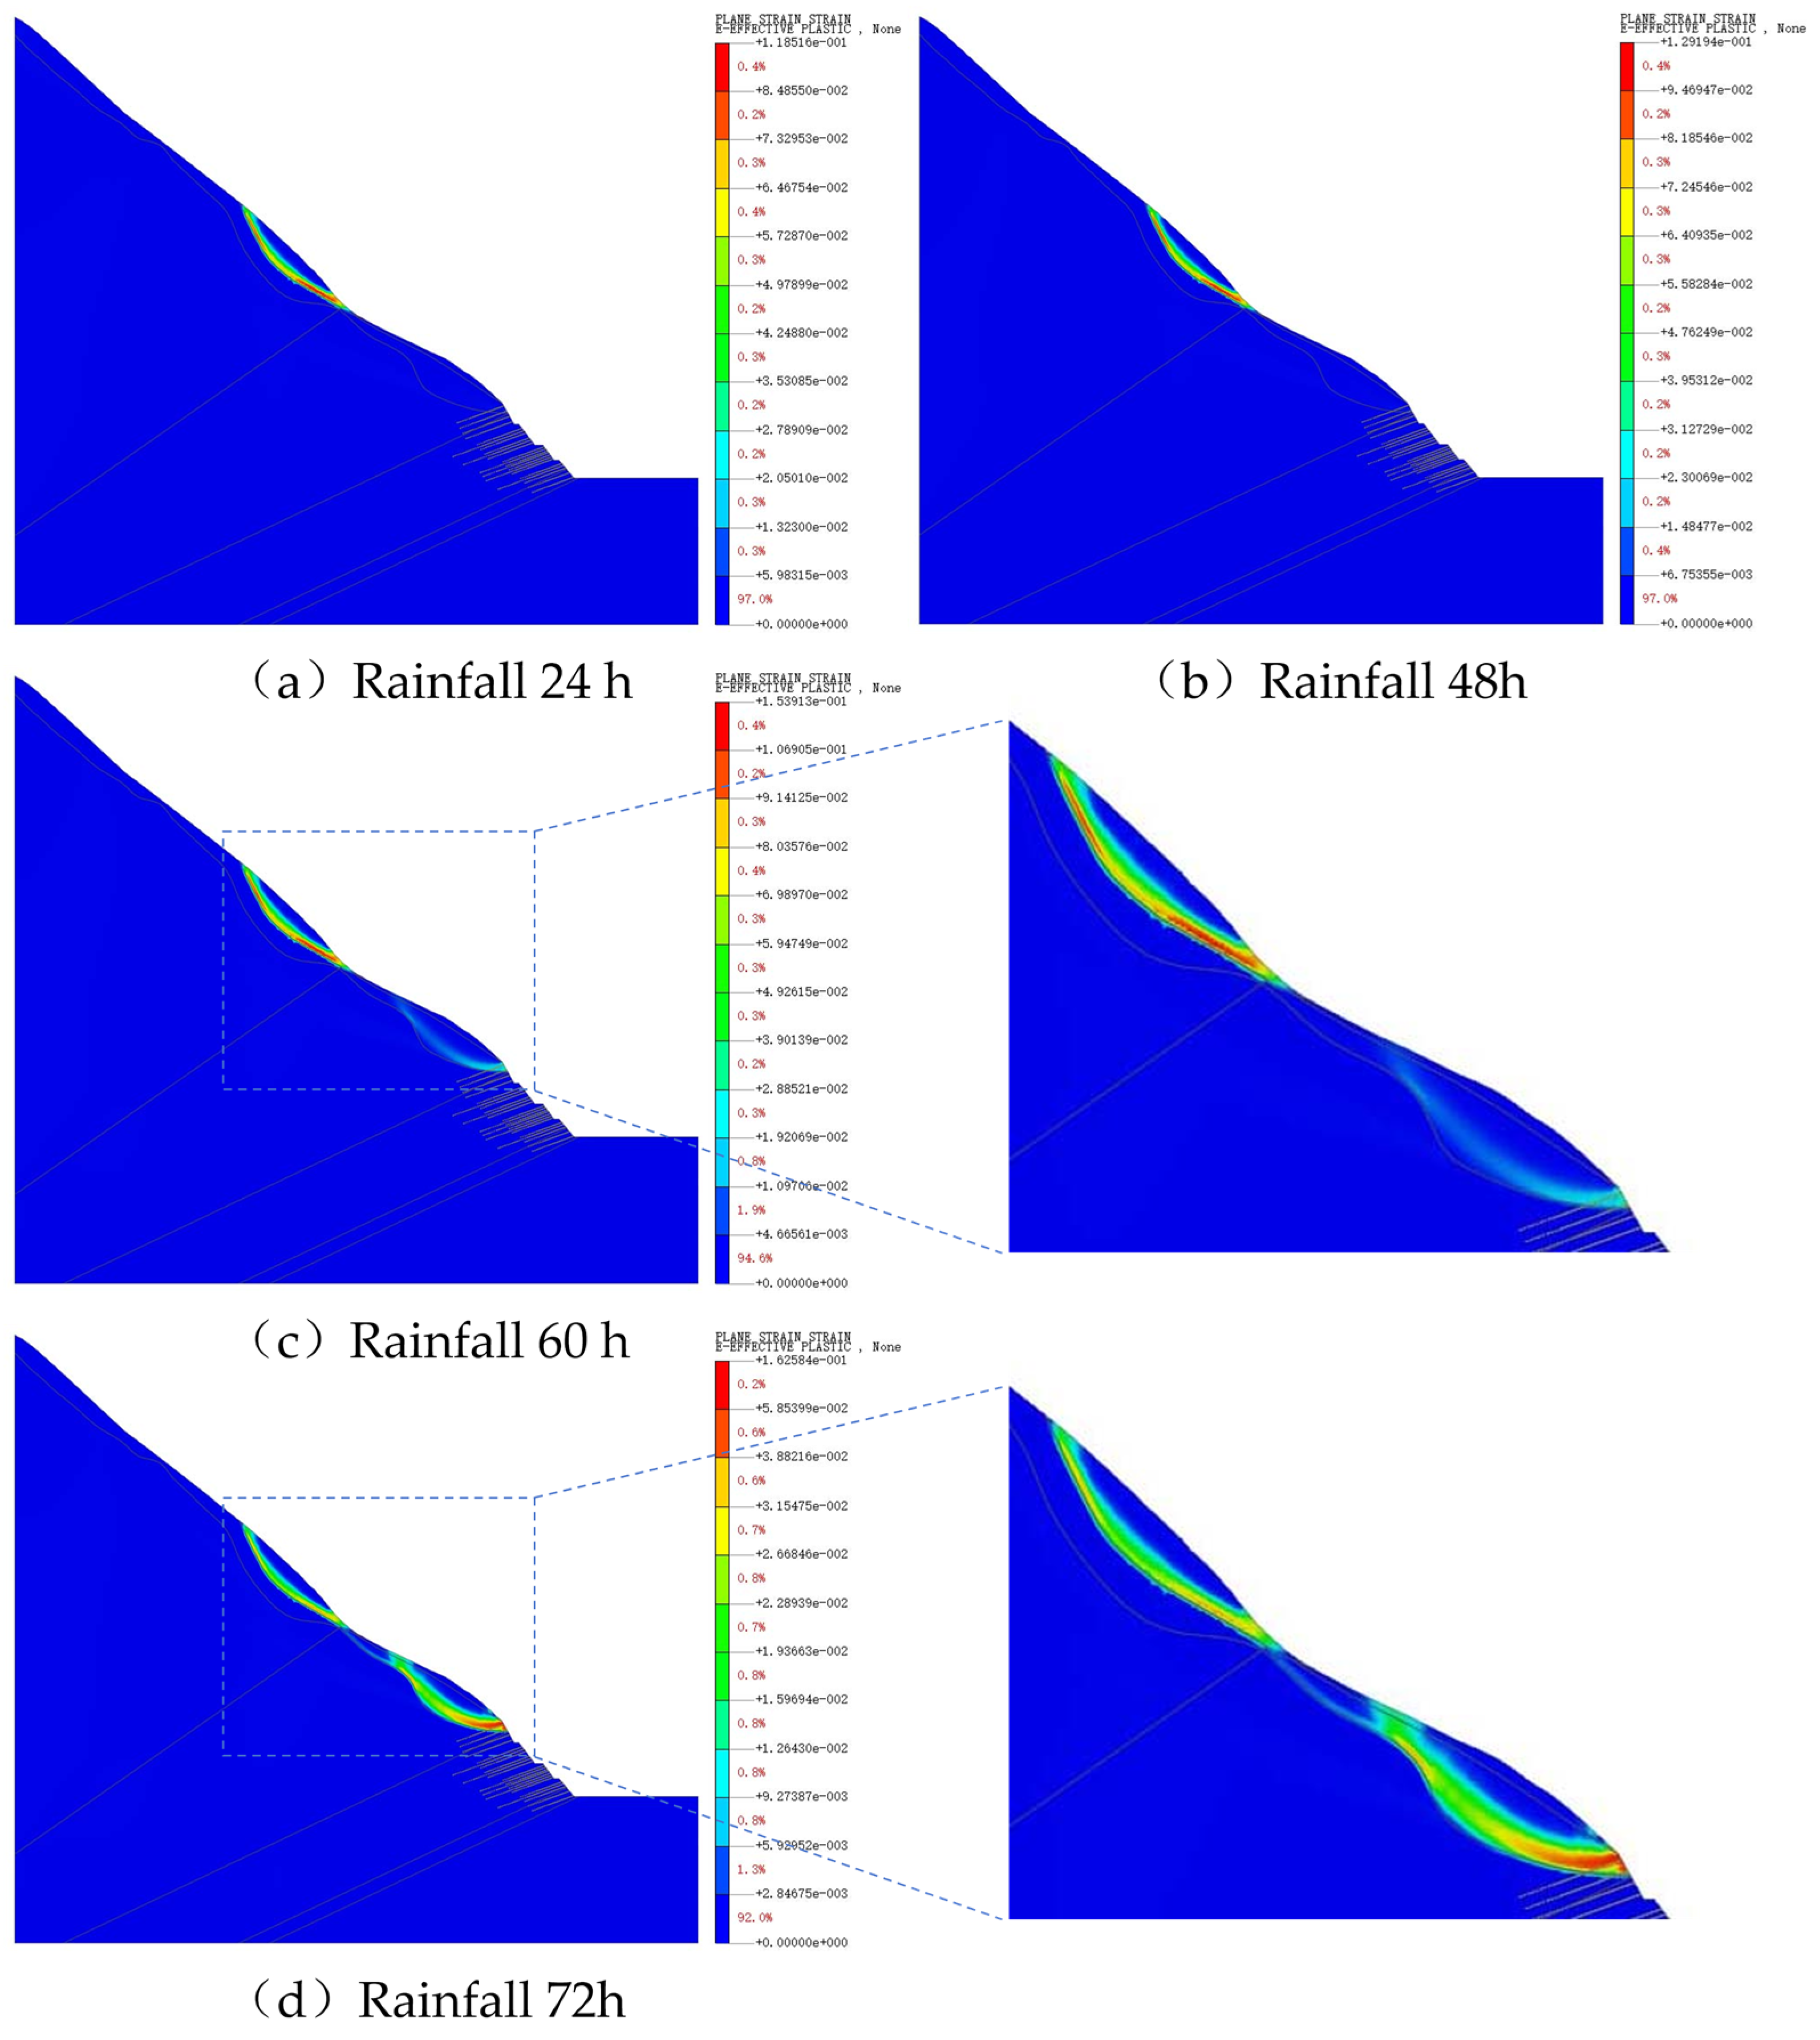
The distribution and expansion of plastic zones reflect the formation of potential sliding surfaces. As shown in
Figure 12, during the initial stage of rainfall, the plastic zone is distributed mainly as a band along the upper block-stone layer–strongly weathered limestone interface and is more extensive than under natural conditions. At this stage, no continuous plastic band has formed along the deep strongly weathered shale interface, and deformation remains dominated by shallow local failure. By 60 h, isolated plastic zones begin to appear near the strongly weathered shale interface as pore-water pressure rises. The upper shallow plastic zone continues to develop while deep plastic deformation increases simultaneously, indicating a transition from single shallow deformation to combined shallow and deep deformation. The plastic zone in the steep middle segment is not yet connected, so the slope has entered a critical deformation stage but a complete deep sliding boundary has not yet formed.
By 72 h, the plastic zone is fully connected along the strongly weathered shale interface, forming a continuous potential sliding surface. Its position corresponds to the high-displacement zone in
Figure 11 and the continuous positive pore-pressure zone in
Figure 9, demonstrating that pore-pressure accumulation, displacement concentration, and plastic yielding are successive manifestations of the coupled evolution of the seepage and stress fields under the hydraulic barrier effect of low-permeability shale.
Overall, the plastic zone first develops locally along the upper block-stone layer–strongly weathered limestone interface and then progressively extends to and becomes continuous along the deep strongly weathered shale interface. Coalescence of the deep plastic band provides direct mechanical evidence for the formation of a potential sliding surface and indicates that the controlling failure zone has shifted from the shallow soil–rock interface to the deep strongly weathered shale interface.
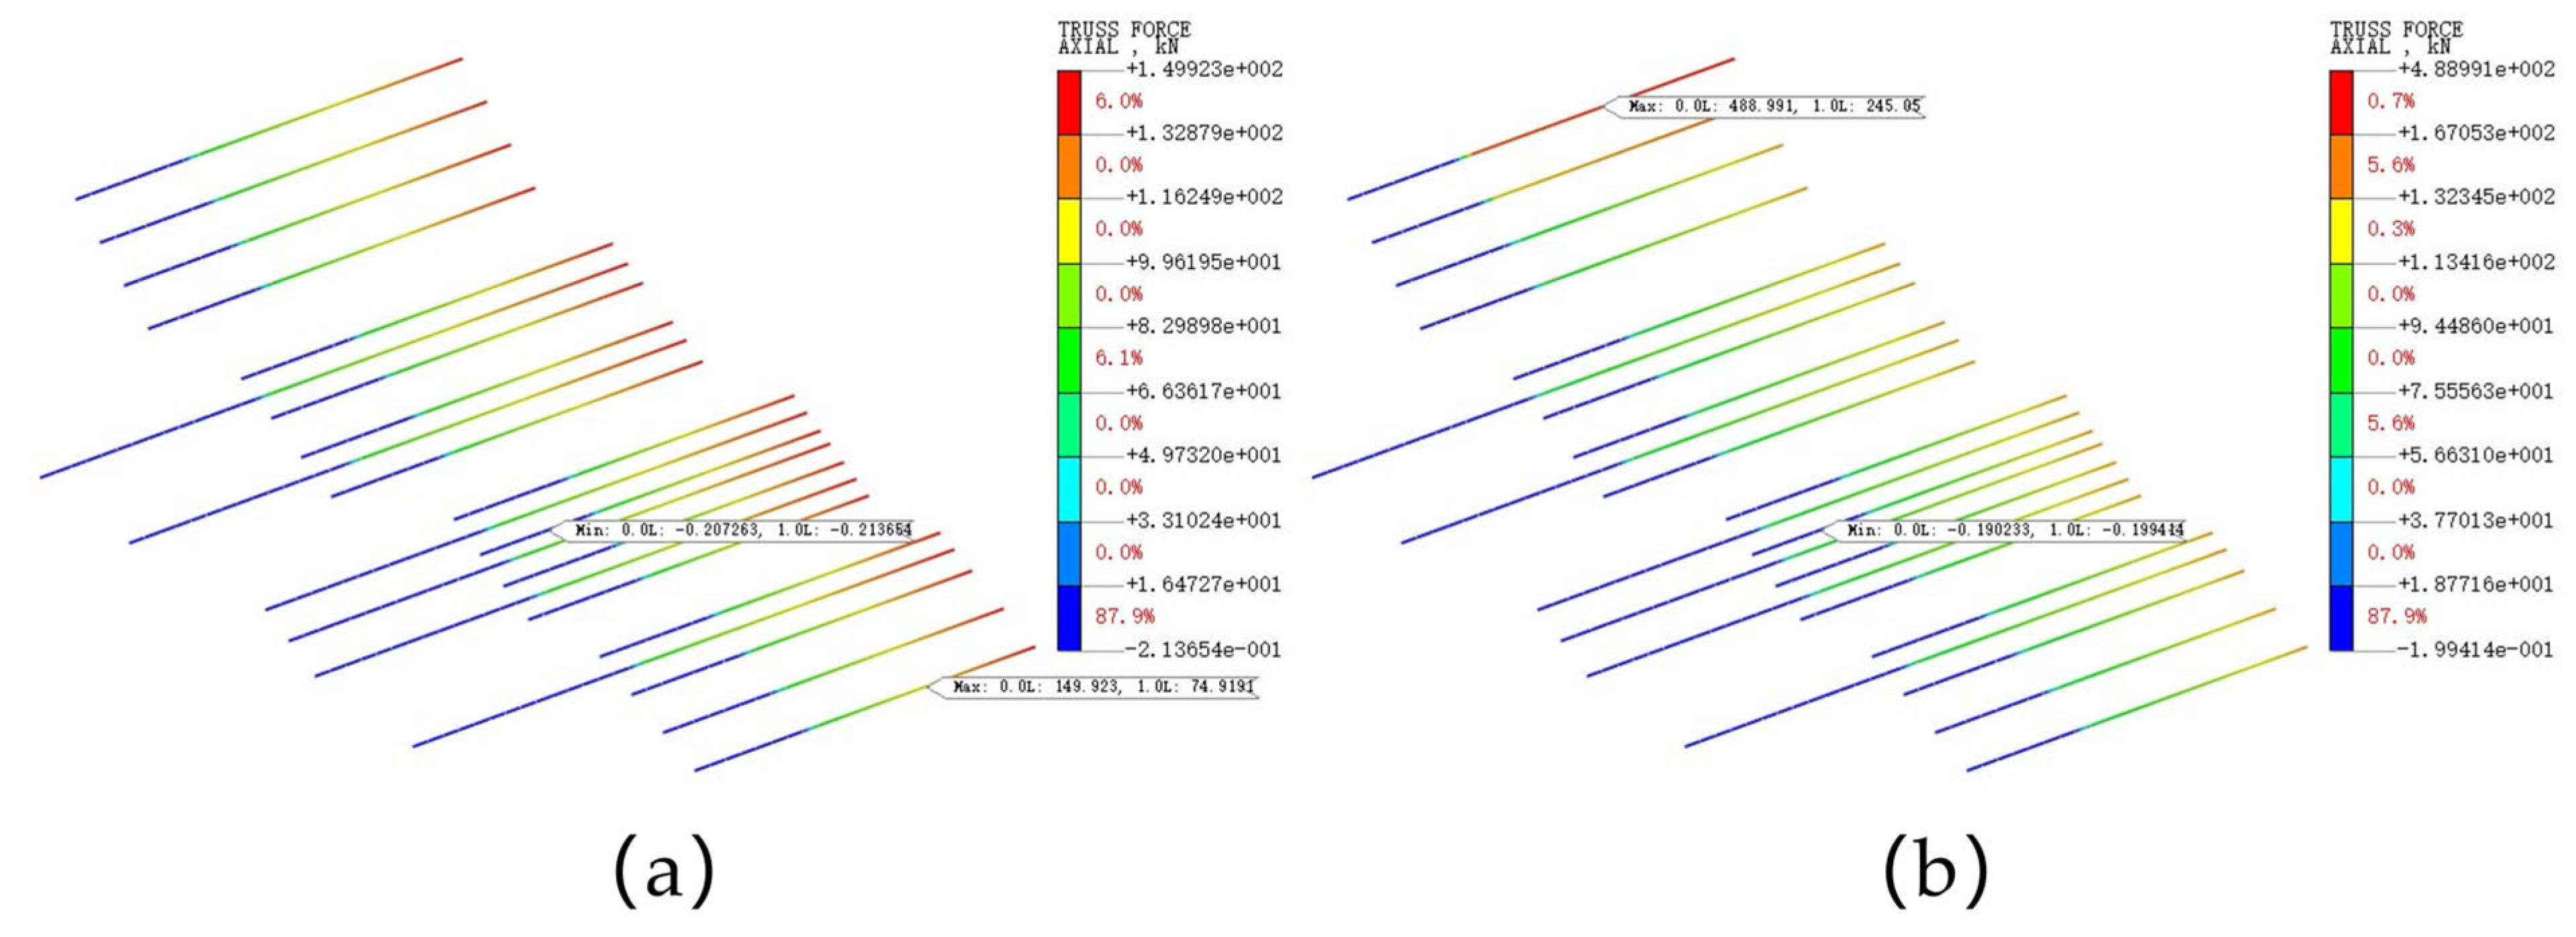
The maximum axial force of the anchor cables was further examined to characterize the response of the reinforcement system (
Figure 13). Before rainfall, the maximum axial force was approximately 150 kN and was mainly concentrated in the lower part of the reinforced cut slope. After 72 h of rainfall, the maximum axial force increased to approximately 489 kN, remaining below the design anchoring force of 500 kN, and its location shifted upward to the intersection between the anchor cables and the strongly weathered shale interface. This spatial shift corresponds to the coalescence of the plastic zone along the strongly weathered shale interface, suggesting that the development of the deep potential sliding zone enhanced deformation and load transfer to the anchor cables intersecting this interface.
5.2.5. Evolution of the Factor of Safety During Rainfall
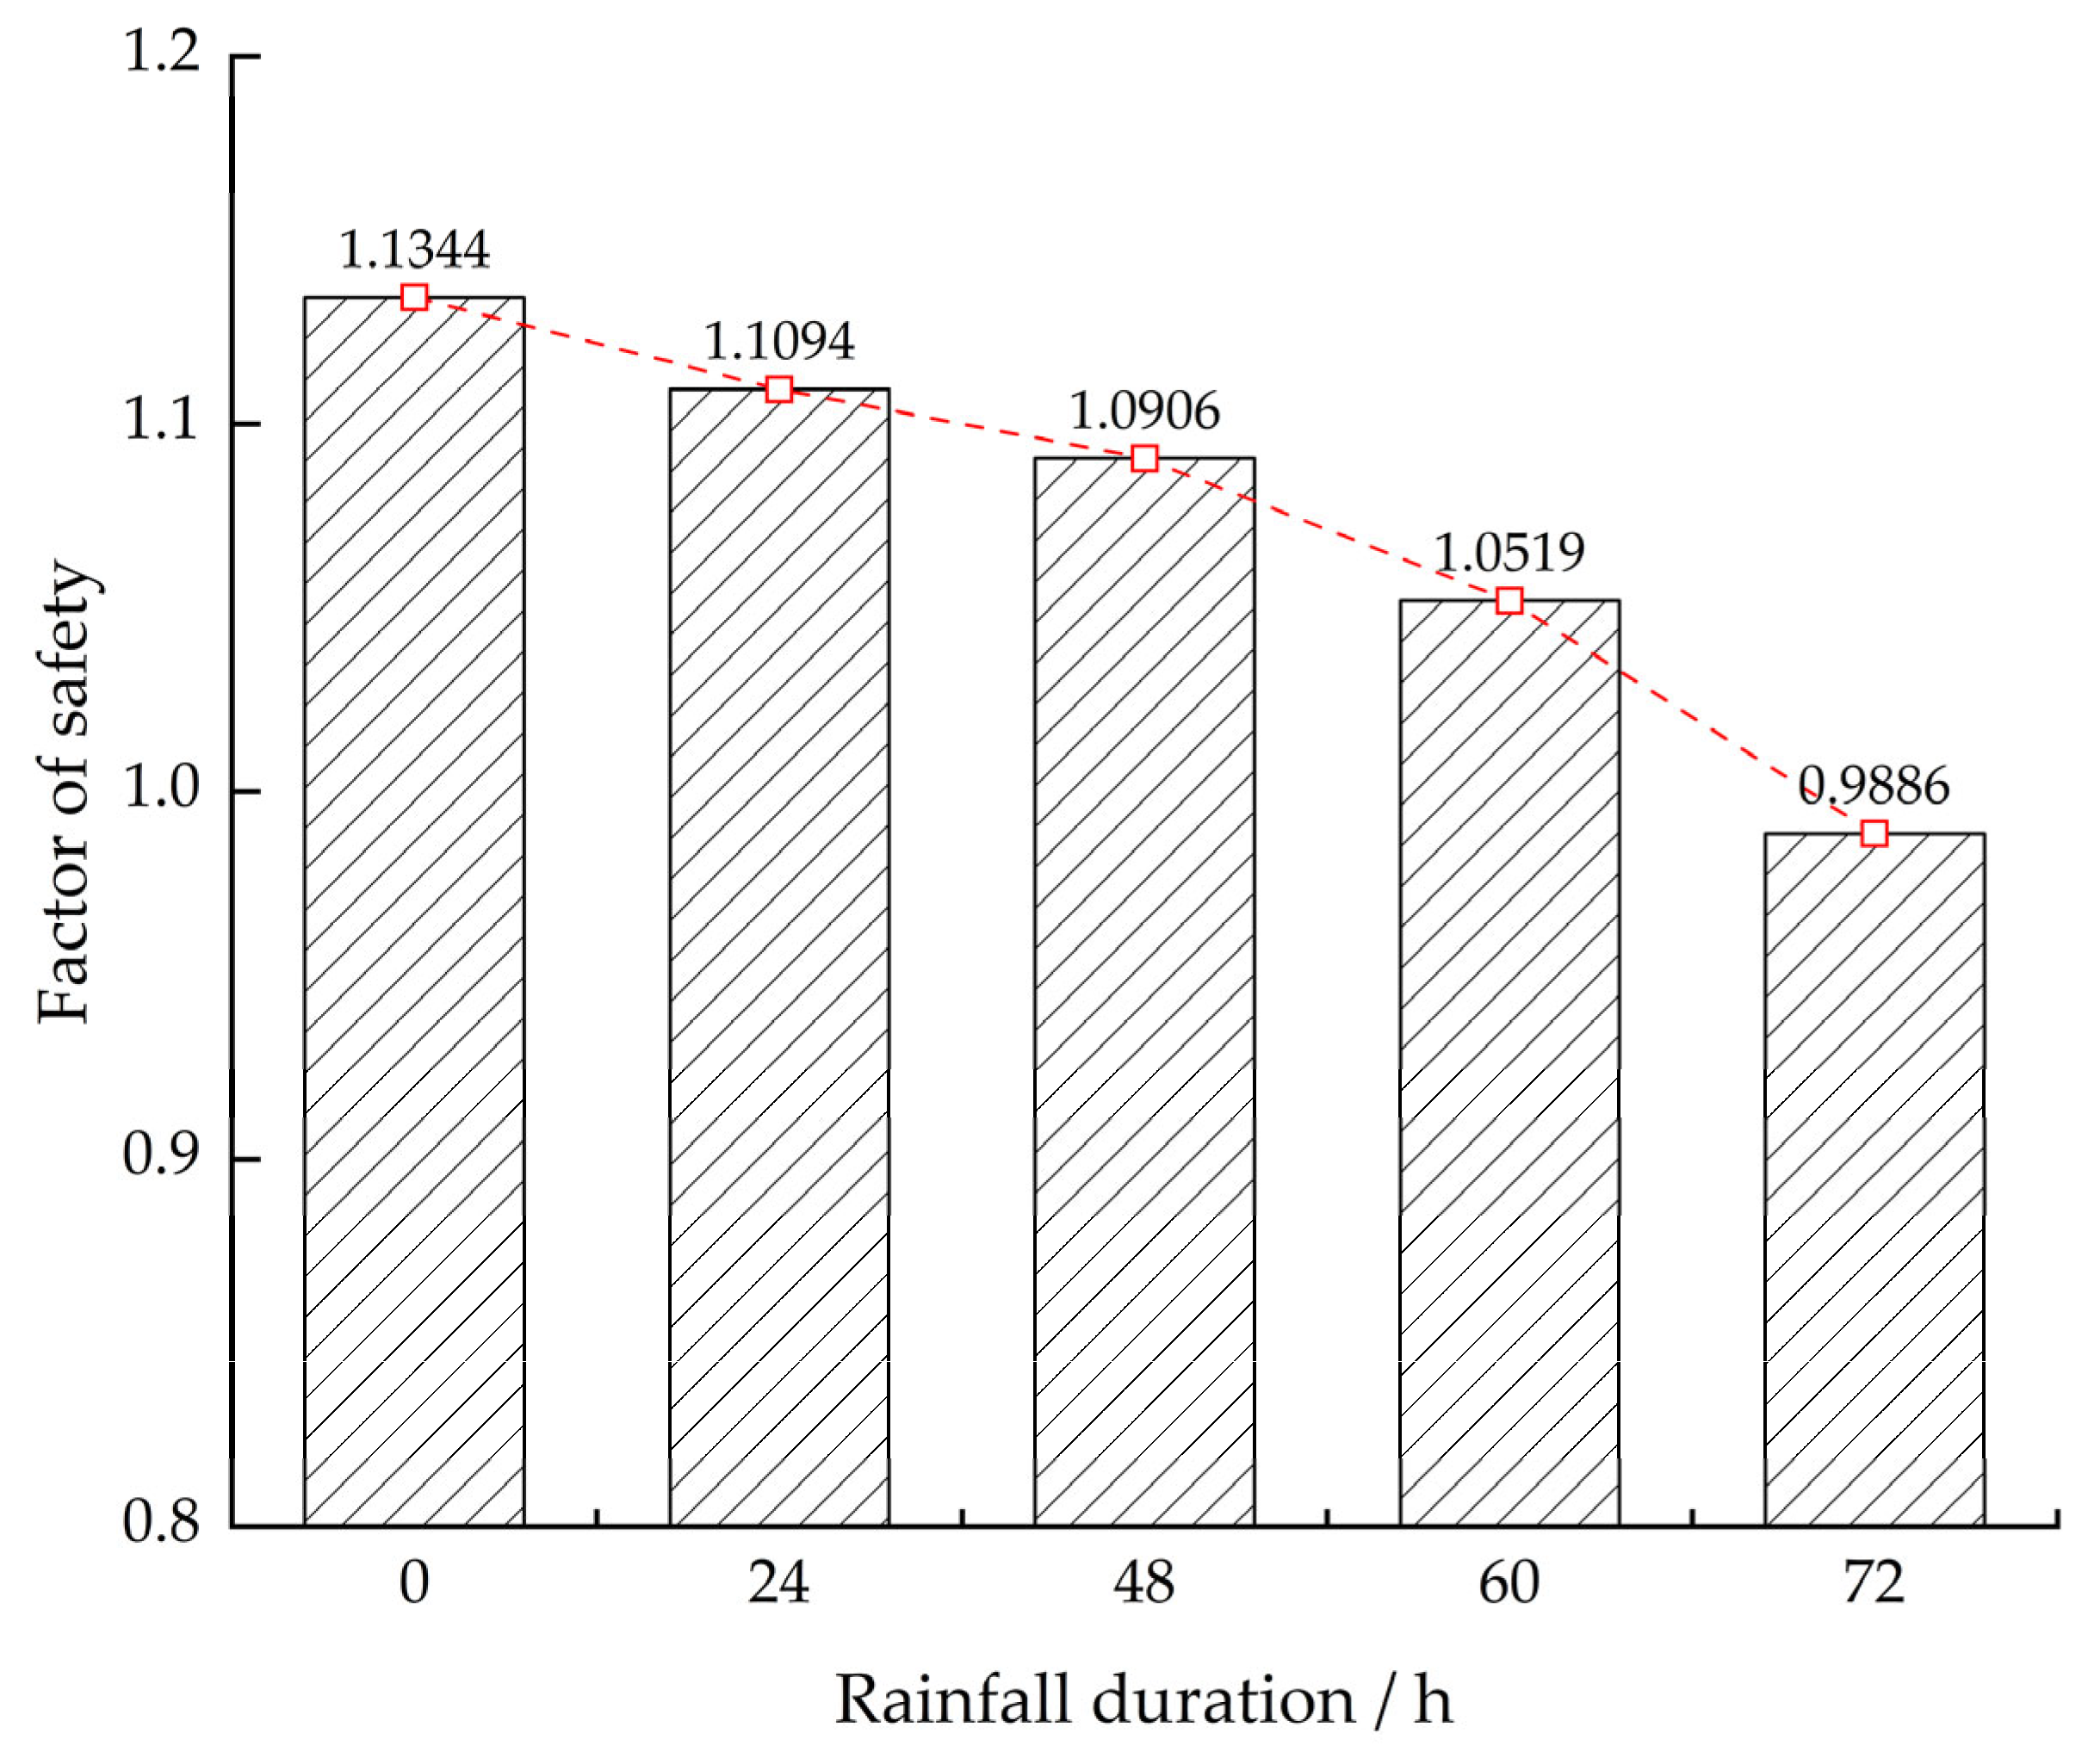
To further examine the evolution of overall slope stability during rainfall, the factor of safety was extracted at different rainfall durations (
Figure 14). The factor of safety generally decreases with increasing rainfall duration, but the rate of decrease varies markedly among stages.
During the initial 0–48 h, rainfall mainly affects the shallow surface layer and the upper soil–rock interface. No extensive positive pore-pressure zone has formed within the slope, and no continuous plastic band has developed along the strongly weathered shale interface; consequently, the factor of safety decreases only slightly. As water migrates deeper through pores in the block-stone layer, fractures in the limestone, and soil–rock interfaces, it progressively accumulates above the underlying low-permeability shale. The resulting increase in pore-water pressure and reduction in matric suction decrease the effective stress near the strongly weathered shale interface, thereby reducing the available shear resistance and promoting the development of deep deformation. During the late stage of rainfall (60–72 h), a continuous transient saturated zone forms along the strongly weathered shale interface, the high-displacement zone rapidly expands, and the plastic zone progressively extends and ultimately becomes continuous along the deep strongly weathered shale interface. The factor of safety therefore decreases more rapidly. At 72 h, it reaches 0.9886, indicating overall slope instability.
The combined evolution of pore-water pressure, displacement, plastic zones, and the factor of safety shows that rainfall-induced instability of the slope is distinctly staged. During the initial stage, water infiltrates through rear-margin cracks, pores in the block-stone layer, and limestone fractures, and deformation along the upper block-stone layer–strongly weathered limestone interface gradually develops. During the middle stage, infiltrating water reaches the deep strongly weathered shale interface and first accumulates in gentle segments with poor drainage. During the late stage, the positive pore-pressure zone expands along the interface and forms a continuous transient saturated zone, continuously reducing effective stress and shear resistance. The high-displacement zone shifts deeper, the plastic zone becomes continuous, and overall instability is triggered.