Article

Probabilistic Risk Assessment Model for the Navigation of Autonomous Mobile Robotic Systems Around an Aircraft

Department of Aviation Engineering and Technologies, Civil Aviation Academy, Almaty 050039, Kazakhstan
*
Author to whom correspondence should be addressed.
Eng 2026, 7(6), 284; https://doi.org/10.3390/eng7060284
Submission received: 6 April 2026 / Revised: 5 June 2026 / Accepted: 5 June 2026 / Published: 8 June 2026

Abstract

The introduction of autonomous mobile robotic systems into ground handling operations at airports has been limited by aviation safety requirements and the high costs associated with a robot colliding with an aircraft. To ensure safety, traditional robotic navigation methods use static buffer zones, which limit the functionality of robotic systems working near the aircraft fuselage. A probabilistic risk assessment model was developed in this study to simulate close-in operation of heterogeneous mobile robotic systems around an aircraft. The proposed model employs a hybrid framework that integrates an extended Kalman filter, Monte Carlo simulations, and a Bayesian network to consider the kinematic uncertainty of a robot, random environmental conditions, and sensor data for real-time evaluation of collision probabilities. The modeling of near-aircraft inspection scenarios conducted in MATLAB demonstrated the feasibility of the proposed approach: the system successfully completed 49 out of 50 simulated missions while testing landing gear inspection scenarios. In addition, the modeling reduced the minimum distance to the inspection object to 0.48 m, compared with a baseline safe distance of 2 m. These results are interpreted as a simulation-based verification of the feasibility of the proposed approach rather than as an operational validation. Experiments, including hardware modeling, data from real sensors, and controlled tests on the airport apron, are required before implementing the approach in real-world conditions.

1. Introduction

In modern civil aviation, the need to improve operational efficiency and minimize operational costs drives the active transformation of operational processes. Airlines are currently experiencing rapid growth in passenger traffic and a highly competitive environment, which has made turnaround time a critical performance indicator [1,2]. Any delay during ground handling affects flight schedules and can result in substantial economic losses [3]. The implementation of heterogeneous autonomous mobile robotic systems to optimize routine and hazardous tasks (such as visual inspection of the fuselage, baggage delivery, refueling, and deicing [4,5]) is expected to speed up ground handling operations and eliminate human error, which is often the main cause of airport apron incidents [6]. However, the aprons of modern international airports are highly dynamic and poorly structured environments that include expensive equipment, specialized machinery, and maintenance personnel [7], which is unlike the predictable conditions inside a warehouse where robotic navigation has become standard. The operation of autonomous mobile robotic systems near aircraft carries substantial risks [8], including collision with the fuselage or landing gear, which can lead to costly repairs and aircraft downtime [9]. In international practice, the movement of equipment around aircraft is strictly limited and must be controlled by an operator [10].
Today, the scientific literature is increasingly mentioning the use of robotic systems for aircraft maintenance, inspection, and ground handling. During hazardous and labor-intensive work, unmanned aerial vehicles (UAV) are used for visual inspection to detect defects, monitor structural integrity, and improve personnel safety [11]. Unmanned ground systems are also used for ground inspections, logistical support for maintenance and reliability organization (MRO) processes, and ensuring the system’s autonomous operation [12]. However, the operation of such autonomous systems near an aircraft differs from traditional warehouse and indoor navigation tasks. This difference in aircraft inspection tasks is due to the robot being located near critical structures, reflective surfaces, moving ground vehicles, and personnel [13].
In probabilistic robotics, state estimation, trajectory prediction, and probabilistic collision prediction are often used for navigation tasks under uncertainty [14]. Localization methods based on the Kalman filter are used to estimate the state of robotic systems under noisy conditions [15]. Approaches using Monte Carlo simulation sampling are necessary when nonlinear motion models are uncertain [14]. Bayesian belief networks are necessary to assess the reliability of decisions made in engineering systems for which operational data are limited and the implementation of expert knowledge is required [16].
The primary mechanisms for reducing the probability of collision under uncertainty include risk-aware navigation methods that consider probabilistic approaches and predictive control for assessing risks and probabilities of movement [17]. Most of the approaches under consideration are developed for general mobile robot and service robot navigation issues for indoor or outdoor spaces. Operation in close proximity to aircraft requires the system to combine inspection accuracy of less than a meter, compliance with safety constraints, environmental uncertainties, and real-time decision-making [18].
Traditional approaches to robotic navigation often rely on deterministic algorithms that use static buffer zones for dynamic environments filled with moving obstacles [19]. To maintain a basic level of safety, such algorithms require the robot to stop when it enters a zone with a fixed threshold regardless of the current speed, sensor accuracy, and environmental conditions. However, their use is limited to applications that require close interaction with service objects, such as flaw detection on a surface [20]. Furthermore, such a deterministic approach does not account for the stochastic nature of sensor data and the influence of external environmental factors, such as wind gusts or reflections from metal surfaces, which can affect robotic navigation, including within the allowed zone [21]. A new approach to robotic navigation that shifts from static constraints to dynamic risk assessment is needed to address these limitations [22].
Despite the progress demonstrated in the scientific literature on probabilistic robotics and navigation under risk, a methodological gap remains in close-in aircraft operations. The current methods for determining the safe zone in front of an aircraft are rather conservative for automated inspection, as they prevent the robot and aircraft from approaching each other. Dynamic risk assessment methods primarily focus on optimizing trajectories or avoiding local obstacles. Furthermore, the described methods do not integrate geometric collision probabilities, robot localization uncertainties, environmental factors, and safety constraints into a unified assessment model for real-time systems [18].
The scientific novelty of this study is the application of the extended Kalman filter (EKF), the Monte Carlo method, and Bayesian networks in the form of an integrated risk assessment system for the operation of automated robotic systems near aircraft. The application of the proposed structure helps improve existing methods in the following ways: (i) assessment of intersections of probabilistic trajectories of robotic motion over a short planning horizon relative to the aircraft geometry; (ii) combination of the geometric probability of a possible collision and the Bayesian level of reliability, considering wind, Global Navigation Satellite System (GNSS) quality, illumination parameters, and dynamic obstacles; (iii) a combined risk model of nominal independence and an upper bound for correlation cases of geometric and contextual risks; and (iv) the emergence of a safety control level integrated with existing navigation methods. This formulation of scientific novelty allows us to solve a specific problem of the operation of automated systems during close inspection of an aircraft, where limited access is due to aviation security restrictions and uncertainty in measurement conditions.
In this study, a probabilistic risk assessment model was developed to quantitatively assess the real-time risk of heterogeneous autonomous mobile robotic systems colliding with aircraft. The proposed model utilizes a hybrid architecture that combines the extended Kalman filter [23] for a kinematic state estimation, Monte Carlo simulations [24] to predict probabilistic trajectories, and a Bayesian network for contextual analysis on the reliability of robotic systems [25]. The proposed framework does not replace existing planning methods with probabilistic constraints [26], predictive risk management [27], or other navigation methods. Instead, it attempts to complement such methods by providing interpretable levels of risk assessment monitoring. Such monitoring ensures that the automated system slows down, stops, or locks down when rare safety scenarios involving possible collisions or reduced reliability are detected. The integration of high-density Monte Carlo simulations with the Bayesian network for contextual analysis preserves computational efficiency and allows the model to adapt to real-time conditions. Numerical simulations were conducted to evaluate the proposed model’s performance in realistic aircraft inspection scenarios.
The main contributions of this paper can be summarized as follows:
  • A probabilistic safety assessment model is proposed for autonomous mobile robotic systems operating in close proximity to aircraft.
  • A unified risk metric model is proposed, which integrates state uncertainty assessment using an extended Kalman filter, trajectory prediction using a Monte Carlo simulation, and contextual analysis using Bayesian networks.
  • A risk fusion strategy is proposed for the geometric collision probability and a conservative upper-bound formulation, where the relationship between them is not guaranteed.
  • The model is evaluated by simulating close-in aircraft inspection scenarios using robotic systems, including landing gear inspection and UAV operation under wind load conditions.
  • The proposed method is compared with a deterministic baseline safety zone. Its practical advantages and limitations are discussed in relation to existing risk-based navigation and planning methods.

2. Materials and Methods

To introduce autonomous mobile robotic systems to ground handling operations around an aircraft and ensure their safe navigation, obtaining a reliable estimate of their state is a critical issue. The extended Kalman filter (EKF) [28] allows the linearization of nonlinear equations of motion, which are inherent to agents interacting with complex objects with nonstandard geometry. Thus, the proposed model applies the EKF to sensor data to obtain a kinematic assessment of a robotic system’s state. In this study, a heterogeneous group of robotic systems comprising two agents was considered: an unmanned ground vehicle (UGV) and a UAV.
The EKF was chosen because repeatable metric accuracy in localizing the relative position of inspection zones is required in aircraft inspection. However, the proposed framework is not limited to global navigation. Localization, lidar data perception, visual odometry, and collision avoidance are included only as additional sources of EKF measurements or as separate inputs to the Bayesian network [29]. Such collision avoidance methods are most effective for local obstacle avoidance; however, they are ineffective for limited inspection zones.
In this study, the term “heterogeneous robotic system” describes the ability of a risk assessment system to process robot state vectors, motion models, sensor uncertainties, and contextual reliability factors. This assessment is demonstrated for two platforms: an unmanned ground vehicle (UGV) with differential drive and an unmanned aerial vehicle (UAV) capable of hovering. Applying this framework to other robotic systems would require the adaptation of the motion model, assessment of measurement noise and collision zones, consideration of aircraft geometry, Bayesian network topology, and risk thresholds. Thus, the research results are transferable at the architectural level; however, their effectiveness is confirmed by evaluating all autonomous airport systems.

2.1. State Assessment and Uncertainty Modeling

The UGV was modeled as a system with differential drive and nonholonomic constraints. The state vector x u g v comprises the Cartesian coordinates ( x , y ) and heading angle θ :
x u g v = [ x , y , θ ] T .
The control vector u u g v comprises the linear velocity v and angular velocity ω . Thus, the UGV state for time step t can be discretely modeled as follows:
x k = f x k 1 , u k 1 + w k 1 = x k 1 + v k 1 cos ( θ k 1 ) t y k 1 + v k 1 sin ( θ k 1 ) t θ k 1 + ω k 1 t + w k 1 ,
where w k ~ N ( 0 , Q u g v ) is white Gaussian noise.
The UGV motion model should ensure that the airport apron work area has a level surface. This assumption is reasonable because airport aprons are typically constructed of asphalt concrete. However, the model does not explicitly account for wheel slippage, surface unevenness, apron contamination, or slope changes. These factors can affect odometry drift and expand the covariance matrix used in subsequent Monte Carlo simulations. Therefore, the parameters of these noises are experimentally determined before practical application [30].
UAVs used for aircraft maintenance are often quadcopters operating in hovering or low-speed flight modes. The UAV was modeled as a simplified system with six degrees of freedom, which was converted to a state vector comprising the position ( x , y , z ) and yaw relative to the aircraft φ :
x u a v = [ x , y , z , φ ] T .
The control vector was specified by setting the velocities in the local coordinate system: u u a v = [ v x , v y , v z , φ ˙ ] T . Thus, the UAV state for time step t can be discretely modeled as follows:
x k = x k 1 + ( v x , k 1 cos φ k 1 v y , k 1 sin φ k 1 ) t y k 1 + ( v x , k 1 sin φ k 1 + v y , k 1 cos φ k 1 ) t z k 1 + v z , k 1 t φ k 1 + φ ˙ k 1 t .
The EKF performs a two-stage process at each step k . The first stage is to predict a robot’s state using an a priori estimate:
x ^ k | k 1 = f ( x ^ k 1 | k 1 , u k 1 ) .
The a priori covariance matrix of errors is estimated as follows:
P k | k 1 = F k P k 1 | k 1 F k T + Q k ,
where F k is the Jacobian of the state transition function ( d f d x ) at point x ^ k 1 | k 1 . The Jacobian for a UGV is given as follows:
F u g v , k = 1 0 v k 1 t sin ( θ k 1 ) 0 1 v k 1 t cos ( θ k 1 ) 0 0 1 .
The second stage involves correcting the predicted state based on the received z k measurement data. The updated state is represented as follows:
K k = P k | k 1 H k T ( H k P k | k 1 H k T + R k ) 1 ,
x ^ k | k = x ^ k | k 1 + K k ( z k h x ^ k | k 1 ) ,
P k | k = ( I K k H k ) P k | k 1 ,
where H k is the observation matrix, R k is the measurement noise covariance, and K k is the Kalman gain.
The EKF outputs the posterior covariance matrix P k | k , which helps determine the shape and orientation of the uncertainty ellipsoid around a robot’s position in space [31]. The numbers ( λ 1 , λ 2 ) and vectors of the matrix ( P k | k ) determine the length of the semi-axes and the inclination angle of the uncertainty ellipsoid. The distribution N ( x ^ k | k , P k | k ) serves as an input parameter for the Monte Carlo simulations used to generate the probabilistic trajectories.

2.2. Prediction of the Collision Probability

Given the density of obstacles on the airport apron and their complex geometry, probabilistic calculations using a Gaussian distribution are ineffective. In such a dynamic environment, Monte Carlo simulations allow for an effective risk assessment [32] by generating a set of robot trajectories over a given time horizon T p r e d .
The estimated state x ^ k | k and covariance P k | k obtained by the EKF can be used to generate an array of states X k . The standard approach for Monte Carlo simulations uses an adaptive number of simulations. In this study, a fixed number of simulations ( N = 10,000) was used to identify risks with high reliability. The number of simulations was set to ensure the coverage of unlikely scenarios that arise during robot maneuvers or changes in sensor readings.
The quantitative sample size for the Monte Carlo simulation was selected through sensitivity analysis. During the experiments, 2000–15,000 simulations were conducted. For a sample of 3000 simulations, the collision probability demonstrated a high scatter of results and low tail sensitivity. Analysis of a sample of 8000 events revealed a relatively low error, which was also maintained for 15,000 simulations, but with increased computational complexity. Therefore, the authors believe that a sample size of 10,000 simulations provides an optimal compromise between all the necessary model parameters.
The initial state vector is generated as follows:
x i n i t = 1 N x ^ k | k T + ( L k · Ξ ) T ,
where Ξ is a d i m   ( x ) × N matrix with a sample of random variables N ( 0,1 ) and is the Kronecker product.
The EKF state estimate is used to fit the local uncertainty of the state of the robot to a Gaussian distribution. In the next step, the Monte Carlo simulation propagates these states through the collision geometry and nonlinear motion models. The trajectories contain nonlinear dispersion and boundary effects that are difficult to describe analytically. However, the current study is limited by global navigation satellite system (GNSS) multipath and lidar reflections from the aircraft’s metalized surfaces, which require calibration.
Calculating 10,000 predicted trajectories T p r e d requires substantial computational resources. The prediction task was parallelized on a graphics processing unit (GPU) to allow for real-time risk assessment. Thread i independently calculates the state vector evolution as follows:
x t + 1 ( i ) = f x t i , u t + w p ( i ) ,   i = 1 10000 .
This parallelization allows the prediction task to be performed in <20 ms for 10–50 Hz control frequencies.
A detailed risk map is created, and each point of a trajectory is checked for the risk of collision with the aircraft. The collision function for the i -th trajectory is calculated as follows:
C ( i ) = max t [ 0 , T pred ] ( d i s t ( x t ( i ) , V o b s ) < R s a f e ) .
The final probability is calculated as follows:
P g = 1 10000 i = 1 10000 C ( i ) .
Using a sample of 10,000 simulations helps introduce a highly granular gradation to the risk assessment, allowing the proposed model to effectively classify potential threats. For example, 10,000 simulations may result in five potential collisions, causing the model to proactively reduce the speed of the UGV. In contrast, 500 simulations run under the same conditions may identify a zero risk, which can cause the model to assume a false sense of safety.
The model applies the law of large numbers to reduce the probability P ^ g to the true probability p . The estimation standard error helps provide information on the model accuracy and is calculated as follows:
S E = p ( 1 p ) N .
The number of Monte Carlo simulations was set to 10,000 to balance the computational complexity with the need to identify critical collision scenarios, which are relatively rare under real-world conditions [33]. Several experiments were conducted while varying the number of simulations to determine the specific number of simulations. The estimated collision probability exhibited high variance and low sensitivity to tail events with 3000 simulations. The increase in model accuracy was negligible with 15,000 simulations, but the computational costs were high. Experiments were also conducted with 2000–15,000 simulations to test the stability of the estimated collision probability. The estimation error was less than 5% with 8000 or more simulations, which is sufficient for decision-making when a robot is in a critical area of the airport apron.

2.3. Contextual Analysis on System Reliability

The geometric collision probability P g is suitable for scenarios in which the UGV and UAV operate normally. However, in real-world scenarios on airport aprons, external stochastic factors, including wind gusts, precipitation, and electromagnetic interference, affect the reliability of autonomous mobile robotic systems. A Bayesian network was used to integrate these factors into a single risk metric [34].
Two specialized network topologies were constructed for the UAV and UGV using distributed acyclic graphs. Each network had identical structures, including the root, intermediate, and leaf nodes. The root nodes comprised the wind speed ( W ), GNSS signal quality ( G ), and illumination level in the inspection zone ( L ). The intermediate nodes included visual odometry errors, which are directly dependent on L (i.e., system accuracy decreases in bright light and at night), and position-holding stability, which depends on W and G . The leaf node represents the probability of system failure ( P s y s ), which implies that the UAV and UGV exit the inspection zone. The main difference between the network topologies was that the UGV network accounts for the coverage of the inspection zone and the density of dynamic obstacles.
Environmental disturbance effects are represented as additional constraints that affect localization, perception, and route selection reliability within the extended model. GNSS multipath effects are represented in the model as position measurement bias. LiDAR distortions are modeled as noise variance in ranging and as periodic spikes in measurements. Noise enhancement in the UGV motion model represents contamination and wheel slip associated with the operating surface. Personnel and ground vehicle movements are modeled using dynamic obstacle density nodes in a Bayesian network and moving obstacle trajectories in the Monte Carlo prediction layer. These effects were not calibrated using real sensor data in this study. As a result, the previously described disturbance parameters are interpreted as constraints at the robustness analysis scenario level. Table 1 presents the modeling constraints and their impact on the proposed model.
Table 2 presents the structure of the Bayesian network. In this study, the Bayesian network does not replace the geometric collision model. It represents a contextual reliability layer for increasing the assessed risk level when external conditions reduce confidence in localization and perception processes. Node states were divided into three layers to maintain computational efficiency and support real-time updates. UAV and UGV networks have similar logic, but the UGV network also considers the dynamic density of obstacles and the coverage of the inspection zone, as this type of robot interacts with ground equipment and personnel [35].
The probability of system failure for the stability node ( S ) is calculated as follows:
P s y s S = w W g G P S W = w , G = g · P ( W = w ) · P ( G = g ) .
This procedure is required to dynamically update the estimated system reliability. The probability at node W changes with increasing wind speed, which causes the probability signal to propagate throughout the model and ultimately increase the final value of P s y s . In this study, a conditional probability table (CPT) [36] was constructed based on expert judgment from ground handling personnel and aircraft inspection specialists along with statistics on sensor and navigation system failure. Expert data were used to initialize the Bayesian network and define a priori distributions, while simulations of standard sensor degradation scenarios and environmental disturbances were used to refine the numerical probability values. This hybrid approach has found wide application in reliability analyses of complex systems where real operational data are limited and ensures model reproducibility while maintaining adaptability.
In this study, the use of CPT is justified because operational data for autonomous automated systems interacting with aircraft have not yet been generated. Additional experiments were conducted to reduce the subjectivity of CPT and refine the simulation scenarios that simulated sensor degradation, wind interference, and localization. Furthermore, sensitivity analyses of CPT were conducted. The robotic system’s performance remained unchanged, demonstrating the robustness of the decision-making process.
The CPTs were formalized through a structured expert procedure to ensure a high level of reproducibility of the Bayesian reliability level. This expert group included representatives of the Kazakh aviation industry with practical experience in ground handling, aircraft inspection, and aviation safety risk assessment. Each expert independently assigned probabilities to each node of the Bayesian network using a three-level linguistic scale, including low, medium, and high levels of degradation. These assessments were converted into numerical probability intervals.
The weight of the expert assessment w i correlates with the expert’s area of expertise, his work experience, and indicators of agreement among all experts:
w i = s i j = 1 N e s j ,
where s i is the normalized expert assessment, and N e the number of experts who participated in the assessment. The aggregated entry in the CPT is then calculated as follows:
P k = i = 1 N e w i P k , i .
Inter-rater agreement is assessed by checking monotonicity constraints. CPT entries for the monotonicity rule are fed back into the model for re-evaluation by experts. The uncertainty in CPT values is propagated by varying the CPT values within intervals of ± 10 % and ± 20 % , followed by repeated Bayesian inference. The decision outcome is robust if the risk class does not change under these recalculations.
This procedure is necessary to ensure the model’s objectivity, thereby making CPTs transparent, reproducible, and verifiable. In cases where a large dataset is missing, the proposed CPTs, derived from expert judgment, serve as engineering a priori conditions necessary for future updates until empirical data becomes available. Table 3 presents the CPT identification protocol.
In traffic safety management models, the integrated risk R k is defined as the conditional probability of an incident I k occurring on the forecast horizon T h :
R k = P ( I i [ t k , t k + T h ] | I k ) .
In this study, the incident I k was defined as an integrated vector of several events: the collision probability P c , k over the time interval T h estimated from the trajectories obtained by Monte Carlo simulations and the critical failure probability P f , k obtained by the Bayesian network. If these probabilities are assumed to be independent for a fixed I k , the integrated risk can be defined as follows:
R k = 1 1 P c , k 1 P f , k .
The assumption that P c , k and P f , k are independent only applies to fixed robot states and short-term planning intervals. In Equation (18) P c , k represents the geometric probability of the predicted robot trajectories and aircraft boundaries’ intersection. Furthermore, P f , k is the contextual probability of system reliability degradation due to wind, GNSS signal quality, lighting, or sensor uncertainties. These probabilities may be correlated in real airport conditions because external disturbances and sensor degradation can simultaneously affect P c , k and P f , k . Consequently, the independence formulation is interpreted as a mathematical approximation rather than a universal equality.
A conservative upper-bound formulation is used to ensure safe operations, in which the correlation between P c , k and P f , k cannot be excluded. This formulation helps to prevent risk underestimation and is directly consistent with conservative engineering practice. This study uses an independence-based expression, and the conservative bound is primarily needed for future practical implementation.
For a fixed system state S ( t ) , P c , k and P f , k were assumed to be independent to facilitate real-time risk assessment. These probabilities are partially correlated under real-world conditions because of the effects of sensor degradation and external environmental effects on system operation. If independence is not guaranteed, a conservative upper bound can be used as follows:
R k P c , k + P f , k .
This ensures that the robotic system complies with safety-critical practices and helps ensure a safety margin during decision-making in the airport apron adjacent to the aircraft [37]. In this study, a threshold risk of R t = 0.05 was applied, which corresponds to the conservative engineering approach adopted for safety-critical systems [38] and ALARP logic [39]. If R k > R t , risk mitigation measures must be implemented. Note that R t is an acceptable level of risk within the interval T h and does not represent the actual incident frequency. Numerical simulations revealed that the number of false alarms increased up to a threshold of R t = 0.03. At R t ≥ 0.08, a response delay occurred in the dynamic operating scenarios. Therefore, the selected threshold balances operational efficiency with the effective monitoring of robotic navigation safety.
The threshold value was selected through sensitivity experiments. For threshold values below 0.03, the model begins to generate false alarms, resulting in the abortion of the verification task even though the robot was outside the collision zone. For threshold values above 0.08, the system begins to lag in dynamic scenarios, reducing the safety margin. Therefore, R t = 0.05 was chosen as a conservative compromise between continuous operation and safety. This value is not interpreted as a tolerance for accident frequency but rather as a decision threshold for the risk assessment system to trigger preventive actions.
Independence is used only as a first-order approximation for a fixed-state estimate. The geometric event C , which is represented by the intersection of the predicted trajectory and the aircraft boundary, and the system reliability degradation event F , which is a contextual system failure, are conditionally independent for the current estimated state x t :
P C , F x t = P C x t P ( F | x t ) .
The model assumes that this assumption does not hold for all airport apron conditions. For example, if the GNSS signal degrades, the trajectory variance increases simultaneously, and the probability of Bayesian failure increases. Consequently, the risk assessment, considering independence, underestimates the risk in cases where the disturbance affects both layers. To avoid unsafe underestimation, a conservative layer merging bound can be achieved:
P C F x t P C x t + P ( F | x t ) .
This study uses independence metrics and nominal simulation scenario metrics. A conservative upper-bound formulation is recommended for scenarios with deterioration or correlated disturbances.
The risk R of an incident is adjusted by the severity of its consequences C , which depends directly on the position of the robotic system relative to the critical zones of an aircraft:
R = P t · C s .
Based on the calculated R, the proposed model decides the action of the robotic system according to the reaction matrix presented in Table 4.

3. Results

Numerical simulations were performed in MATLAB R2025a using the UAV Toolbox and Robotics System Toolbox packages. Because of the large sample size, the Parallel Computing Toolbox with GPU support was used for the Monte Carlo simulations.

3.1. Accuracy of State Assessment

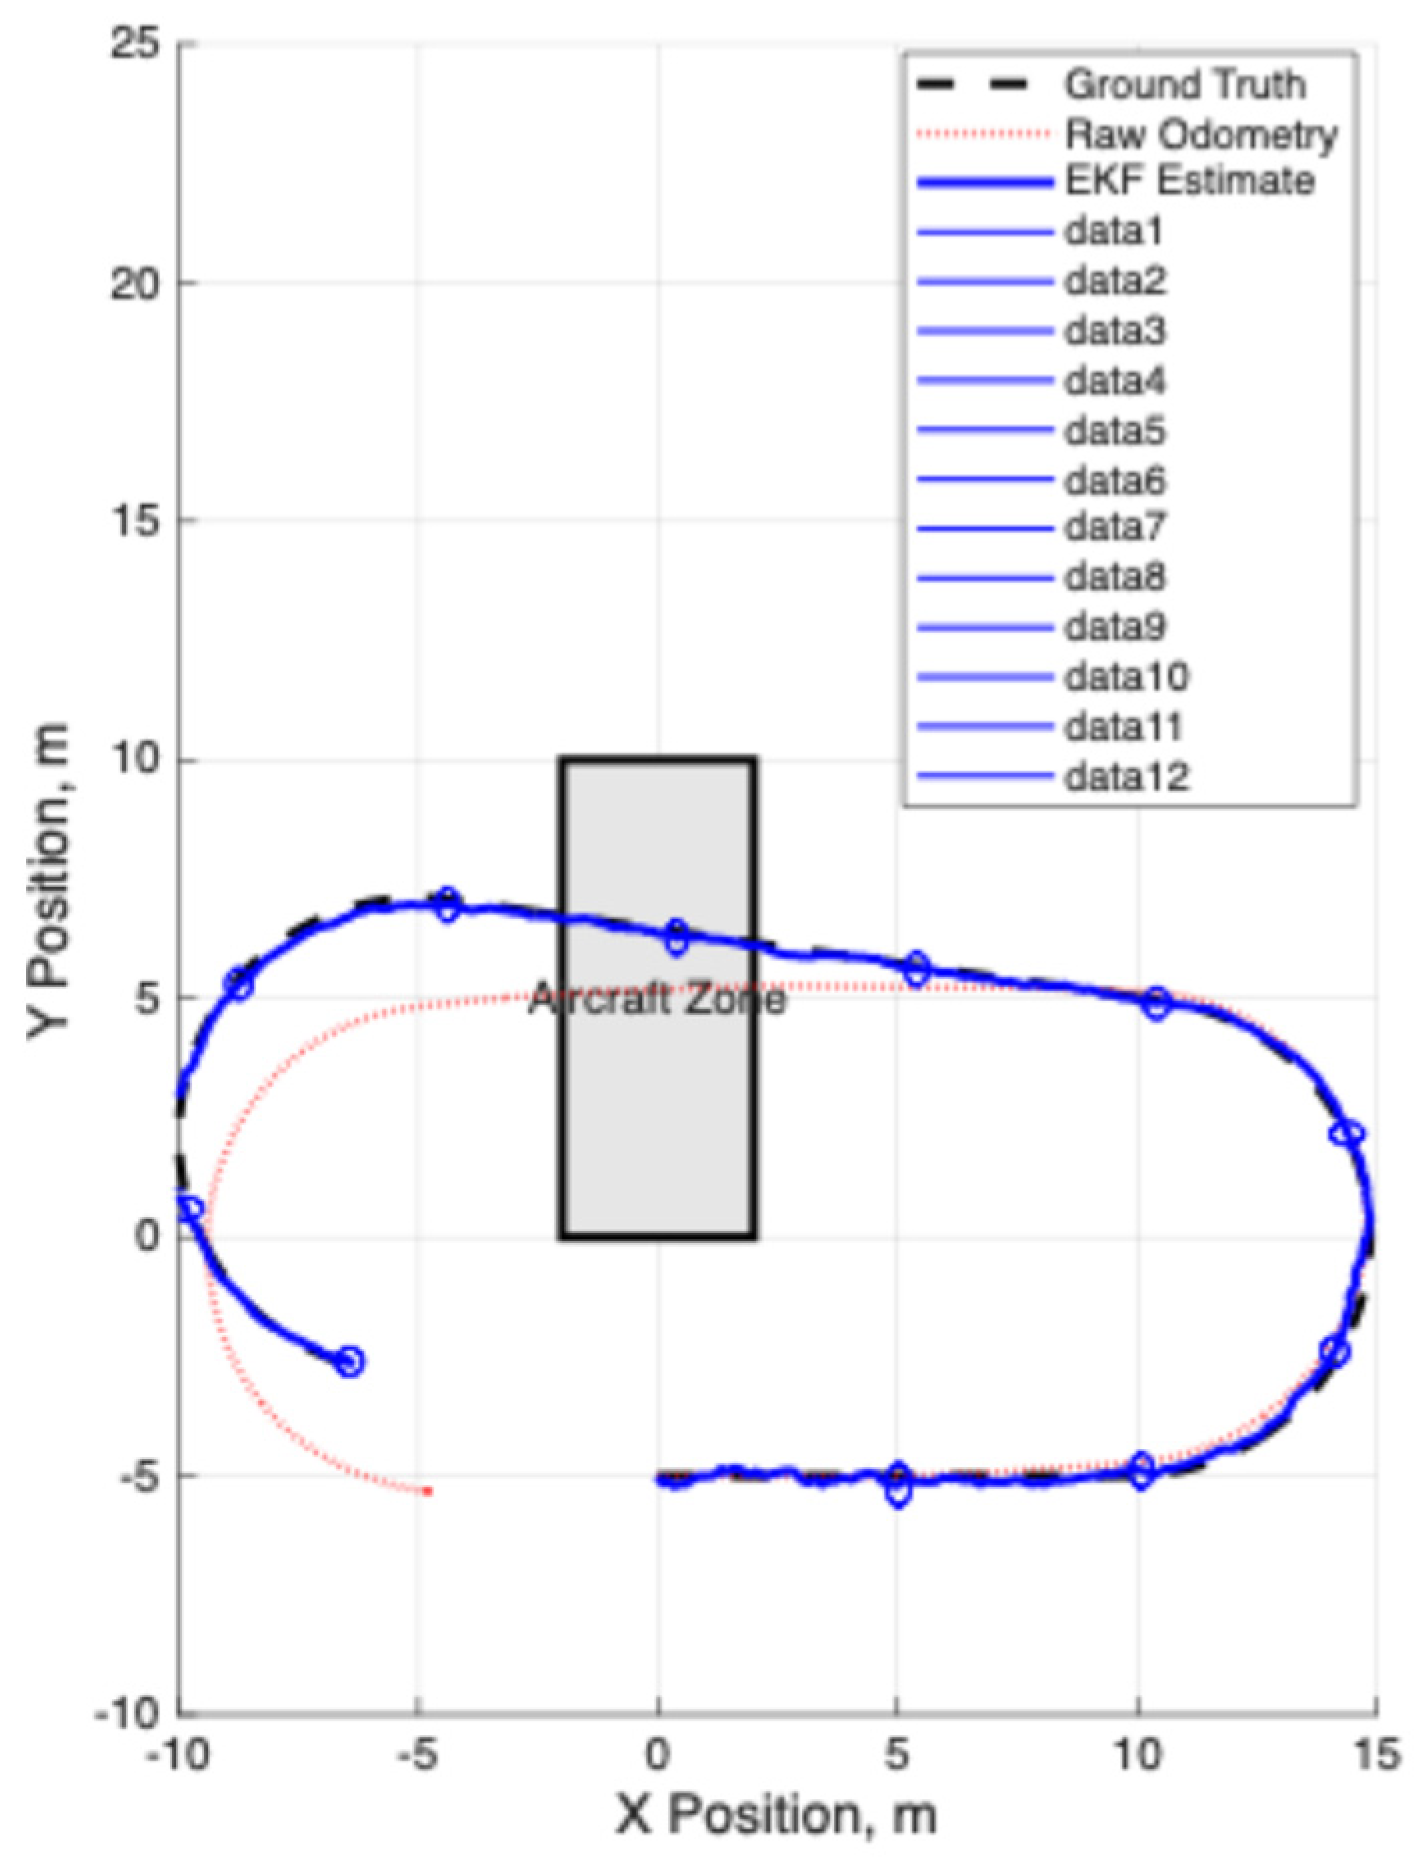
A series of simulations was executed to confirm the ability of the EKF to compensate for odometry errors that accumulate during operation and to estimate the position of a robotic system near an aircraft. Figure 1 visualizes the UGV trajectory along a closed loop through an aircraft zone on a two-dimensional plane. The black dashed line represents the true trajectory, the red dotted line represents the estimated trajectory based on odometry data, and the solid blue line represents the EKF-based trajectory. The odometry-based trajectory exhibited drift, and midway along the route, the deviation from the true trajectory became critical. At the end of the odometry-based trajectory, the UGV’s position estimation error reached several meters. In contrast, the EKF-based trajectory demonstrated close agreement with the true trajectory due to the effective error correction using GNSS data. The covariance ellipses in the figure represent the uncertainty along the entire trajectory.
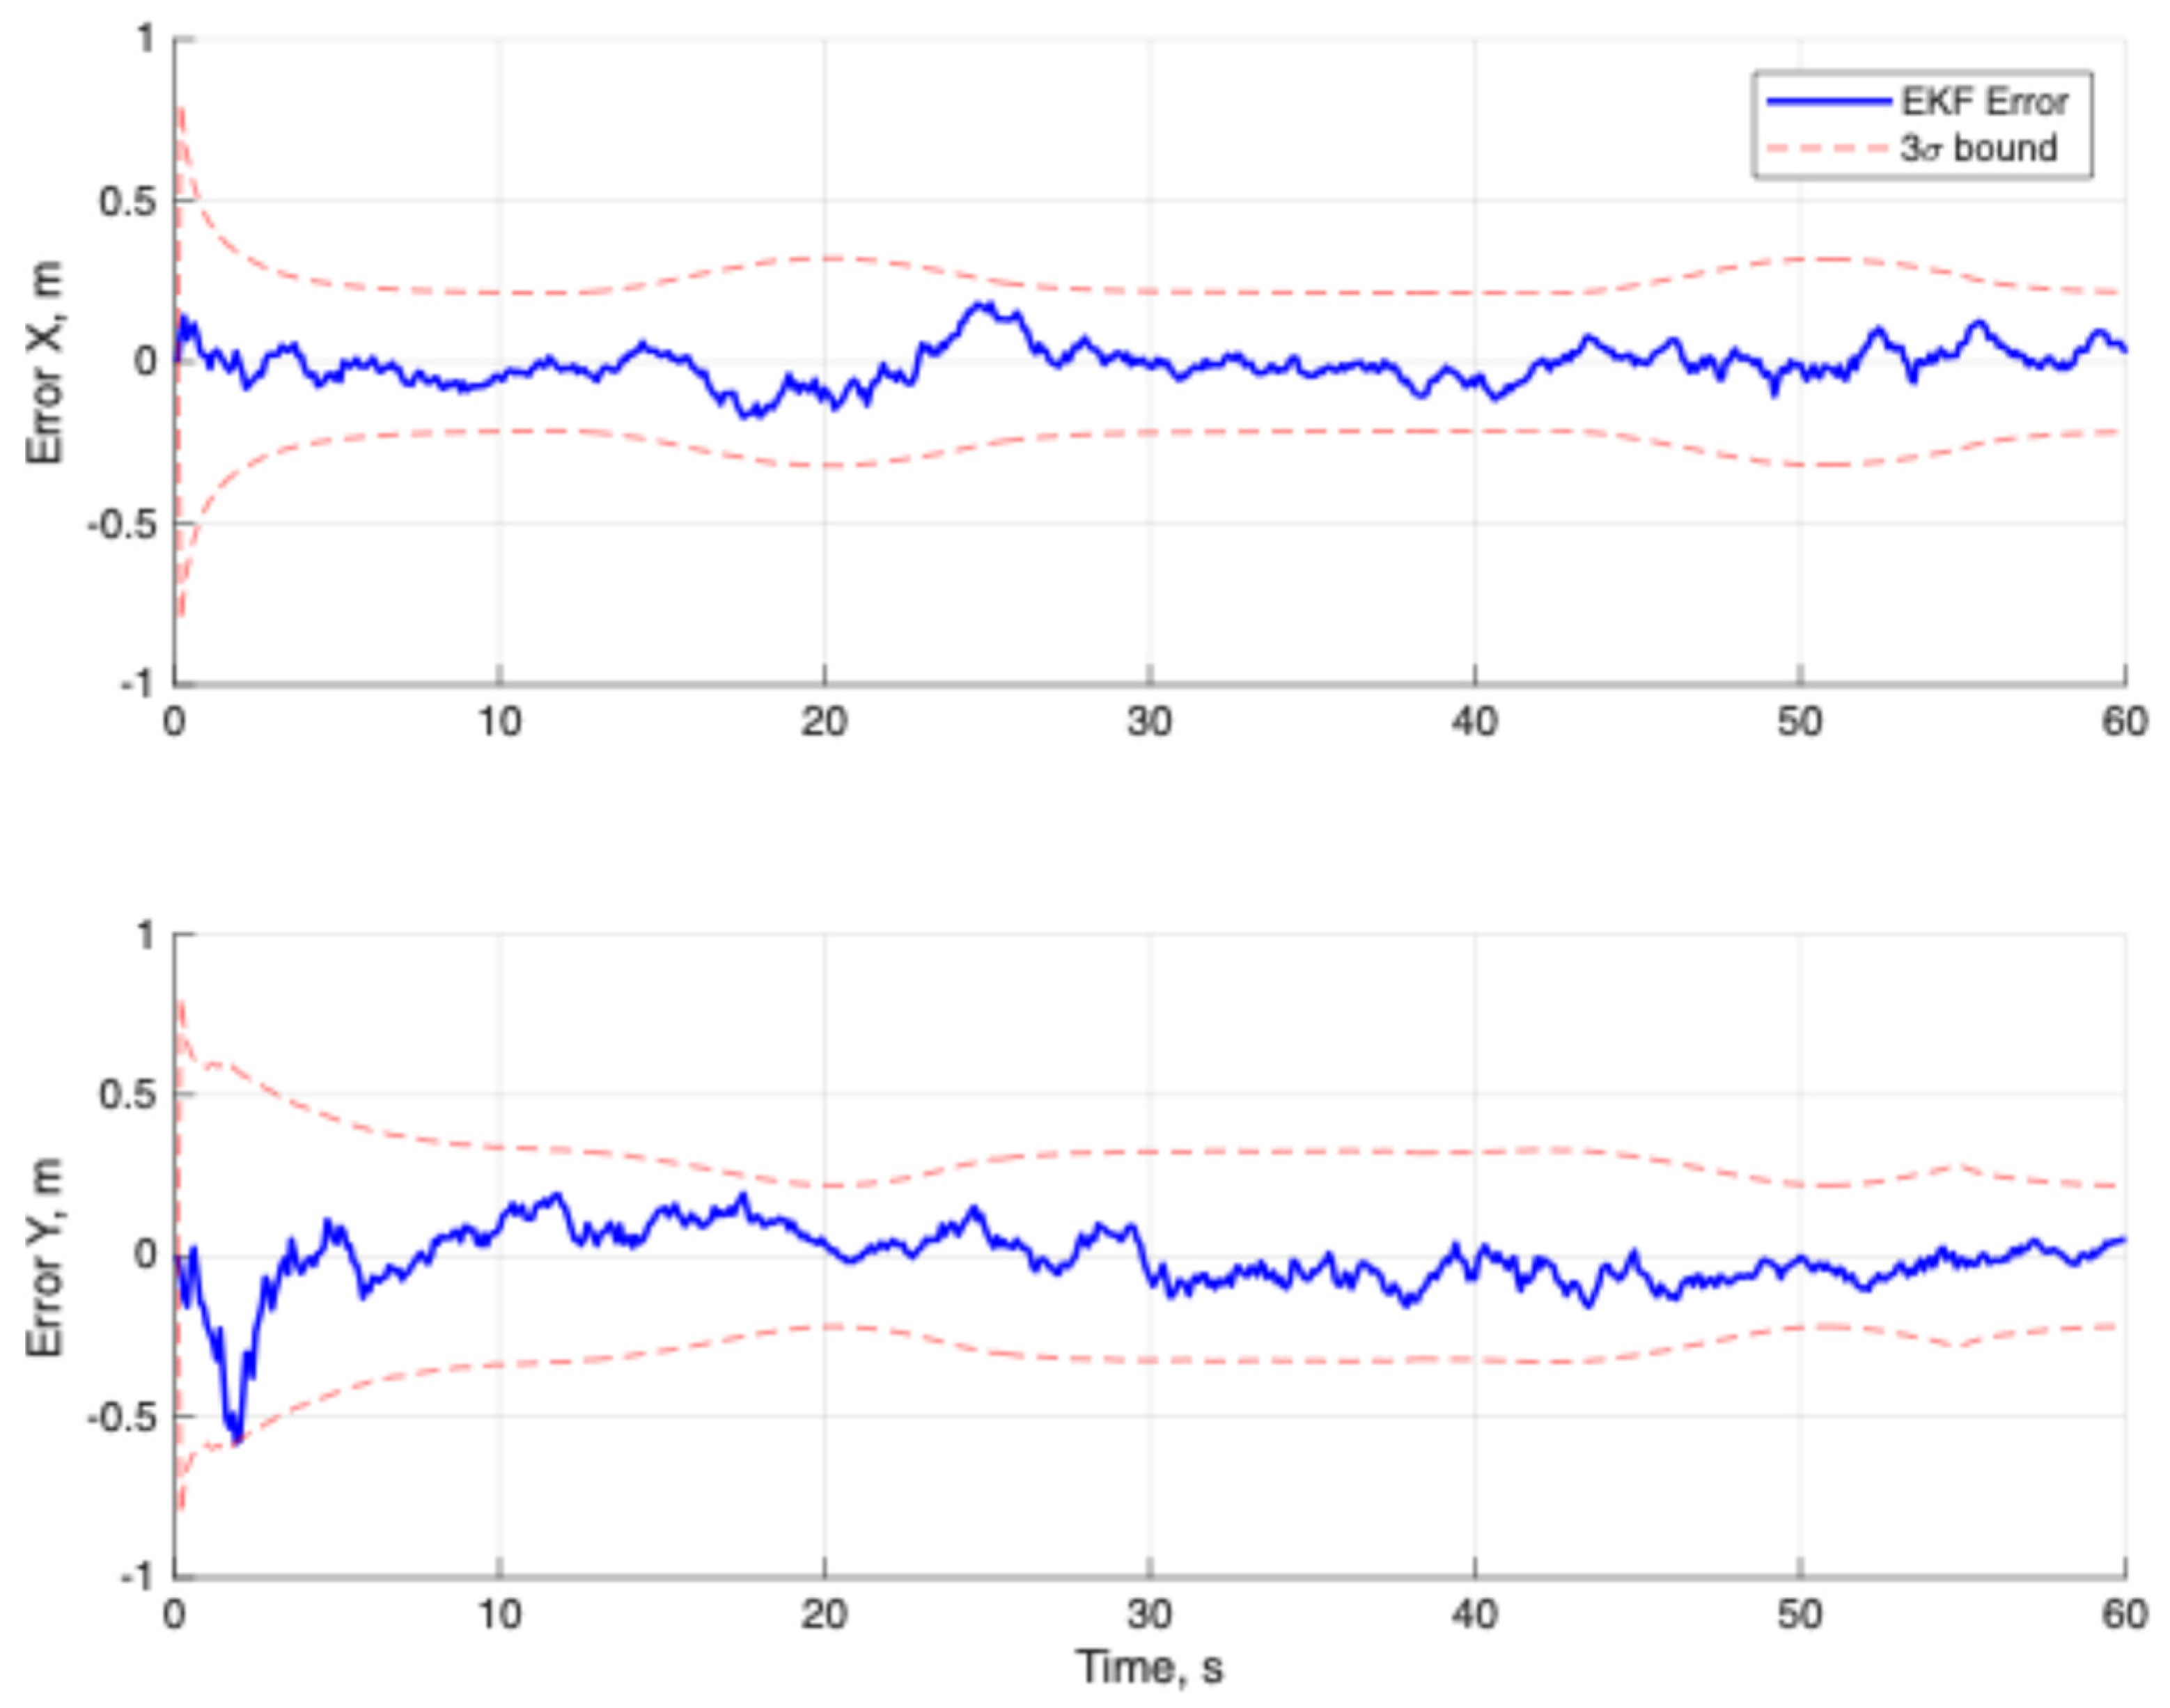
Figure 2 shows the estimation error dynamics of the EKF-based trajectory along the X and Y axes with a confidence interval of three standard deviations. Along both axes, the estimation error fluctuated within ±0.5 m. Throughout the simulation period, the error remained within the 3 σ . Spikes in the estimation error correspond to turning maneuvers by the UGV, but the EKF quickly compensated for such spikes. The fact that the estimation error did not exceed the confidence interval confirms the accuracy of the proposed model and indicates that the covariance matrix P k adequately describes the uncertainty.

3.2. Collision Risk Analysis

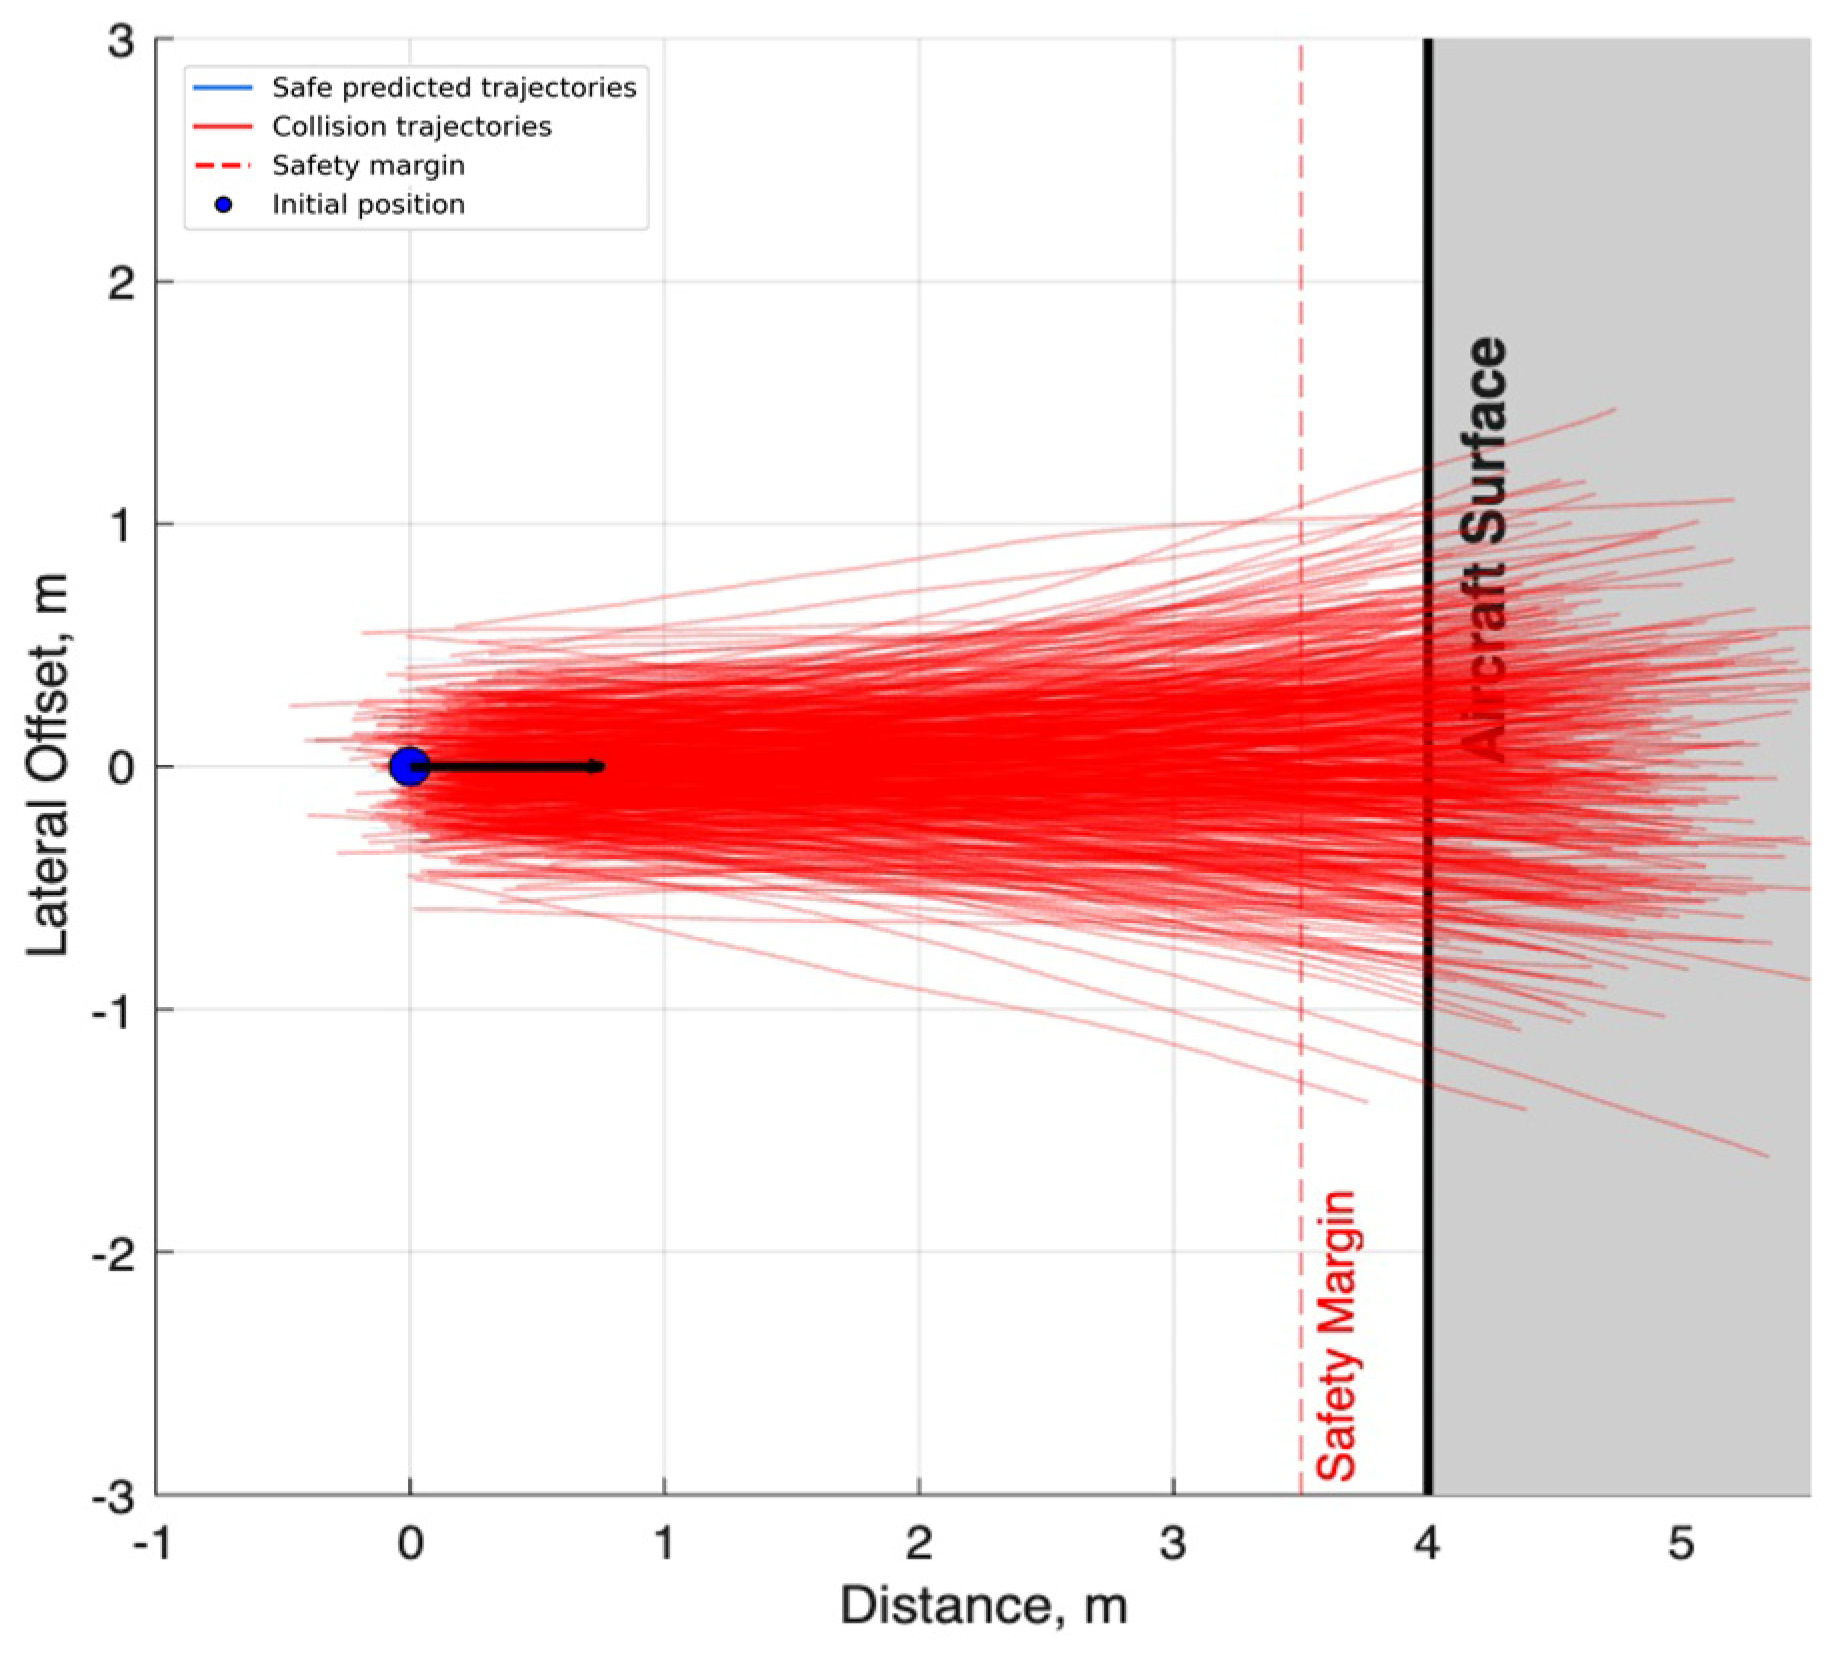
To evaluate the effectiveness of the proposed model in assessing the collision risk, 10,000 Monte Carlo simulations of critical encounters between a UGV and an aircraft were conducted. In the simulations, the UGV moved toward the aircraft’s fuselage, located 4 m away, at a speed of 1.5 m/s for a prediction horizon of 3 s. Figure 3 distinguishes between safe (predicted) trajectories, trajectories crossing the aircraft boundaries, the robot’s initial position, and the collision boundaries with the aircraft to improve the interpretation of the Monte Carlo simulation results. The density and direction of the trajectories indicate the correlation between the propagation uncertainty and the prediction horizon.
Figure 3 presents the simulation results. The model exhibited high sensitivity to the UGV dynamics as it approached the aircraft. Initially, the UGV was at a safe distance; however, the predicted trajectories indicated that a collision was inevitable if the velocity vector remained constant. A geometric collision probability of P g = 0.987 was calculated, which corresponds to a high-risk level (Table 2) and triggered an emergency stop of the UGV well before a physical collision. The dispersion of the trajectories demonstrates the influence of the stochastic disturbances included in the simulations.
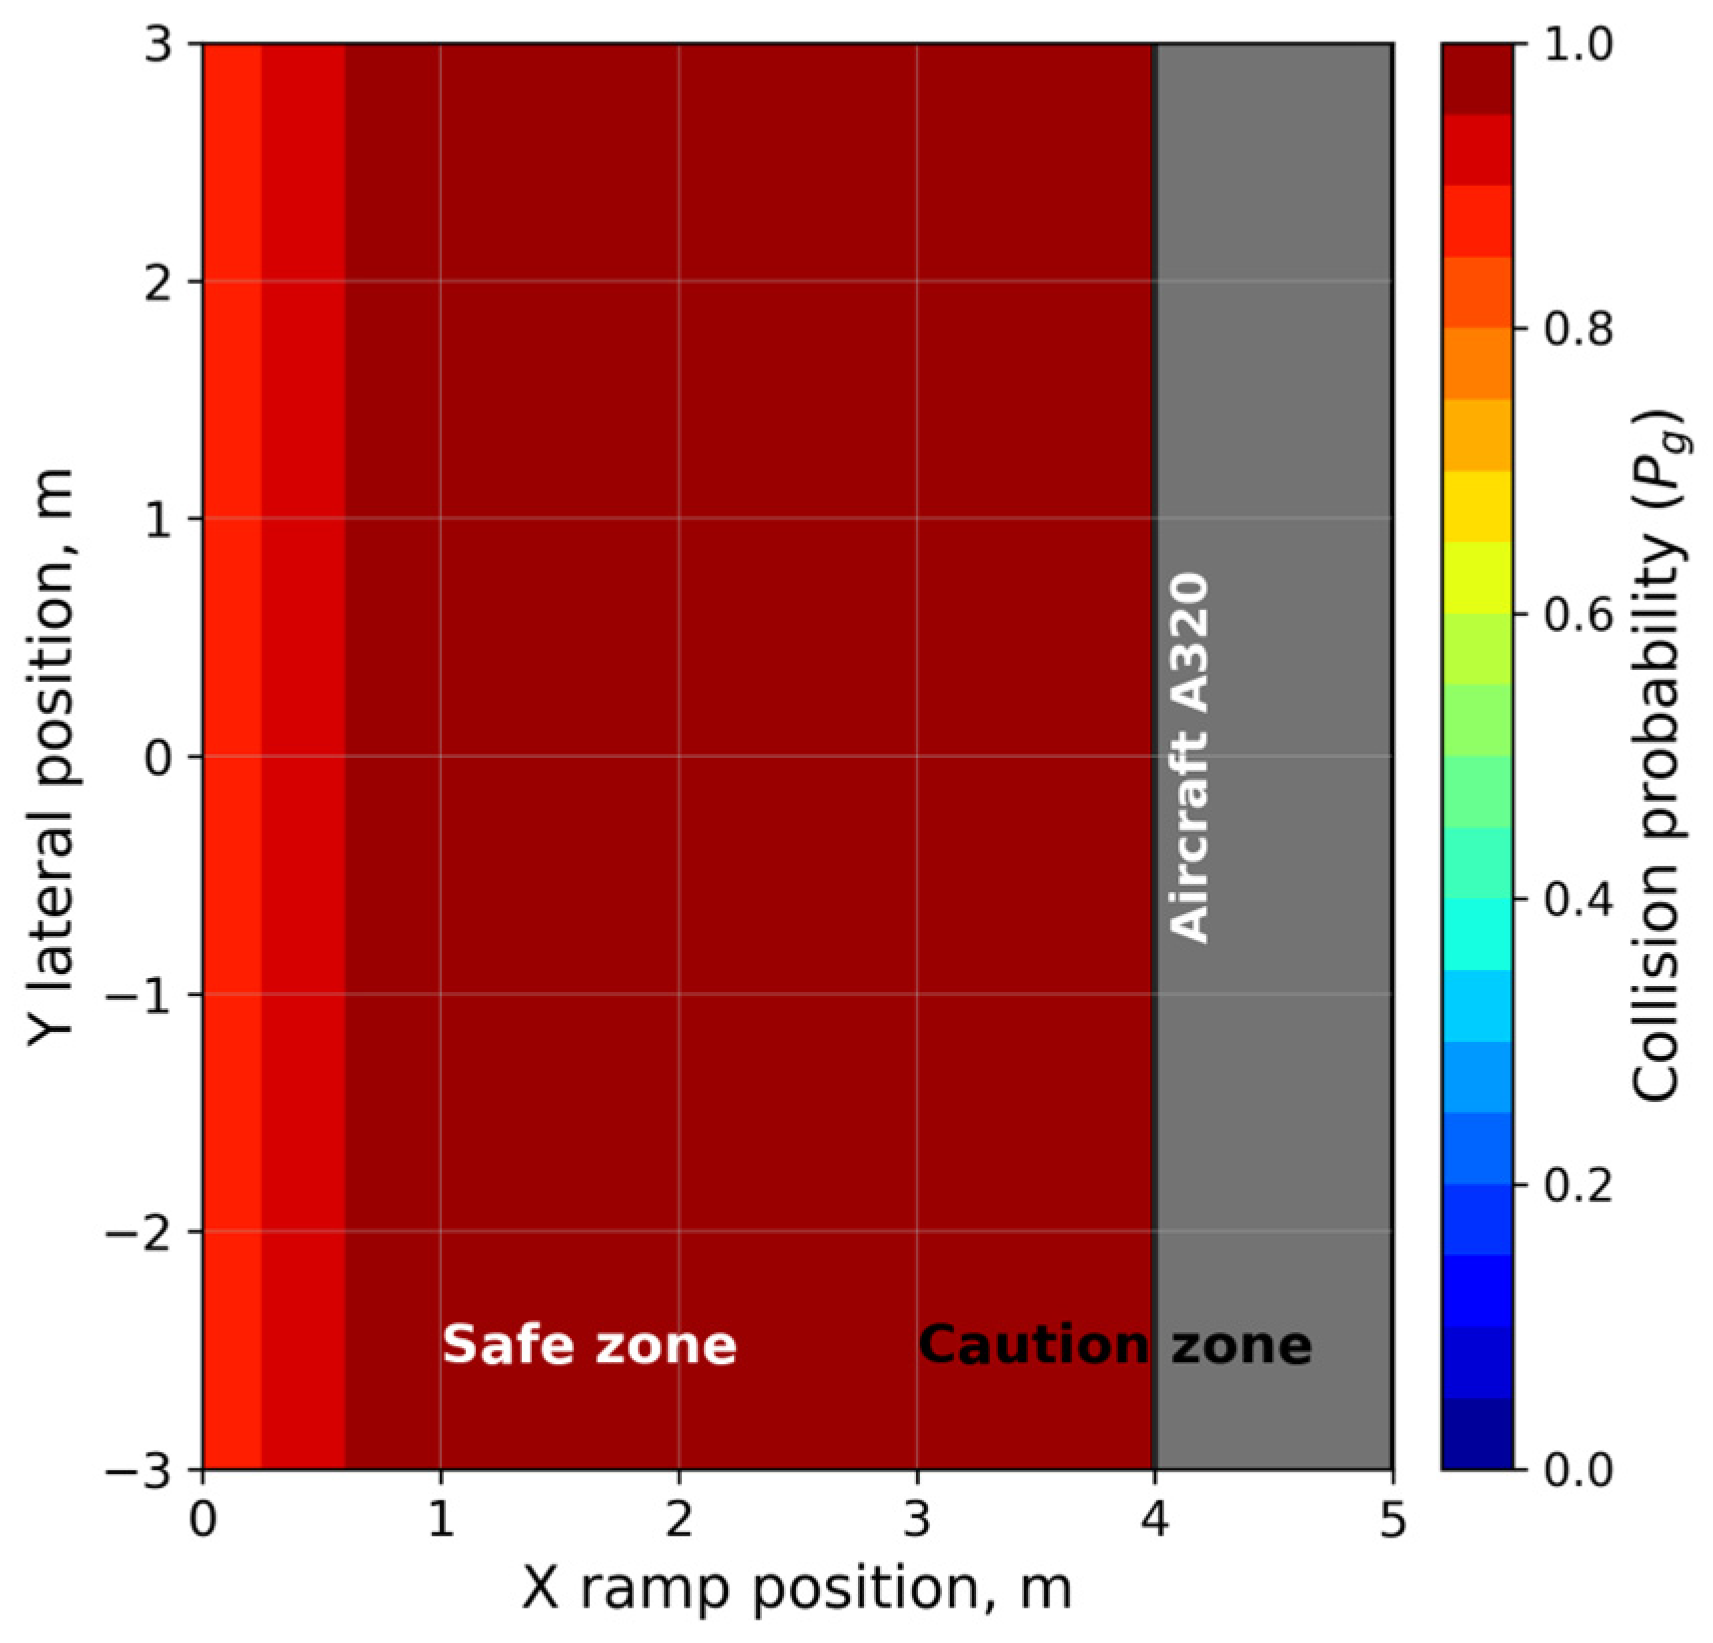
A heat map is necessary for interpreting the spatial variations in the estimated risk. The robot’s position, speed, and trajectory dispersion are combined in high-risk areas. Figure 4 shows a heat map of the movement-related risks. Because the UGV was moving at an excessive speed near the aircraft, the proposed model considered the entire airport apron to be high-risk. This demonstrates that the selected motion parameters did not result in safe trajectories. This heat map demonstrates the need for adaptive speed control, which can be used to create safety zones in which the robotic system reduces speed in proportion to its proximity to the aircraft. The proposed model’s conservative nature and robustness are demonstrated in the heat map, which prevents a false sense of security when a robotic system approaches an aircraft.

3.3. Influence of Environmental Conditions

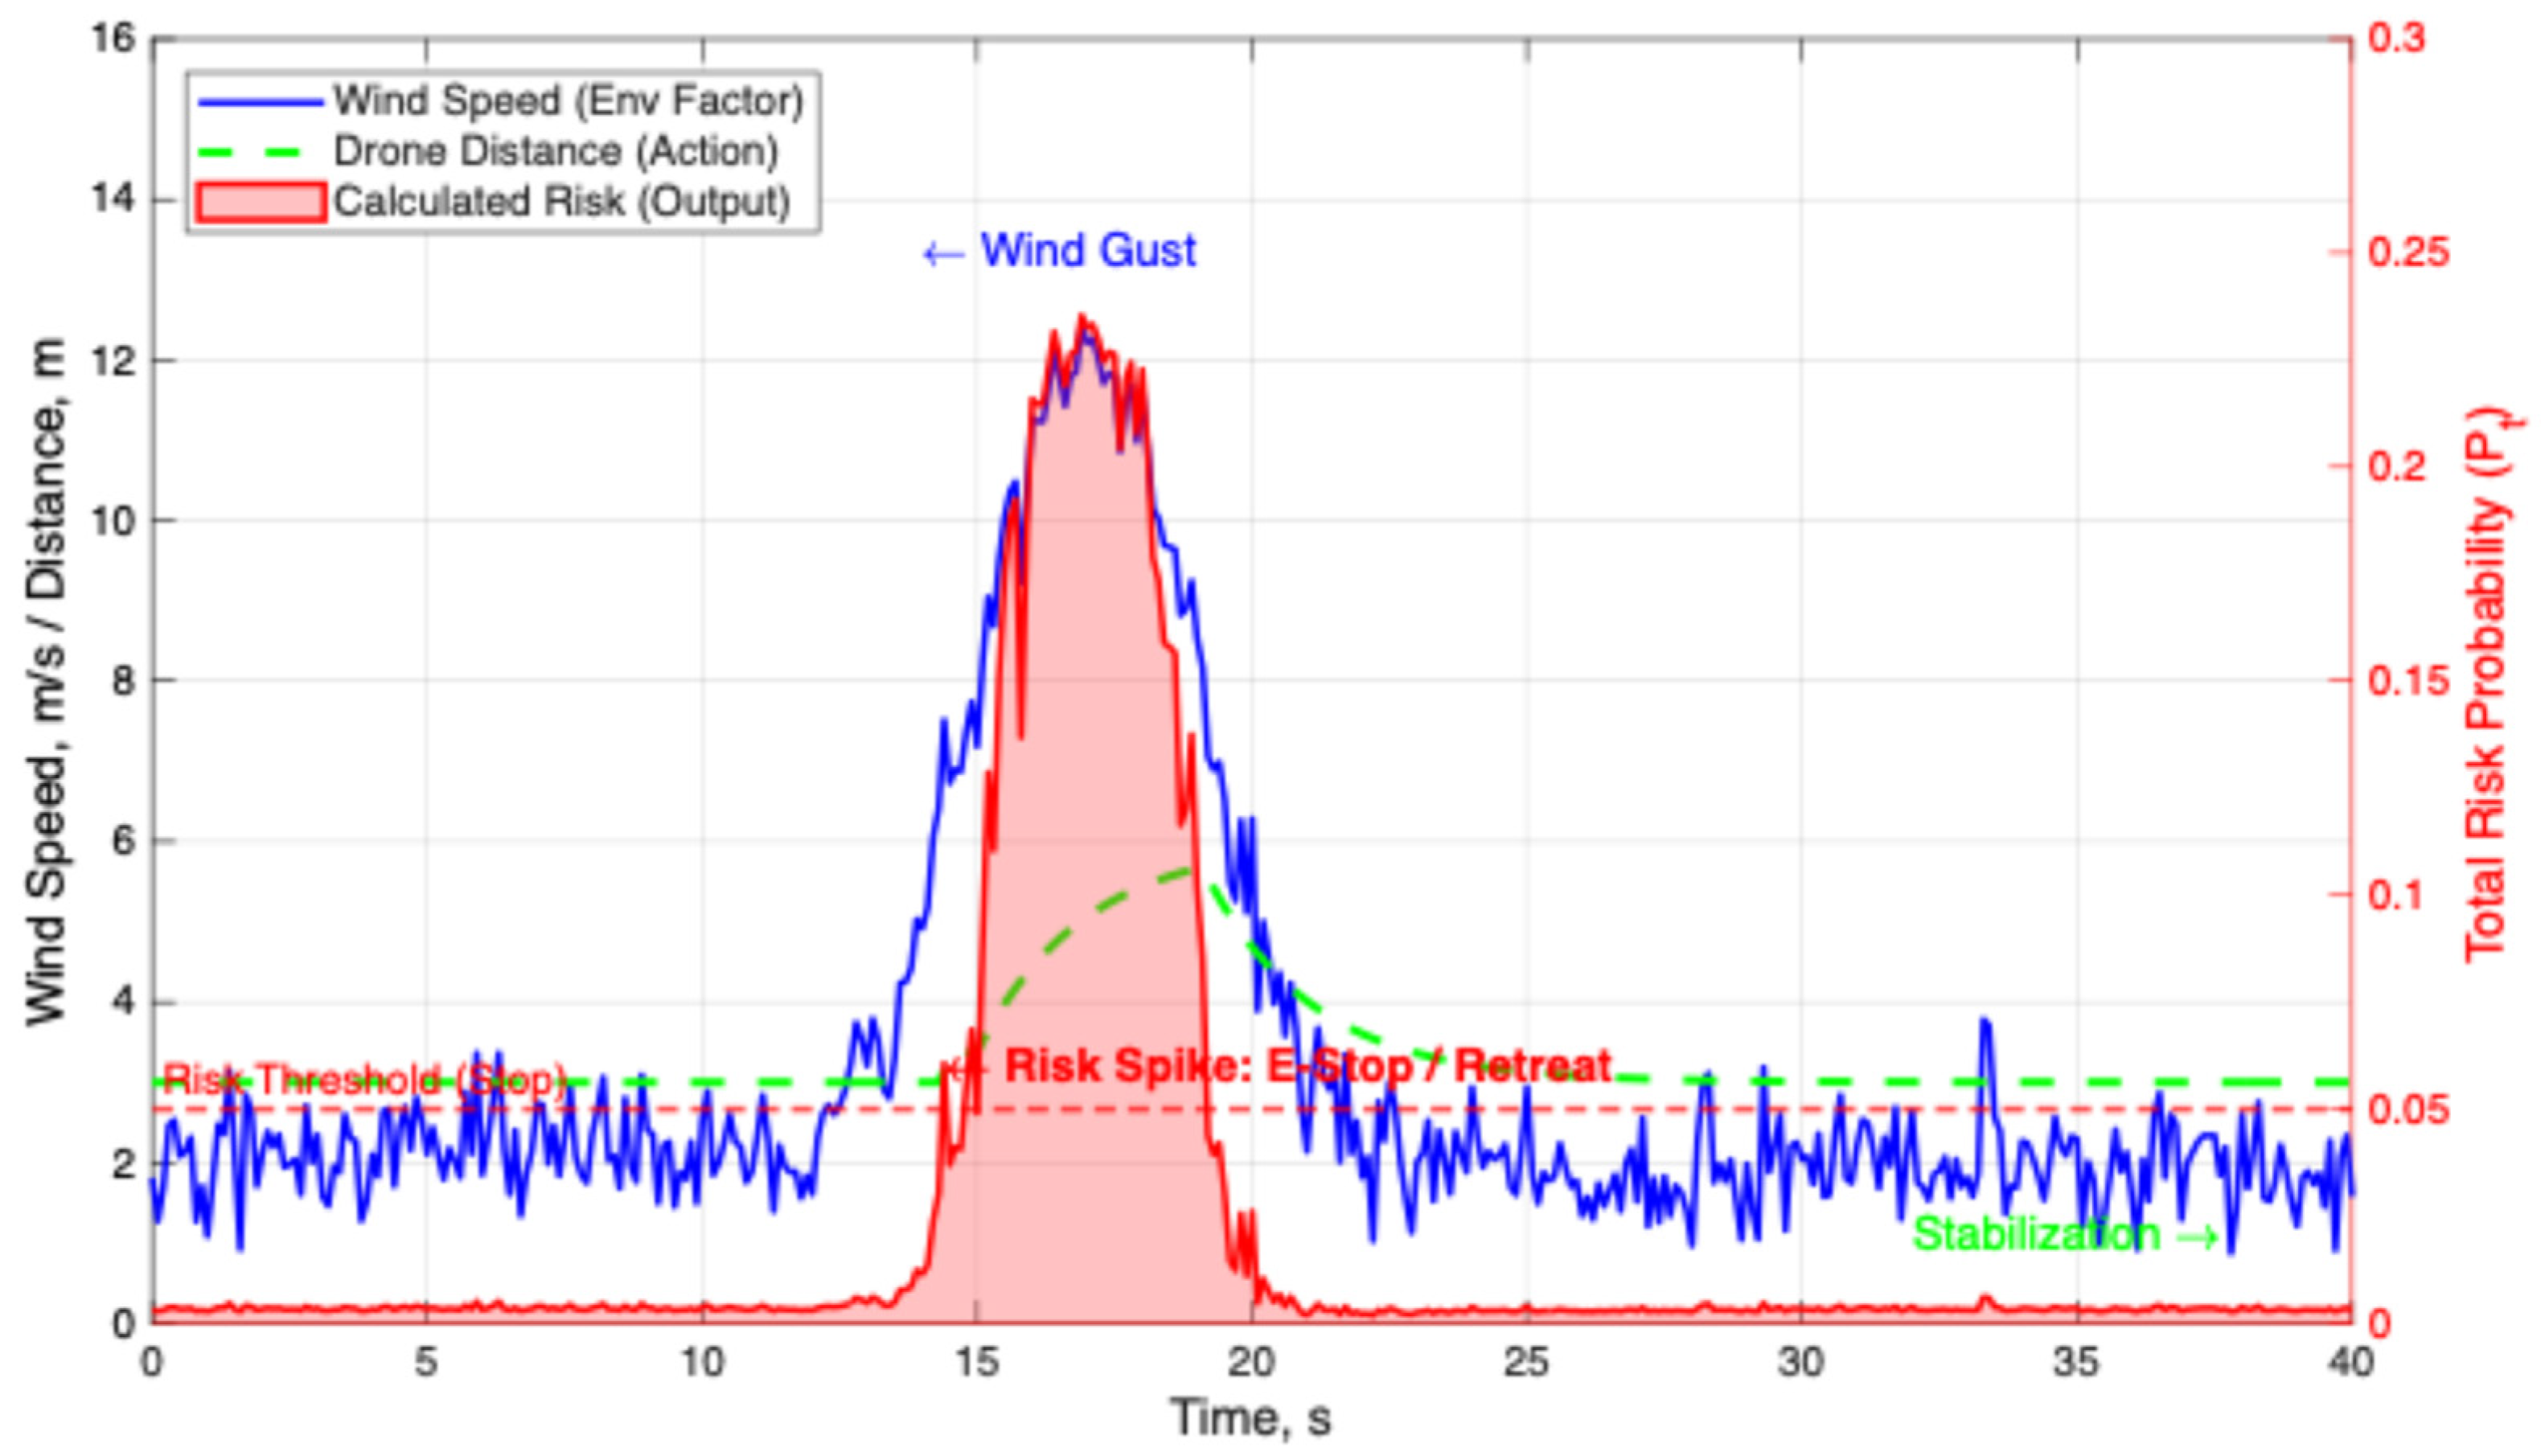
Next, an experimental scenario was considered in which a UAV hovered 3 m above the aircraft’s surface. At 13–20 s, an external disturbance in the form of a sharp gust of wind with a speed of 12 m/s was introduced into the simulation environment. Figure 5 shows the response dynamics of the proposed UAV based on the probabilistic risk assessment. The operation was stable up to 13 s. At this point, the wind speed was 2–3 m/s, and the UAV was maintaining a distance of 3 m from the aircraft. Thus, the Bayesian network estimated the collision risk to be approximately 0. At 13–15 s, the increase in wind speed caused the collision risk to increase sharply. However, at this point, the UAV remained at the same altitude. At 15 s, the collision risk calculated by the Bayesian network exceeded the threshold value of 0.05, triggering the protective protocol of the UAV and initiating an emergency retreat that increased the distance from the aircraft to 5.5 m. The calculated collision risk peaked at 0.23, which is significantly higher than the threshold value. As the wind speed decreased and the UAV distance increased, the collision risk fell below the threshold value. The UAV switched to stabilization mode and maintained its distance from the aircraft to compensate for future increases in wind speed. These results confirm that the Bayesian network can prevent collisions involving loss of control. The UAV would have maintained a distance of 3 m without the Bayesian network, which would have increased the collision risk when the wind speed increased because of inertial drift. A qualitative analysis was conducted on the impact of probability values in the CPT on the Bayesian network sensitivity. The results showed that changing the input probabilities by up to 20% did not affect the decision-making logic or operating modes of the UAV, confirming the robustness of the proposed model against uncertainty in the expert evaluations.

3.4. Comparative Analysis

A comparative analysis was conducted using the deterministic safety zone method, which is the industry standard for aviation safety, to assess the applicability of the proposed method. Ground handling regulations state that unmanned vehicles cannot move within 2 m of an aircraft. An experimental scenario involving the inspection of landing gear using a UGV at a distance of 0.5 m was designed. The studies were conducted using binomial estimation rather than performance guarantees to avoid increasing the consistency of mission success rates and underrepresenting occasional false positives. As previously noted, 50 different simulation runs were conducted with different initial disturbances, noise sensors, wind profiles, and illumination. The 95% confidence interval was calculated using the Clopper–Pearson binomial method. Forty-nine out of 50 missions achieved a success rate of 98%. Considering the confidence interval, this success rate is 89.4–99.9%. A false positive rate of 6% corresponds to 3 events out of 50, considering the confidence interval of 1.3–16.5%. The data intervals indicate that the simulation data are sufficient for assessing the feasibility of missions but not for assessing the safety of certification. Table 5 presents the results of the repeated-run statistics.
Successful mission completion was defined as the UGV reaching the inspection zone while maintaining a low integrated risk R (i.e., no emergency stops or physical collision with the aircraft). A false alarm corresponded to a forced shutdown of the UGV even in cases where there was no collision risk. Table 6 presents the results. Automated inspection was impossible with the deterministic safety zone method. In all simulations, the UGV was stopped at the restricted area boundary. These stops qualified as false alarms because there were no physical obstacles in the path of the UGV. In contrast, the proposed method successfully completed the mission in 98% of cases. The proposed model allowed the UGV to approach the landing gear within a distance of 0.48 m without exceeding the threshold risk of 0.05. False alarms (6%) were caused by the introduction of sensor noise, which the Bayesian network perceived as increased uncertainty. Such alarms are an acceptable compromise for ensuring the safety of autonomous mobile robotic systems.

3.5. Computational Performance

The proposed computational risk assessment layer is evaluated by measuring the execution time of the EKF update, MCTP, BN inference, and risk data fusion. In the model, the Monte Carlo module is the dominant computational component because each trajectory requires propagation over the forecast horizon and checking for possible collisions with the aircraft. GPU parallelization is used to improve model performance due to the independent propagation of trajectory samples.
The computational complexity of the Monte Carlo layer scales is as follows:
O N s N h N a ,
where N s is the number of samples, N h is the number of prediction horizon steps, and N a is the number of robotic agents. The memory usage scale is as follows:
O N s N h d ,
where d is the state dimension. It follows that for large-scale deployment of a model including multiple robots, the sample size must be reduced or distributed computing must be used. Table 7 shows the computational characteristics of the proposed framework.

4. Discussion

The conducted comparative modeling shows that the proposed probabilistic risk assessment model simulates operations in the immediate vicinity of the aircraft at a close distance compared to the deterministic basic safety zone. The safety zone was reduced from 2 to 0.48 m, while the collision probability was maintained at less than 10 4 . Simplified models often fail to identify rare tail risks, which are critical issues in technical systems. The Monte Carlo simulations generate a high sample density that allows the identification of rare scenarios involving an unfavorable combination of sensor noise and external disturbances. The collision risk analysis confirmed that the proposed model adaptively prevents the robot from approaching the aircraft based on changes in the robot’s velocity vector and weather conditions.
The proposed framework differs from the risk-based dynamic robot navigation approaches described in the literature. Compared with risk model-based prediction, the proposed method does not optimize robot trajectories. It acts as a safety controller that can be integrated with low-level controllers. Compared with random constraint planning methods, the proposed method does not rely on an analytical uncertainty distribution but uses Monte Carlo simulation to capture nonlinear trajectory dispersion and evaluate rare events. Compared with probabilistic navigation maps or other sample-based trajectory planning methods, the proposed method focuses primarily on risk assessment near critical aircraft elements. Compared with the perception-based collision avoidance method, the proposed model also incorporates system reliability factors, such as GNSS signal degradation, wind gusts, and illumination changes.
The proposed model focuses on positioning and should not be considered a complete system compared with risk-based navigation approaches. A risk-based control model offers risk-based optimization, but it can be computationally expensive when simultaneously considering aircraft geometry, rare collision possibilities, and sensor contextual reliability. Constraint-based planning provides probabilistic safety constraints, but its practical effectiveness directly depends on the uncertainty distribution and constraint formulation. Probabilistic sampling planning allows trajectory modeling in cluttered environments; however, this requires a planning mechanism that often does not account for collision geometry and system-level reliability degradation. Machine-learning-based navigation methods are well adapted to complex environments but require large training data and have limited interpretability in safety-critical environments. The proposed framework is used as an interpretable layer for risk assessment and control. The qualitative comparison of these approaches is summarized in Table 8. The conceptual positioning of the proposed framework relative to the individual modeling components and the static safety zone in the simulated landing-gear inspection scenario is presented in Table 9.
The simulation results show inspection efficiency, particularly due to the reduction in unnecessary stops near the target, considering controlled risk. However, this advantage should not be interpreted as operational readiness. The resulting reduction in distance and false alarm rates was achieved only for simulated scenarios that included a specific disturbance model and sensor-noise characteristics. Therefore, claims with respect to reduced inspection time, improved safety, and improved apron deployment can only be made after conducting physical experiments.
The proposed framework is not a mission planner but rather a movement safety assessment layer. The model does not address inspection, energy consumption, or task execution time optimization directly. Instead, the proposed framework helps assess whether the predicted robot movements remain within acceptable risk levels. The automated inspection system monitors mission execution and cancels planned commands when the risk exceeds a threshold in the proposed architecture.
Transferring the proposed approach to other robots and tasks require adaptation. The key parameters for UGVs include wheel-surface interaction, odometry drift, contact patch estimation, braking distance, and dynamic obstacle density. For UAVs, wind sensitivity, flight controller response, GNSS signal reliability, airflow limitations, and distance to the object of investigation are the key parameters. For inspection missions, the risk threshold and location criticality map should reflect the aircraft inspection area, sensor resolution, and distance to the object. Although the proposed architecture can be employed for logistics, refueling, and deicing tasks, the motion dynamics and failure modes may differ. Therefore, the proposed framework can be considered a portable risk assessment architecture rather than a general-purpose navigation solution.
Despite the positive results obtained from the modeling, this study has several limitations. First, the model was validated only through MATLAB simulation. This validation should be considered a preliminary assessment of the feasibility of the model, not a full-fledged safety test. The study does not include hardware testing, physical experiments on an airport apron, or reproducibility tests on real sensor data. Therefore, the 98% mission success rate and 6% false alarm rate do not apply to all airport apron conditions. Future work will require the authors to conduct experimental validation with hardware on real data, reproduce navigation data, and test under real airport conditions. Second, the EKF uncertainty includes Gaussian state uncertainty, but sensor errors may be non-Gaussian in real-world airfield conditions. Third, the CPT of the Bayesian network was initialized through expert judgment and refined during the modeling phase, rather than using operational datasets. Fourth, the independence of the integrated risk assessment is conditionally valid only for a short-term planning horizon. In future real-world testing, it will be replaced by a conservative upper-bound estimate or an empirical dependence model. Finally, the model has a number of advantages over traditional conservative inspection practices, but a full quantitative assessment considering risk and navigation through the system’s learning algorithms is required for use in real practice.
The reliability and generalizability of the obtained results are limited by the set of scenarios considered during the modeling process. The tested scenarios include the close-range inspection, landing gear approach, and wind effects on the UAV; however, they cannot cover the entire range of possible airport apron operations. Disturbances, wet or contaminated pavement, GNSS multipath, aircraft LiDAR reflections, visual obstructions, dynamic apron traffic, and other factors affect performance. A conservative risk assessment formulation with an upper bound can reduce the likelihood of risk underestimation in such cases but also increase the number of false alarms and reduce operational efficiency. Therefore, a factorial test matrix encompassing robot types, mission profiles, surface conditions, sensor degradation, obstacle density, weather conditions, aircraft geometry, and communication latency should be included in a comprehensive validation.
The system also faces deployment-related challenges. For example, airport aprons are subject to variable lighting, wet or dirty surfaces, GNSS multipath, electromagnetic interference, and moving equipment and personnel. Scaling the system to multiple robots will require the development of coordination strategies to prevent the underestimation of inter-agent interactions. Integration into airport operational systems will also require a reliable communication channel, cybersecurity, certification, and updates to ground handling regulations.
The next phase of research will concentrate on dealing with the limitations described above by applying the proposed model in real-life conditions. Laboratory experiments will be conducted to assess the interference effects on real-world sensors. Expanding the Bayesian network to account for dynamic barriers, such as personnel movement, will be a critical step. The proposed model will also be integrated into a smart apron system for data exchange between robots and dispatchers.

5. Conclusions

This study developed a probabilistic risk assessment model for the safe navigation of UGVs and UAVs on airport aprons. The results demonstrate how the proposed approach can detect increased risk because of uncertainty in trajectory and deterioration in contextual reliability. These are primarily caused by wind gusts that trigger a sequence of actions until a selected risk threshold is exceeded. The modeling results also lay the foundation for further development of autonomous robotic aircraft inspection systems in airport environments. However, this study is not a field test. Practical implementation requires real equipment, sensor calibration using real data, and controlled testing near an aircraft.
Future work will focus on three main areas. First, real-world hardware experiments will be conducted to validate the implementation of the real-time risk assessment module. Second, the dataset will be expanded with real-world lidar, GNSS, and odometry data acquired under degraded image quality conditions to calibrate the EKF and CPT interference and noise parameters. Third, the model will be intended to incorporate the movement of personnel, vehicles, multi-robot coordination, and integration into apron systems.

Author Contributions

Conceptualization, K.K. and D.M.; methodology, D.M.; software, Y.K.; validation, D.M., Y.K. and A.K.; formal analysis, D.M.; investigation, D.M.; resources, Y.K.; data curation, Y.K.; writing—original draft preparation, D.M.; writing—review and editing, K.K.; visualization, A.K.; supervision, K.K.; project administration, A.K.; funding acquisition, A.K. All authors have read and agreed to the published version of the manuscript.

Funding

This research was funded by Science Committee of the Ministry of Science and Higher Education of the Republic of Kazakhstan under Grant BR28713125 “Development and implementation of unmanned technologies and intelligent robotic pre-flight control systems to improve safety in air transport”.

Data Availability Statement

The raw data supporting the conclusions of this article will be made available by the authors on request.

Acknowledgments

During the preparation of this manuscript, the authors used [ChatGPT, version 5.2] for the purposes of language text translation and proofreading. The authors have reviewed and edited the output and take full responsibility for the content of this publication.

Conflicts of Interest

The authors declare no conflicts of interest.

Abbreviations

The following abbreviations are used in this manuscript:
EKFExtended Kalman filter
UGVUnmanned ground vehicle
UAVUnmanned aerial vehicle
GPUGraphic processing unit
GNSSGlobal navigation satellite system
MROMaintenance and reliability organization
VOEVisual odometry error
DODDynamic obstacle density
CPTConditional probability table

References

  1. Chanpariyavatevong, K.; Wipulanusat, W.; Champahom, T.; Jomnonkwao, S.; Chonsalasin, D.; Ratanavaraha, V. Predicting airline customer loyalty by integrating structural equation modeling and Bayesian networks. Sustainability 2021, 13, 7046. [Google Scholar] [CrossRef]
  2. Fu, X.; Lei, Z.; Wang, K.; Yan, J. Low-cost carrier competition and route entry in an emerging but regulated aviation market—The case of China. Transp. Res. Part A Policy Pract. 2015, 79, 3–16. [Google Scholar]
  3. Chen, X.; Yu, H.; Cao, K.; Zhou, J.; Wei, T.; Hu, S. Uncertainty-aware flight scheduling for airport throughput and flight delay optimization. IEEE Trans. Aerosp. Electron. Syst. 2020, 56, 853–862. [Google Scholar] [CrossRef]
  4. Laudante, E.; Greco, A.; Caterino, M.; Fera, M. Human–robot interaction for improving fuselage assembly tasks: A case study. Appl. Sci. 2020, 10, 5757. [Google Scholar] [CrossRef]
  5. Klikushin, Y.; Koshekov, K.; Kobenko, V.; Trunin, E. An algorithm for evaluating the state of a generating unit based on the identification measurements of vibrosignals. Russ. J. Nondestruct. Test. 2014, 50, 413–418. [Google Scholar] [CrossRef]
  6. Koshekov, K.; Ospanov, Y.; Muratkhan, B.; Levchenko, N.; Koshekov, A.; Togambayev, R. Probabilistic multiplicative stochastic modeling of aviation safety risks using the Swiss cheese model: A Monte Carlo simulation approach. IEEE Access 2025, 13, 185233–185244. [Google Scholar] [CrossRef]
  7. Kovacs, B.; Voros, F.; Vas, T.; Karoly, K.; Gajdos, M.; Varga, Z. Safety and security-specific application of multiple drone sensors at movement areas of an aerodrome. Drones 2024, 8, 231. [Google Scholar] [CrossRef]
  8. Wijayathunga, L.; Rassau, A.; Chai, D. Challenges and solutions for autonomous ground robot scene understanding and navigation in unstructured outdoor environments: A review. Appl. Sci. 2023, 13, 9877. [Google Scholar] [CrossRef]
  9. Pinello, L.; Hassan, O.; Giglio, M.; Sbarufatti, C. Preliminary nose landing gear digital twin for damage detection. Aerospace 2024, 11, 222. [Google Scholar] [CrossRef]
  10. Zhang, C.; Pan, W.; Zhu, Y.; Jiang, Y.; Wang, X. Theoretical assessment of runway capacity for training and transport airport considering wake vortex encounter safety: A case study of Luoyang Beijiao Airport. Appl. Sci. 2025, 15, 11273. [Google Scholar] [CrossRef]
  11. Qin, G.; Jin, Y.; Qiao, L.; Wu, Z. Advances, Challenges, and Recommendations for Non-Destructive Testing Technologies for Wind Turbine Blade Damage: A Review of the Literature from the Past Decade. Sensors 2026, 26, 1773. [Google Scholar] [CrossRef]
  12. Rodríguez, D.A.; Tafur, C.L.; Melo Daza, P.F.; Villabla Vidales, J.A.; Daza Rincón, J.C. Inspection of aircrafts and airports using UAS: A review. Results Eng. 2024, 22, 102330. [Google Scholar] [CrossRef]
  13. Piao, M.; Wang, X.; Wang, W.; Xie, Y.; Lu, B. A Review of Robotic Aircraft Skin Inspection: From Data Acquisition to Defect Analysis. Mathematics 2025, 13, 3161. [Google Scholar] [CrossRef]
  14. Malathi, V.; Sreedharan, P.; P R, R.; Anil Kumar, V.; Sadasivan, A.L.; Udupa, G.; Pastorelli, L.; Troppina, A. Decision-Making for Path Planning of Mobile Robots Under Uncertainty: A Review of Belief-Space Planning Simplifications. Robotics 2025, 14, 127. [Google Scholar]
  15. Doumbia, M.; Cheng, X. State Estimation and Localization Based on Sensor Fusion for Autonomous Robots in Indoor Environment. Computers 2020, 9, 84. [Google Scholar] [CrossRef]
  16. Tarcsay, B.L.; Bárkányi, Á.; Németh, S.; Chován, T.; Lovas, L.; Egedy, A. Risk-Based Fault Detection Using Bayesian Networks Based on Failure Mode and Effect Analysis. Sensors 2024, 24, 3511. [Google Scholar] [CrossRef]
  17. Çelik, C.; Li, H.; Liu, J.; Bashir, M.; Zou, L.; Yang, Z. Integrating geometric and causation probability approaches into Dynamic Bayesian Networks for real-time collision risk prediction. Transp. Res. Part E Logist. Transp. Rev. 2026, 205, 104520. [Google Scholar] [CrossRef]
  18. Jiang, C.; Zhou, X.; Chen, H.; Liu, T. UAV Positioning Using GNSS: A Review of the Current Status. Drones 2026, 10, 91. [Google Scholar] [CrossRef]
  19. Wei, Z.; Wang, S.; Chen, K.; Wang, F. ROS-based navigation and obstacle avoidance: A study of architectures, methods, and trends. Sensors 2025, 25, 4306. [Google Scholar] [CrossRef]
  20. Koshekov, K.; Klikushin, Y.; Kashevkin, A.; Latypov, S.; Sof’ina, N.; Savostina, G.; Koshekov, A. An Intelligent System for Vibrodiagnostics of Oil and Gas Equipment. Russ. J. Nondestruct. Test. 2018, 54, 249–259. [Google Scholar] [CrossRef]
  21. Yang, Z.; Wang, X.; Wang, L. Controllability of networked sampled-data systems. IEEE Trans. Autom. Control 2024, 69, 5081–5093. [Google Scholar] [CrossRef]
  22. Andrade, P.; Silva, C.; Ribeiro, B.; Santos, B.F. Aircraft maintenance check scheduling using reinforcement learning. Aerospace 2021, 8, 113. [Google Scholar] [CrossRef]
  23. Semenyuk, V.; Kurmashev, I.; Lupidi, A.; Cantelli-Forti, A. Developing the GoogleNet neural network for the detection and recognition of unmanned aerial vehicles in the data fusion system. East.-Eur. J. Enterp. Technol. 2023, 2, 16–25. [Google Scholar] [CrossRef]
  24. Chen, Y.; Kisselyova, O.; Abzhaparova, A.; Aliakbarkyzy, D.; Karsybayev, Y. Comparing intermodal and synchromodal transport systems to enhance efficiency and sustainability at the Port of Aktau, Kazakhstan. Int. J. Transp. Dev. Integr. 2025, 9, 217–225. [Google Scholar] [CrossRef]
  25. Solovei, O.; Honcharenko, T. A Bayesian-driven feedforward neural network model for Kafka cluster latency forecasting. Radioelectron. Comput. Syst. 2025, 2025, 68–87. [Google Scholar] [CrossRef]
  26. Kabashkin, I.; Perekrestov, V. Ecosystem of aviation maintenance: Transition from aircraft health monitoring to health management based on IoT and AI synergy. Appl. Sci. 2024, 14, 4394. [Google Scholar] [CrossRef]
  27. Yildirim, S.; Rana, Z.A. Enhancing aircraft safety through advanced engine health monitoring with long short-term memory. Sensors 2024, 24, 518. [Google Scholar] [CrossRef]
  28. Ding, L.; Wen, C. High-order extended Kalman filter for state estimation of nonlinear systems. Symmetry 2024, 16, 617. [Google Scholar] [CrossRef]
  29. Munguia, R.; Trujillo, J.-C.; Grau, A. UAV Navigation Using EKF-MonoSLAM Aided by Range-to-Base Measurements. Drones 2025, 9, 570. [Google Scholar] [CrossRef]
  30. Yuan, D.; Zhong, Y.; Zhu, X.; Chen, Y.; Jin, Y.; Du, X.; Tang, K.; Huang, T. Trajectory Planning for Unmanned Vehicles on Airport Apron Under Aircraft–Vehicle–Airfield Collaboration. Sensors 2025, 25, 71. [Google Scholar] [CrossRef]
  31. Lai, X.; Zhu, G.; Chambers, J. A fuzzy adaptive extended Kalman filter exploiting the student’s t distribution for mobile robot tracking. Meas. Sci. Technol. 2021, 32, 105017. [Google Scholar] [CrossRef]
  32. Tian, W.; Zhou, X.; Yin, J.; Li, Y.; Zhang, Y. Identification of key risk hotspots in mega-airport surface based on Monte Carlo simulation. Aerospace 2024, 11, 254. [Google Scholar] [CrossRef]
  33. Ahern, Z.; Corry, P.; Rabbani, W.; Paz, A. Extensive hypothesis testing for estimation of crash frequency models. Heliyon 2024, 10, e26634. [Google Scholar] [CrossRef]
  34. Niu, G.; Wu, L.; Gao, Y.; Pun, M.-O. Unmanned aerial vehicle (UAV)-assisted path planning for unmanned ground vehicles (UGVs) via disciplined convex–concave programming. IEEE Trans. Veh. Technol. 2022, 71, 6996–7007. [Google Scholar]
  35. Wang, Q.-A.; Lu, A.-W.; Ni, Y.-Q.; Wang, J.-F.; Ma, Z.-G. Bayesian Network in Structural Health Monitoring: Theoretical Background and Applications Review. Sensors 2025, 25, 3577. [Google Scholar] [CrossRef]
  36. Strielkina, A.; Tetskyi, A.; Krasilshchykova, V. Risk and uncertainty assessment in software project management: Integrating decision trees and Monte Carlo modeling. Radioelectron. Comput. Syst. 2023, 217–225. [Google Scholar] [CrossRef]
  37. Koshekov, K.; Tompiyev, N.; Yemutbayev, F.; Levchenko, N.; Koshekov, A.; Togambayev, R. Assessing the Probability of Extreme Event Risks During Aircraft Operation in the Context of Urban Air Mobility Development. Aerospace 2026, 13, 206. [Google Scholar] [CrossRef]
  38. Savas, T. A risk-based analysis of lightweight drones: Evaluating the harmless threshold through human-centered safety criteria. Drones 2025, 9, 517. [Google Scholar]
  39. Bayirhan, I. An approach to calculating the minimum safety distance against the potential risks of shipwrecks. Sustainability 2025, 17, 10450. [Google Scholar] [CrossRef]
Figure 1. UGV trajectory estimation near the aircraft zone. The dashed black curve denotes the reference trajectory, the red dotted curve denotes odometry estimation, and the solid blue curve denotes EKF-based estimation. The ellipse represents the positional covariance projected to the horizontal plane.
Eng 07 00284 g001
Figure 2. EKF estimation error of the UGV trajectory along the X and Y axes. Shaded regions indicate the ± 3 σ confidence envelope derived from the EKF covariance matrix.
Eng 07 00284 g002
Figure 3. Monte Carlo trajectory prediction for a UGV approaching an aircraft fuselage. Safe predicted and collision trajectories are shown separately to visualize uncertainty propagation and risk events.
Eng 07 00284 g003
Figure 4. Heat map of the estimated movement-related risks around the aircraft. Higher values indicate regions where predicted trajectory dispersion, proximity to the aircraft, and UGV velocity jointly increase collision probability.
Eng 07 00284 g004
Figure 5. Time analysis of the system response to a wind gust. The risk threshold R t h r = 0.05 is shown to indicate the moment when the protective retreat protocol is triggered.
Eng 07 00284 g005
Table 1. Environmental disturbances and their representation in the proposed model.
DisturbancePhysical EffectModel RepresentationAffected Component
GNSS multipathBiased localization near metallic structuresTime-corrected position bias
R k
EKF
LiDAR reflection distortionRange outlines from aircraft surfaceOutlier probability
range variance
EKF/Bayesian network
Wheel slipOdometry drift Q k EKF/Monte Carlo
Surface contaminationReduced tractionLongitudinal velocity perturbationThe UGV motion model
Wind gustsUAV drift and instabilityWind node in the BN. State perturbationBayesian network/Monte Carlo
Dynamic trafficMoving ground vehiclesDynamic obstacle trajectoriesMonte Carlo
Personnel movementHuman obstacles near the aircraftDOD node and MODBayesian network/Monte Carlo
Illumination degradationDegradation of visual odometryVOE nodeBayesian network
Table 2. Bayesian network structure and definitions.
NodeTypeStatesDescription
Wind speedRootLow/Medium/HighExternal aerodynamic disturbances affecting the stability of UAV/UGV
GNSS qualityRootGood/Degraded/LostReliability of metric localization
Illumination levelRootNormal/Low/ExcessiveVisual perception quality and visual odometry
Visual odometry error (VOE)IntermediateLow/Medium/HighDepends mainly on the illumination and surface reflectivity
Position-holding stabilityIntermediateStable/Marginal/UnstableDepends on wind speed, GNSS quality, and odometry error
Dynamic obstacle density (DOD)UGV-specific rootLow/Medium/HighPersonnel density and ground-support equipment
Inspection zone coverageUGV-specific intermediateComplete/Partial/LostThe robot’s ability to maintain the required inspection path
Probability of system failureOutputNormal/Warning/CriticalProbability of losing safe navigation or leaving the inspection corridor
Table 3. The CPT elicitation protocol.
StepProcedureOutput
Expert selectionGround handling, inspection, robotics, and aviation safetyExpert panel
Probability elicitationIndependent scoring of the CPT entries Individual CPTs
Consistency checkMonotonicity and logical constraintsCorrected CPTs
WeightingExperience- and consistency-based weightingExpert weights
AggregationWeighted linear poolingFinal CPT
Uncertainty propagation ± 10 % and ± 20 % CPT perturbationRobustness envelope
Update mechanismFuture sensor/apron dataPosterior CPT refinement
Table 4. Reaction matrix.
Risk Level (R)System Action
Low (<10−4)Normal operation at maximum speed
Medium (10−4–10−2)Reducing the speed by half and increasing the scanning frequency
High (> 10 2 )Emergency stop with a request sent to the operator
Table 5. Repeated-run statistics for the comparative simulation.
MetricDeterministic Safety ZoneProposed Method95% CI
Number of Runs5050-
Successful missions0/5049/5089.4–99.9%
Mission success rate (%)0%98%89.4–99.9%
False positives50/503/501.3–16.5%
False positive rate100%6%1.3–16.5%
Physical collisions0/500/50-
Minimum distance achieved2.0 m0.48 mScenario-dependent
Table 6. Comparative analysis of navigation performance.
Navigation MethodStop CriteriaAverage Minimum Distance ReachedMission Success, %False Positives, %
Static zonesd ≤ 2.0 m20100
Proposed method P t > 0.050.48986
Table 7. The computational characterization of the proposed framework.
ComponentMain OperationScalabilityNotes
EKFPrediction and correction O ( d 3 ) for covariance updateLow computational load
Monte CarloTrajectory propagation and collision checking O N s N h N a Dominant cost
Bayesian networkReliability inferenceDepends on the number of nodes/statesLow for the current topology
Risk fusion P c o l l , P f a i l , severity integration O ( 1 ) per agentNegligible
MemoryStorage of the trajectory samples O N s N h d Increases with agents/horizons
Table 8. Qualitative comparison with related navigation approaches.
MethodMain PrincipleStrengthLimitation Near AircraftDifference in Proposed Framework
Static safety zonesFixed distance thresholdSimple and conservativePrevents close-range inspectionAllows for a dynamic risk-based approach
Risk-aware MPCOptimizes control under the risk costDirect control optimizationComputationally demanding near-complex geometryActs as a supervisory safety layer
Chance-constrained planningThe probability of constraint violation is maintained below the thresholdFormal probabilistic safetyOften depends on assumptions of analytical uncertaintyMonte Carlo trajectory sampling
Probabilistic motion planningSample feasible trajectoriesFlexible path generationFocuses mainly on planning rather than reliabilityCombines trajectory and system failure risks
Learning-based navigationLearns the navigation policy from the dataAdaptive in complex environmentsRequires large validated datasets and explainabilityMaintains interpretable PRL
Perception-based avoidanceLocal sensing is used for obstacle avoidanceEffective for immediate obstaclesSystem reliability or task constraints may not be includedContextual reliability and aircraft zone risk
Table 9. Conceptual positioning of navigation and risk-assessment approaches for the simulated landing-gear inspection scenario.
MethodMission SuccessFalse PositiveMinimum DistanceCollision-Risk HandlingComputational Cost
Static safety zone0%100%2.0 mFixed thresholdVery low
EKFMediumLowScenario-dependentNo future collision predictionLow
Monte CarloHigh under nominal conditionsMedium<1 m possibleGeometric riskHigh
Bayesian reliabilityMediumMediumScenario-dependentContextual riskLow
Proposed model98%6%0.48 mGeometric + contextualMedium-high
Disclaimer/Publisher’s Note: The statements, opinions and data contained in all publications are solely those of the individual author(s) and contributor(s) and not of MDPI and/or the editor(s). MDPI and/or the editor(s) disclaim responsibility for any injury to people or property resulting from any ideas, methods, instructions or products referred to in the content.