1. Introduction
Occupational Health and Safety (OHS) has evolved into a critical component of industrial process reliability and operational performance, particularly in sectors characterized by complex technologies and hazardous substances [
1,
2]. In modern manufacturing environments, safety management extends beyond regulatory compliance and increasingly focuses on proactive identification and control of process deviations before they escalate into accidents or operational failures [
3]. From an engineering perspective, safety incidents are often the result of process deviations and system failures, rather than isolated events. If not identified and controlled at early stages, such deviations may propagate across production systems, leading to operational disruptions or major accidents [
4]. Consequently, organizations are shifting from reactive post-incident analysis toward proactive, engineering-based methodologies aimed at early hazard identification, failure prevention, and process optimization [
5]. These approaches emphasize the analysis of near-misses, minor incidents, and low-impact nonconformities as valuable indicators of underlying system weaknesses [
6]. Despite the widespread use of causal analysis tools in safety management, there remains a lack of integrated methodologies that systematically link root-cause identification with detection efficiency within engineering processes. Several methodologies are currently used for occupational risk assessment and causal analysis, including Failure Mode and Effects Analysis (FMEA), Hazard and Operability Study (HAZOP), System-Theoretic Process Analysis (STPA), Bow-Tie analysis, and the 5M model (Environment—M1, Man—M2, Method—M3, Material—M4, Machine—M5) [
7]. Models such as the 5M framework provide a structured basis for analyzing contributing factors; however, they are typically applied in isolation, without capturing how and where deviations are identified within the operational flow [
8]. This limitation reduces the ability to detect systemic deficiencies and to implement targeted engineering control measures in a timely manner.
The increasing complexity of modern manufacturing systems requires integrated approaches capable of simultaneously addressing process reliability, operational safety, quality control, and real-time detection of process deviations [
9]. In manufacturing engineering, nonconformities are no longer viewed exclusively as isolated occupational safety events, but as indicators of instability within interconnected production systems [
10]. Consequently, there is growing interest in methodologies that combine root-cause analysis, process monitoring, and detection efficiency in order to support predictive and data-driven manufacturing environments aligned with Industry 4.0 objectives [
11,
12,
13,
14]. In this context, proactive identification of deviations close to their source contributes not only to occupational safety improvement but also to manufacturing reliability, process stability, reduced downtime, and sustainable operational performance [
15]. The present study addresses this gap by proposing and validating a novel integrated 5M–Source–Detection framework specifically designed for proactive OHS nonconformity management.
In this context, particular attention must be given to industries characterized by high-risk processes and hazardous substances [
16]. The cosmetics and fragrance industry involves the use of volatile, flammable, and potentially irritating substances, creating significant occupational risks such as exposure to toxic vapors, fire, and explosions [
17]. Processes like solvent extraction and distillation require strict control measures, proper ventilation, and adherence to safety procedures [
18]. Although this study focuses on the cosmetics and fragrance industry, the proposed approach is not limited to this sector [
19]. The integrated 5M–Source–Detection framework is applicable to any industry involving high-risk processes and complex operational systems, where multiple causal factors may interact and lead to adverse events.
Integrated systems for quality, OHS, and environmental management aim to stabilize and standardize processes, stimulate the identification, reporting, and correction of nonconformities, and improve overall organizational performance [
20,
21].
OHS management systems are increasingly recognized as tools for performance improvement [
22], supporting process monitoring, early identification of nonconformities, and corrective actions implemented close to their source, while enhancing employee awareness regarding OHS standards [
23,
24,
25].
The regulatory framework governing OHS includes standards such as ISO 45001:2018 [
24], Directive 89/391/EEC [
26] and national occupational safety and health legislation [
27,
28].
According to Heinrich’s Safety Pyramid, reducing minor incidents and unsafe situations contributes to a proportional decrease in severe and fatal accidents [
29,
30,
31]. This paradigm supports the shift toward proactive safety management by emphasizing early detection and intervention.
Despite the extensive literature on OHS risk assessment and accident prevention, several challenges remain. Some studies emphasize the predominance of human factors in accident causation, while others highlight technical failures or organizational deficiencies as primary contributors [
32]. This divergence indicates the need for integrated approaches capable of capturing the multi-causal nature of incidents. Furthermore, while root-cause analysis methods such as the 5M model are widely used, their integration with operational control tools remains limited in practice [
33,
34].
To address these gaps, this study proposes an integrated framework combining the 5M model with the Source–Detection Matrix. This approach enables both causal analysis and process-oriented mapping of nonconformities, facilitating the identification of systemic weaknesses and improving control efficiency [
35]. In this context, the implementation of the Source–Detection Matrix within OHS systems serves multiple strategic objectives. It enables continuous monitoring and visualization of product and service quality, as well as their evolution over time. Furthermore, it supports the development of stable and safe processes, reducing the likelihood of occupational accidents and work-related illnesses. An essential contribution of this approach is the increased accountability of personnel in identifying, reporting, and maintaining high standards of occupational health and safety [
36]. By actively involving employees in the detection and correction of nonconformities, organizations foster a culture of responsibility and continuous improvement [
37]. This integrated system ensures a consistently high level of quality for products and services while simultaneously protecting employee health and safety, thus aligning operational performance with sustainable organizational development [
38,
39].
The main objective of this study is to develop and validate a structured methodology for the identification, classification, and prevention of OHS nonconformities, focusing on shifting detection as close as possible to the source of occurrence. The main scientific contribution is the development of an integrated 5M–Source–Detection framework that combines the classic 5M root-cause model with a Source–Detection Matrix. The framework simultaneously addresses the “why” and the “where” of nonconformities, enabling systematic reduction in detection delay and risk propagation. This approach fills a gap in current OHS methodologies, which rarely link causal analysis with detection efficiency in operational processes.
2. Methods
2.1. Source–Detection Matrix for OSH Process Deviations
The analysis of high-potential incidents (near misses), minor incidents, and hazardous situations with limited or no consequences represents a more effective strategy for improving management systems than learning solely from severe or fatal accidents. In this context, the Source–Detection Matrix serves as an analytical tool for correlating organizational entities (e.g., departments, processes, or operational stages) in order to identify both the origin of a nonconformity and the point at which it is detected. This approach enables the evaluation of responsibilities and the effectiveness of quality control mechanisms.
The matrix is constructed based on the following principles:
- -
Rows indicate the source of the problem (i.e., the point at which it is generated);
- -
Columns indicate the point of detection of the problem;
- -
Cells reflect the relationship between source and detection and are populated with indicators such as the number of cases and risk scores, represented through visual coding (e.g., a color matrix).
The main diagonal represents self-detection situations, in which the responsible entity identifies its own nonconformities (the ideal case).
For the construction of the matrix, a predefined set of entities relevant to the analyzed system is first defined (e.g., suppliers, procurement, receiving, raw material storage, production, quality control, finished goods storage, logistics, customers), each being appropriately coded. This structure ensures a standardized baseline representation of the system, aligned with established process modelling approaches in the literature. At the same time, the framework allows for contextual adaptation, enabling the inclusion of additional entities depending on the specific complexity, organizational structure, and operational scope of the analyzed system. System entities may include departments, processes, operational stages, systems, or roles, as illustrated in
Table 1.
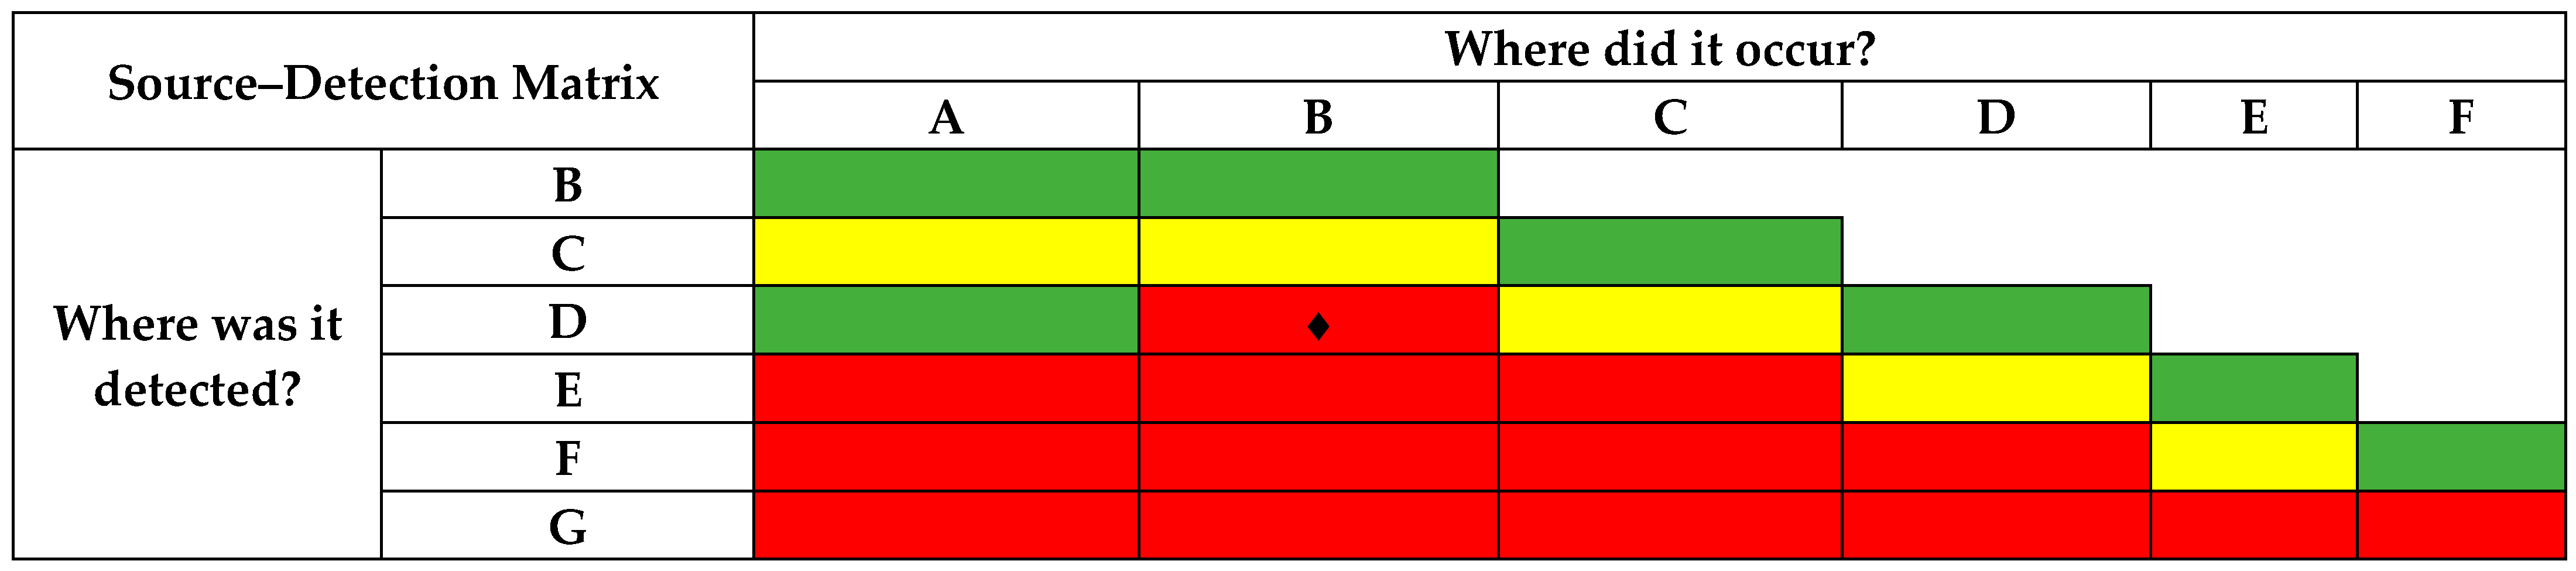
Subsequently, the same entities are positioned on both the horizontal and vertical axes, and the relationships between them are identified and quantified based on the available data (e.g., number of cases), using a color-coded matrix (
Figure 1).
The analysis of the matrix (development and interpretation) is performed periodically (usually on a monthly basis) and involves evaluating the relationships between the source of problems and the points of detection, providing an overall picture of the effectiveness of the control system.
The interpretation of the results can be performed using a visual coding scheme:
- -
Green zone—optimal situation, in which the nonconformity is identified at the level of the entity that generated it or, in the case of external suppliers, upon receipt during procurement;
- -
Yellow zone—detection occurs at the immediately subsequent stage in the operational flow;
- -
Red zone—the nonconformity propagates through multiple stages before being identified.
The analysis is carried out along two main directions:
Row-based analysis—highlights the entities that detect a high number of nonconformities, which may indicate either a high level of control or deficiencies in preceding stages. This may suggest strict control at that point.
Column-based analysis—highlights the entities that frequently generate nonconformities, indicating a loss of control at these points. These areas become priorities for intervention and improvement, as they represent major sources of errors.
A critical aspect is represented by issues detected at the customer level, which indicate weak internal control. Ideally, nonconformities should be identified and corrected before reaching the customer or the next entity in the flow/matrix.
By using the Source–Detection Matrix, the organization can identify vulnerable process points, assess the effectiveness of existing controls, and implement measures to prevent the propagation of nonconformities. Thus, the tool contributes to strengthening a proactive quality and safety management system.
Beyond its basic analytical function, the Source–Detection Matrix can be transformed into a powerful risk assessment and management tool within industrial environments. When systematically applied, the matrix evolves from a simple visualization instrument into a strategic indicator widely used in industry for monitoring process performance and risk propagation.
In this context, the matrix can be interpreted as a multidimensional analytical map. First, it acts as a defect propagation map, highlighting where nonconformities originate, where they escape internal controls, and where they are ultimately detected, including at the customer level. This perspective allows organizations to understand the dynamic flow of errors across operational stages.
Second, the matrix functions as a process responsibility map, providing clear insights into unstable processes and areas where control mechanisms are insufficient or absent. This enables management to identify accountability gaps and reinforce ownership at each stage of the workflow.
Third, the matrix becomes a systemic risk map, identifying critical processes that have a significant impact on overall organizational performance. These processes represent priority areas for intervention, as failures within them may propagate rapidly and generate major operational or safety risks.
The Source–Detection Matrix can also be interpreted as a process-monitoring and operational-control tool for manufacturing systems. By tracking the propagation and detection location of nonconformities, the framework supports process supervision, identification of unstable operational stages, and data-driven improvement of manufacturing reliability and quality performance. This functionality aligns with Industry 4.0 principles [
40] emphasizing traceability and proactive process control.
2.2. Classification of OSH Nonconformities Using the 5M Model
The process of classification, categorization, and coding of nonconformities identified within the occupational safety and health (OSH) flow uses the 5M (cause–effect) model in order to systematically identify determining factors and support preventive measures and continuous improvement. M1—Environment (Work Environment) represents the totality of environmental conditions in which work activities are carried out, namely the factors surrounding the worker that may influence their safety and health.
In order to identify and assess occupational risks, nonconformities associated with the work environment are classified according to their root causes and potential effects on workers, as presented in
Table 2.
M2—Man (Personnel) represents the human factor involved in the execution of activities, namely the behavior, level of competence, as well as the physical and psychological condition of workers, which may influence occupational safety and health.
Nonconformities associated with the human factor are primarily caused by behavioral errors, lack of training, or the inadequate condition of workers, generating significant risks of occupational accidents. These are presented in
Table 3, together with typical causes and possible effects.
M3—Method (Procedures and Work Methods) represents the way in which activities are organized and carried out, namely the set of procedures, work instructions, and OSH rules that define the correct and safe execution of operations.
Nonconformities related to work methods (
Table 4) occur as a result of the absence, inadequacy, or incorrect application of procedures and work instructions, leading to operational disruptions and an increased risk of occupational accidents.
M4—Protective equipment and substances (PPE and Substances) represent the totality of personal and collective protective equipment and measures used to prevent or reduce workers’ exposure to occupational hazards.
Nonconformities related to protective means (
Table 5) arise as a result of the absence, improper use, or nonconformity of protective equipment, as well as exposure to hazardous substances, leading to an increased risk of occupational injury or illness.
M5—Machine (Equipment, Machinery and Installations) represents the totality of equipment, machinery, installations, and transport equipment used in the work process, which may generate risks in the event of improper operation or incorrect use.
Nonconformities related to equipment and installations (
Table 6) arise as a result of technical defects, lack of maintenance, or improper use, leading to severe occupational accidents and equipment damage.
In practice, each identified nonconformity is analyzed through the 5M model in order to determine its root cause. Once identified, the nonconformity can be positioned within the Source–Detection Matrix, according to the entity that generated it and the point at which it was detected, thus enabling a clear understanding of the propagation flow.
Based on the results of the analysis, corrective actions are established with the aim of shifting nonconformities toward the green zone of the matrix, namely toward situations in which they are identified and managed as close as possible to their point of origin.
The implemented measures must simultaneously satisfy two essential conditions:
- -
They must be efficient, meaning that they are applied rapidly and as close as possible to the source of the nonconformity, according to the principle “self-correction at source”;
- -
They must be effective, meaning that they directly address the root cause identified through the 5M analysis.
Within the causal analysis, among the factors identified for each category of the 5M model, priority interventions are selected, typically the top three causes with the highest impact on the occurrence of the nonconformity.
Subsequently, an appropriate monitoring system is established, which must be both efficient and effective, based on relevant indicators and periodic control mechanisms. This system should enable continuous evaluation of the results of implemented measures and lead to:
- -
Improvement of process performance through the reduction in the frequency and severity of nonconformities;
- -
Prevention of recurrence through the elimination of root causes;
- -
Strengthening of operational control through early detection of deviations.
Thus, the integration of the 5M analysis with the Source–Detection Matrix contributes to the development of a proactive management system oriented toward prevention and continuous improvement.
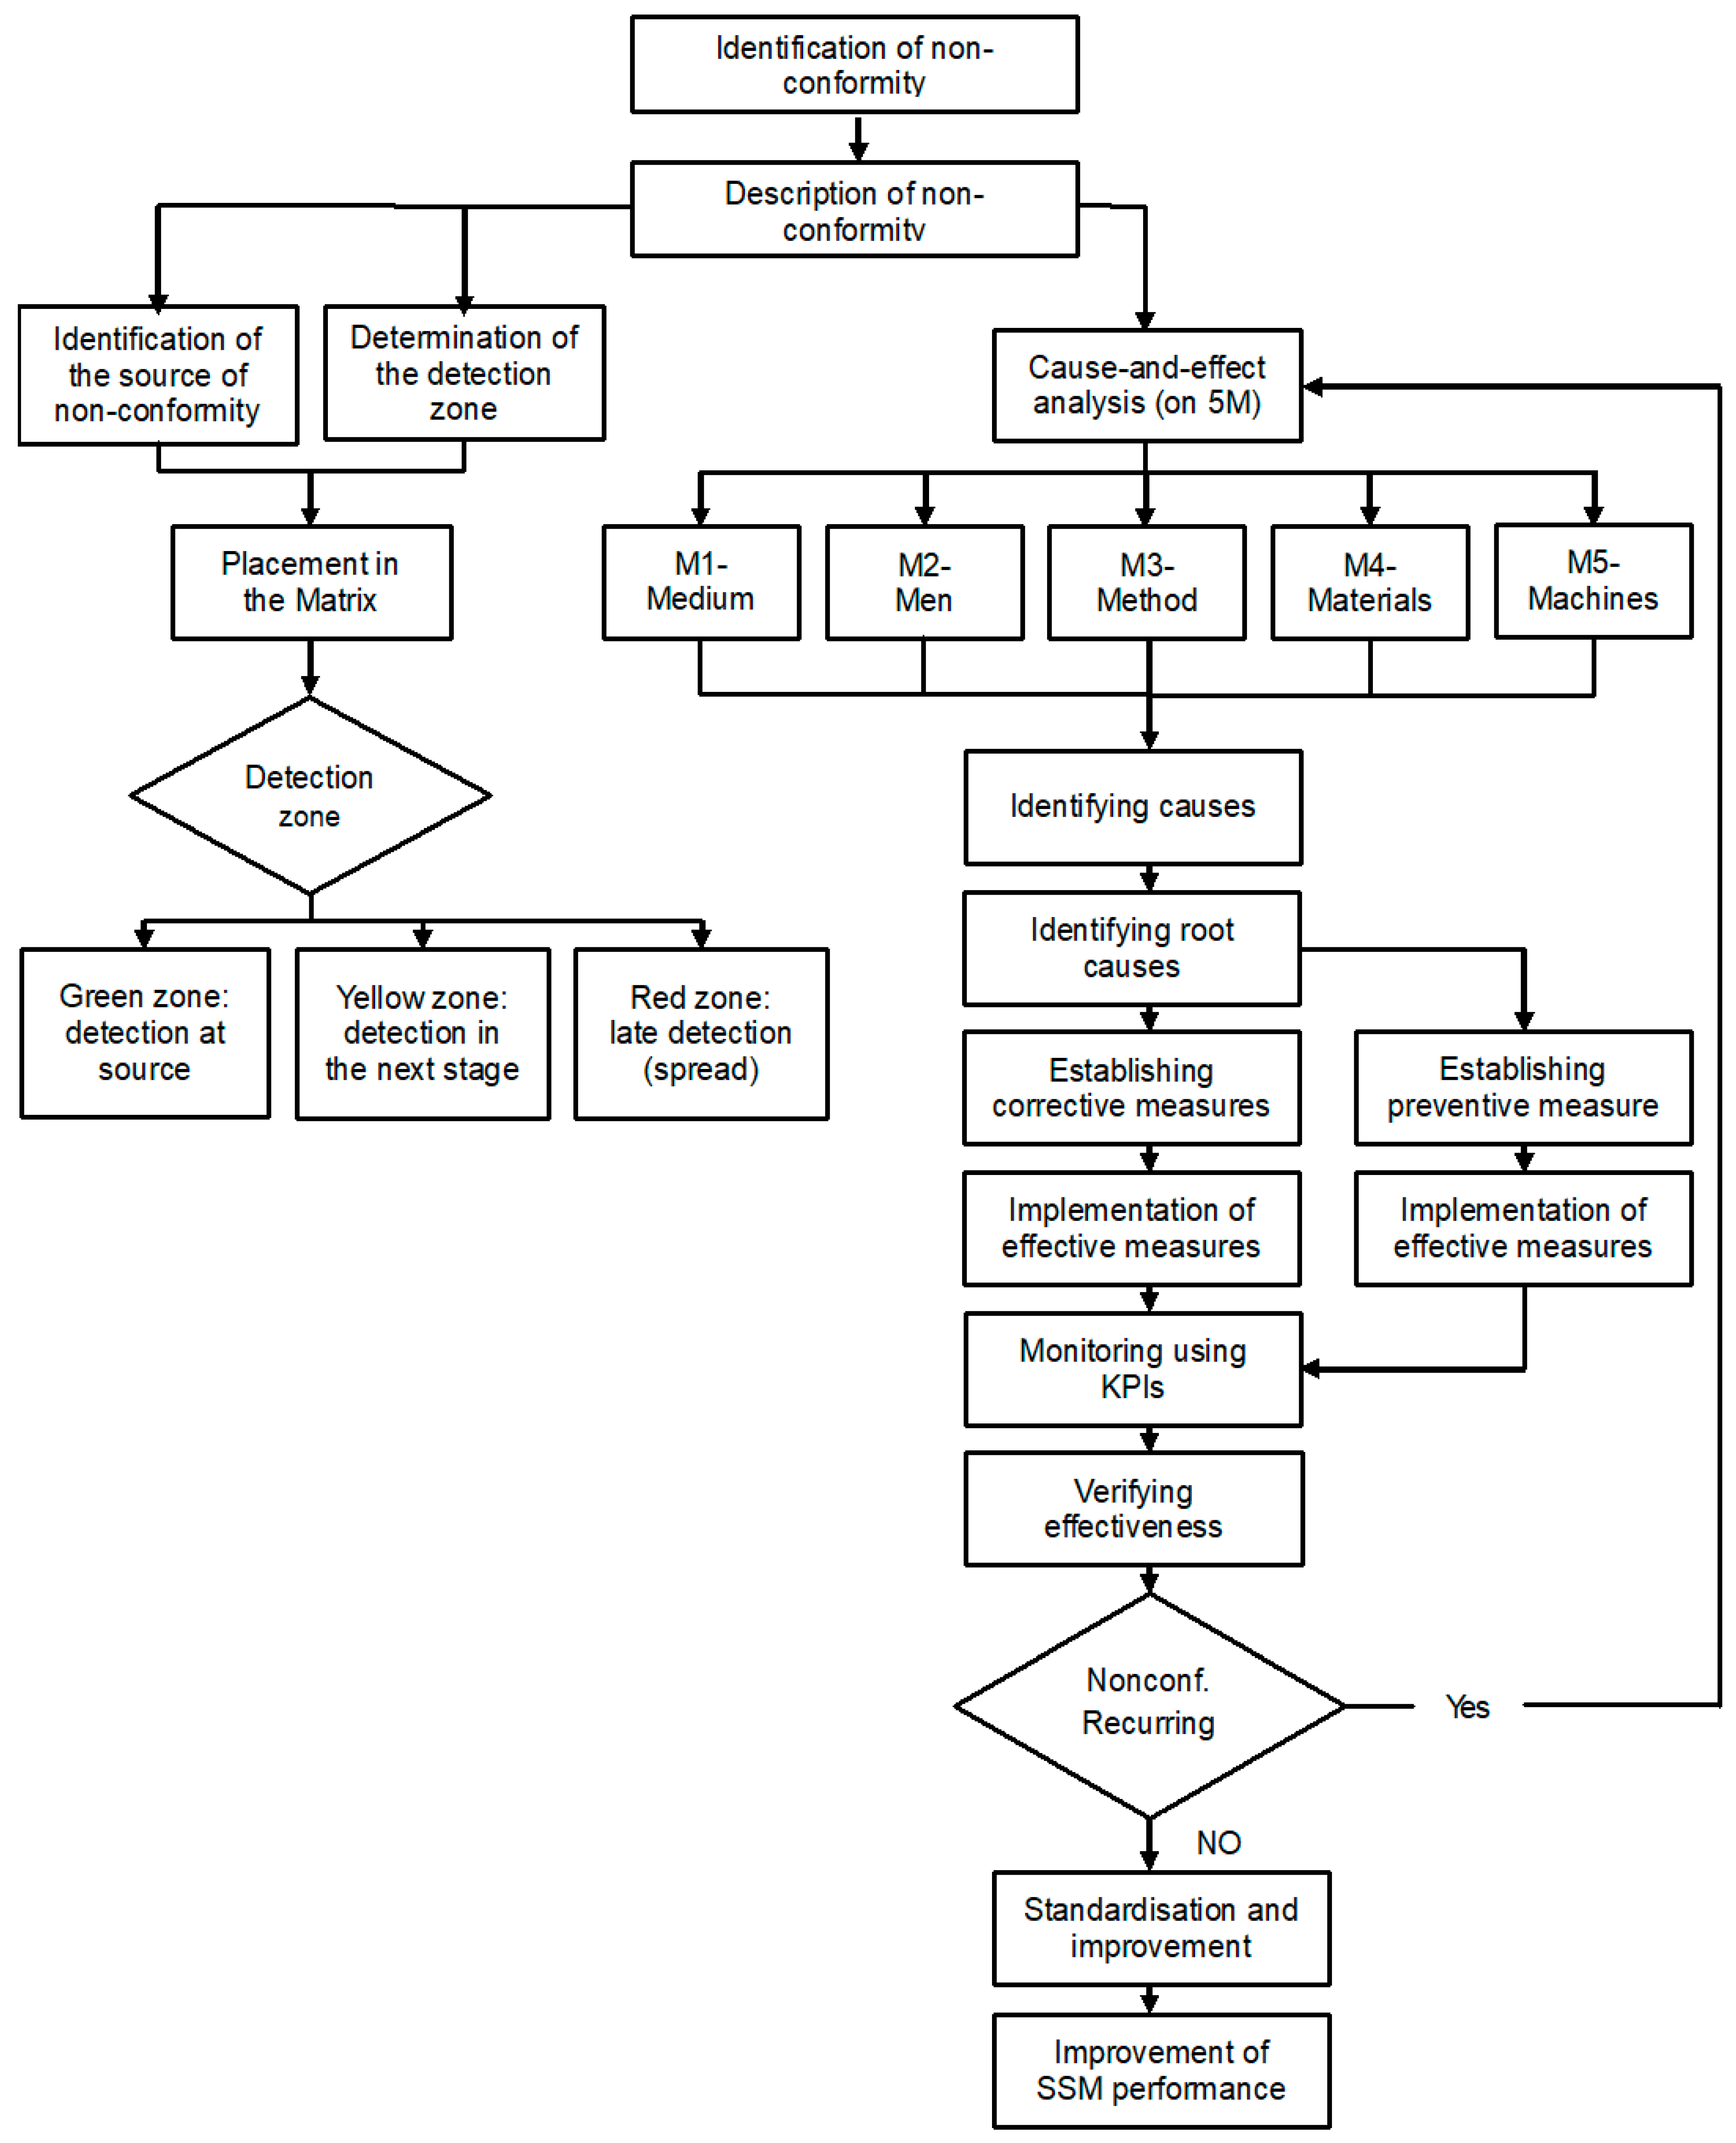
Figure 2 illustrates the integration between the 5M root-cause analysis method and the Source–Detection Matrix within the proposed framework.
This integrated workflow allows a systematic transition from cause identification (5M analysis) to process mapping (Source–Detection Matrix), supporting a more comprehensive evaluation of nonconformities. By linking root causes with their detection locations, the framework enables improved traceability, clearer responsibility allocation, and enhanced decision-making for corrective and preventive actions.
2.3. Differentiation from Established Risk and Safety Analysis Tools
The proposed 5M–Source–Detection framework is fundamentally different from widely used tools such as Failure Mode and Effects Analysis (FMEA), Hazard and Operability Study (HAZOP), Bow-Tie analysis, Ishikawa (Fishbone) diagram, System-Theoretic Process Analysis (STPA), and traditional risk matrices. While FMEA, HAZOP, Bow-Tie, and STPA are predominantly proactive design-phase or process-hazard analysis tools focused on identifying potential failures before they occur [
41], the present framework operates as a reactive-proactive operational tool applied to actual events (near-misses, minor incidents, and hazardous situations). Ishikawa diagrams and the classic 5M model focus exclusively on root cause identification. In contrast, the integrated framework adds a second dimension—the Source–Detection Matrix—which explicitly maps the propagation path and detection point of nonconformities within the organizational and process flow. This enables the calculation of specific performance indicators (e.g., Detection at Source Rate, Detection Delay Index, Propagation Index) and supports targeted actions to minimize detection lag. Conventional risk matrices evaluate probability and severity but do not track where and by whom a nonconformity is detected in the real operational chain [
42]. The proposed approach therefore fills a practical gap by linking causal analysis with detection efficiency and process responsibility.
3. Case Studies: Application of the 5M Model with Source–Detection Matrix Analysis in the Cosmetics and Perfumery Industry
The aromatic compound extraction industry from plant-based raw materials (flowers, leaves, roots, seeds, etc.) for perfumery and cosmetics is mainly based on volatile solvent extraction, a method particularly suitable for thermolabile substances that cannot withstand steam distillation (such as jasmine, tuberose, rose, mimosa, bitter orange, etc.) [
43]. The final objective is the production of pure and concentrated aromatic extracts (absolutes), with superior olfactory yields and sensory profiles that closely reflect the raw material, without significant thermal degradation.
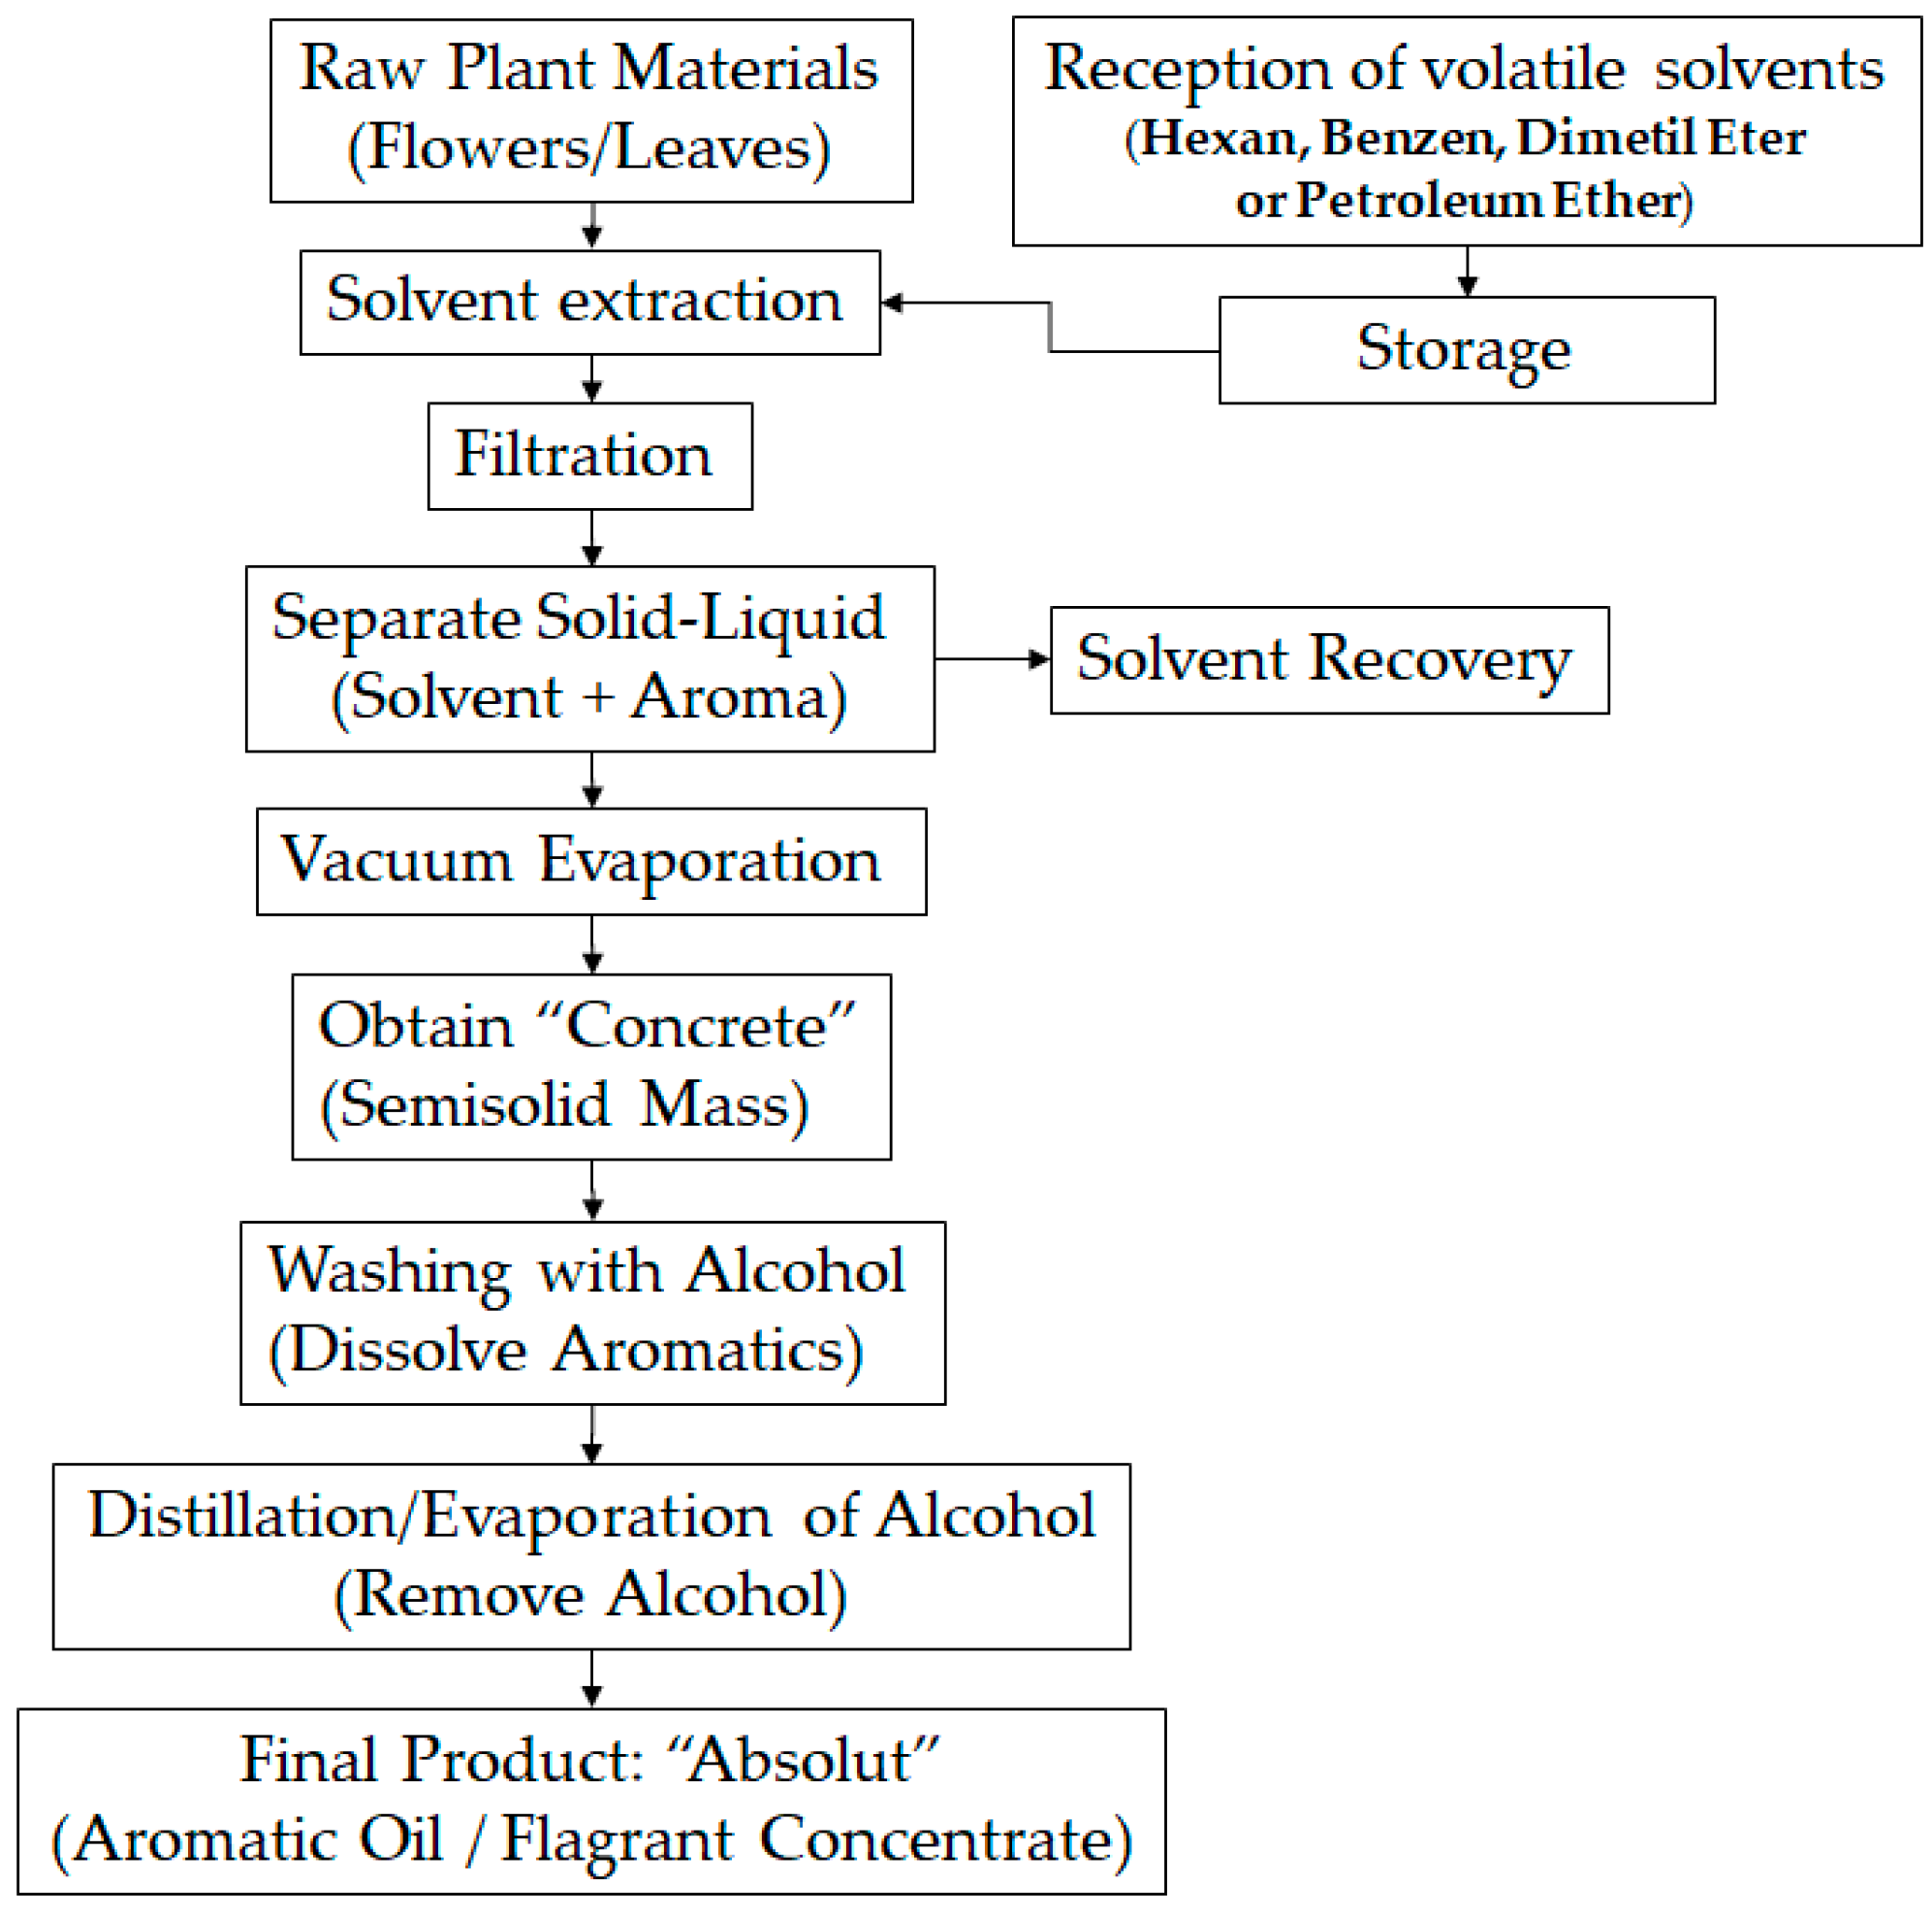
Figure 3 presents a generalized process flow diagram for the production of aromatic concentrates (absolutes) used in the cosmetics industry.
The process begins with the treatment of plant-based raw materials using volatile solvents, a stage carried out in closed systems equipped with ventilation and vapor control to prevent exposure and reduce the risk of explosion. The resulting mixture is then safely filtered, avoiding solvent losses and direct contact of operators with toxic substances.
The solvent is subsequently recovered through vacuum evaporation, thereby reducing both fire hazards and harmful emissions, while the remaining product (“concrete”) is handled under controlled conditions. Alcohol treatment and final distillation stages are performed in secure equipment with continuous monitoring of temperature and pressure.
The volatile solvent extraction process is strongly influenced by occupational safety and health requirements, as the substances involved present significant risks of fire, explosion, and toxicity.
From the reception stage onwards, the handling of solvents such as hexane, benzene, or dimethyl ether is performed in strict compliance with safety procedures. Personnel must use personal protective equipment, and quality documentation checks are complemented by packaging inspections to prevent leaks or contamination. Any nonconformity may generate serious risks; therefore, this stage is treated with maximum attention.
Solvent storage represents one of the most critical phases in terms of safety. Solvents are stored in specially designed areas compliant with ATEX standards [
44,
45], equipped with efficient ventilation and temperature control systems. It is essential to eliminate any ignition sources, including inappropriate electrical equipment or electrostatic discharges. In addition, storage facilities are equipped with fire suppression systems, and access is strictly controlled to reduce the risk of accidents. Proper organization and staff training play a decisive role in preventing incidents [
46].
During their use in the extraction process, risks are increased due to direct solvent handling and the formation of flammable vapors. Therefore, equipment is hermetically sealed, and processes are conducted under controlled conditions with continuous monitoring of pressure and temperature. Industrial ventilation and vapor detection systems play a crucial role in preventing hazardous accumulations. Solvent recovery through distillation or vacuum evaporation is not only economically important but also essential for reducing exposure to toxic substances and minimizing the impact on the working environment.
The final stages, in which ethanol is used and the “absolute” product is obtained, involve lower risks but still require appropriate protective measures. Alcohol handling and distillation operations are carried out under controlled conditions to prevent fires and vapor exposure. Throughout the entire technological flow, staff training, compliance with operational procedures, and the use of protective equipment are essential for ensuring a safe working environment.
In the extraction and absolute production process, control points (CPs) are critical stages that ensure product quality and operational safety. CP1 refers to the reception of raw plant materials (flowers/leaves), where quality is checked, including moisture content, presence of contaminants, and compliance with supplier specifications. CP2 is the solid–liquid separation stage during solvent extraction, where process parameters are controlled and risks related to solvent leaks or vapors are monitored. CP3 involves alcohol distillation/evaporation, where temperature and pressure are regulated to safely remove the solvent and obtain a high-quality final product.
3.1. Scenario 1. Electrical Accident in the Cosmetics and Perfumery Industry
In a production facility within the cosmetics and perfumery industry, following an unauthorized technical intervention performed by production personnel on the vacuum evaporation system, the aromatic compound extraction installation was put into operation without completing the electrical safety checks and without verification of proper functionality by the production department.
During operation of the installation, an operator touched the metal casing of a pump filtering equipment and suffered a minor electric shock caused by the accidental energization of the casing, resulting from an electrical fault and insufficient protective measures.
The operator did not verify the proper operation of the equipment and did not report the incident further; the event was later identified and reported by quality control staff during process parameter verification, who also experienced a minor electric shock.
The event was analyzed using the 5M model in order to identify the multiple causes that led to the accident, which are summarized in
Table 7.
The accident is the result of a single outcome (electric shock), generated by the interaction of five main causes, each belonging to a different category of the 5M model. This perfectly illustrates the multi-M principle leading to electrical shock.
The positioning of the elements involved in the occurrence of the accident was carried out using the Source–Detection Matrix, an analytical tool that highlights the relationships between hazard sources and their identification and control possibilities. In this context,
Figure 4 was developed, presenting the entity matrix and the relationships between them in the case of the electrical accident, providing an overall view of the interdependencies between technical, human, organizational, and environmental factors.
The matrix identifies the nonconformity in relation to “who generates it” and “who identifies it”. In this case, the accident was detected by personnel from the quality control department during process verification. The quality control staff are not the owners of the aromatic compound extraction equipment handling process; however, they are the department responsible for process control, and therefore the subsequent point in the matrix entity of identifying this type of nonconformity. Thus, this nonconformity is classified in the yellow zone within the entity matrix. The purpose of corrective actions is to shift this situation toward the green zone of the matrix by ensuring that nonconformities are identified and addressed as close as possible to the source, namely at the level of the process where they are generated.
Given that the factors identified through the 5M model are interdependent, corrective and preventive measures have been established in a correlated manner, so as to simultaneously address technical, human, organizational, and environmental causes. These measures are designed to be both efficient, through rapid implementation, and effective, by directly targeting the root causes of the accident.
In this context,
Table 8 and
Table 9 present the correspondence between the identified causes and the proposed corrective measures, as well as the intended objectives of their implementation.
The priorities established must be correlated with the specific characteristics of the cosmetics and perfumery industry, where risks are amplified by the presence of volatile solvents and electrical equipment used in potentially explosive atmospheres. First, the use of personal protective equipment and staff training are essential, as workers operate in sensitive environments (ATEX zones), where any error may have severe consequences. Second, work procedures must be adapted to specific processes such as extraction, distillation, or solvent handling, while continuous training contributes to strict compliance with these procedures. Preventive maintenance is also critical, as it ensures the safe operation of electrical and technological installations used in the production of aromatic products.
The monitoring system is adapted to this type of industry and includes indicators such as the number of electrical incidents in process areas, the level of training of personnel working with equipment in hazardous environments, and the percentage of installations inspected in accordance with ATEX requirements. Control is carried out through periodic occupational safety and health inspections, audits of technological procedures, and verification of equipment used in the presence of flammable solvents, as well as through emergency response simulations.
The objectives pursued are a reduction in industry-specific risks, particularly those related to electric shock and fire, the rapid identification of nonconformities in equipment operation, and the prevention of accidents in hazardous environments. Thus, the organization adopts a proactive approach, essential in the cosmetics and perfumery industry, where process safety and personnel protection are closely linked to the control of volatile substances and electrical equipment.
3.2. Scenario 2. Handling of Volatile and Irritant Substances in the Cosmetics and Perfumery Industry
During the unloading of products containing volatile and/or irritant substances, production personnel were exposed to harmful vapors, experiencing nasal symptoms and coughing.
- -
Source of nonconformity: Procurement—(B) (products inadequately protected against inhalation exposure);
- -
Detection of nonconformity: Quality Control—QC (D), which intervened after operators developed symptoms;
- -
Impact: Exposure to health risks for personnel, possible intoxication, or physical discomfort.
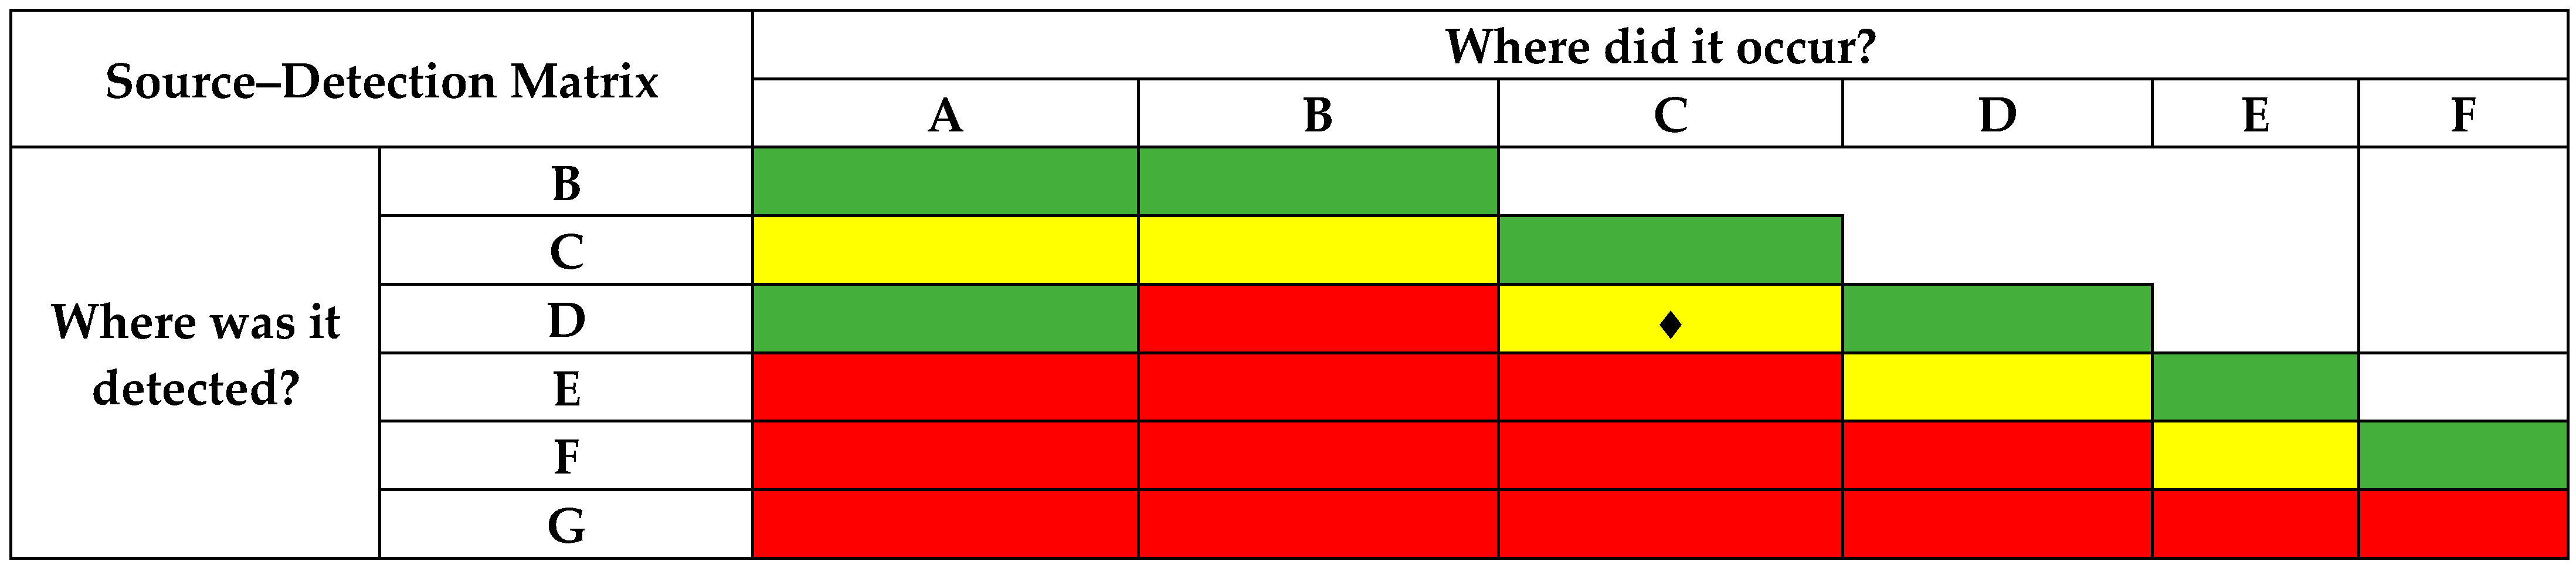
The analysis of the event (
Figure 5) indicates that the source of the nonconformity was located in the Procurement area (B), due to the acceptance of products insufficiently protected against inhalation risk, while the detection of the nonconformity occurred in the Quality Control—QC area (D), after symptoms had already appeared among operators.
In this case, the incident was detected by the quality control department staff during the inspection of the product purchased by the procurement department. The quality control staff are not the owners of the procurement process; however, they are responsible for product inspection.
The positioning within the entity matrix highlights that the risk was introduced into the system at the procurement stage but was only identified later at the operational control stage, indicating an insufficient preventive assessment of hazards associated with the received products.
The analysis of the causes contributing to risks associated with the handling of volatile and irritant substances in the cosmetics and perfumery industry was carried out using the 5M model, in order to identify human, technical, organizational, material, and environmental determining factors. This approach enables the identification of key process vulnerabilities and supports the development of appropriate preventive measures.
Table 10 summarizes the identified causes and the associated possible effects within the analyzed process.
Three main causes with major impact:
- -
M1-3—contaminated working environment with irritant vapors;
- -
M2-1—non-use of appropriate personal protective equipment (PPE);
- -
M3-1/M3-2—lack or inadequacy of work procedures.
Effects of the nonconformity:
- -
Onset of respiratory symptoms;
- -
Physical discomfort;
- -
Interruption of activity;
- -
Need for first aid intervention;
- -
Intoxication in case of prolonged exposure;
- -
Aggravation of pre-existing respiratory conditions;
- -
Noncompliance with OSH requirements;
- -
Increased risk of complaints, audit nonconformities, and productivity losses.
In order to reduce the risks associated with the handling of volatile and irritant substances, both corrective and preventive measures were established, as well as a set of concrete actions correlated with the causes identified through the 5M model (
Table 11,
Table 12 and
Table 13). These measures aim both at the immediate elimination or control of risks and at preventing their recurrence through process standardization, staff training, and improvement of working conditions.
3.2.1. Efficient and Effective Monitoring
Indicators and verification measures:
Procurement verification—delivered products must comply with packaging and hazard communication requirements (protection against inhalation of volatile substances).
Compliance with PPE use—operators must wear appropriate full-face respirators equipped with organic vapor cartridges, respirators, and other required protective equipment.
Operator feedback—collection of information regarding handling practices and perceived risks.
Evaluation of implemented measures—periodic analysis of the efficiency and effectiveness of actions, with prompt correction in case of deviations.
Compliance audit—internal audit regarding the implementation of work instructions and the adequacy of control measures.
3.2.2. Results and Improvements
- -
Elimination of direct exposure to vapors and irritant substances;
- -
Standardization of operations for handling hazardous products;
- -
Increased personnel awareness and protection;
- -
Improved communication with suppliers to ensure safe deliveries;
- -
Reduction in the risk of similar incidents and strengthening of a proactive OSH system.
This case study highlights how the multi-M to single-effect analysis, combined with the Source–Detection Matrix and an action plan based on efficient and effective measures, can prevent occupational exposure and support the standardization of hazardous substance handling processes.
3.3. Results and Quantitative Validation
To validate the effectiveness of the proposed 5M–Source–Detection framework, a quantitative assessment was conducted based on operational data collected over two comparable time intervals: a baseline period (6 months before implementation) and a post-implementation period (6 months after implementation). Operational data used for the quantitative evaluation of the KPIs were collected from the organization’s internal Quality Management System (QMS) and Safety Management System (SMS). The primary data sources included structured incident logs, nonconformity reports, near-miss reporting records, customer complaint databases, and internal audit documentation.
The quantitative validation of the proposed framework was performed using a set of key performance indicators (KPIs) designed to capture detection efficiency, risk reduction, and overall process performance. These indicators include the Detection at Source Rate (DSR), Detection Delay Index (DDI), Customer Detection Rate (CDR), Near-Miss Reporting Rate (NMRR), Minor Incident Frequency (MIF), Average Risk Priority Number (RPNavg), Risk Reduction Rate (RRR), and Propagation Index (PI). Together, these metrics provide a comprehensive and multidimensional assessment of how effectively nonconformities are identified, how risks evolve within the system, and how operational safety performance improves following the implementation of the 5M–Source–Detection framework. The corresponding results are summarized in
Table 14.
Operational data used for the quantitative evaluation of the 5M–Source–Detection framework were collected from the organization’s internal quality and safety management system. The analysis was conducted using structured incident logs, nonconformity reports, near-miss records, and customer feedback reports. Each recorded event was classified according to severity, detection point, and causal category based on the 5M classification model. The sample sizes used for KPI computation were as follows: baseline period: n1 = 128 and post-implementation period: n2 = 95.
All Key Performance Indicators (KPIs) were calculated using aggregated counts derived from these datasets. The following standard definitions were applied:
Detection at Source Rate (DSR, %) = (Number of nonconformities detected at source/Total number of nonconformities) × 100;
Customer Detection Rate (CDR, %) = (Customer-detected defects/Total defects) × 100;
Near-Miss Reporting Rate (NMRR) = Number of near-miss reports/Month;
Minor Incident Frequency (MIF) = Number of minor incidents/Month;
Average Risk Priority Number (RPNavg) was calculated as the arithmetic mean of individual Risk Priority Numbers (RPNs) obtained from Failure Mode and Effects Analysis (FMEA): RPNavg = ΣRPNi/n;
Risk Reduction Rate (RRR, %) = (RPNavg before − RPNavg after/RPNavg before) × 100;
DDI and PI were computed based on the average number of process stages required for detection and containment of nonconformities, as defined in the internal process mapping framework.
All KPIs were derived consistently across both periods to ensure comparability. No changes were made to the KPI definitions between baseline and post-implementation phases. The same classification rules and data extraction procedures were applied to both datasets to avoid methodological bias.
The integrated interpretation of the quantitative results indicates a coherent and system-wide improvement in occupational safety and process control performance. The findings reflect a clear transition from reactive identification of nonconformities toward a proactive approach in which deviations are detected earlier and closer to their point of origin. This evolution suggests strengthened operational discipline, improved effectiveness of internal control mechanisms, and better alignment between causal analysis and process monitoring activities. From a risk management perspective, the results confirm that addressing root causes through the 5M model, combined with structured detection mapping, leads to more stable and predictable risk control across the system.
The observed trends highlight a positive transformation in organizational behavior and safety culture. The increased attention to low-level events such as near-misses indicates higher employee engagement and improved awareness of potential hazards, supporting early intervention and prevention of escalation. At the same time, the reduction in externally identified issues demonstrates enhanced internal verification and quality assurance capabilities. These effects confirm that the proposed framework not only improves technical and procedural aspects of safety management but also contributes to the development of a more proactive, data-driven, and continuously improving organizational environment.
4. Discussion
The present study demonstrates that integrating the 5M root-cause model with a Source–Detection Matrix offers a practical and effective approach for proactive OHS nonconformity management. By simultaneously addressing the causes of deviations and their propagation through the operational flow, the framework enables earlier detection and reduces risk escalation.
This combined methodology complements established tools such as FMEA, HAZOP, and Ishikawa diagrams. While these tools excel in prospective hazard identification or cause analysis, they rarely examine the actual detection location and propagation distance of nonconformities in day-to-day operations—a gap that the proposed framework specifically addresses.
Recent studies have widely applied classical occupational risk assessment tools such as FMEA, HAZOP, and Bow-Tie analysis for industrial safety management; however, most of them remain focused on hazard identification and qualitative risk representation, without explicitly addressing the detection point and propagation of nonconformities within operational workflows. For example, Bow-Tie-based approaches are mainly used to map causes, barriers, and consequences of accidents, but they do not systematically evaluate where failures are detected within the process chain or how detection delays influence risk propagation [
47]. Similarly, HAZOP and FMEA are effective in identifying deviations and failure modes, but they lack integration with real operational detection data and do not capture inter-process responsibility flows [
48,
49].
In contrast to these approaches, the proposed 5M–Source–Detection framework extends traditional methods by explicitly linking root causes (5M classification) with detection location and process propagation dynamics, enabling a more operational and traceable safety performance evaluation.
4.1. Findings and System-Level Insights
Although the 5M model and various matrix-based tools for tracking nonconformities are individually well established, the original contribution of this study consists in their purposeful integration into a unified operational framework. This combination enables not only the identification of root causes but also the simultaneous visualization and quantification of detection delays and propagation paths. Such integration provides a practical mechanism for shifting detection closer to the source, an aspect that has received limited attention in existing literature.
The present study demonstrates the effectiveness of integrating the 5M model with the Source–Detection Matrix for proactive management of OHS nonconformities. The case studies presented, including electrical hazards and exposure to volatile substances, highlight the multi-causal nature of workplace incidents and the value of early detection in preventing escalation to severe accidents.
The industrial applicability of the proposed framework is further strengthened by the transformation of the Source–Detection Matrix into a comprehensive risk analysis tool. In practical applications, the matrix provides a clear visualization of defect propagation, enabling organizations to track where nonconformities originate, where they bypass internal controls, and how they reach subsequent stages of the process or even the final customer [
50].
This enhanced interpretation allows the matrix to serve not only as an analytical instrument but also as a decision-support tool. By integrating risk-based indicators, organizations can quantitatively assess the severity and spread of nonconformities [
51]. This data-driven approach significantly improves the prioritization of corrective and preventive actions, reduces response time, and enhances the overall effectiveness of management decisions [
52,
53].
Another key finding is the impact on employee awareness and engagement [
54]. The visualization of nonconformities and their propagation across processes, combined with direct involvement of personnel at the operational level (Gemba), contributes to a significant reduction in both minor incidents and the risk of major accidents [
55]. This participatory approach strengthens the organizational safety culture and promotes individual responsibility for quality and safety outcomes [
56].
Our findings are consistent with previous research emphasizing the multi-factorial origins of workplace accidents. For example, many studies [
57,
58] emphasized that human errors often interact with technical and organizational deficiencies to produce adverse outcomes. Similarly, Heinrich’s Safety Pyramid [
29] and Bird’s subsequent extensions [
59] support the concept that reducing minor incidents and unsafe acts can proportionally reduce severe accidents, a principle directly applied in the methodology proposed in this study [
60].
The Source–Detection Matrix provides a clear visualization of the origin and detection of nonconformities, allowing organizations to identify critical control points and evaluate the effectiveness of existing monitoring mechanisms. This approach confirms earlier observations by Hollnagel [
32], who argued that proactive safety management requires both identification of risks at the source and systemic analysis of organizational processes.
The integration of 5M causal analysis with detection mapping enhances the prioritization of corrective measures, ensuring that interventions are both efficient (applied rapidly and close to the source) and effective (targeting root causes) [
61]. For example, in the electrical hazard case, the combined analysis identified four contributing causes across different categories (Man, Machine, Method, Equipment), guiding the organization to implement measures addressing personnel training, PPE provision, procedural standardization, and preventive maintenance [
62]. Such multi-level intervention aligns with contemporary recommendations for integrated risk management [
63].
The findings also highlight the critical importance of shifting detection toward the “green zone” of the Safety Pyramid, where nonconformities are identified and corrected as close as possible to their source [
64]. This proactive strategy reduces the risk propagation along operational processes and prevents incidents from reaching customers or external stakeholders, addressing a common weakness identified in previous studies on OHS compliance [
65,
66].
4.2. Relevance to Manufacturing Engineering and Industry 4.0
The proposed framework extends beyond conventional occupational safety management by providing a process-oriented methodology directly applicable to manufacturing engineering environments. The integration of root-cause analysis with detection mapping enables monitoring of operational deviations, supporting improved manufacturing reliability, process stability, and quality assurance.
From an Industry 4.0 perspective, the framework facilitates structured data collection regarding process deviations, detection delays, and propagation paths. These data can support future integration with digital manufacturing systems, predictive analytics, industrial IoT platforms, and AI-based monitoring tools.
The methodology contributes to sustainable manufacturing by reducing operational disruptions, minimizing process losses, improving resource utilization, and preventing risk escalation across production systems.
The proposed approach is particularly relevant for high-risk manufacturing sectors involving hazardous substances, non-automated equipment, and complex process interactions, where rapid detection and containment of nonconformities are essential for operational continuity and worker safety.
4.3. Lessons Learned, Long-Term Implications, Limitations and Future Directions
The implementation of the integrated 5M–Source–Detection framework highlights several important lessons. First, proactive reporting of minor incidents and near-misses plays a crucial role in preventing escalation toward severe accidents, confirming the principles of the Safety Pyramid.
Second, internal detection mechanisms are essential for maintaining process control. Departments that adopted self-verification practices demonstrated a significant reduction in nonconformities transferred to downstream processes or external stakeholders.
Third, the visualization and analysis of data through the matrix enabled rapid identification of critical points and problematic process flows, facilitating timely interventions.
Finally, employee involvement proved to be a key success factor. Active participation in identifying and correcting nonconformities increased awareness, accountability, and adherence to occupational health and safety standards.
The long-term implementation of the proposed framework generates significant organizational benefits. These include a reduction in the frequency and severity of workplace incidents, achieved through early detection and correction of nonconformities.
Continuous monitoring and periodic analysis of defect flows contribute to ongoing process improvement and increased operational stability. At the same time, product and service quality are enhanced, leading to improved customer satisfaction and strengthened organizational reputation.
The approach supports the development of a strong safety culture based on responsibility and self-quality, where each employee understands the impact of their actions on overall system performance.
From a strategic perspective, the use of risk-based indicators enables more informed decision-making, allowing organizations to allocate resources efficiently and prioritize preventive measures. In the long term, this leads to a more robust, predictable, and resilient operational structure, capable of managing current challenges while proactively preventing future risks.
Despite the clear benefits, the study acknowledges certain limitations. The case studies are limited to two specific types of incidents within controlled industrial environments, which may not fully represent the diversity of risks in other sectors. Additionally, while the proposed framework facilitates visualization and prioritization of nonconformities, its effectiveness depends on accurate data collection, employee engagement, and consistent application of corrective measures.
Future research should explore several directions:
Expansion of the methodology to multi-site organizations with diverse operational processes and higher complexity.
Integration of digital tools and real-time monitoring systems, such as IoT sensors and predictive analytics, to enhance early detection of nonconformities.
Quantitative assessment of the impact of the integrated 5M–Source–Detection framework on accident rates, near-miss reporting, and overall organizational safety culture.
Comparative studies between organizations adopting the proactive 5M–Matrix approach and those following traditional reactive incident reporting models.
This study demonstrates that the combination of causal analysis (5M model) and process-based visualization (Source–Detection Matrix) offers a robust tool for proactive OHS management. The methodology not only supports the identification and correction of nonconformities at the earliest stages but also strengthens organizational safety culture, enhances employee awareness, and reduces the probability of severe workplace accidents. These findings provide a strong foundation for further empirical validation and practical implementation in diverse industrial contexts.
Future developments may include integration of the 5M–Source–Detection framework with artificial intelligence and Industry 4.0 technologies, such as machine learning algorithms for predictive nonconformity analysis, IoT-based real-time monitoring systems, and digital dashboards for dynamic process-risk visualization. Such integration could enable automated identification of propagation patterns and support adaptive control strategies in smart manufacturing environments.
Although the proposed framework focuses primarily on source–detection relationships and risk traceability, it may be further extended through the integration of automated quality control systems, real-time monitoring technologies, and process separation mechanisms, depending on the operational complexity and technological maturity of the analyzed system.
Although automation and advanced instrumentation systems can substantially improve defect detection and reduce operational risks, many manufacturing and healthcare-related processes continue to involve significant human interaction, manual verification activities, and operator decision-making, particularly in partially automated environments. In such contexts, nonconformities may still originate from human, procedural, organizational, or communication-related factors that cannot be fully eliminated through automation alone. Therefore, the proposed 5M–Source–Detection framework is intended to complement existing technical control systems by providing a structured methodology for identifying source–detection relationships and supporting systematic root-cause analysis. Nevertheless, the current study does not explicitly integrate automated monitoring or intelligent instrumentation systems, which represents a limitation and a potential direction for future research and practical implementation.
The authors acknowledge that the individual components of the framework (the 5M model and matrix-based tracking) build upon established tools in root-cause analysis and quality management. The novelty resides in their specific integration and practical application within OHS, supported by quantitative validation in an industrial setting. Future research should further test the generalizability of this integrated approach across different sectors.