1. Introduction
The rapid advancement of infrastructure construction in China, encompassing transportation, water conservancy, and mining, has brought the construction and long-term stability control of sandstone–mudstone interbedded slopes—a widely distributed type of rock slope—to the forefront of engineering challenges. Blasting technology, valued for its efficiency and cost-effectiveness, is extensively used for rock excavation in such slopes. However, the dynamic loads generated by blasting significantly disturb the internal structure of the slope, often causing irreversible damage to the mechanically weaker mudstone interlayers. This can trigger the initiation and propagation of cracks, potentially leading to slope instability, which poses serious threats to both construction safety and long-term operational integrity.
Blast-induced vibrations are a recognized trigger for rock slope instability, making stability analysis and control paramount for mitigating this engineering hazard. Scholars worldwide have conducted substantial research in this area. Regarding analytical methods, Kramer S.L. [
1] and Ausilio E. [
2] drew from seismic studies to analyze slope dynamic stability and propose reinforcement techniques. Liu Huali et al. [
3] assessed stability based on the distribution of normal stress on the slip surface. Chen Ningning et al. [
4], Wang Xiujie et al. [
5], and Chen Qingyun et al. [
6] employed numerical simulations and time-history analysis to investigate the stability of cut slopes and hydropower station slopes. Concerning failure modes, studies [
7,
8,
9,
10,
11,
12] have revealed that slopes tend to develop tensile cracks and shear slip surfaces, with failure generally following specific mechanical mechanisms. The instability process can often be divided into three stages: toppling deformation, fragmentation, and collapse/sliding, frequently initiated by rock mass fracturing. For stability control, Li Wenxiu et al. [
13] studied the influence of blasting mining on the stability of an open-pit mine slope in southern Gansu Province. Liu Meishan et al. [
14] proposed distinct safety vibration velocity thresholds for rock masses with different weathering degrees, based on multi-source data and engineering references. Lin Daneng et al. [
15], using an open-pit slope as a case study, determined a safe vertical vibration velocity criterion by analyzing the relationship between horizontal and vertical accelerations. A key finding from these studies is that blast vibration velocity is commonly adopted as the control threshold for the dynamic stability of rock slopes.
This study is based on the diversion channel project of the Qingnian Hub of the Ping-Lu Canal. Addressing the issue of blasting excavation disturbance in the sandstone–mudstone interbedded slopes of this project—characterized by variable weak interlayer thicknesses (1.5~4.0 m) and diverse dip angles (8~17°)—an integrated methodology combining field blasting tests, laboratory dynamic tests on rocks, and numerical simulation validation is employed. Field monitoring and laboratory tests are conducted to acquire slope dynamic response data and dynamic mechanical parameters of the rock mass, respectively. Numerical modeling is then utilized to investigate the influence of interlayer parameters on the fracturing of the weak layers, thereby revealing the dynamic fracture mechanisms and proposing safety criteria for slope dynamic stability to support engineering control.
The primary objectives of this research are to elucidate the dynamic fracture mechanism of weak interlayers in sandstone–mudstone interbedded slopes under blasting loads and to quantify the influence of rock stratum occurrence on fracture characteristics. The findings are expected to provide a scientific basis for optimizing blasting parameters and controlling slope stability in similar engineering projects, offering both theoretical innovation and practical guidance.
2. Materials and Methods
2.1. Test Slope and Geological Conditions
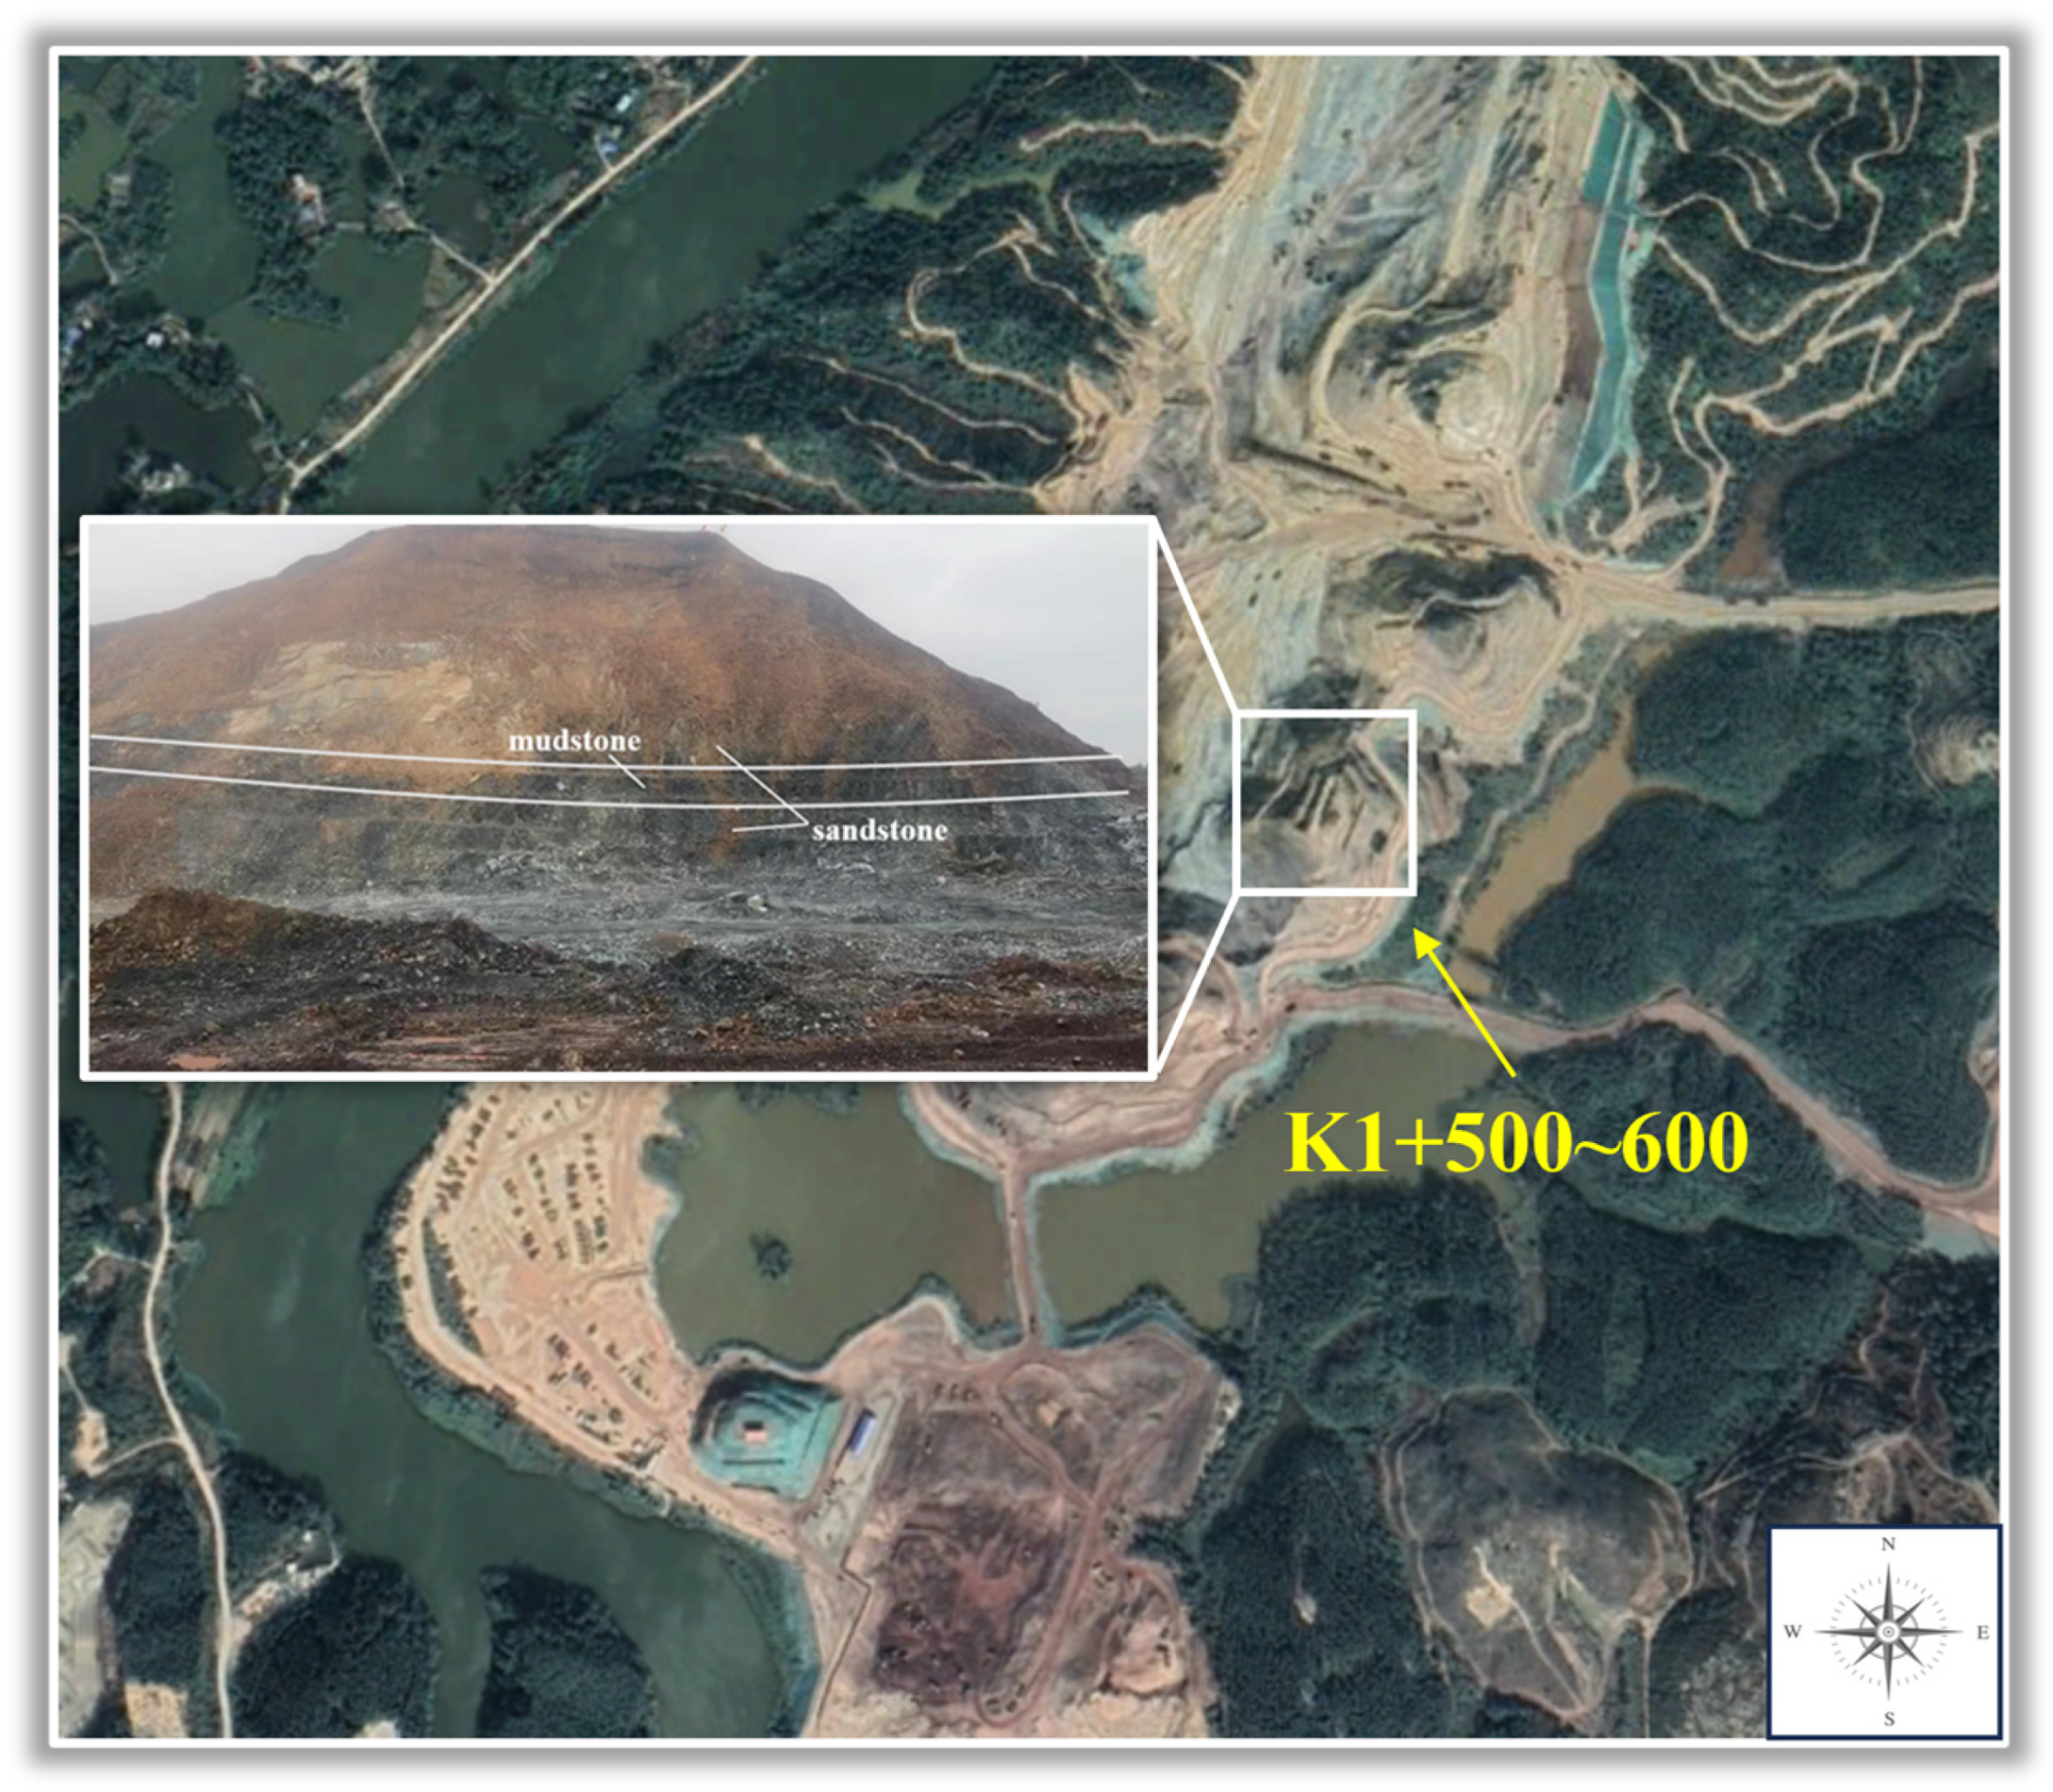
To investigate the dynamic response characteristics of weak layers in sandstone–mudstone interbedded slopes under blasting vibration, a natural slope with geological conditions similar to those of the Qingnian Hub excavation area was selected as the study object. The rock mass of the test slope primarily consists of interbedded purplish-gray sandstone, dark gray argillaceous siltstone, and mudstone, exhibiting an overall structure of gently inclined stratified rock. The slope has a vertical height of approximately 60 m, with sandstone and mudstone layers distributed alternately. The bedding planes dip at angles ranging from approximately 8° to 17°, with interlayer spacings of 3 to 4 m. The mudstone layers, with thicknesses varying between 1.5 and 4.0 m, exhibit poor continuity and are locally discontinuous.
Figure 1 shows the geographical location of the test slope and the spatial distribution and geometric characteristics of the weak layers within it.
2.2. Blasting Vibration Test
To investigate the influence of blasting vibration on the dynamic response of the sandstone–mudstone interbedded slope, three blasting test lines were arranged on the slope. Boreholes were drilled along the slope surface direction, and vibration monitoring instruments were installed. Each test line consisted of 3 boreholes with a diameter of 100 mm, a depth of 10 m, and an inter-hole spacing of 4 m. A coupled charging method was employed, with the charge weight per hole decreasing sequentially from the crest to the toe (48 kg, 42 kg, 36 kg). A millisecond-delay initiation technique was adopted to minimize interference effects between adjacent boreholes.
Regarding the treatment of wave interference, the superposition of wave trains in measured signals is an inevitable consequence of millisecond-level delays. This study employs PPV as the core criterion, as this metric directly quantifies the most unfavorable transient effects following superposition, aligning with conventional engineering safety analysis practices. The numerical model’s effectiveness in reproducing overall waveform characteristics supports the reliability of this treatment approach.
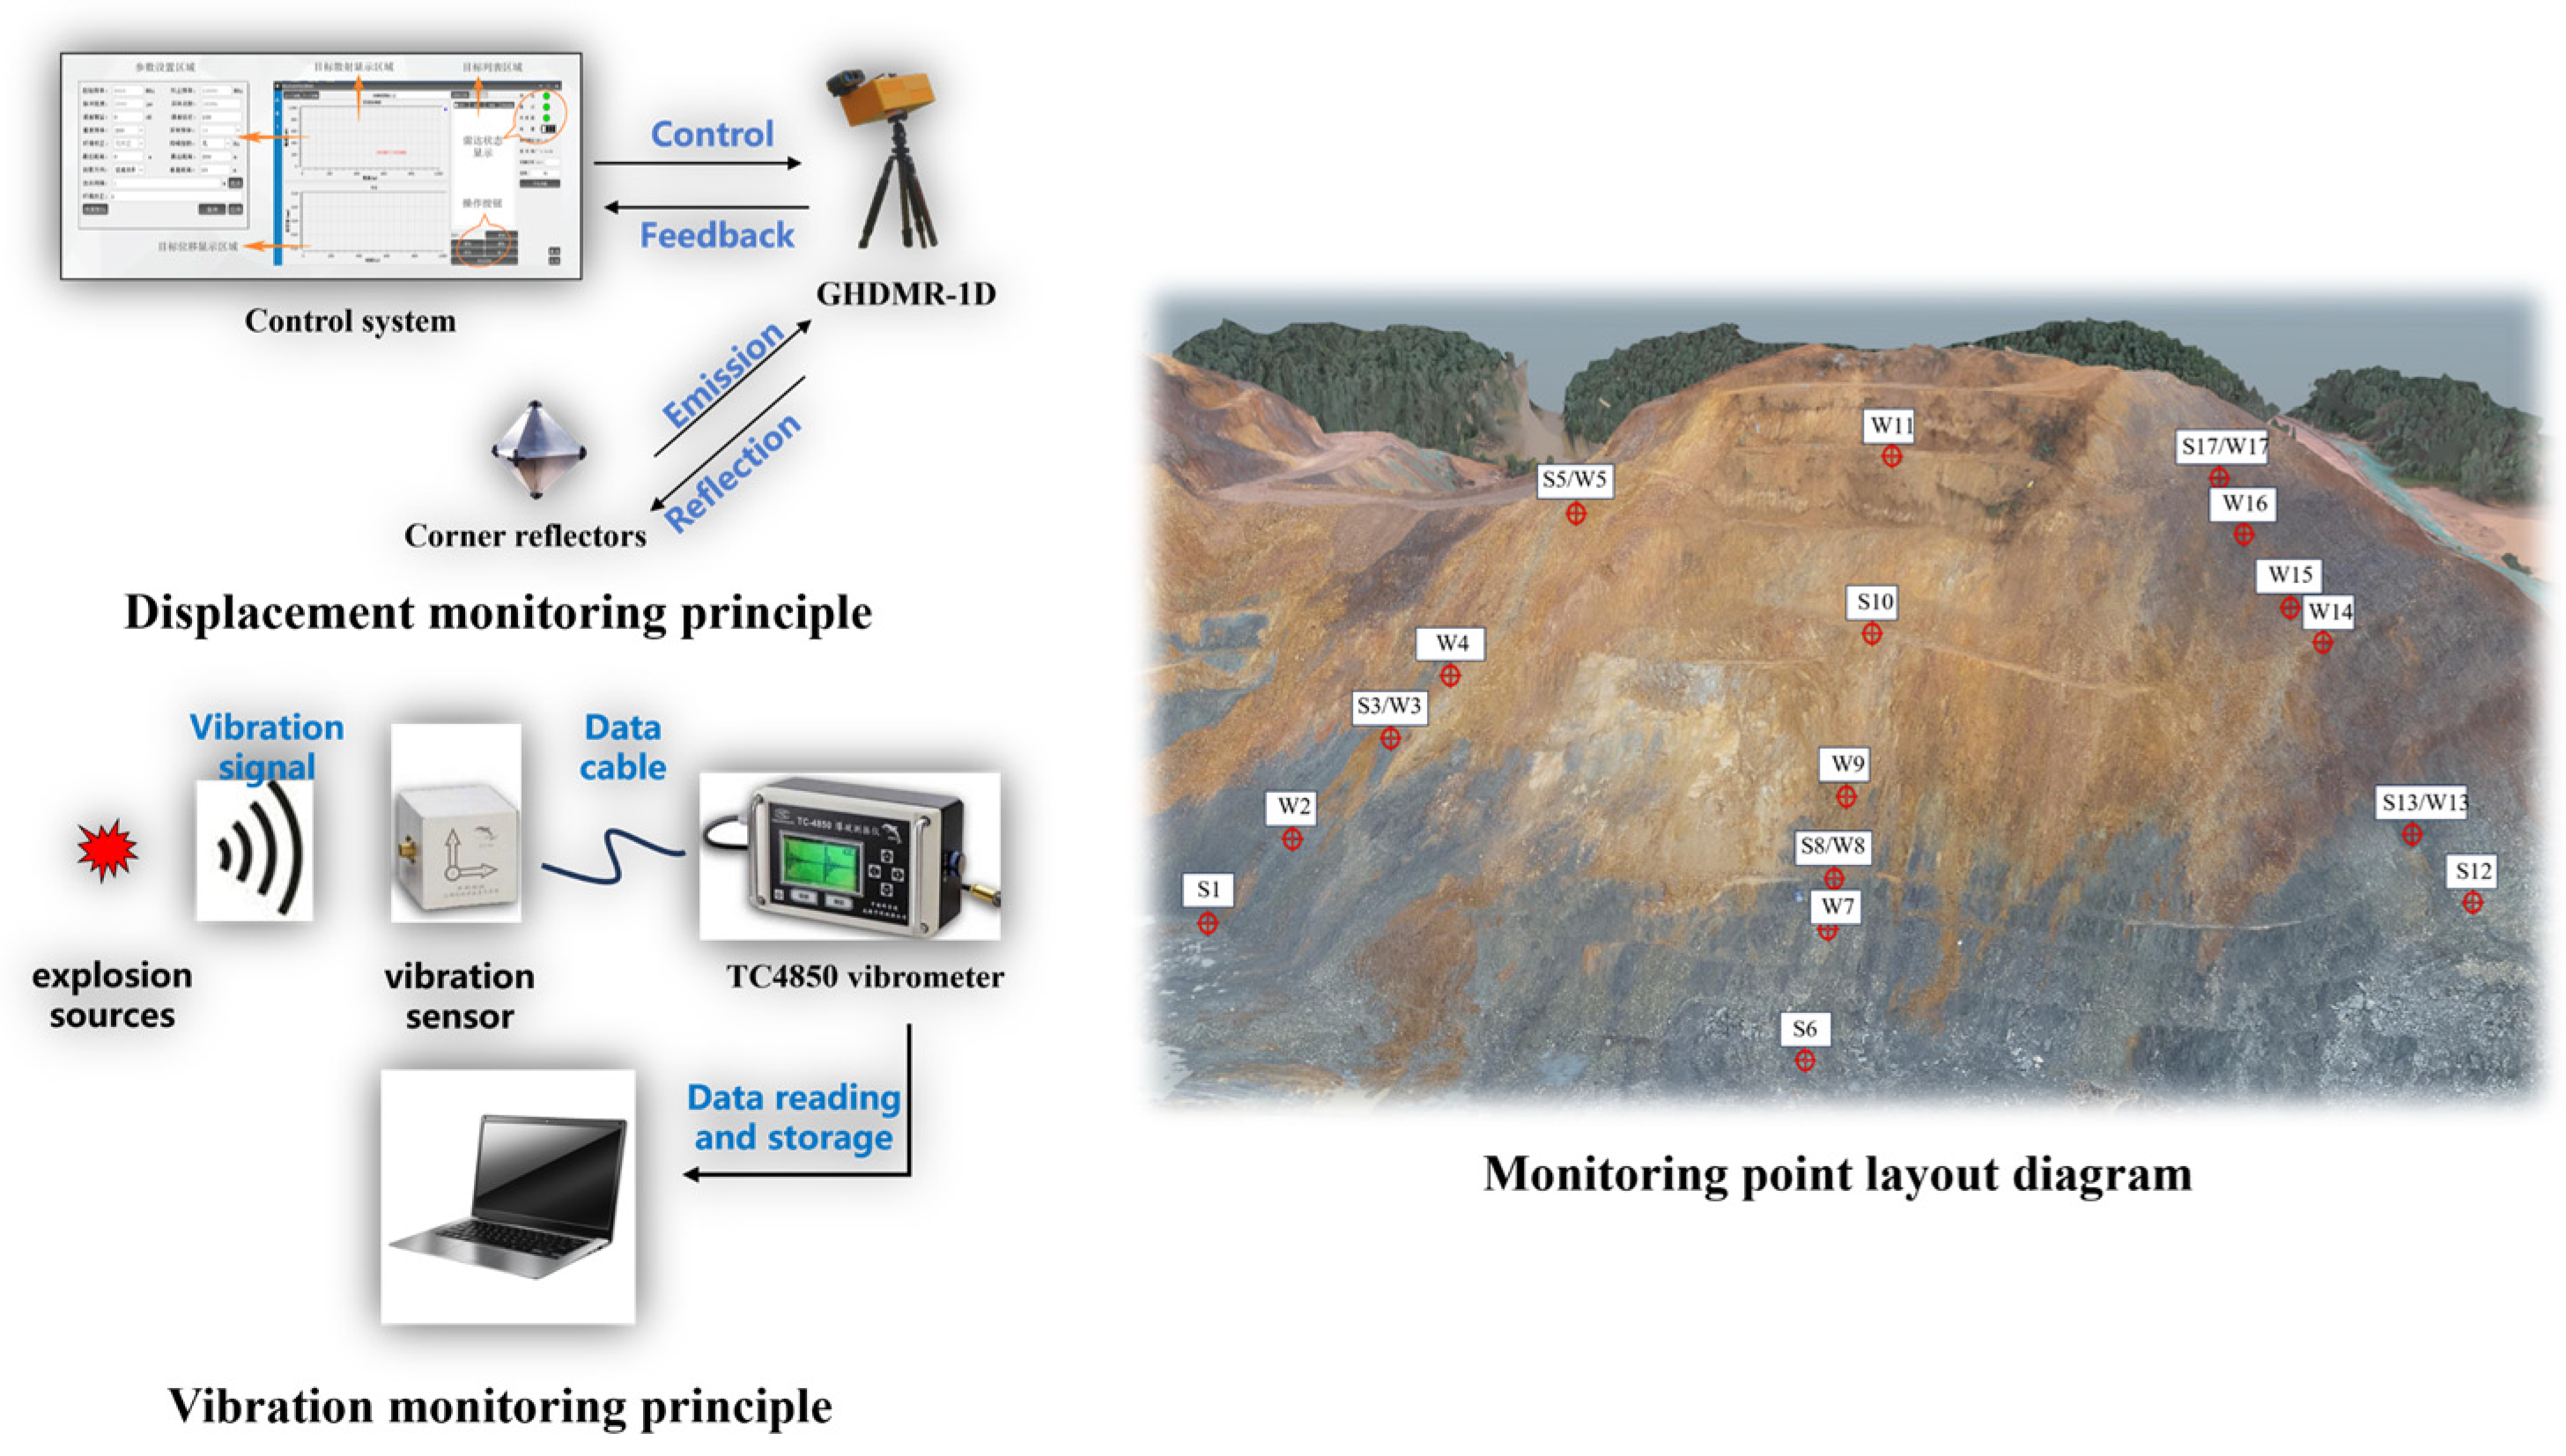
To simultaneously capture the velocity and displacement responses induced by the blasting vibration, a TC-4850 multi-channel blast vibration testing system and a GH-DMR-1D dynamic displacement monitoring radar were utilized, respectively. The layout of the monitoring points and the operational principles of the equipment are shown in
Figure 2. The letter ‘S’ denotes vibration velocity monitoring points, while ‘W’ denotes displacement monitoring points, with numbers indicating the specific point identifiers (e.g., S1, W2). The monitoring points were arranged sequentially along the direction perpendicular to the slope face, with a spacing of approximately 5 m. Specifically, points numbered 3, 8, and 13 were positioned near the sandstone–mudstone interfaces to specifically record the vibration response at the locations of the weak layers.
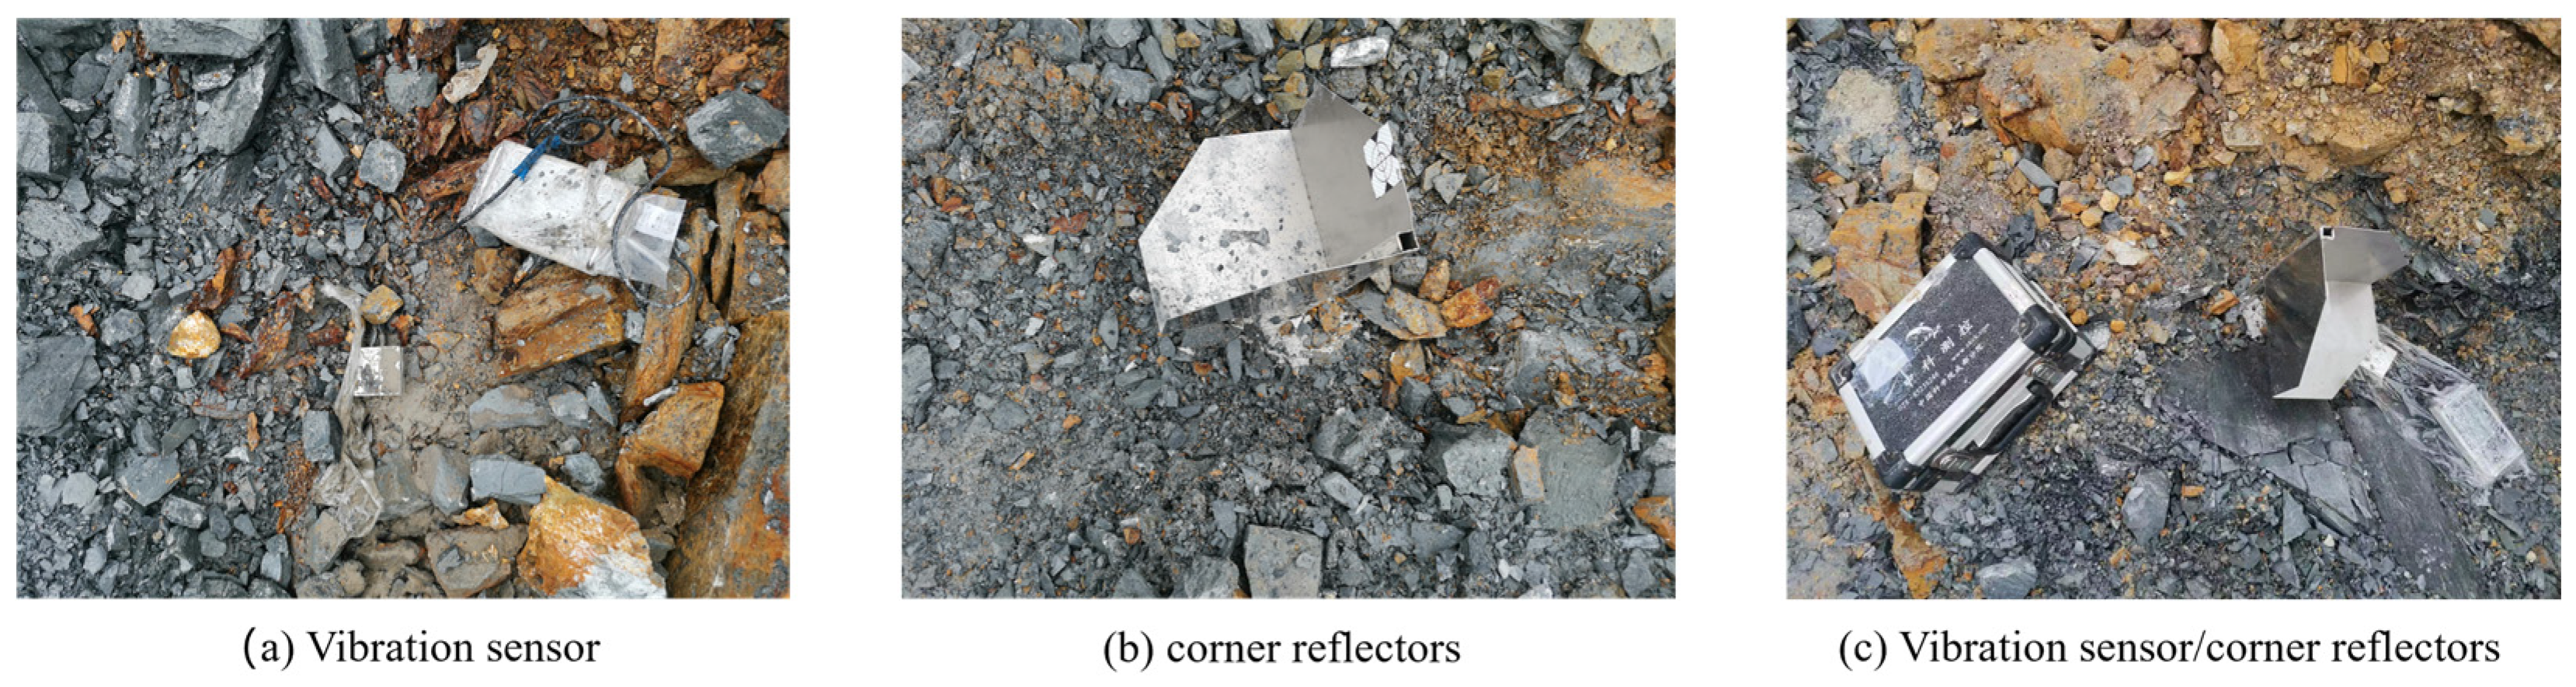
During the deployment of the radar equipment, factors such as the observation range, signal line-of-sight, observation angle, and safe distance were fully considered to ensure the accuracy and validity of the monitoring data. To avoid the impact of blast flyrock, the radar was positioned in a safe area in front of the slope, with its installation angle adjusted to be nearly perpendicular to the slope surface, thereby optimizing the quality of the reflected signal. The field arrangement of the various monitoring devices is shown in
Figure 3.
The experiment involved three blasting events on different slope sections. The collected data encompassed tri-directional vibration velocities and full displacement time-histories, with the complete waveforms from each blast serving as the basis for numerical model verification and dynamic response analysis.
2.3. Rock Dynamic Property Experiments
To further elucidate the differences in the dynamic response between sandstone and mudstone, ultrasonic wave velocity tests and dynamic splitting tests using a Split Hopkinson Pressure Bar (SHPB) were conducted. Combined with the results from static mechanical tests, both the dynamic and static mechanical parameters of the rocks were obtained for use as numerical simulation inputs and for determining the failure criteria of the weak layers.
- (1)
Specimen Preparation and General Procedure
Representative sandstone and mudstone cores were selected based on the field drilling results. The samples were processed into disc-shaped specimens with a diameter of 50 mm and a height of 25 mm via mechanical cutting and precision grinding. The testing procedure was as follows: ultrasonic transmission tests were first performed to determine the compressive (P-) and shear (S-) wave velocities and to calculate the dynamic elastic parameters; subsequently, dynamic Brazilian splitting tests were conducted using the SHPB apparatus to establish the relationship between the dynamic tensile strength of the mudstone and the applied strain rate.
- (2)
Ultrasonic Testing and Acquisition of Dynamic Elastic Parameters
The pulse transmission method was used to determine the compressive (P-) wave and shear (S-) wave velocities of the specimens. Statistical results for the wave velocities were obtained from multiple measurements on various rock samples, and the dynamic elastic modulus and dynamic Poisson’s ratio were calculated based on the theory of elastic wave propagation. The test results indicated that the P-wave velocity of sandstone was significantly higher than that of mudstone, and its dynamic elastic modulus was correspondingly larger, demonstrating a greater wave propagation capability and stiffness. The ultrasonic test results were used to define the dynamic mechanical input parameters for the rock mass in the numerical model. Representative results are presented in
Table 1.
- (3)
Dynamic Brazilian Splitting Test Using SHPB
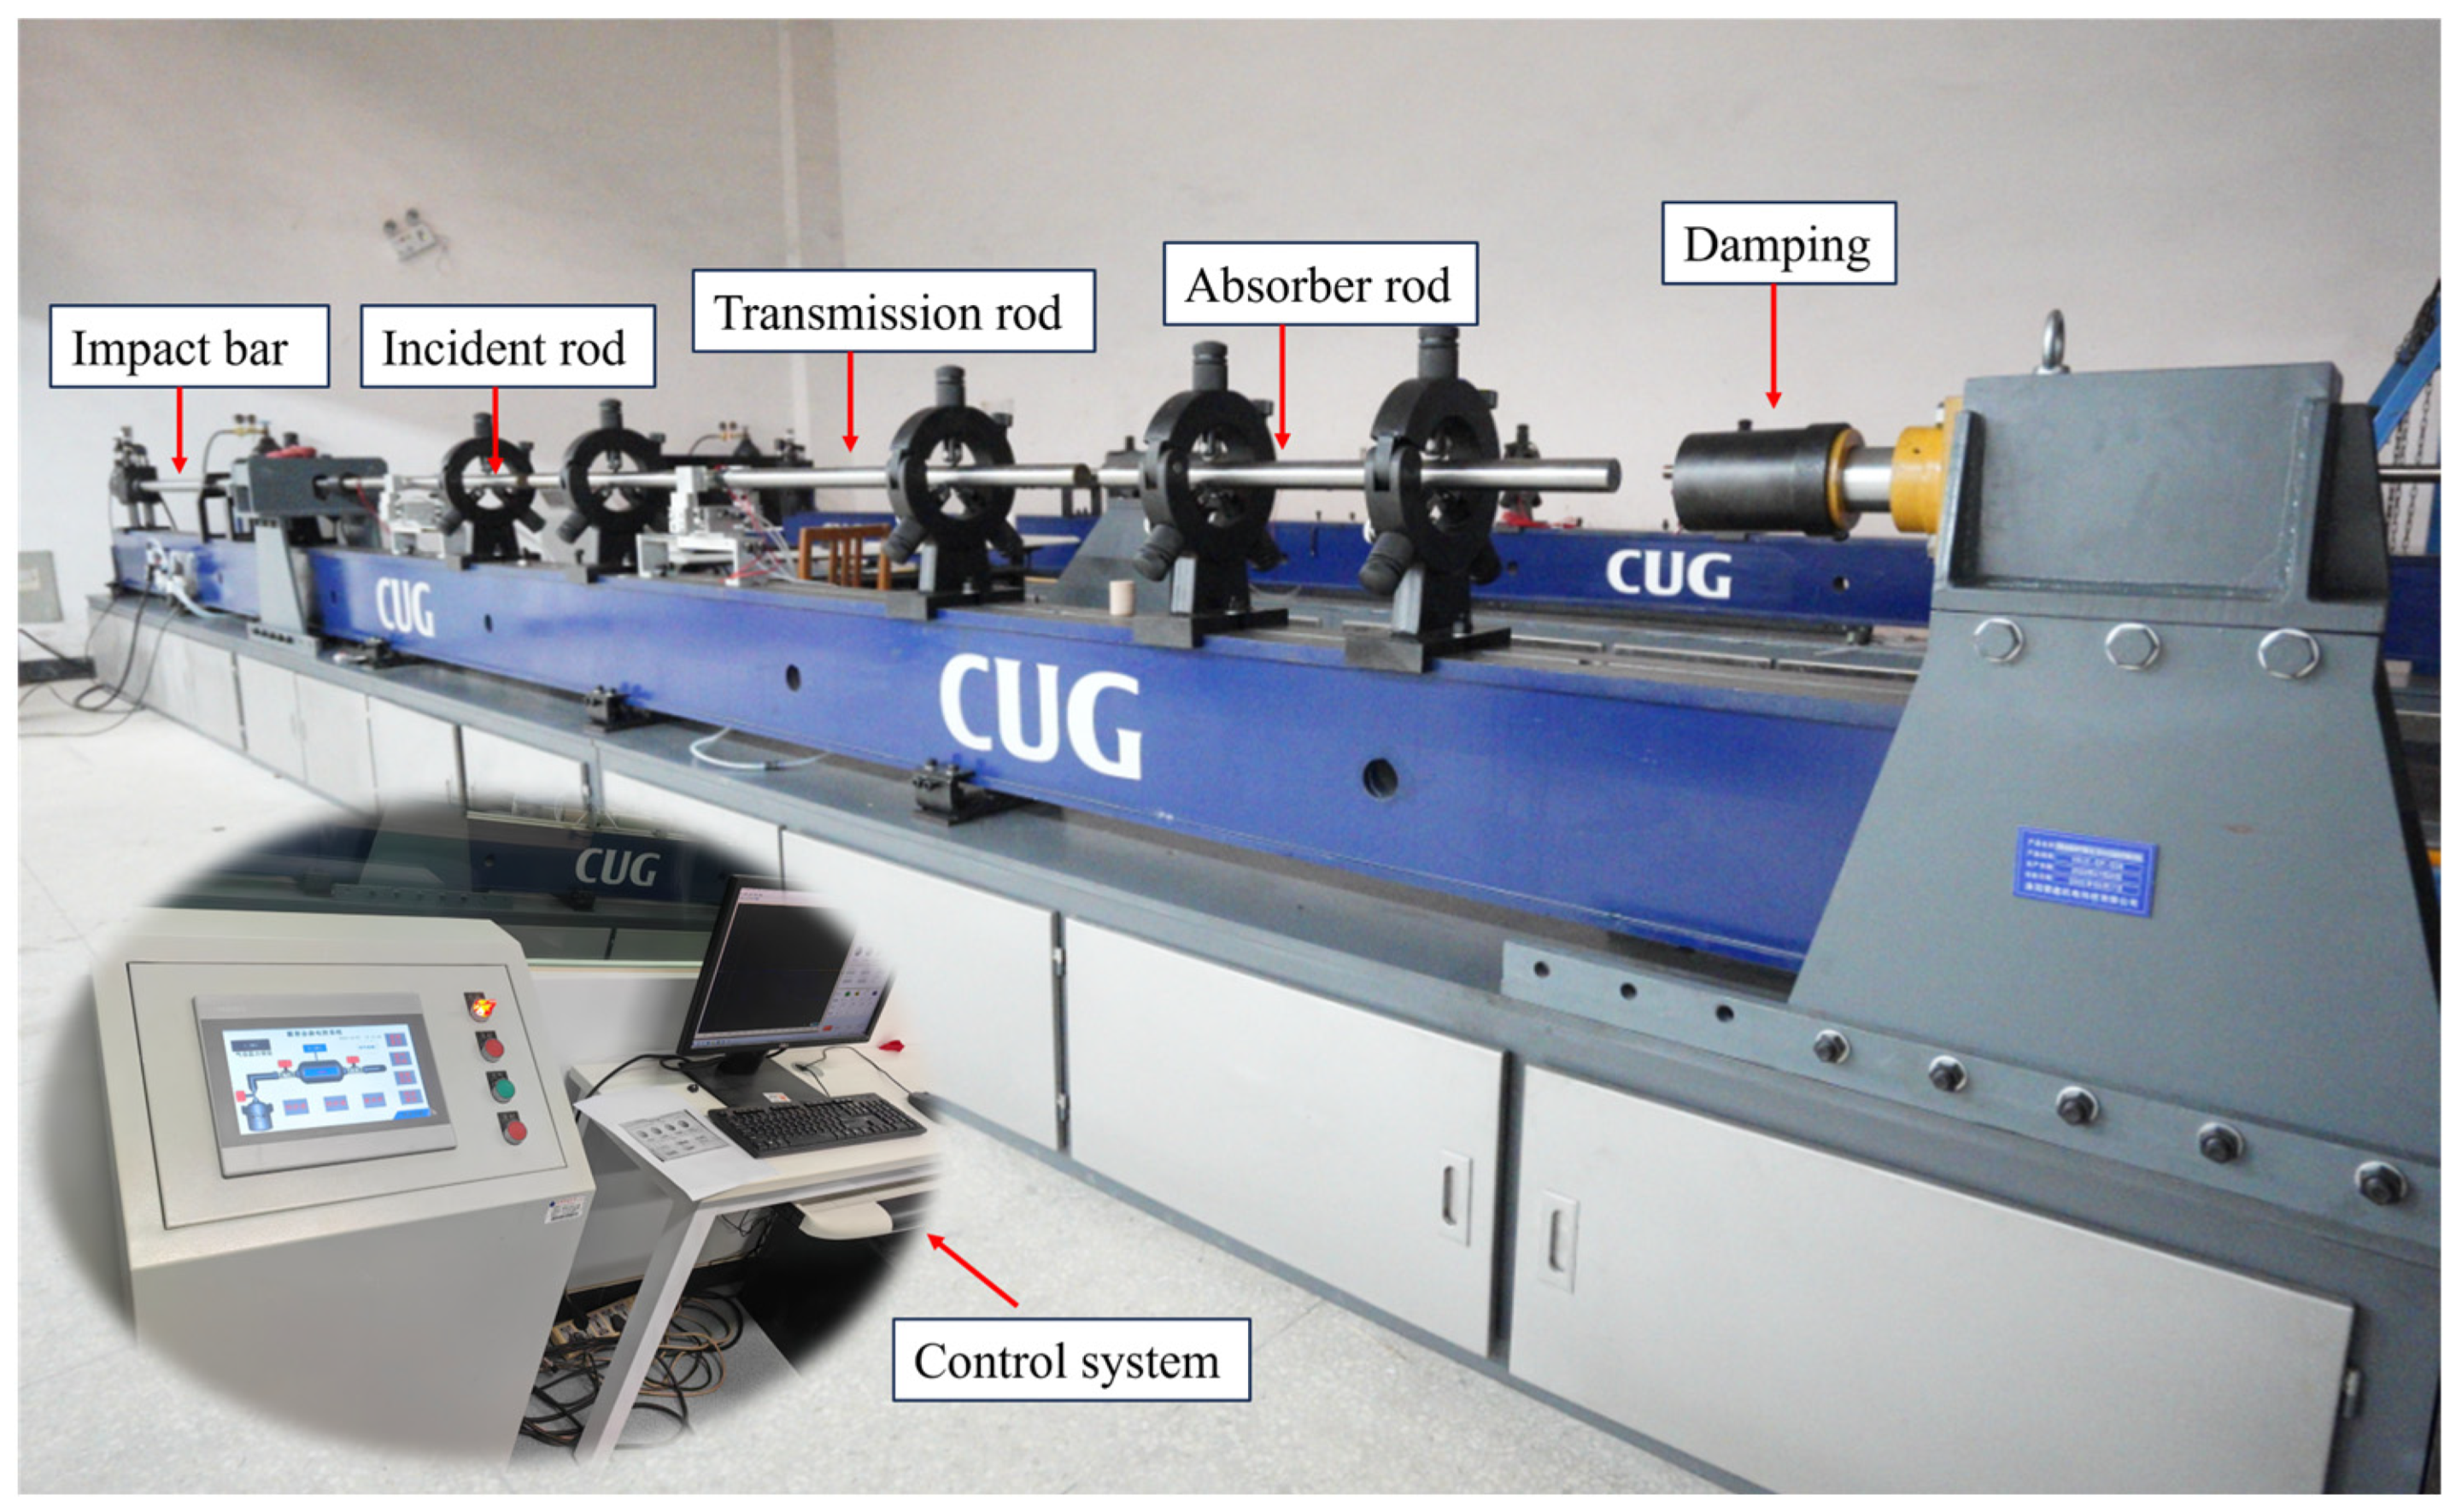
Dynamic tensile tests on the rocks were performed using a Split Hopkinson Pressure Bar (SHPB) system. The setup, illustrated in
Figure 4, comprises an incident bar, a transmission bar, and an energy absorption bar, all with a diameter of 50 mm. The strain rate was controlled by adjusting the air pressure applied to the striker bar, with five different pressure levels set for the tests. The Brazilian disc method was employed. The incident, reflected, and transmitted wave signals were recorded, and the stress–strain curves of the specimens were determined based on one-dimensional stress wave theory using Equations (1) and (2) [
16]. A statistical summary of the specific test results is presented in
Table 2.
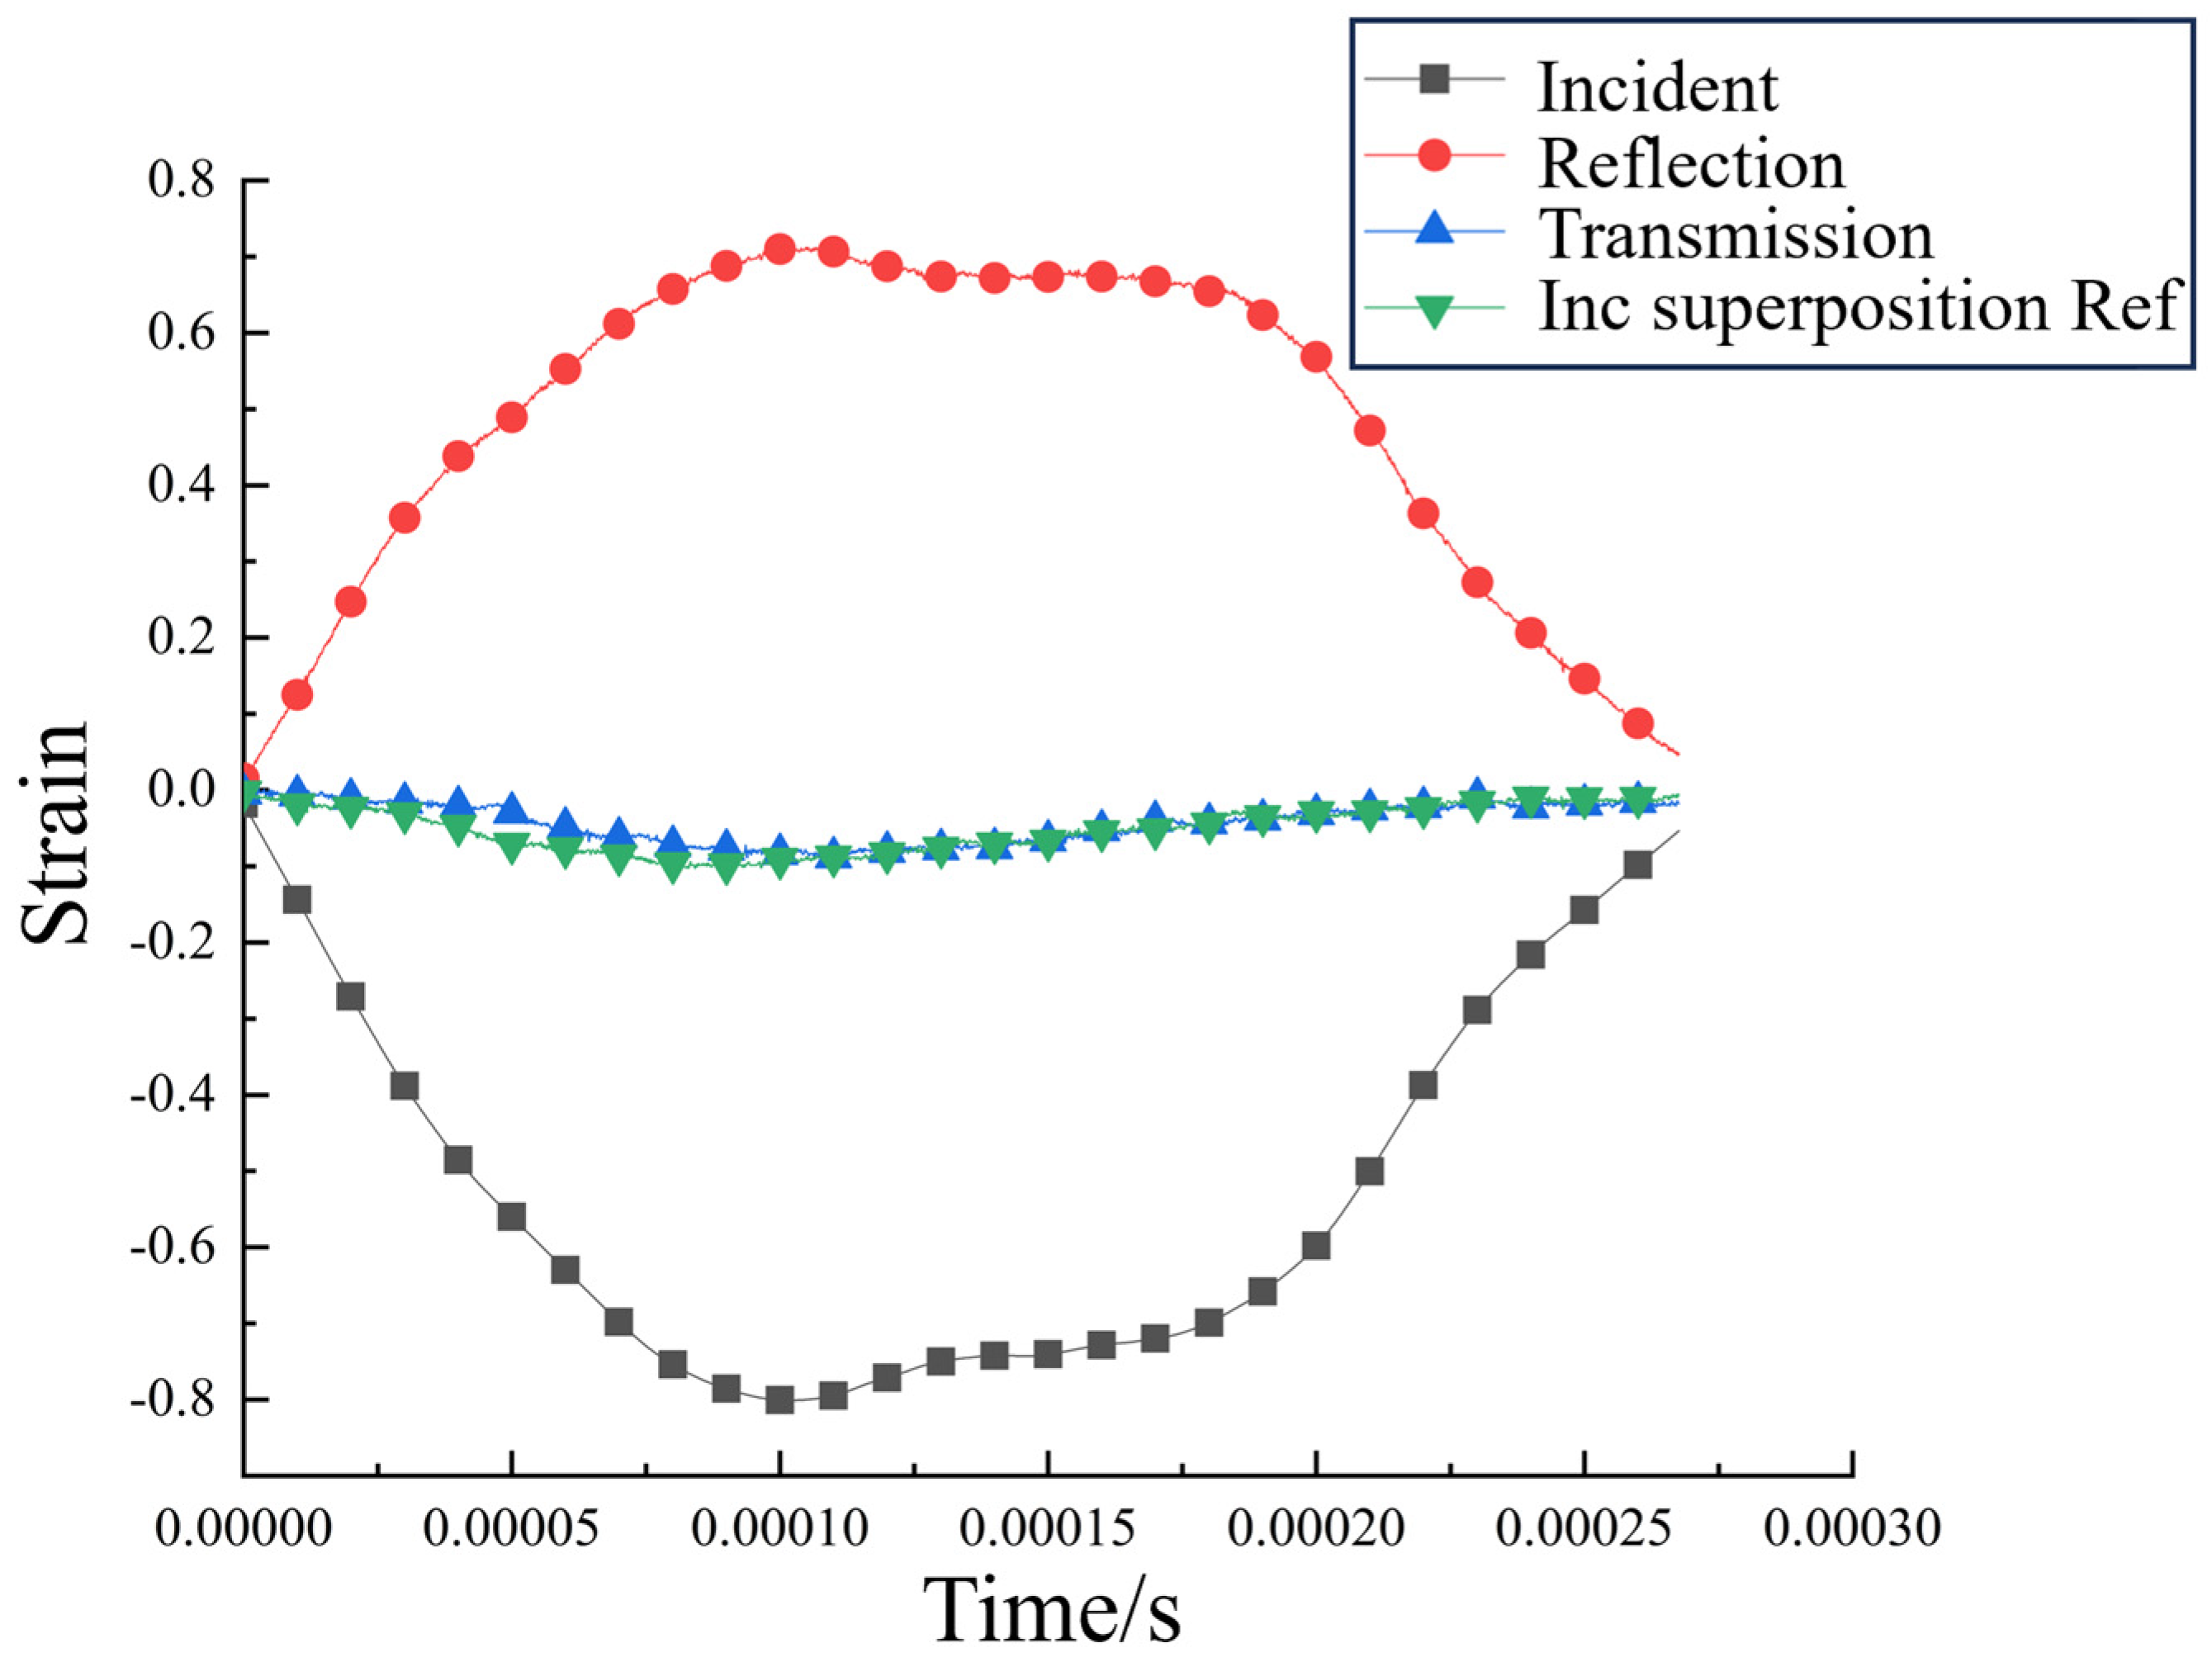
Figure 5 shows the typical waveforms from the incident and transmission bars recorded during a test on a mudstone specimen (Specimen #5).
As shown in
Figure 4, the sum of the incident and reflected waves essentially coincides with the transmitted wave, indicating that stress equilibrium was achieved in the specimen during the test and that the results are highly reliable. The data presented in
Table 2 demonstrate that higher impact velocities result in increased strain rates in the rock specimens, which in turn leads to a rise in their dynamic tensile strength. This confirms a significant strain rate dependence of the dynamic tensile strength in mudstone.
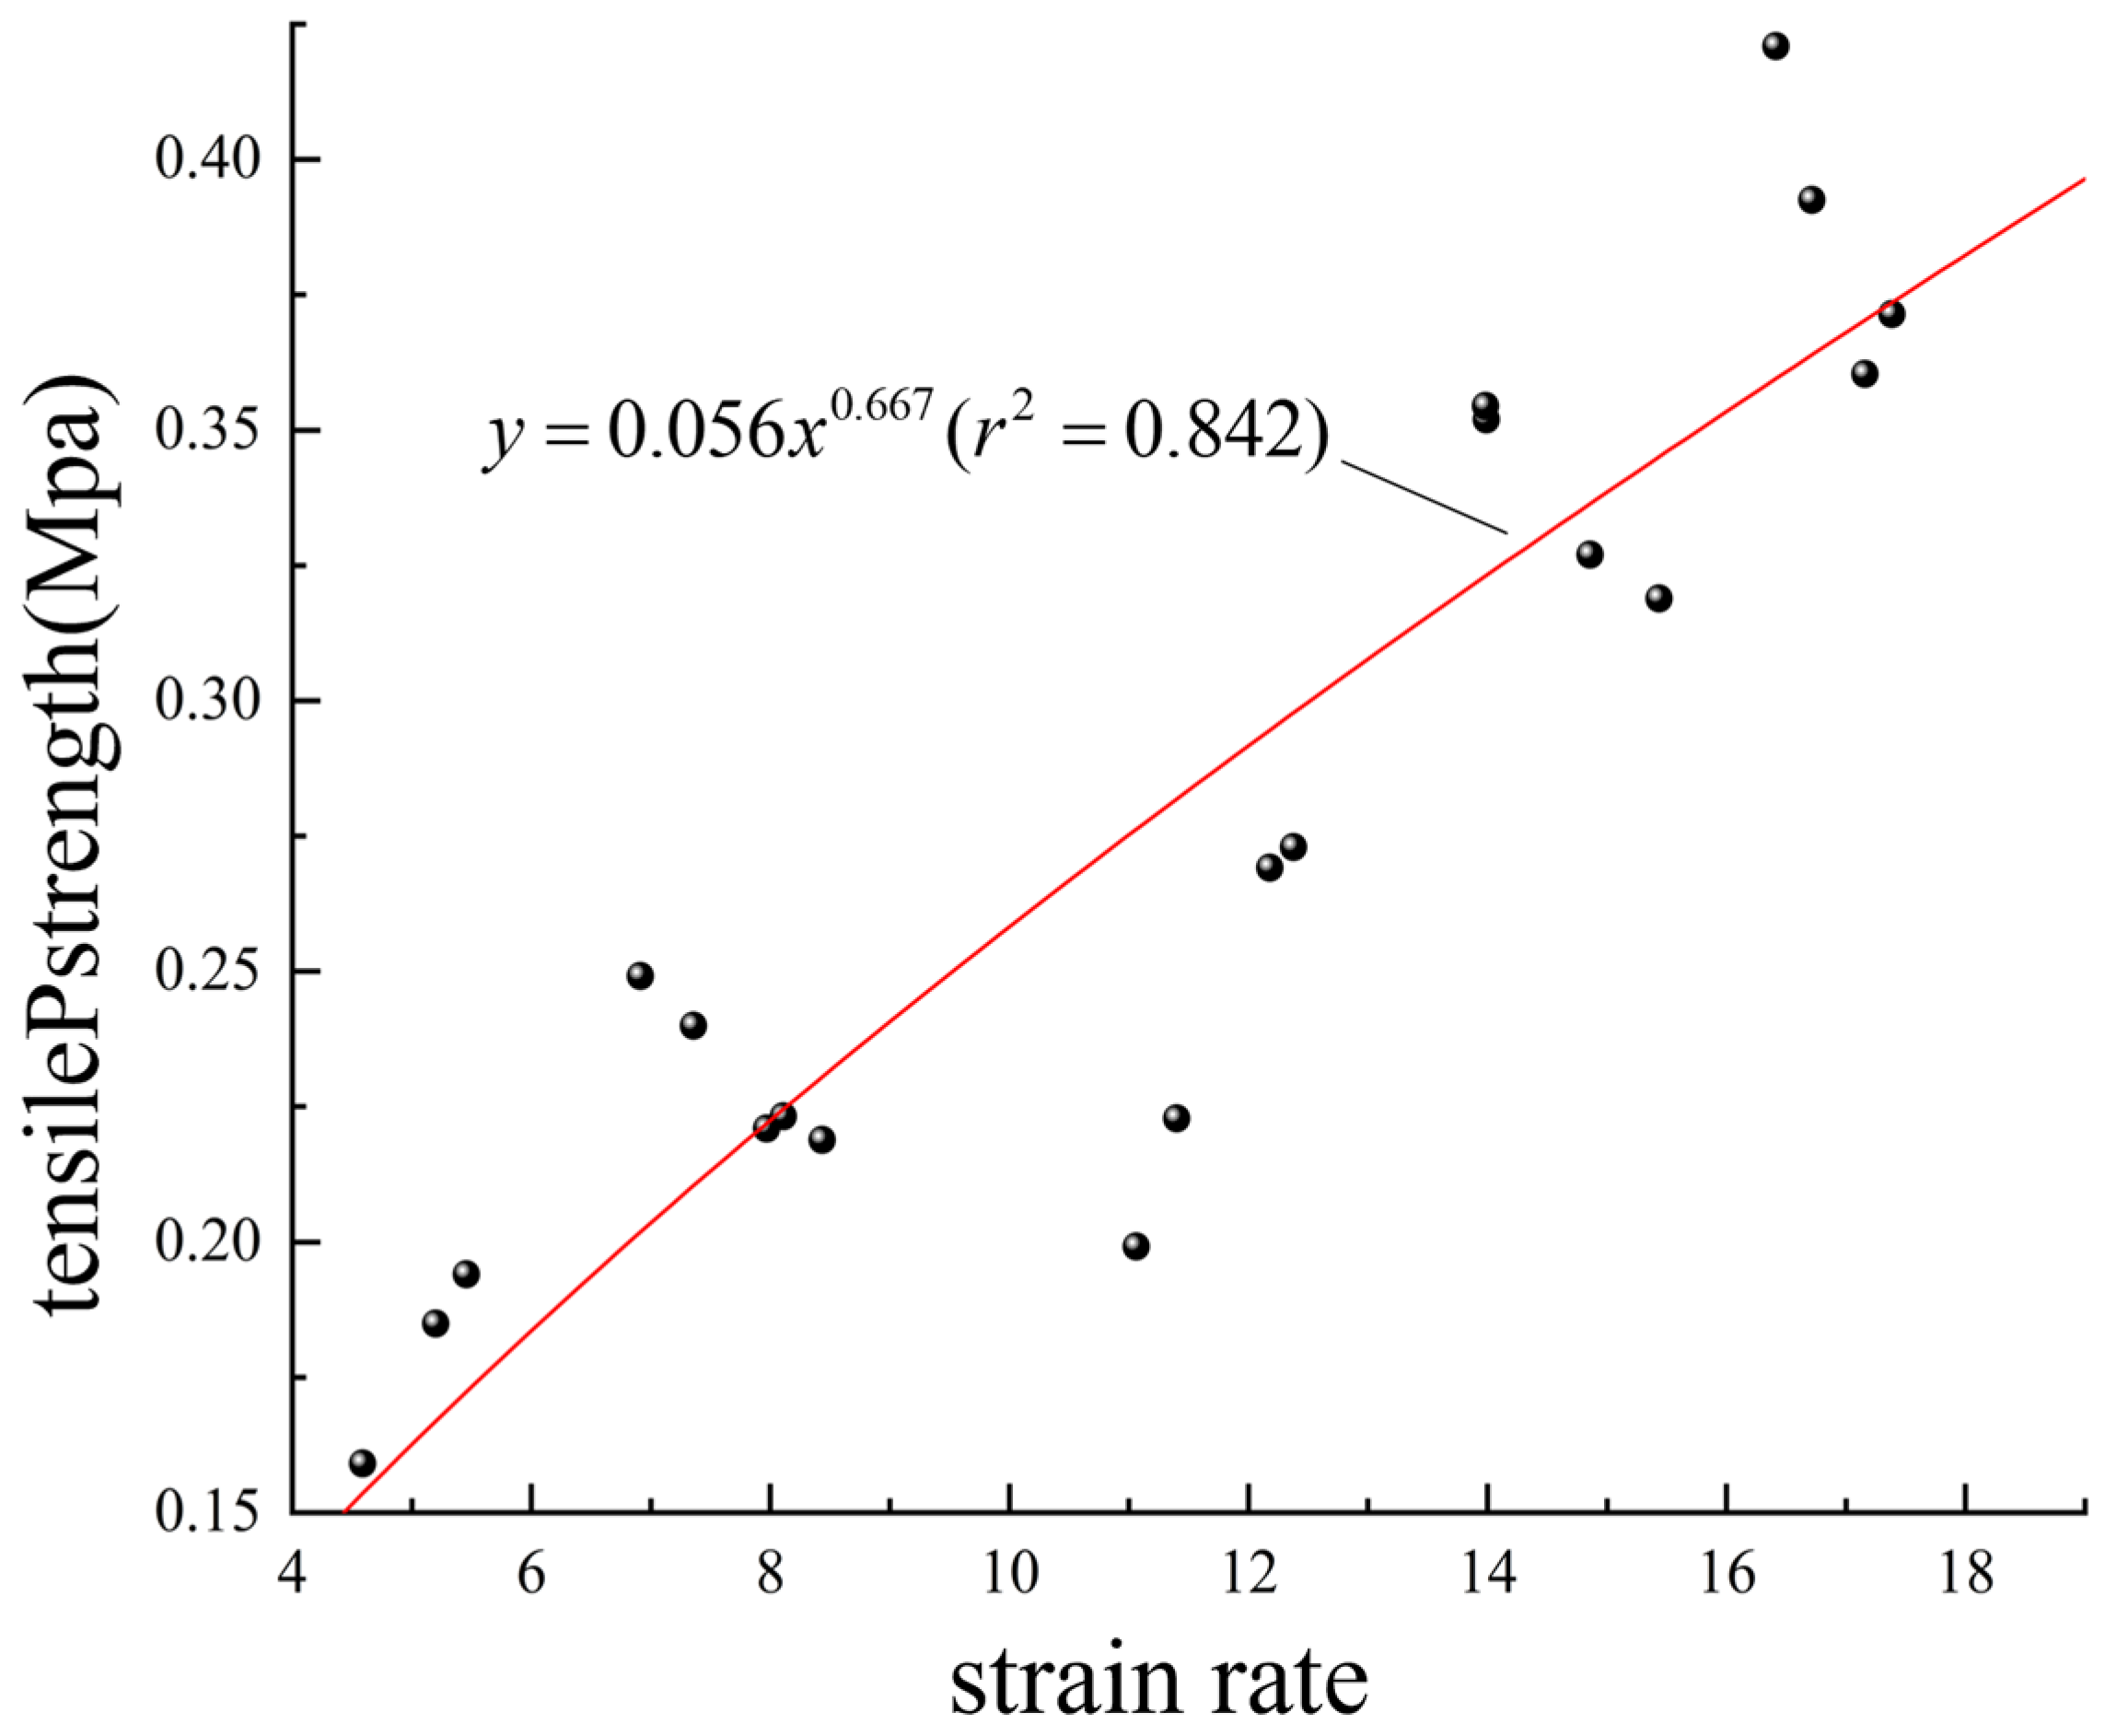
To quantitatively characterize the relationship between the dynamic tensile strength of mudstone and the strain rate, a nonlinear curve fitting was performed on the data obtained from all 22 tests. The fitting result is shown in
Figure 6, with a coefficient of determination (R
2) of 0.84, indicating a good fit and confirming a stable quantitative correlation between the tensile strength and the strain rate. This finding implies that in practical engineering scenarios, the dynamic tensile strength of mudstone can be predicted based on this established quantitative relationship for a given strain rate level. Consequently, it provides a valuable reference for evaluating slope stability under blasting vibrations.
The SHPB test strain rates (~5–17 s−1) employed in this study aim to simulate the dynamic loading conditions induced when blast stress waves propagate to weak layers in the mid-to-far field of slopes. This range aligns with engineering estimates for strain rates of rock particles at comparable distances. To ensure the reliability of material parameters in numerical simulations, a conservative dynamic tensile strength value based on experimental data was adopted. The overall validity of the model has been verified through field measurements of macroscopic vibration responses. Consequently, the laboratory parameters effectively support the analysis of wave-induced cracking mechanisms in weak layers.
3. Numerical Simulation
To gain deeper insight into the dynamic response and fracture mechanisms of weak layers in sandstone–mudstone interbedded slopes under blasting loads, and to compensate for the limitations of field tests, this study conducted a systematic numerical simulation analysis using the ANSYS/LS-DYNA finite element software. The simulation aimed to replicate the dynamic process of the field blasting tests, validate the reliability of the model, and, based on this, reveal the influence of bedding plane orientation on the fracture characteristics of the weak layers through a parametric study.
3.1. Model Setup and Boundary Conditions
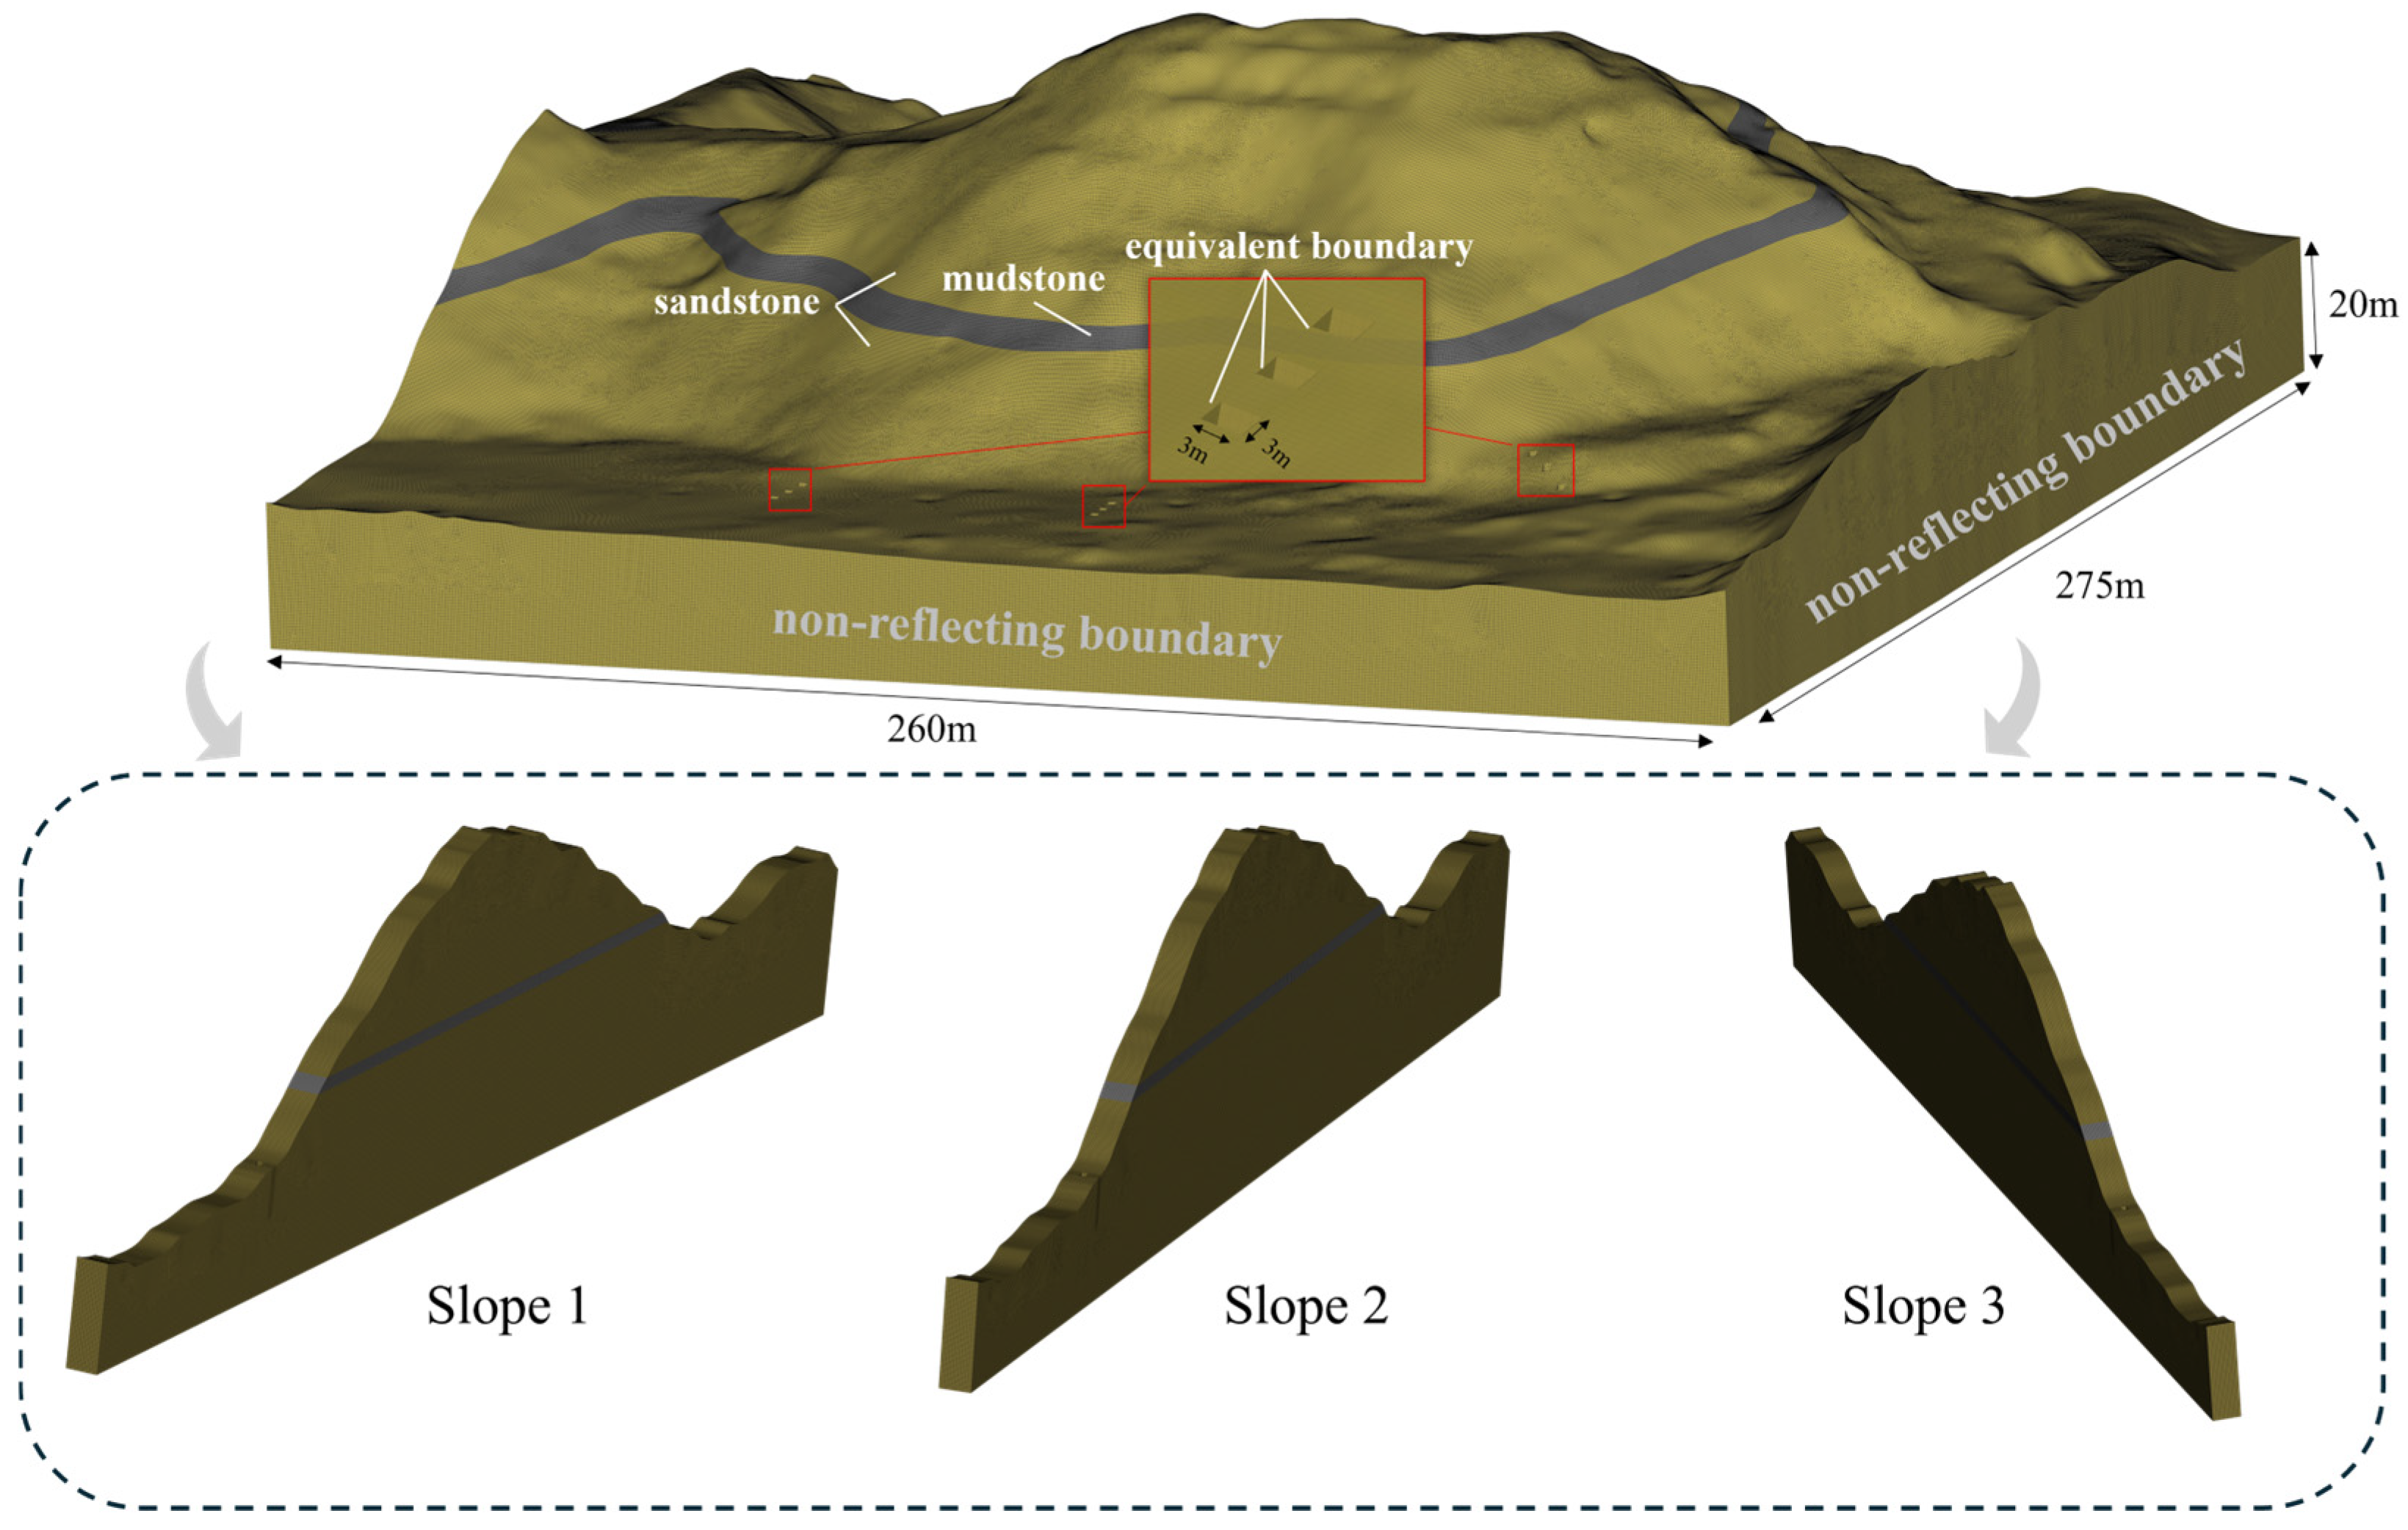
A detailed three-dimensional numerical model was established based on the actual geological structure and geometry of the field test slope. The overall model dimensions are 275 m (length) × 260 m (width) × 20 m (depth), accurately reproducing the interbedded structure of sandstone and mudstone. The model was meshed with SOLID164 solid elements, totaling over 1.81 million elements. To ensure computational accuracy while maintaining efficiency, the mesh was refined in potential fracture zones (the mudstone layers and adjacent areas).
Non-reflective boundary conditions were applied to the bottom and all four lateral surfaces of the model to simulate an infinite domain, effectively absorbing outgoing stress waves and preventing interference from boundary reflections on the slope’s dynamic response. The ground surface was set as a free boundary. The model geometry and boundary conditions are shown in
Figure 7.
3.2. Material Parameters and Computational Setup
The sandstone and mudstone materials in the model were both described using the *MAT_PLASTIC_KINEMATIC kinematic hardening model [
17]. This model incorporates the strengthening effect of yield stress with strain rate via the Cowper–Symonds constitutive relationship, expressed as:
In the equation,
represents the static yield stress,
denotes the equivalent plastic strain rate, and C and P are strain rate parameters. Based on the dynamic tensile strength–strain rate relationship for mudstone obtained from the SHPB dynamic splitting test in
Section 2.3 (
Figure 6), C and P were calibrated to ensure the model reasonably reflects the rate-dependent behaviour of mudstone strength within typical blasting loading strain rates. The material parameters were primarily determined based on the laboratory rock mechanics test results described in
Section 2, with the specific values listed in
Table 3.
Given the large scale of the field test slope and the relatively small size of the blast holes, directly simulating the explosive detonation would cause mesh distortion and computational difficulties. Therefore, this study adopted the equivalent blast load method, which has been validated in engineering practice [
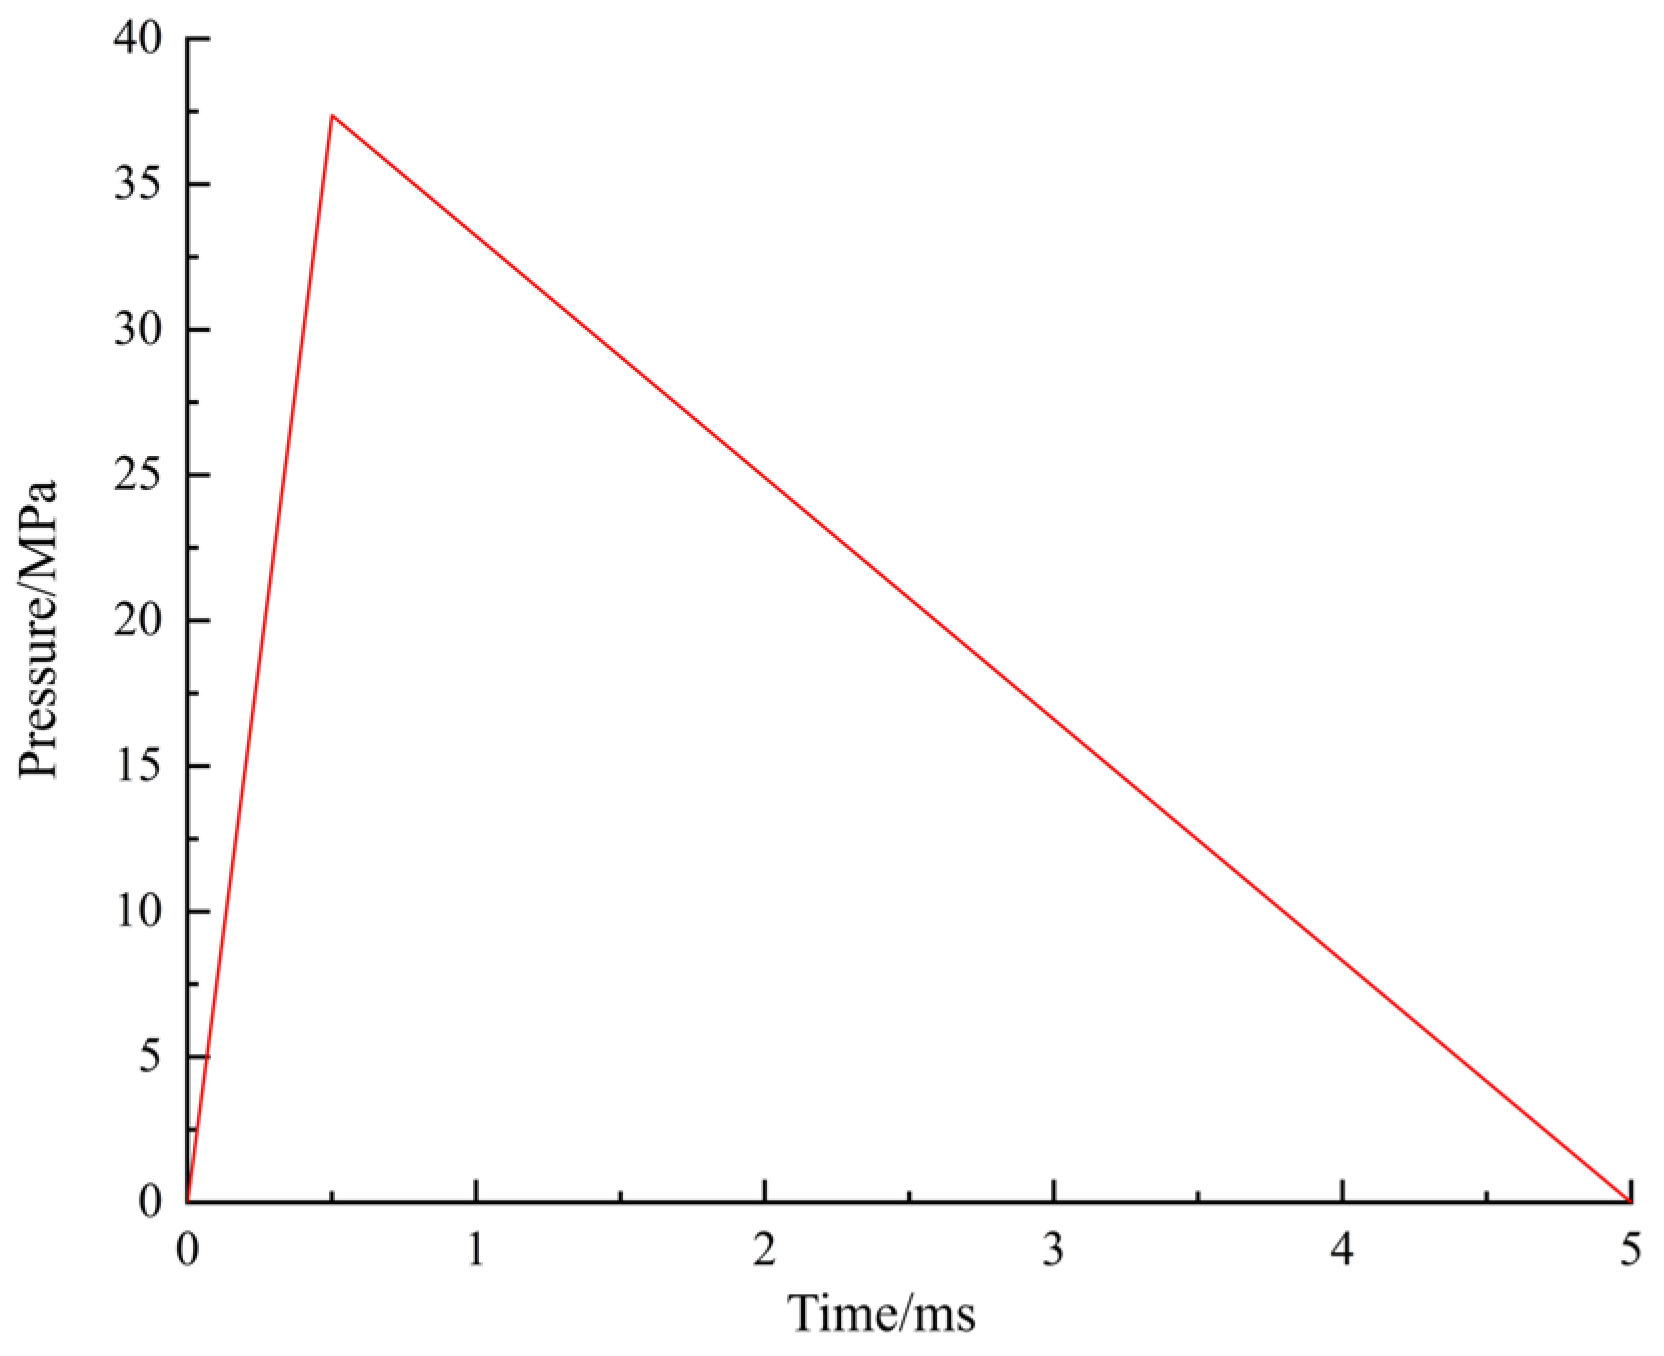
18]. The impact load generated by the explosion was equivalently represented as a triangular pressure–time history curve applied to an equivalent elastic boundary surrounding the blast hole area, derived via theoretical calculation. This equivalent load had a peak pressure of 37.36 MPa, a rise time of 0.5 ms, and a positive pressure duration of 5 ms. The applied load curve is shown in
Figure 8. This method effectively simulates the propagation characteristics of the blast-induced stress wave in the medium-to-far field and significantly improves computational efficiency. This method is designed to efficiently simulate the overall dynamic response in the far field during blasting. However, it cannot accurately reproduce the high-pressure gradients and high-frequency components in the near field, making it unsuitable for near-field fragmentation or high-frequency damage analysis. Nevertheless, for macroscopic tensile cracking initiated by stress waves propagating into weak layers, the cracking is primarily governed by attenuated stress waves dominated by low frequencies. Therefore, load simplification is reasonable for this core process.
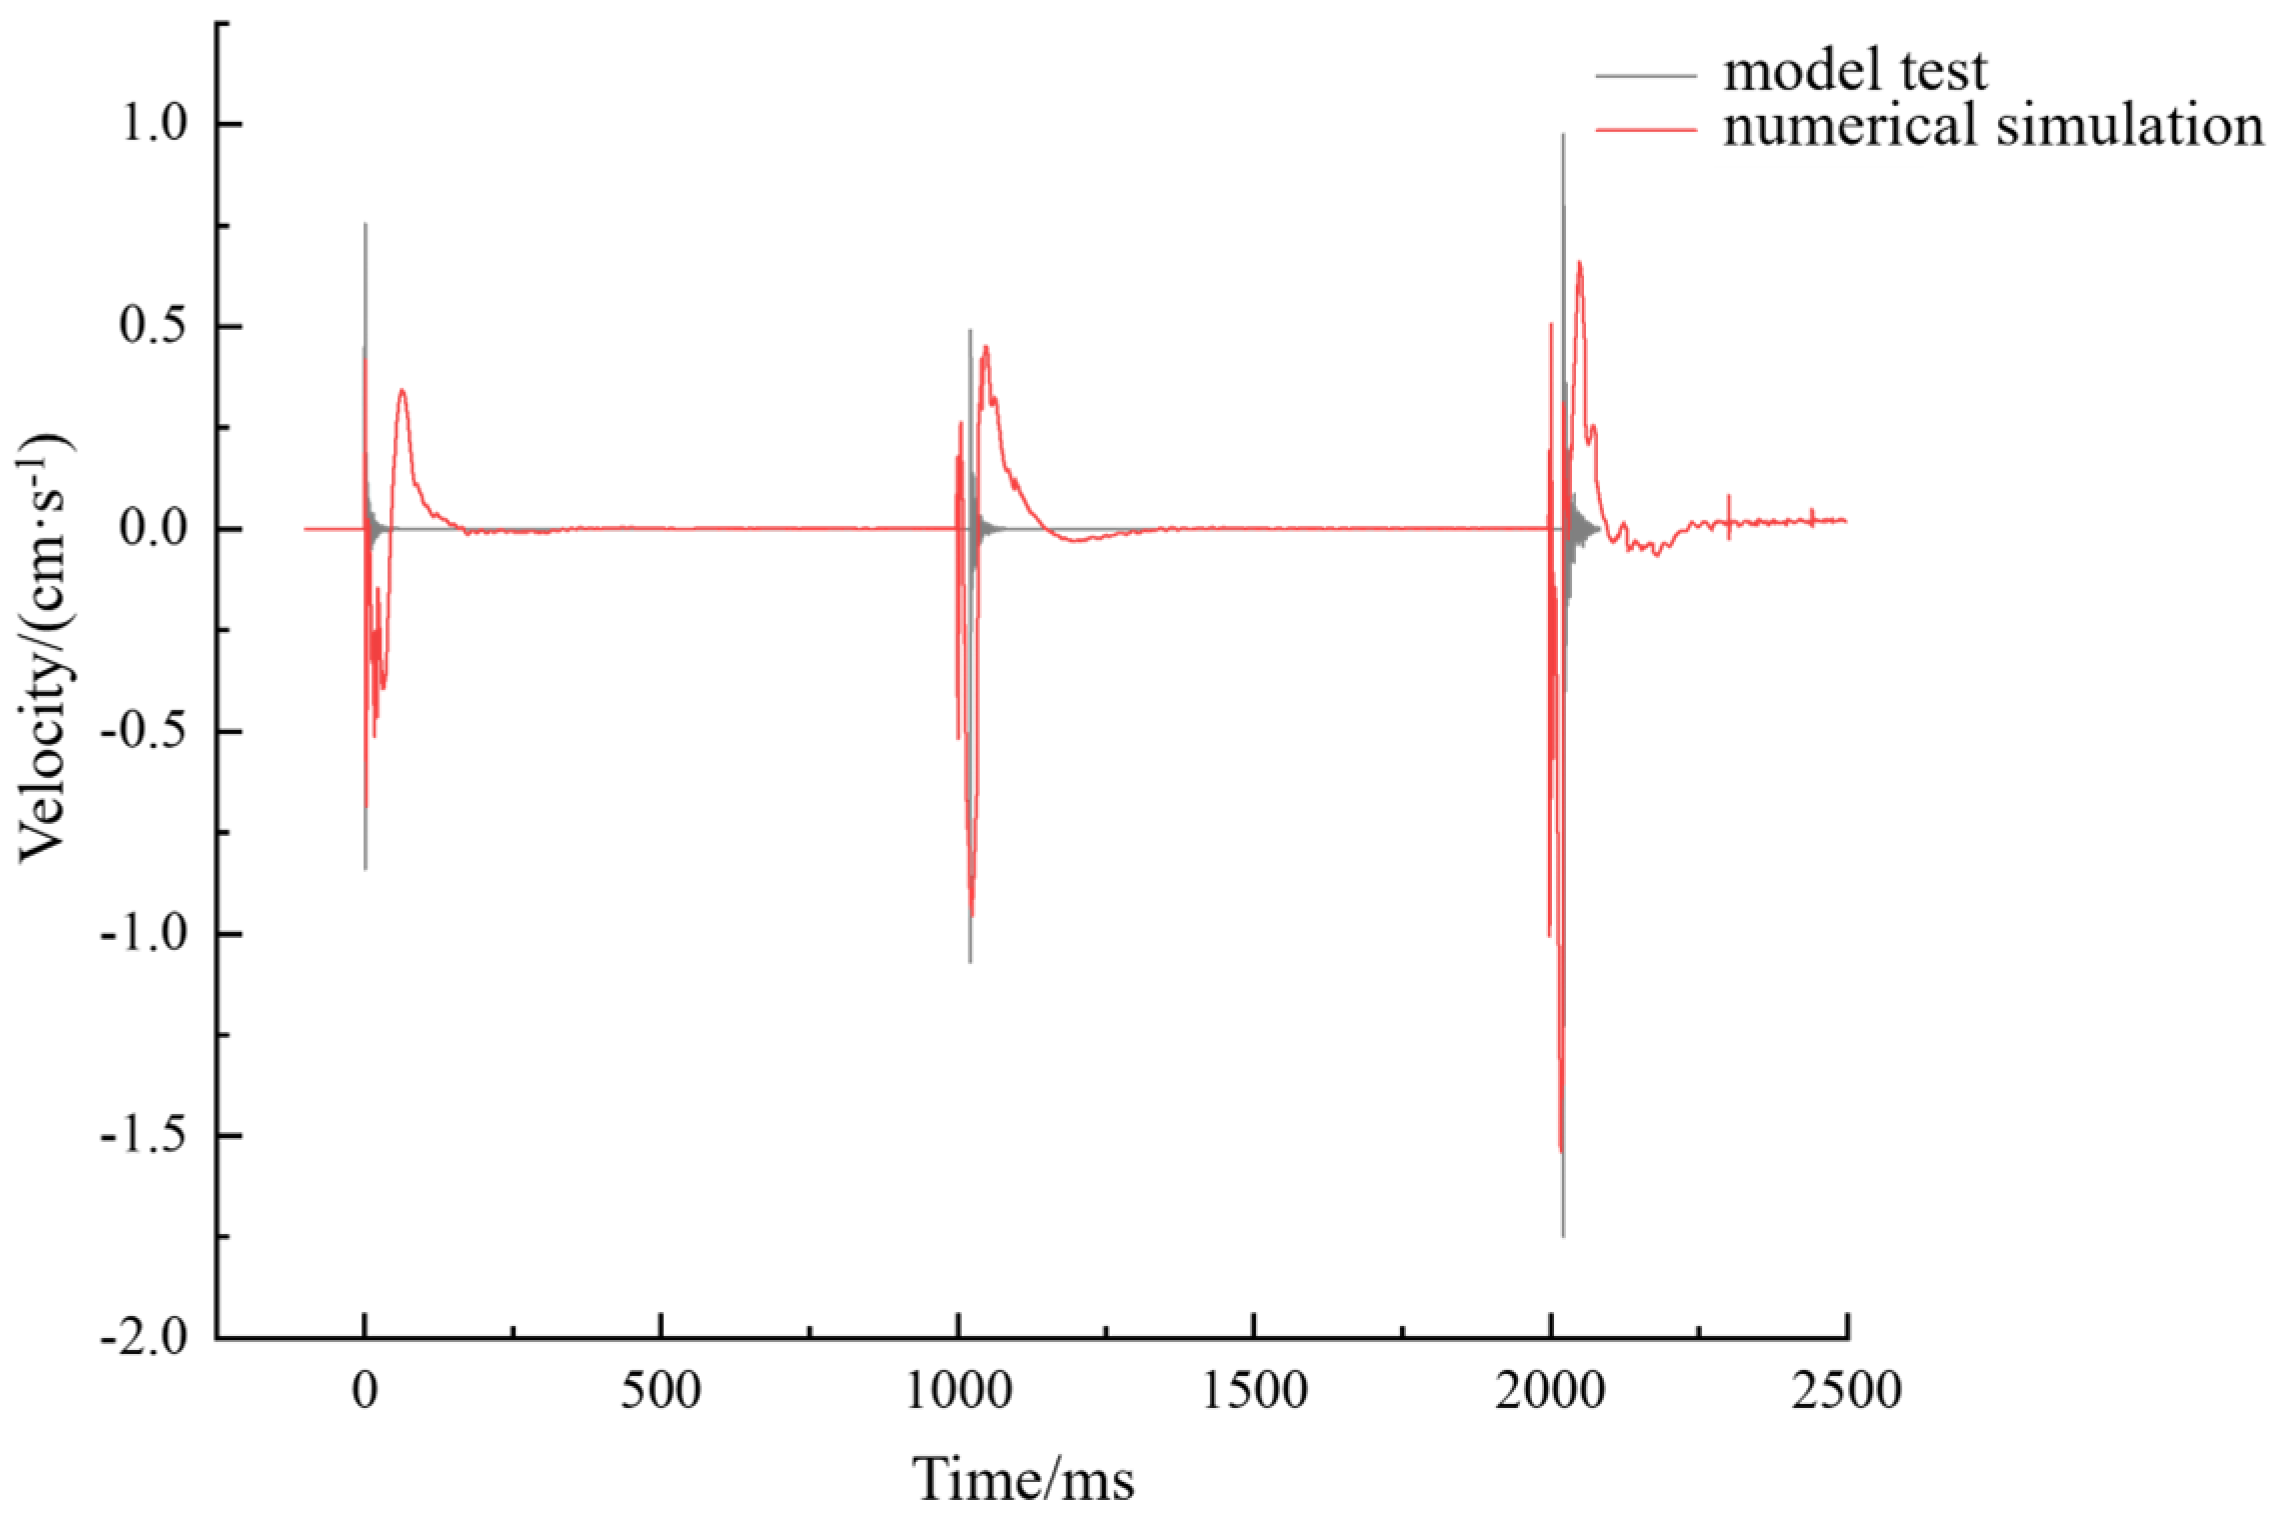
To rigorously validate the reliability of the numerical model, the initial verification model fully replicated the field test blasting conditions. Specifically, the equivalent loads were applied sequentially at the locations of the three blast holes at the slope toe, with a time interval of 1.0 s between each load to simulate the sequential initiation process used in the field.
It should be noted that after the model was validated and used for the systematic study of the influence of bedding parameters on the fracture characteristics of the weak layers, a single blast source model was employed in all subsequent parametric analyses. This simplification, involving the application of the equivalent blast load only at the borehole closest to the weak layer under investigation, was implemented to more clearly analyze the interaction between the blast stress wave and a single weak layer and to reduce the complexity introduced by the superposition of stress waves from multiple blast sources. This approach helps to focus on the core scientific issue and clarify the dynamic response and crack initiation mechanism of the weak layer under a single blast disturbance.
To simulate the tensile failure process of the mudstone weak layer under blasting vibration, the *MAT_ADD_EROSION keyword was introduced into the mudstone material [
19,
20]. Based on the SHPB dynamic splitting test results, the dynamic tensile strength threshold for mudstone was set to 0.30 MPa (considering the most unfavorable condition). When the maximum principal stress of an element exceeds this threshold, the element is deleted, thereby intuitively representing the initiation and propagation of cracks.
3.3. Model Validation
The reliability of the model was validated by comparing the numerical results from the three-blast-source model with the monitoring data obtained from the field tests. The comparison focused on the Peak Particle Velocity (PPV) in three orthogonal directions at various monitoring points on the slope surface: X (horizontal direction towards the blast source), Y (horizontal direction perpendicular to the line connecting the point and the blast source), and Z (vertical direction).
The comparative results presented in
Table 4 demonstrate that the PPV values obtained from the numerical simulation agree well with the field-measured data in terms of both variation trend and magnitude. The relative errors for most monitoring points are controlled within 20%, with the maximum relative error of 23% observed in the X-direction at point S6. This discrepancy is likely attributable to the inherent heterogeneity of the in situ rock mass in the horizontal direction, which was simplified as a homogeneous material in the model.
Figure 9 shows the vibration velocity–time history curve in the Z-direction at point S6. The waveform characteristics, dominant frequency, and the three sequentially arriving wave peaks (corresponding to the delayed initiation of the three blast holes) in the numerical simulation are essentially consistent with the measured data, demonstrating the reasonableness of the load simulation. This agreement confirms the reasonableness of the blast load simulation. Although the simulated vibration duration is slightly shorter than the measured value, primarily due to the model’s simplification of subtle internal joints and fractures within the rock mass, the model demonstrates sufficient reliability regarding the key parameter of peak particle velocity. Therefore, it is deemed suitable for subsequent extended investigations.
4. Numerical Simulation Results and Discussion
This section, based on the validated numerical model, focuses on analyzing the influence of bedding plane dip angle and interlayer spacing on the dynamic fracture characteristics of the mudstone weak layers within the sandstone–mudstone interbedded slope, aiming to reveal their crack propagation patterns and controlling mechanisms.
4.1. Influence of Bedding Plane Dip Angle on Fracture Characteristics
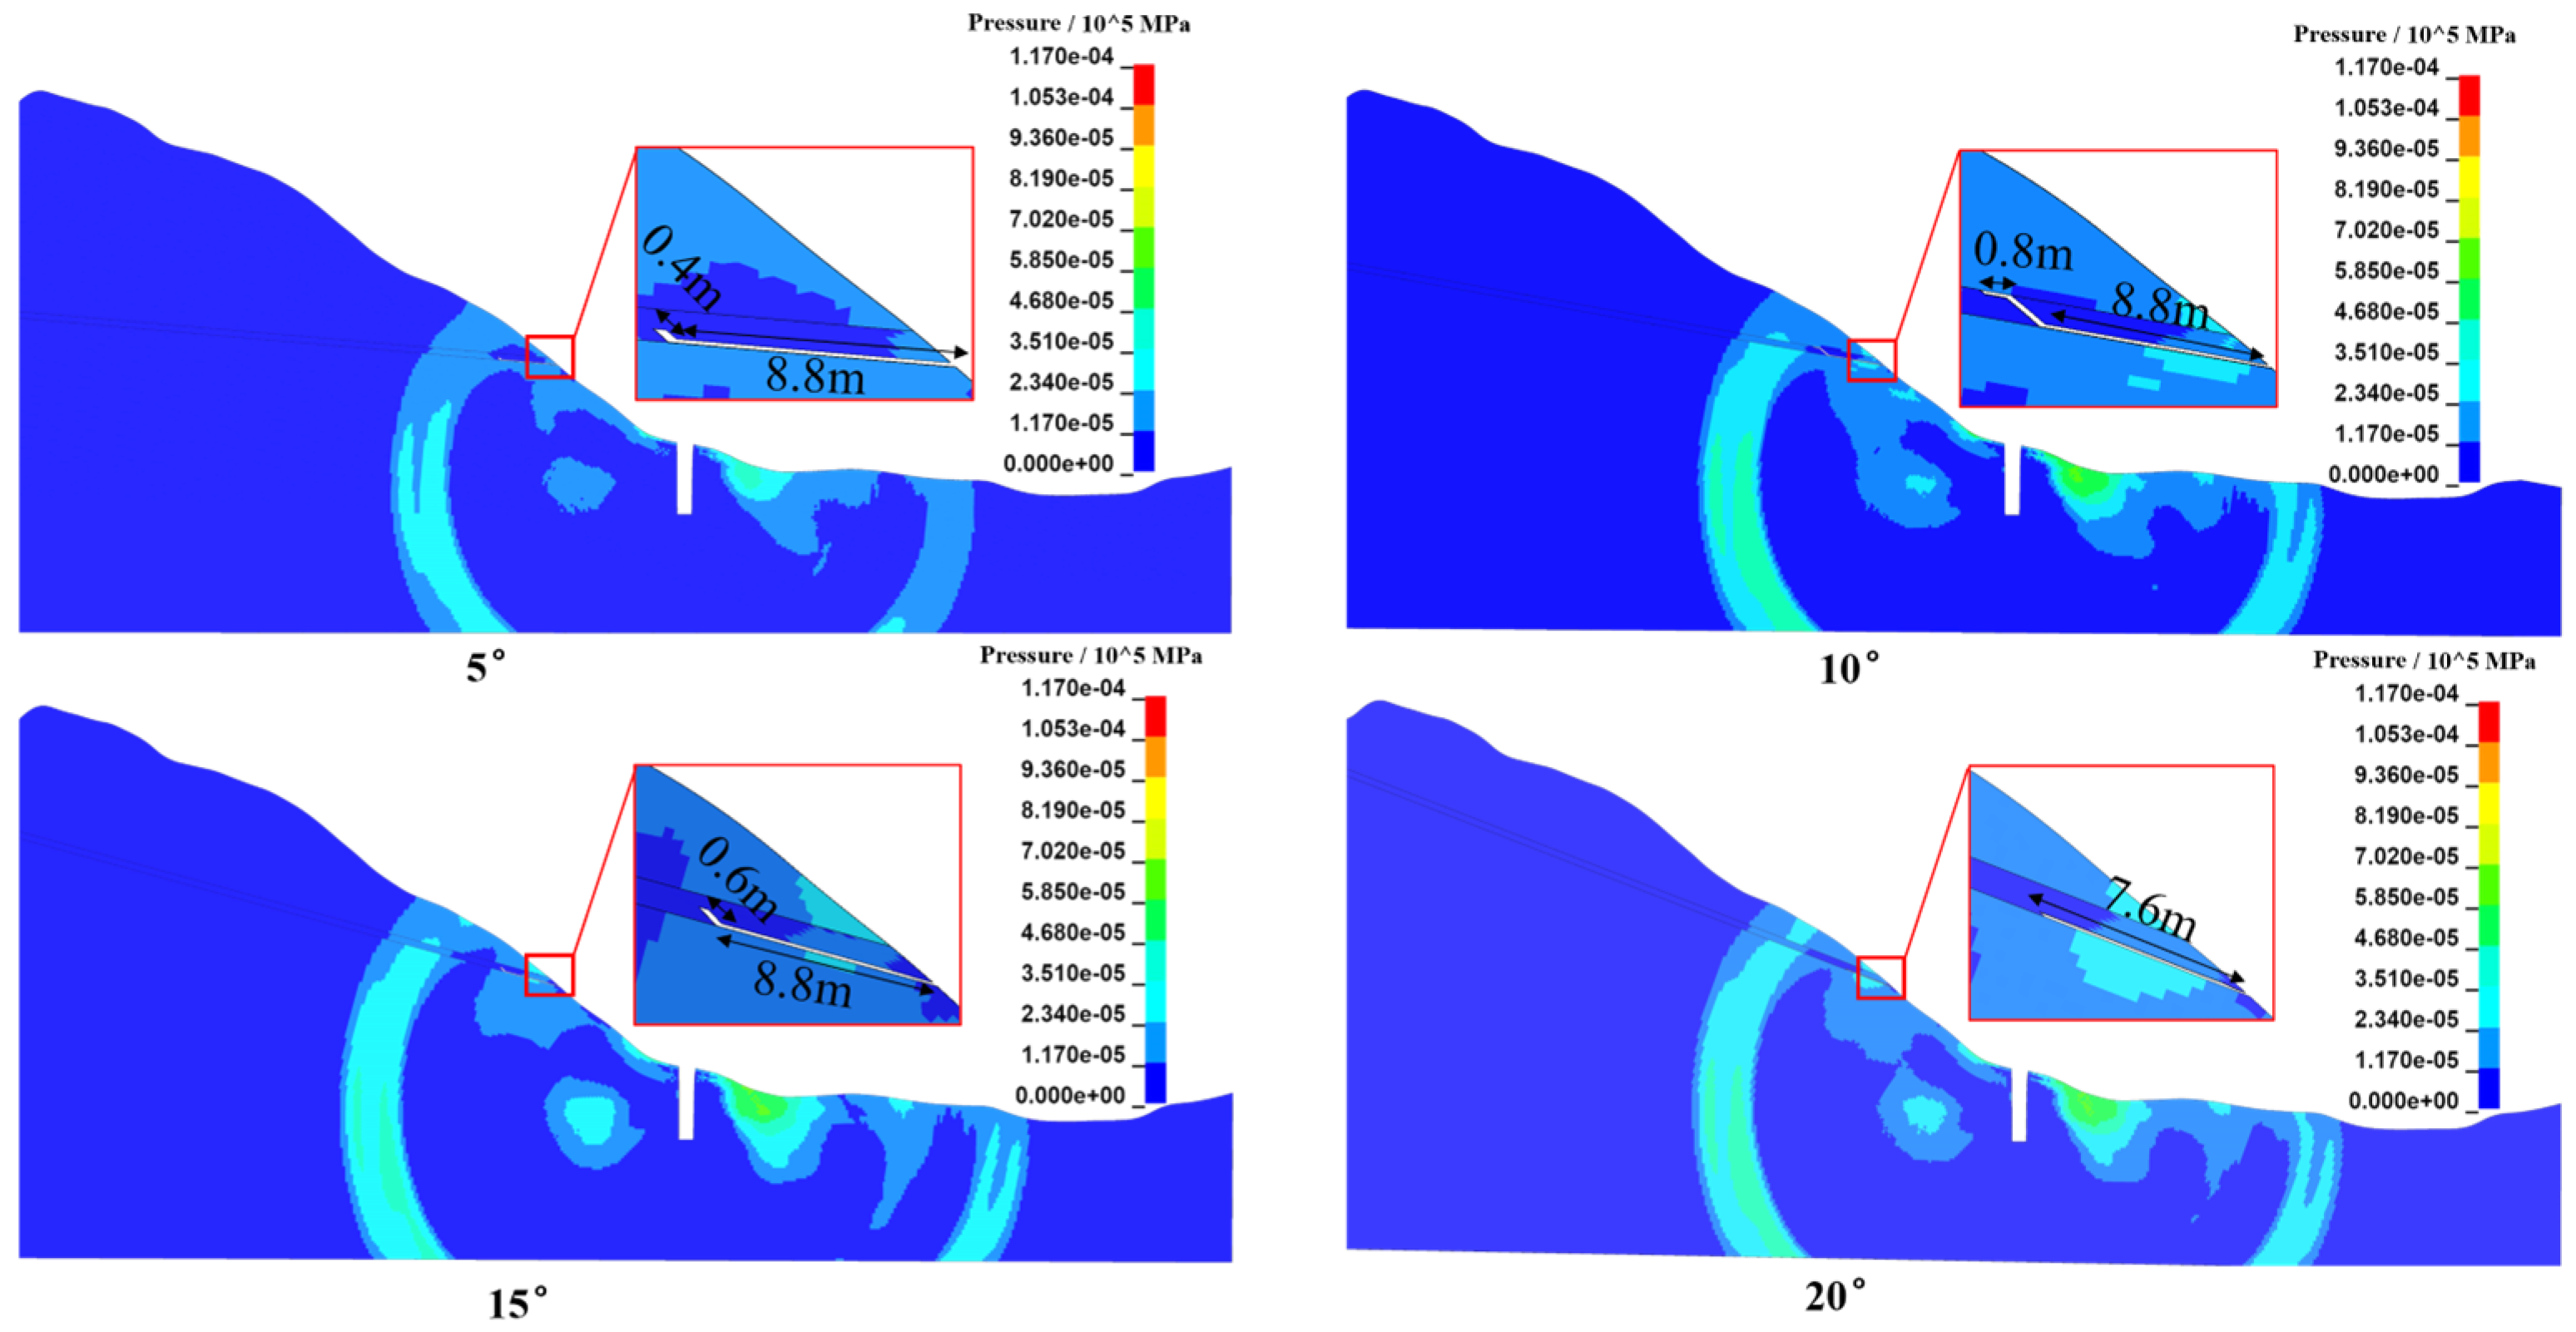
To investigate the effect of bedding plane dip angle, numerical models with five different dip angles (0°, 5°, 10°, 15°, 20°) were established while maintaining a constant interlayer spacing of 1 m. By analyzing the crack propagation process and final morphology within the mudstone layers, the significant controlling effect of the dip angle on the fracture mode was revealed.
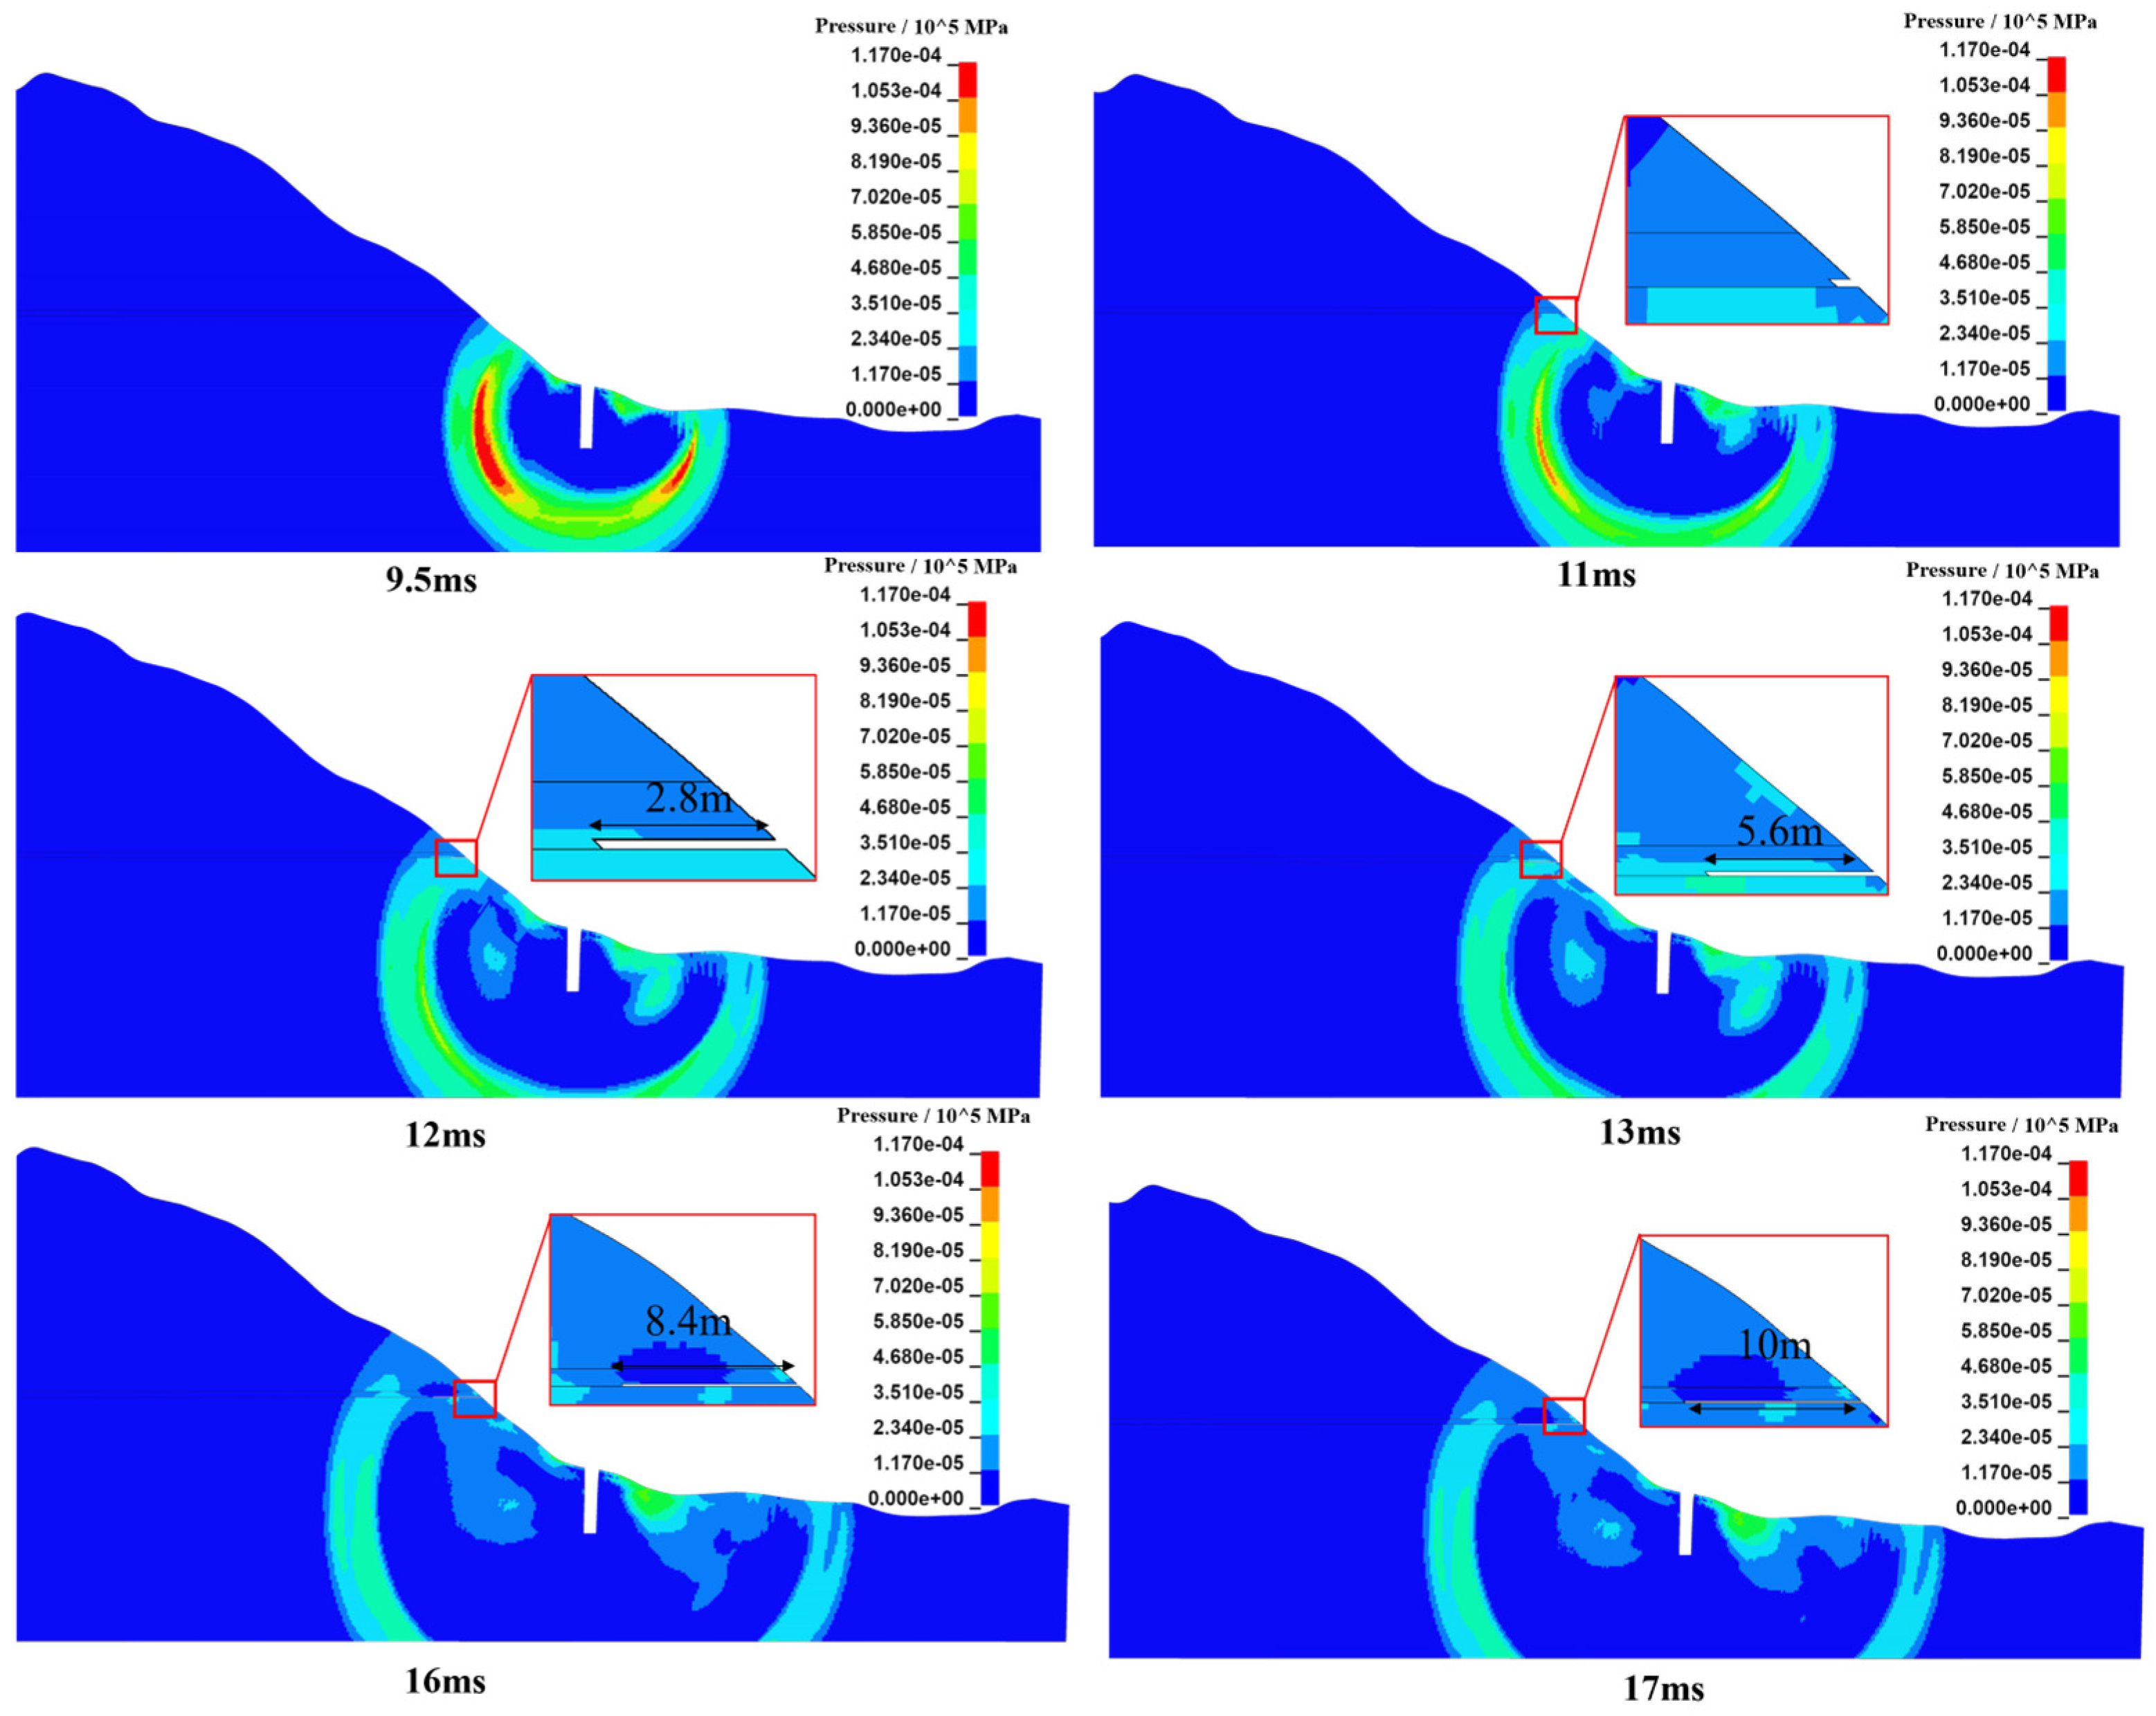
Taking the model with a 0° dip angle as an example, its crack propagation process is shown in
Figure 10. The stress wave began to disturb the mudstone layer at 9.5 ms after initiation. Approximately 2 ms later (at 11.5 ms), tensile cracks started to generate along the lower bedding plane of the mudstone layer. Subsequently, the crack propagated steadily along the bedding plane into the slope interior, ultimately forming an approximately 10-m-long horizontal interlayer crack by 17 ms after initiation.
Figure 11 shows the final fracture morphologies of the mudstone layers under different bedding plane dip angles. Analysis reveals that changes in the dip angle significantly governed the evolution law of the fracture characteristics. When the dip angle was 5°, the fracture process involved two distinct stages: first, the crack propagated approximately 8.8 m along the lower bedding plane, followed by the induction of an approximately 0.4-m-long oblique crack within the layer. As the dip angle increased to 10°, the fracture process became more complex, developing into three stages: besides the equivalent length (8.8 m) of propagation along the lower bedding plane and the formation of a penetrating oblique crack, a secondary crack approximately 0.8 m long was also triggered along the upper bedding plane. When the dip angle further increased to 15°, although the fracture mode was similar to the 5° case, still exhibiting a two-stage characteristic, the length of the internal oblique crack increased to 0.6 m. At a dip angle of 20°, the final fracture characteristic returned to a single horizontal interlayer crack mode, essentially identical to the 0° case, but the crack length along the lower bedding plane shortened to 7.6 m. This series of changes clearly demonstrates that the bedding plane dip angle not only determines the complexity and number of stages of the fracture process but also directly influences the propagation lengths of various crack types.
The combined results indicate that as the bedding plane dip angle increases, the crack length along the lower bedding plane of the mudstone gradually decreases, while the length of the oblique cracks within the mudstone first increases and then decreases. This phenomenon occurs because an increasing dip angle moves the lower bedding plane further from the blast source, reducing the intensity of the stress wave reaching it. Simultaneously, the change in dip angle alters the reflection and superposition paths of the stress wave within the mudstone layer, creating conditions most favorable for the development of oblique cracks within the 10° to 15° range.
4.2. Influence of Interlayer Spacing on Fracture Characteristics
To study the influence of interlayer spacing (mudstone layer thickness), numerical models with interlayer spacings of 1 m, 2 m, 3 m, 4 m, and 5 m were established, while keeping the bedding plane dip angle fixed at 25°.
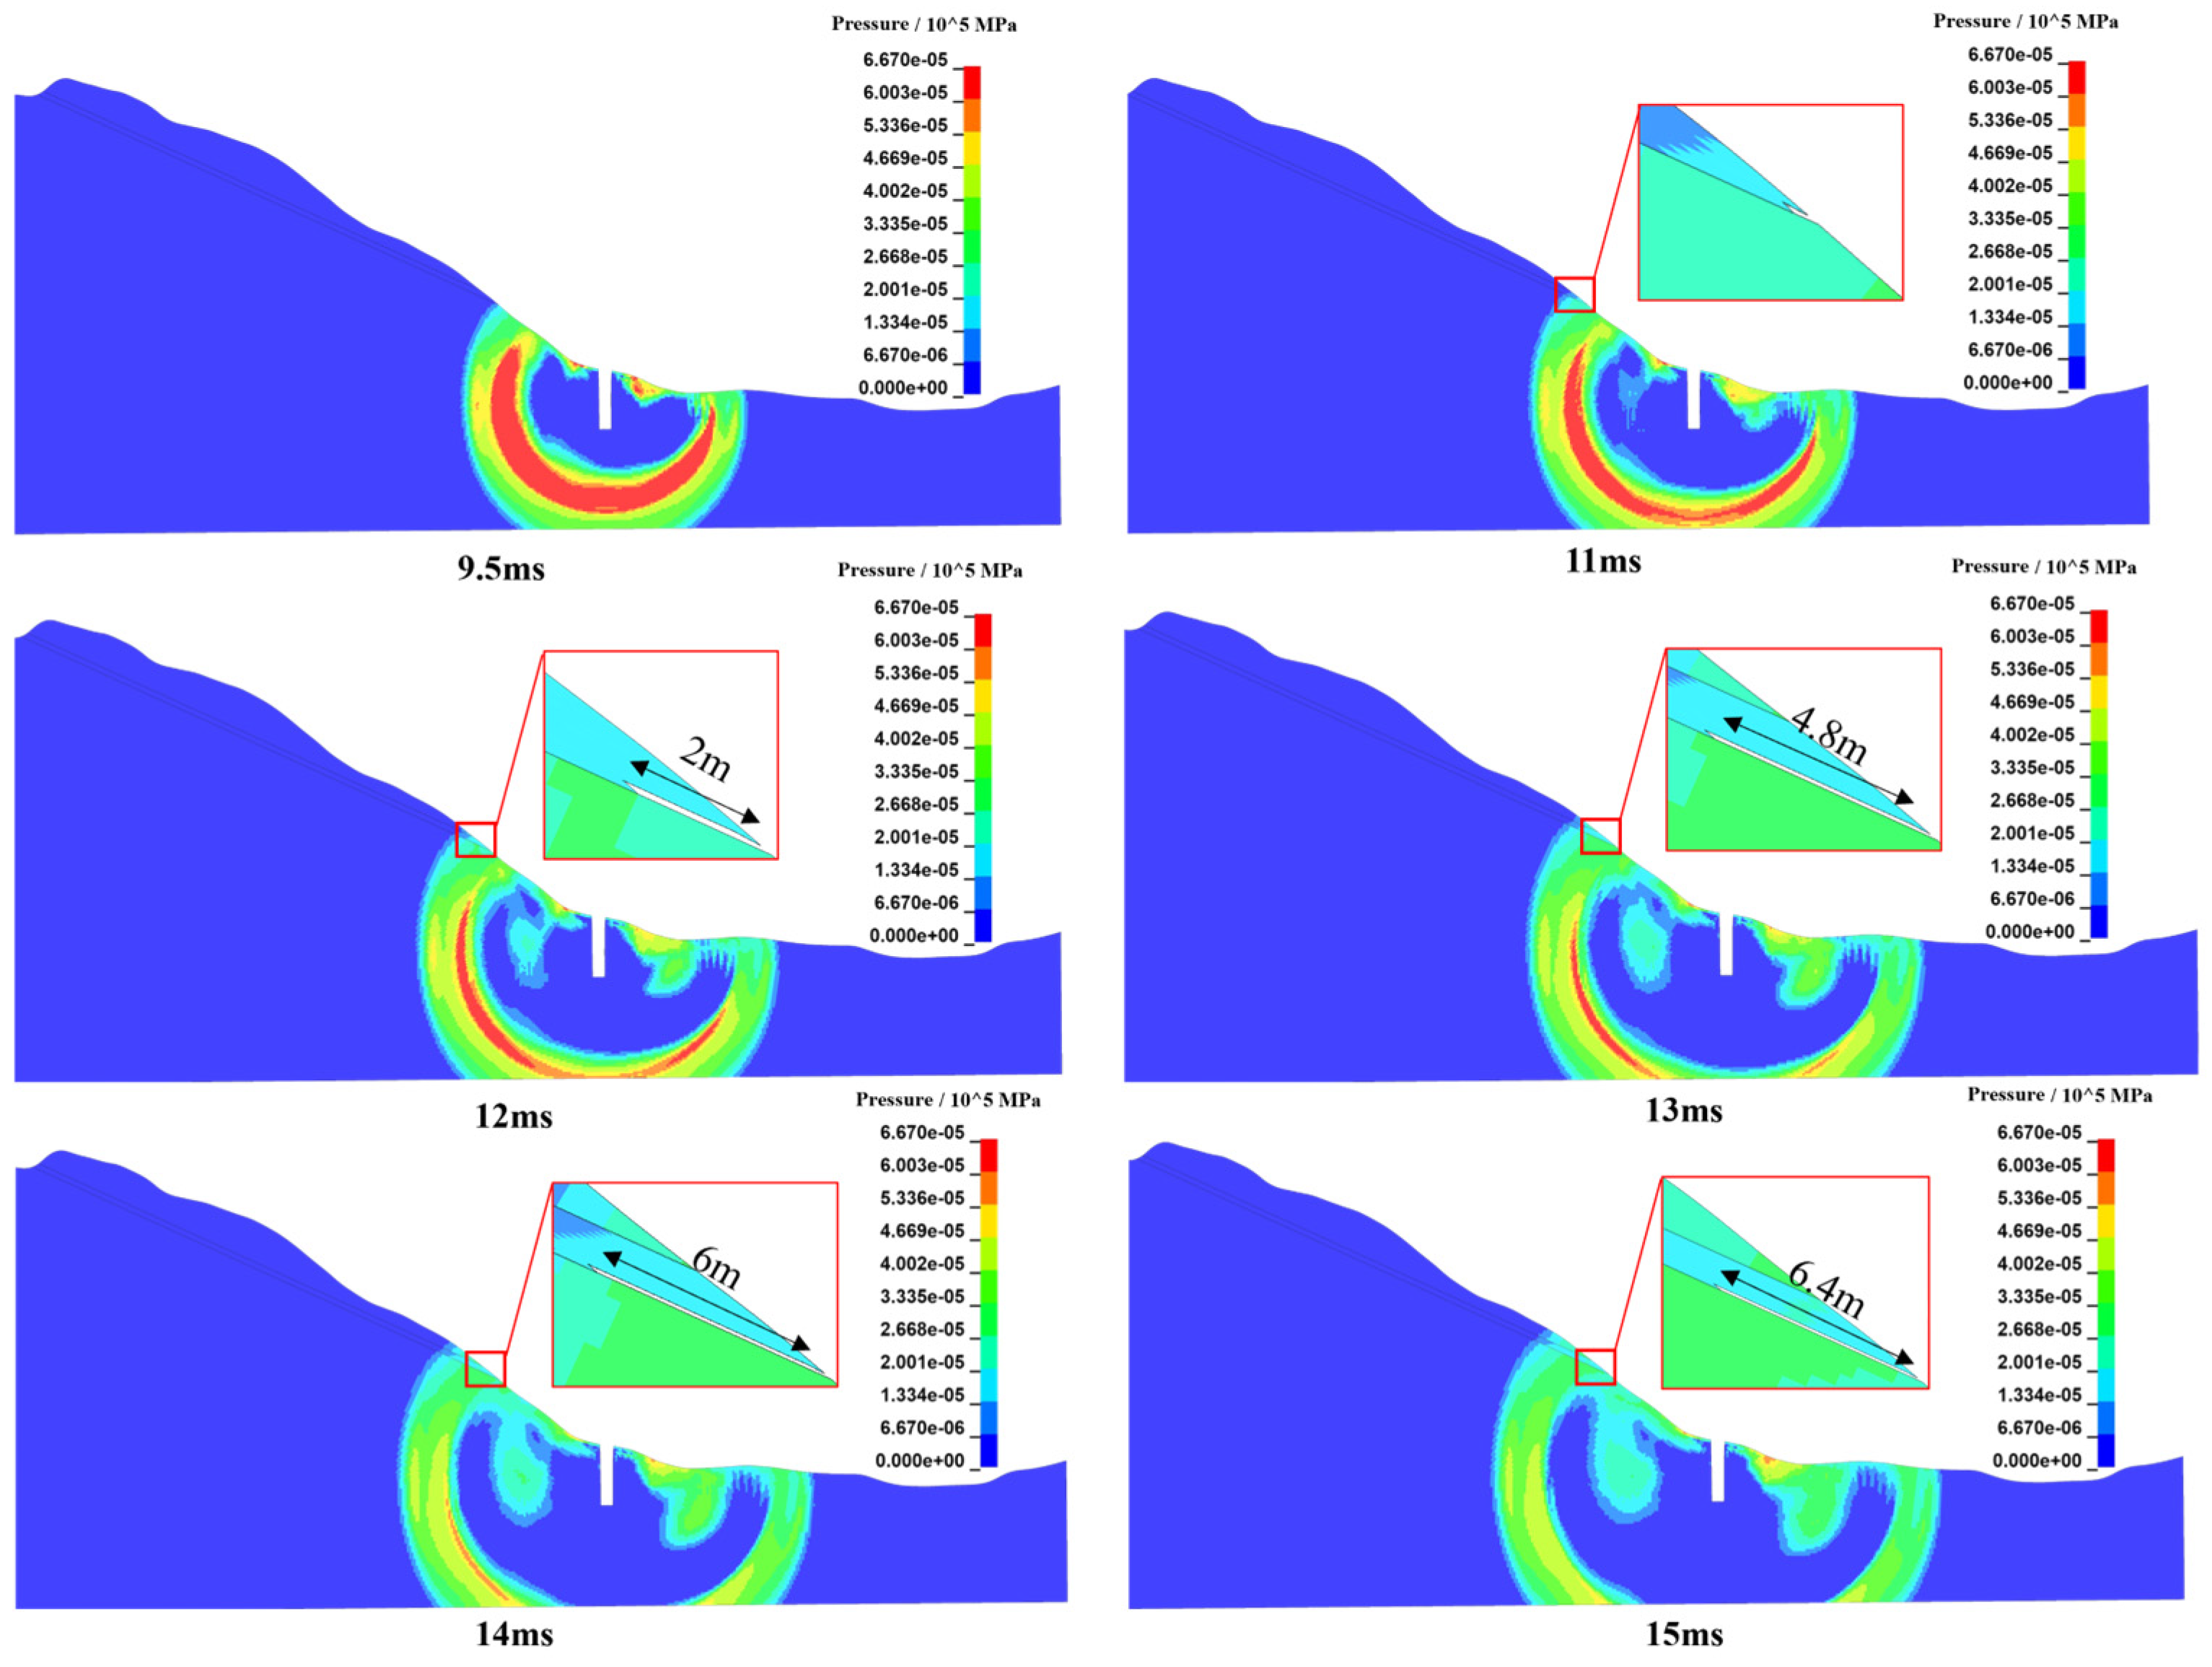
Taking the model with 1 m interlayer spacing as an example, its crack propagation process is shown in
Figure 12. The mudstone layer began to fracture approximately 11 ms after initiation. The crack propagated steadily inward along the lower bedding plane, reaching a maximum length of 6.4 m by 15 ms.
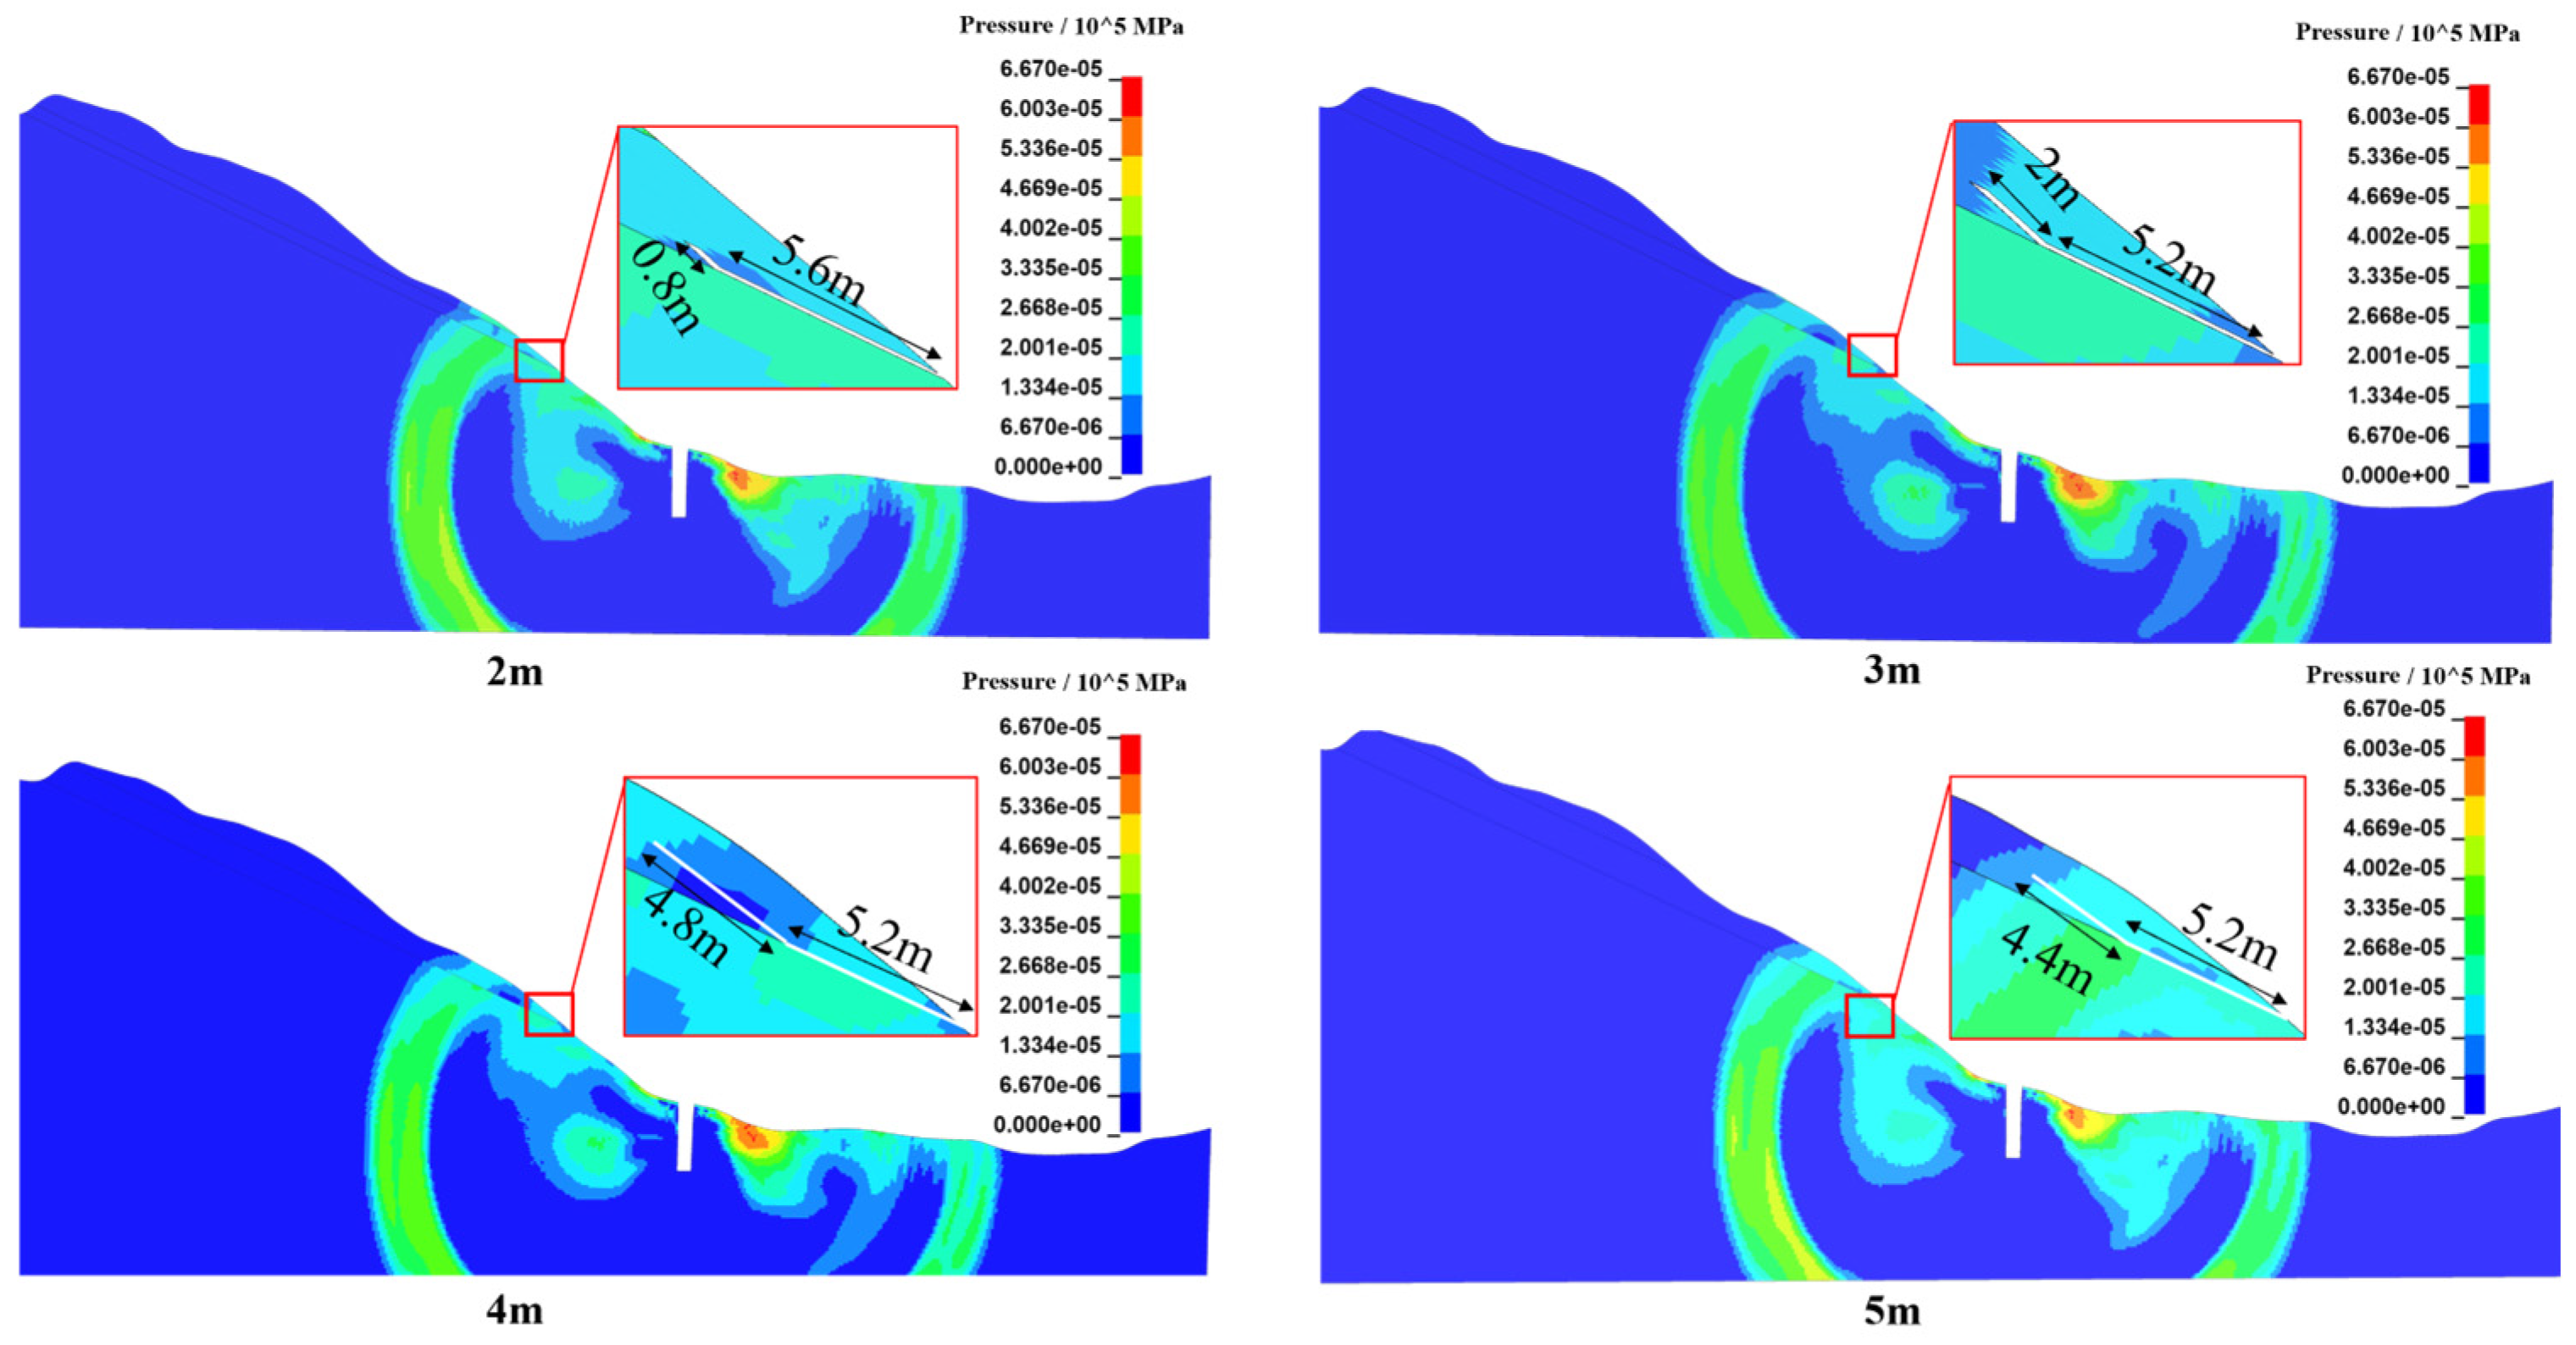
Figure 13 shows the fracture characteristics of mudstone under different interlayer spacings. Analysis indicates that changes in interlayer spacing affect the fracture behavior of mudstone. When the spacing ranges from 2 m to 5 m, the fracture characteristics differ from those at 1 m spacing, with the final fracture pattern in mudstone being divisible into two stages in all these cases. Stage 1: Cracks propagate along the bedding plane from the slope surface gradually toward the interior of the slope. Stage 2: From the fracture initiation point on the lower bedding plane of the mudstone, cracks extend in a direction approximately parallel to the slope surface, forming oblique cracks.
The lengths of cracks formed in Stage 1 and Stage 2 vary with different interlayer spacings. For a spacing of 2 m, the crack lengths for the two stages are 5.6 m and 0.8 m, respectively. For spacings of 3 m, 4 m, and 5 m, the Stage 1 crack lengths are all 5.2 m, while the Stage 2 crack lengths are 2.0 m, 4.8 m, and 4.4 m, respectively.
Based on the analysis, when the bedding dip angle remains constant and the interlayer spacing gradually increases from 1 m to 5 m, the crack length along the lower bedding plane of the mudstone first decreases and then stabilizes at 5.2 m, while the length of the internal oblique cracks within the mudstone first increases and then decreases.
The mechanisms underlying this phenomenon can be attributed to the following factors. As the interlayer spacing progressively increases, the distance between the upper and lower bedding planes of the mudstone widens. This results in a reduction in the stress wave intensity reflected from the upper to the lower bedding plane, consequently leading to a gradual decrease in the crack length along the lower plane. When the interlayer spacing reaches a certain threshold, the reflected stress wave from the upper plane becomes negligible, causing the crack length along the lower plane to remain essentially constant with further increases in spacing.
On the other hand, the variation in interlayer spacing alters the propagation path of the stress wave within the mudstone layer. When the spacing falls within a specific range, the transmission and reflection of the stress wave between the upper and lower bedding planes generate significant superposition near the fracture initiation point on the lower plane, particularly in a direction approximately parallel to the slope surface. This promotes the development of oblique cracks within mudstone. However, as the interlayer spacing continues to increase beyond this range, the intensity of this superposition gradually diminishes, resulting in a corresponding reduction in the length of the oblique cracks. According to the numerical results, the maximum oblique crack length reaches 4.8 m at an interlayer spacing of 4 m.
4.3. Model Limitations
The numerical model established in this study provides an effective tool for revealing the dynamic fracture patterns of weak layers in sandstone–mudstone interbedded slopes. However, the model retains certain simplifications and limitations that require careful consideration during result interpretation and engineering application:
(1) To ensure the efficiency and stability of large-scale computations, the model employs a structured hexahedral mesh and a macro-failure criterion based on element erosion. This approach effectively characterizes macroscopic crack initiation and propagation trends, making it suitable for revealing the qualitative relationship between fracture patterns and geometric parameters investigated in this study. However, the simulated crack paths exhibit relatively regular morphology influenced by grid orientation, differing from the complex microfracture patterns observed in natural rock masses due to heterogeneity and microdefects.
(2) The model assumes homogeneous and isotropic properties for the same lithological material, employing uniform strength and deformation parameters. This simplification focuses analysis on the controlling effects of stratigraphic conditions. In reality, shallow slope rock masses may exhibit spatially graded mechanical properties due to unloading, weathering, and reduced confining pressure.
(3) Although the employed elastoplastic model accounts for strain rate hardening, it inadequately describes complex behaviors such as cumulative damage and post-peak softening in rock. These simplifications are reasonable for analyzing macroscopic responses dominated by interlayer tensile cracking. However, further considerations are necessary when evaluating the overall long-term stability or shear slip of the slope.
(4) The element deletion method employed in this study is an equivalent simulation technique for macroscopic fracture. Its advantages lie in computational efficiency and stability, enabling effective identification of macroscopic crack initiation, propagation trends, and lengths. It is well-suited for systematic parametric comparisons. However, this method cannot describe the progressive damage process at the crack tip or the energy dissipation mechanism. While damage-based or cohesion-based models could more realistically simulate microfracture physics, they would significantly increase computational costs and are not expected to alter the core conclusions of this paper regarding geometric parameter control over macroscopic fracture patterns.
5. Safety Criterion for Slope Dynamic Stability Based on Crack-Initiation Vibration Velocity
The aforementioned findings reveal that although variations in the bedding dip angle and interlayer spacing lead to diverse fracture patterns in the mudstone layers, the initial fracture position invariably originates at the intersection between the slope surface and the lower bedding plane of the mudstone. This common characteristic indicates that this location is the most sensitive area in terms of dynamic blast response. Therefore, defining the peak particle velocity in the principal vibration direction (Z-direction) at the moment when the mudstone layer initially fractures at this location as the crack-initiation vibration velocity—and subsequently using it as a safety threshold to prevent initial slope failure—possesses clear physical significance and aligns with conservative safety principles in engineering practice.
To establish a quantifiable safety criterion, this study designed 25 numerical simulation cases covering different bedding dip angles (5–25°) and interlayer spacings (1–5 m), systematically analyzing the influence of these parameter combinations on the crack-initiation vibration velocity. The specific results are summarized in
Table 5.
In-depth analysis of the data in
Table 5 reveals clear trends: under a constant bedding dip angle, the crack-initiation vibration velocity decreases as the interlayer spacing decreases; conversely, with a fixed interlayer spacing, the crack-initiation vibration velocity diminishes as the dip angle increases. This indicates that steeper dip angles or thinner mudstone layers make the weak layer in the slope more susceptible to fracturing under lower blasting vibration intensity, representing a more critical condition for stability.
To accurately describe the quantitative relationship between the safety control threshold and the bedding parameters, a nonlinear surface fitting was performed on all 25 datasets, drawing upon the functional form commonly used in blast vibration attenuation prediction models. This yielded a predictive model for the safe control vibration velocity [
v], where the peak particle velocity is perpendicular to the slope direction, with the bedding dip angle (
θ) and interlayer spacing (
D) as independent variables:
6. Conclusions
This study systematically investigated the dynamic response and fracture characteristics of weak mudstone layers in sandstone–mudstone interbedded slopes under blasting loads by integrating field blast vibration tests, laboratory dynamic property tests on rocks, and refined numerical simulations. The main conclusions are as follows:
(1) The reliability of the numerical model was verified against field test results. Comparison between field monitoring data and numerical results showed that the relative error of the Peak Particle Velocity (PPV) was within 20% at most monitoring points, and the waveform characteristics and dominant frequency were generally consistent. This confirms that the established numerical model effectively replicates the dynamic response of the slope under blasting vibrations.
(2) The bedding dip angle significantly influences the fracture characteristics of the weak layers. As the dip angle increases, the crack length along the lower bedding plane of the mudstone gradually decreases, while the length of internal oblique cracks first increases and then decreases. Oblique cracks are most likely to develop within the dip angle range of 10–15°, reflecting the complex mechanism where the stress wave propagation path and superposition effects are controlled by the bedding orientation.
(3) The interlayer spacing (mudstone layer thickness) affects the fracture mode and crack propagation. As the interlayer spacing increases, the crack length along the lower bedding plane first decreases and then stabilizes, whereas the length of oblique cracks first increases and then decreases, reaching a maximum of 4.8 m at a spacing of 4 m. This indicates that variations in mudstone layer thickness alter the reflection and superposition behavior of stress waves between layers, consequently influencing the fracture morphology.
(4) A safety criterion for slope dynamic stability based on the “crack-initiation vibration velocity” was proposed. Through 25 parametric numerical simulations, a predictive model for the safe control vibration velocity [v] was established, with the bedding dip angle (θ) and interlayer spacing (D) as independent variables. This provides a quantitative basis for stability assessment and dynamic safety control of sandstone–mudstone interbedded slopes under blasting vibrations.
(5) It should be noted that this study assumes uniform strength parameters for the same lithological material within the numerical model. While this facilitates focusing on the geometric control effects of stratigraphic conditions, it represents a simplification compared to actual engineering scenarios. In actual slopes, due to stress release near the free surface, weathering unloading, and significant reductions in confining pressure, the mechanical properties of rock masses often exhibit a spatial gradient increasing from the slope face toward the interior. This gradient variation influences the stress state and failure tendency in near-slope regions, potentially making these areas more susceptible to shear sliding or tensile cracking under dynamic loading. While the constant strength model employed in this study effectively reveals the influence patterns of geometric parameters when analyzing failure modes dominated by interlayer tensile cracking, future refined stability assessments for specific engineering projects or investigations into global shear instability of slopes require further consideration of the spatial variability in rock mass strength to enhance prediction accuracy.
Author Contributions
Conceptualization, G.Z. and Y.S.; methodology, G.Z.; software, G.Z.; validation, S.C. and X.L.; formal analysis, Y.S.; investigation, X.T.; resources, Z.Z.; writing—original draft preparation, G.Z.; writing—review and editing, N.J.; funding acquisition, N.J. All authors have read and agreed to the published version of the manuscript.
Funding
This research is supported by the Open Project Funding of the CCCC Key Laboratory of Environment Protection and Safety in Foundation Engineering of Transportation.
Data Availability Statement
The original contributions presented in this study are included in the article. Further inquiries can be directed to the corresponding author.
Conflicts of Interest
Authors Guocai Zhang, Ying Sun, Sheng Chen, and Xue Liu were employed by the company CCCC Fourth Harbor Engineering Co., Ltd. The remaining authors declare that the research was conducted in the absence of any commercial or financial relationships that could be construed as a potential conflict of interest.
Abbreviations
The following abbreviations are used in this manuscript:
| PPV | Peak Particle Velocity |
References
- Kramer, S.L. Geotechnical Earthquake Engineering; Pearson Education India: Chennai, India, 1996. [Google Scholar]
- Ausilio, E.; Conte, E.; Dente, G. Seismic stability analysis of reinforced slopes. Soil Dyn. Earthq. Eng. 2000, 19, 159–172. [Google Scholar] [CrossRef]
- Liu, H.L.; Gong, Y.X.; Li, H.W.; Zhu, D.Y. Slope stability analysis under blasting vibration load based on normal stress distribution of slip surface. Rock Soil Mech. 2013, 34, 117–121. [Google Scholar]
- Chen, N.N.; Gao, W.X.; Zhou, S.S.; Zhang, L.J.; Hou, B.H. Stability analysis of cut slope under blasting load. Constr. Technol. 2013, 42, 64–67. [Google Scholar]
- Wang, X.J.; Zhu, X.X.; Wu, X.X.; Zhang, C.Y.; Xiong, X.Y. Dynamic stability analysis of high slope excavation by blasting at Jinping I Hydropower Station. Eng. Blasting 2010, 16, 27–30. [Google Scholar]
- Chen, Q.Y.; Liu, M.S.; Wang, X.J.; Zhang, D.J. Study on blasting dynamic stability of slope excavation at Jinping I Hydropower Station. Blasting 2011, 28, 35–39. [Google Scholar]
- Ye, H.L.; Zheng, Y.R.; Du, X.L.; Li, A.H. Shaking table model test and numerical analysis on dynamic failure characteristics of slope. China Civ. Eng. J. 2012, 45, 128–135. [Google Scholar]
- Lin, M.L.; Wang, K.L. Seismic slope behavior in a large scale shaking table model test. Eng. Geol. 2006, 86, 118–133. [Google Scholar] [CrossRef]
- Katz, O.; Aharonov, E. Landslides in vibrating sand box: What controls types of slope failure and frequency magnitude relations? Earth Planet. Sci. Lett. 2006, 247, 280–294. [Google Scholar] [CrossRef]
- Li, Z.S.; Li, G.Q. Research on slope failure mode of open-pit coal mine based on combined “surface-deep” monitoring method. Coal Eng. 2021, 53, 144–147. [Google Scholar]
- Feng, S.J.; Guo, P.; Sun, S.G. The Research of Blasting Dynamices to Slope Rock Mass Damage. Adv. Mater. Res. 2014, 962, 384–387. [Google Scholar] [CrossRef]
- Liu, Y.P.; Huang, R.; Deng, H. Study on physical simulation vibration test of the anti-inclined slab-rent structure rock slope. J. Chengdu Univ. Technol. (Sci. Technol. Ed.) 2011, 38, 413–421. [Google Scholar]
- Li, W.X.; Wang, J.; Dai, L.F. Safety criterion of blasting vibration for high and steep slopes in open-pit mines of mountainous area. Ind. Miner. Process. 2006, 35, 20–22. [Google Scholar]
- Liu, M.S.; Wu, C.Q.; Zhang, Z.Y. Experimental study on safety criterion of blasting vibration for high slope of Xiaowan Hydropower Station. J. Yangtze River Sci. Res. Inst. 2007, 24, 40–43. [Google Scholar]
- Lin, D.N.; Tang, Y.M.; Fan, J.G.; Yang, J.W. Stability analysis of high and steep slopes under blasting vibration. Miner. Eng. Res. 2009, 24, 25–28. [Google Scholar]
- Jiang, N.; Zhang, S.Y.; Yao, Y.K.; Zhou, C.B.; Luo, X.D.; Cao, H.Z. Explosive unit consumption based on the impact dynamic characteristics and energy dissipation of frozen sandstone. Results Eng. 2026, 29, 108750. [Google Scholar] [CrossRef]
- Yang, F.; Jiang, N.; Yao, Y.K.; Zhou, C.B.; Lyu, G.P. How does the shape of a falling rock affect its impact force on sand cushions: A computer-aided statistical analysis. Rock Mech. Rock Eng. 2025. [Google Scholar] [CrossRef]
- Jiang, N.; Lyu, G.P.; Wu, T.Y.; Zhou, C.B.; Li, H.B.; Yang, F. Vibration effect and ocean environmental impact of blasting excavation in a subsea tunnel. Tunn. Undergr. Space Technol. 2023, 131, 104855. [Google Scholar] [CrossRef]
- Liu, Y.; Jiang, N.; Yao, Y.K.; Yang, F.; Lyu, G.P. Multi-factor sensitivity analysis of dynamic response and safety assessment of reinforced concrete pipelines with different buried depths under the impact of collapse rockfalls. J. Civ. Struct. Health. 2026, 16, 6. [Google Scholar] [CrossRef]
- Lyu, G.P.; Jiang, N.; Zhou, C.B.; Yang, F.; Yao, Y.K. Surface explosion induced damage effects and optimization of blast resistance performance of buried pipelines: A case study of concrete pipelines with bell-and-spigot joints. Tunn. Undergr. Sp. Tech. 2026, 172, 107513. [Google Scholar] [CrossRef]
| Disclaimer/Publisher’s Note: The statements, opinions and data contained in all publications are solely those of the individual author(s) and contributor(s) and not of MDPI and/or the editor(s). MDPI and/or the editor(s) disclaim responsibility for any injury to people or property resulting from any ideas, methods, instructions or products referred to in the content. |