Article

Heat Transfer Analysis in a Channel Mounted with In-Line Downward-Facing and Staggered Downward-Facing Notched Baffles

1
School of Engineering and Industrial Technology, Mahanakorn University of Technology, Bangkok 10530, Thailand
2
Mechanical Engineering Department, DIT University, Dehradun 248009, India
3
School of Engineering, King Mongkut’s Institute of Technology Ladkrabang, Bangkok 10520, Thailand
4
Department of Mechanical and Manufacturing Engineering, Faculty of Science and Engineering, Kasetsart University Chalermphrakiat Sakon Nakhon Province Campus, Sakon Nakhon 47000, Thailand
*
Author to whom correspondence should be addressed.
Eng 2025, 6(9), 229; https://doi.org/10.3390/eng6090229
Submission received: 4 July 2025 / Revised: 11 August 2025 / Accepted: 1 September 2025 / Published: 5 September 2025

Abstract

This study presents a comprehensive analysis of heat transfer enhancement, flow resistance, and thermal performance in rectangular channels equipped with three baffle configurations: conventional transverse baffles (TBs), in-line downward-facing notched baffles (IDF-NBs), and staggered downward-facing notched baffles (SDF-NBs). The influence of the pitch-to-baffle height ratio (P/e), ranging from 2.0 to 10, was examined across Reynolds numbers from 6000 to 24,000. Results indicate that a P/e ratio of 6.0 consistently yielded the highest Nusselt numbers across all configurations. While the TB configuration produced significant heat transfer at P/e= 6.0, it experienced a substantial friction penalty, with its best thermal enhancement factor (TEF = 1.168) observed at P/e = 8.0. The IDF-NB configuration achieved optimal performance at P/e = 6.0 with a TEF of 1.257, offering a better balance between heat transfer and flow resistance. The SDF-NB arrangement outperformed all other cases, delivering the highest Nusselt number (Nu = 116.9), TEF (1.362), and improved flow reattachment, primarily due to enhanced mixing from the staggered layout. These findings demonstrate that the staggered notched baffle configuration at P/e = 6.0 offers the most effective thermal performance enhancement among the configurations studied.

1. Introduction

Over the past few decades, the growing global demand for energy has led to increased consumption of fossil fuels, intensifying concerns over greenhouse gas emissions and environmental sustainability [1,2]. This has accelerated the development of renewable energy technologies, with solar energy emerging as a particularly vital alternative in the transition to a low-carbon future [3]. In parallel, a substantial amount of thermal energy is being lost as waste heat across industrial and commercial sectors. Waste heat recovery presents a promising solution for improving energy efficiency and reducing carbon emissions. Among various strategies, converting waste heat into usable electricity represents a key direction of research and development, with significant long-term implications [4]. To achieve optimal performance in these renewable and waste heat recovery systems, heat transfer enhancement techniques are essential. Whether in solar collectors, heat exchangers, or thermoelectric systems, effective thermal management remains a critical factor for sustainable and efficient energy use. These improvements not only enhance energy efficiency but also help reduce equipment size, material consumption, and overall operational costs [5]. Complementing these strategies, Kouidri et al. [6] developed AI-based models to estimate fouling resistance in shell-and-tube heat exchangers, providing a data-driven approach to maintain thermal-hydraulic performance and link long-term operation with enhancement techniques. This addition reinforces the thematic continuity in heat-transfer and heat-exchanger research, bridging energy-efficiency efforts with practical system performance. Consequently, numerous research efforts have focused on developing and applying modification devices aimed at augmenting heat transfer. Ko et al. [7] conducted an experimental study on heat transfer enhancement in rectangular channels using porous baffles. They investigated porous media with three different pore densities, two window cut ratios (Bh/Dh), and two baffle thickness ratios (Bt/Dh), across a Reynolds number range of 20,000 to 50,000. The results showed that porous baffles could enhance heat transfer by up to 300%. However, the ratio of heat transfer enhancement to the required pumping power remained below unity. Huang et al. [8] used transient liquid crystal thermal imaging to study the local heat transfer coefficient in a square channel fitted with perforated baffles. They examined the effects of Reynolds number, baffle height, and number of perforations. The findings indicated that increasing the Reynolds number and baffle height significantly improved heat transfer. Additionally, the downstream regions outside the centerline exhibited higher heat transfer coefficients than the central region, primarily due to secondary flow effects. Ary et al. [9] performed both numerical simulations and experimental investigations to analyze the effects of inclined perforated baffles in rectangular channels. They explored the influence of baffle quantity, hole number, and Reynolds number. Their results revealed that using double baffles provided better heat transfer performance than a single baffle. Moreover, baffles with fewer holes offered greater heat transfer enhancement, although with increased pressure loss. Chompookham et al. [10] experimentally studied the influence of different upper-edge baffle shapes: rectangular, triangular, and trapezoidal on turbulent heat transfer in rectangular channels. Among them, the rectangular baffle yielded the highest Nusselt number and friction factor, while the trapezoidal baffle showed the best thermal performance factor. The study also found that increasing the baffle height ratio and Reynolds number led to higher Nusselt numbers but reduced the overall thermal performance factor. Sahel et al. [11] investigated heat transfer enhancement in a rectangular channel using a perforated baffle through numerical simulation. They focused on the effects of the pores axis ratio (PAR) and Reynolds number. Their results showed that a baffle with a PAR of 0.19 effectively eliminated low heat transfer regions downstream of the baffle. This design increased the heat transfer rate by 2% to 65% compared to a solid baffle, reduced the friction factor by a factor of 12, and achieved a thermal performance factor as high as 6.3. Mashaei et al. [12] analyzed the laminar heat transfer behavior of Al2O3-water nanofluid in the inlet region of a channel fitted with transverse inline baffles, using numerical simulations. They found that increasing the nanoparticle volume fraction and Reynolds number significantly improved the heat transfer coefficient and increased pressure drop. The nanofluid provided better temperature uniformity and thermal performance, especially at lower Reynolds numbers and higher heat flux. It also effectively reduced hot spots downstream of the baffles. El Habet et al. [13] examined heat transfer in channels with baffles installed in both straight and staggered arrangements on the upper and lower channel walls. They tested baffles with various perforation rates. Their findings showed that the baffles improved heat transfer performance by up to 410% compared to smooth channels. At high perforation rates (β = 20–40%), staggered arrangements enhanced heat transfer more effectively than straight ones. However, at low perforation rates (0% and 10%), straight baffles performed better. In another study, El Habet et al. [14] investigated the impact of baffles with different inclination angles and perforation rates on flow and heat transfer in a rectangular channel, using both experiments and simulations. They found that baffles with a 0° inclination angle and a perforation rate of 8–10% offered the highest heat transfer enhancement but also caused the most flow resistance. In contrast, baffles with a 60° angle and a 40% perforation rate showed the weakest heat transfer improvement but the lowest friction factor. Low-angle baffles with low perforation rates generated strong reattachment and circulation zones on the heated surface, leading to a Nusselt number ratio of up to 2.6. Additionally, the thermal performance factor peaked at about 0.7 for the configuration with a 60° angle and 10% perforation rate at Re = 12,000. Eiamsa-ard et al. [15] conducted a numerical study to evaluate the flow and heat transfer performance of three types of baffles in a channel: transverse solid baffles, perforated baffles, and perforated baffles with square wings. They found that the perforated baffle with square wings eliminated the dead zone behind the baffle by creating multiple impinging jets. The perforated design also reduced friction losses. This configuration achieved a thermal performance factor of 1.2 at a Reynolds number (Re) of 9000, which was 6.0% higher than that of the perforated baffle and 3.3% higher than that of the transverse solid baffle. Karabulut [16] studied the effects of angle (30°, 60°, and 90°) and height (0.25H, 0.5H, and 0.75H) of rectangular baffles in a rectangular flow channel with intersecting circular grooves. The results showed that the highest average Nusselt number occurred at a baffle angle of 90° and a height of 0.75H. However, the configuration with a 30° angle and 0.25H height gave the highest Performance Evaluation Criterion (PEC) due to its lower friction loss. Jamal et al. [17] investigated a new baffle design using “≠”-shaped baffles mounted on the top and bottom walls of the channel. They used computational fluid dynamics (CFD) with the finite volume method (FVM) and the SIMPLE algorithm to analyze the effect of different baffle spacings. They found that reducing the baffle spacing significantly improved system performance. At the smallest spacing, the thermal performance was 44% higher than that of a channel without baffles. Alwatban and Aljabr [18] investigated the effect of using baffles of different lengths on the thermal performance factor of a channel. They used ANSYS Fluent software to simulate various baffle sizes and found that when the length of the second baffle was half that of the first, the thermal performance factor increased by 3%, and the upper wall friction coefficient decreased by about 50%. Biswas and Tripathy [19] analyzed modified solar collectors with three different designs: (1) a cross-flow design with solid baffles arranged at 30°, 35°, and 40°, (2) a channel design, and (3) a twist design. For the channel and twist designs, they varied the distance between fins at 50, 100, and 150 mm. The simulation results showed that the channel design had the highest convective heat transfer coefficient, followed by the cross-flow and twist designs. However, the cross-flow design demonstrated the best thermohydraulic performance factor. Both the cross-flow and twist designs performed better than a flat plate collector, while the channel design performed worse in terms of thermohydraulic efficiency. Jamal et al. [20] conducted a detailed analysis of the effects of baffle length and arrangement in an air duct. Their results indicated that adjusting the baffle length played a critical role in controlling the flow rate, which directly influenced the temperature distribution in the system. They also found that periodically arranged baffles helped form optimized recirculation zones, improving fluid mixing and heat transfer without significantly increasing flow resistance. At a Reynolds number of 30,000, the periodic arrangement achieved the highest thermal performance factor of 3.27.
The novelty of this research lies in the development and investigation of a newly designed notched baffle geometry that aims to overcome the limitations of traditional solid baffles—particularly the presence of dead zones behind the baffles that significantly reduce heat transfer. By introducing a bottom notch and employing a staggered arrangement, the design promotes a zigzag flow path, enhances fluid mixing, and minimizes pressure loss. The study systematically analyzes the effect of key geometric parameters (e.g., N/e and P/e) on heat transfer and friction loss, providing new insights into optimized baffle configurations for rectangular channels. The article describes the utilization of notched baffles as a turbulence promoter for enhancing the mixing of fluids in the channel, specifically between the fluids in the middle and those closer to the wall. According to the conventional hypothesis regarding heat transfer in a channel with transverse or solid baffles, when fluids flow past the baffle, the baffle causes the recirculation flow to attack the wall, mixing the fluids from the core flow with the hot channel wall in a large zone. However, there is still have a dead zone of flow behind the baffle, which results in extremely low heat transfer in that area. When using a newly designed notched baffle, air is directed via a tiny hole at the bottom of the baffle, minimizing pressure loss and the dead zone behind the baffle. Therefore, in this study, the notch has altered the staggered arrangement to aid fluid flow zigzag between the each baffle, which increases fluid mixing and promotes the heat transfer rate. This study aimed to broaden the understanding of how baffle geometry affects heat transfer and friction loss in rectangular channels. In-line and staggered notched baffles were installed on the lower surface of a channel with an aspect ratio (W/H) of 3.75. The height of the straight baffles (e) was 12 mm, and the channel height (H) was 40 mm, giving a height ratio (e/H) of 0.3. The notch height-to-baffle height ratio (N/e) was kept constant at 0.125. The spacing between adjacent notches (b) was fixed at 10 mm, and the pitch-to-height ratio (P/e) was varied at values of 2.0, 4.0, 6.0, 8.0, and 10. For comparison, standard transverse baffles were also tested as reference cases. The main objective was to identify the optimal heat transfer conditions across a Reynolds number range of 6000 to 24,000.

2. Theoretical Aspects

The heat transfer in the existing system is primarily attributed to the convection process. The Nusselt number (Nu), a dimensionless metric that is employed to evaluate the overall heat transfer, can be expressed as [21]
Nu= hDh/k
where k is the conductivity of air, h is the convective heat transfer coefficient, and Dh is the equivalent channel hydraulic diameter calculated from the cross-sectional area of flow (A) and perimeter (Pe).
Dh = 4A/Pe = (4(W·H))/(2(W + H))
The thermal equilibrium test showed that the heat supplied (QIV = IV) by electrical winding in the test section is below 5% higher than the heat absorbed by the fluid/air (Qa).
Q a = Q I V Q a Q I V × 100 % 5 %
The calculation of the average convective heat transfer coefficient (h) under uniform heat flux conditions is performed using the equation provided below.
h = Qconv/A(TwTb)
The convection heat transfer rate (Qconv) is calculated based on the experimental data derived for air.
Qconv = Qa = ṁCp(ToTi)
Thermochromic liquid crystal (TLC) sheet colors may be used to estimate the average bulk air temperature (Tb), while the average channel wall temperature (Tw) can be computed from
Tb = (To + Ti)/2
In order to evaluate the spatial variation in heat transfer within the rectangular duct fitted with notched baffles, the local Nusselt number (Nux) was determined along the heated surface of the test section. The calculation was based on the local convective heat transfer coefficient (hx), obtained from the measured wall temperature distribution and the estimated bulk air temperature at the same axial positions.
The local convective heat transfer coefficient is defined as:
h x = q x T w , x T b , x
The local Nusselt number is then calculated from:
N u x = h x D h k
Under the assumption of uniform wall heat flux, steady-state flow, and fully developed velocity distribution in the heated section, the axial variation in bulk air temperature can be approximated as linear between the inlet and outlet of the heated section. This allows the local bulk air temperature at any axial position x to be estimated from:
T b , x x = T b , i + T b , o T b , i L h x
For discrete measurement points xi:
T b , x i = T b , i + T b , o T b , i L h x i
The measured values of Tw,x and the calculated Tb,x were then used in Equations (7) and (8) to determine hx and Nux at multiple axial positions, providing a detailed profile of the local heat transfer behavior along the heated wall.
The equivalent diameter (Dh), which determines the Reynolds number, may be written as
Re = UDh
The friction factor can be defined as
f = Δp(Dh)/2(ρLU2)
Lastly, the Nusselt number and friction factor ratios are used to compute the thermal enhancement factor (TEF) as
TEF = (Nu/Nus)(f/fs)−1/3
In our current setup, the channel walls were insulated using an insulating layer that left the observation window exposed for TLC visualization. This configuration allowed simultaneous. The heating system featured an electric polyimide film radiator installed on the bottom wall, measuring 150 mm in width and 900 mm in length. A uniform heat flux of 600 W/m2 was precisely controlled via a variac transformer connected to the heating coils with an accuracy of ±0.1 °C [22], measure the temperature change at the heat exchange surface within the test range of 30–35 °C [23]. To reduce heat loss and enhance measurement accuracy, the test section was insulated. Wall temperatures were monitored using thermochromic liquid crystals (TLCs) placed on the bottom wall, with surface temperature distributions captured by a high-resolution camera. Additionally, eight resistance temperature detectors (RTDs) positioned at the channel’s entry and exit continuously monitored air temperature, providing real-time data for analysis [24].

3. Experimental Facility Setup

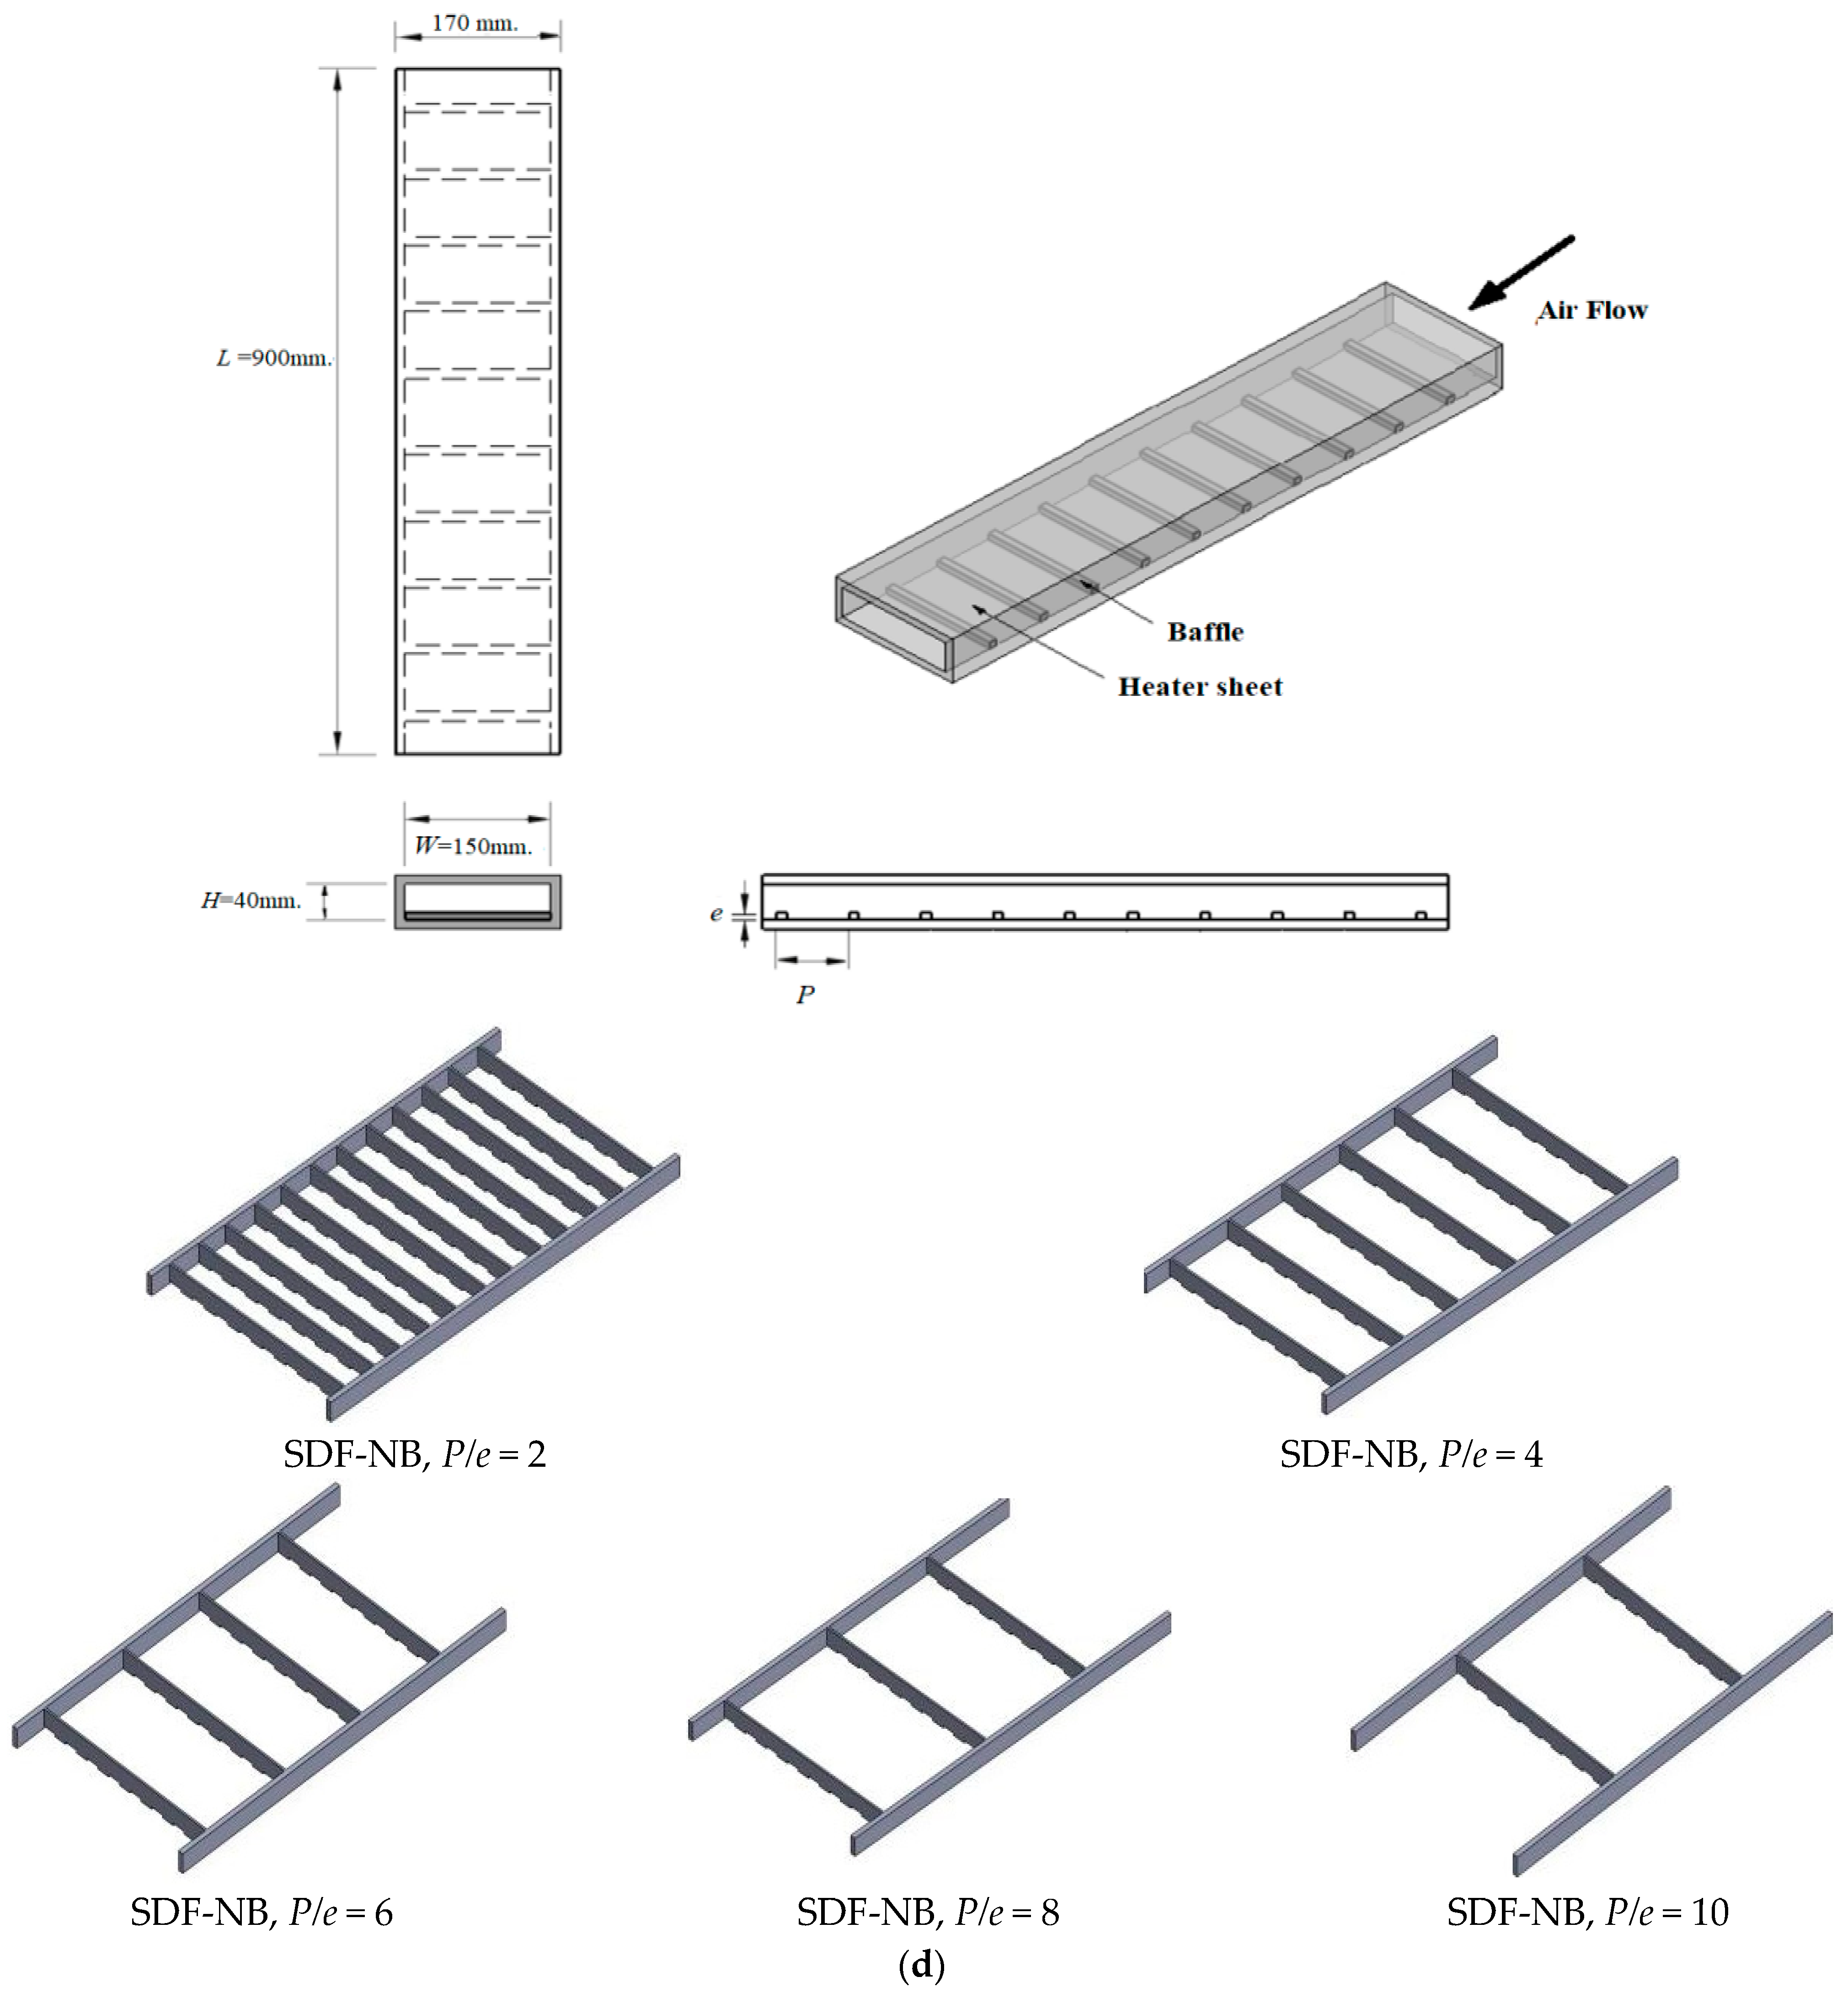
Figure 1 shows a schematic diagram of the experimental setup. The rectangular heat exchanger channel, measuring 3500 mm in length with a cross-section of 150 mm × 40 mm, consisted of three main sections: an entry (or calming) section, a test section, and an outflow section. The channel walls were well-insulated to minimize heat loss. Airflow through the channel was driven by a 2.2 kW fan and regulated by an inverter. A voltage-rectifying transformer controlled the power supply, delivering a constant heat flux of 600 W/m2 to the bottom surface of the test section. The bulk air temperature was estimated by averaging the readings from eight RTD Pt100 thermocouples (HI-DEN HEATTECH, Bang Nam Chuet, Thailand) positioned at the inlet and outlet of the heated section. The wall temperatures of the channel were measured using thermochromic liquid crystal (TLC) sheets, with color changes captured by a high-resolution digital camera. A digital pressure gauge measured the pressure drop across the test section to determine the friction factor. All data were collected under steady-state conditions. Figure 2 illustrates the configurations of conventional transverse baffles and notched baffles arranged in both inline and staggered patterns. The notched baffles were mounted on the inner surfaces of the lower walls of the channels. The notch height-to-baffle height ratio (N/e) was kept constant at 0.125, and the spacing between adjacent notches (b) was fixed at 10 mm. The roughness pitch ratio (P/e) was varied from 2.0 to 10. A summary of the channel dimensions, baffle geometry, and operating conditions is provided in Table 1.
In order to enable simultaneous heating, thermal insulation, and surface temperature measurement using the TLC method, the test section was wrapped with a multi-layer insulation to minimize both radial and axial heat losses, while a dedicated observation window was left directly above the heated surface. This window allowed unobstructed optical access for recording the color patterns of the TLC sheet without compromising the effectiveness of the insulation. Heating was provided by a polyimide electric film heater installed on the bottom wall of the test section, delivering a uniform heat flux controlled via a variac transformer. The TLC sheet was attached to the heated surface inside the observation window, and the color change was recorded using a high-resolution digital camera. Table 2 shows the specifications of the instruments used for the calibration and experiment.
Prior to the experiments, the TLC sheet was calibrated under a constant wall-temperature condition using a controlled heating setup. The calibration was performed under the same environmental and operational conditions as the actual tests, ensuring that the hue–temperature relationship remained accurate and directly applicable to the experimental runs. Data reliability was further ensured through instrument calibration and duplicate trials for each test condition. Additionally, all individual experimental datasets have been provided in the Electronic Supplementary Information (ESI) for transparency and reproducibility.
To ensure the reliability of the experimental results, the uncertainties of all directly measured and derived quantities were evaluated following the methodology of Kline and McClintock [25], using the root-sum-square (RSS) approach. This method calculates the propagated uncertainty of derived parameters, such as the Reynolds number (Re), Nusselt number (Nu), and friction factor (f), from the individual uncertainties of all directly measured variables.
The main sources of measurement error included thermocouple/TLC calibration drift, flow-rate fluctuations, pressure sensor resolution, and unavoidable heat losses to the surroundings. Typical uncertainties of the primary measurements were ±0.1 °C for air and surface temperatures, ±0.1% psi for pressure drop, and ±1.0% L/s for volumetric flow rate. Based on these values, the propagated uncertainties were calculated as ±3.54% for Re, ±3.10% for Nu, and ±5.34% for f.
The propagation of uncertainty for a calculated parameter X from n directly measured variables xi is expressed as:
ω X = X x 1 ω 1 2 + X x 2 ω 2 2 + + X x n ω n 2
Based on this methodology, the combined uncertainties for the three key parameters in this study were calculated as follows:
Reynolds number (Re)
ω R e R e = ω ρ ρ 2 + ω U U 2 + ω D h D h 2 + ω μ μ 2
Nusselt number (Nu)
ω N u N u = ω h h 2 + ω D h D h 2 + ω k k 2
Friction factor (f)
ω f f = ω Δ P Δ P 2 + ω D h D h 2 + ω ρ ρ 2 + ω L L 2 + ω U U 2
Table 3 summarizes the uncertainty levels for all directly measured parameters, while Table 4 presents the combined uncertainties for the key derived parameters.
The calculated uncertainties are well within acceptable limits for experimental thermofluid research, where values below ±6% are generally considered reliable. Moreover, these uncertainties are smaller than the observed differences between configurations (<3.10% for Nu and <5.34% for f), ensuring that the reported trends and conclusions remain valid despite measurement variability. The reported uncertainty levels are also consistent with those documented in similar experimental studies, further confirming the credibility of the present results.

4. Experimental Results

4.1. Validation of Flow and Heat Transfer Characteristics in a Smooth Channel

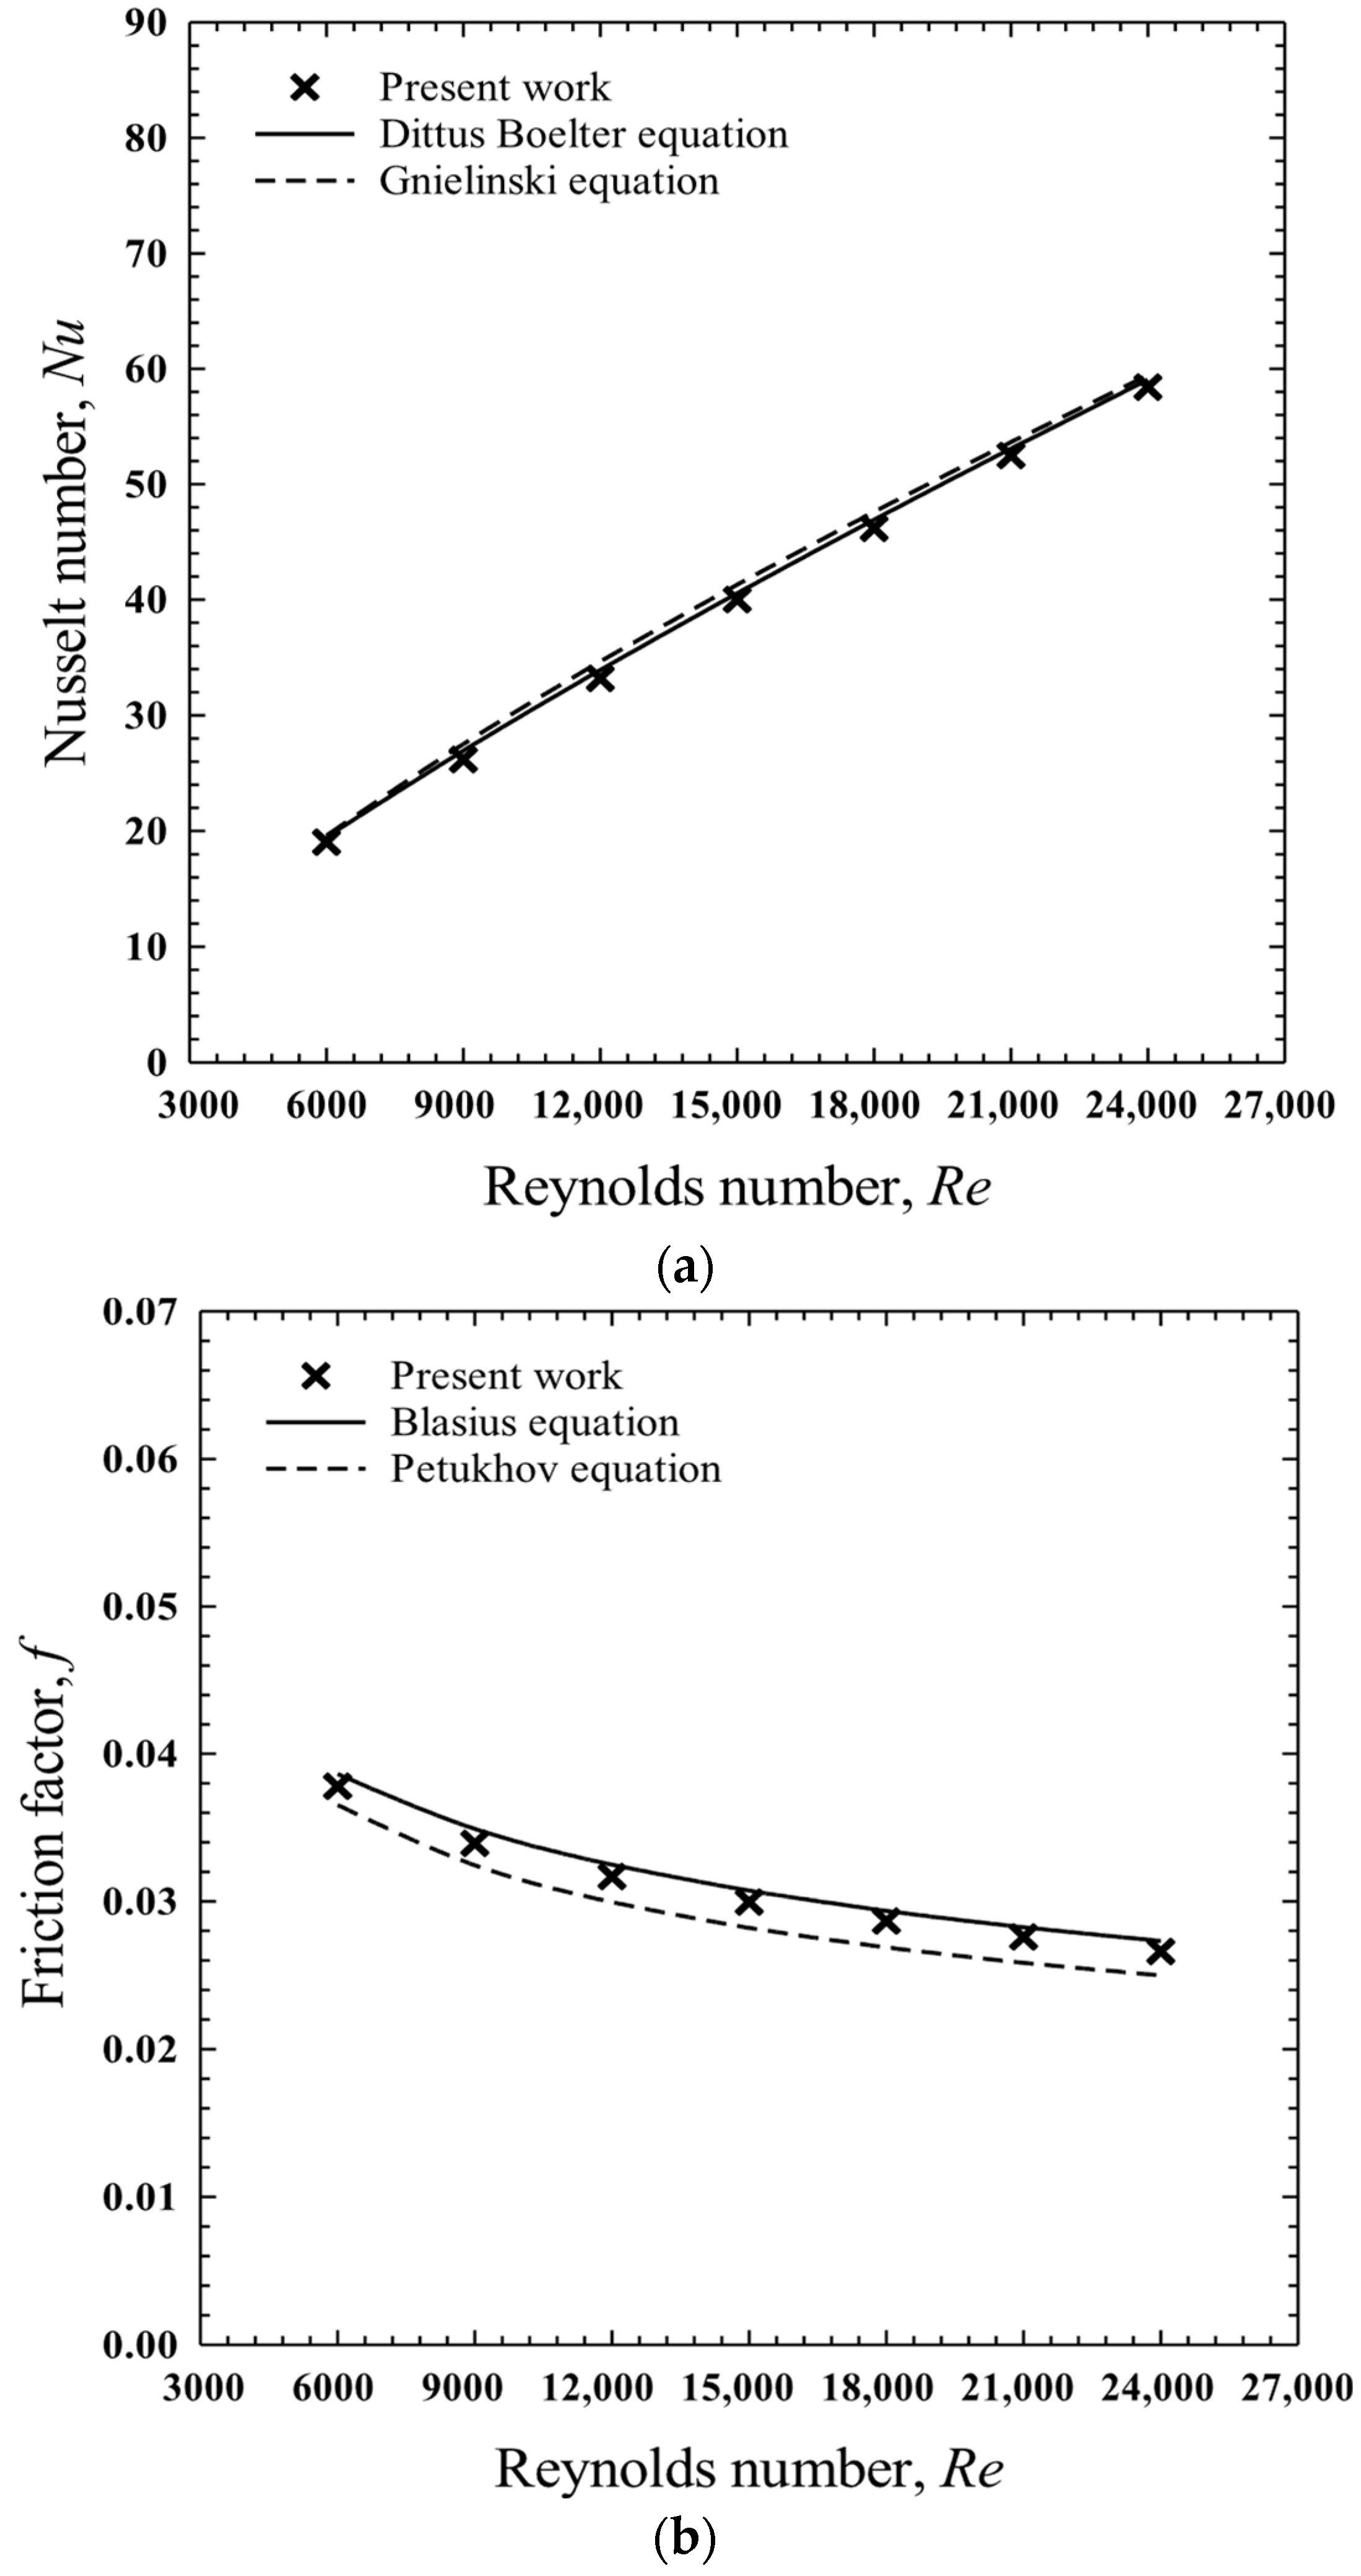
Figure 3a illustrates the relationship between the Reynolds number and the Nusselt number for a smooth channel. The experimental results showed that the Nusselt number increased with increasing Reynolds number. The experimentally obtained values closely matched those predicted by the Dittus–Boelter and Gnielinski correlation equations across the entire tested range. The maximum average error between the experimental Nusselt number and the values from both correlations was found to be ±3.2%. Figure 3b illustrates the relationship between the Reynolds number and the friction factor for a smooth channel. The results showed that the friction factor decreased as the Reynolds number increased. The experimental data were comparable to the values predicted by the Blasius and Petukhov correlation equations, with a maximum average error of ±10.4%.

4.2. Effect of Baffle Pitch to Baffle Height Ratio, (P/e): Case I: Conventional Transverse Baffles (TBs)

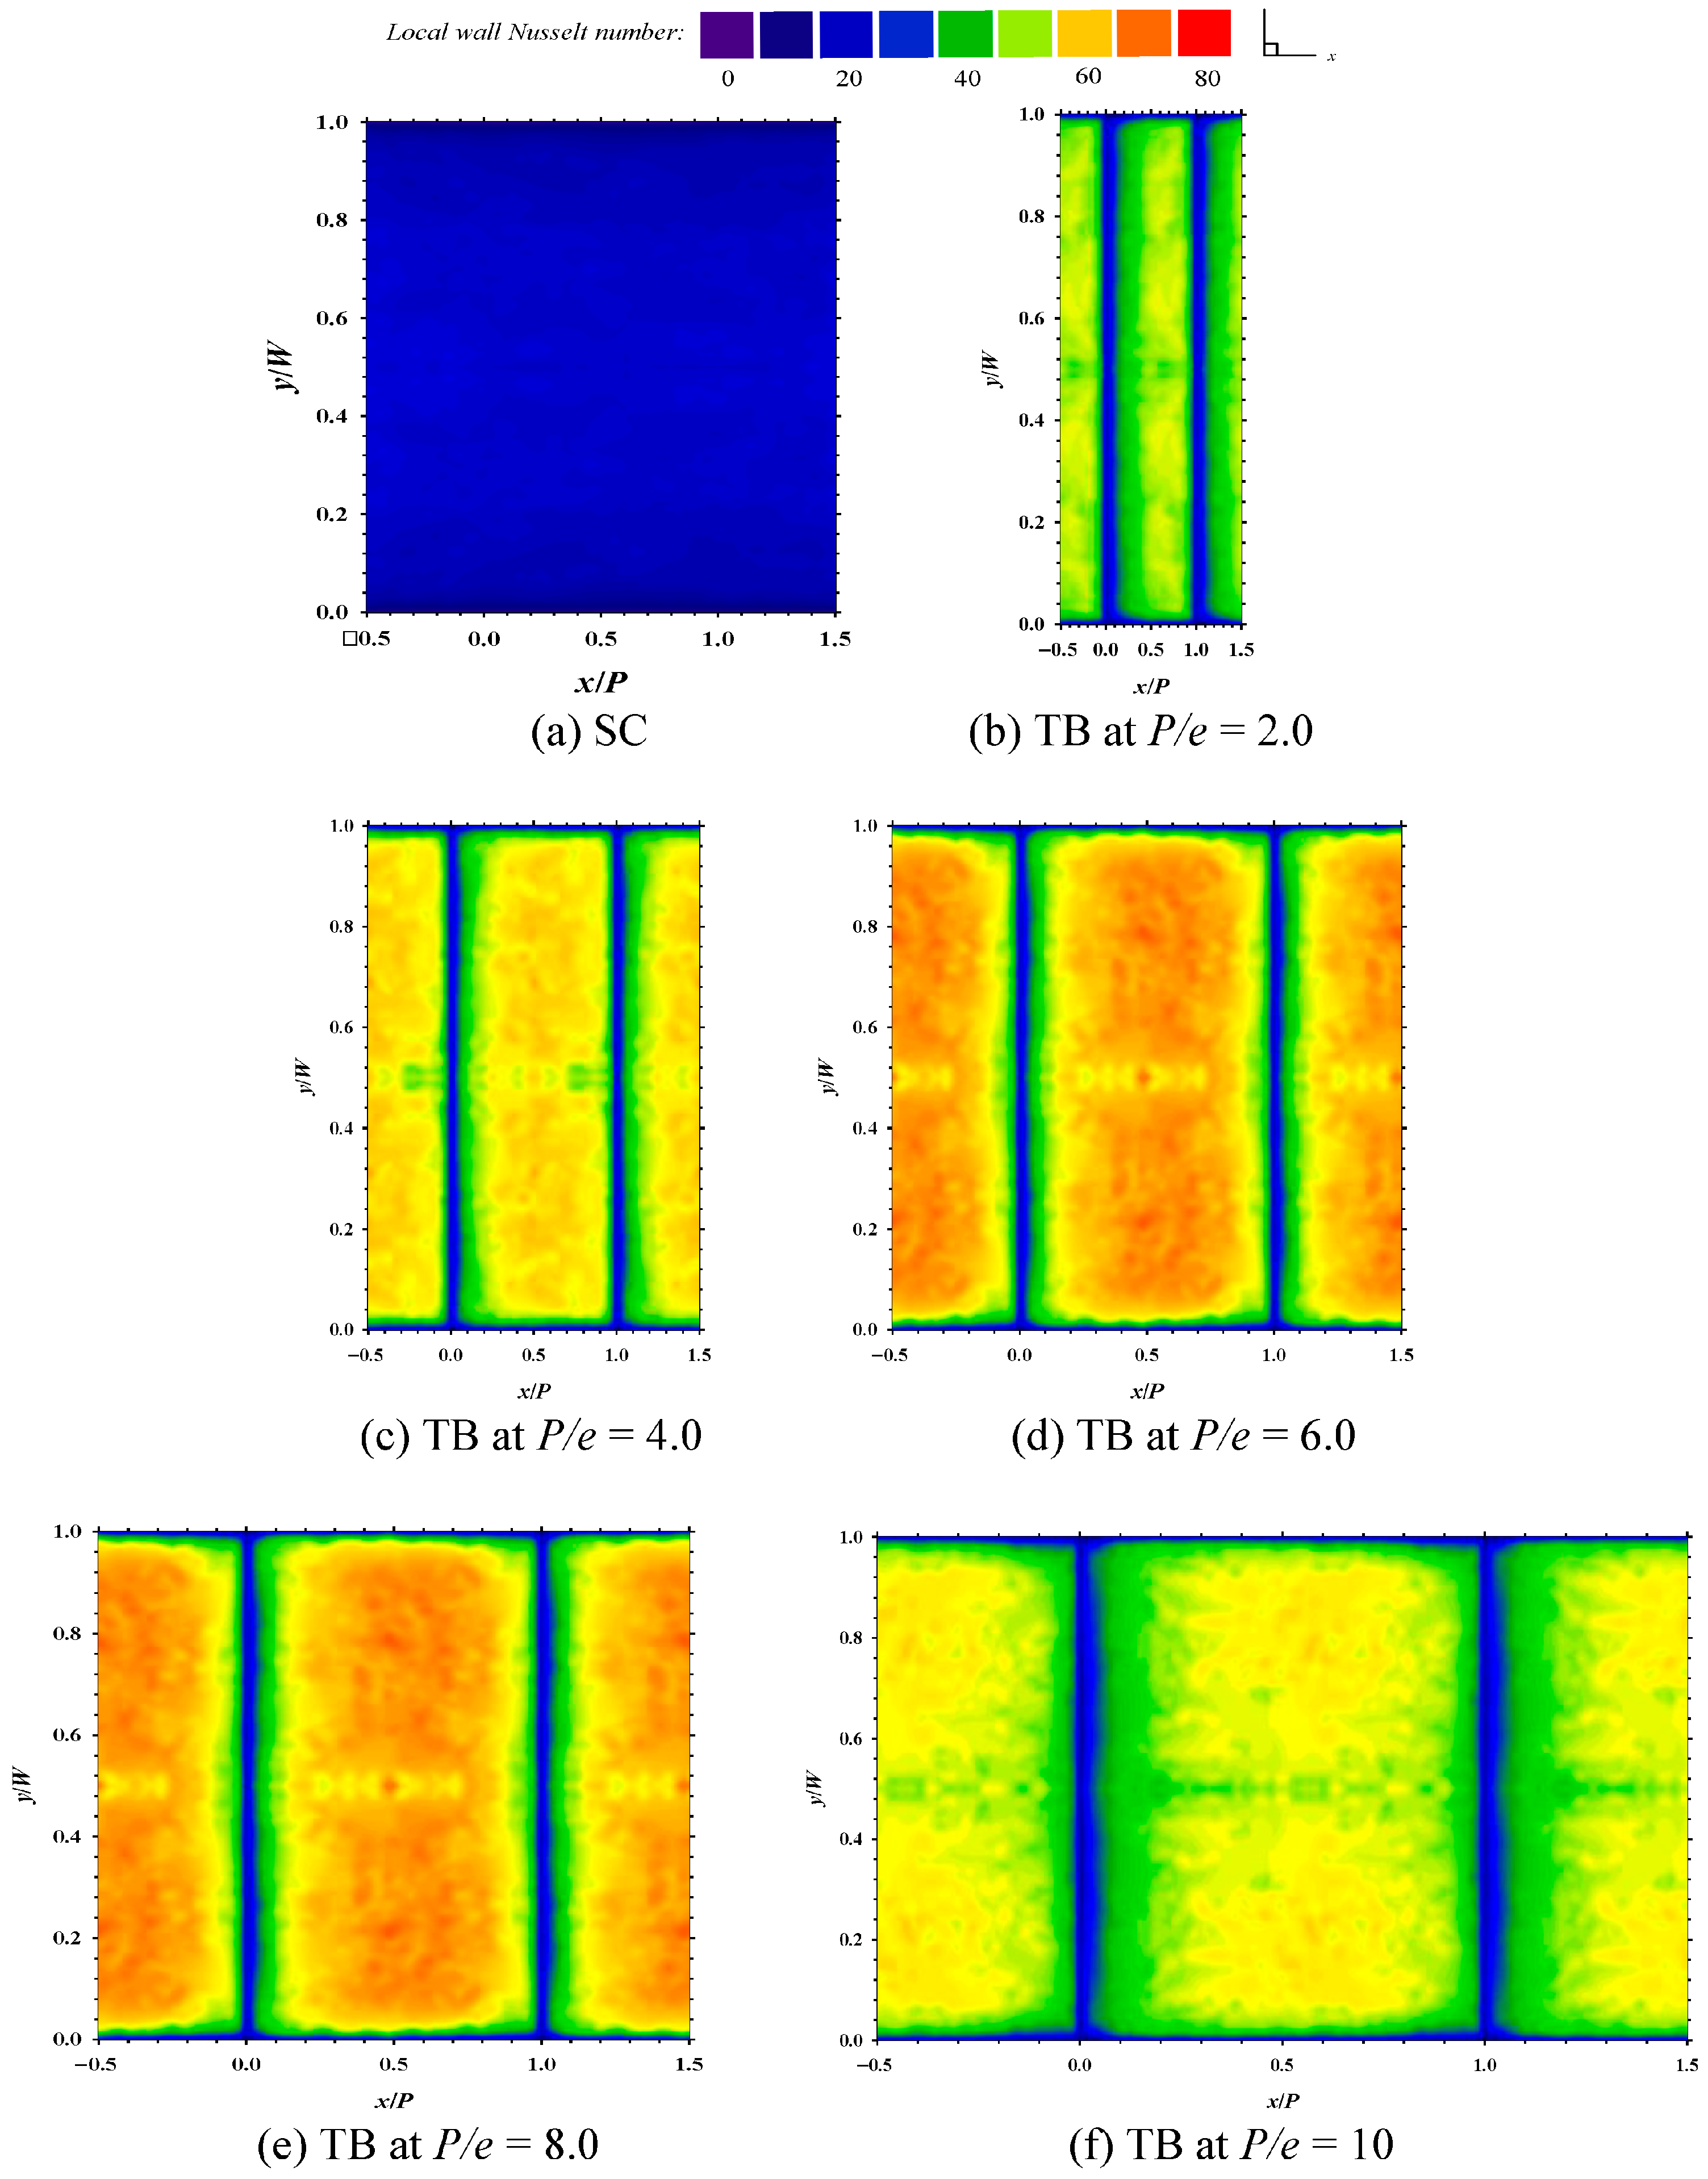
Figure 4 presents the Nusselt number (Nu) distributions in channels equipped with Conventional transverse baffles at various pitch-to-height ratios (P/e), ranging from 2.0 to 10.0. The experiments were conducted at a fixed baffle height-to-channel height ratio (e/H) of 0.3 and a Reynolds number (Re) of 6000. For comparison, results for a smooth channel are also included. The smooth channel showed a uniformly low Nusselt number throughout, as there was no significant disturbance to the flow to enhance heat transfer. In contrast, the baffle-equipped channels displayed distinct patterns characterized by alternating regions of high and low Nusselt numbers. High-Nusselt-number regions were associated with flow reattachment zones downstream of the baffles. Meanwhile, low-Nusselt-number regions were found near where each baffle was located and flow separation occurred. These observations highlight the role of baffle in controlling the thermal boundary layer and promoting heat transfer.
Figure 4 also illustrated that the Nusselt number distribution was strongly influenced by the pitch-to-height ratio (P/e) of the baffles. Baffles with very small (P/e = 2.0–4.0) or very large (P/e = 10) pitch ratios resulted in poor heat transfer performance. For small pitch ratios, the space between adjacent baffles was too narrow, causing semi-continuous flow separation and limited reattachment, which weakened the overall convective heat transfer. In contrast, very large pitch ratios allowed the flow to pass with minimal interaction with the baffles, leading to weak turbulence and reduced heat transfer. The best performance was observed at moderate pitch ratios (P/e = 6.0–8.0), where strong flow reattachment and well-developed recirculation zones promoted higher and more uniform Nusselt number distributions. This was visually represented by a more even spread of orange and red hues along the channel wall, indicating enhanced heat transfer. Notably, the most intense orange and red coloration appeared at P/e = 6.0, suggesting this ratio provided the highest Nusselt number among all configurations tested.
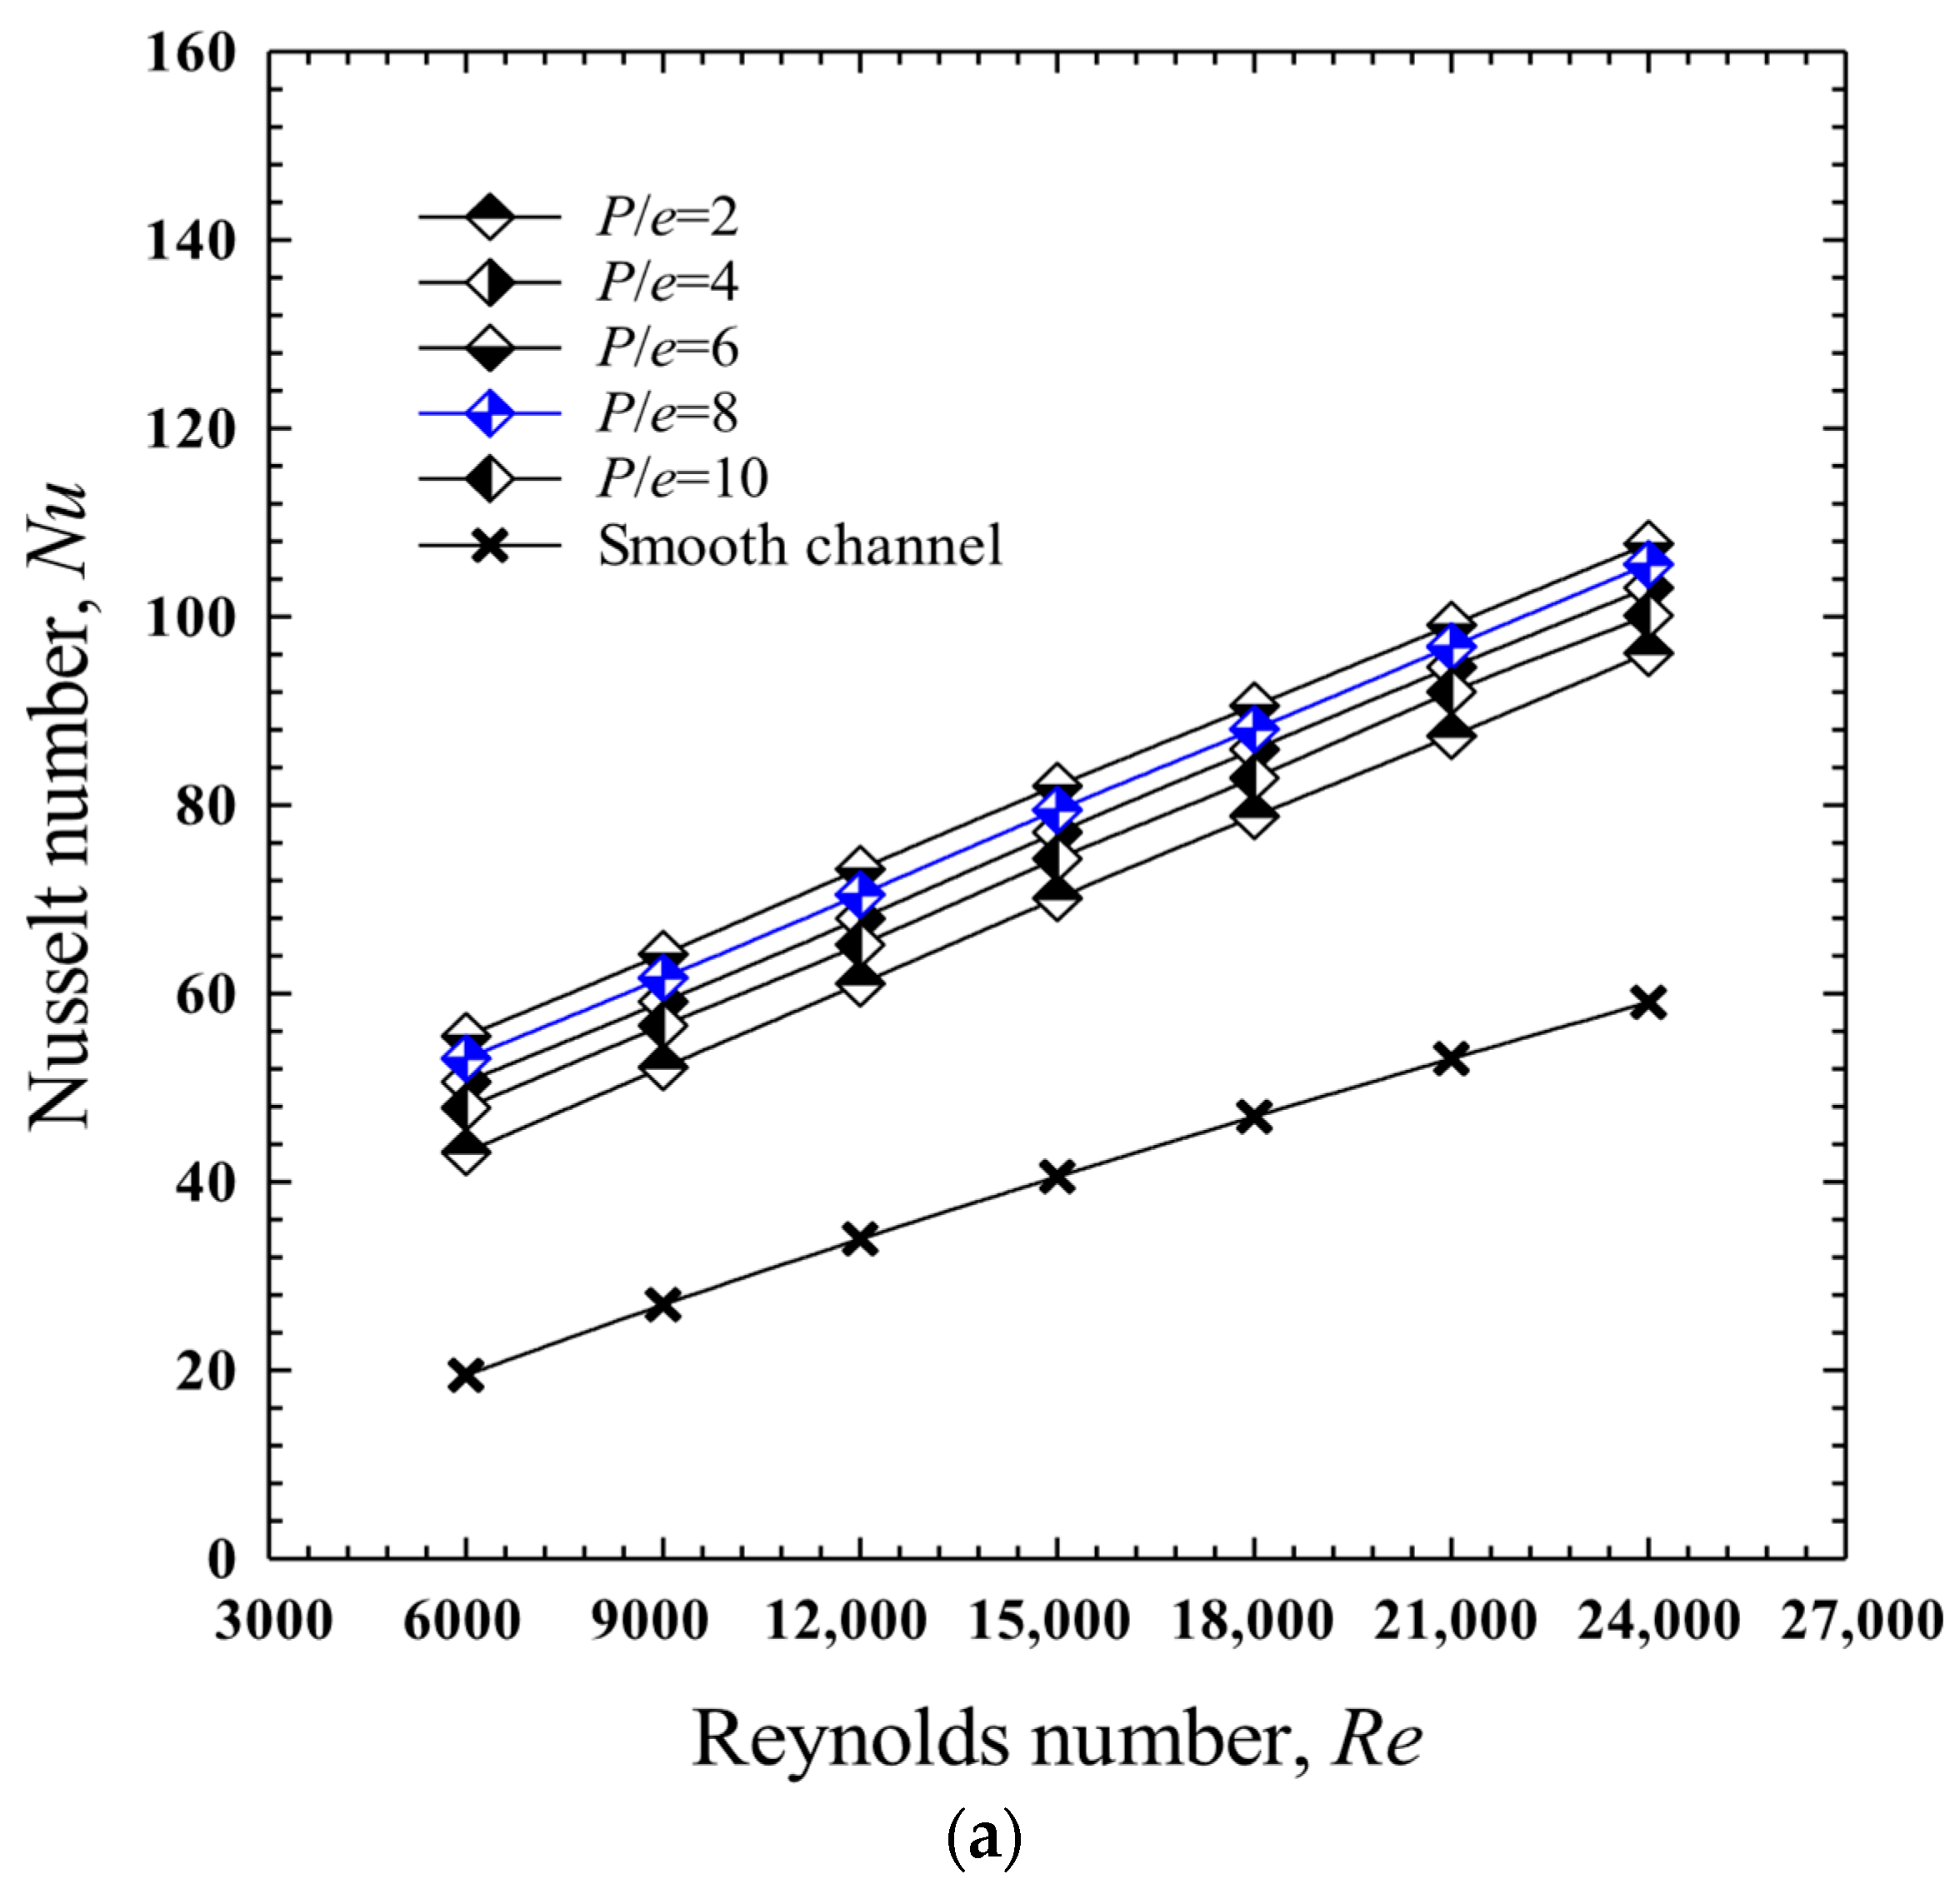
Figure 5a,b show the heat transfer performance in a channel fitted with straight conventional transverse baffles (TB) at different pitch-to-height ratios (P/e), evaluated over a Reynolds number range from 6000 to 24,000. Figure 5a presents the Nusselt number (Nu), while Figure 5b shows the Nusselt number ratio (Nu/Nus), where Nus refers to the value for a smooth channel. As expected, the Nusselt number increased with Reynolds number due to the higher turbulence intensity, which enhanced convective heat transfer. Nevertheless, the Nusselt number ratio decreased as the Reynolds number increased. This is due to the naturally thinner thermal boundary layer at higher flow rates, which makes further enhancement less significant. Among the tested configurations, the TBs with a P/e ratio of 6.0 delivered the highest Nusselt number, followed by those with P/e values of 8.0, 4.0, 10, and 2.0, respectively. The highest Nusselt number of 107.8, corresponding to a Nusselt number ratio of 2.848, was observed at a Reynolds number of 24,000 for the P/e = 6.0 configuration.
Figure 6a,b show the influence of conventional transverse baffles and the baffle pitch-to-height ratio (P/e) on the friction factor (f) and the friction factor ratio (f/fs), respectively, where fs represents the friction factor for a smooth channel. The presence of conventional transverse baffles significantly increased friction losses, primarily due to secondary flows generated by flow separation and reattachment around the baffles. For all P/e ratios considered, the friction factor decreased as the Reynolds number increased. At a fixed Reynolds number, the highest friction loss occurred at a P/e ratio of 6.0, followed by 4.0 8.0, 2.0, and 10, respectively. This behavior appears to be governed by two key factors: (1) the intensity of flow reattachment, often associated with higher heat transfer rates or Nusselt numbers, and (2) the frequency of flow separation and reattachment events, which is influenced by the number of baffles. The highest friction loss at P/e = 6.0 can be attributed to the combined effect of strong reattachment, reflected by the highest Nusselt number, and a moderate frequency of flow disturbances due to its intermediate pitch. Interestingly, although the configuration with P/e = 8.0 yielded a higher Nusselt number than that with P/e = 4.0, it resulted in lower friction loss. This suggests that, for these cases, the frequency of flow disturbance plays a more dominant role in determining friction loss than reattachment intensity. At P/e = 2.0, the high frequency of flow separation did not result in substantial friction loss, likely because of the very weak reattachment intensity. On the other hand, the configuration with the largest pitch (P/e = 10) showed moderate reattachment intensity and fewer disturbances, leading to the lowest observed friction loss. Within the examined Reynolds number range, the highest friction factor of 0.606 and the maximum friction factor ratio of 15.686 were recorded at P/e = 6.0 and Re = 6000.
Figure 5 and Figure 6 show the effects of Reynolds number, number and Pitch-to-baffle height ratio (P/e) on friction loss. Both friction factor (f) and friction factor enhancement ratio (f/fs) decrease with increasing Reynolds number. Similarly to heat transfer results, P/e = 6 cause higher friction loss than other values. The results can be attributed to the larger surface areas or blockage of flow passage as compared to those of other values. Moreover, the additional vortex effect of baffle also relates to the promoted friction loss. The increased friction loss primarily relates to the promoted vortex and swirling effects. From Figure 7, it can also be observed that Reynolds number shows greater effect on the Nusselt number and friction factor as the number of P/e reach to 6.0.
The higher friction factor directly leads to a higher pressure drop (ΔP), which in turn increases the required pumping power (P) according to P = ΔP × Q, where Q is the volumetric flow rate. While this results in a rise in energy consumption, the corresponding heat transfer enhancement outweighs the pumping penalty, yielding an overall improvement in system thermal efficiency. We have highlighted that in practical applications, the trade-off between enhanced heat transfer and additional pumping power should be considered when selecting the optimized configuration.
Figure 7 shows the relationship between the thermal enhancement factor (TEF) and Reynolds number in the rectangular channels with TBs, where the baffle pitch-to-height ratio (P/e) was varied from 2.0 to 10. The experimental results revealed a consistent trend: TEF decreases with increasing Reynolds number for all P/e values. The highest TEF was observed at P/e = 8.0, reaching a maximum value of 1.168 at a Reynolds number of 6000. For the same fan power input, the TEF for the P/e = 8.0 configuration ranged from 0.791 to 1.168, demonstrating superior heat transfer performance compared to other designs. This improvement is attributed to an optimal balance between heat transfer enhancement and the associated frictional losses. Although the baffles with P/e = 6 produced a higher Nusselt number, the increased friction offset the thermal gain, making the one with P/e = 8 configuration more efficient overall. In contrast, the lowest TEF was recorded at P/e = 2.0, which can be attributed to the minimal reattachment intensity and, consequently, a lower Nusselt number.

4.3. Effect of Baffle Pitch to Baffle Height Ratio, (P/e): Case II: In-Line Downward-Facing Notched Baffles (IDF-NB)

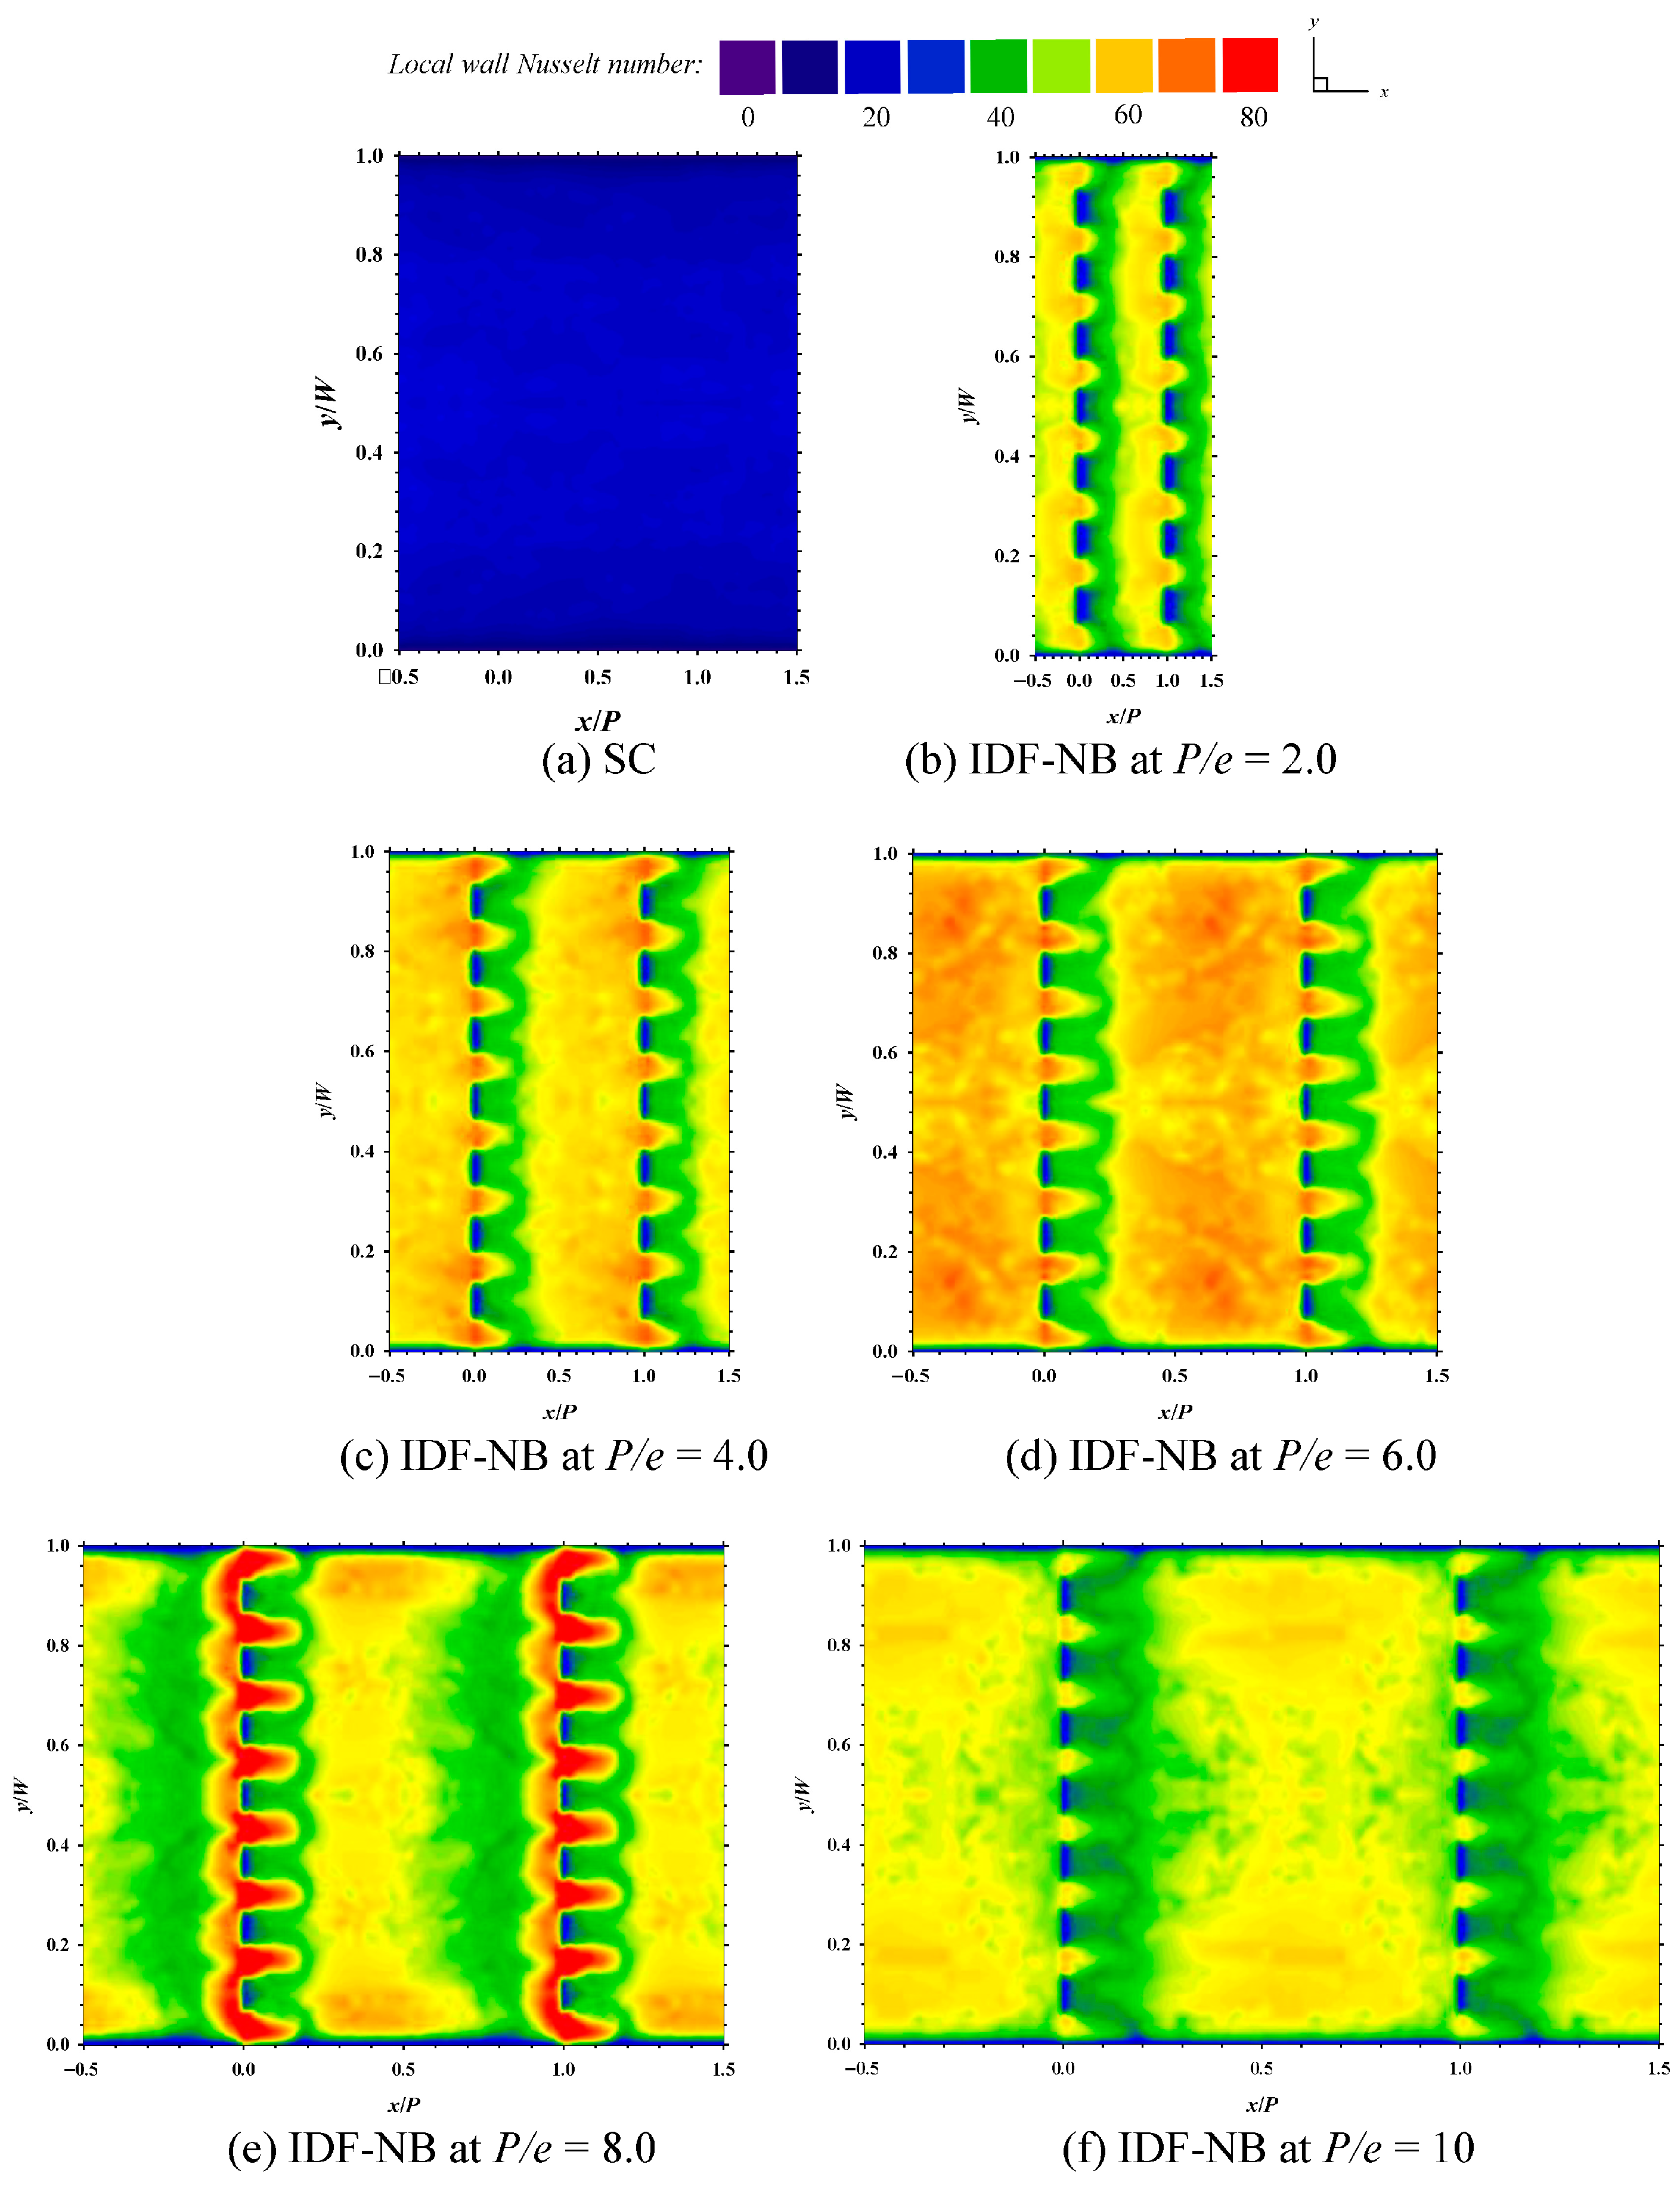
The experimental results for notched baffles arranged in-line and facing downward (IDF-NB) were analyzed to investigate the impact of varying the pitch-to-height ratio (P/e = 2.0, 4.0, 6.0, 8.0, and 10) on heat transfer performance, friction factor (f), and thermal enhancement factor (TEF). All tests were conducted at a constant notch height-to-baffle height ratio (N/e) of 0.125. Figure 8a–f presents the Nusselt number (Nu) distributions for the IDF-NB configuration, which differ notably from those observed with conventional transverse baffles. The regions with baffle notches exhibited higher Nusselt numbers due to flow reattachment occurring through the perforations. This reattachment effectively reduced dead zones that were commonly seen with transverse baffles. As the P/e ratio increased from 2.0 to 6.0, the Nusselt number rose significantly, and the temperature distribution became more uniform. However, beyond P/e = 6.0, both the magnitude and uniformity of the Nusselt number began to decline. Notably, the difference in Nu distribution between P/e = 6.0 and 8.0 was more substantial in this case (IDF-NB) than in Case I with conventional transverse baffles. At P/e = 6.0, the heat transfer intensity was much higher compared to P/e = 8.0, indicating a stronger thermal enhancement at the optimal pitch ratio.
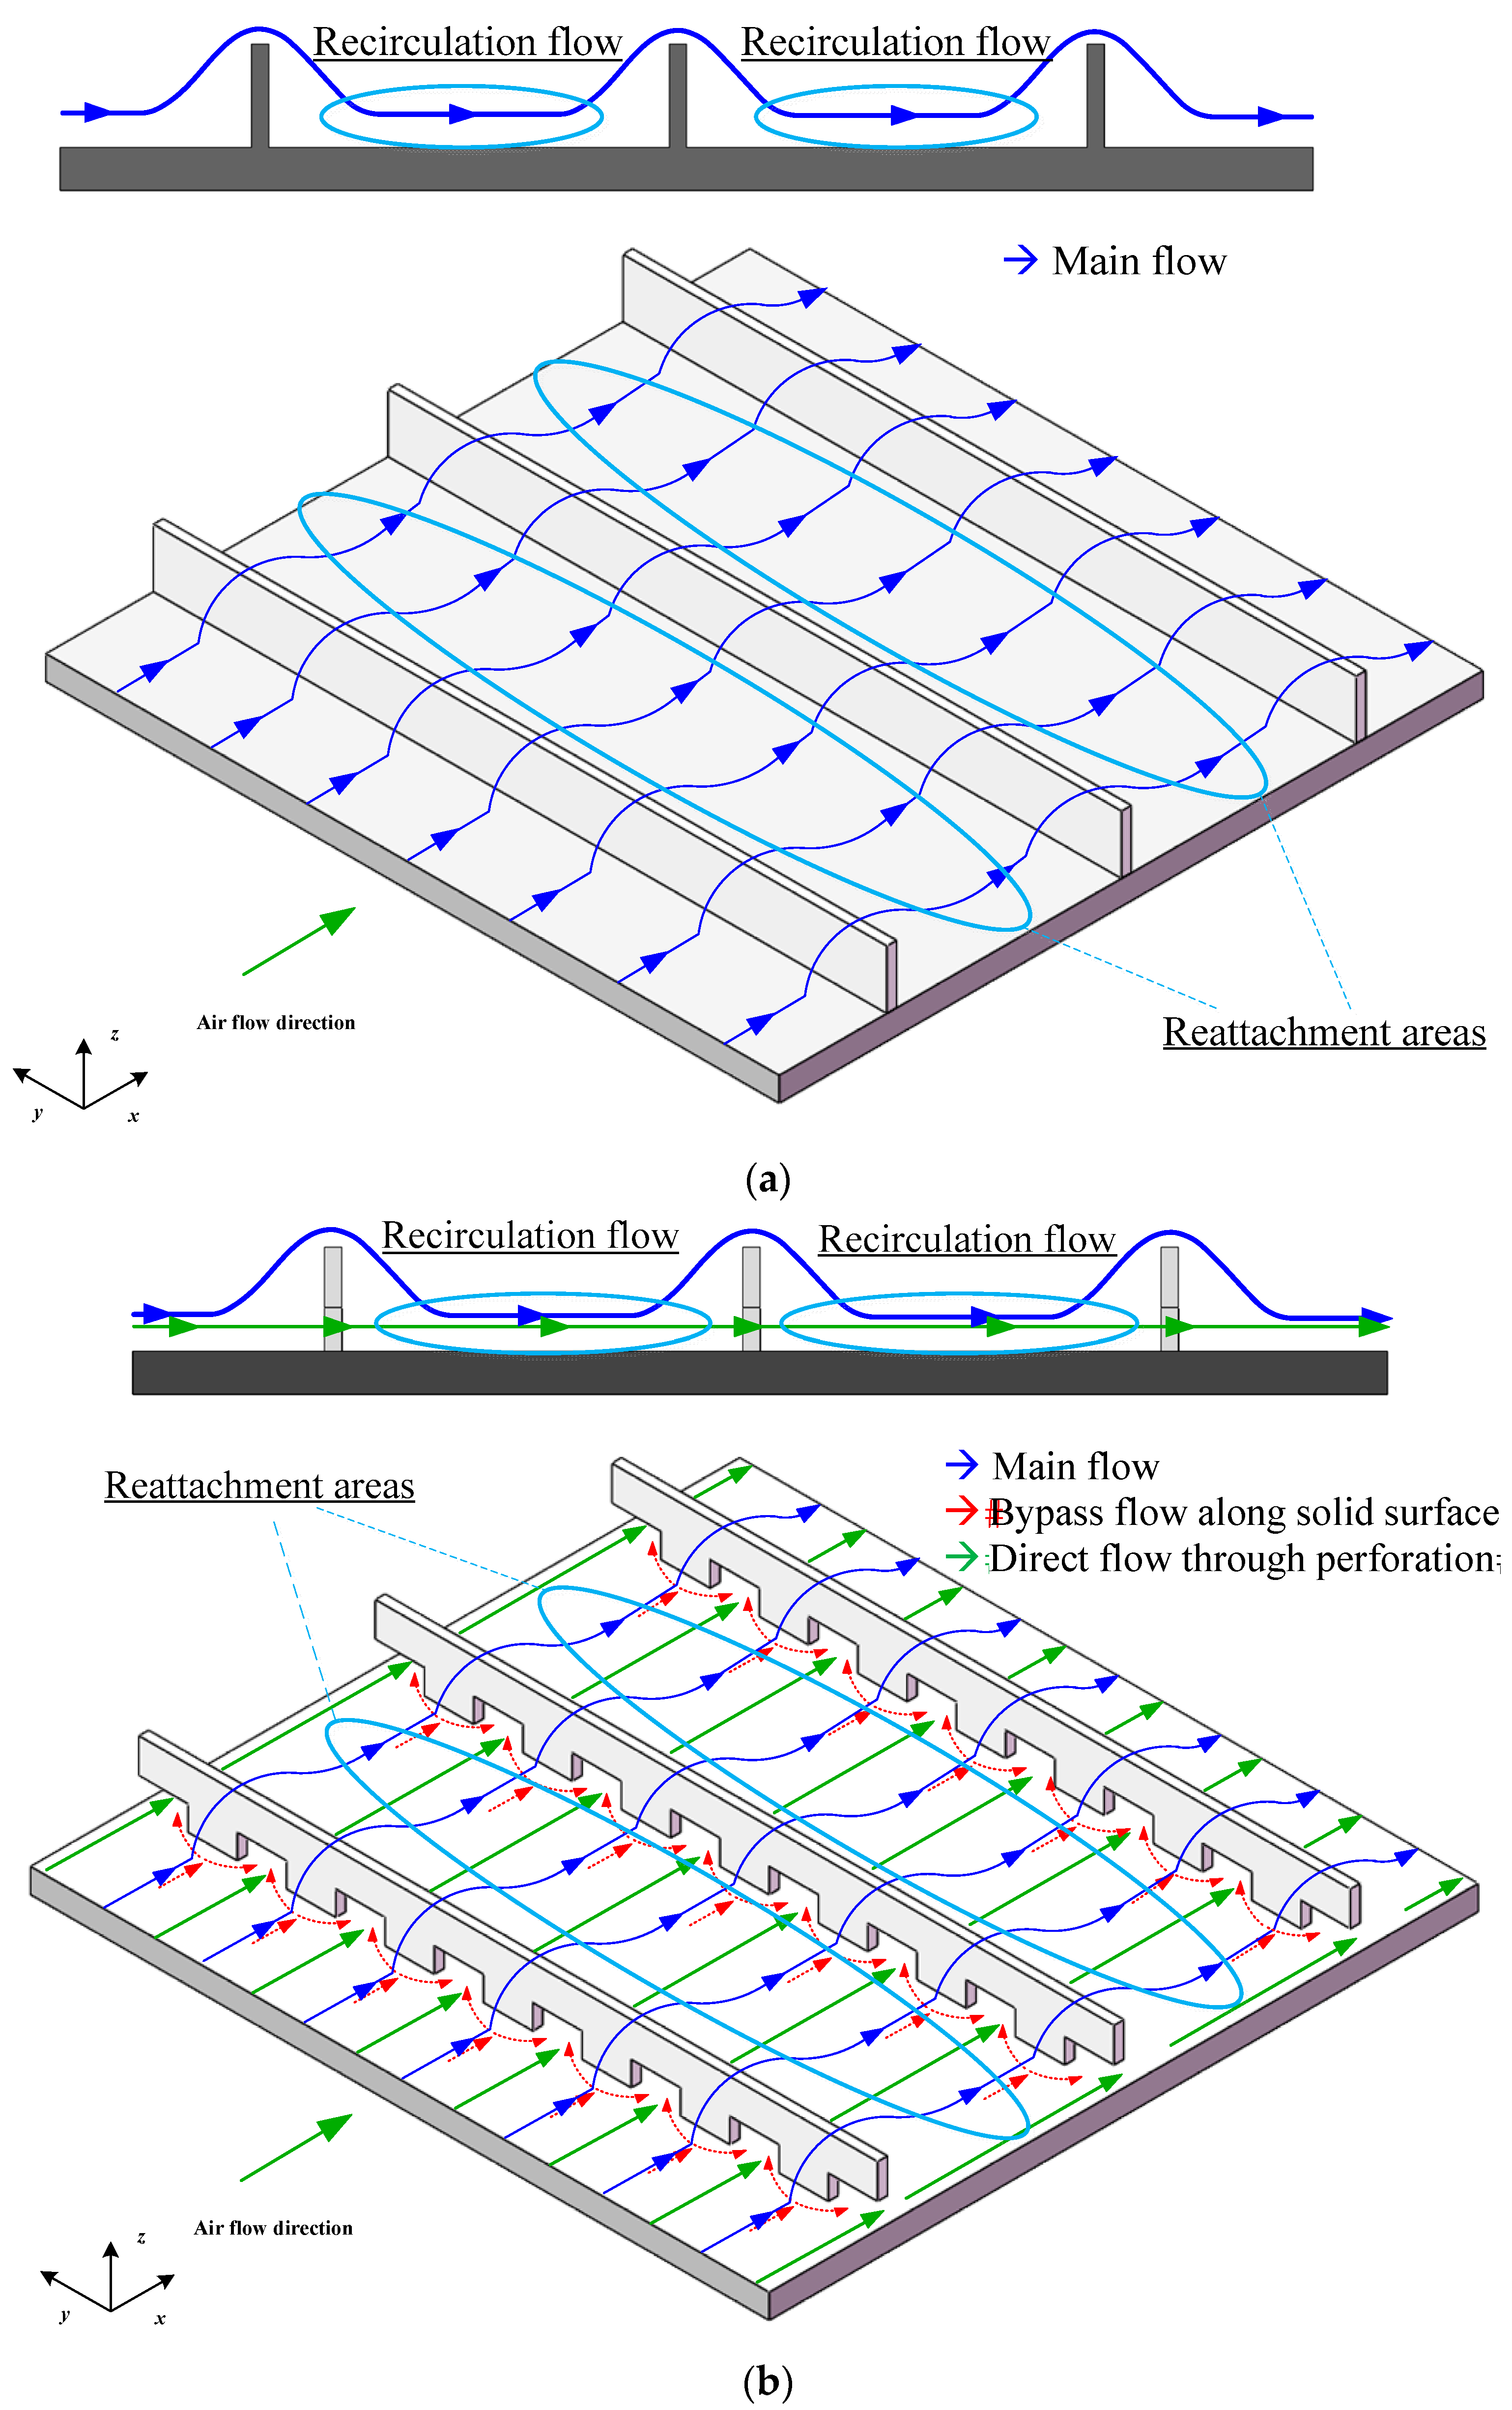
This statement regarding reduced dead zones in the notched and staggered configurations is based on qualitative analysis from flow patterns and temperature contour maps. To better illustrate the airflow behavior in the channel equipped with the notched baffle aligned in-line and facing downward (In-line Downward-Facing Notched Baffle: IDF-NB), Figure 9 presents a schematic of the airflow pattern. The flow can be categorized into three distinct portions:
  • Main flow (blue arrows): This portion represents the primary airflow that travels along the channel and experiences flow separation and reattachment upon encountering the baffles.
  • Direct flow through perforation (green arrows): This airflow passes directly through the notches (perforations) in the baffles, providing an alternate path.
  • Bypass flow along solid surface (red arrows): This portion strikes the solid area adjacent to the perforations and is redirected along the baffle surface, sweeping the dead zone in front of the baffle before entering through the perforation.
The second and third flow portions play an important role in reducing stagnation zones both in front of and beneath the baffles, thereby improving overall flow uniformity and heat transfer performance.
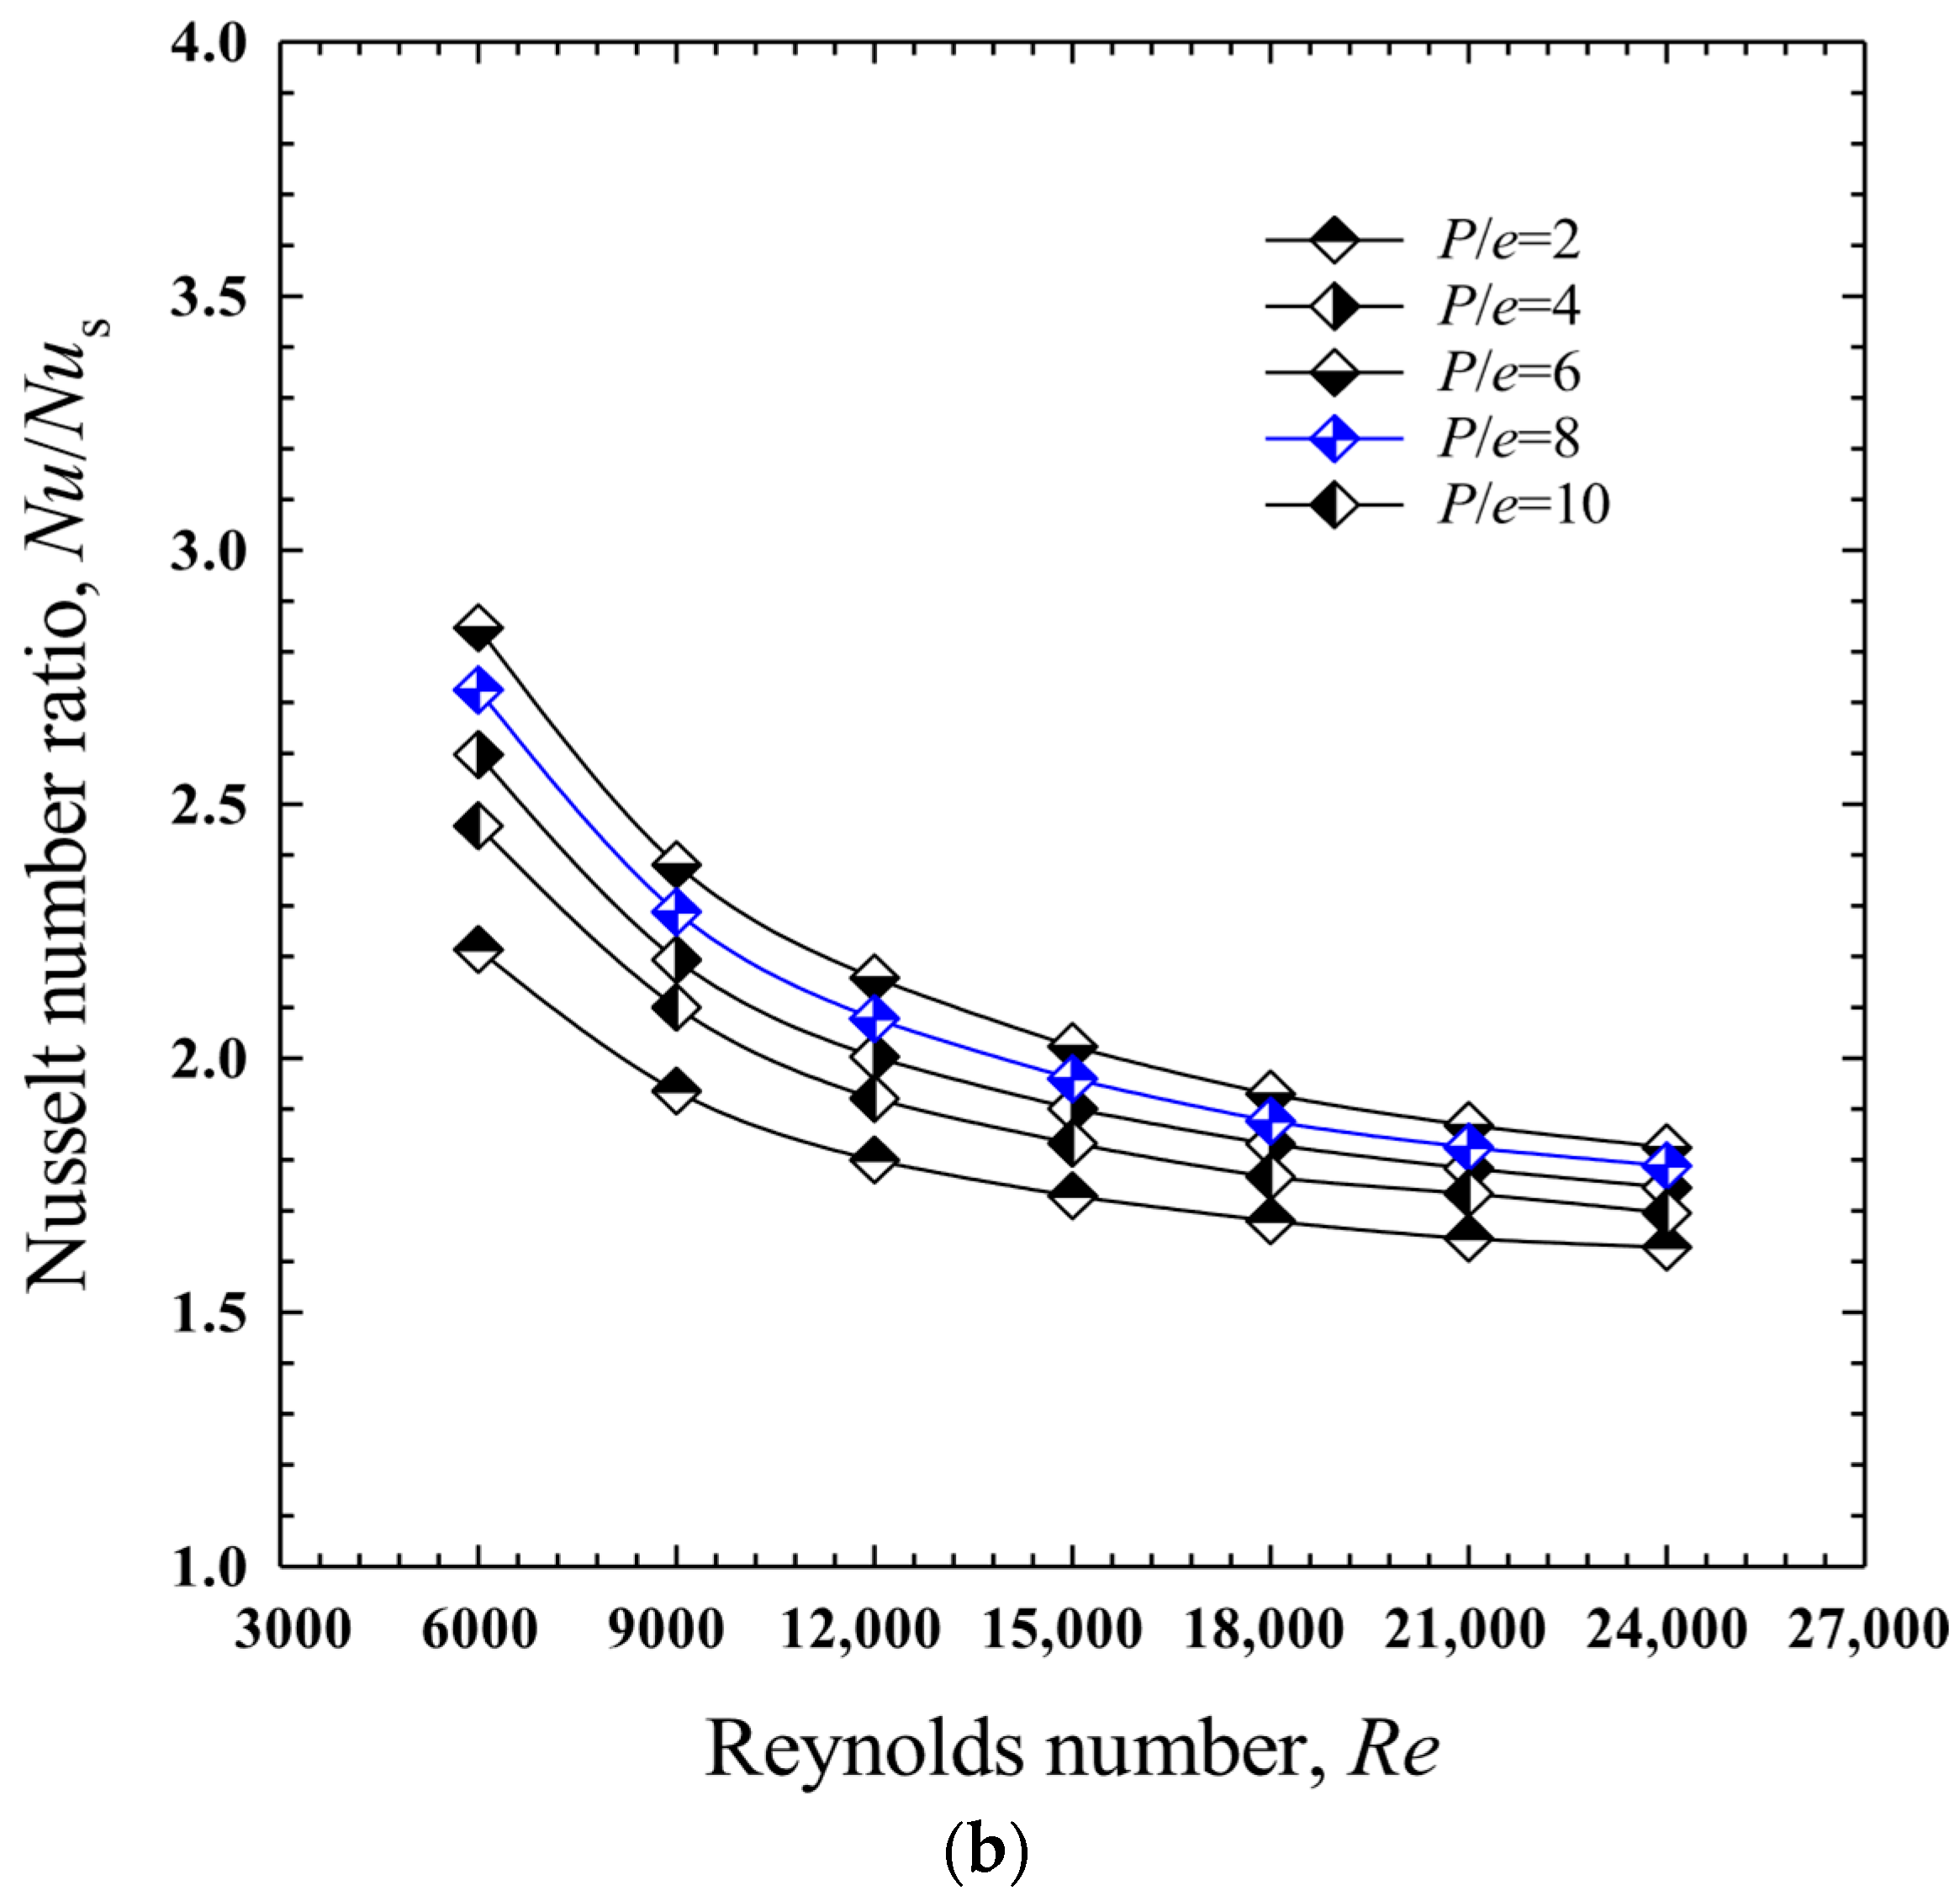
Figure 10a,b illustrate the variations in the Nusselt number and the Nusselt number ratio with Reynolds number in the turbulent flow regime, ranging from 6000 to 24,000. The results show that the use of IDF-NBs significantly enhances heat transfer compared to a smooth channel across all P/e values. Among the configurations tested, the baffles with a P/e ratio of 6 achieved the highest Nusselt number, followed in order by P/e values of 4.0, 8.0, 10, and 2.0. The maximum Nusselt number of 110.4 was recorded at a Reynolds number of 24,000 for the P/e = 6.0 configuration, corresponding to a Nusselt number ratio of 2.891. Overall, the Nusselt number ratios for the IDF-NB configuration with a P/e ratio of 6.0 ranged from 1.869 to 2.891, demonstrating a consistent and significant enhancement in convective heat transfer compared to the smooth channel.
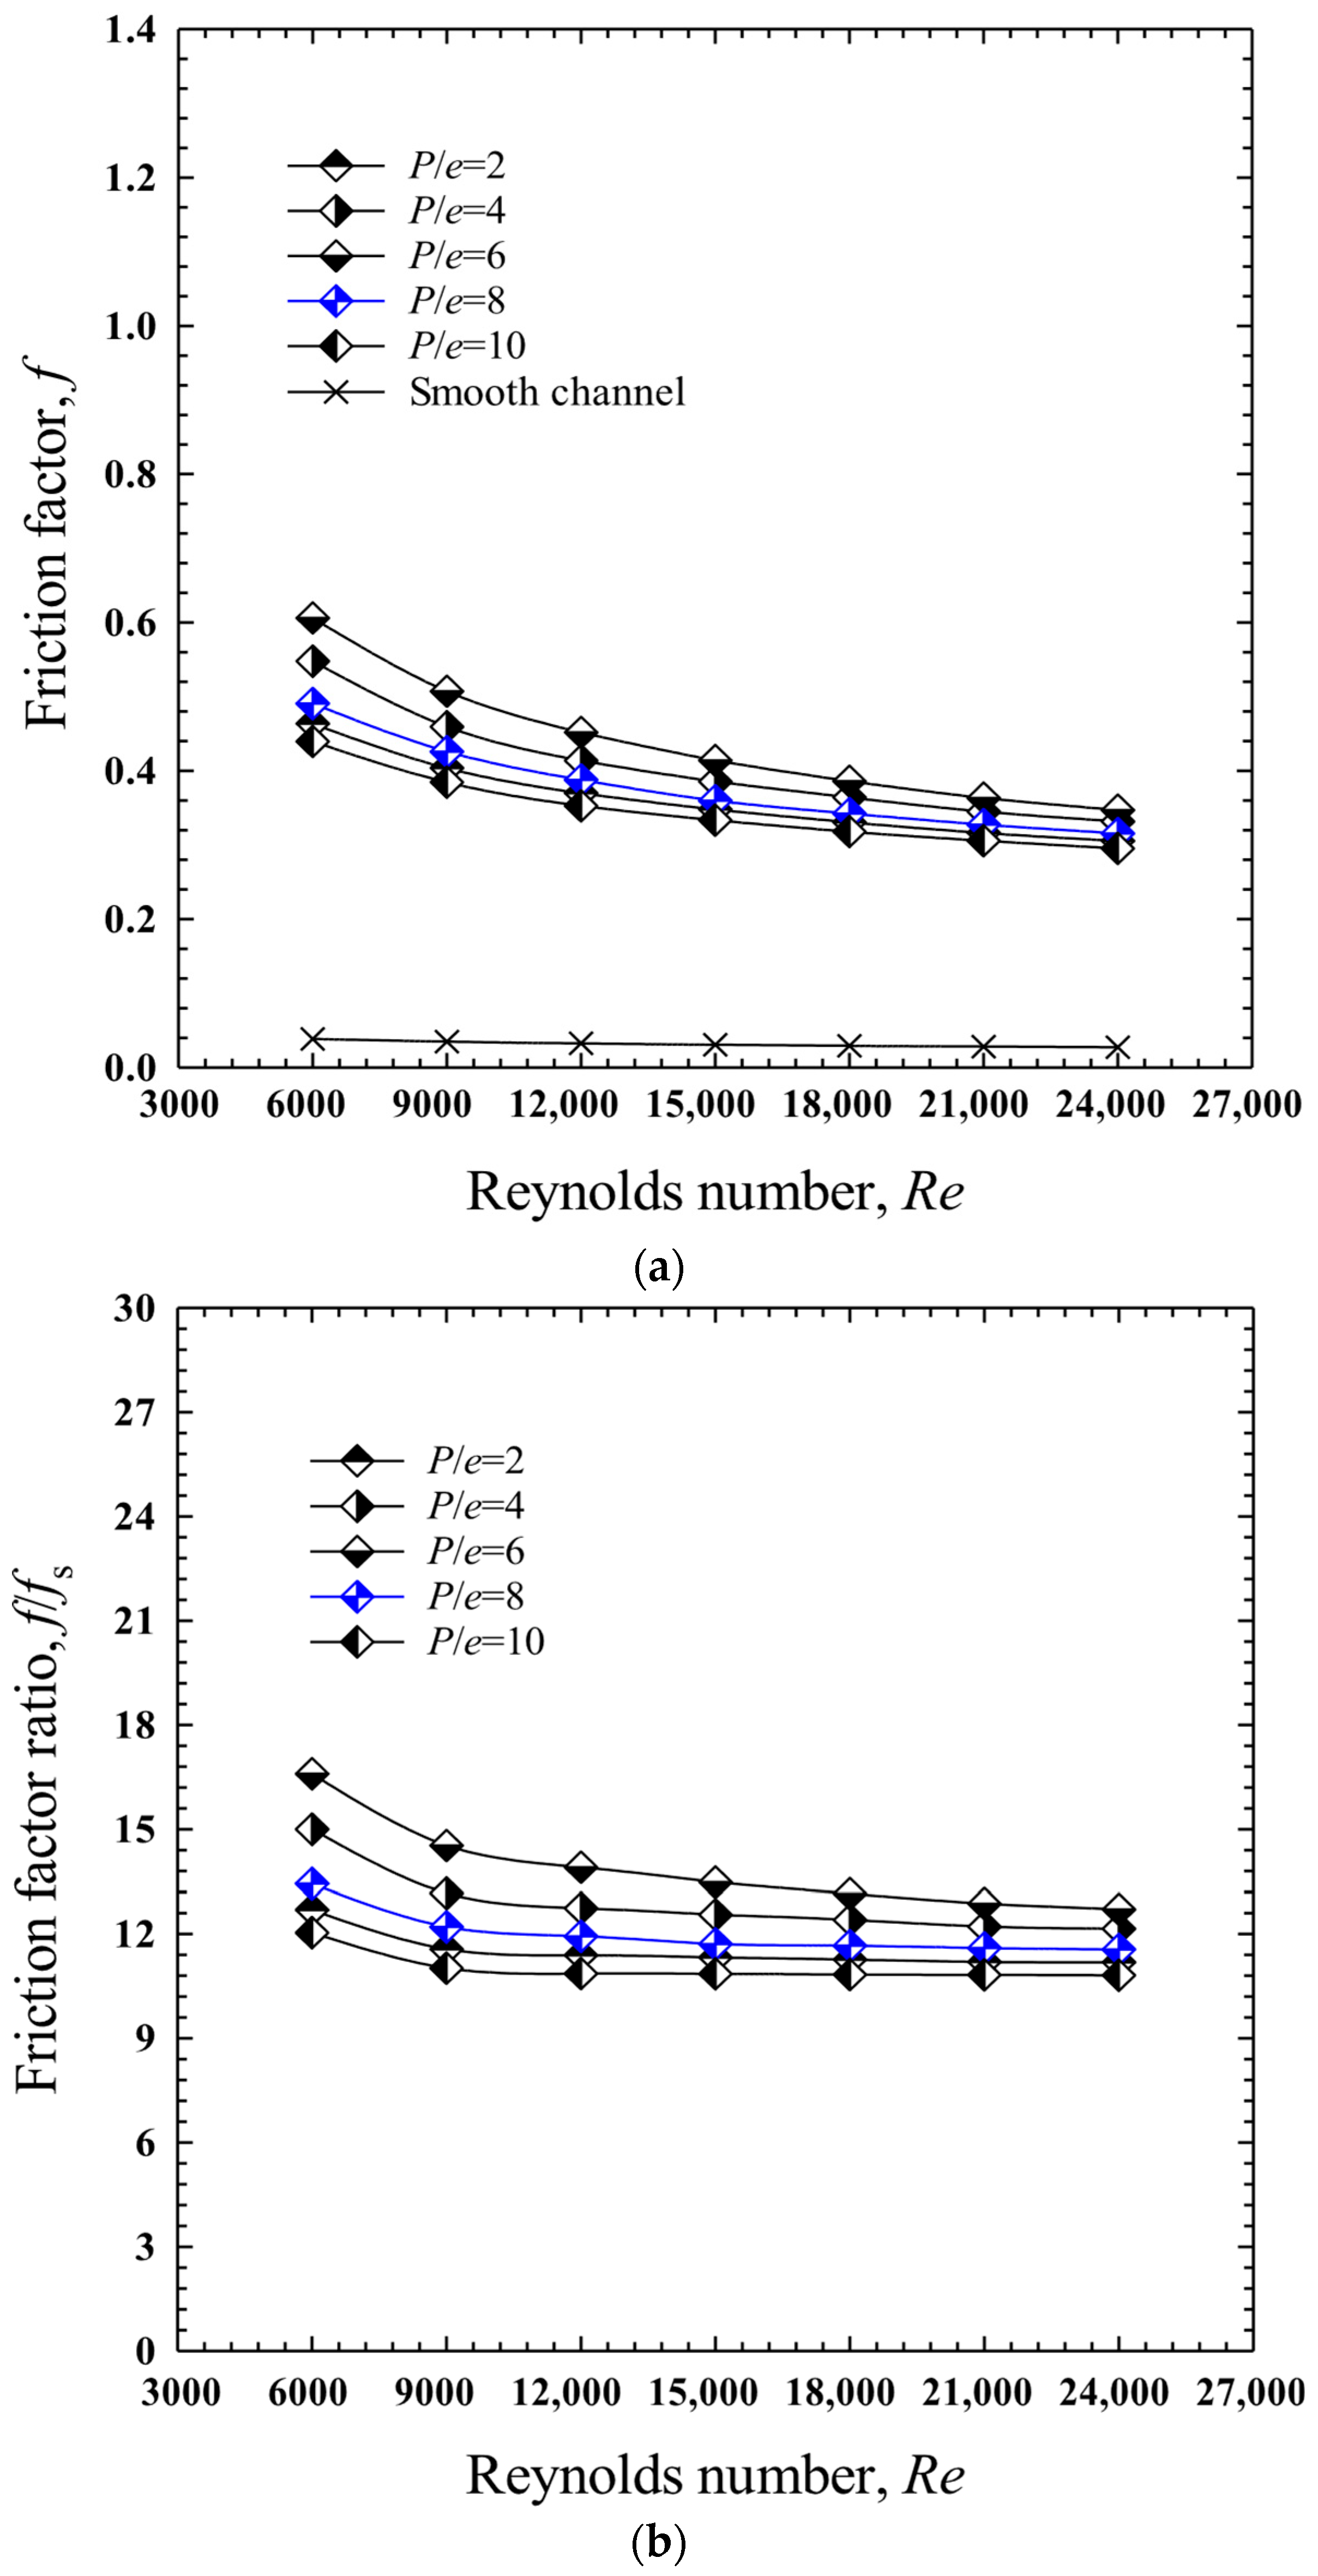
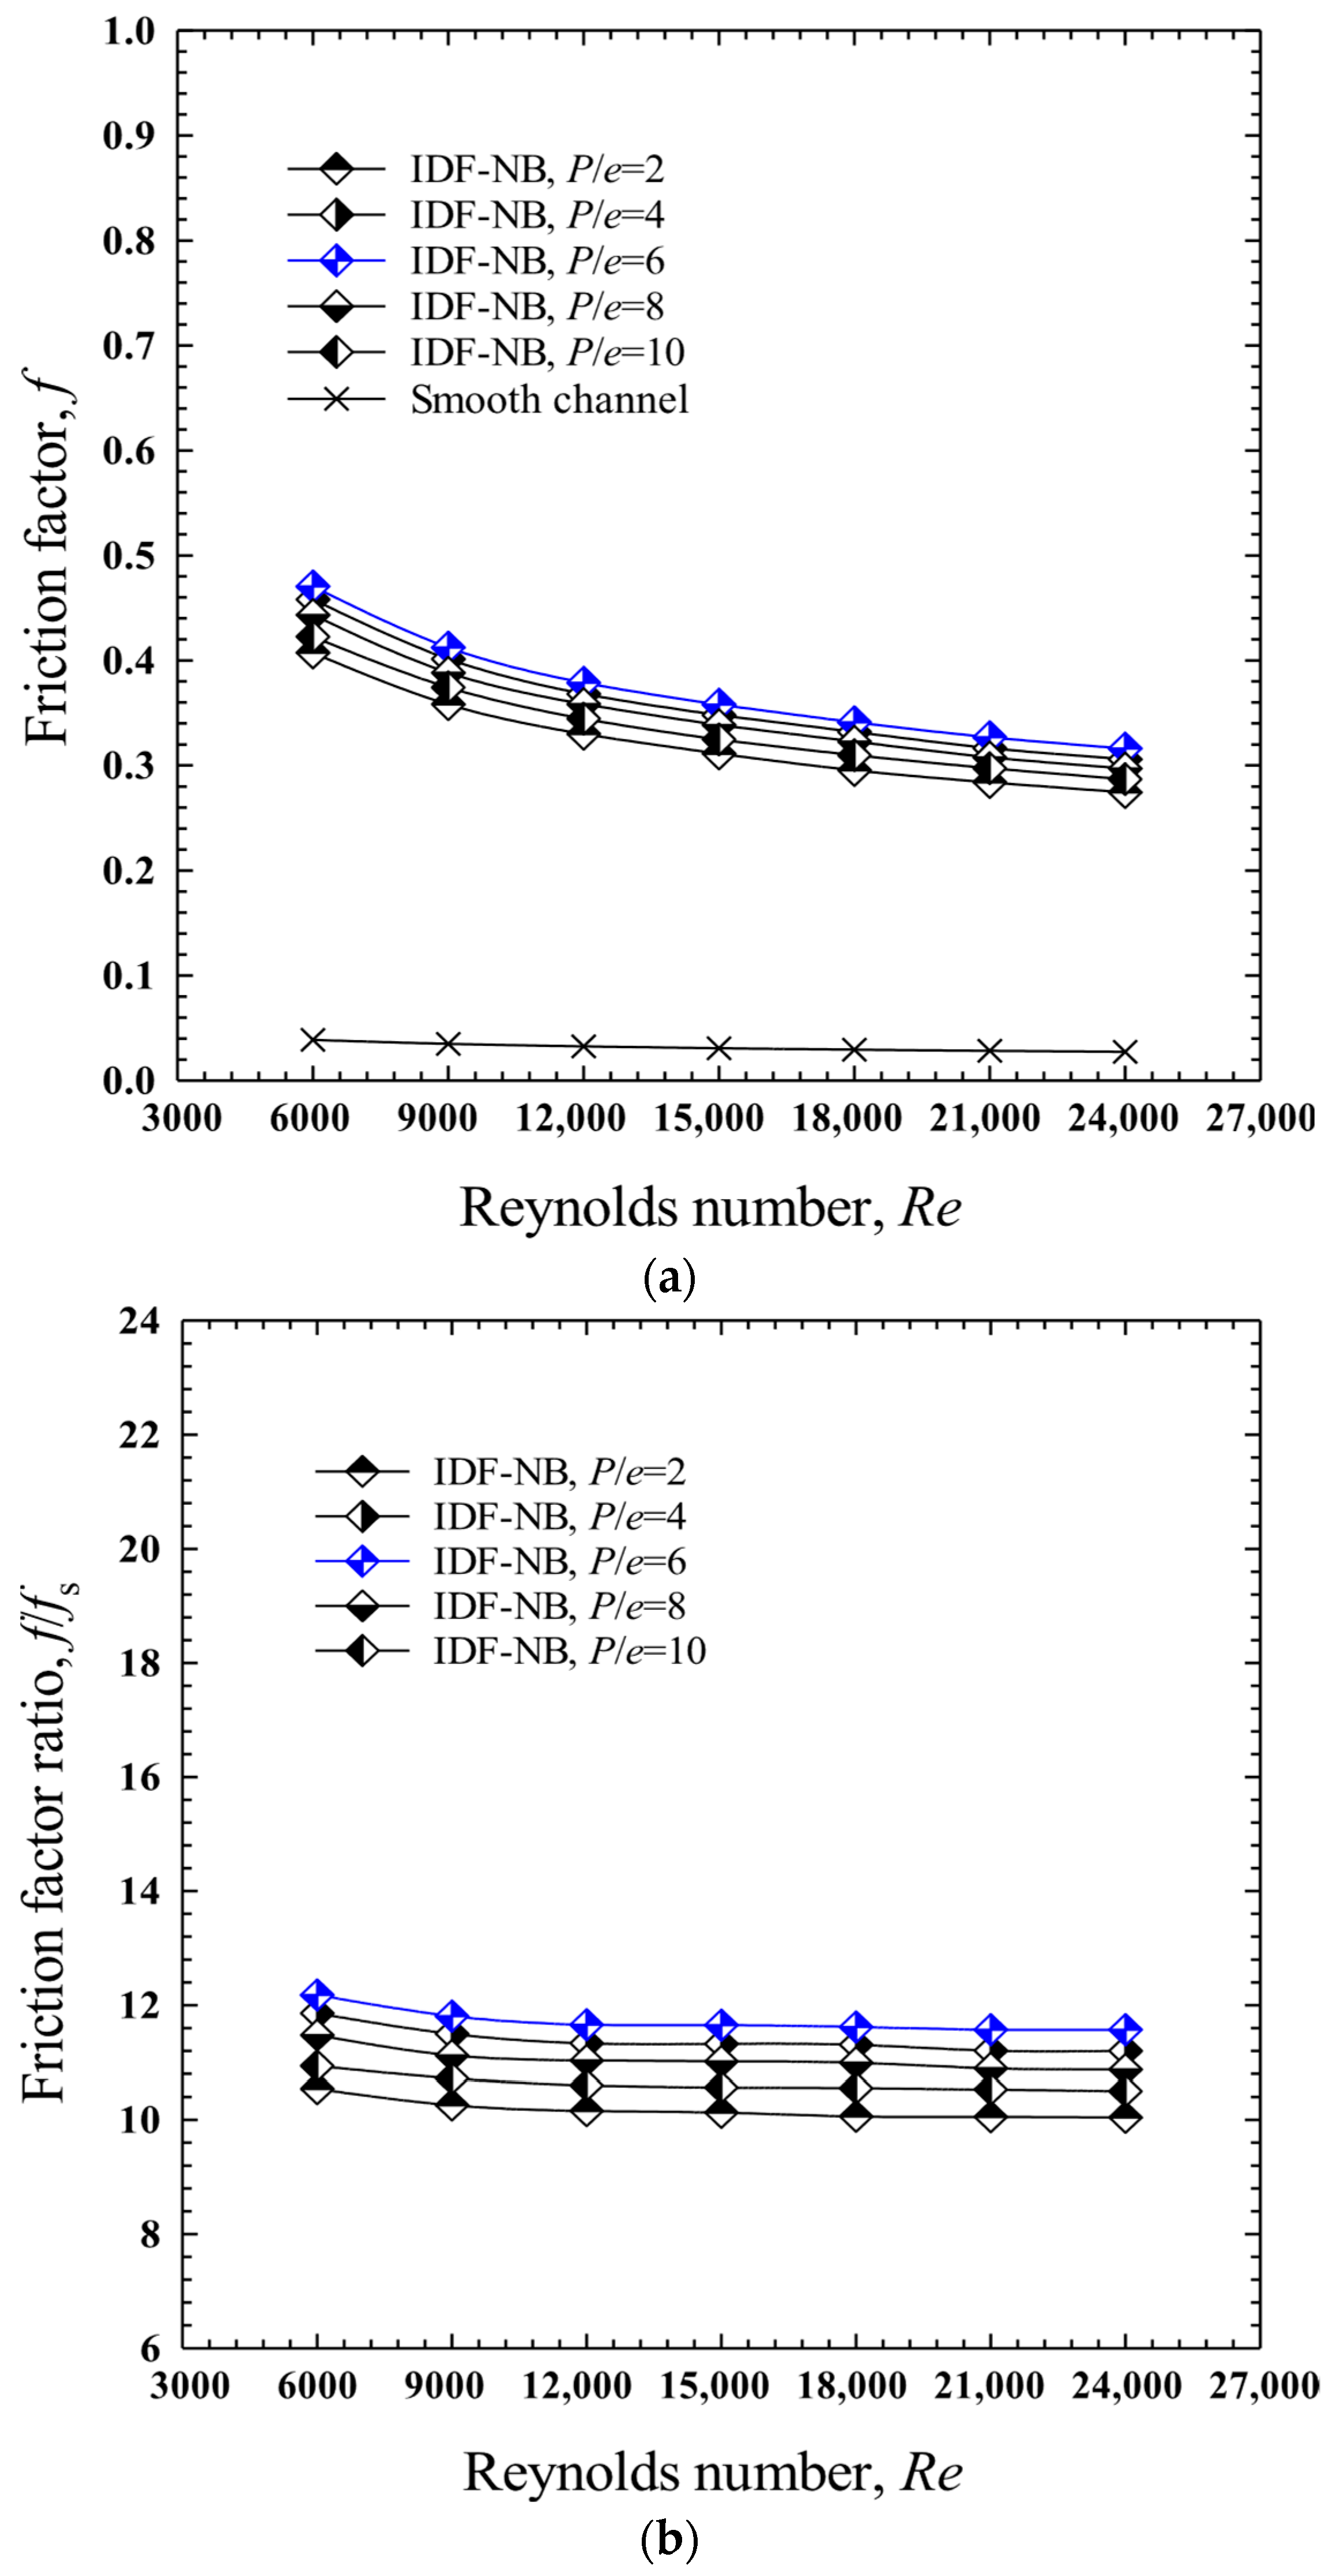
Figure 11a,b illustrates the effect of IDF-NBs and the baffle pitch-to-height ratio (P/e) on the friction factor (f) and the friction factor ratio (f/fs), respectively. Similarly to conventional transverse baffles, the presence of IDF-NBs led to a notable increase in friction losses. The greatest friction loss was observed at a P/e ratio of 6.0, followed by ratios of 4.0, 8.0 10, and 2.0. The trend in friction factor closely mirrors that of the Nusselt number, highlighting the direct relationship with reattachment strength. The highest friction factor ratio was also recorded at P/e = 6.0, with values ranging from 11.57 to 12.18 times that of the smooth channel. The peak value of 12.18 occurred at a Reynolds number of 6000.
In this study, the ratio P/e = 6.0 consistently provided the highest thermal performance among the tested configurations; however, this optimum is not expected to be universal. The optimal spacing can vary with channel size and aspect ratio, as smaller hydraulic diameters or high-aspect-ratio ducts alter recirculation patterns and vortex reattachment lengths. It may also depend on fluid properties and Reynolds number, since changes in viscosity or thermal conductivity affect the balance between heat transfer and pressure loss. Furthermore, baffle dimensions, including height, thickness, and tip angle, influence vortex strength and flow disruption, potentially shifting the preferred pitch-to-height ratio. For practical design, P/e ≈ 6.0 can serve as a robust starting point, but adjustments through CFD simulations or preliminary experiments are recommended for channels or operating conditions that deviate significantly from those examined in this study.
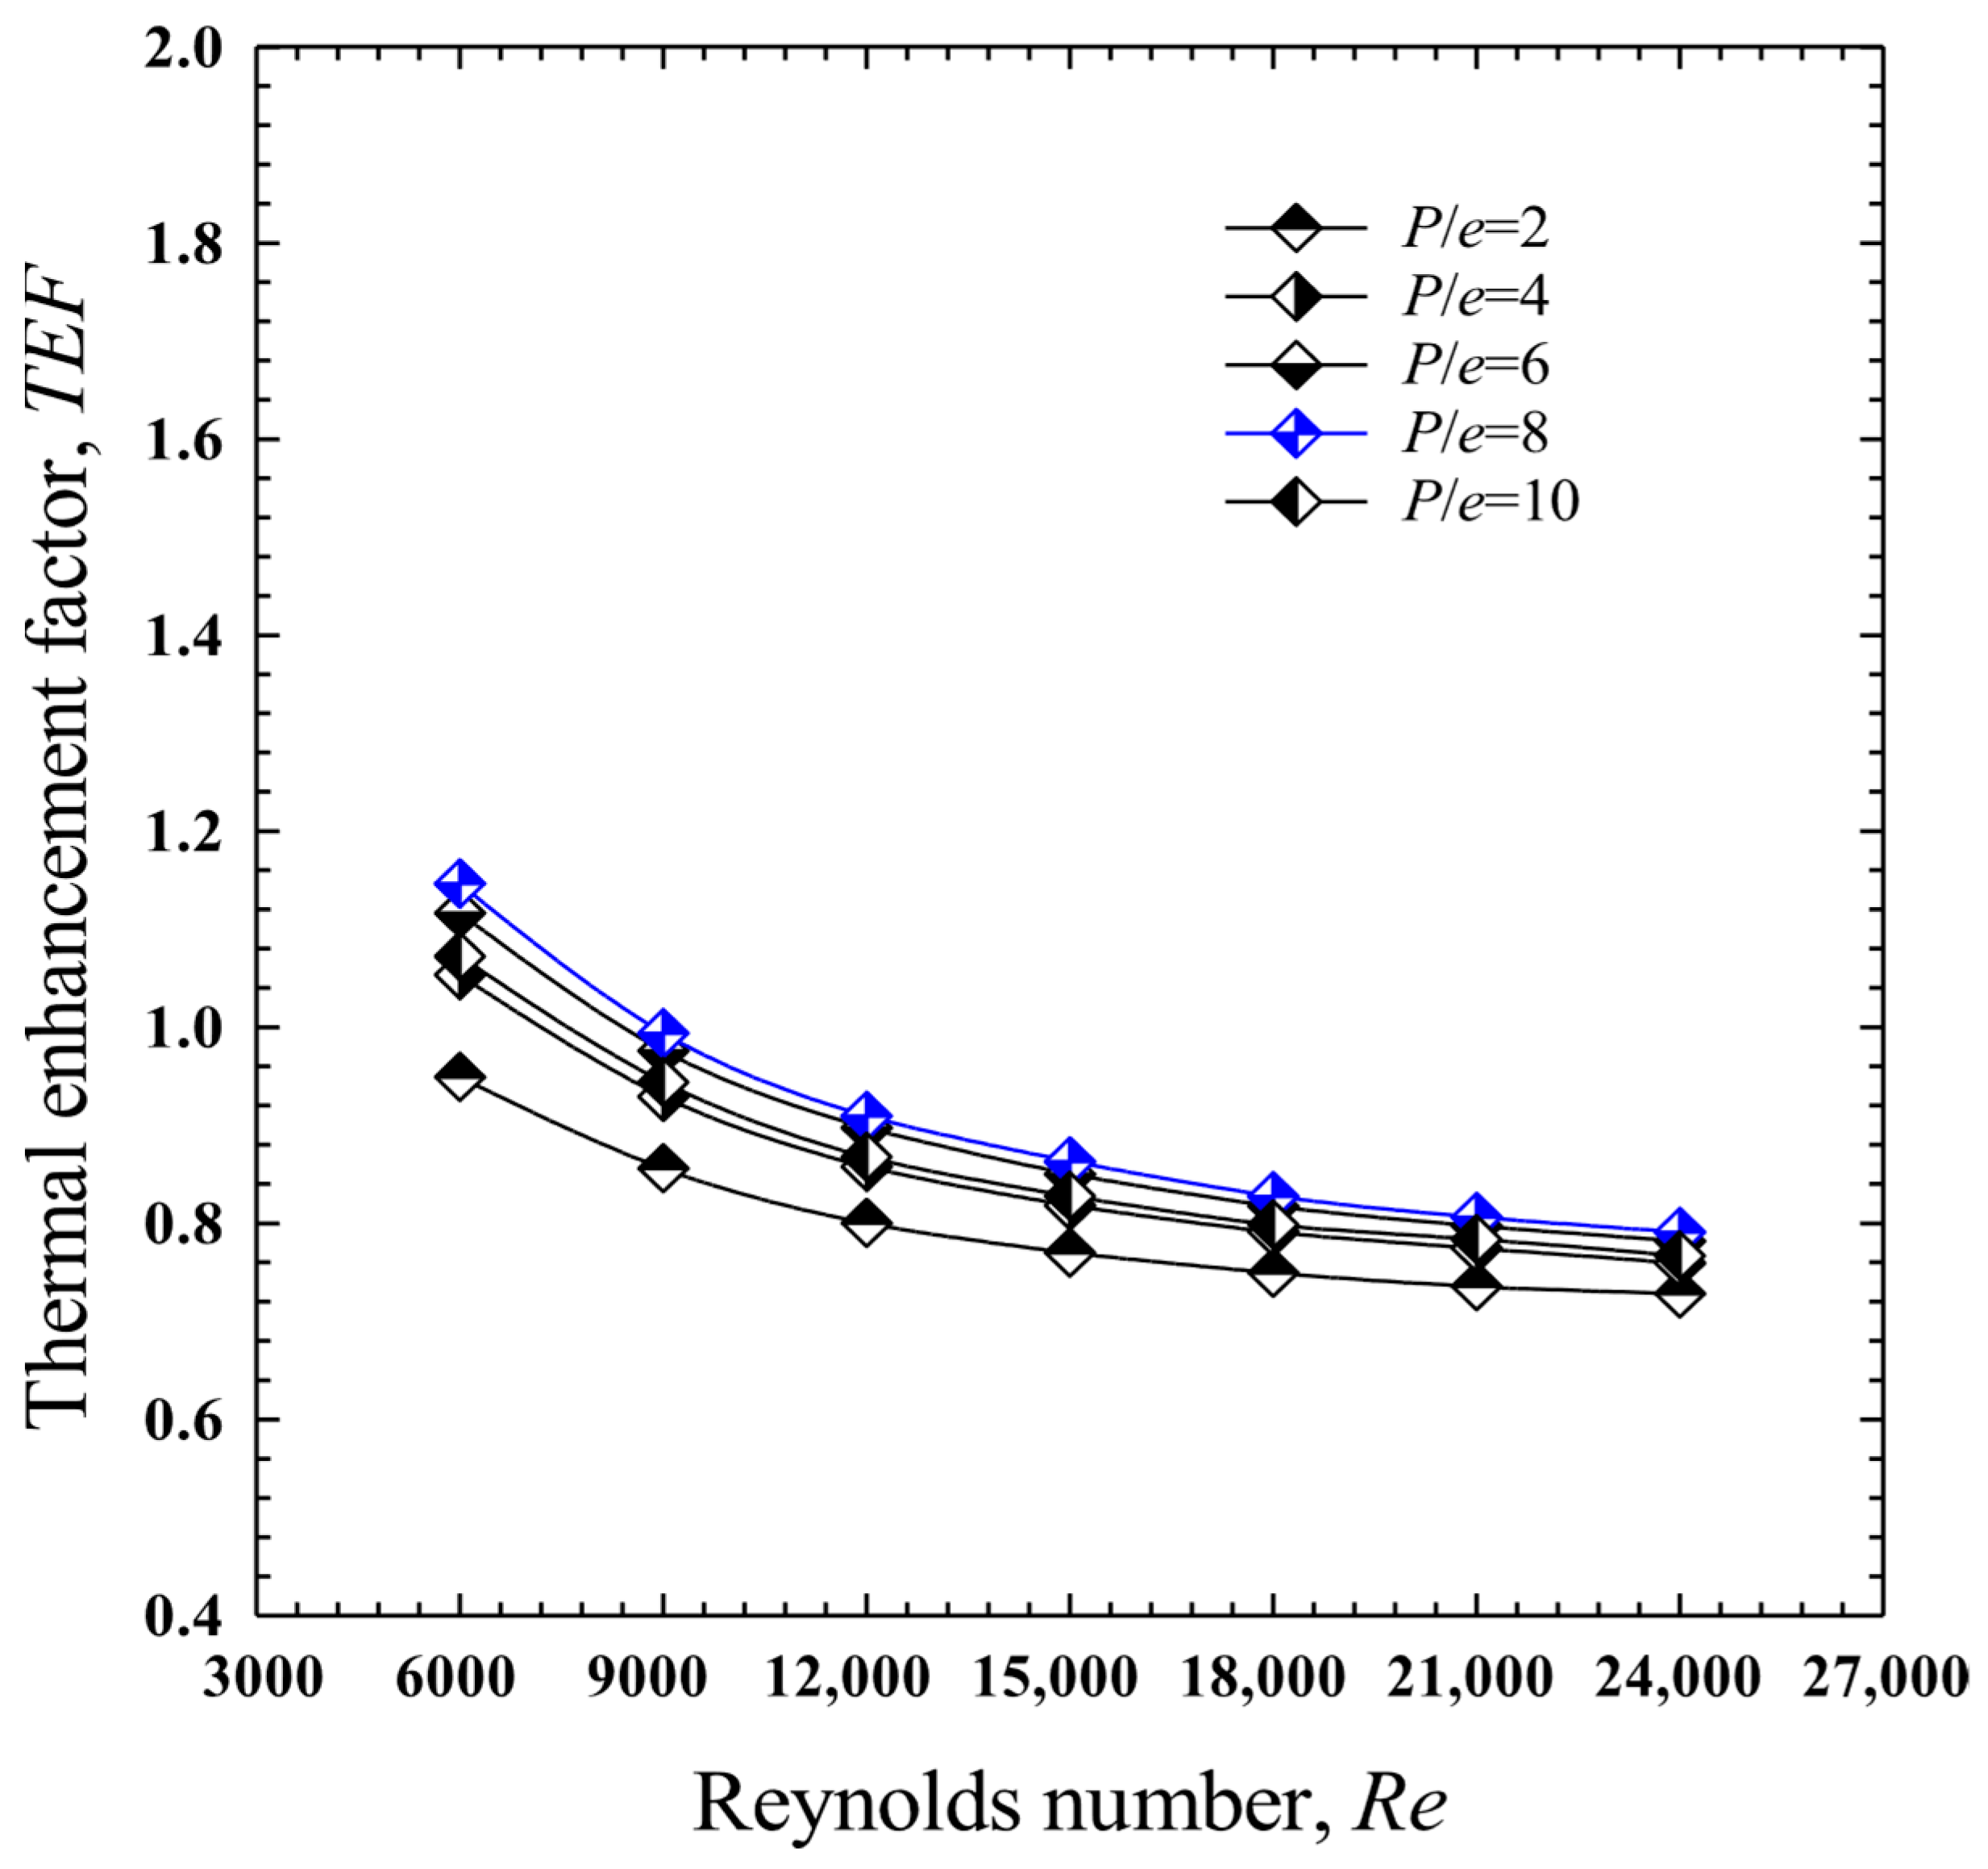
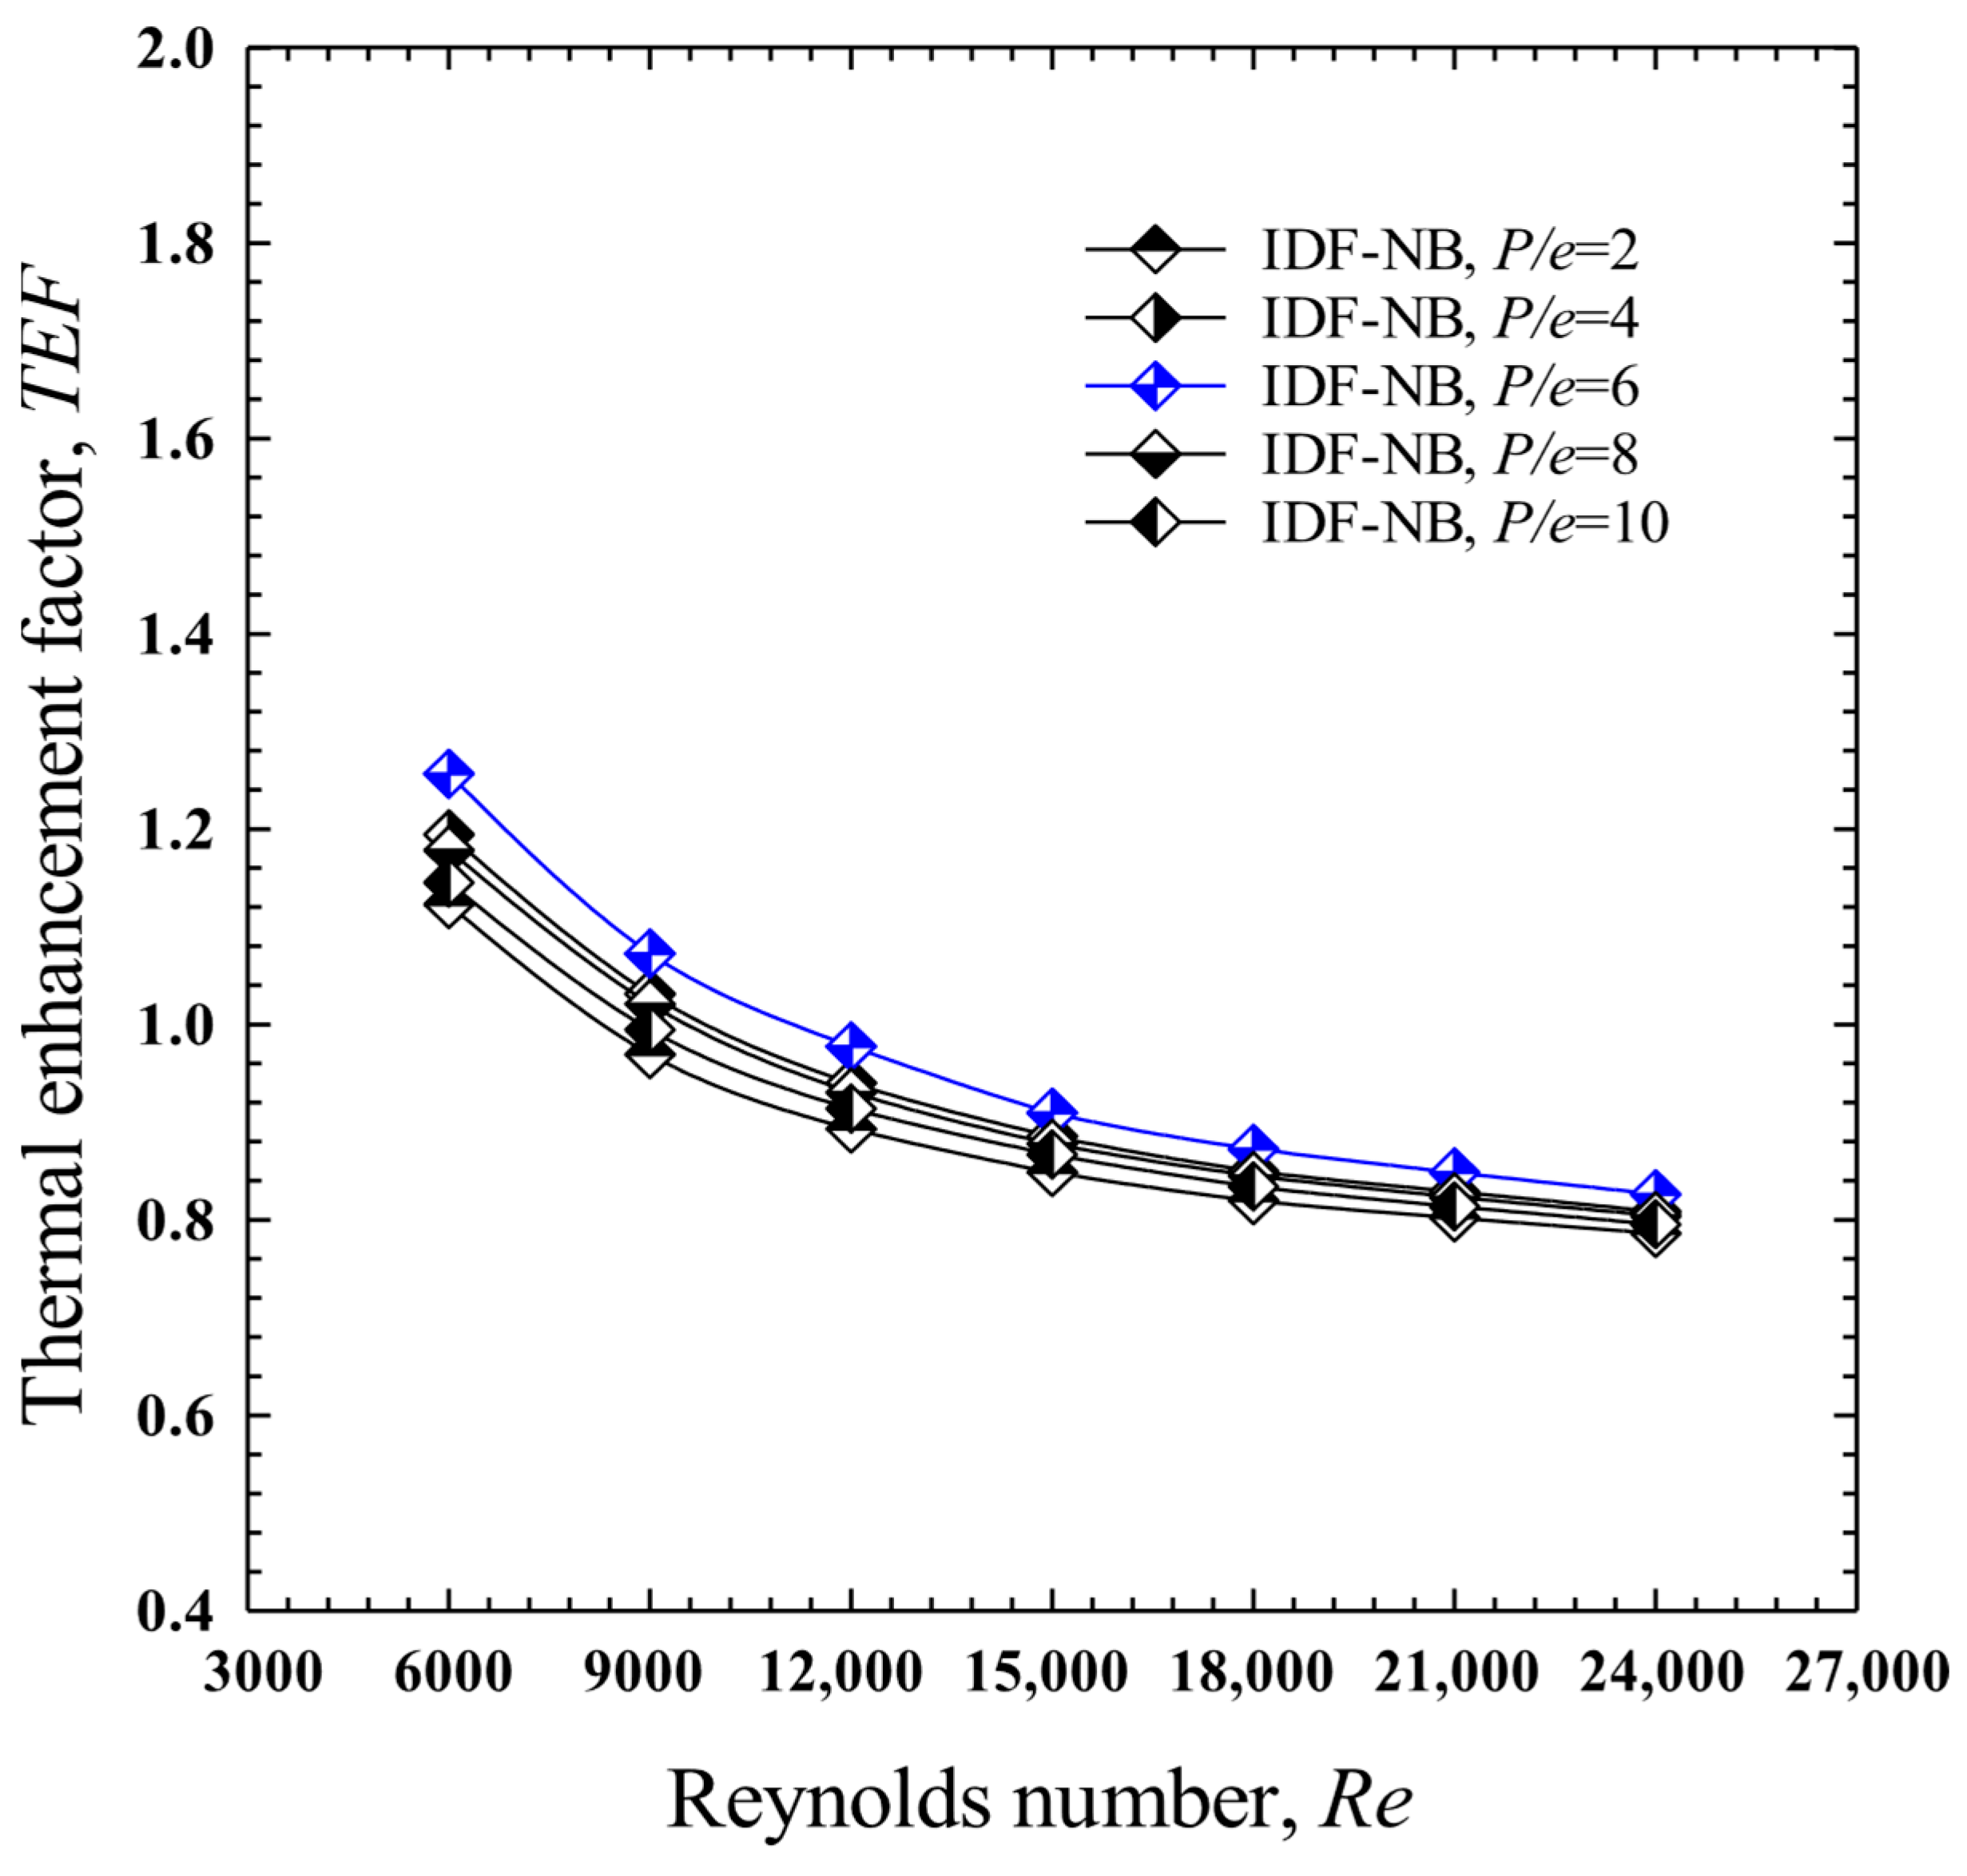
Figure 12 shows the relationship between the thermal enhancement factor (TEF) and Reynolds number in the channels equipped with the IDF-NB, where the baffle pitch-to-height ratio (P/e) was varied from 2 to 10. At any Reynolds number, the channel with the IDF-NBs having P/e = 6.0 yielded the highest TEF with values ranging from 0.826 to 1.257 under constant fan power conditions. The maximum TEF value of 1.257 is achieved at a P/e ratio of 6.0 and a Reynolds number of 6000.

4.4. Effect of Baffle Pitch to Baffle Height Ratio, (P/e): Case III: Staggered Downward-Facing Notched Baffles (SDF-NB)

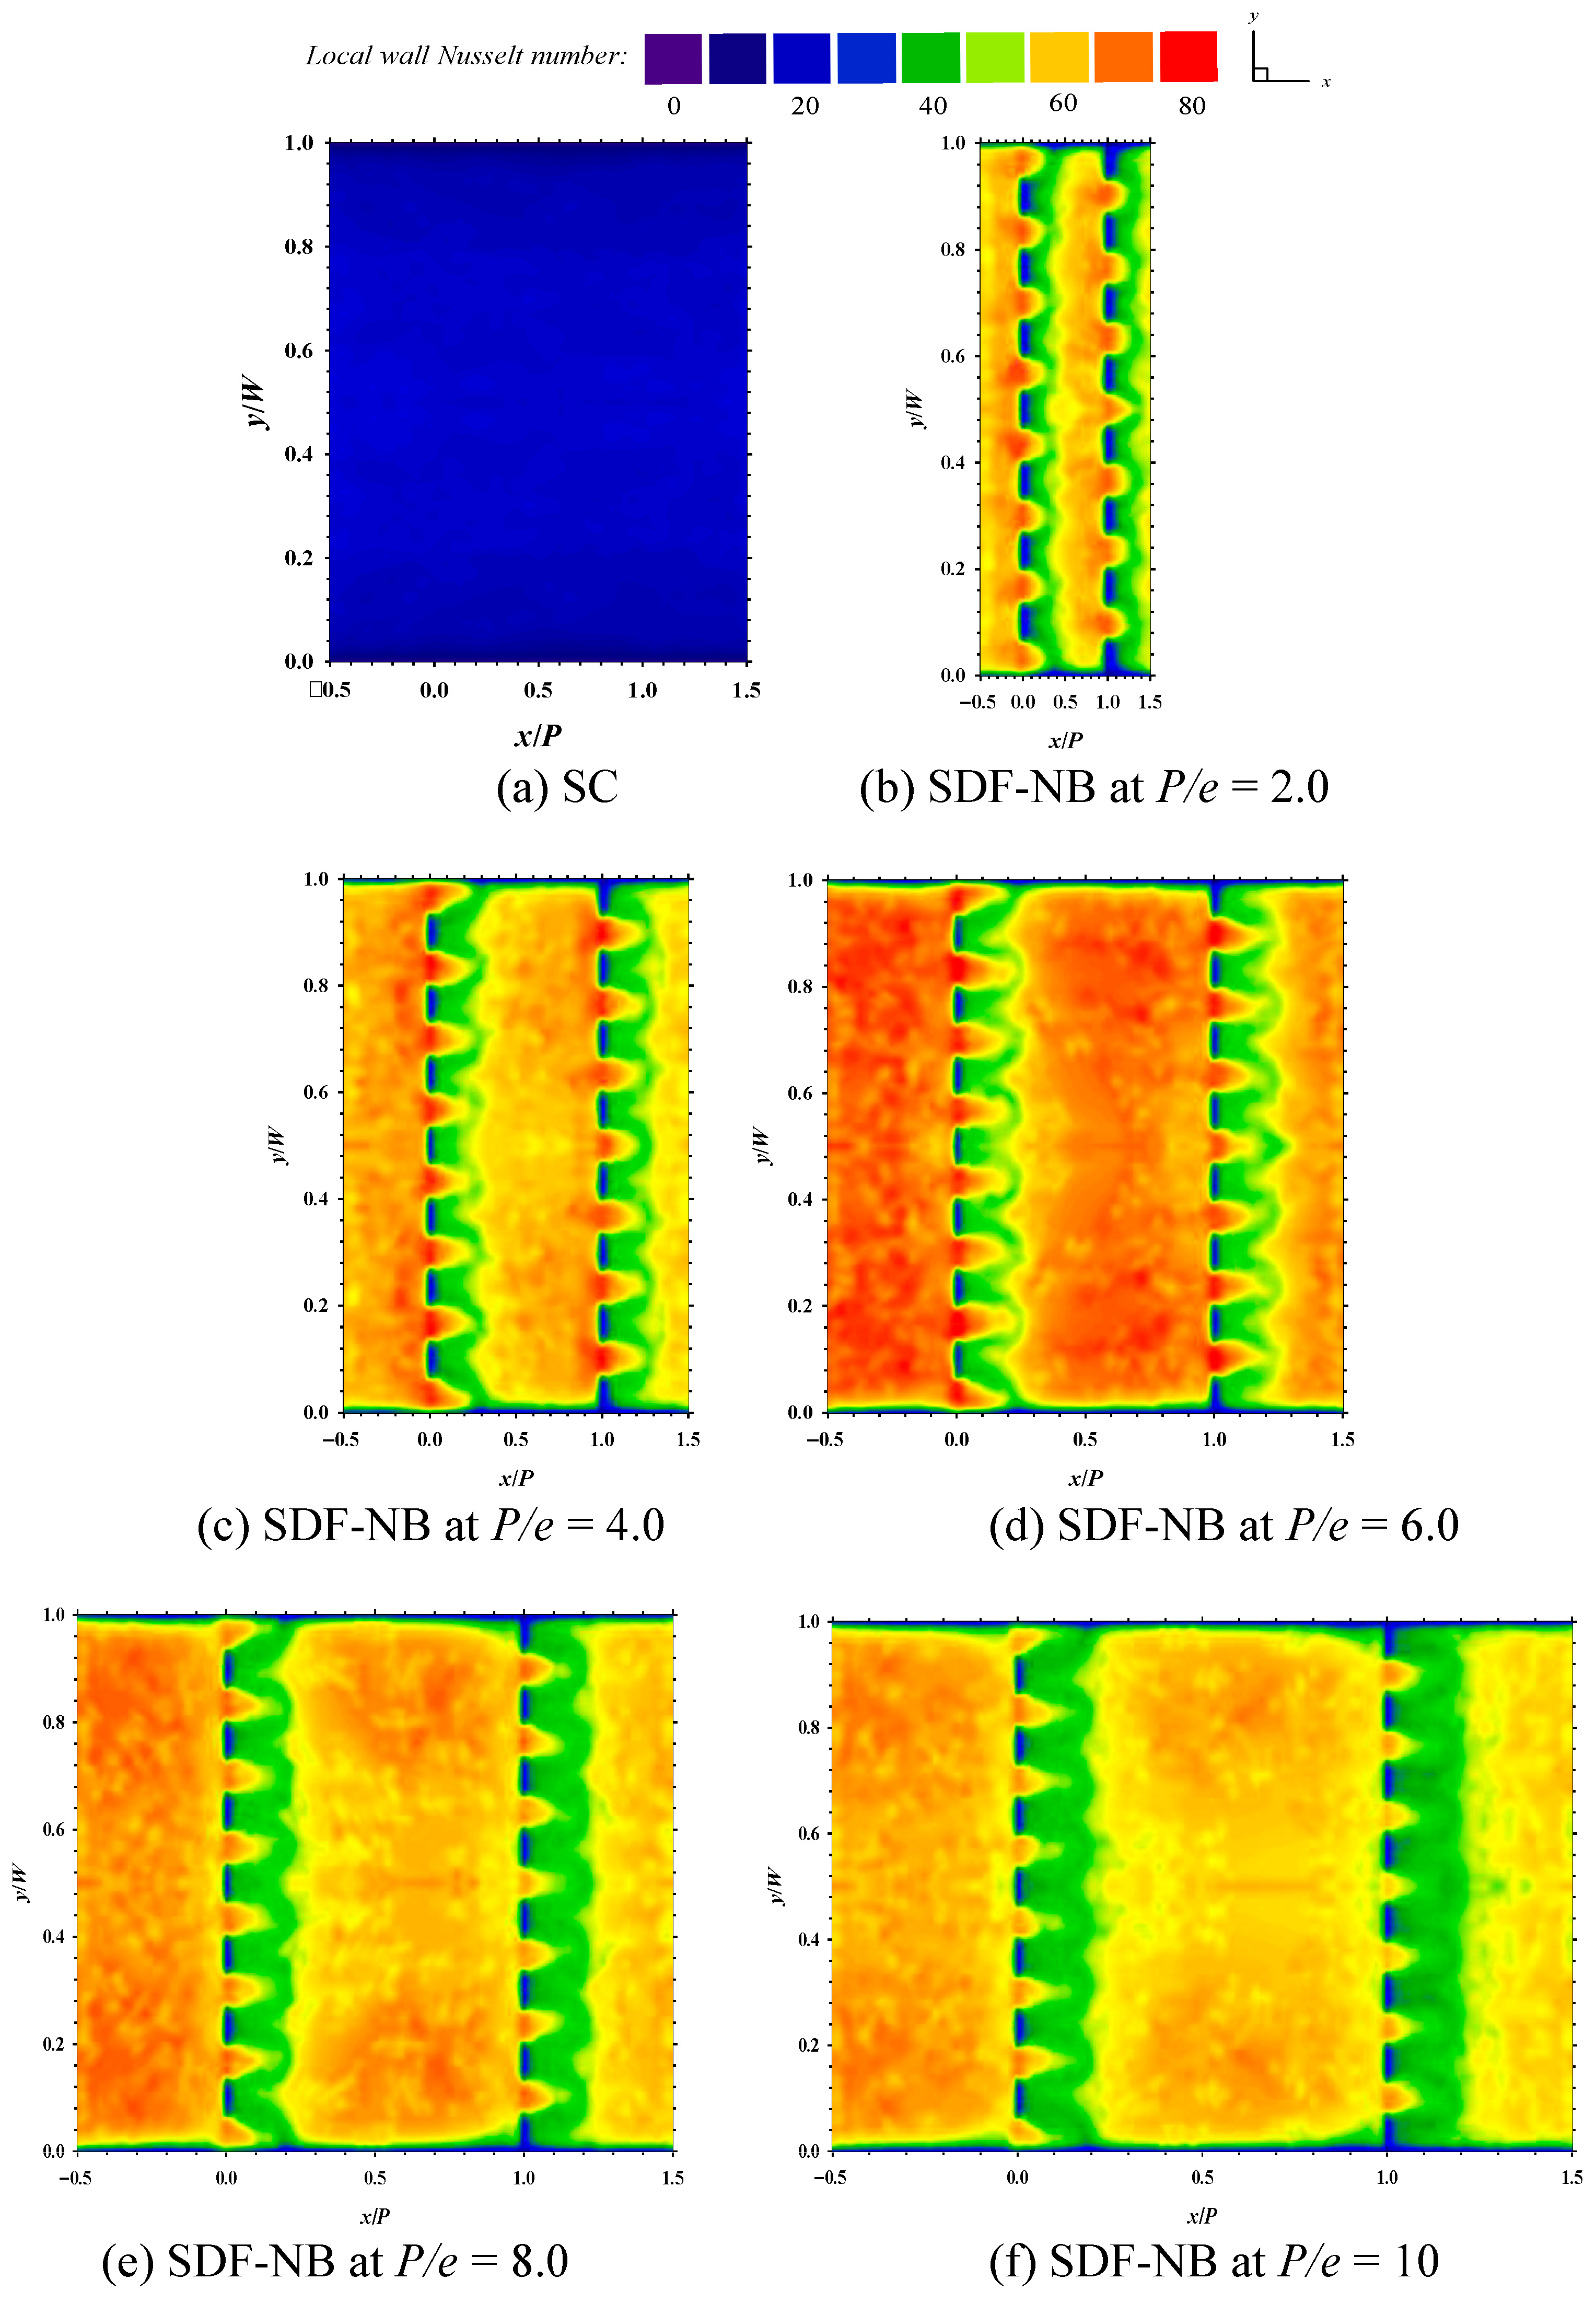
The section describes the impact of the pitch-to-height ratio (P/e = 2.0, 4.0, 6.0, 8.0, and 10) on heat transfer performance, friction factor (f), and thermal enhancement factor (TEF) for staggered downward-facing notched baffles (SDF-NB). The ratio of notch height to baffle height (N/e) was kept constant at 0.125. Figure 13a,b show the Nusselt number distributions for channels equipped with staggered downward-facing notched baffles (SDF-NB). Overall, the distribution patterns were similar to those observed in the in-line configuration. However, the staggered arrangement proved more effective in reducing dead zones, particularly behind the baffles. As the P/e ratio increased from 2.0 to 6.0, the Nusselt number rose significantly, and the temperature distribution became more uniform. At P/e = 6.0, the heat transfer intensity reached its peak, as indicated by the strong orange coloration, and the dead zones behind the baffles were greatly minimized. Beyond P/e = 6.0, both the magnitude and uniformity of the Nusselt number began to decline, and the size of the dead zones behind the baffles increased.
Figure 14 schematically illustrates the airflow behavior in a channel fitted with staggered downward-facing notched baffles (SDF-NB). The airflow can be divided into three main components, similar to those observed in the notched baffle aligned in-line and facing downward (In-line Downward-Facing Notched Baffle: IDF-NB) configuration. However, a key difference lies in the path of the flow through the perforations. In the SDF-NB configuration, the airflow passing through the perforation of an upstream baffle (indicated by green arrows) does not continue directly through the perforation of the downstream baffle, as it does in the IDF-NB setup. Instead, it strikes the solid section of the next baffle. Upon impact, this flow is redirected along the baffle surface (shown by red arrows), effectively sweeping the dead zone behind the baffle. This redirected flow appears to be more vigorous in the SDF-NB case compared to the IDF-NB configuration. In the IDF-NB setup, the upstream flow contributing to reattachment is a weaker recirculating stream, whereas in the SDF-NB setup, the redirected flow originates from a fresh, high-momentum stream passing through the perforation.
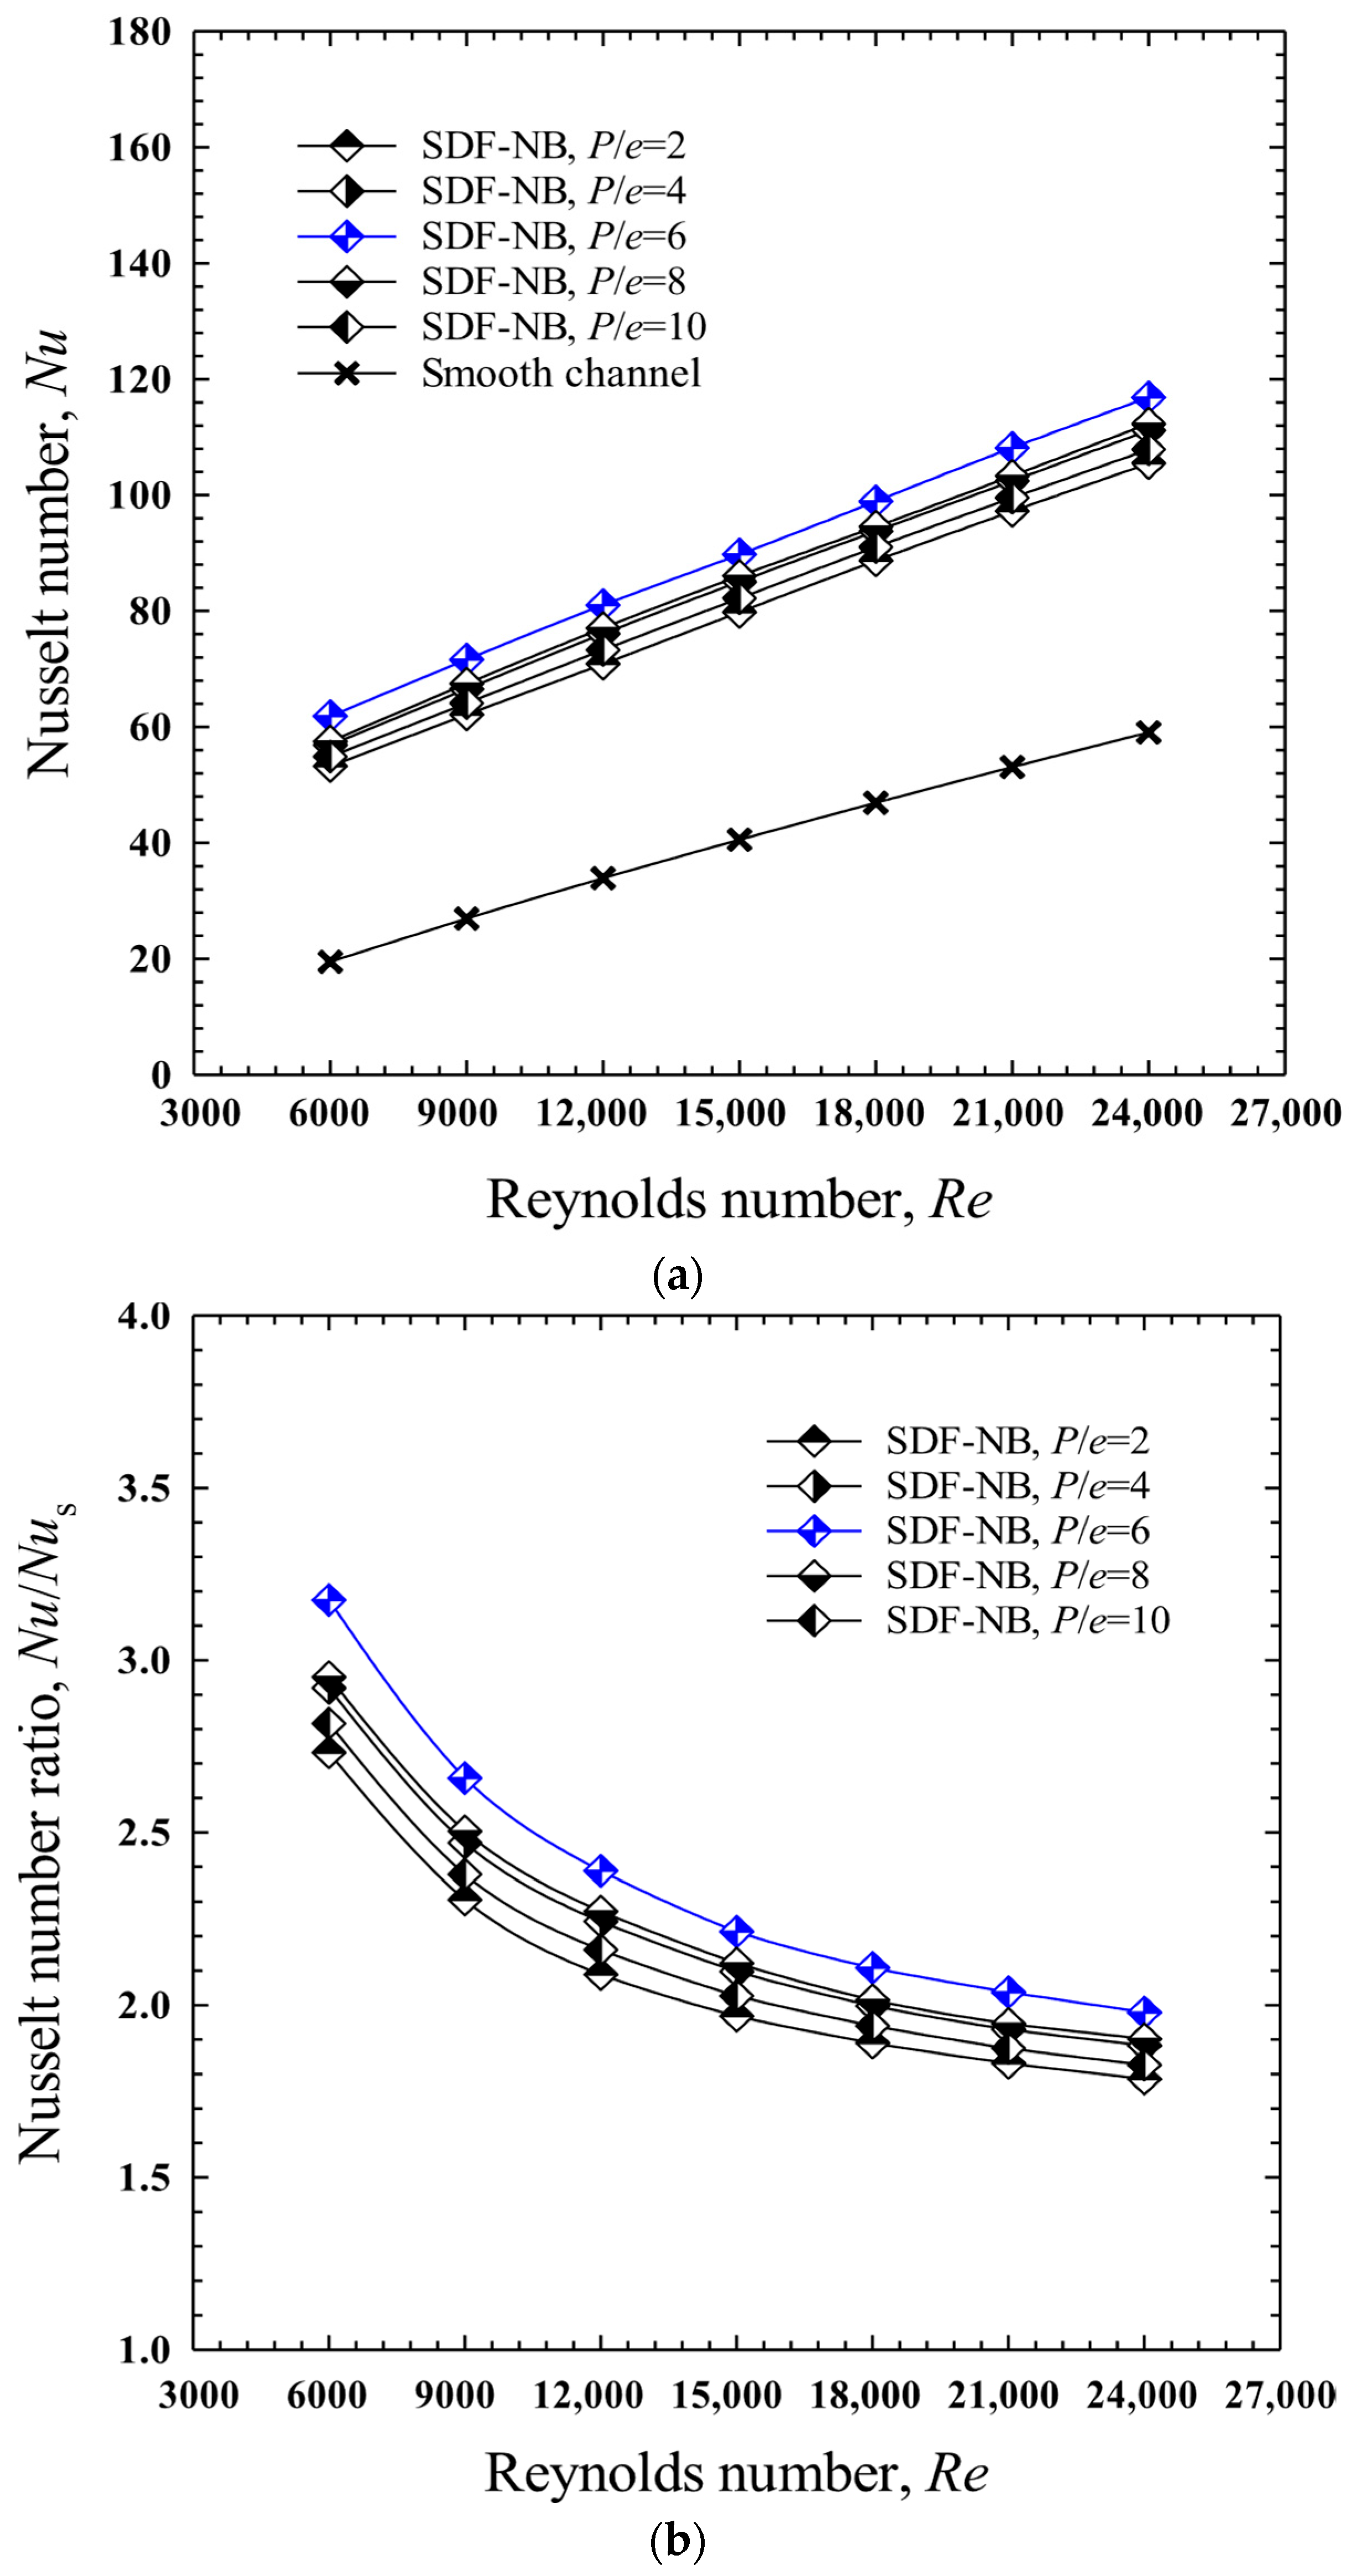
Figure 15a,b present the variations in the Nusselt number and the Nusselt number ratio as functions of the Reynolds number, which ranges from 6000 to 24,000. The results clearly indicate that the use of staggered downward-facing notched baffles (SDF-NB) significantly enhances heat transfer compared to a smooth channel. Among all tested configurations, the highest Nusselt number was achieved with a P/e ratio of 6.0, followed by P/e ratios of 8.0, 4.0, 10, and 2.0. Notably, the Nusselt numbers for P/e ratios of 8.0 and 4.0 were nearly identical. The maximum Nusselt number recorded was 116.886 at a Reynolds number of 24,000 for the P/e = 6.0 configuration, which corresponds to a Nusselt number ratio of 3.175. Overall, the Nusselt number ratios for the IDF-NB configuration at P/e = 6.0 ranged from 1.979 to 3.175 across the studied Reynolds number range.
Figure 16a,b illustrate the effect of staggered, downward-facing baffles with rectangular notches (Staggered Downward-Facing Notched Baffles: SDF-NB) on the friction factor (f) and the friction factor ratio (f/fs), where fs represents the friction factor of a smooth channel. The highest friction loss occurred at a pitch-to-height ratio (P/e) of 6.0, followed by 4.0, 8.0, 10, and 2.0. This trend closely aligns with the pattern observed in the Nusselt number, indicating a strong correlation between friction loss and reattachment intensity. The maximum friction factor ratio was also found at P/e = 6.0, with values ranging from 11.791 to 12.669 times greater than that of the smooth channel. The peak ratio of 12.669 occurred at a Reynolds number of 6000.
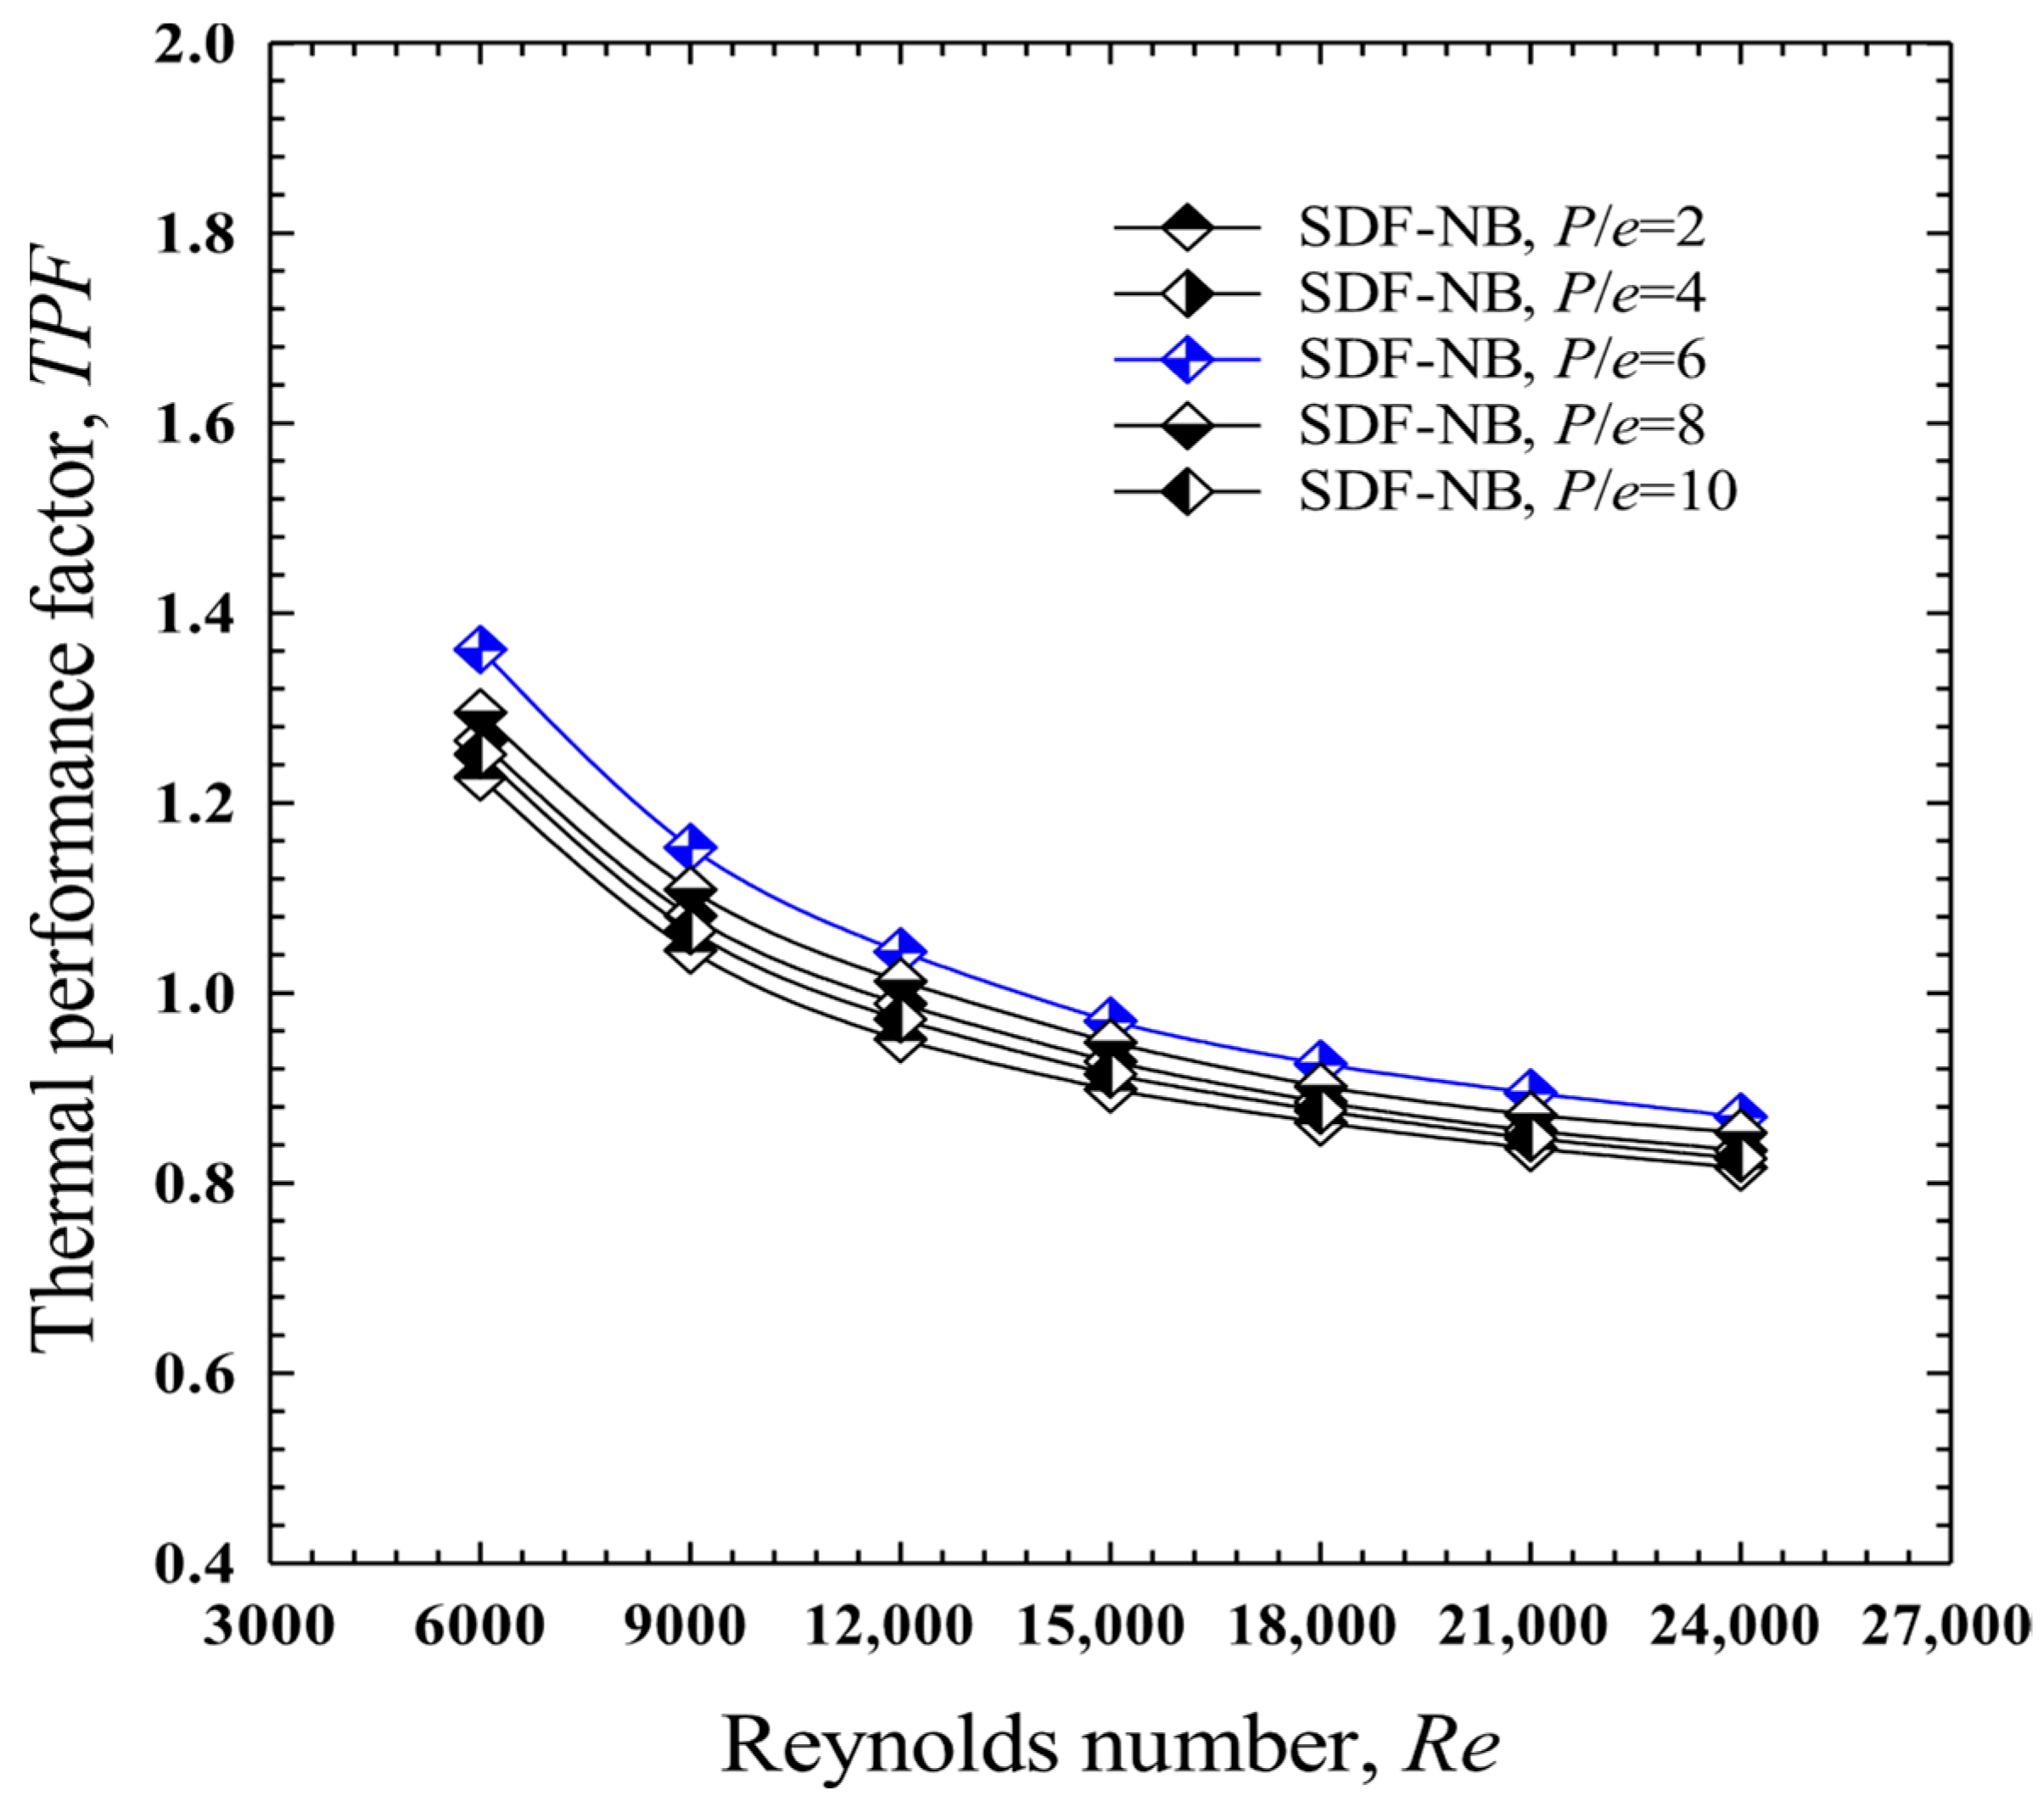
Figure 17 illustrates the relationship between the thermal enhancement factor (TEF) and Reynolds number for channels fitted with staggered downward-facing notched baffles (SDF-NB), with the baffle pitch-to-height ratio (P/e) varying from 2.0 to 10. Across all Reynolds numbers, the configuration with P/e = 6.0 consistently produced the highest TEF values, ranging from 0.87 to 1.362 under constant fan power conditions. The peak TEF of 1.362 was observed at P/e = 6.0 and a Reynolds number of 6000.

4.5. Effect of Baffle Design

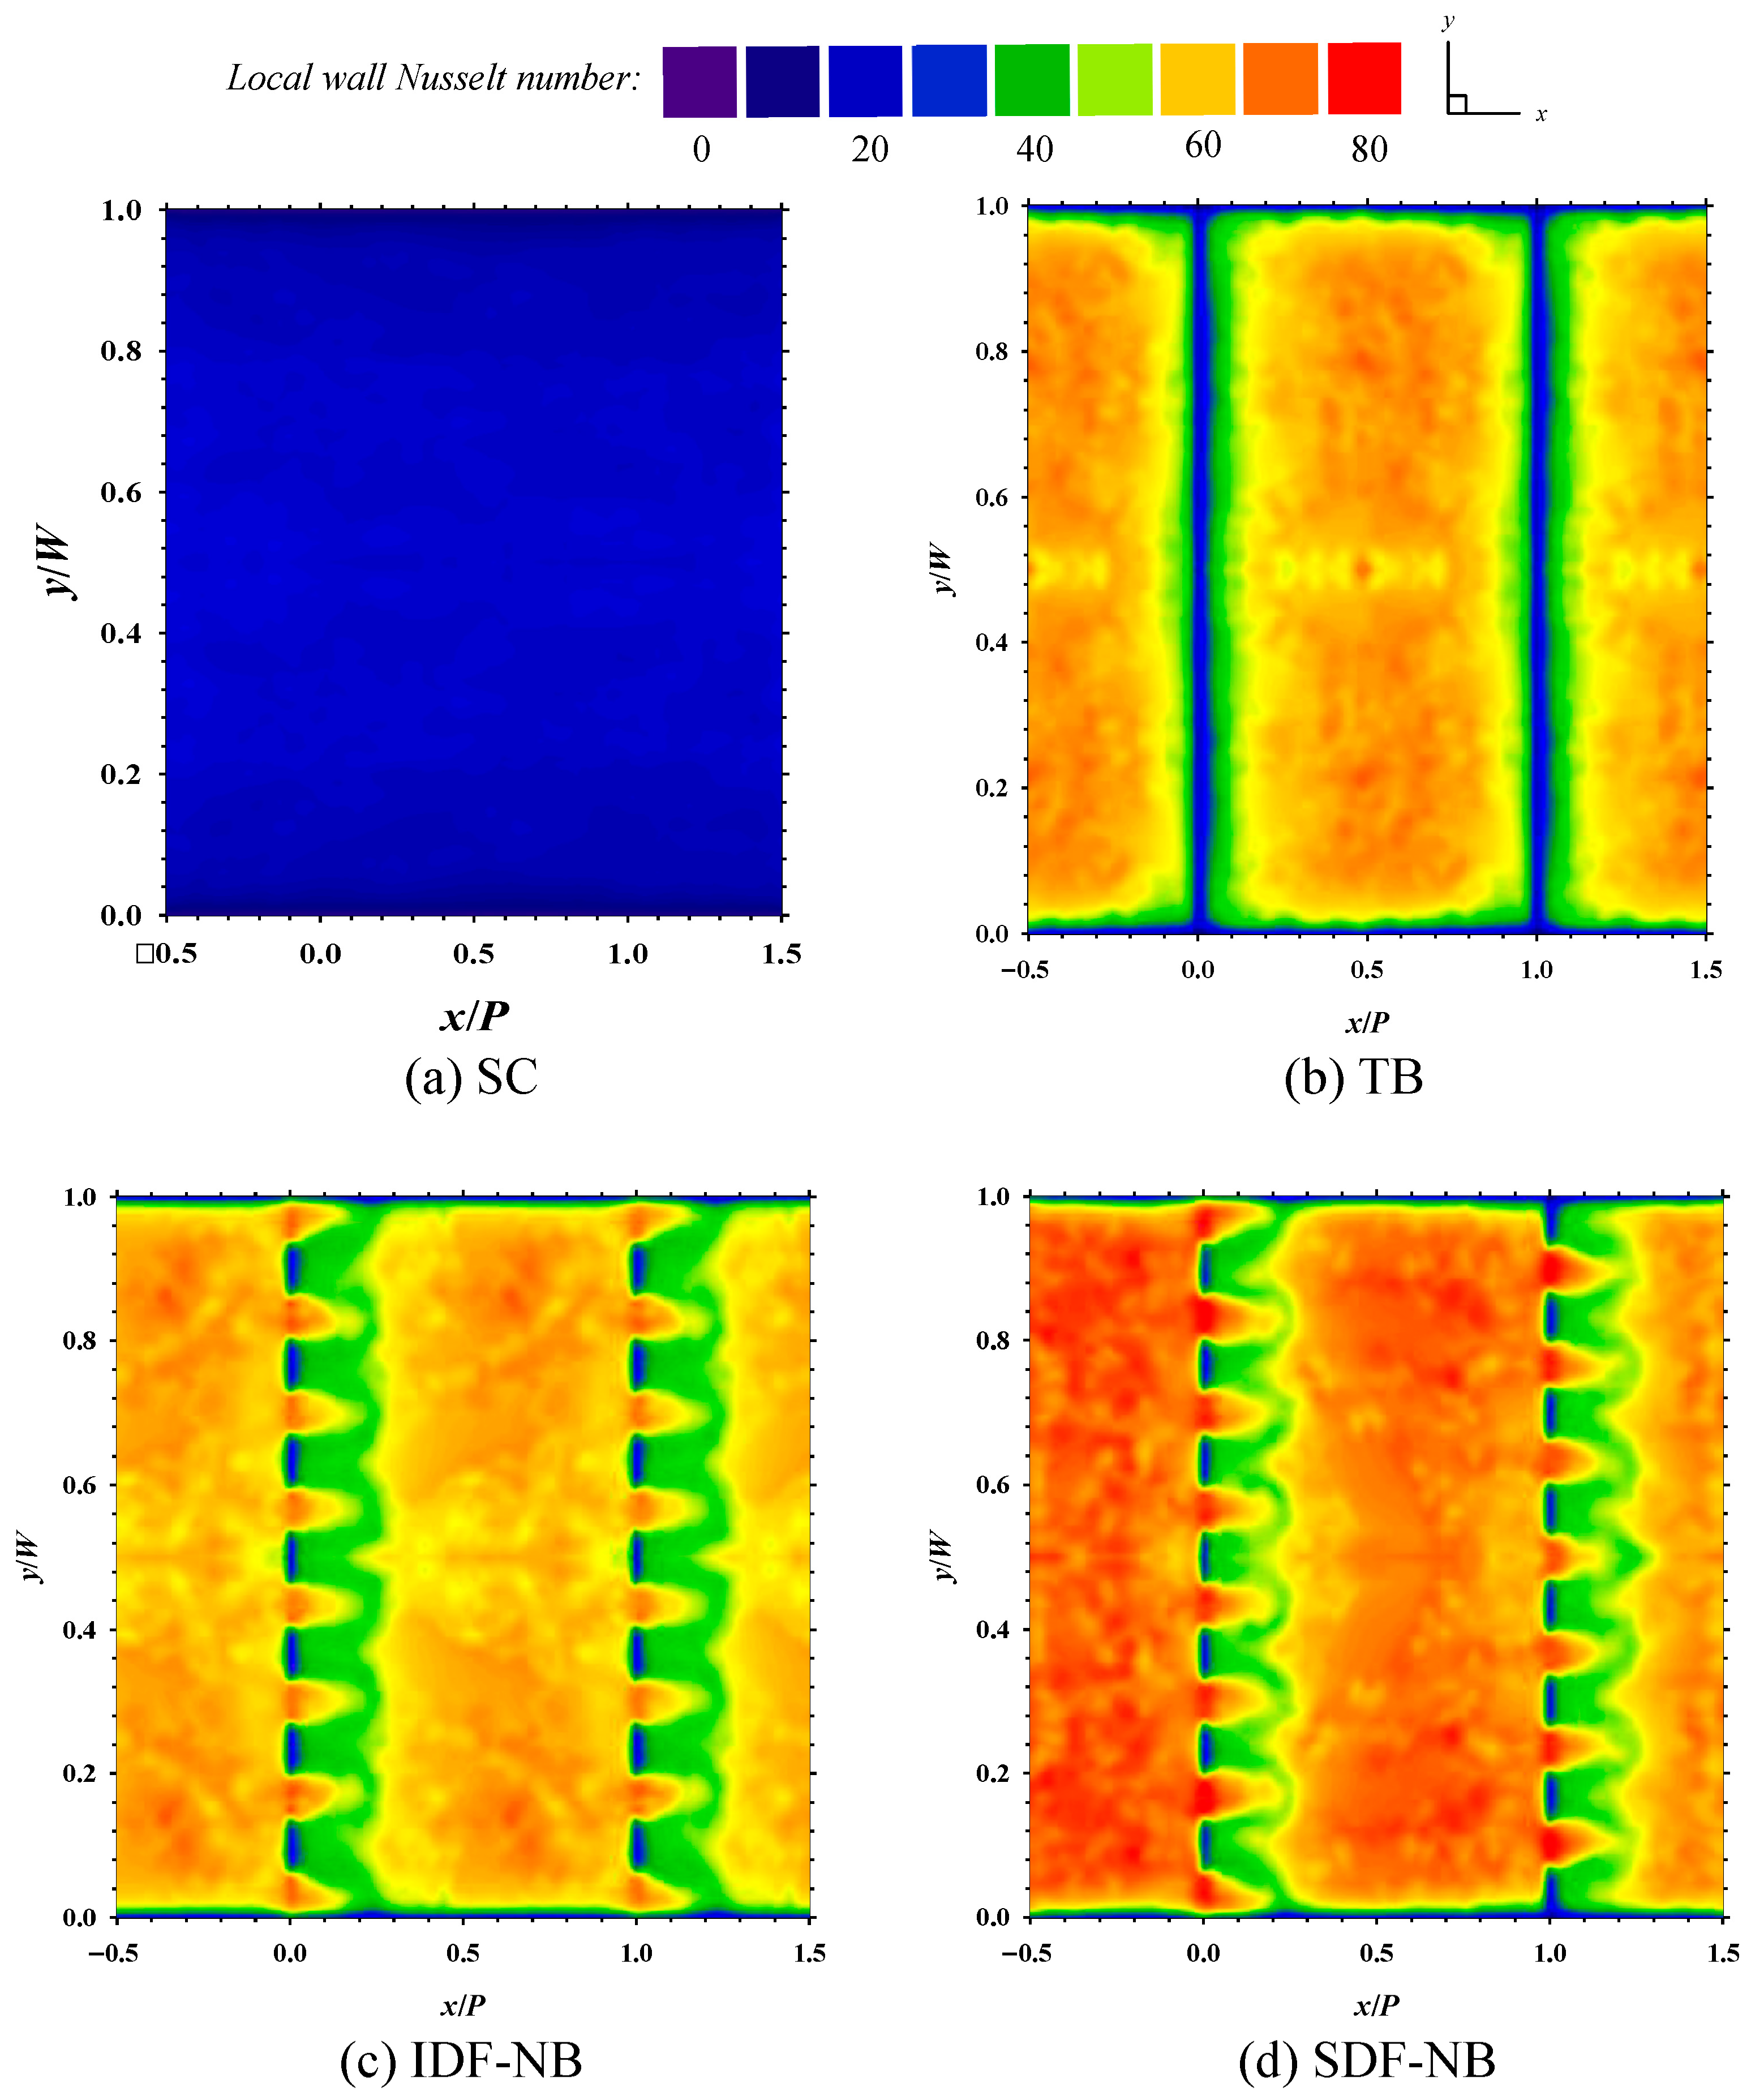
This section presents the effects of baffle design on the Nusselt number (Nu), friction factor (f), and thermal enhancement factor (TEF). The performance of three baffle configurations: conventional transverse baffles (TBs), in-line downward-facing notched baffles (IDF-NBs), and staggered downward-facing notched baffles (SDF-NBs), is compared. All designs are evaluated at a baffle pitch-to-height ratio (P/e) of 6.0, with the notched baffles (IDF-NBs and SDF-NBs) analyzed at a notch height-to-baffle height ratio (N/e) of 0.125. Figure 18a–d show the Nusselt number (Nu) distributions for channels with three different baffle configurations. Both notched baffles (IDF-NBs and SDF-NBs) demonstrated superior performance compared to the conventional transverse baffles, particularly in reducing dead zones near the notched regions. This improvement is attributed to flow reattachment through the perforations. Among the notched designs, the staggered downward-facing notched baffles (SDF-NBs) exhibited a more intense orange hue, indicating greater heat transfer enhancement, especially near the rear of the baffles. This superior performance is likely due to stronger redirected flow from a fresh, high-momentum stream entering through the perforations, as opposed to the weaker recirculating flow observed in the in-line configuration (In-line Downward-Facing Notched Baffle: IDF-NB).
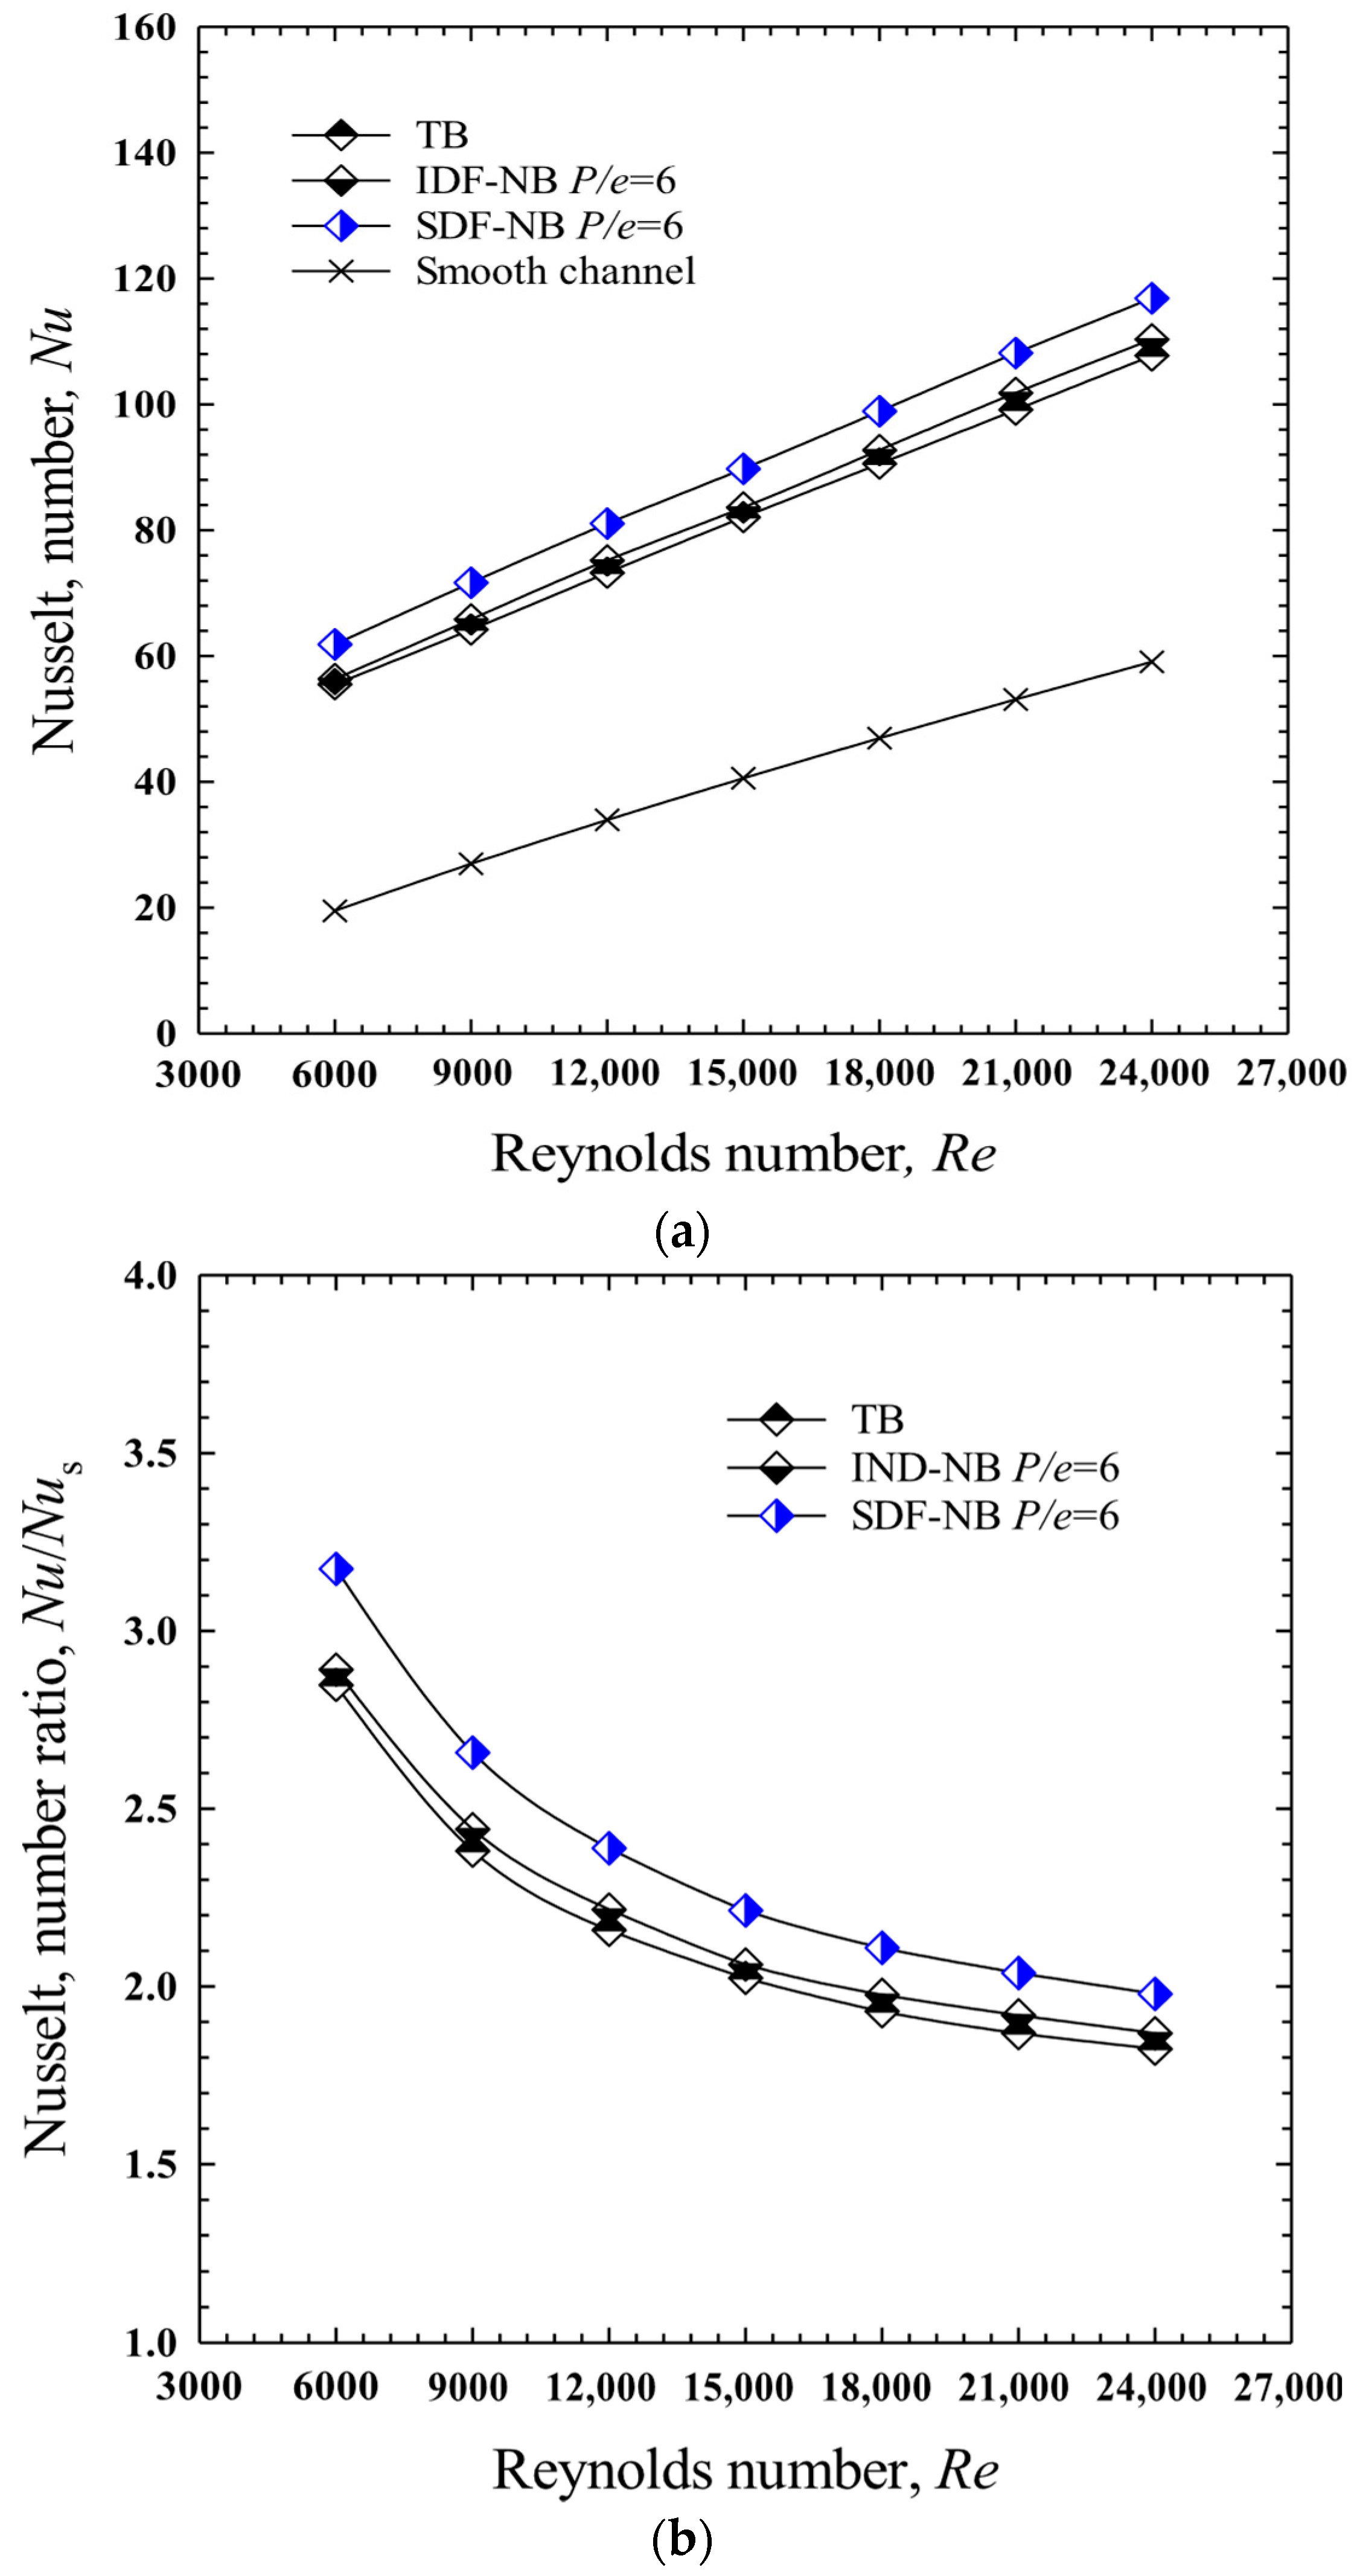
Figure 19a,b show the variations in the Nusselt number and the Nusselt number ratio with Reynolds number, ranging from 6000 to 24,000. Among the configurations tested, the staggered downward-facing notched baffles (SDF-NB) achieved the highest Nusselt numbers, followed by the in-line downward-facing notched baffles (IDF-NB) and the conventional transverse baffles (TB). The maximum Nusselt number observed was 116.886, corresponding to a Nusselt number ratio of 3.175 at a Reynolds number of 24,000. Across the entire Reynolds number range, SDF-NBs outperformed IDF-NBs and TBs by approximately 5.92% and 8.48%, respectively.
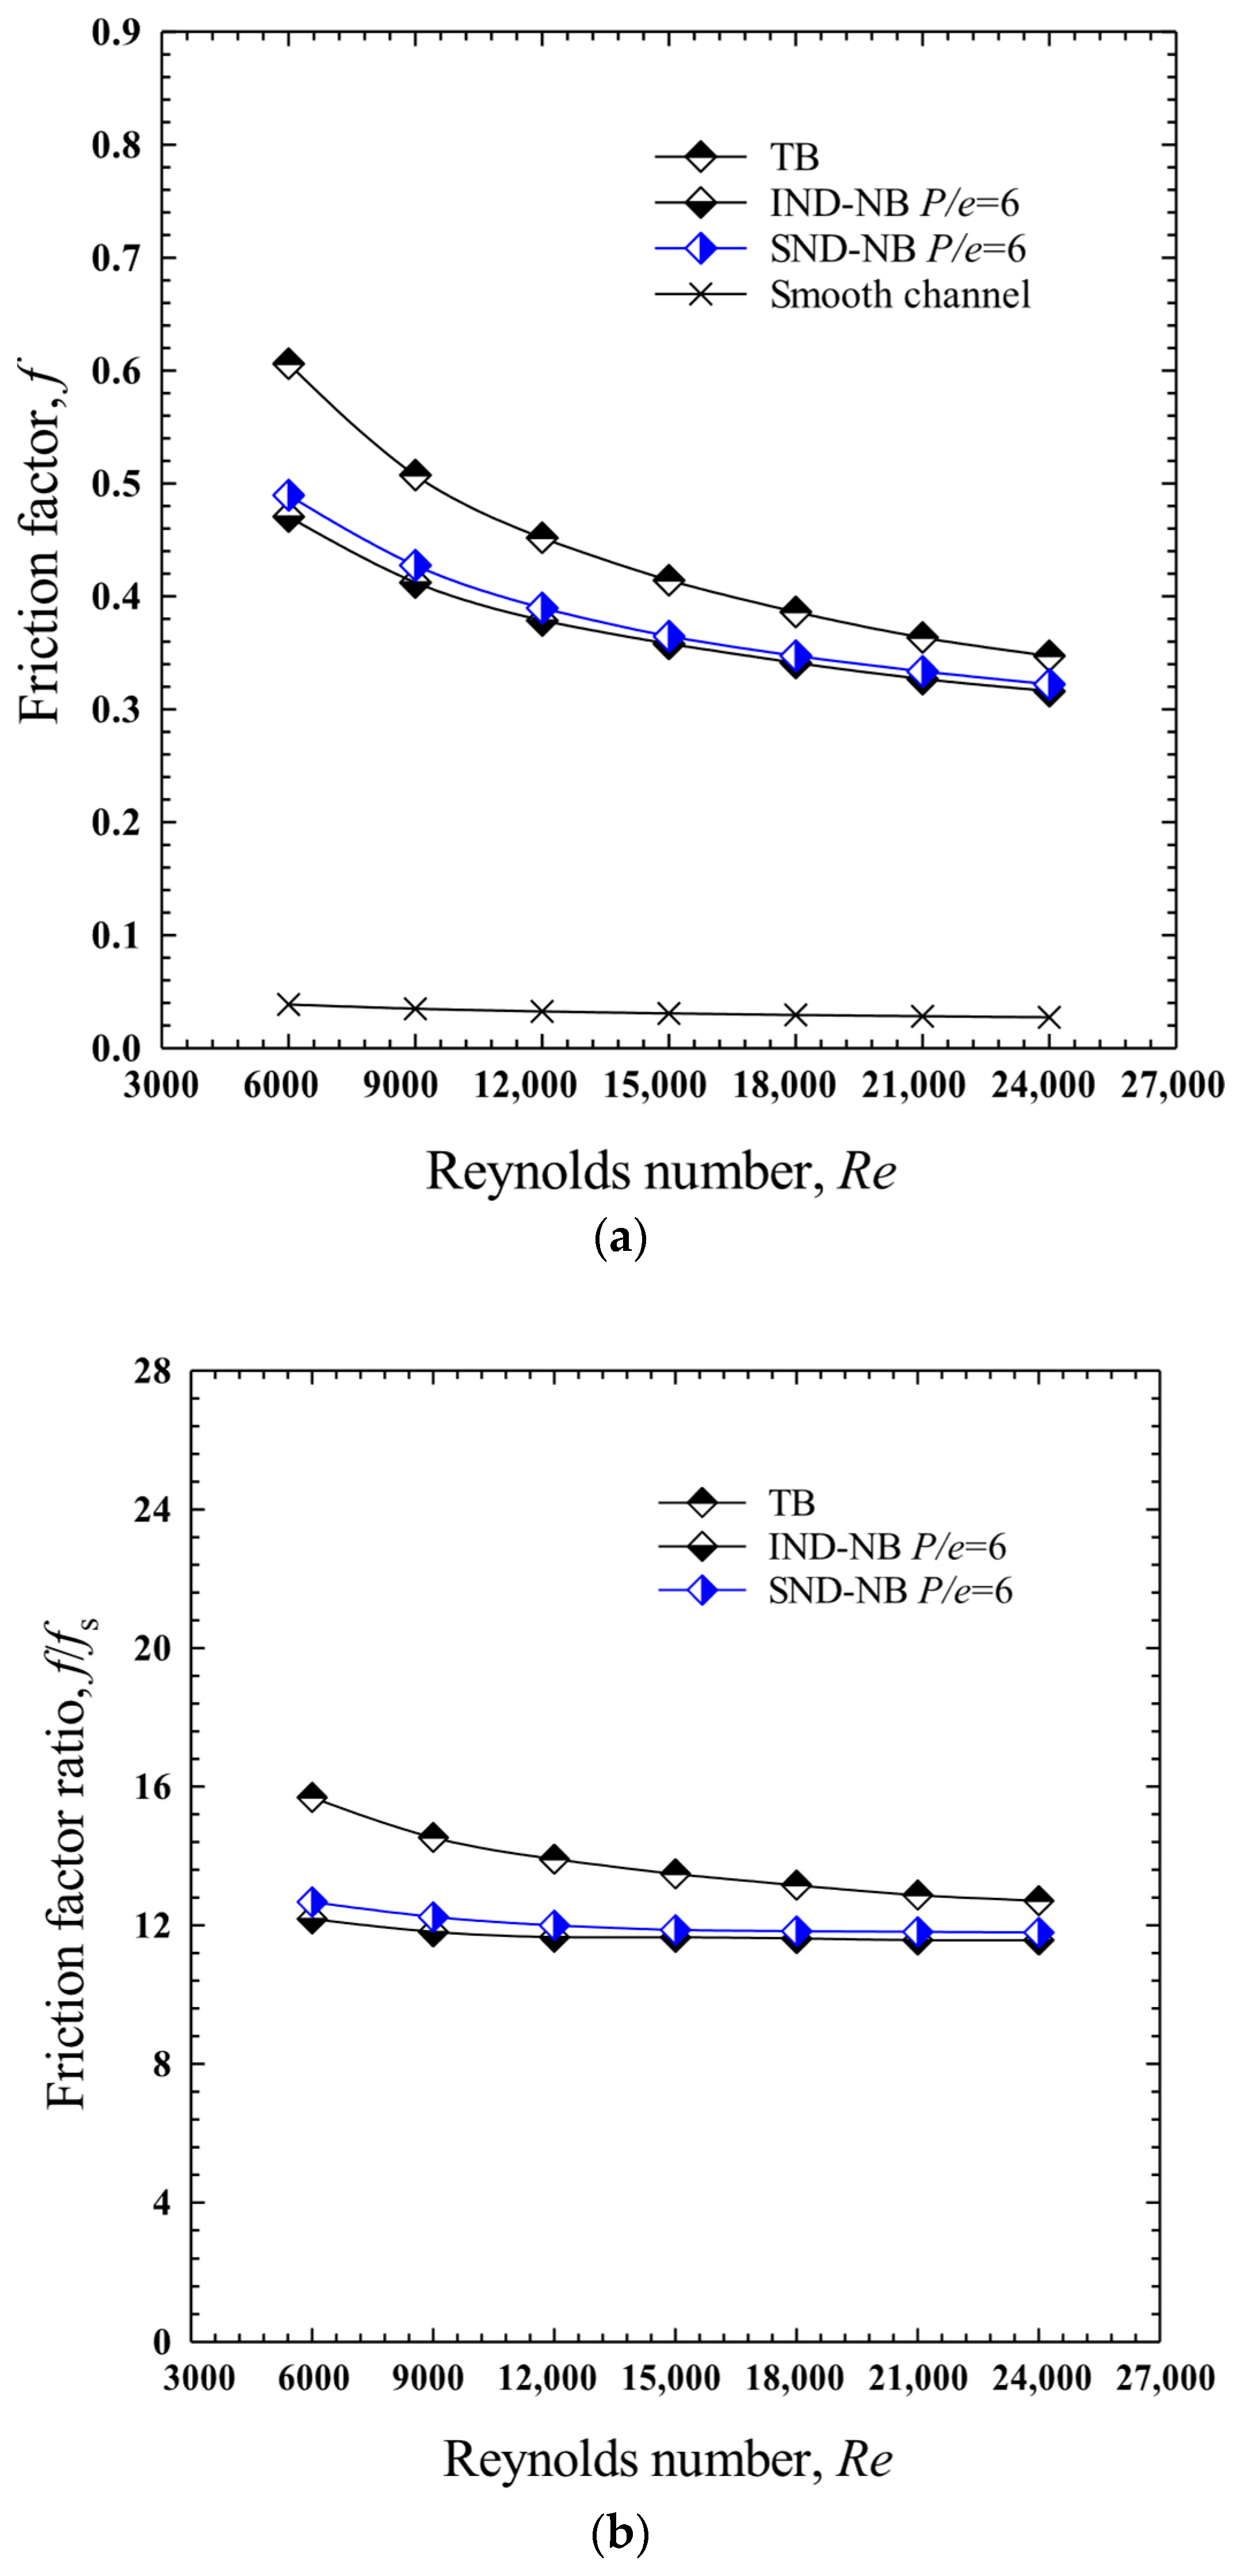
The effects of different baffle configurations: conventional transverse baffles (TB), in-line downward-facing notched baffles (IDF-NB), and staggered downward-facing notched baffles (SDF-NB) on the friction factor and friction factor ratio are illustrated in Figure 20a,b. All baffle setups use a pitch-to-height ratio (P/e) of 6.0, and the notched baffles have a notch height-to-baffle height ratio (N/e) of 0.125. At a given Reynolds number, the conventional transverse baffles exhibited the highest friction factor due to their greater solid blockage area. In contrast, the notched baffles allow more fluid to pass through, reducing flow resistance and frictional losses. Between the two notched configurations, the SDF-NBs produced a slightly higher friction factor than the IDF-NBs. This is attributed to stronger flow reattachment, as indicated by the more intense orange hue in Figure 18. The highest recorded friction factor (f) was 0.489, corresponding to a friction factor ratio (f/fs) of 15.68 at a Reynolds number of 6000. Across the full Reynolds number range, the conventional transverse baffles consistently showed appreciably higher friction factors, approximately 22.28% and 36.76% greater than those of the SDF-NBs and IDF-NBs, respectively.
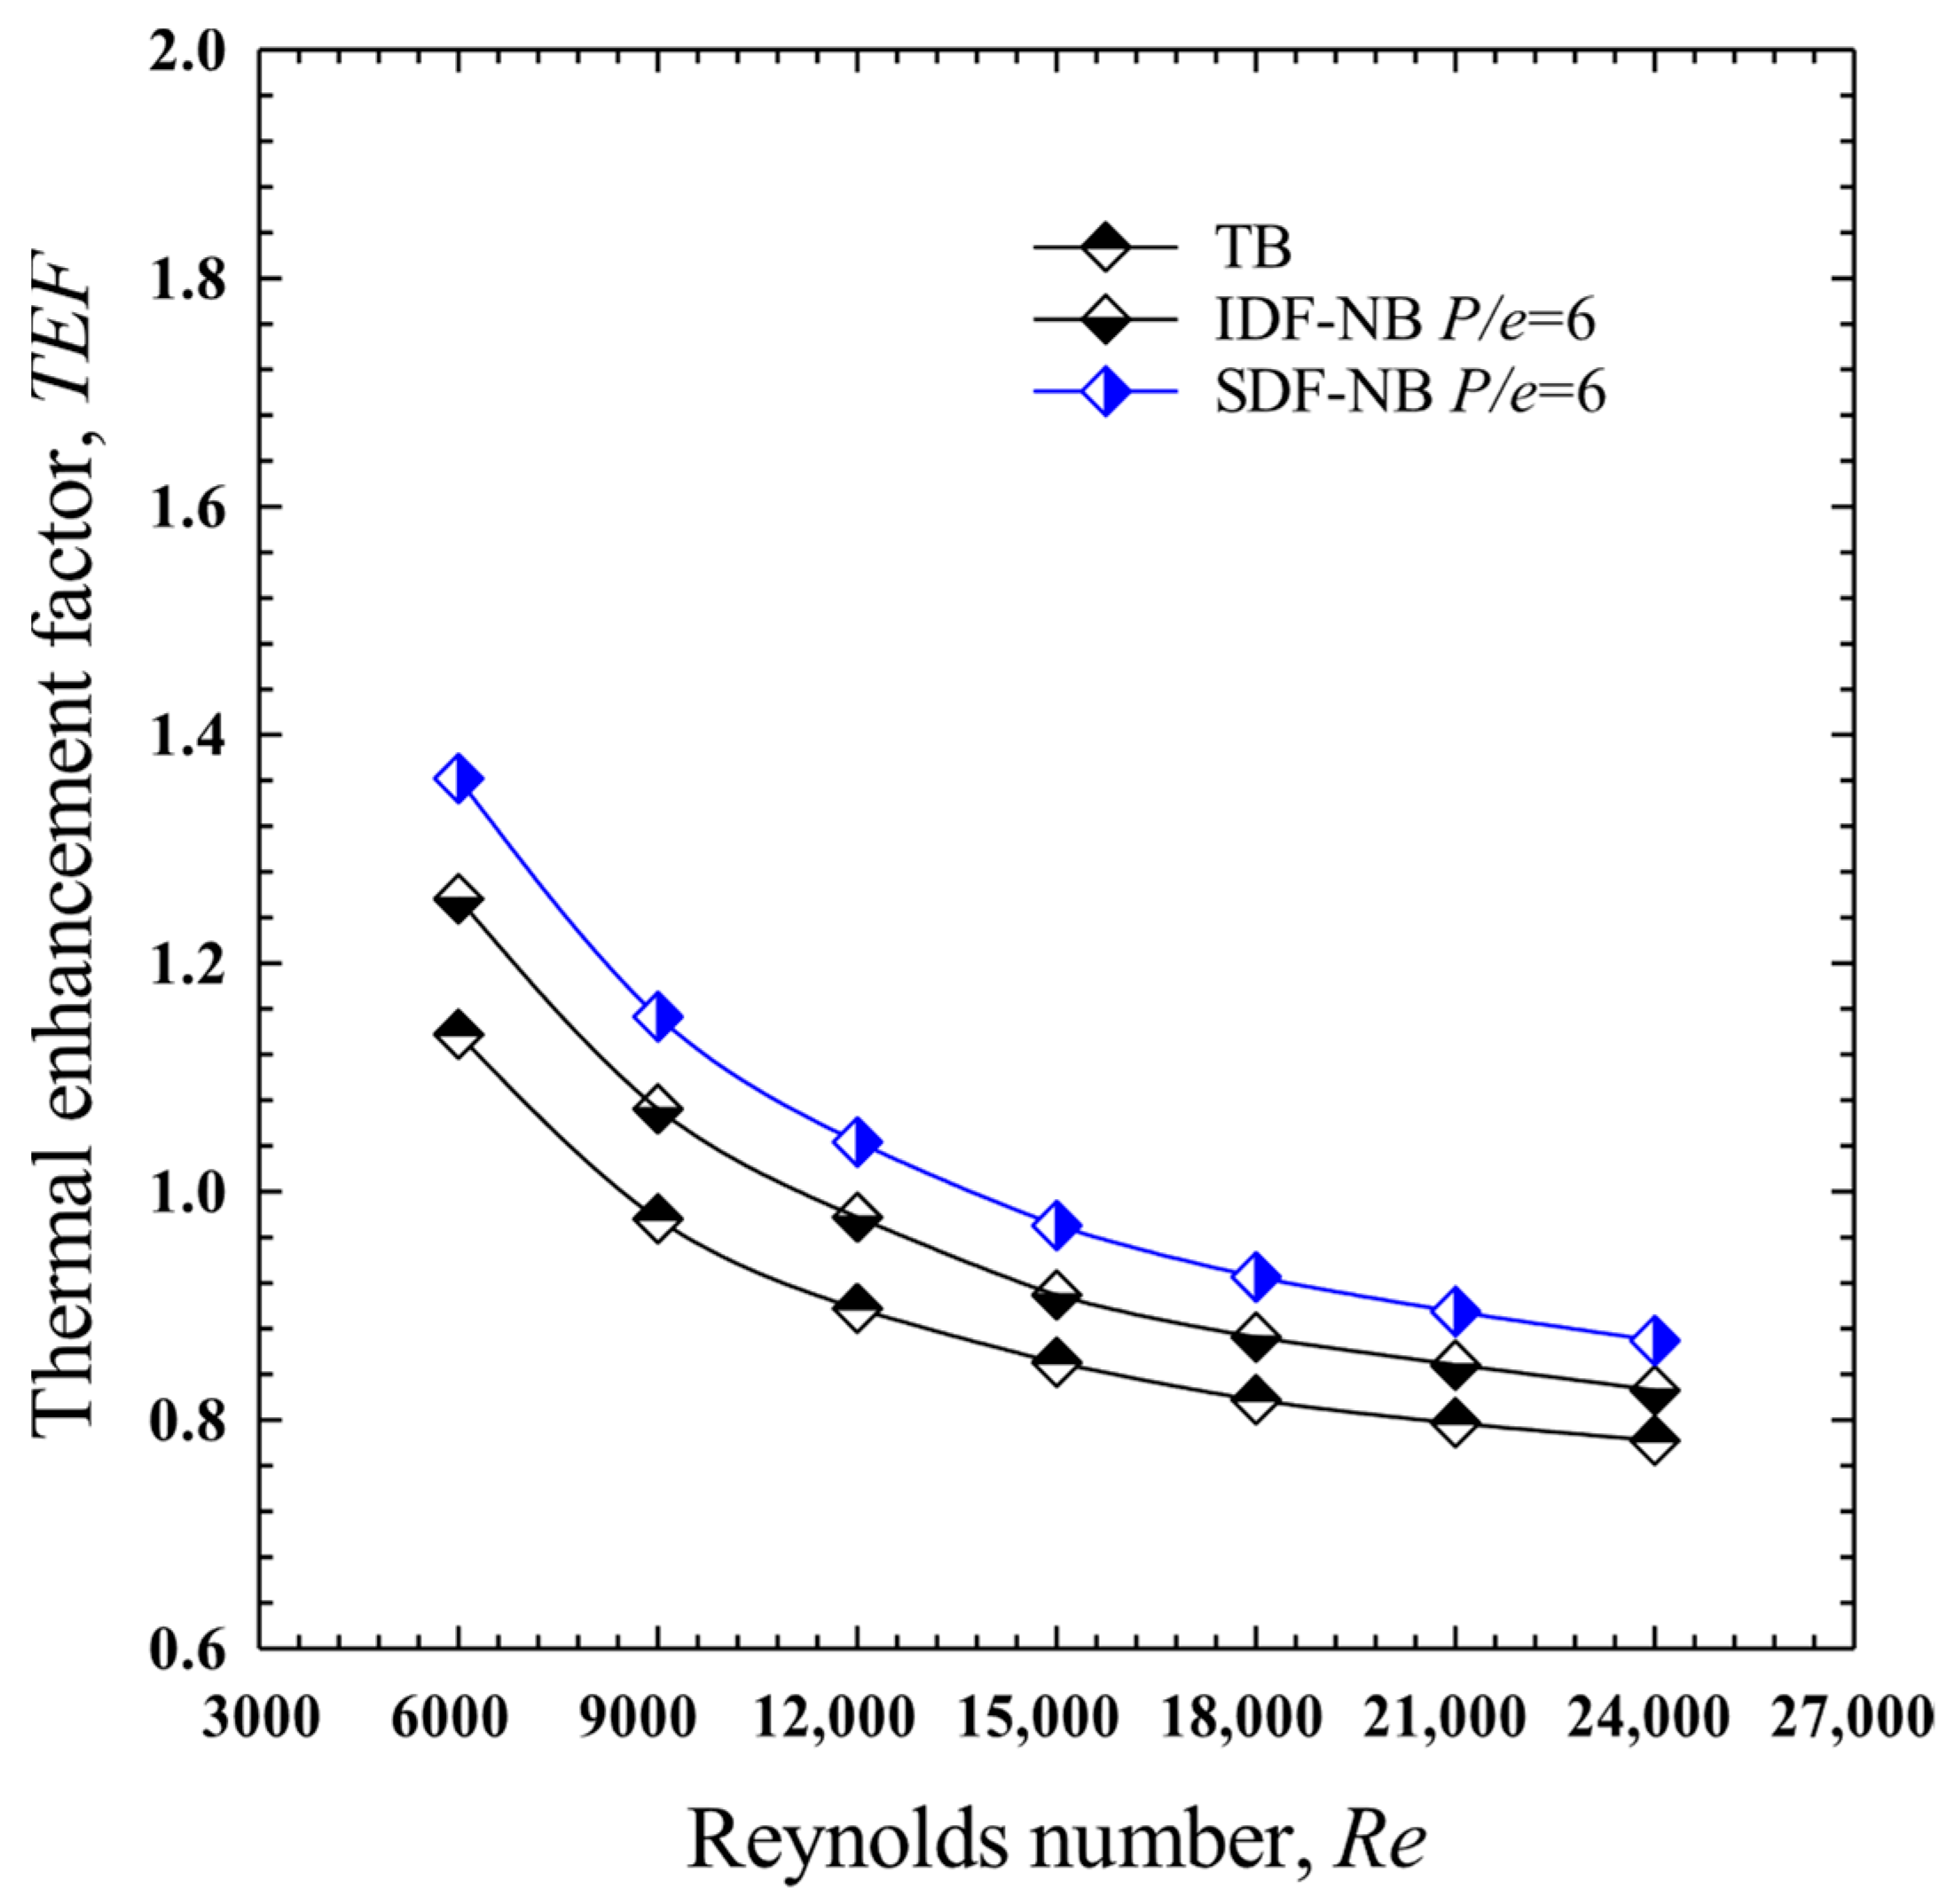
Figure 21 illustrates the variation in the thermal enhancement factor (TEF) with Reynolds number for channels with and without baffles. All baffle configurations share a pitch-to-height ratio (P/e) of 6, and the notched baffles have a notch height-to-baffle height ratio (N/e) of 0.125. Among the configurations, the staggered downward-facing notched baffles (SDF-NB) achieved the highest TEF, followed by the in-line downward-facing notched baffles (IDF-NB), and then the conventional transverse baffles (TB). The superior TEF performance of the notched baffles compared to the transverse baffles is primarily due to their lower frictional losses, enabled by the perforated design. Interestingly, although the SDF-NBs produced slightly higher friction losses than the IDF-NB, it still resulted in a better TEF. This improvement is attributed to the staggered arrangement, which enhances dead zone washing and leads to more effective heat transfer. The maximum TEF achieved by the SDF-NBs found a Reynolds number of 6000 was as high as 1.362. Across the full Reynolds number range, the conventional transverse baffles consistently showed appreciably higher TEF, approximately 8.35% and 19.68% greater than those of the IDF-NBs and TBs, respectively.

5. Summary

The influence of the baffle pitch-to-baffle height ratio (P/e) on heat transfer enhancement, flow resistance, and thermal performance was systematically investigated for three different baffle configurations: conventional transverse baffles (TBs), in-line downward-facing notched baffles (IDF-NBs), and staggered downward-facing notched baffles (SDF-NBs), across Reynolds numbers ranging from 6000 to 24,000. The key conclusions are as follows:
  • Across all configurations, a P/e ratio of 6.0 consistently yielded the highest Nusselt numbers, indicating the most effective convective heat transfer.
  • For the conventional transverse baffle (TB) configuration, the highest heat transfer occurred at P/e = 6.0 (Nu = 107.8, Nu/Nus = 2.848), but with a high friction penalty (f/fs = 15.686). The optimal thermal performance, considering pressure loss, was achieved at P/e = 8.0, where the TEF reached 1.168.
  • For the in-line downward-facing notched baffle (IDF-NB), P/e = 6.0 provided the best balance between heat transfer and pressure drop, with a maximum Nu of 110.4, Nu/Nus = 2.891, f/fs = 12.18, and the highest TEF of 1.257.
  • The staggered downward-facing notched baffles (SDF-NBs) achieved the most efficient performance at P/e = 6.0, with the highest Nu of 116.886, Nu/Nus = 3.175, f/fs = 12.669, and a peak TEF of 1.362, making it the most effective configuration overall.
  • Notched baffles (IDF-NBs and SDF-NBs) significantly reduced dead zones via perforation-induced reattachment and improved flow uniformity compared to conventional transverse baffles (TBs).
  • The staggered arrangement (SDF-NB) facilitated more vigorous redirected flow behind the baffles, leading to the highest overall thermal performance.

Author Contributions

Conceptualization, S.E.-A.; Methodology, A.P. and W.K.; Validation, A.P., W.K. and S.C.; Formal analysis, S.E.-A., M.K. and M.P.; Investigation, A.P., M.P. and S.C.; Resources, W.K. and M.P.; Data curation, W.K. and S.C.; Writing—original draft, A.P. and M.P.; Supervision, S.E.-A. All authors have read and agreed to the published version of the manuscript.

Funding

The authors acknowledge with appreciation the School of Engineering, King Mongkut’s Institute of Technology Ladkrabang for financial support of this research (Grant No. 2568-02-01-027).

Data Availability Statement

The data that support the findings of this study are available from National Science, Research and Innovation Fund (NSRF) but restrictions apply to the availability of these data, which were used under license for the current study, and so are not publicly available. For access to the data, kindly reach out to C. Thianpong.

Conflicts of Interest

The authors declare no conflict of interest.

Nomenclature

ACross-sectional area of testing section (m2)
bThe spacing between adjacent notches
CpSpecific heat capacity (J/K⋅kg)
DhChannel hydraulic diameter (m)
eBaffle height (m)
fFriction factor
hConvective heat transfer coefficient (W/m2K) or notch height (m)
HChannel height (m)
kConductivity of air, (W/m2K)
LChannel length (m)
mMass flow rate (kg/s)
NNotch height (mm)
NuNusselt number
PBaffle pitch length (m)
PePerimeter (m)
P/eBaffle pitch length to baffle height ratio
ΔpPressure loss (Pa)
QHeat transfer (W)
ReReynolds number
TTemperature (K)
UVelocity (m/s)
V ˙ Volumetric flow rate (m3/s)
WChannel width (m)
Greek letters 
νkinematic viscosity (m2/s)
ρFluid density (kg/m3)
Subscripts 
aair
bBulk
convconvection
hEquivalent channel height
iInlet
IElectric current (A)
oOutlet
SSmooth channel
VVoltage (V)
wWall
Abbreviation 
IDF-NBIn-line downward-facing notched-baffle
SDF-NBStaggered downward-facing notched-baffle
TBConventional Transverse baffle
TEFThermal enhancement factor
TLCThermochromic liquid crystal 

References

  1. Joo, H.J.; Kwak, H.Y.; Kong, M. Effect of twisted tape inserts on thermal performance of heat pipe evacuated-tube solar thermal collector. Energy 2022, 254, 124307. [Google Scholar] [CrossRef]
  2. Jaisankar, S.; Radhakrishnan, T.K.; Sheeba, K.N. Studies on heat transfer and friction factor characteristics of thermosyphon solar water heating system with helical twisted tapes. Energy 2009, 34, 1054–1064. [Google Scholar] [CrossRef]
  3. Göksu, T.T. Energy, exergy analysis, and RSM modeling of different designed twisted tapes in placed PV/T systems. Energy 2024, 304, 132041. [Google Scholar] [CrossRef]
  4. Yang, W.; Jin, C.; Zhu, W.; Xie, C.; Huang, L.; Li, Y.; Xiong, B. Innovative design for thermoelectric power generation: Two-stage thermoelectric generator with variable twist ratio twisted tapes optimizing maximum output. Appl. Energy 2024, 363, 123047. [Google Scholar] [CrossRef]
  5. Abajja, K.M.A.; Selimli, S.; Shaneb, A.M.A.; Eljetlawi, I.A.M. Enhancing Heat Transfer for Laminar Flow in Heat Pipes Using Perforated and Jagged-Edged Twisted Tapes: An experimental study. Energy 2025, 325, 136141. [Google Scholar] [CrossRef]
  6. Kouidri, I.; Dahmani, A.; Furizal, F.; Ma’arif, A.A.; Amrane, A.; Mouni, L.; Sharkawy, A.N. Artificial intelligence-based techniques for fouling resistance estimation of shell-and-tube heat exchanger: Cascaded forward and recurrent models. Eng 2025, 6, 85. [Google Scholar] [CrossRef]
  7. Ko, K.H.; Anand, N.K. Use of porous baffles to enhance heat transfer in a rectangular channel. Int. J. Heat Mass Tran. 2003, 46, 4191–4199. [Google Scholar] [CrossRef]
  8. Huang, K.D.; Tzeng, S.C.; Jeng, T.M.; Wang, J.R.; Cheng, S.Y.; Tseng, K.T. Experimental study of fluid flow and heat transfer characteristics in the square channel with a perforation baffle. Int. Commun. Heat Mass Transf. 2008, 35, 1106–1112. [Google Scholar] [CrossRef]
  9. Ary, B.K.P.; Lee, M.S.; Ahn, S.W.; Lee, D.H. The effect of the inclined perforated baffle on heat transfer and flow patterns in the channel. Int. Commun. Heat Mass Transf. 2012, 39, 1578–1583. [Google Scholar] [CrossRef]
  10. Chompookham, T.; Eiamsa-ard, S.; Promvonge, P. Heat transfer enhancement of turbulent channel flow by baffles with rectangular, triangular and trapezoidal upper edges. J. Engine. Thermo Phys. 2015, 24, 296–304. [Google Scholar] [CrossRef]
  11. Sahel, D.; Ameur, H.; Benzeguir, R.; Kamla, Y. Enhancement of heat transfer in a rectangular channel with perforated baffles. Appl. Therm. Eng. 2016, 101, 156–164. [Google Scholar] [CrossRef]
  12. Mashaei, P.R.; Taheri-Ghazvini, M.; Moghadam, R.S.; Madani, S. Smart role of Al2O3 -water suspension on laminar heat transfer in entrance region of a channel with transverse in-line baffles. Appl. Therm. Eng. 2016, 112, 450–463. [Google Scholar] [CrossRef]
  13. Habet, M.E.; Ahmed, S.A.; Saleh, M.A. Thermal/hydraulic characteristics of a rectangular channel with inline/staggered perforated baffles. Int. Commun. Heat Mass Transf. 2021, 128, 105591. [Google Scholar] [CrossRef]
  14. Habet, M.A.E.; Ahmed, S.A.; Saleh, M.A. The effect of using staggered and partially tilted perforated baffles on heat transfer and flow characteristics in a rectangular channel. Int. J. Therm. Sci. 2021, 174, 107422. [Google Scholar] [CrossRef]
  15. Eiamsa-ard, S.; Sripattanapipat, S.; Saysroy, A.; Promvonge, P.; Maruyama, N.; Hirota, M. Heat transfer distribution and flow characteristics in a channel with perforated-baffles. Energy Rep. 2022, 8, 420–426. [Google Scholar] [CrossRef]
  16. Karabulut, K. Heat transfer and thermal–hydraulic evaluations of cross-circular grooved rectangular flow ducts depending on rectangular baffle design parameters. Eur. Phys. J. Plus. 2024, 139, 227. [Google Scholar] [CrossRef]
  17. Jamal, I.; Barhdadi, F.Z.; Amghar, K.; Daoudi, S.; Yahiaoui, R.; Ghoumid, K. Enhancing performance in solar air channels: A numerical analysis of turbulent flow and heat transfer with novel shaped baffles. Appl. Therm. Eng. 2024, 251, 123561. [Google Scholar] [CrossRef]
  18. Alwatban, A.; Aljabr, A. Thermo-flow behavior of air-channel heat exchanger with nonidentical baffle lengths: Computa-tional analysis. J. Therm. Anal. Calorim. 2024, 149, 3593–3603. [Google Scholar] [CrossRef]
  19. Biswas, R.; Tripathy, P.P. Finite element based computational analysis to study the effects of baffle and fin on the perfor-mance assessment of solar collector. Therm. Sci. Eng. Prog. 2024, 49, 102431. [Google Scholar] [CrossRef]
  20. Jamal, I.; Barhdadi, F.Z.; Daoudi, S.; Kaouachi, A. Numerical analysis of the effect of baffle length and arrangement on the thermal performance of solar air channels. Int. Commun. Heat Mass Transf. 2024, 161, 108458. [Google Scholar] [CrossRef]
  21. Suri, A.R.S.; Kumar, A.; Maithani, R. Experimental determination of enhancement of heat transfer in a multiple square perforated twisted tape inserts heat exchanger tube. Exp Heat Transfer. 2018, 31, 85–105. [Google Scholar] [CrossRef]
  22. Coleman, H.W.; Steele, W.G. Experimentation, Validation, and Uncertainty Analysis for Engineers, 3rd ed.; John Wiley and Sons: Hoboken, NJ, USA, 2009. [Google Scholar]
  23. Toriyama, K.; Tada, S.; Ichimiya, K.; Funatani, S.; Tomita, Y. A new method of temperature measurement using thermo-chromic liquid crystals (extension of measurable range based on spectral intensity in the narrow-band wavelength). Int. J. Heat Mass Transf. 2016, 92, 483–489. [Google Scholar] [CrossRef]
  24. Abdullah, N.A.; Talib, R.A.; Jaafer, A.A.; Salleh, M.A.M.; Chong, W.T. The basics and issues of thermochromic liquid crystal calibrations. Exp. Therm. Fluid Sci. 2010, 34, 1089–1121. [Google Scholar] [CrossRef]
  25. Kline, S.J.; McClintock, F.A. Describing uncertainties in single sample experi-ments. Mech. Eng. 1953, 75, 3–8. [Google Scholar]
Figure 1. Schematic diagram of the experimental apparatus.
Eng 06 00229 g001
Figure 2. Illustrates the configurations of conventional transverse baffles and notched baffles arranged in both inline and staggered patterns. The roughness pitch ratio (P/e) was varied from 2.0 to 10. (a) Conventional transverse baffle (TB); (b) In-line downward-facing notched baffle (IDF-NB) configuration; (c) Staggered downward-facing notched baffle (SDF-NB) configuration; (d) Modified baffle arrangement in the rectangular channel with pitch-to-height ratios (P/e).
Eng 06 00229 g002aEng 06 00229 g002b
Figure 3. Validation test of Nusselt Number and friction factor for flow in a smooth channel. (a) Nu; (b) f.
Eng 06 00229 g003
Figure 4. Effect of conventional transverse baffle (TB) at various pitch-to-height ratios (P/e) on Nusselt number distribution at baffle height-to-channel height ratio (e/H) of 0.3 and Reynolds number of 6000.
Eng 06 00229 g004
Figure 5. Relationship between Nusselt number and Reynolds number for channel equipped with conventional transverse baffle (TB) at pitch-to-height ratios (P/e) ranging from 2.0 to 10. (a) Nu; (b) Nu/Nus.
Eng 06 00229 g005aEng 06 00229 g005b
Figure 6. Relationship between friction factor and Reynolds number for channel equipped with conventional transverse baffle (TB) at pitch-to-height ratios (P/e) ranging from 2.0 to 10. (a) f; (b) f/fs.
Eng 06 00229 g006
Figure 7. Relationship between thermal enhancement factor and Reynolds number for channel equipped with conventional transverse baffle (TB) at pitch-to-height ratios (P/e) ranging from 2.0 to 10.
Eng 06 00229 g007
Figure 8. Effect of in-line downward-facing notched baffle (IDF-NB) aligned at various pitch-to-height ratios (P/e) on Nusselt number distribution at baffle height-to-channel height ratio (e/H) of 0.3 and Reynolds number of 6000.
Eng 06 00229 g008
Figure 9. The airflow pattern through the conventional transverse baffle (TB) and notched baffle aligned in-line and facing downward (In-line Downward-Facing Notched Baffle: IDF-NB). (a) TB; (b) IDF-NB.
Eng 06 00229 g009
Figure 10. Relationship between Nusselt number and Reynolds number for channel equipped with notched baffle aligned in-line and facing downward (In-line Downward-Facing Notched Baffle: IDF-NB) at pitch-to-height ratios (P/e) ranging from 2.0 to 10. (a) Nu; (b) Nu/Nus.
Eng 06 00229 g010
Figure 11. Relationship between friction factor and Reynolds number for channel equipped with notched baffle aligned in-line and facing downward (In-line Downward-Facing Notched Baffle: IDF-NB) at pitch-to-height ratios (P/e) ranging from 2.0 to 10. (a) f; (b) f/fs.
Eng 06 00229 g011
Figure 12. Relationship between thermal enhancement factor and Reynolds number for channel equipped with notched baffle aligned in-line and facing downward (In-line Downward-Facing Notched Baffle: IDF-NB) at pitch-to-height ratios (P/e) ranging from 2.0 to 10.
Eng 06 00229 g012
Figure 13. Effect of staggered downward-facing notched baffles (SDF-NB) at various pitch-to-height ratios (P/e) on Nusselt number distribution at baffle height-to-channel height ratio (e/H) of 0.3 and Reynolds number of 6000.
Eng 06 00229 g013
Figure 14. The airflow pattern through the staggered downward-facing notched baffles (SDF-NB).
Eng 06 00229 g014
Figure 15. Relationship between Nusselt number and Reynolds number for channel equipped with staggered downward-facing notched baffles (SDF-NB) at pitch-to-height ratios (P/e) ranging from 2.0 to 10. (a) Nu; (b) Nu/Nus.
Eng 06 00229 g015
Figure 16. Relationship between friction factor and Reynolds number for channel equipped with staggered downward-facing notched baffles (SDF-NB) at pitch-to-height ratios (P/e) ranging from 2.0 to 10. (a) f; (b) f/fs.
Eng 06 00229 g016
Figure 17. Relationship between thermal enhancement factor and Reynolds number for channel equipped with staggered downward-facing notched baffles (SDF-NB) at pitch-to-height ratios (P/e) ranging from 2.0 to 10.
Eng 06 00229 g017
Figure 18. Effect of baffle configurations (in-line downward-facing notched baffles, IDF-NBs, and staggered downward-facing notched baffles, SDF-NBs) on Nusselt number distribution at P/e = 6.0, N/e = 0.125 and Re = 6000.
Eng 06 00229 g018
Figure 19. Effect of baffle configurations (in-line downward-facing notched baffles, IDF-NBs, and staggered downward-facing notched baffles, SDF-NBs) on Nusselt number at P/e = 6.0 and N/e = 0.125. (a) Nu; (b) Nu/Nus.
Eng 06 00229 g019
Figure 20. Effect of baffle configurations (in-line downward-facing notched baffles, IDF-NBs, and staggered downward-facing notched baffles, SDF-NBs) on friction factor at P/e = 6.0 and N/e = 0.125. (a) f; (b) f/fs.
Eng 06 00229 g020
Figure 21. Effect of baffle configurations (in-line downward-facing notched baffles, IDF-NBs, and staggered downward-facing notched baffles, SDF-NBs) on thermal enhancement factor at P/e = 6.0 and N/e = 0.125.
Eng 06 00229 g021
Table 1. Geometries of conventional transverse baffles and notched baffles with inline and staggered configurations and operating conditions.
Test Channel (Height, Width, Length; H × W × L)40 mm × 150 mm × 900 mm
Channel aspect ratio (W/H)3.75
Baffle materialPolylactic acid plastic (PLA)
Space between adjacent notches (b)10
Roughness pitch ratio (P/e)2.0, 4.0, 6.0, 8.0, and 10
notch height-to-baffle height ratio (N/e)0.125 for Case II and Case III
Working fluidAir
Reynolds number6000–24,000
Prandtl number0.7
Table 2. Specifications of the instruments used to perform the calibration and experiment.
ItemDescriptionSpecification
Camera Type SLR-liketake TLC
(Surface pictures)
Effective Pixel 24.93 megapixels
(4928 × 3264 pixels for large size)
Liquid Crystal Coated sheet
(TLC)
Temperature indicating sheet
(Heating surface)
accuracy: ±0.1 °C,
40–45 °C (104–113 °F)
Fluke 922
thermo-anemometer
Air velocity
(Measurement airflow)
accuracy: ±2.5% for reading
(±0.015 m/s), range: 1–80 m/s
resolution: 0.01 m/s
Dwyer MS2Differential pressure sensor
(Orifice section)
accuracy: ±1% for 250 Pa,
±1% for 250–1250 Pa
Dwyer DM-2005-LCDDifferential pressure sensor
(Test section)
accuracy: ±1% full scale at 70 °C
HIOKI data loggerTemperature recorder
(Display show temperature)
10 ms high-speed sampling
(30-channel as standard)
RTD Pt100Temperature sensor
(Inlet and outlet temperature)
accuracy: ±0.001 Ω at 0 °C
(−130 to 95 ±0.05 °C)
Table 3. Uncertainties of directly measured parameters based on equipment calibration data and manufacturer specifications.
VariableUncertainty
Air temperature (T)±0.1%
Surface temperature (Ts)±0.1%
Air velocity (U)±2.5%
Differential pressure (ΔP)±1.0%
Duct diameter/length (D, L)±0.5%
Cross-section area (A)±0.5%
Density (ρ)±1.5%
Viscosity (μ)±2.0%
Thermal conductivity (k)±3.0%
Power input (Q)±0.5%
Table 4. Summary of uncertainty estimates for key experimental parameters.
ParameterUncertainty (%)
Reynolds number (Re)±3.54%
Nusselt number (Nu)±3.10%
Friction factor (f)±5.34%
Disclaimer/Publisher’s Note: The statements, opinions and data contained in all publications are solely those of the individual author(s) and contributor(s) and not of MDPI and/or the editor(s). MDPI and/or the editor(s) disclaim responsibility for any injury to people or property resulting from any ideas, methods, instructions or products referred to in the content.