Article

Intelligent Fault Detection of MV/HV Transformers Using Fuzzy Logic Based on DGA

1
Department of Electrical Engineering, University of Botswana, Gaborone UB0061, Botswana
2
Department of Electronics Engineering, University of Engineering and Technology, Taxila 47050, Pakistan
3
Department of Electrical and Electronic Engineering Technology, University of Johannesburg, Johannesburg 2092, South Africa
*
Authors to whom correspondence should be addressed.
Eng 2025, 6(9), 228; https://doi.org/10.3390/eng6090228
Submission received: 22 June 2025 / Revised: 21 July 2025 / Accepted: 1 September 2025 / Published: 4 September 2025
(This article belongs to the Section Electrical and Electronic Engineering)

Abstract

Dissolved Gas Analysis (DGA) of power system transformers has emerged as one of the most effective transformer health diagnosing tools by analyzing the gases dissolved in the insulating oil. There are various traditional DGA techniques like Key Gas Method, Roger’s Ratio, IEC ratio, Dornenburg’s Ratio, and Duval Triangle method. However, these techniques have limitations such as inconsistent results, the inability to detect low-energy faults, and reliance on expert knowledge due to complex interpretation. To overcome these limitations, this paper introduces an integrated fuzzy logic system that enhances DGA interpretation by combining the diagnostic strengths of Key Gas Method, Roger’s Ratio, IEC ratio, and Duval Triangle methods. To obtain a final, human-readable diagnosis, the output of each technique is incorporated into a higher-level fuzzy inference system once each is modeled separately with fuzzy logic, having known membership functions and rule bases. To test this model, oil samples of known results of different transformers are used and compared to the results given by the proposed fuzzy inference system. The proposed method is easier and more feasible for practical use since it not only improves fault detection accuracy and reliability but also allows for easier interpretation by non-specialists. This study makes an additional contribution to a higher-level, more effective, and more accurate method for transformer fault detection by overcoming the interpretational difficulties and weaknesses of conventional DGA approaches.

1. Introduction

Power transformers are a very crucial apparatus in the electric power system of transmission and distribution. Utilities tend to measure transformer condition and prioritize them to develop maintenance schedules. Transformer oil plays a very significant role in transformer operation as it is used in its core for cooling and insulation [1]. During transformer operation, the oil is exposed to thermal and electrical stresses, and if these stresses are not dealt with, it may affect the transformer’s life and efficiency. Therefore, it is important to monitor the health of a transformer to prevent further degradation of the transformer insulation and breakdown, which may eventually lead to disturbance of the power system as a whole [2]. The majority of transformer diagnostic procedures are costly and difficult to utilize because they require strict testing protocols. One of the most effective methods in terms of affordability and ease of use is Dissolved Gas Analysis (DGA), which was developed over many years by R&D communities and engineers who specialize in defect diagnosis in original equipment manufacturing businesses. Power engineers can benefit from this technique as it provides a complete breakdown of the components that make up insulating oil. As more sophisticated and advanced diagnostic tools are being created, it is necessary to create a prototype algorithm that can consider the percentages of the various parts and provide us with a human-readable response that expresses the insulating oil’s condition.
DGA is used for identifying the health of the transformer depending on the concentration of various gases dissolved in transformer oil [3]. The presence of certain gases is an indication of specific faults. Gases found in the transformer oil due to decomposition are hydrogen (H2), methane (CH4), ethane (C2H6), ethylene (C2H4), and acetylene (C2H2), while carbon monoxide (CO) and carbon dioxide (CO2) are due to paper decomposition [3]. Faults like partial discharge occur within the gaps of insulation, such as an air bubble or small sections of the fluid, but do not allow continuous discharge between metal contacts. Hydrogen is the key gas in this fault. Arcing or high-energy discharge, this fault suggests electricity is jumping between metal contacts, causing a continuous arc. It is characterized by the presence of hydrogen and acetylene; they are a sign of electrical stress in a transformer. High temperature overheating is a common defect that can compromise a transformer’s performance. When temperatures rise steeply, often due to overloading or inadequate cooling, fault gases are produced [4]. Their concentration is normally determined by the temperature of the oil. For instance, hydrogen and methane are produced in large quantities if the temperature of the transformer rises to between 150 °C and 300 °C due to abnormal thermal stresses. If the temperatures rise above 300 °C, ethylene is produced in large quantities, and at 700 °C and above, a large amount of hydrogen and ethylene is produced. Therefore, ethylene is an indication of a very high temperature hot spot inside an electrical transformer [5]. Paper insulation degradation is extremely important for the electrical and mechanical integrity of a transformer. It insulates the windings, provides a facility for cooling oil, and even acts as mechanical support. Paper degradation results in carbon monoxide discharge and, later on, carbon dioxide [3,5]. Lastly, it is important to mention that DGA can help identify the faults, namely partial discharge, arcing, hot spots in the core, overheating of oil or paper insulation, insulation aging, sparking between contacts, and internal short circuits well in time, accurately for predictive maintenance [4,6,7].

2. Problem Statement

Power transformers are vital components in electrical power systems, utilized to ensure stable transmission and distribution of electricity. One of the most significant processes is constant transformer maintenance because, if it breaks down, there will be large interruptions, loss of funds, and even accidents. To avoid such unwanted failures and increase the service life of such critical components, fault detection as soon as possible and ongoing monitoring of the transformer’s condition are required.
As one of the fault detection methods, DGA is used, and it involves analyzing the types and concentration of gases dissolved in the transformer’s insulation oil. In the case of an internal transformer fault, some gases are released due to oil degradation or insulation materials. DGA can perhaps provide critical information about the condition of the transformer by analyzing and detecting these gases, enabling early intervention and maintenance.
Despite its proven effectiveness, the traditional use of DGA is attended by a unique set of difficulties. Despite their accuracy, modern methods of diagnosis tend to be based on more sophisticated or technical interpretation techniques and specialist expertise; therefore, they are less accessible to non-specialists. Decision-makers also want to have information that is readily understandable and actionable, and such techniques will tend to produce a technical report, which can be hard for them to analyze. Also, with transformer design increasingly improving and operating demands growing, there is a greater need for even more sophisticated diagnostic tools that can keep pace with current standards.
The main challenge that this paper seeks to overcome is the need for a more efficient diagnostic approach that maintains the accuracy and reliability of DGA but allows for simpler interpretation of the results. More specifically, there is a need for a prototype algorithm that would read DGA data and convert it to an easily understandable, human-readable diagnosis. The dissolved gas concentrations, potential faults, and general condition of the transformer must be calculated based on such an algorithm. This would enable numerous users, such as non-specialists, to make intelligent decisions regarding the operation and maintenance of transformers.

3. Motivation

The strong need to improve the effectiveness and reliability of power transformer diagnostic techniques is the driving force for this project. Transformers form the core of the stability of electrical power networks, and sudden failure can be catastrophic. While DGA is a common technique for identifying transformer faults, its complex interpretation typically requires some expert knowledge and thus limits its accessibility. With the development of an algorithm that would convert technical information into meaningful, productive information, this research aims to enhance and simplify DGA diagnostics. This project is aimed at enabling more stakeholders to ensure transformer health and deliver faultless electricity by making DGA accessible.

4. Literature Review

DGA has been utilized over the years, and due to some imperfections, various research have been carried out with the aim of improving its overall efficiency. This section goes through previous studies to try and identify gaps and justify the need for this proposal.
DGA has developed into a fundamental method for condition monitoring and fault detection of power transformers. Transformers form an important element of electrical power networks; therefore, it is necessary to check whether they work properly or not. By checking dissolved gases present in the insulation oil, DGA provides an efficient, inexpensive, and universally accepted technique of transformer fault identification and diagnosis [8]. Over the years, several studies have been conducted to improve the effectiveness of DGA techniques such as Key Gas Method, Roger’s Ratio, Dornenburg’s ratio, and Duval Triangle method [9], to make it an indispensable tool for engineers and maintenance personnel. But the difference in the outcomes of several DGA techniques has grown to be problematic. Studies by [10,11] targeted a consistent DGA interpretation using a fuzzy logic method. This study compared and then merged a number of techniques, including the Duval Triangle, Key Gas Method, Dornenburg’s ratio, IEC (International Electrotechnical Commission) ratio, and Roger’s Ratio. However, a study by [12] assessed the precision of different DGA methods for diagnosing transformer faults. The authors wanted to know the accuracy of various ways of fault type prediction in comparison to the Key Gas Method, Dornenburg’s, Roger’s, IEC, and Duval Triangle methods. Although there are merits in every method, they have observed that the Duval Triangle gave the maximum total accuracy. But with the inclusion of AI, the DGA methods can be developed further for transformer oil quality testing. In references [13,14], DGA methods are mainly utilized for the monitoring of transformer faults like PD, electrical discharges, thermal faults, and paper Insulation Breakdowns. With the goal of increasing accuracy, [15] brought forward a new graphical triangle approach founded on innovative three gas concentration ratios. Five combustible gases, like C2H6 and H2, which are originally not considered under the Duval Triangle, are taken into consideration by it. These gases are defined in terms of three gas ratios, which are translated into three percentage ratios represented in triangular coordinates. Despite the notable limitation of its inability to detect multiple faults simultaneously, the proposed triangle technique was highly effective in the comprehensive detection of fault types, surpassing traditional approaches in its transparency, directness, reliability, and accuracy.
In their study, [16] presented a numerical method based on MATLAB 2024b that expanded the Duval Triangle diagnostic graph for transformer failure diagnosis. This method makes it easier to discover electrical and thermal faults in transformers on a more user-friendly platform. However, the approach is very MATLAB-reliant and has a greater focus on thermal faults, which restricts its applicability. Traditional DGA methods often need manual operation, specialized equipment, and professional interpretation, are slow and time-consuming, and may overlook low-energy faults or early-stage issues. Without considering the percentage of components that may aid in determining the condition of the transformer and insulating oil, the studies primarily concentrated on the consistency of the DGA interpretations. Additionally, these studies do not consider how to make the DGA process simple to use and eliminate the need for personal expertise, which would make the engineering and maintenance staff’s jobs easier. Recently, research has investigated using Artificial Intelligence (AI) tools and combining them with DGA to increase overall effectiveness in an attempt to address the limitations noted above.
AI refers to the simulation of human intelligence in machines that are programmed to think, learn, and solve problems like a human [17]. AI methods often do not need human expertise to analyze the data since they can make decisions based on input from gas concentrations. Numerous writers have conducted studies to determine how to enhance the DGA processes by utilizing AI approaches such as fuzzy logic. The IEC 60599-2007 [18] standard serves as a foundational guide for interpreting DGA in diagnosing faults within oil-filled electrical equipment. To differentiate among various types of faults, such as partial discharges, electrical discharges, and thermal faults, it lists important gas ratios like CH4/H2 and C2H2/C2H4 and concentration levels. Through the definition of fuzzy logic membership functions based on the threshold of gas concentration, the standard helps to automate fault detection and decrease expert interpretation requirements. Because of this, it is especially useful in assisting diagnostic accuracy and guaranteeing early fault detection of the transformer. Similarly, the IEEE Std C57.104-2019 [6] is an essential tool to utilize when interpreting transformer oil DGA in order to identify such gas concentration limits that classify conditions of a transformer. It emphasizes the identification of key gases, such as H2, CH4, and C2H2, which indicate different fault conditions like overheating, arcing, or partial discharge. These concentration limits act as standards for fault severity, facilitating a systematic approach to diagnosing transformer issues. A study by [19] proposed a method that took into consideration the fault’s severity, and it is made up of five fuzzy logic (FL) models, like gas level FL, gas rate FL, gas level and rate FL, Duval Pentagon Method (DPM) FL, and fault severity FL. But the study only used five gases: H2, CH4, C2H6, C2H4, and C2H2, hence not tackling the fault severity of paper Insulation Breakdown, which is also as significant as other faults. In a study by [20], they enhanced transformer fault diagnosis by integrating Rogers’s ratio and IEC ratio DGA methods with fuzzy logic to address multiple and borderline faults. The fuzzy logic model, developed in MATLAB, interprets gas ratios using membership functions and rules for diagnosing faults like arcing, overheating, and partial discharge. While this approach improves diagnostic accuracy, the model’s effectiveness is constrained by the small sample size and imprecise membership functions. A study by [21] compared the results of different conventional and intelligent DGA methods and inspections. The techniques are compared based on consistency, precision, and detectability. Duval Pentagon method and Fuzzy Inference System (FIS) based on IEC 60599 [18] were found to be the best performance in the comparison, hence using a FIS based on Duval Pentagon could yield a new promising, useful, and effective method. In their study, Ref. [22] developed a Fuzzy Sugeno Inference System (FIS) with 1920 rules for interpreting DGA data to assess power transformer insulating oil quality. Their method took six input gases, such as hydrogen (H2) and methane (CH4), into consideration in order to compute Total Dissolved Combustible Gas (TDCG) levels, which categorize transformer oil conditions into Normal, Repair, Danger, or Fault. Limitations of the method are the computational effort required by the large rule base and the absence of carbon dioxide (CO2) and nitrogen (N2), which can limit the scope of the diagnosis, although it is 100% accurate when compared to actual DGA testing. Additional work must be performed to optimize rule sets, include other gases, and implement the method across a wider range of transformer types.
For one to improve DGA of power transformer fault diagnosis, the study of [23] suggests a multi-faceted solution using machine learning. The article suggests improving diagnosis accuracy and reliability through the fusion of traditional methods with Random Forest algorithms. Nevertheless, there is still room for overfitting, and its effectiveness largely depends on large datasets. Different research papers have proceeded to investigate fuzzy logic techniques with a view to increasing the reliability and accuracy of transformer insulation system diagnostics. Table 1 below compares fuzzy logic-based studies.
Several pieces of work in the literature have proven the potential of AI techniques, particularly fuzzy logic, in complementing DGA to identify transformer faults; yet, there exist gigantic areas for enhancement. The techniques proposed, such as fuzzy logic models and neuro-fuzzy hybrid systems, have proven capable of providing proper diagnoses and reducing reliance on human expertise. However, some of the drawbacks are that it is impossible to integrate critical fault parameters like paper insulation failure and the complexity of other models, making it difficult to implement them, and too time-consuming. The challenges suggest continued research to enhance AI-based DGA methods with features like process simplification, fault detection accuracy, and complete identification of all categories of faults. The need to perform further research in this area as a way of designing even more functional, effective solutions for detecting faults in transformers is also indicated by this.
Other various methods of Artificial Intelligence-based DGA techniques have been proposed over the years, as shown in Table 2 below. Similarly to fuzzy logic methods, their aim is to improve the effectiveness of DGA and prolong the transformer life.
Even though ANN, RNN, and CVA from the above studies have improved the accuracy and performance of DGA as compared to the traditional methods, fuzzy logic is still a better approach because of its interpretability, handling of uncertainty, simplicity, and adaptability. Fuzzy logic is a better option for real-time DGA-based transformer fault diagnosis because it can represent expert knowledge in an understandable and operationally efficient manner. This is also stated by [39] as they used both fuzzy logic and ANN together. This is very important because the goal is to make sure that human operators trust and understand the decision-making process. Fuzzy logic, being a better approach, can also be justified by Table 3 below, which describes the strengths and limitations of various AI-based techniques that are covered in this literature review.

4.1. DGA Traditional Methods

(a) 
Key Gas Method
It is attributed to the quantity of fault gases produced by the insulating oil as the chemical structure breaks down at various temperatures within the transformer [40]. Every type of fault will give a characteristic set of gases; hence, this method is a sound way of identifying the type of fault.
(b) 
Dornenburg’s Ratio Method
This technique used four different gas ratios, such as CH4/H2, C2H2/C2H4, C2H6/C2H2, and C2H2/CH4. It detects various fault types, including partial discharge, arcing, and thermal faults, using these gas ratio ranges [41]. Table 4 below gives the Dornenburg’s ratio ranges and their related faults.
(c)  
Roger’s Ratio Method
Similarly to Dornenburg’s ratio, this method also identifies the faults by using the ranges of gas ratios in the insulation oil, but it utilizes only the following gas ratios: CH4/H2, C2H2/C2H4, C2H4/C2H6, and C2H6/CH4 [42].
(d)  
IEC Ration Method
This method also uses three ratios, CH4/H2, C2H2/C2H4, and C2H4/C2H6, which can be used to diagnose faults like thermal faults ranging from 300 °C to 700 °C [43]. Table 5 below shows the different fault types and their related ratio ranges.
(e) 
Duval Triangle
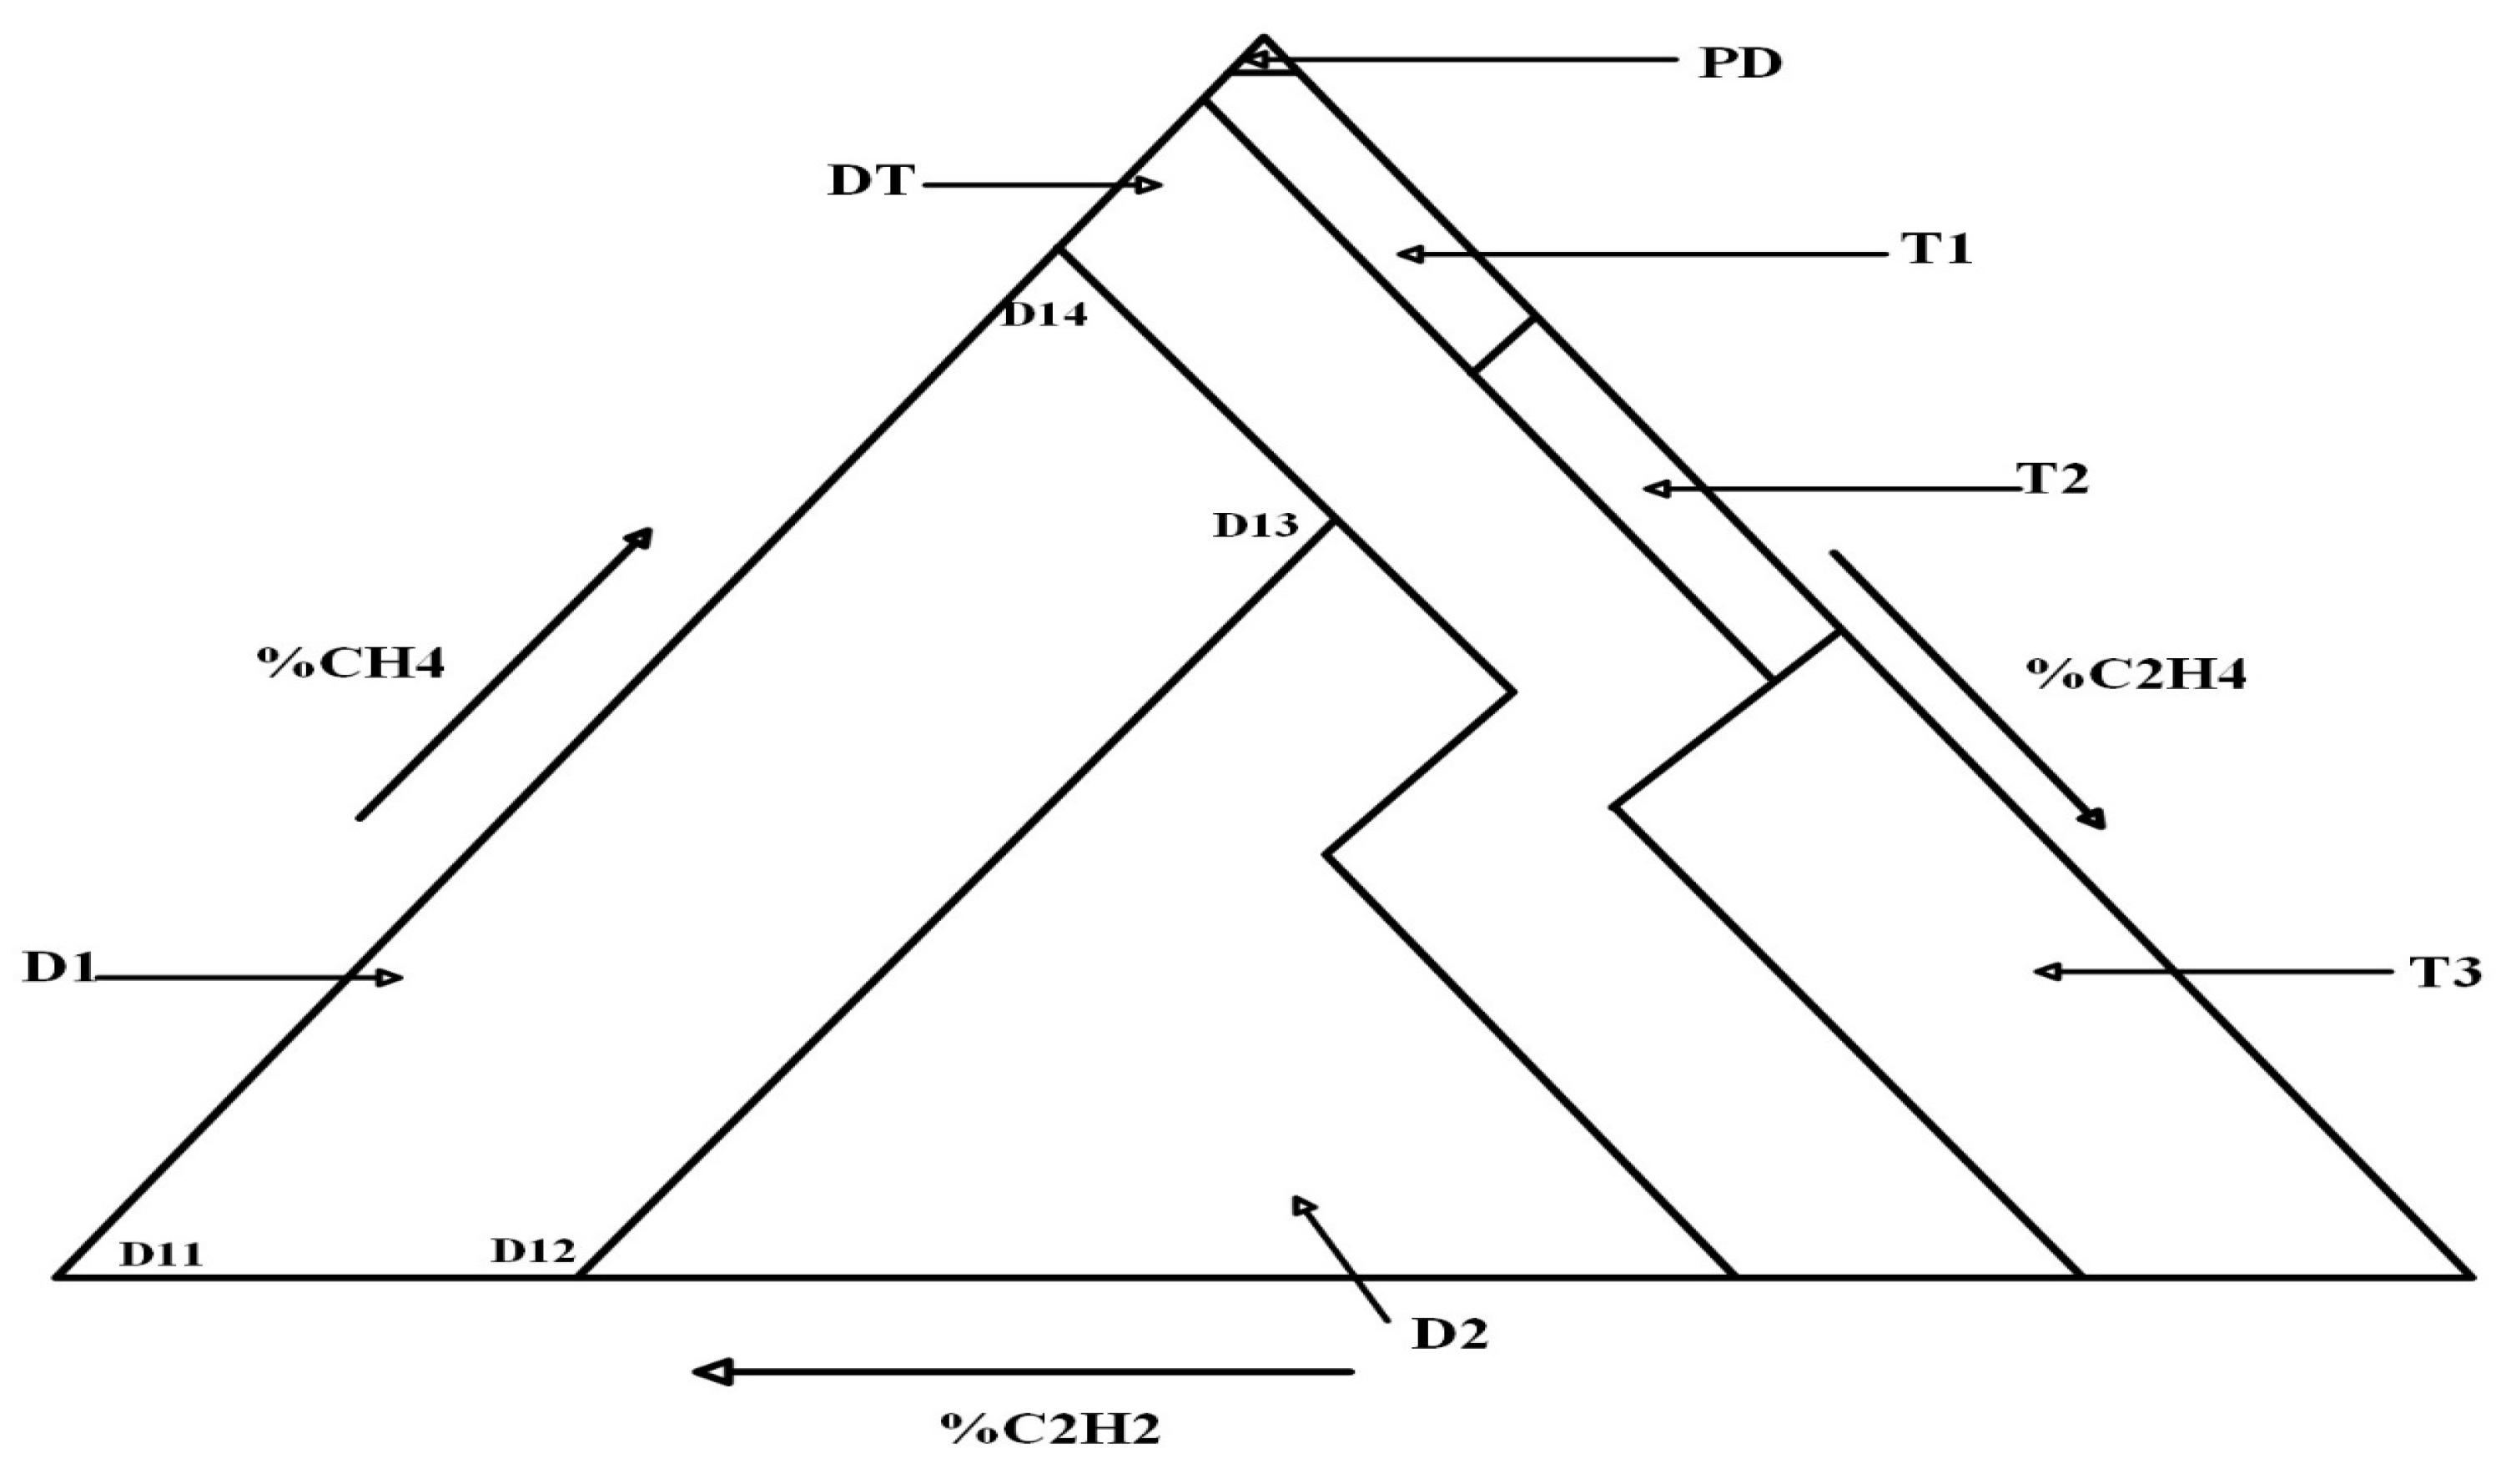
The concentrations of CH4, C2H4, and C2H2 varied between ppms as a percentage of the sum (CH4 + C2H4 + C2H2) of a point (%CH4, %C2H4, %C2H2) on a triangular graph that has been divided into fault zones [44]. The location of the plotted point within the Duval Triangle determines the most probable fault type associated with that specific gas concentration combination. The Duval Triangle categorizes faults into three main types: thermal faults with various temperature ranges, electrical discharges, both low- and high-energy, and partial discharges. These three kinds of faults are subdivided into seven zones, as illustrated by Figure 1 below [45].
(f)  
Duval Pentagon
In this method, all five fault gases are listed [45]. The levels of the five gases are then displayed in the pentagon plot. The arrangement of these gases at the five meetings of Pentagon 1 corresponds to the increasing energy or temperature of the fault producing these gases [45].
Compared to each other, the traditional DGA methods may have some abilities and weaknesses in terms of fault determination output. Table 6 below provides a comparative analysis of traditional DGA methods based on IEC/IEEE standards [18], highlighting their strengths and weaknesses in diagnosing transformer faults. While these methods have been widely adopted for a long time due to their simplicity and ease of implementation, they often face challenges in accurately detecting complex fault conditions, such as low-energy discharges or partial discharge faults. So, due to various weaknesses when using traditional DGA methods, there is a need to use multiple methods simultaneously for them to make up for one another’s disadvantages, then analyze and decide based on the cumulative results. This process is going to be time-consuming and needs experienced personnel for the decision-making, hence not making the interpretation any easier.
The comparison showcases the basic trade-offs between accuracy, detection capability, and consistency across various fault types, underscoring the need for improvements or integration with more advanced AI techniques like fuzzy logic systems.

4.2. Fuzzy Logic Implementation

Fuzzy logic is a way of relating naturally analog processes to a continuous range of values, to a computer that would prefer things to be crisply defined, discrete numeric values. The output of a fuzzy logic system is derived from the fuzzifications of the inputs and outputs using the appropriate membership functions [46].
The core processes involved in a fuzzy logic control system:
(a) 
Fuzzification: It is the process of converting classical or crisp data into fuzzy data that can be processed by a fuzzy logic system [46]. This is performed using membership functions (MFs), which are mathematical functions that map each crisp input value to a degree of membership in a fuzzy set.
(b) 
Fuzzy inference process (FIS): This is where the actual decision-making occurs in a fuzzy logic system. This process combines fuzzified inputs with a set of fuzzy rules to derive fuzzy outputs. Fuzzy rules are represented by a sequence of the form IF-THEN, leading to algorithms describing what action or output should be taken in terms of the currently observed inputs and outputs [46].
(c) 
Defuzzification: This is where the fuzzy output from the inference step is converted into a crisp value, which can be utilized to operate real-world devices or make decisions [46]. Three of the defuzzification methods most commonly utilized are the mean of maximum method, the center of gravity method, and the height method.

5. Methodology

This section discusses the step-by-step procedure for building an integrated fuzzy logic system to detect transformer faults. It involves the modeling of single DGA techniques: Key Gas Method, Roger’s Ratio, IEC ratio, and Duval Triangle as FISs. These FISs, built with specific membership functions and rule bases, are then integrated into an upper-level integrated system. The aim is to utilize their respective strengths toward a more accurate and interpretable ultimate diagnosis. The succeeding sections will introduce the implementation of each DGA methodology in fuzzy logic and the proposed integrated system.

5.1. Key Gas Method

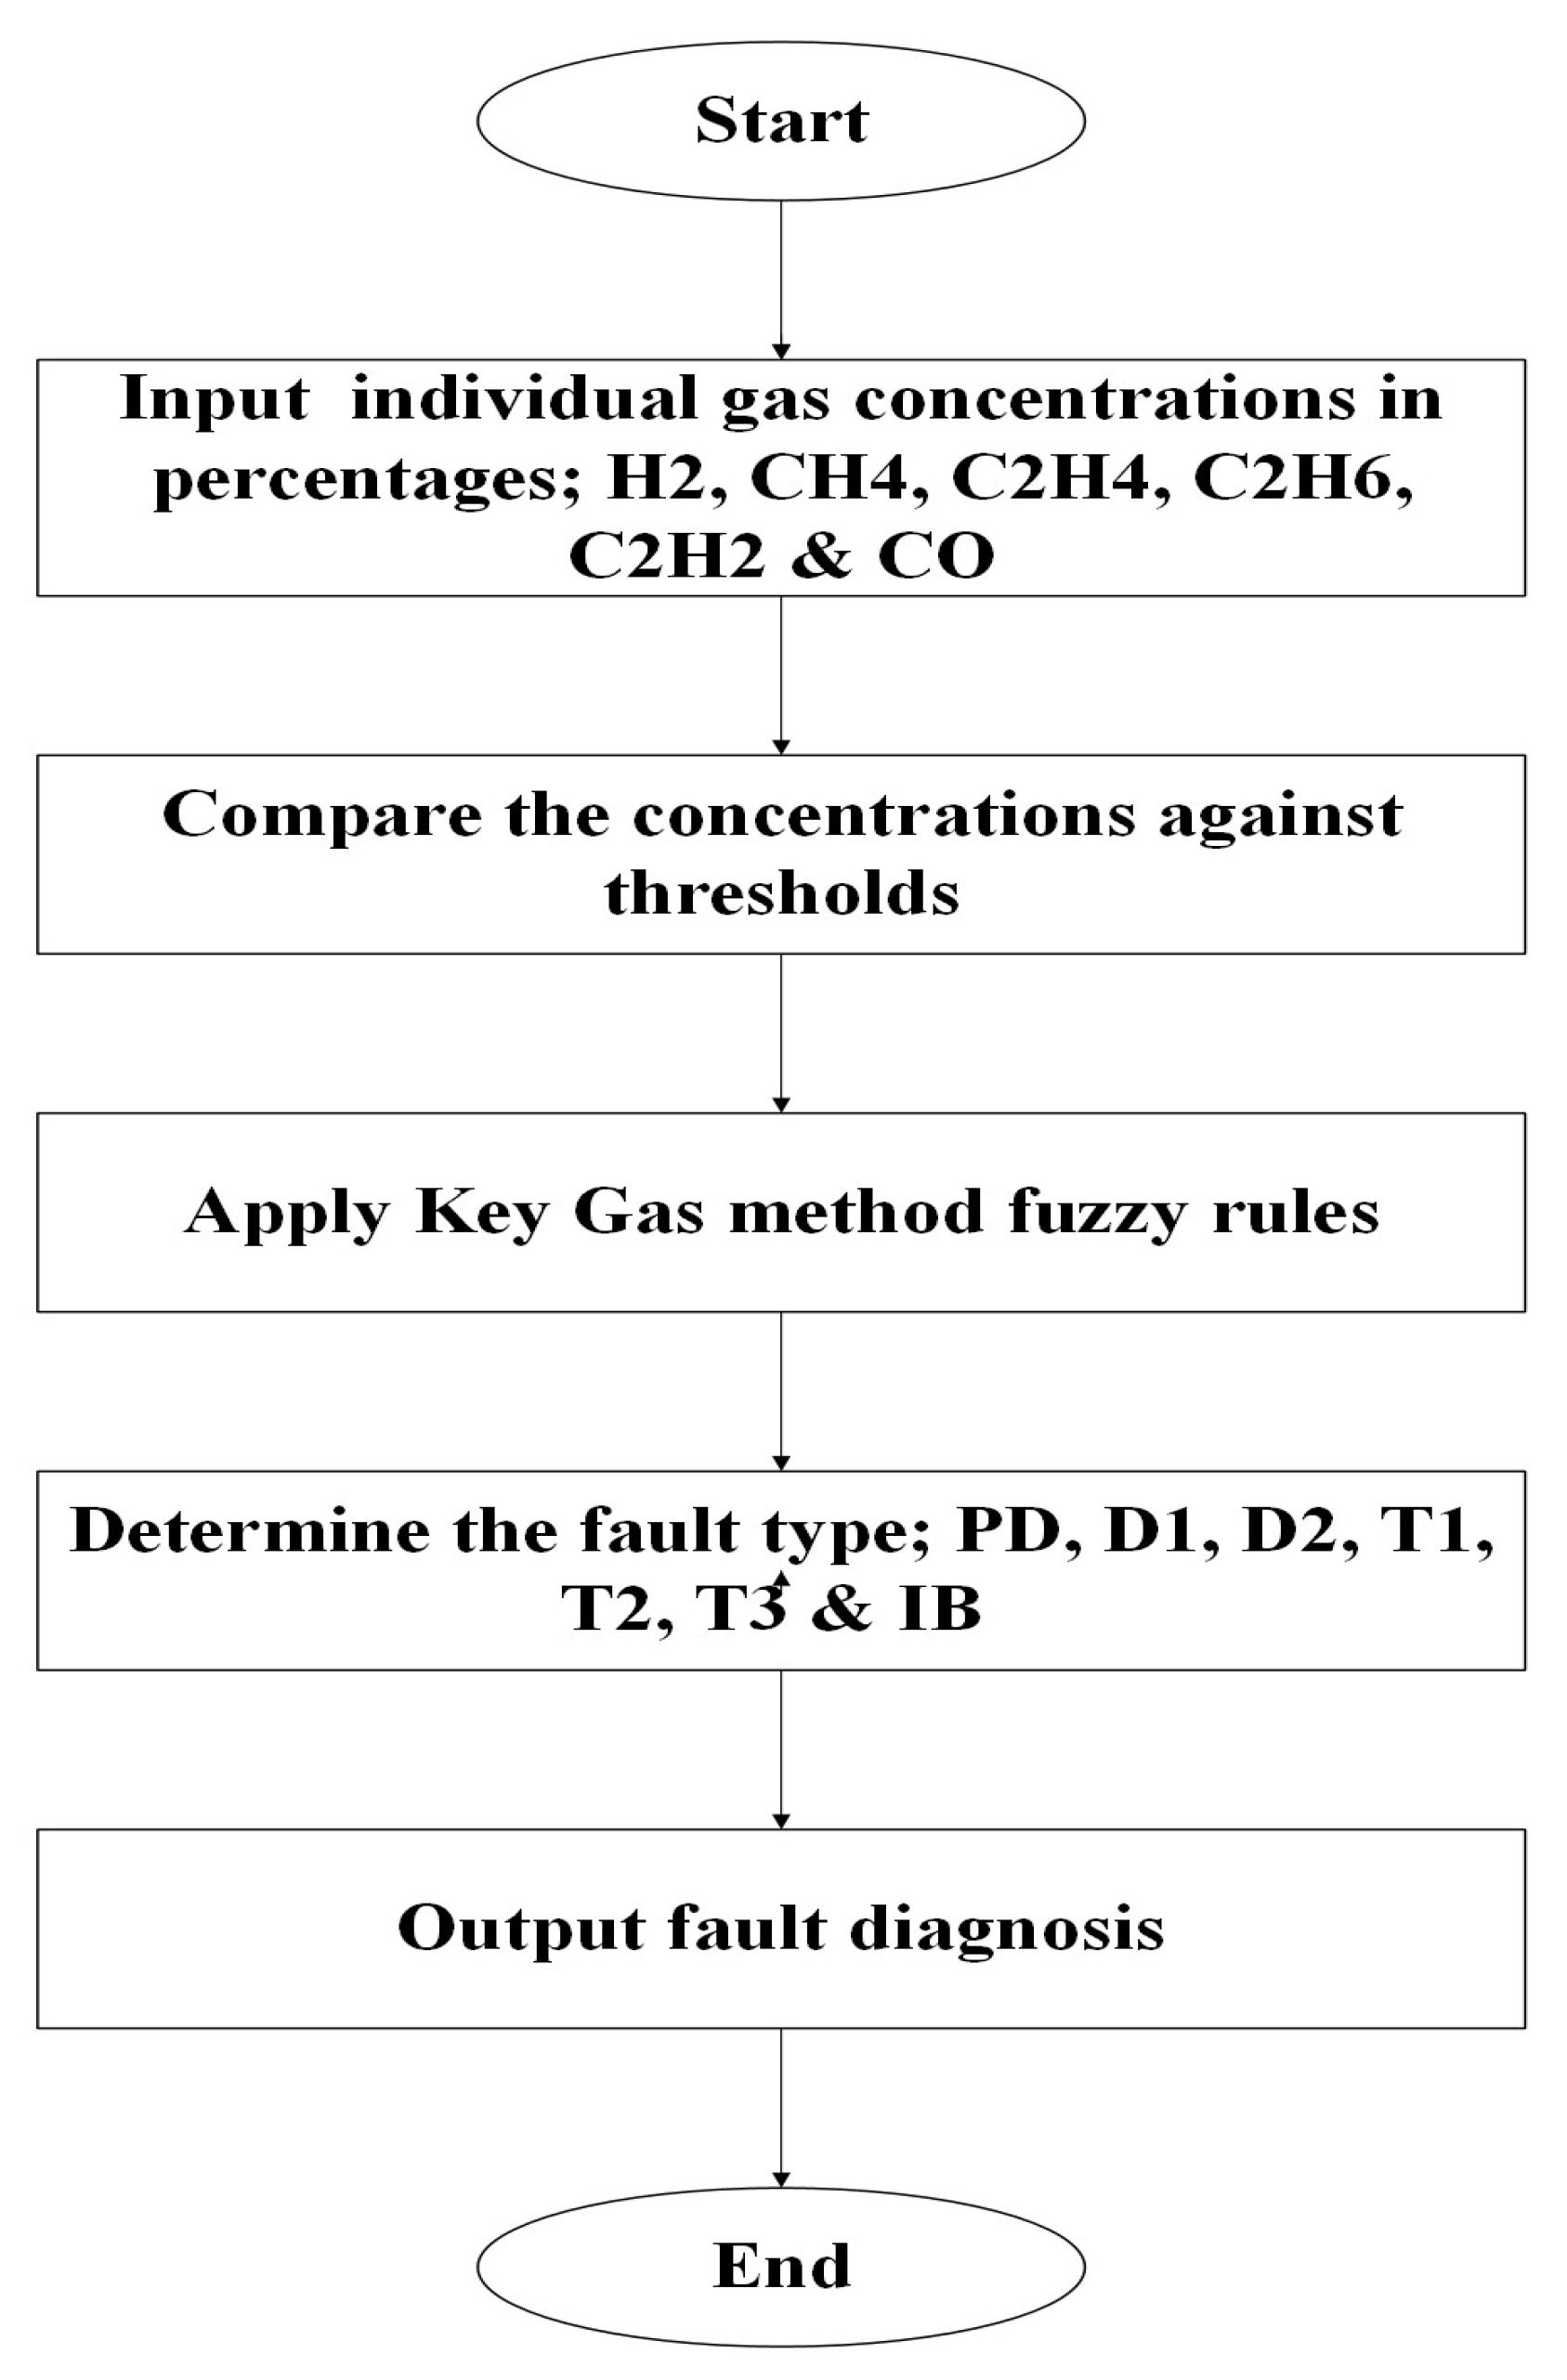
It primarily utilizes the quantity of fault gases released in the insulation oil during degradation [40]. Key gases for faults like thermal issues (C2H4), cellulose breakdown (CO), partial discharge (H2), and arcing (H2, C2H2) are identified. Their concentrations are fuzzified using membership functions. Table 7 below shows the key gases for specific fault types and their typical proportions generated during combustion. A rule base, derived from guidelines in Table 7 and the process in Figure 2, maps gas concentrations to fault classifications.
To map the logic of the Key Gas Method directly into its fuzzy counterpart, the gases and their respective indicative fault types need to be comprehended. Table 7 is a summary of the major gases for various transformer fault conditions. The table serves as the foundation of the fuzzy rule generation that maps gas concentrations into fault types based on expert knowledge and standard DGA interpretation.
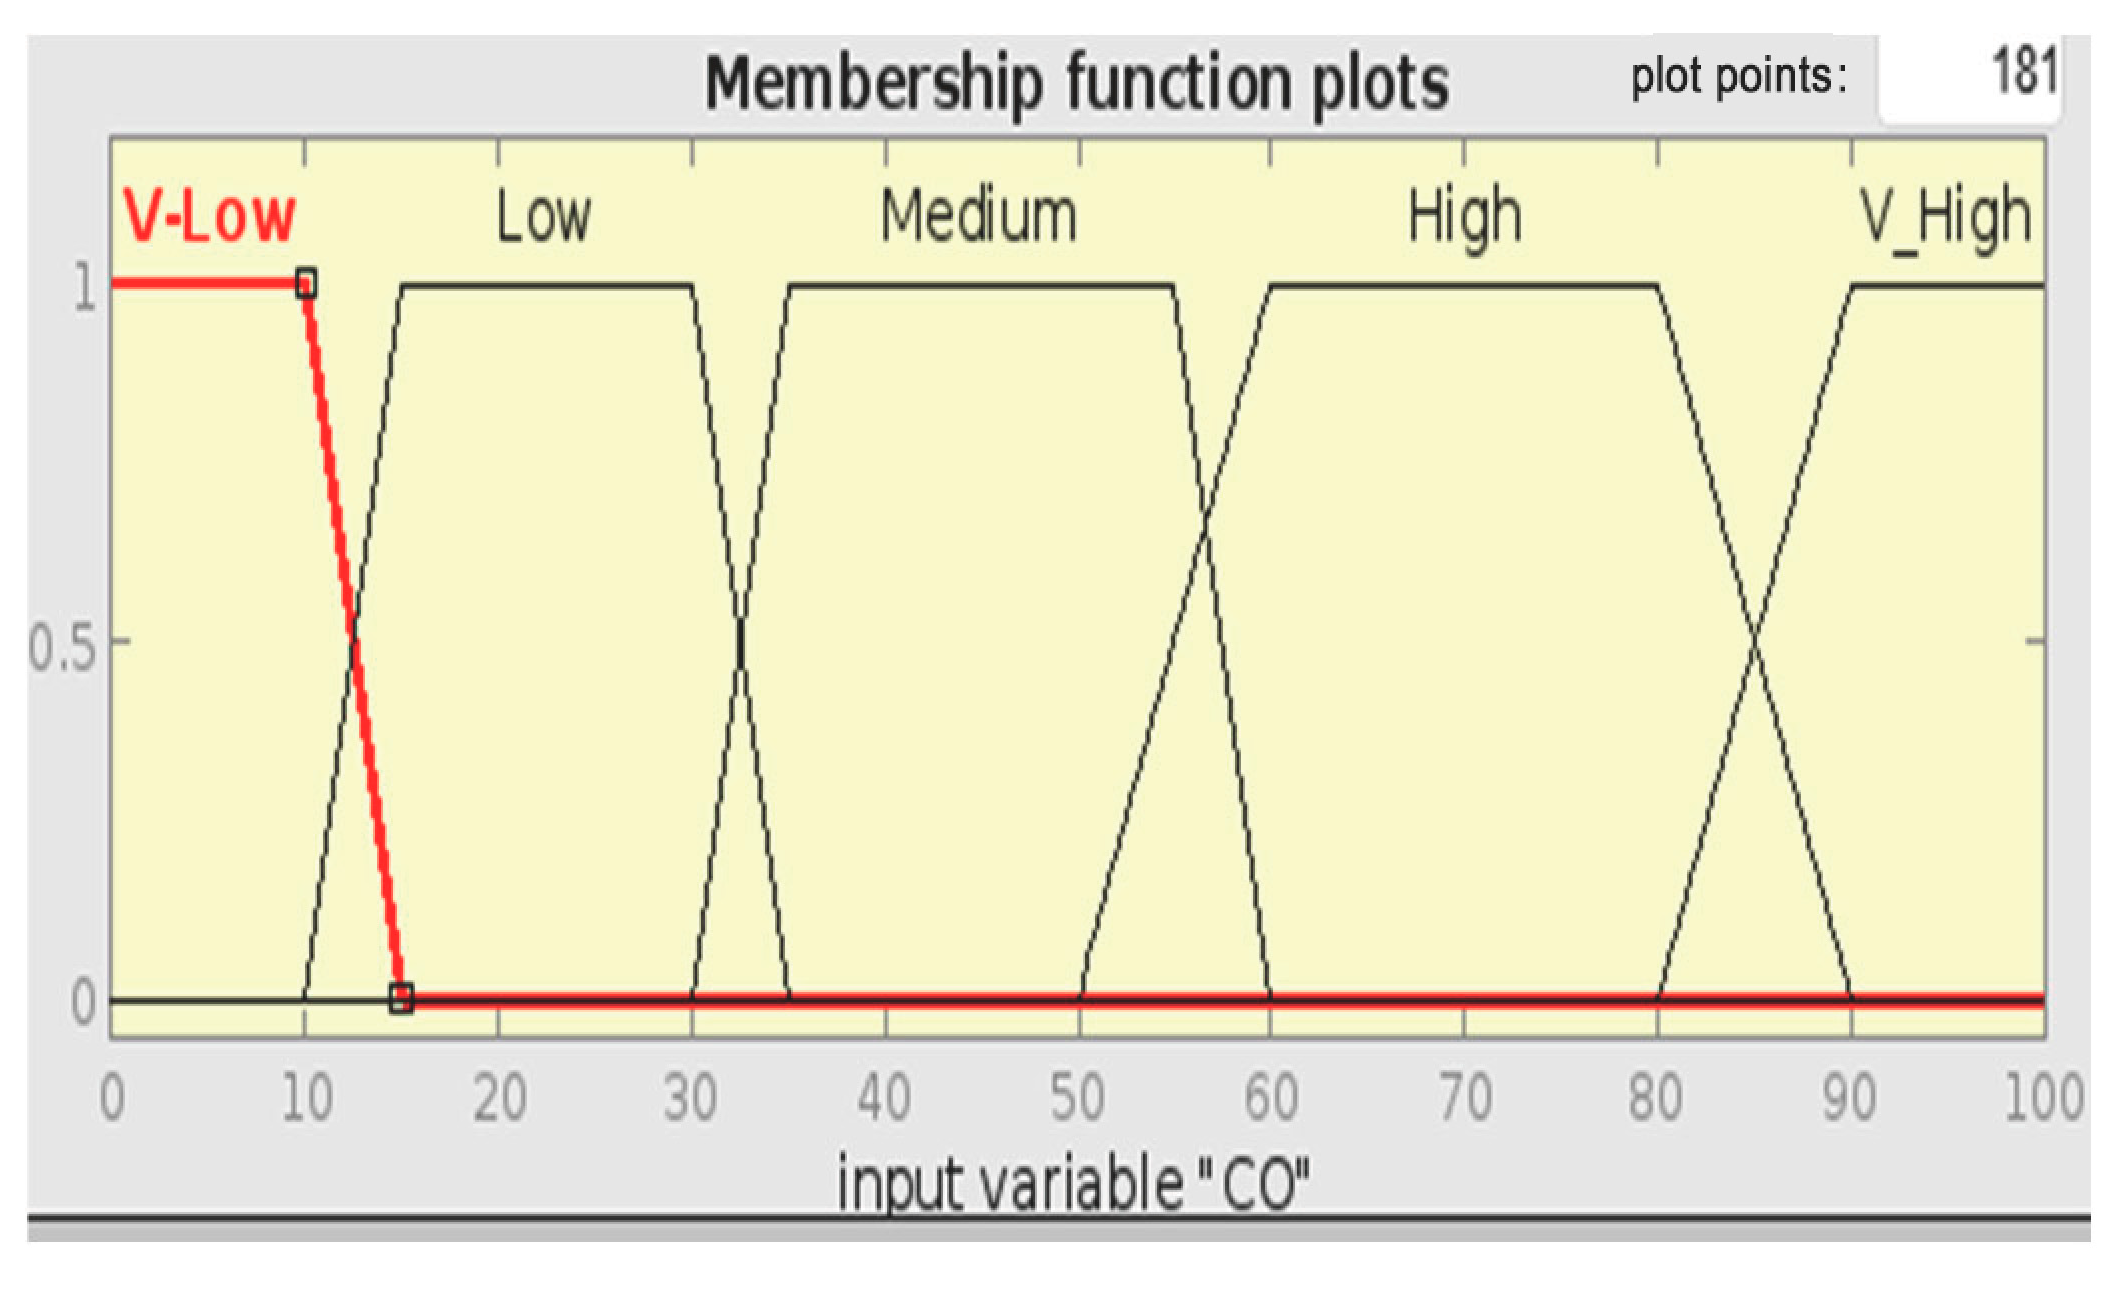
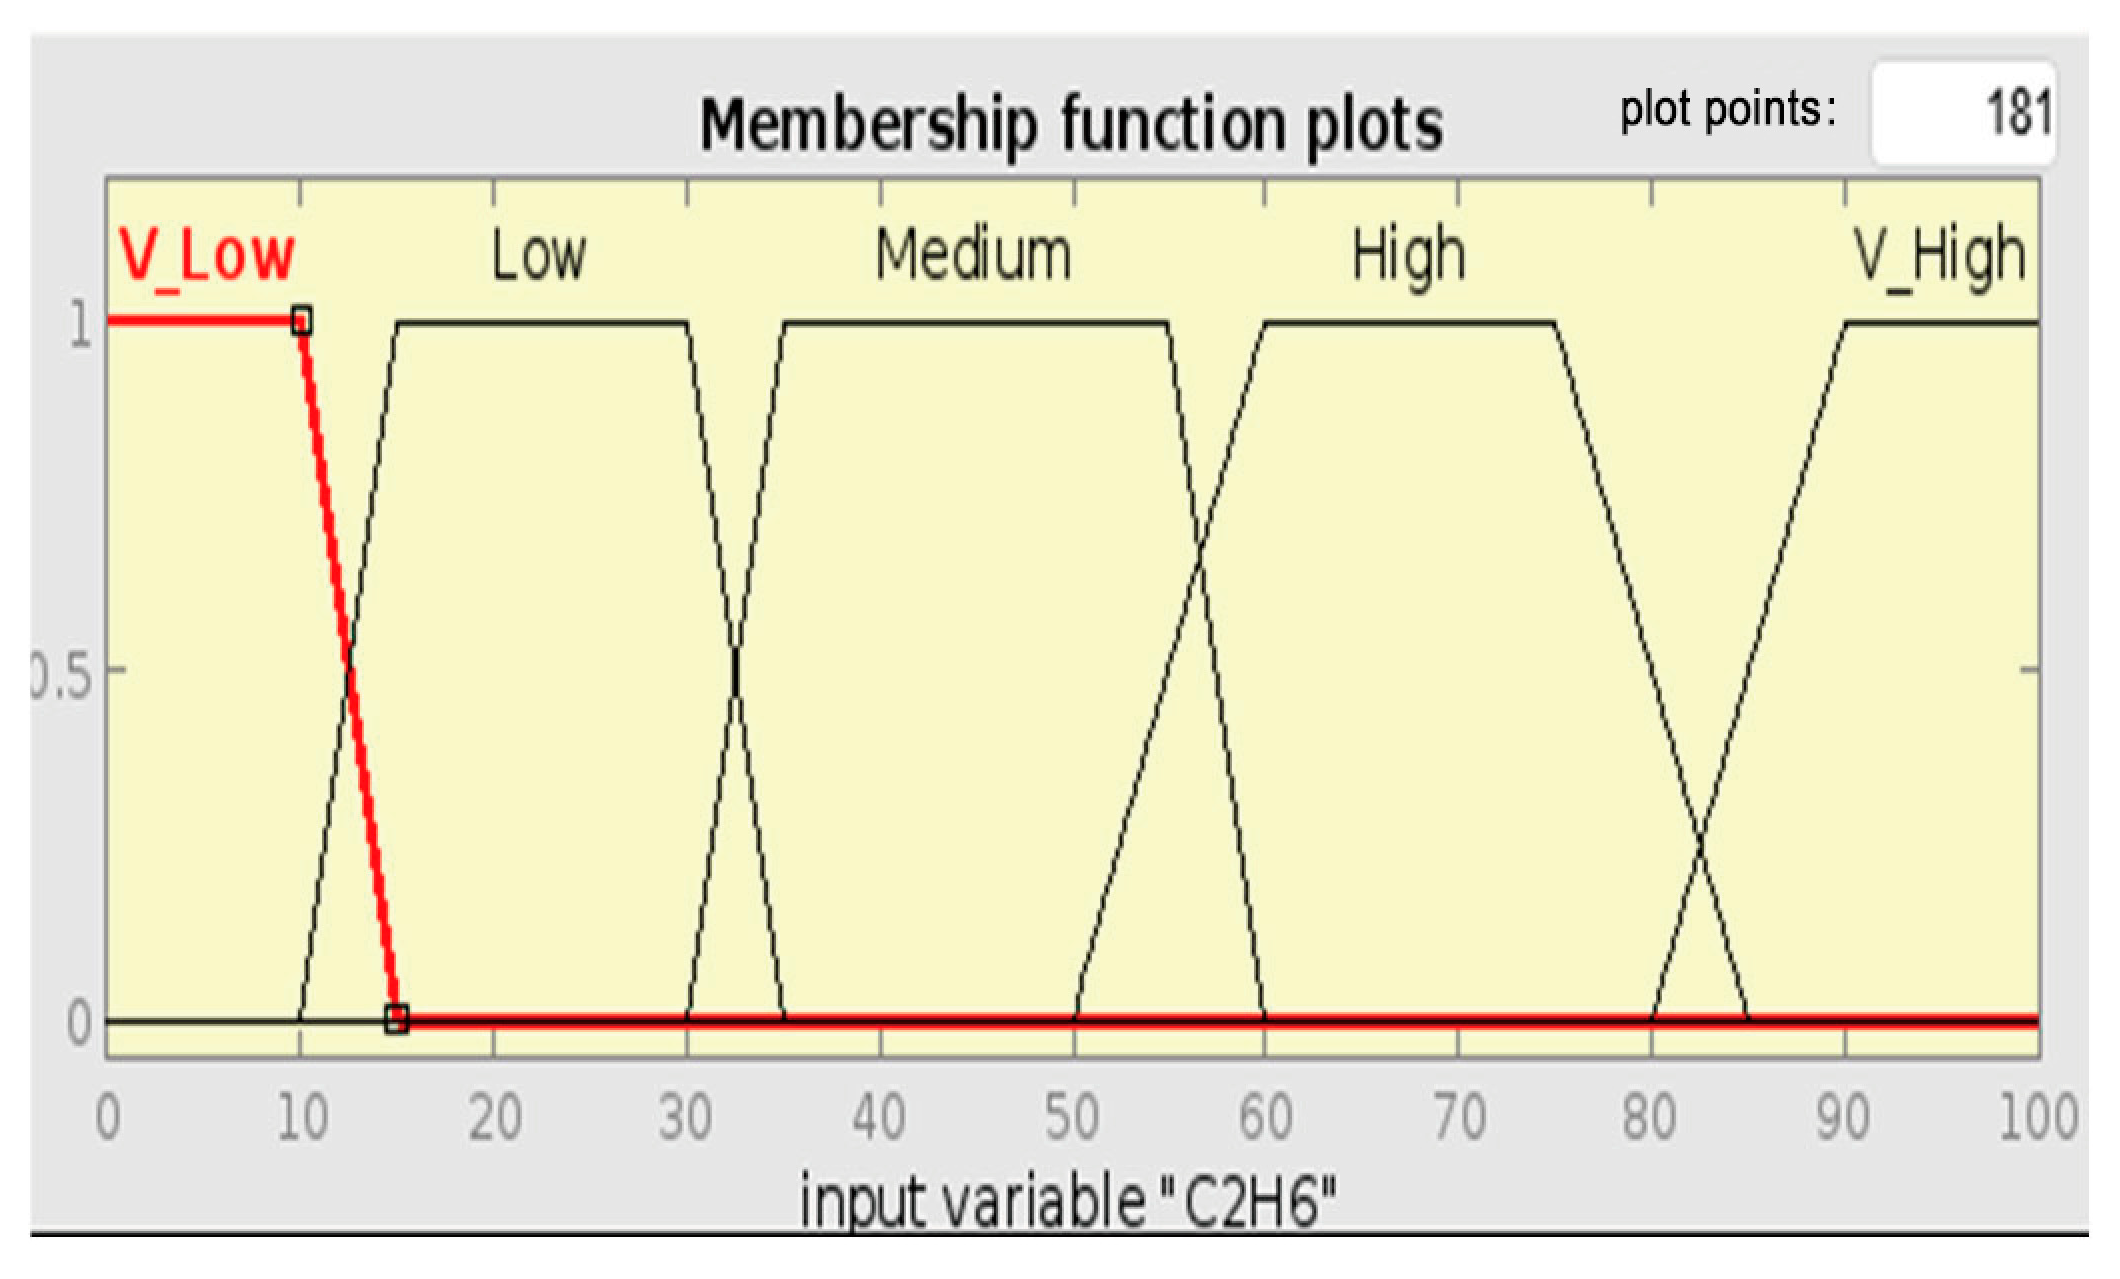
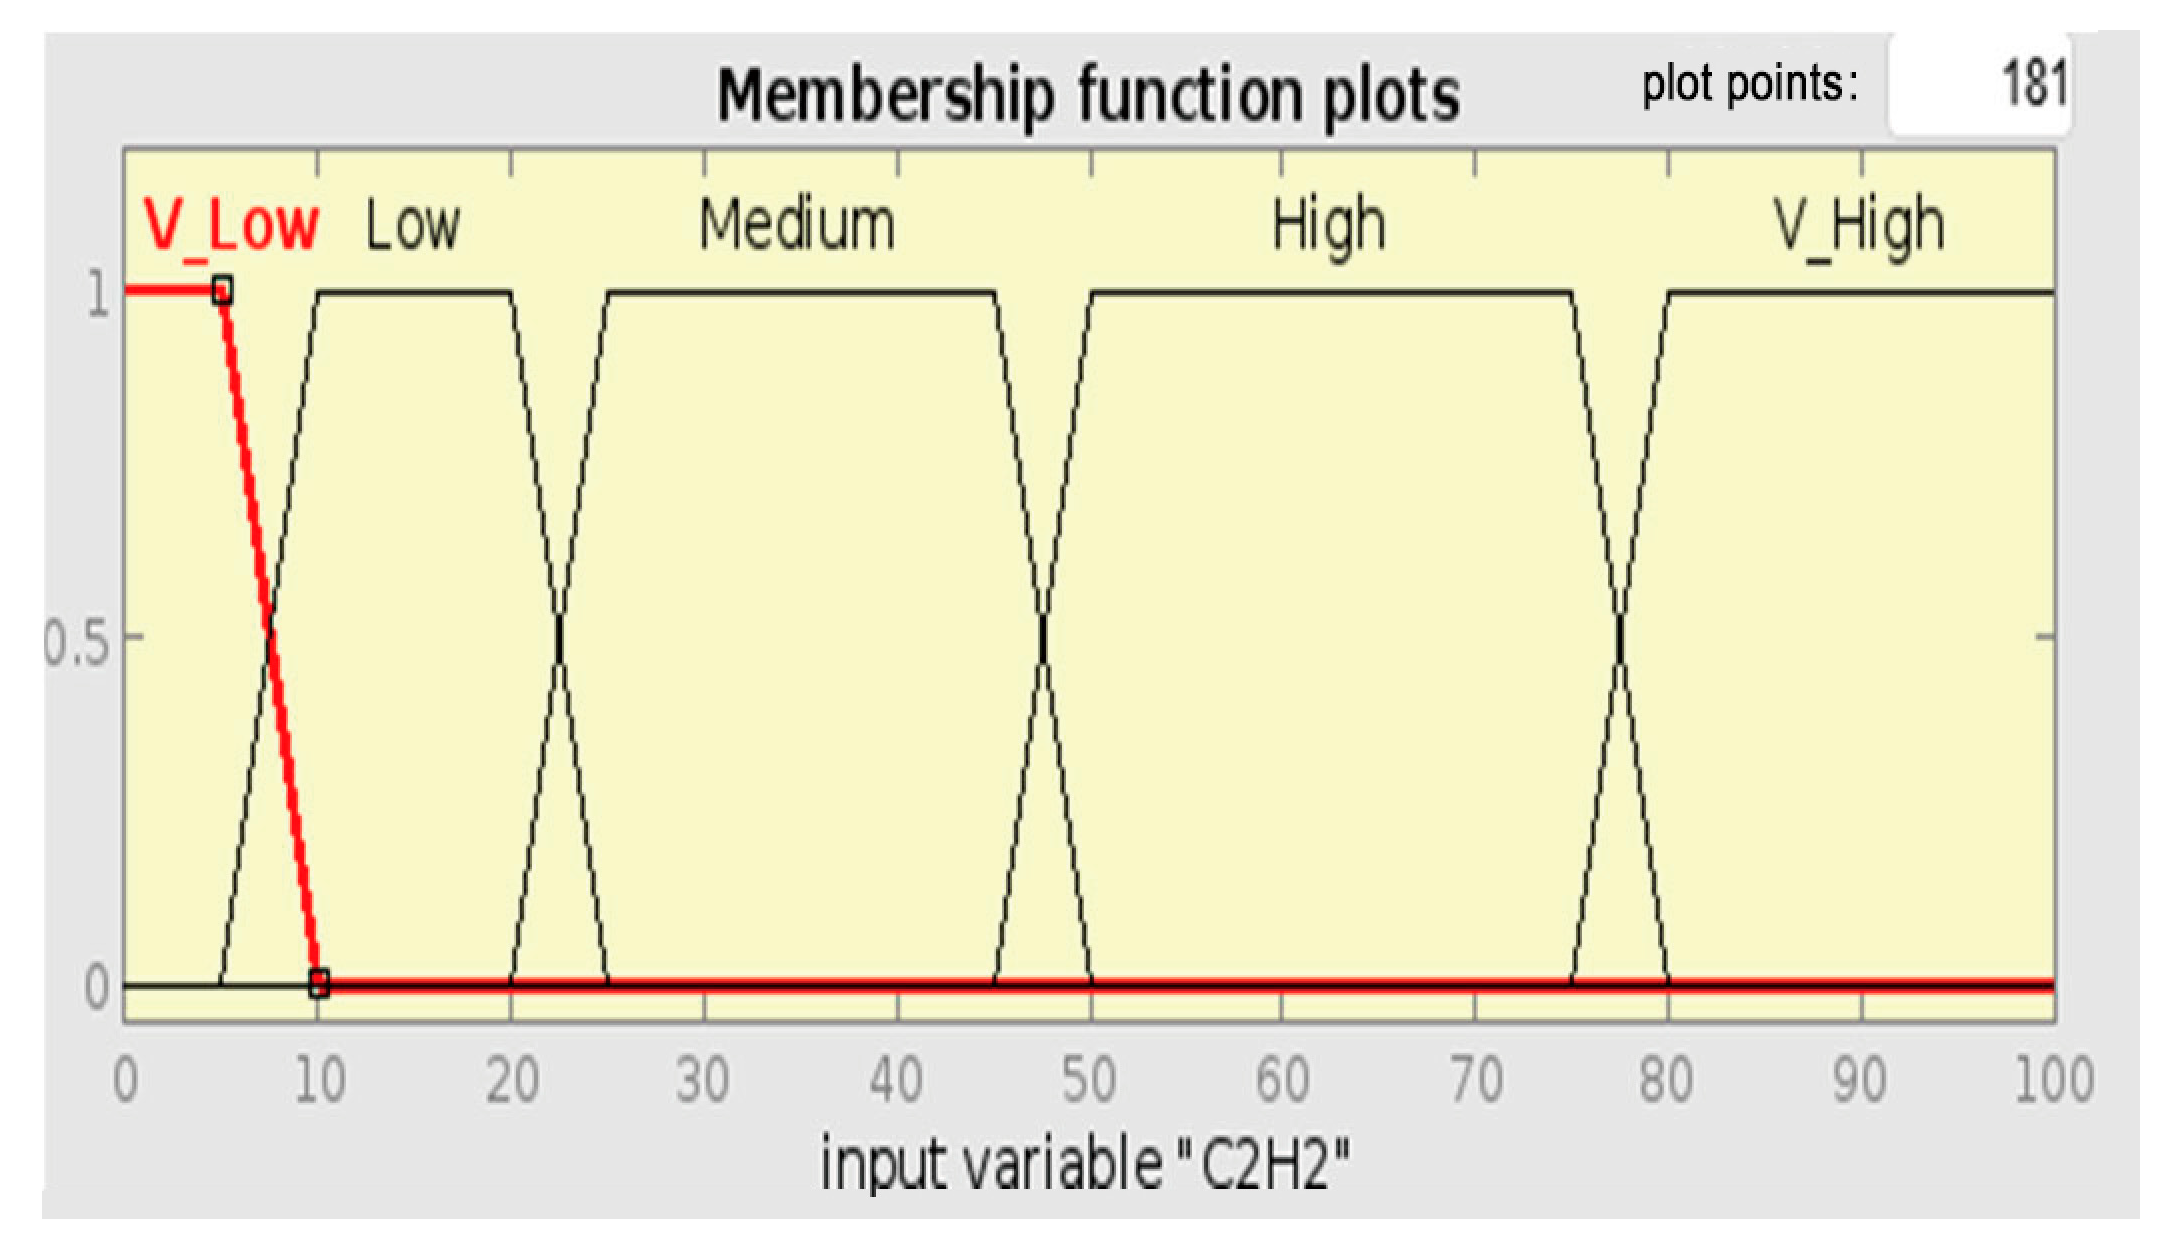
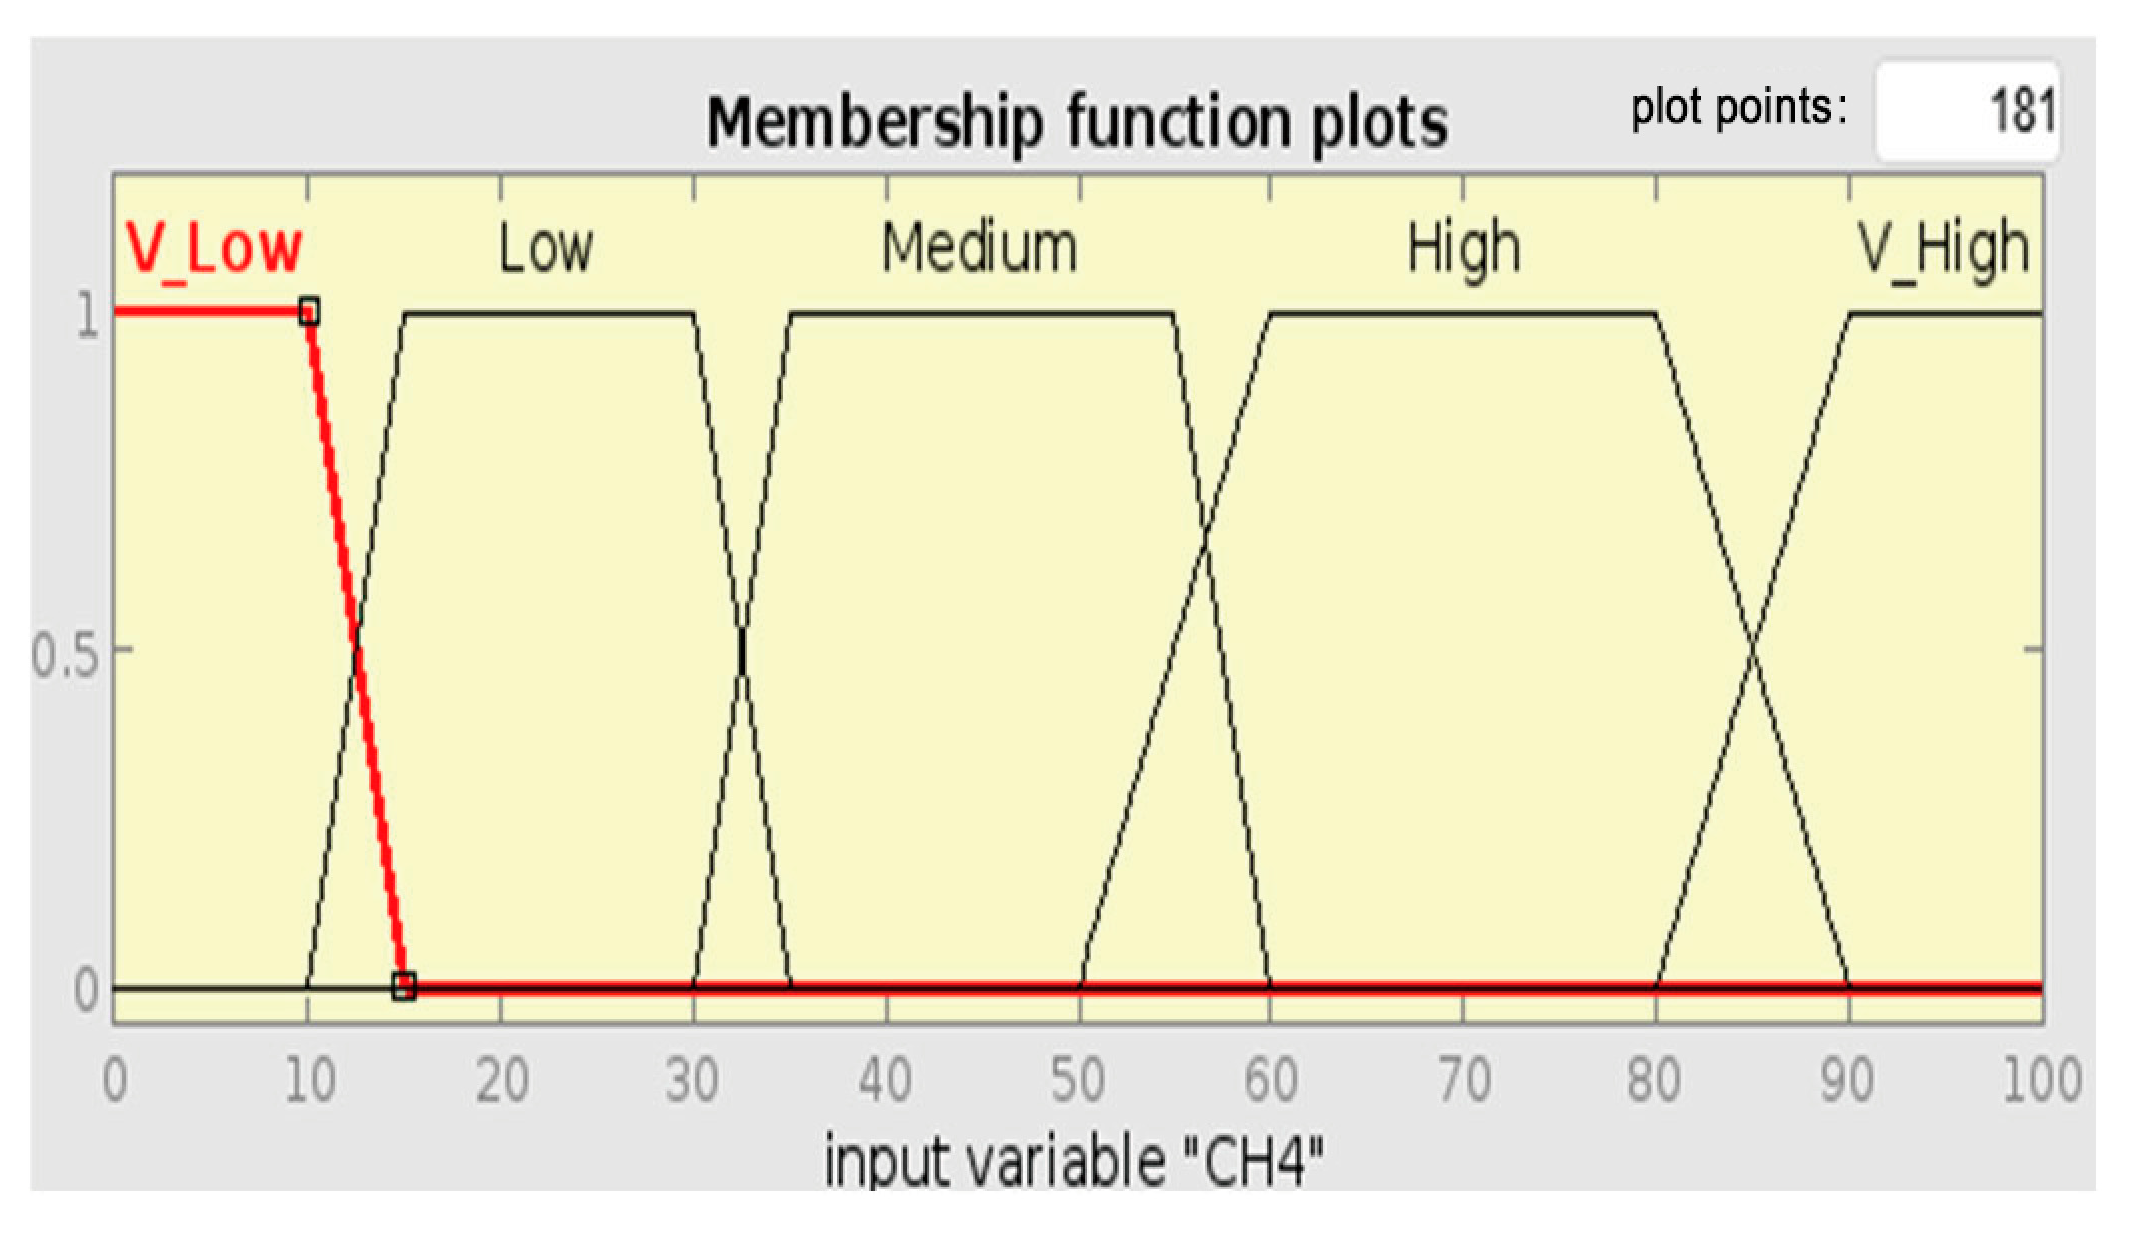
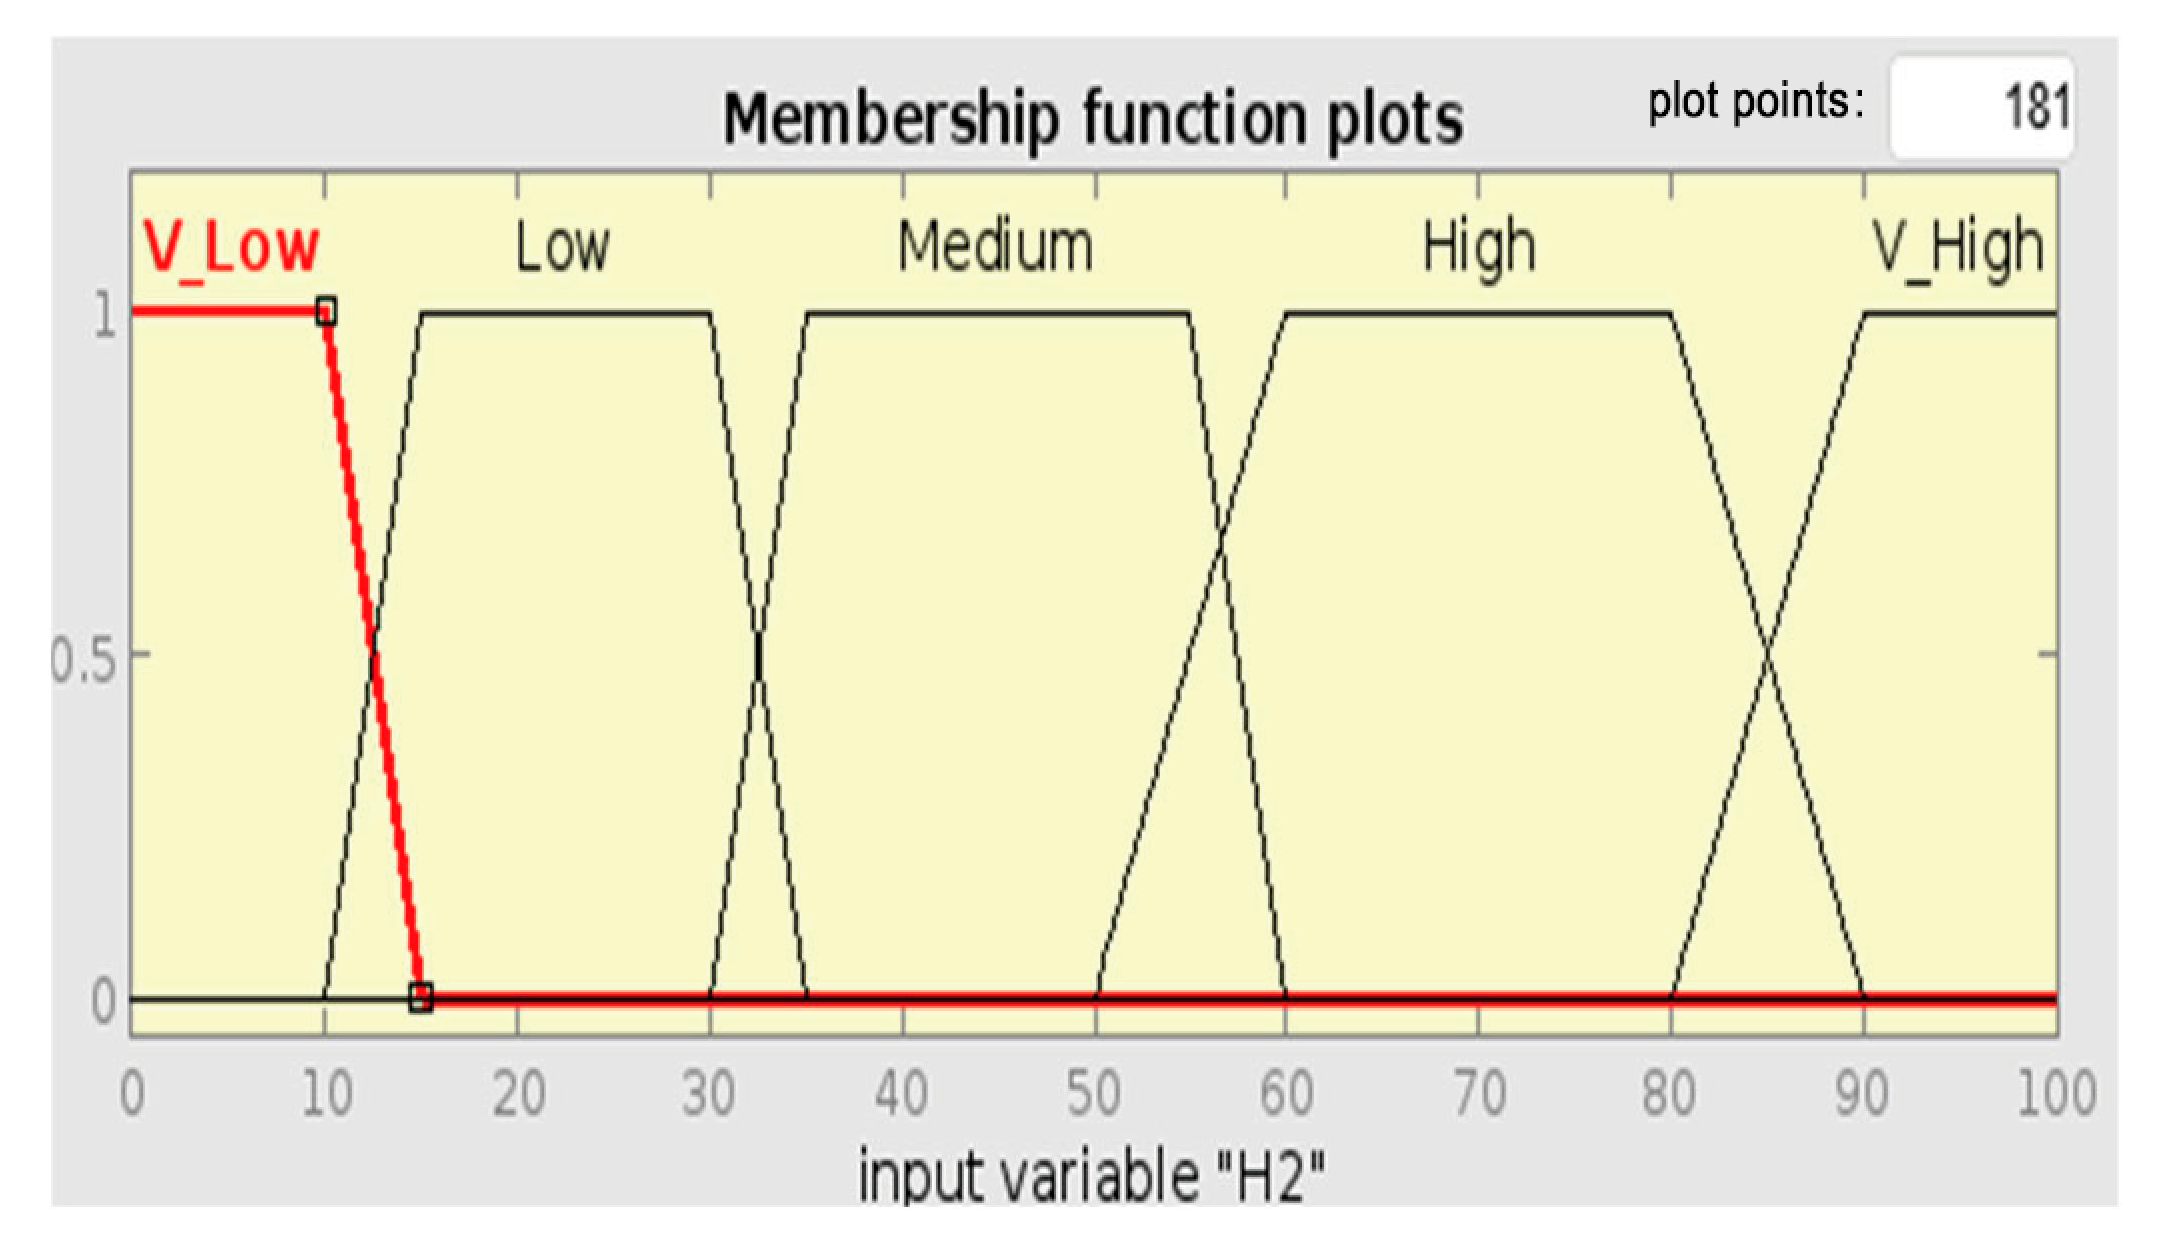
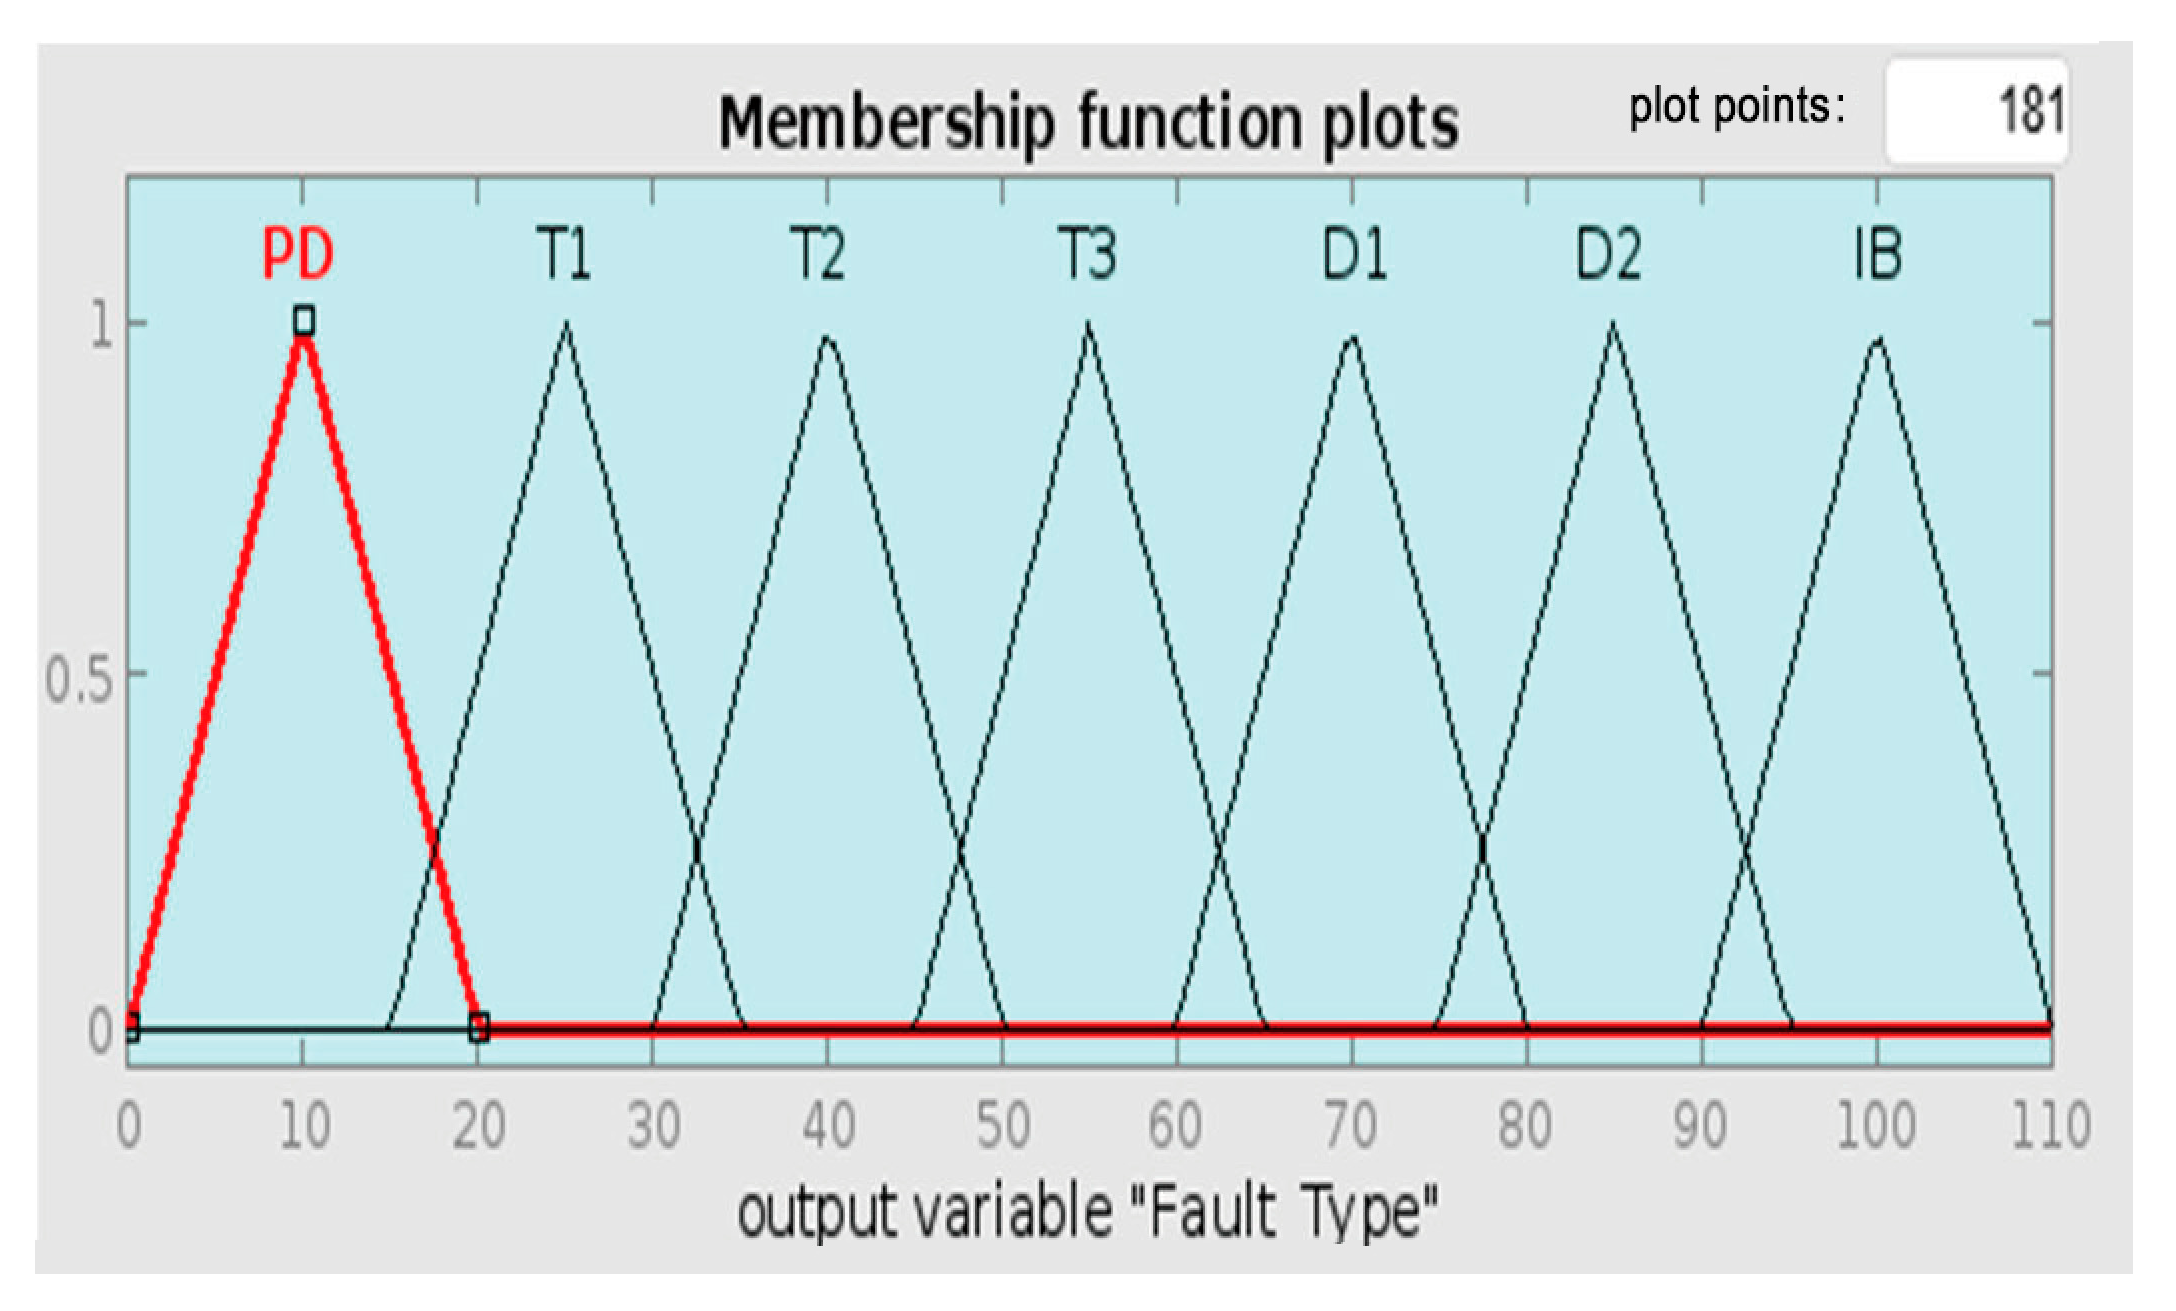
In order to enable the analysis of the gas composition and aid in fault identification, the quantities of the gases are quantified as percentage values and are used to categorize the fault based on the dominant gases in the sample. MFs of the input gases of the Key Gas Method fuzzy system are thus percentages. MFs for the input gases are shown in Figure 3, Figure 4, Figure 5, Figure 6, Figure 7 and Figure 8, while MFs for output fault types are shown in Figure 9.

5.2. Roger’s Ratio

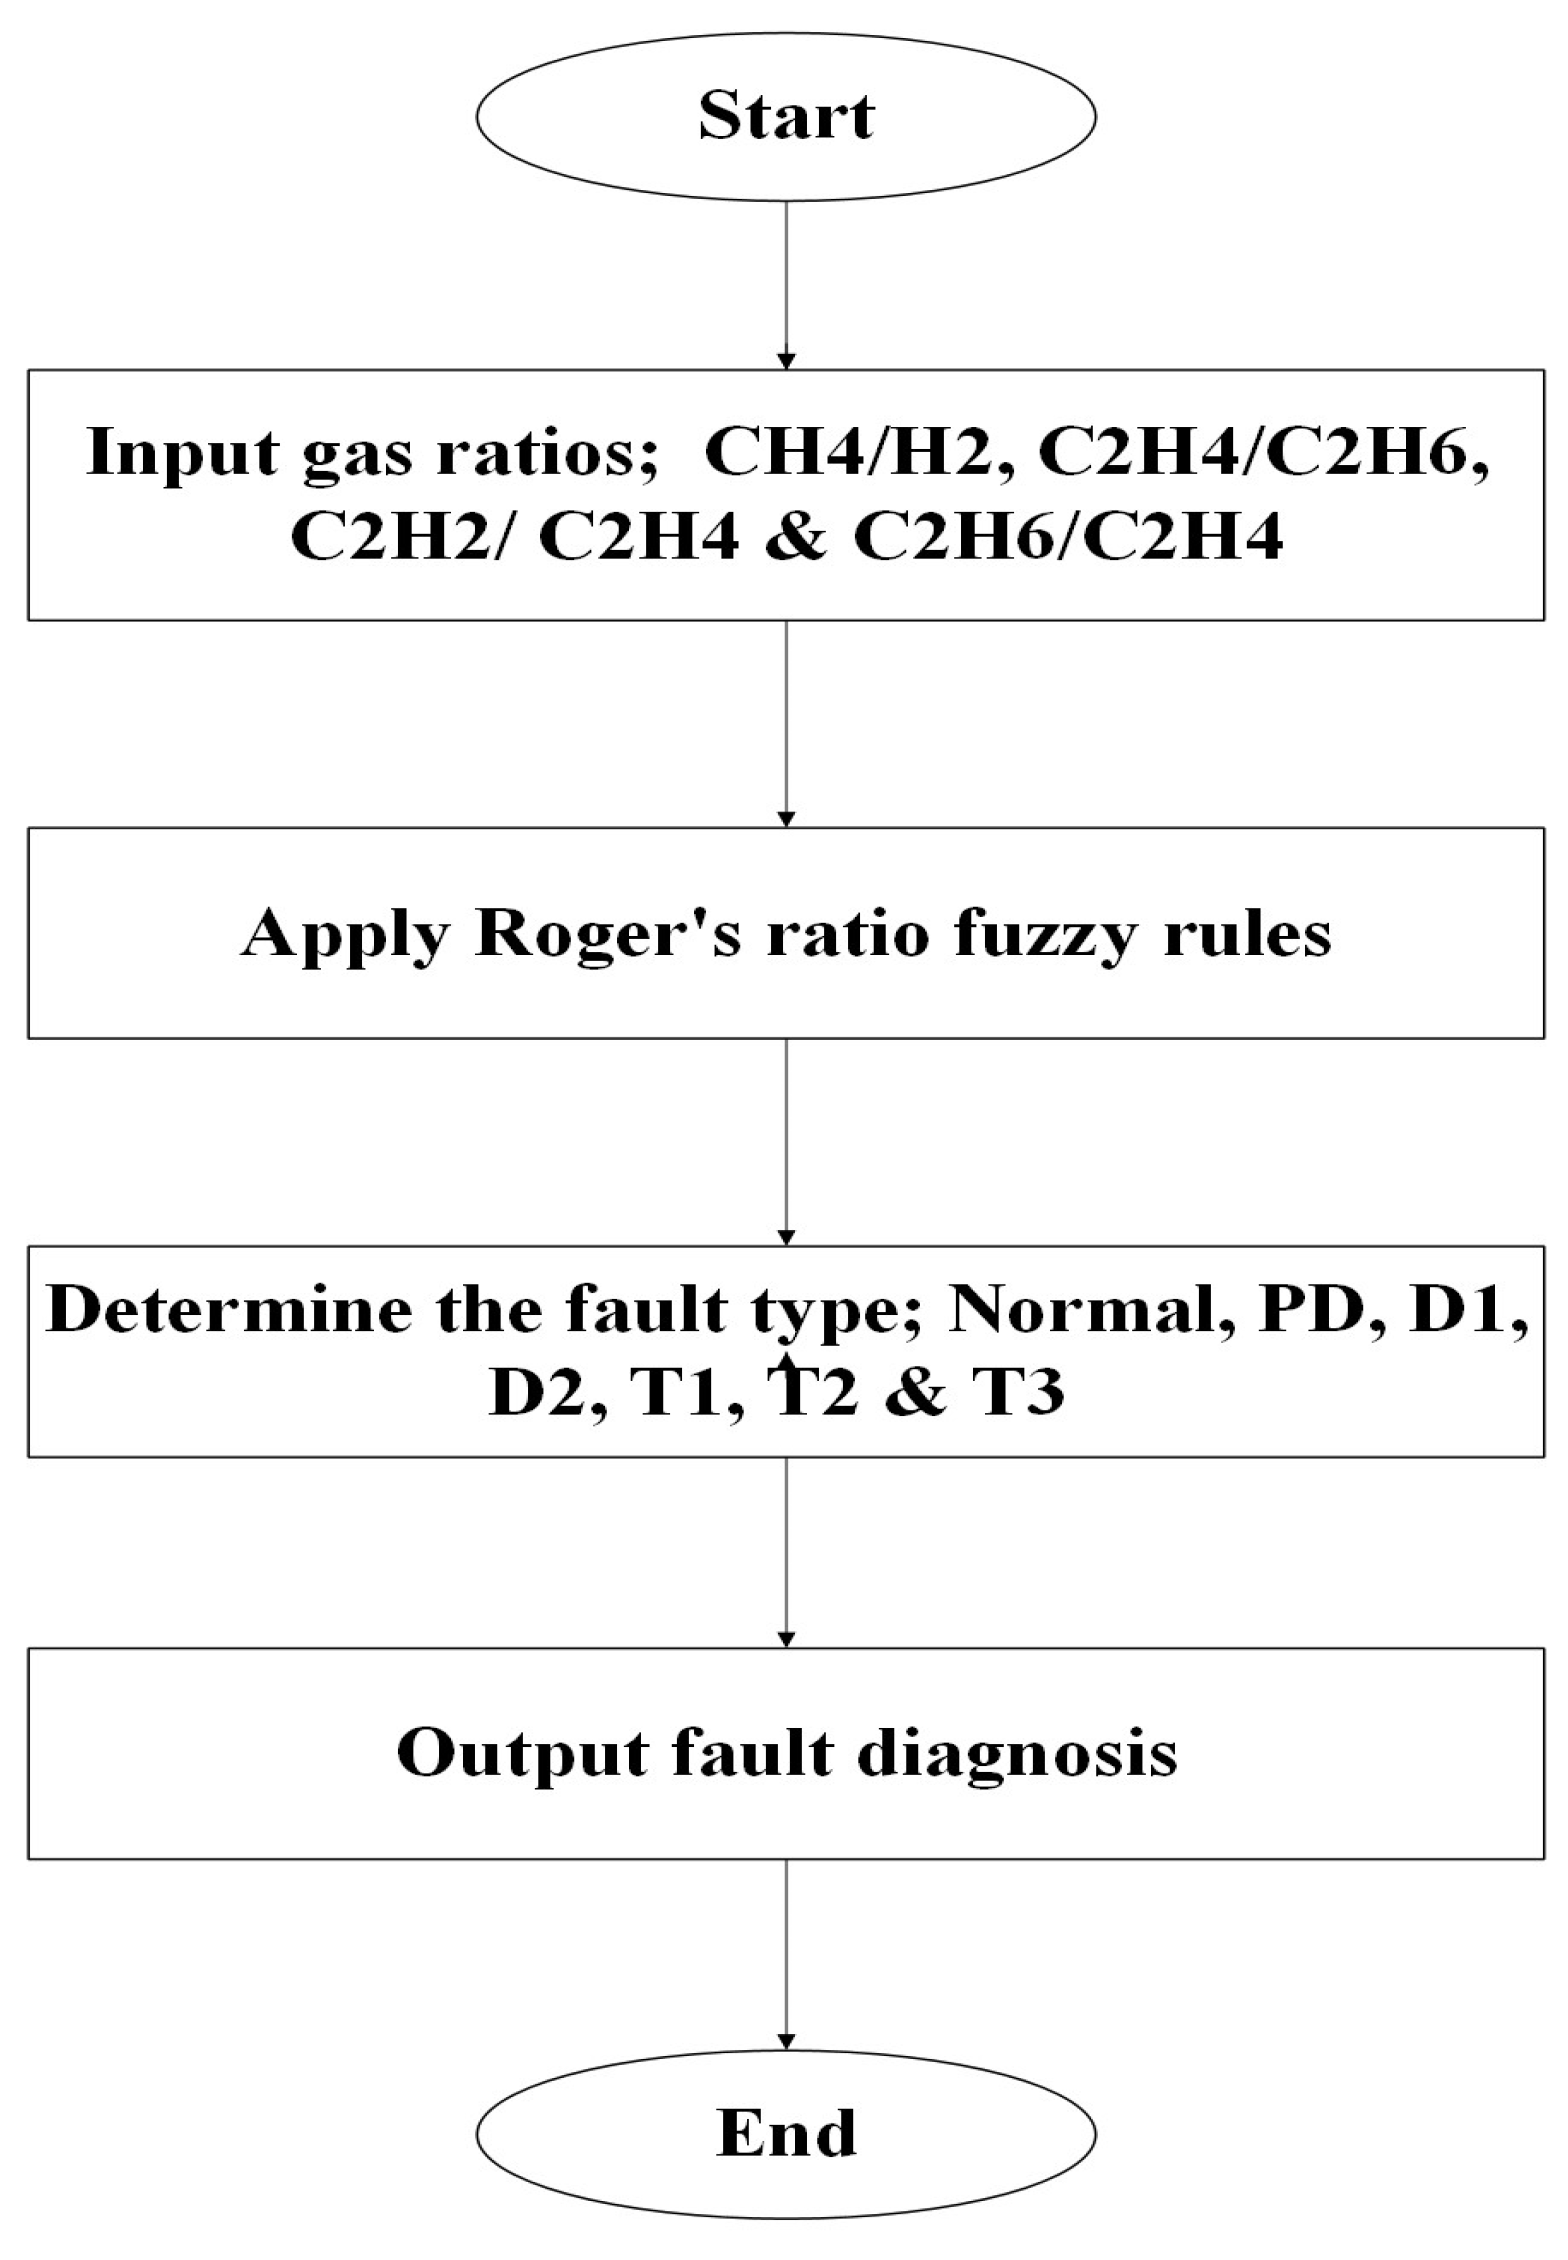
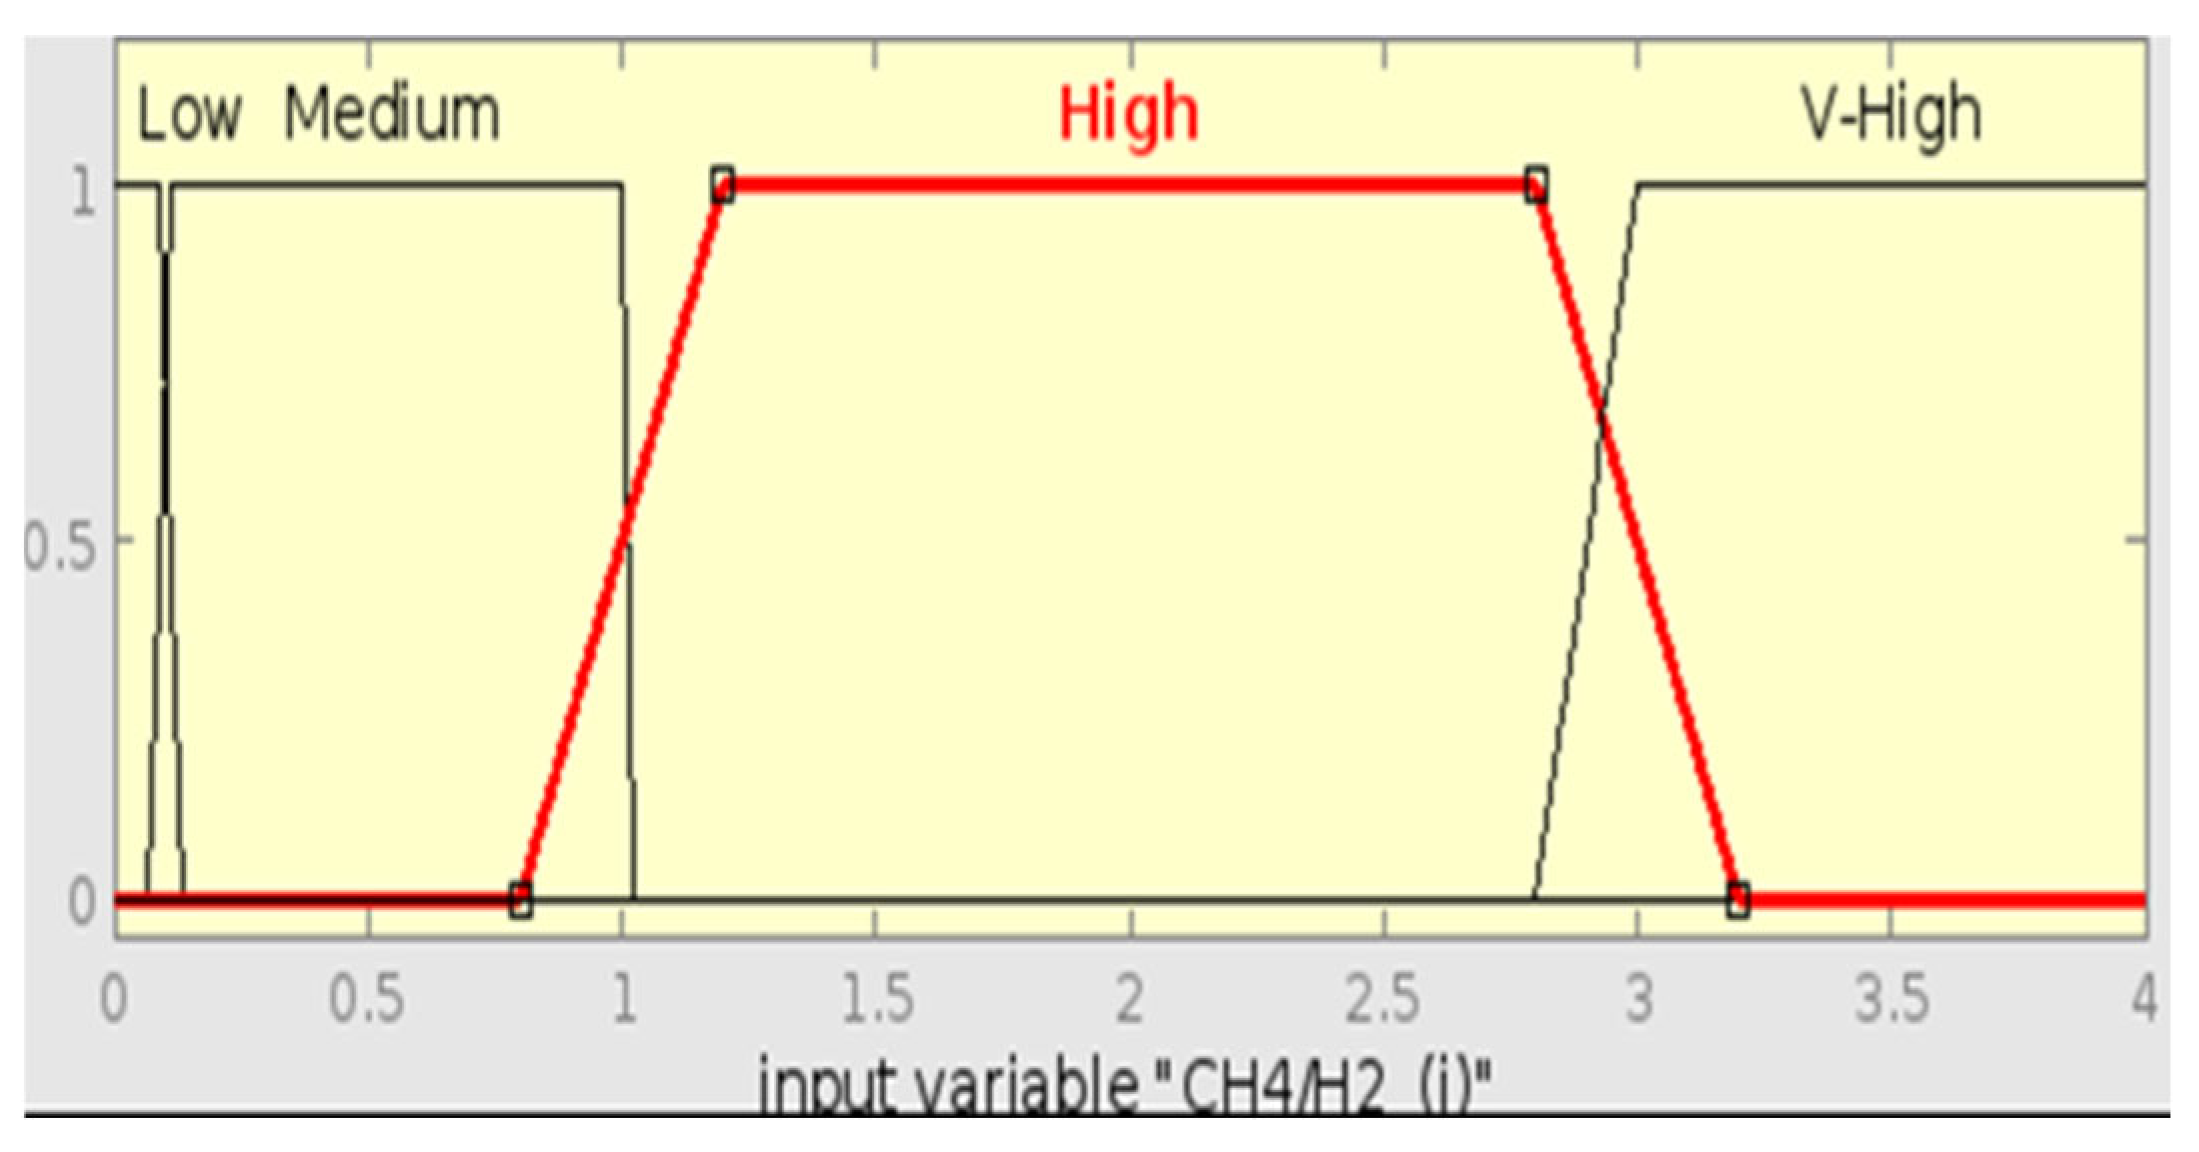
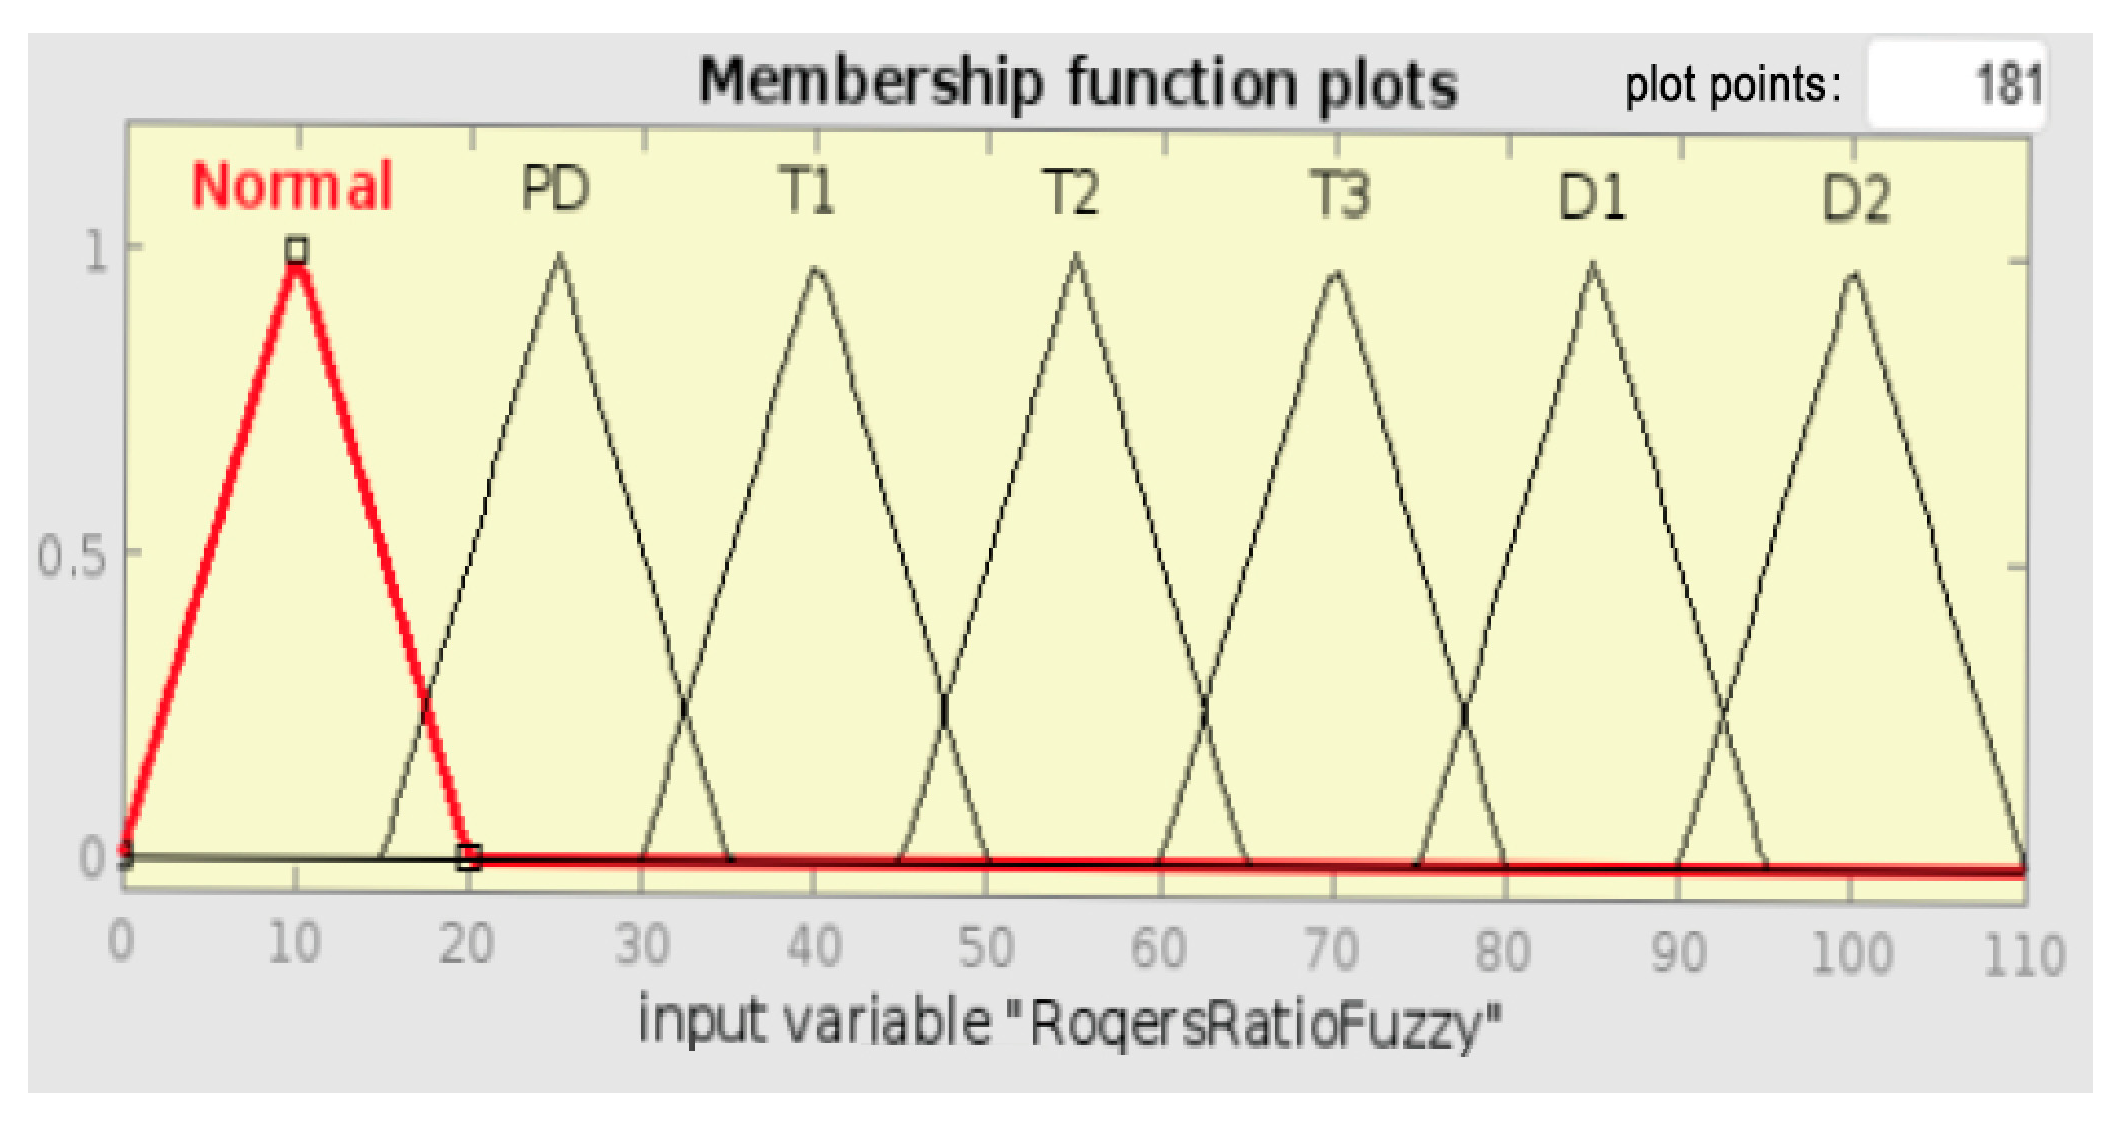
This method utilizes specific ratios of combustible gases for clear fault diagnosis [47]. Four significant gas ratios—CH4/H2, C2H6/CH4, C2H4/C2H6, C2H2/C2H4—serve as inputs. MFs with diagnostic codes from Table 8 fuzzify the ratios. Fuzzy rules, obtained from the diagnostic logic in Table 9 and the flowchart in Figure 10, decide the fault type. Figure 11, Figure 12, Figure 13 and Figure 14 illustrate the input ratio membership functions.
In order to apply fuzzy MFs to the Roger’s Ratio technique, the gas ratios must be quantized into labeled intensity levels. Table 8 describes how each of the four gas ratios is divided into diagnostic codes and intensity labels. These codes are the fuzzy system’s linguistic inputs and allow standardization of how fuzzy rules are constructed from the gas ratios.
Roger’s Ratio method diagnostic logic is founded on some combinations of gas ratio intensities. Table 9 contains all possible fault cases identifiable by different input ratio code combinations. Each combination is assigned to a specific fault diagnosis explicitly, which is then utilized in the fuzzy inference rule base.
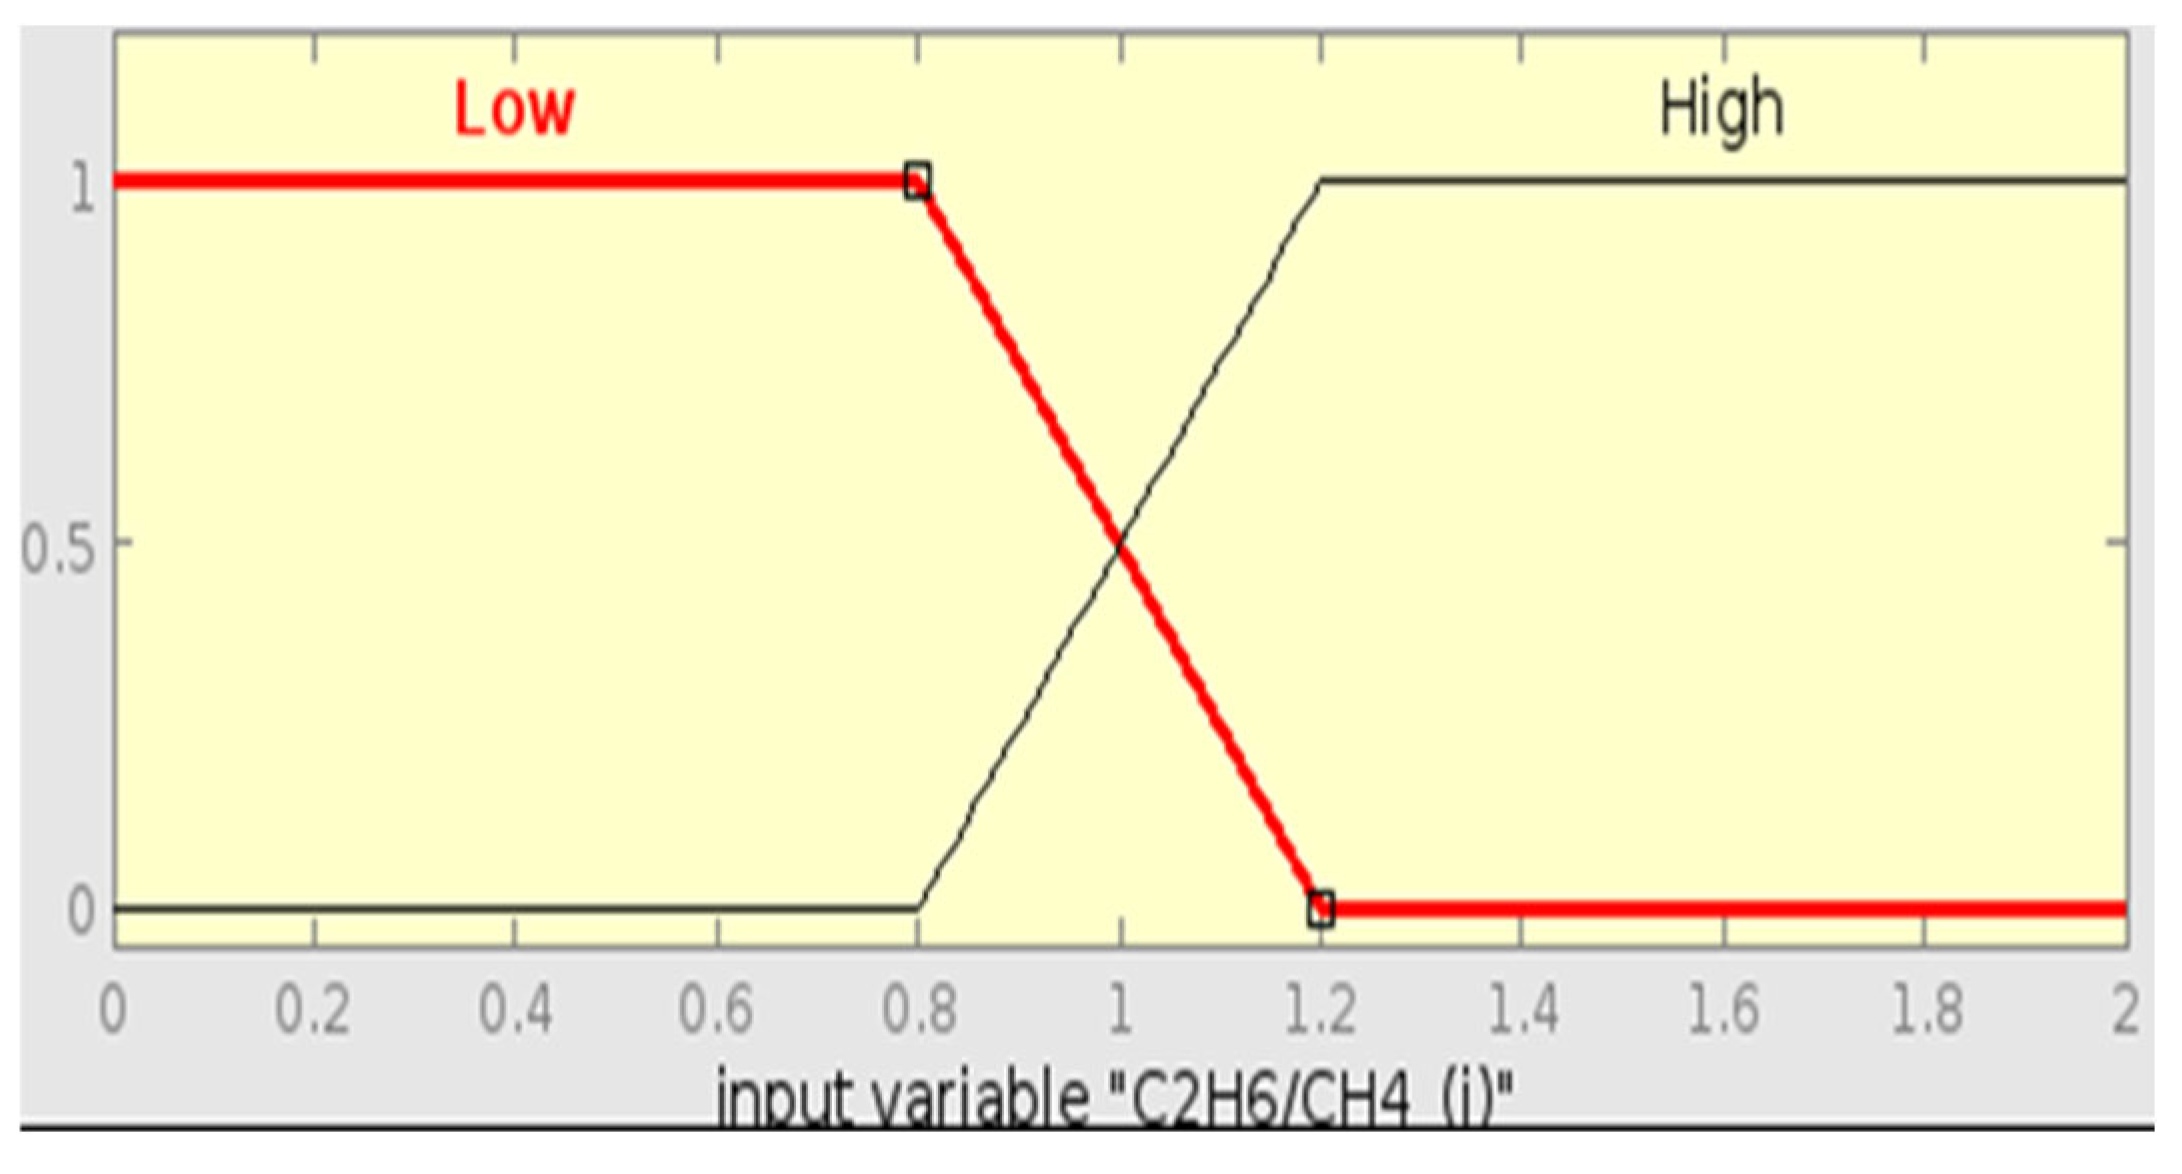
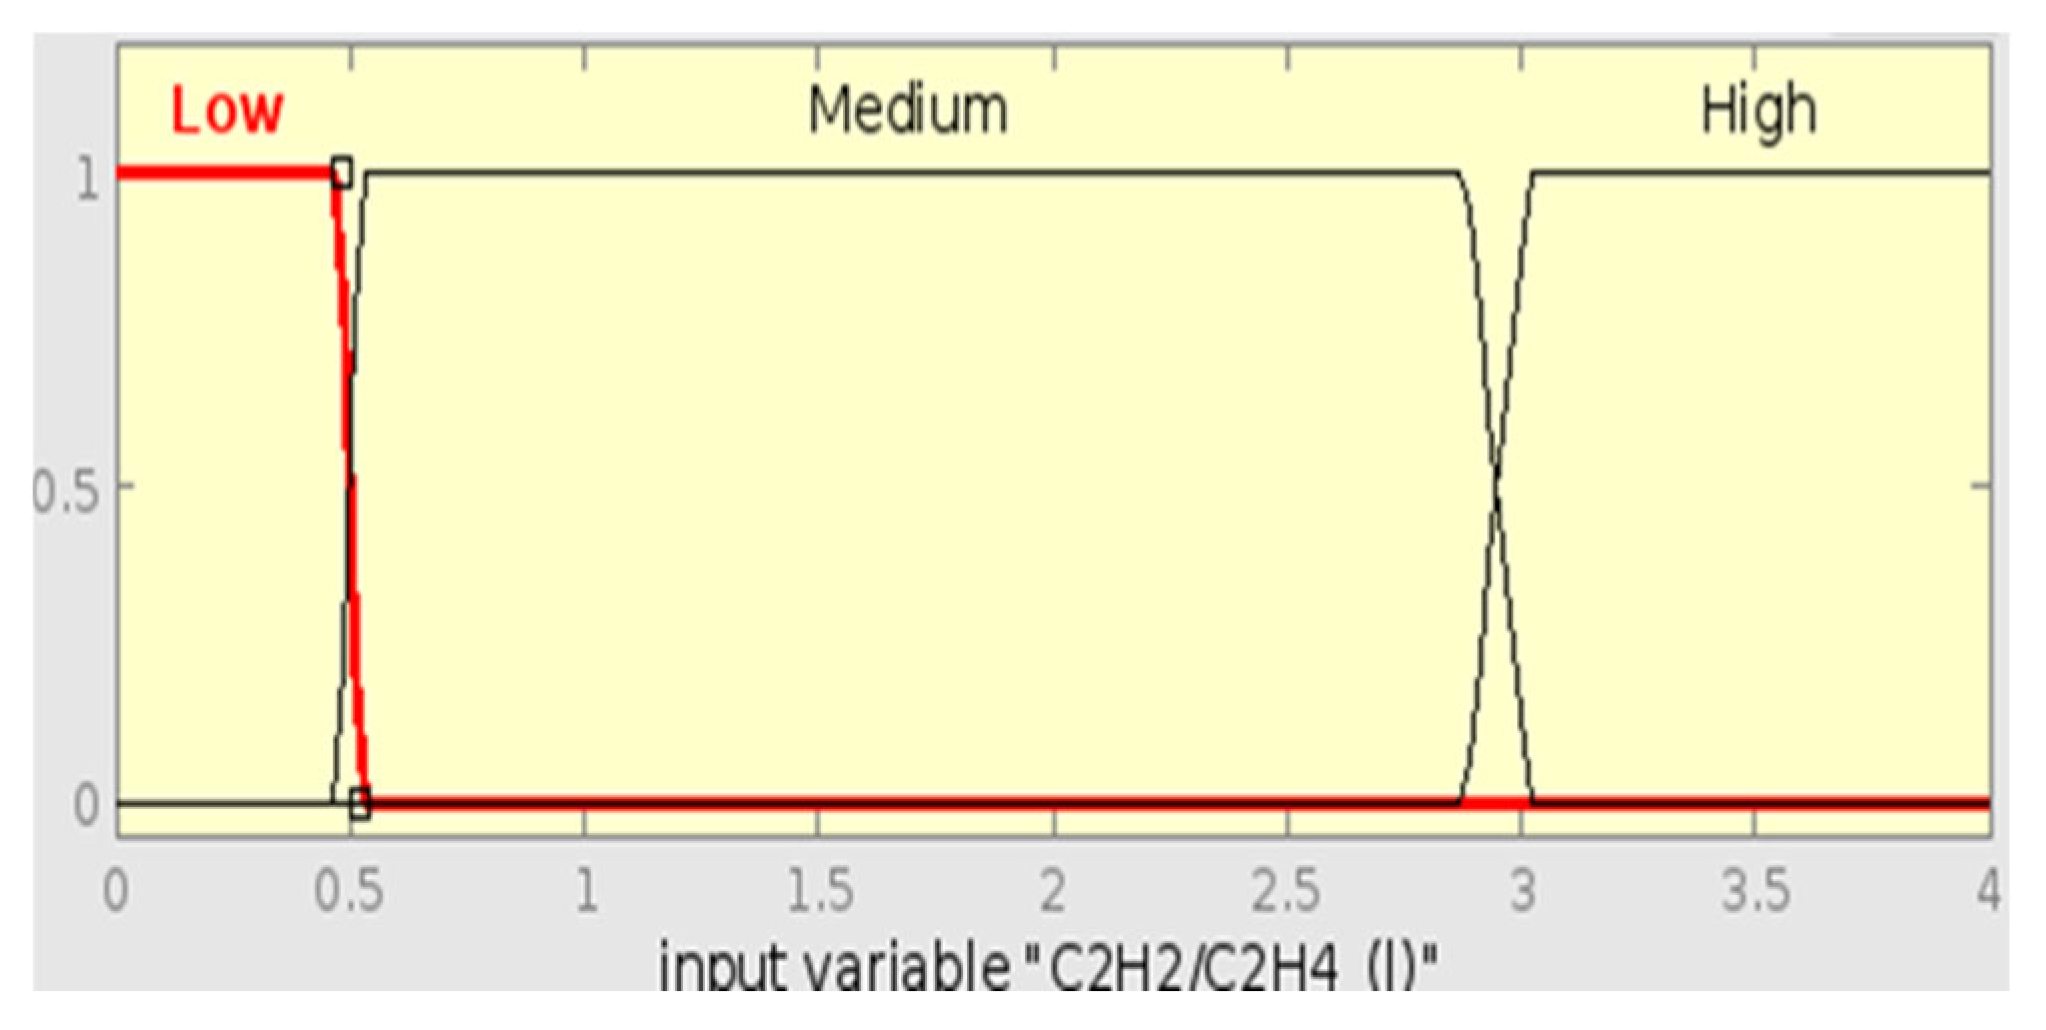
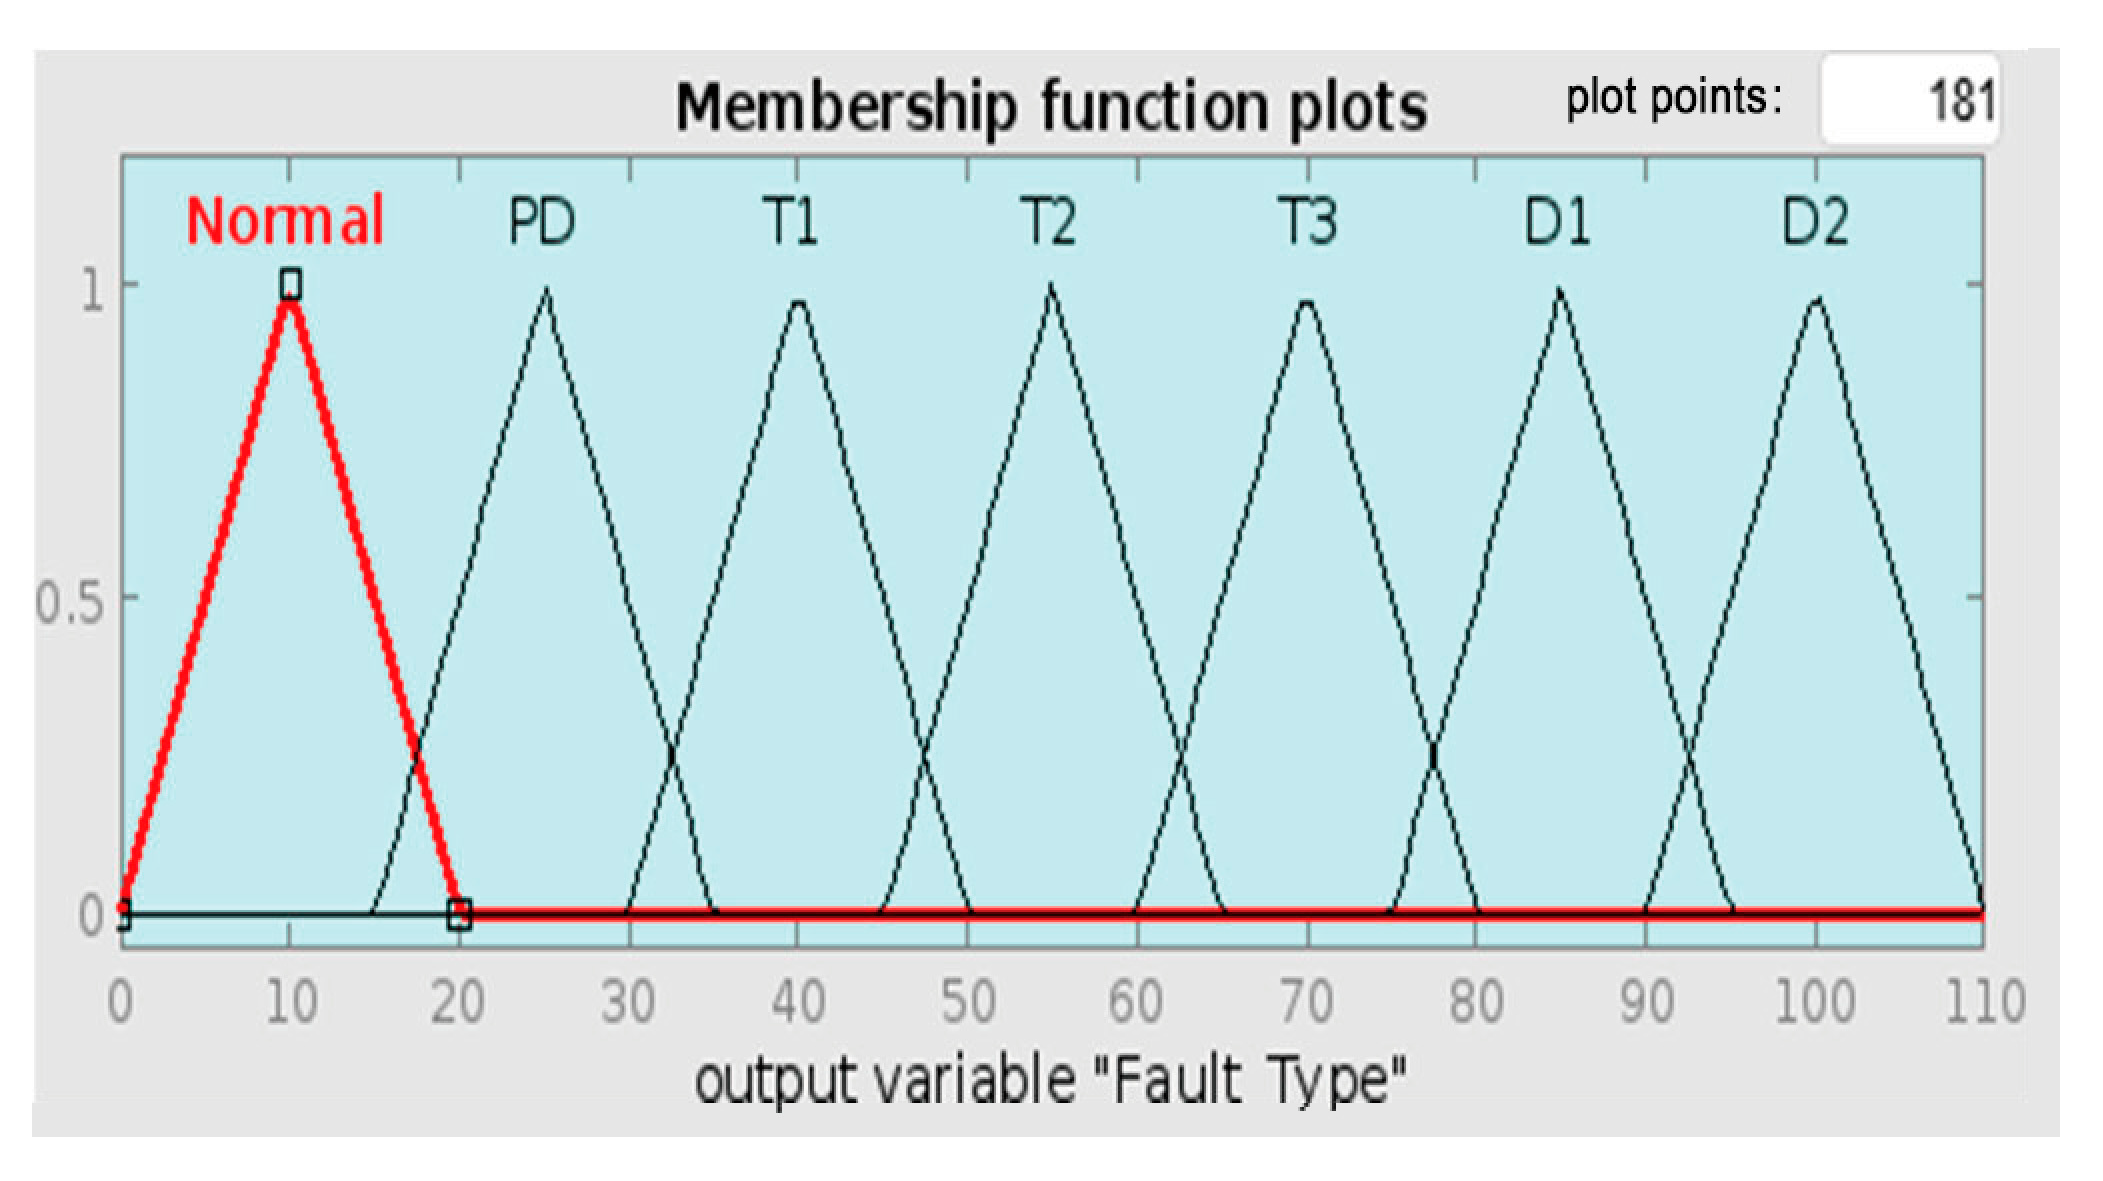
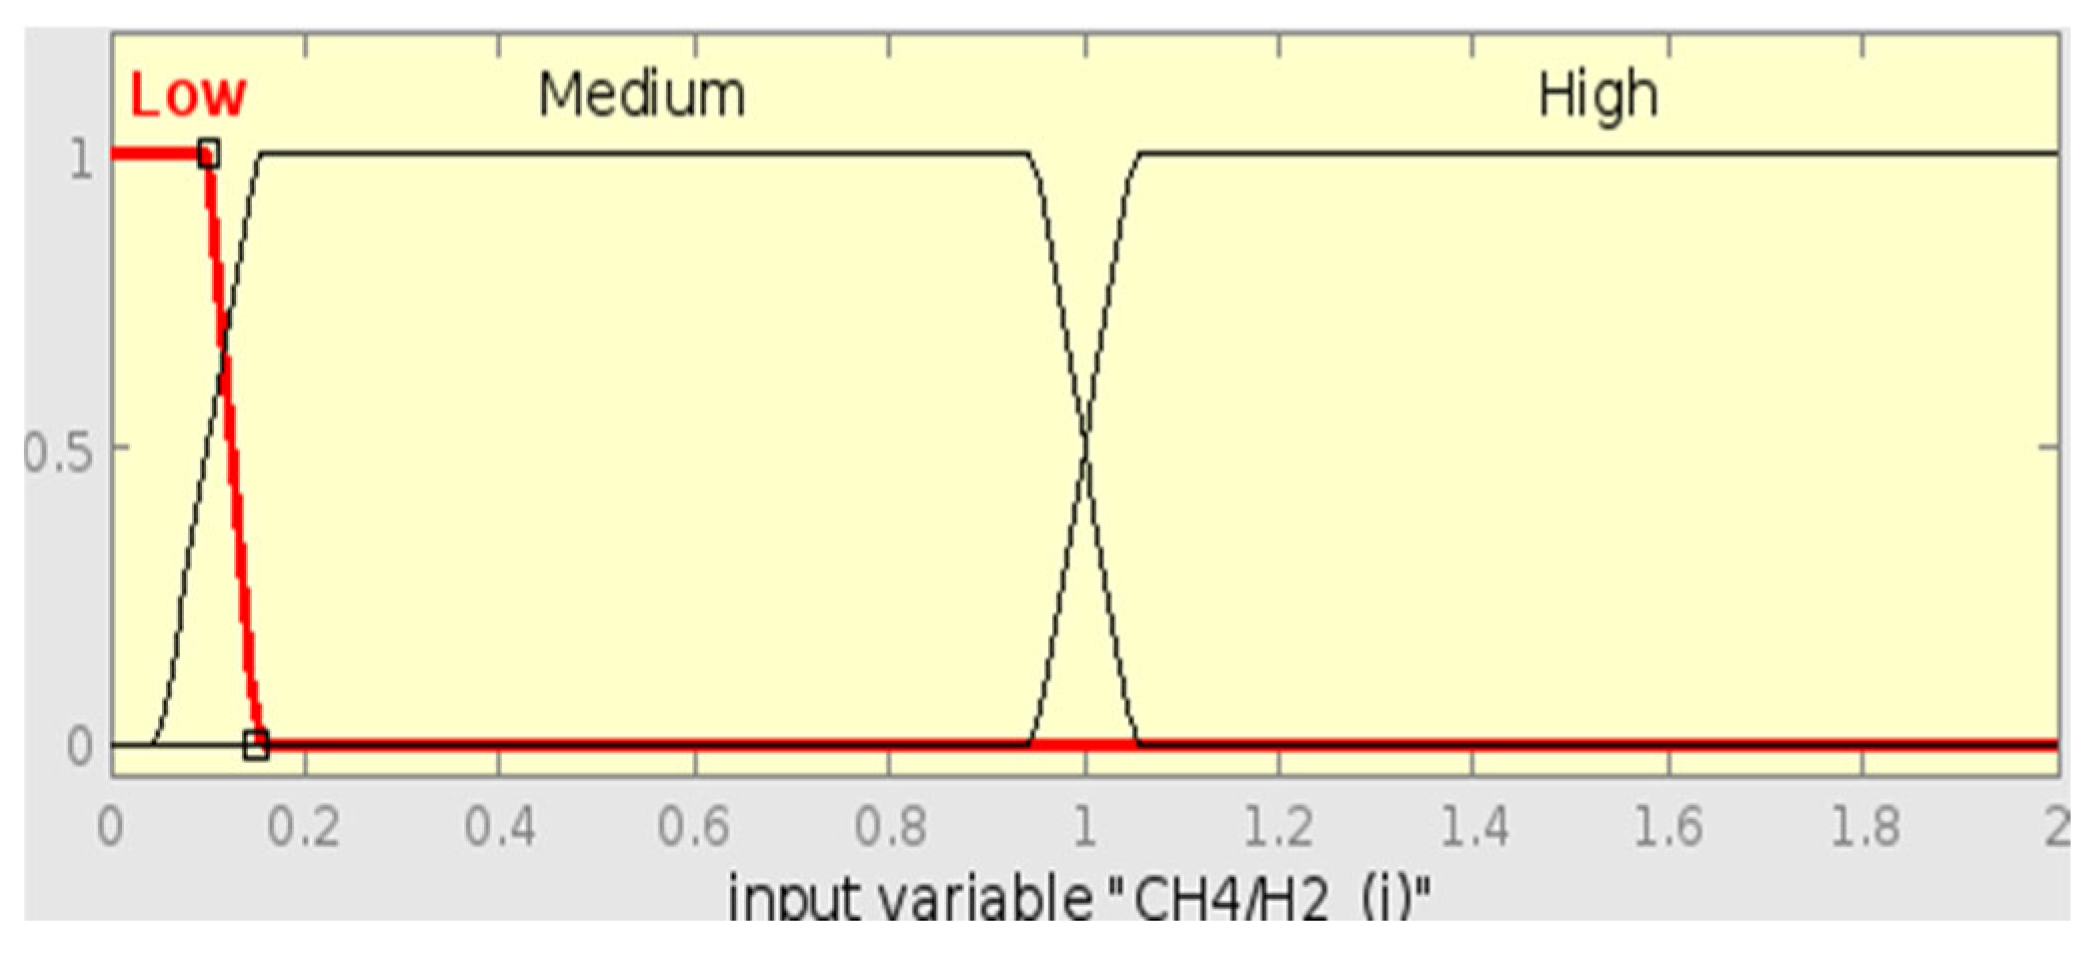
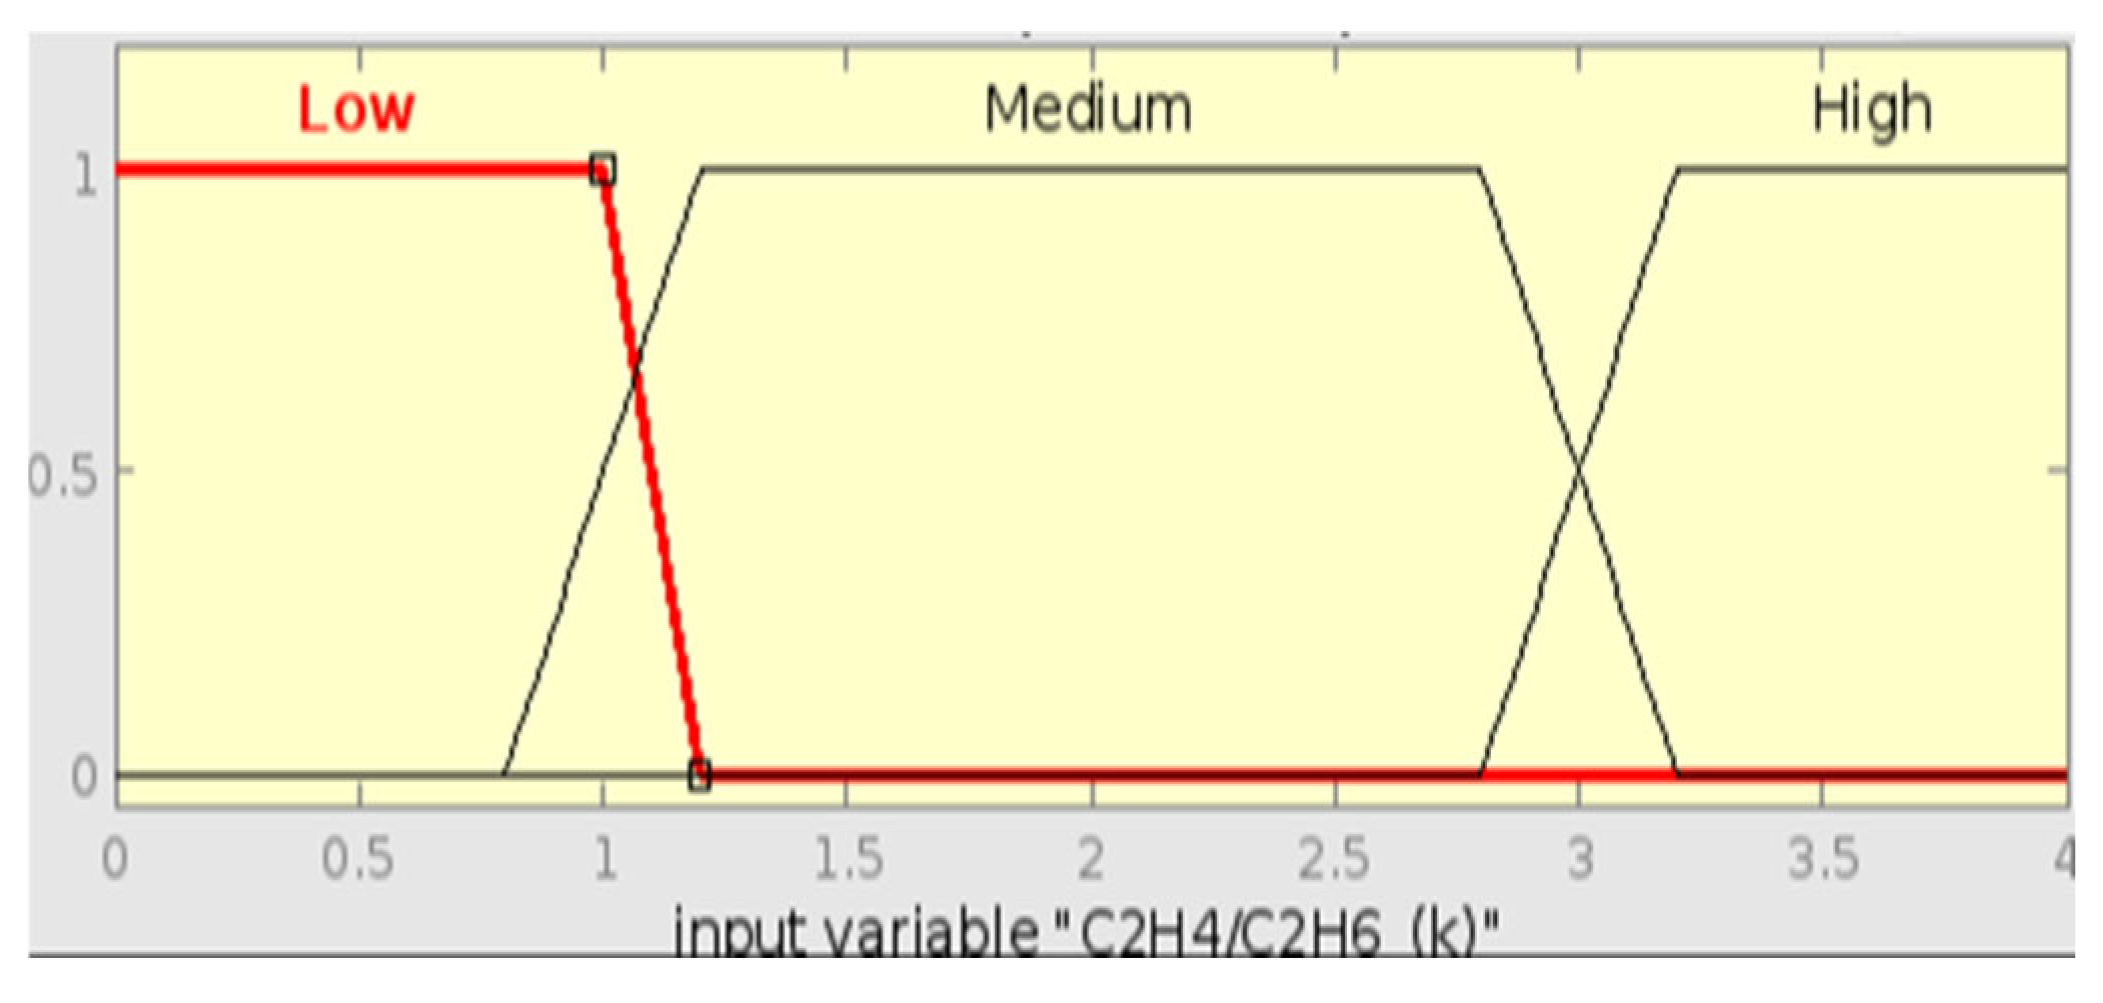
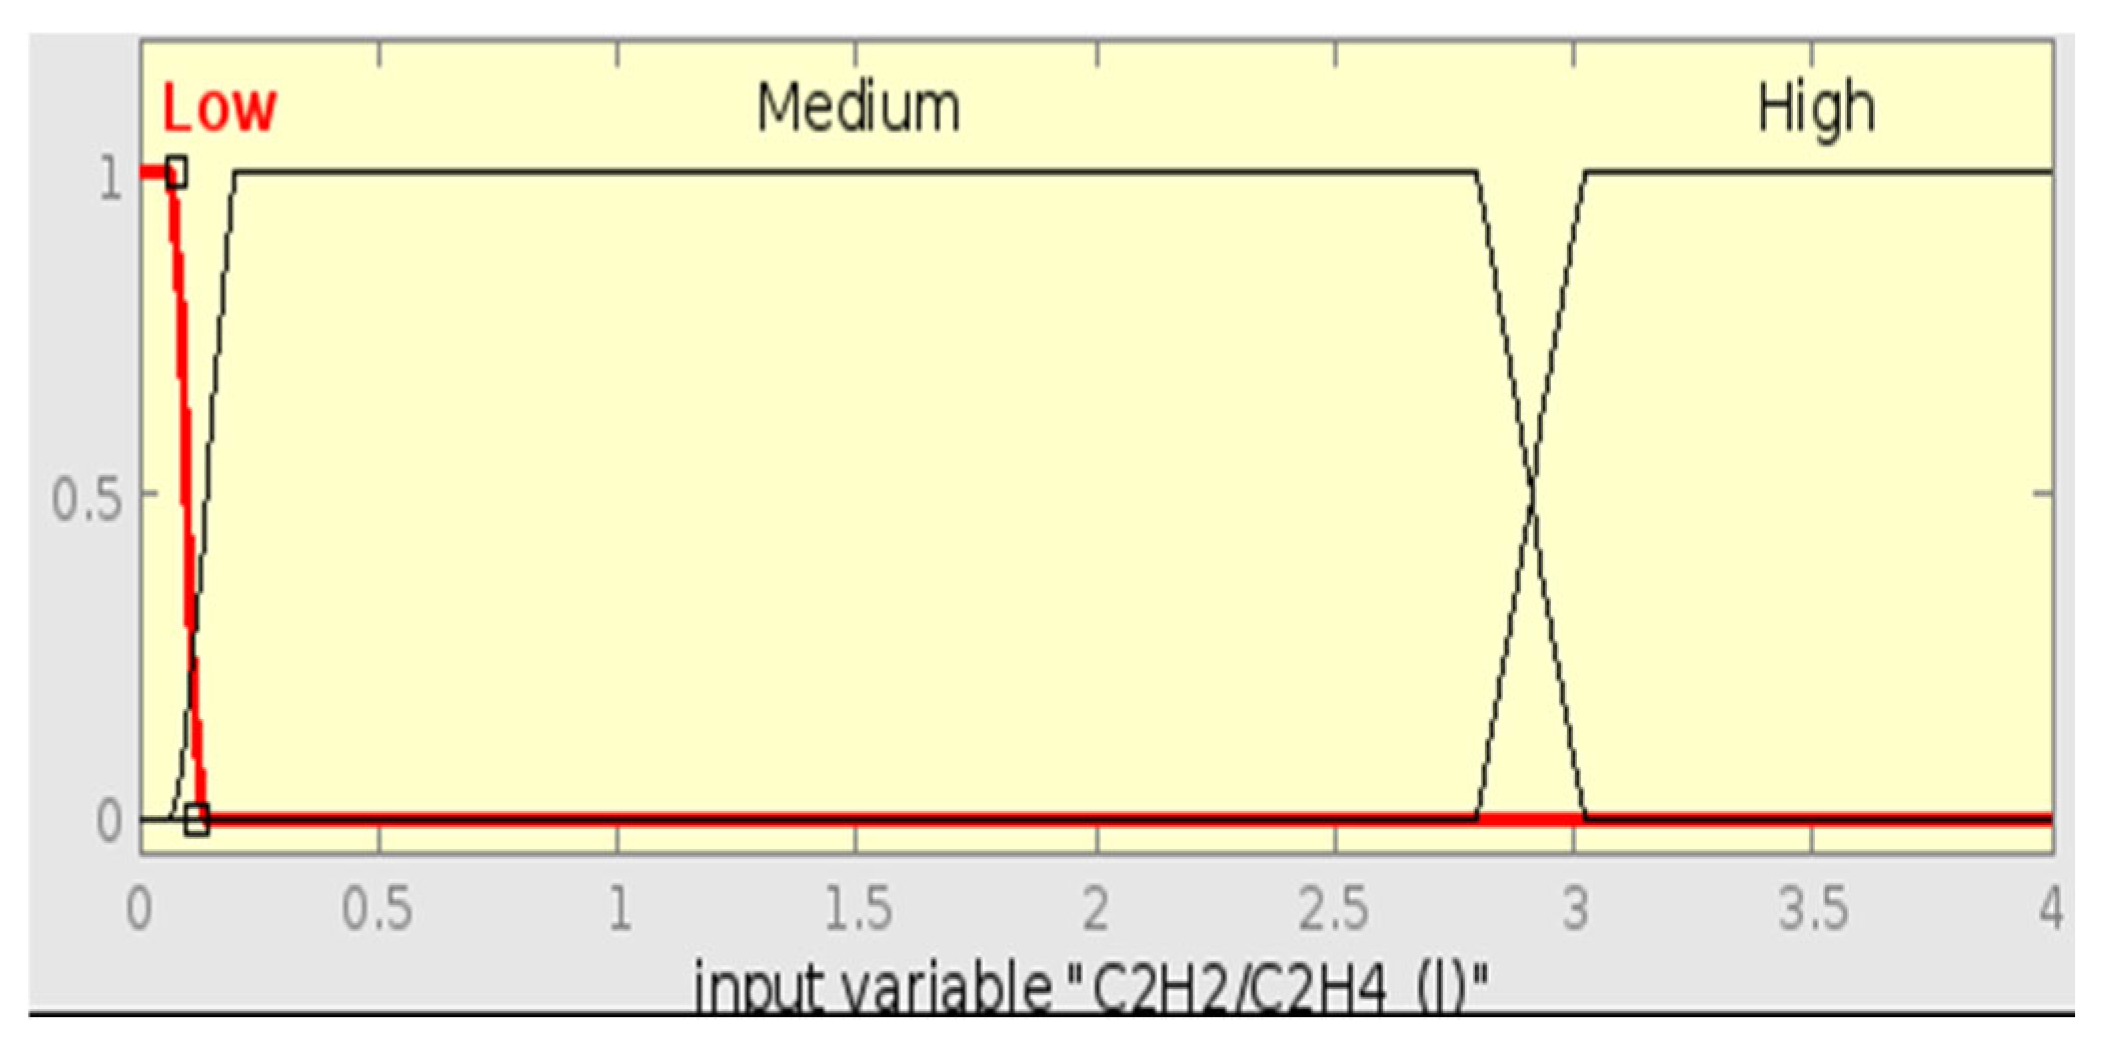
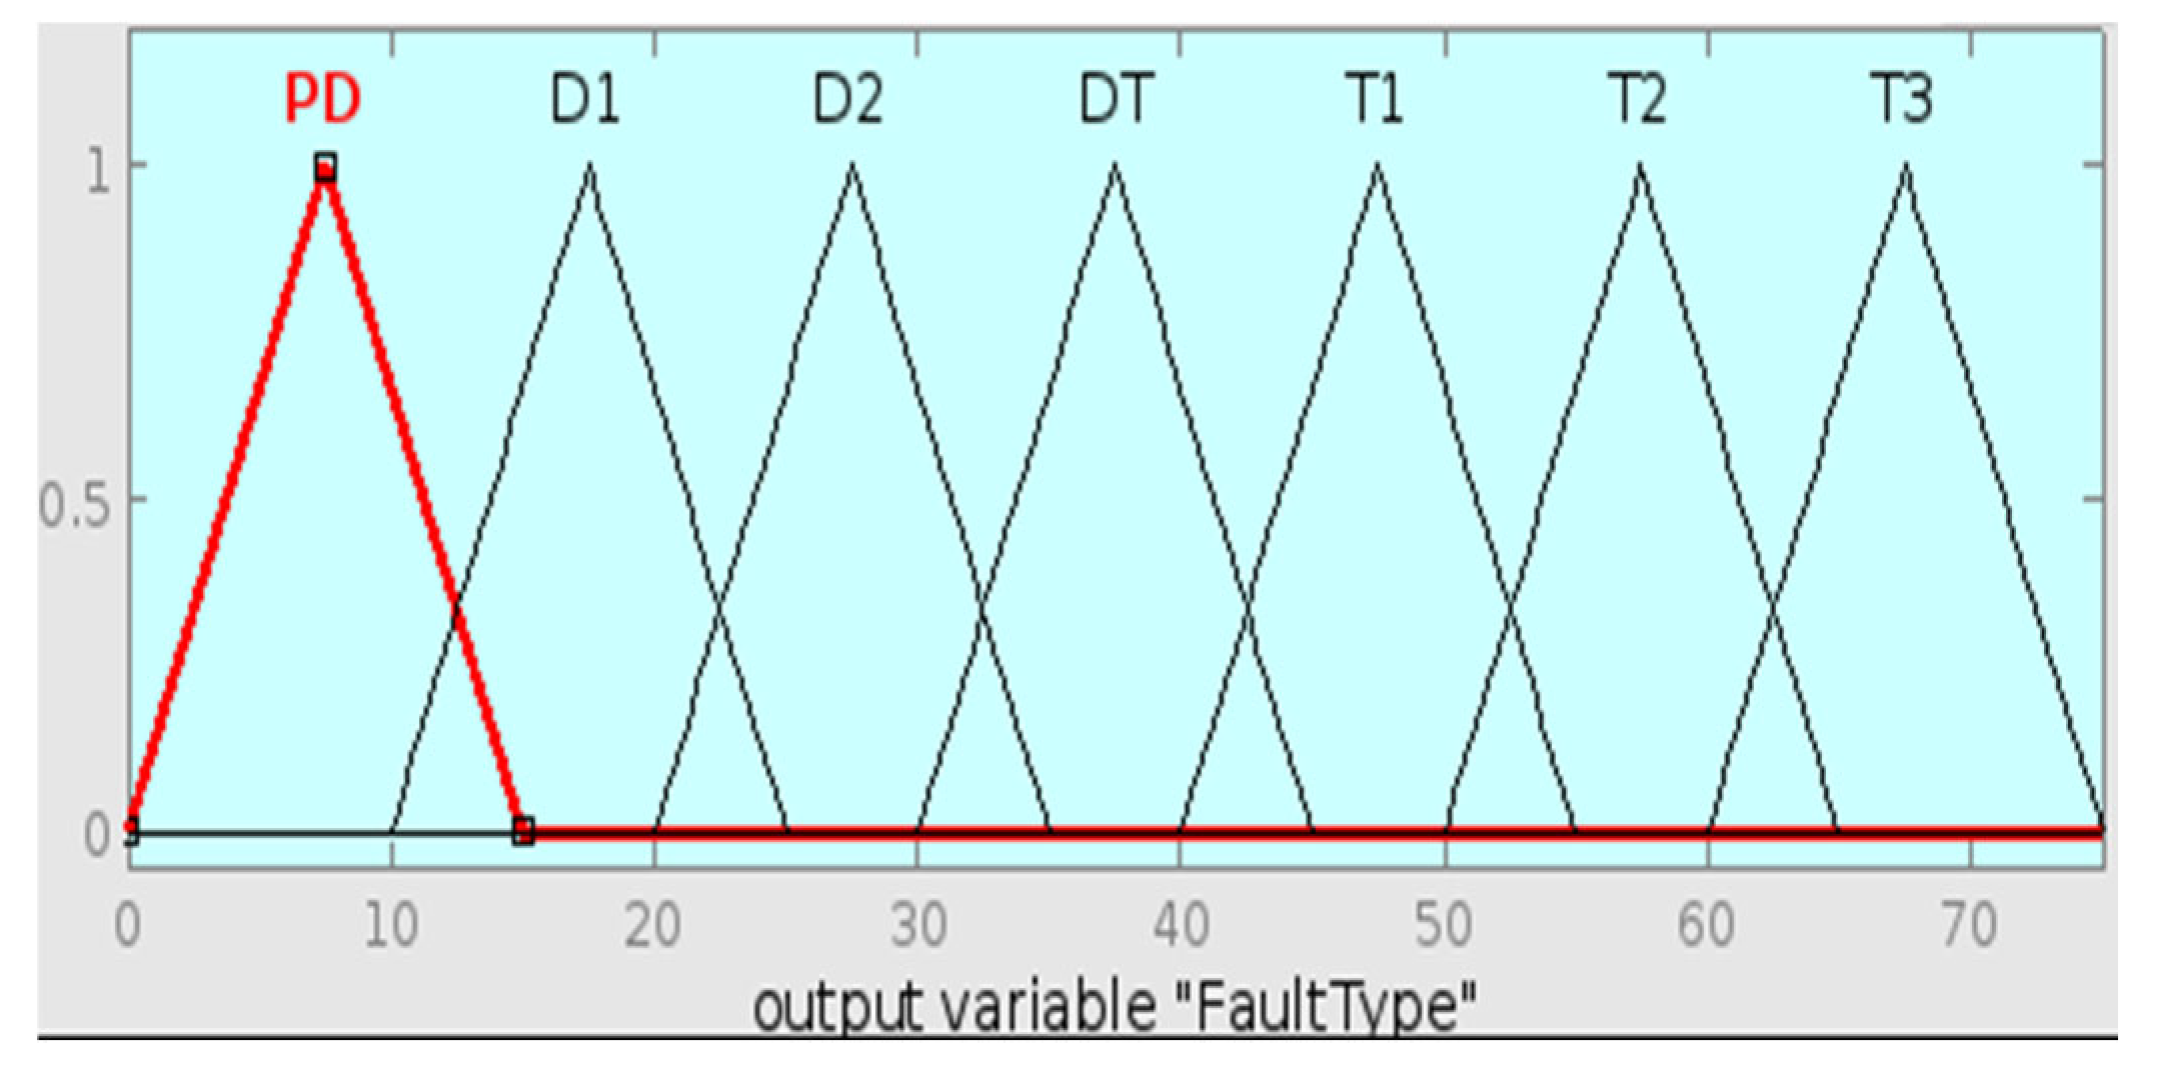
To develop a fuzzy logic system for the Rogers Ratio method, the gas ratios CH4/H2 (i), C2H6/CH4 (j), C2H4/C2H6 (k), and C2H2/C2H4 (l) are used as inputs with MFs; low, medium, and high, as shown in Figure 11, Figure 12, Figure 13 and Figure 14 below, respectively, designed based on their defined ranges. These MFs are represented by trapezoidal membership functions, as shown in the figures below. The output is the fault diagnosis, which includes fault types, such as Normal, PD, T1, T2, and T3, and D1 and D2, as depicted by Figure 15 below. Using Table 9, Fuzzy rules are generated by linking the input ranges to specific faults. The FIS uses an IF-THEN rule-based system, for instance, to generate rules like IF (i) is Low AND (j) is Low AND (k) is Low AND (l) is Low, THEN Fault Type = Normal Deterioration.

5.3. IEC Ratio Method

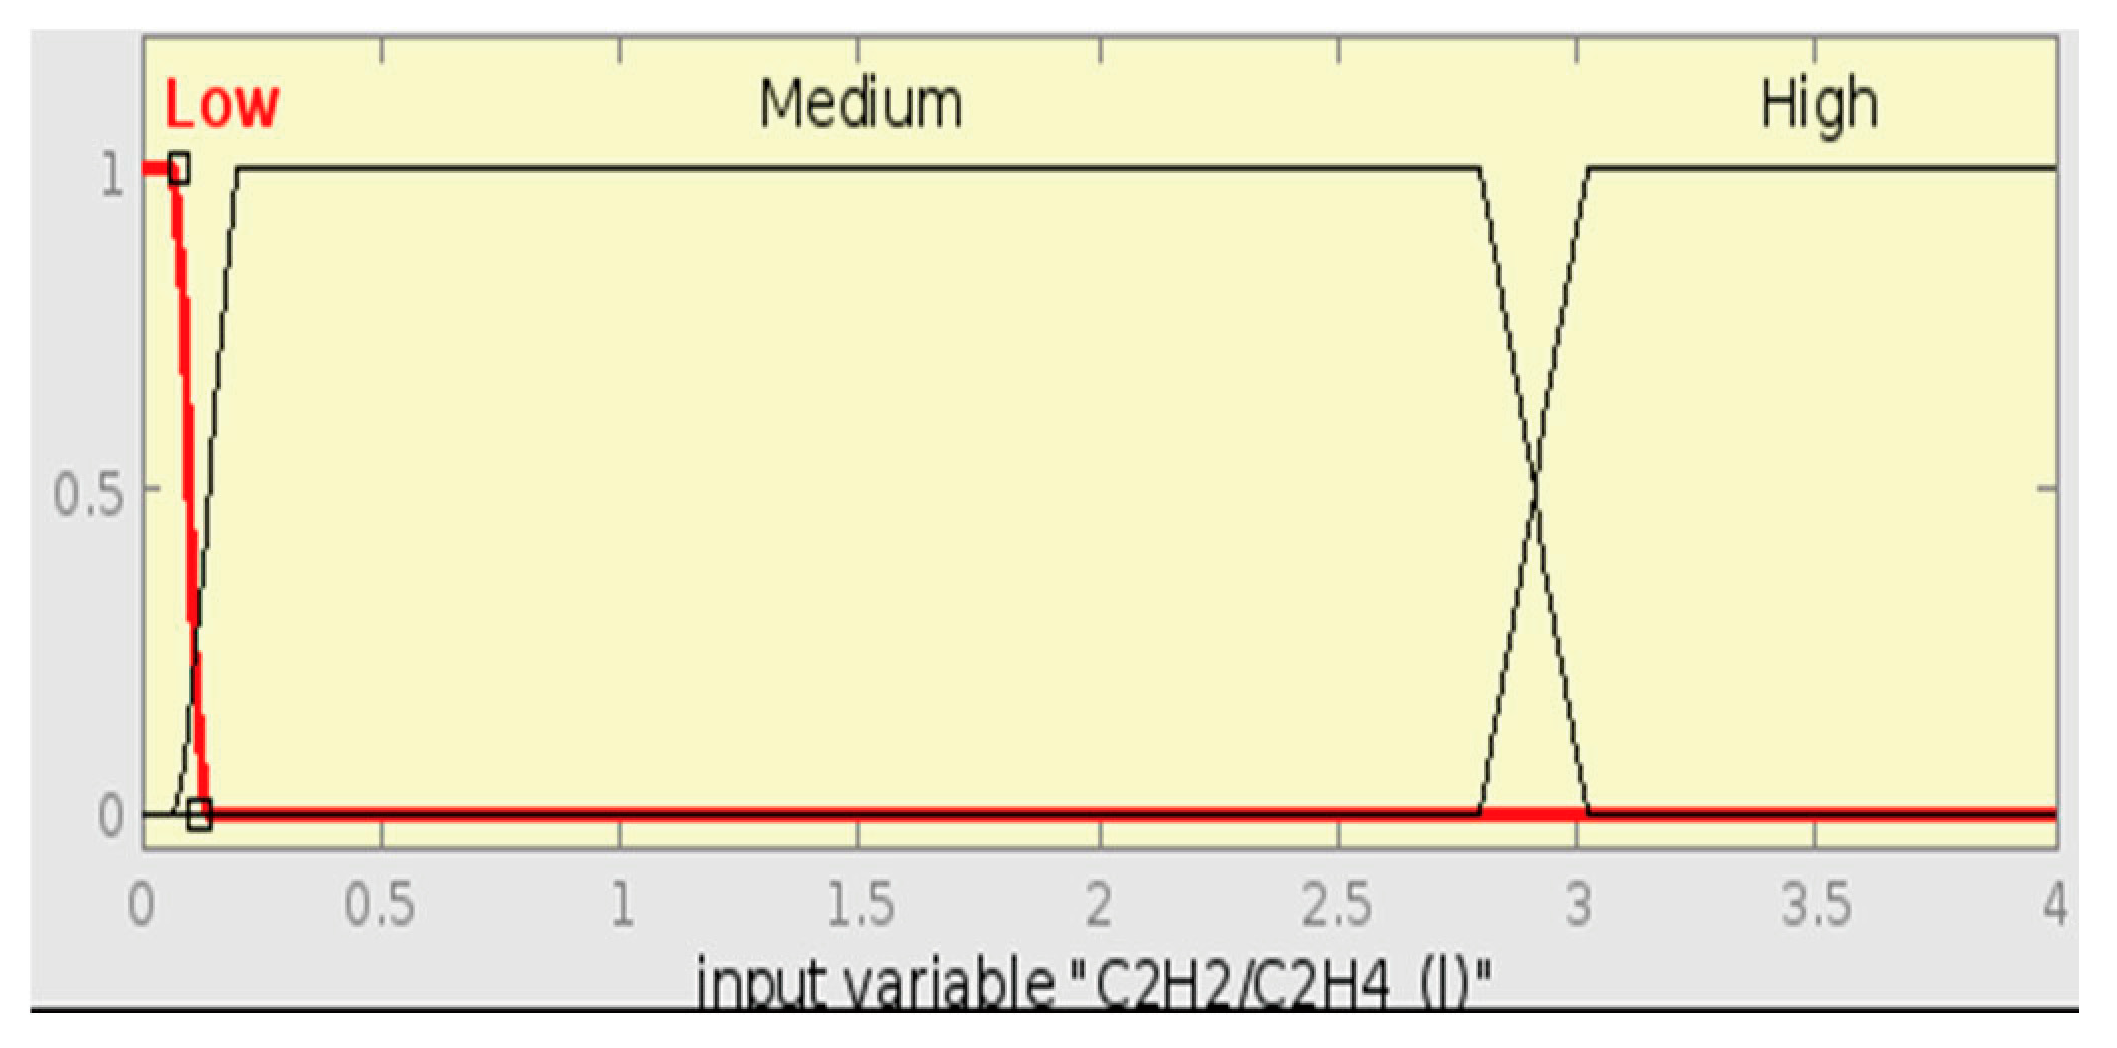
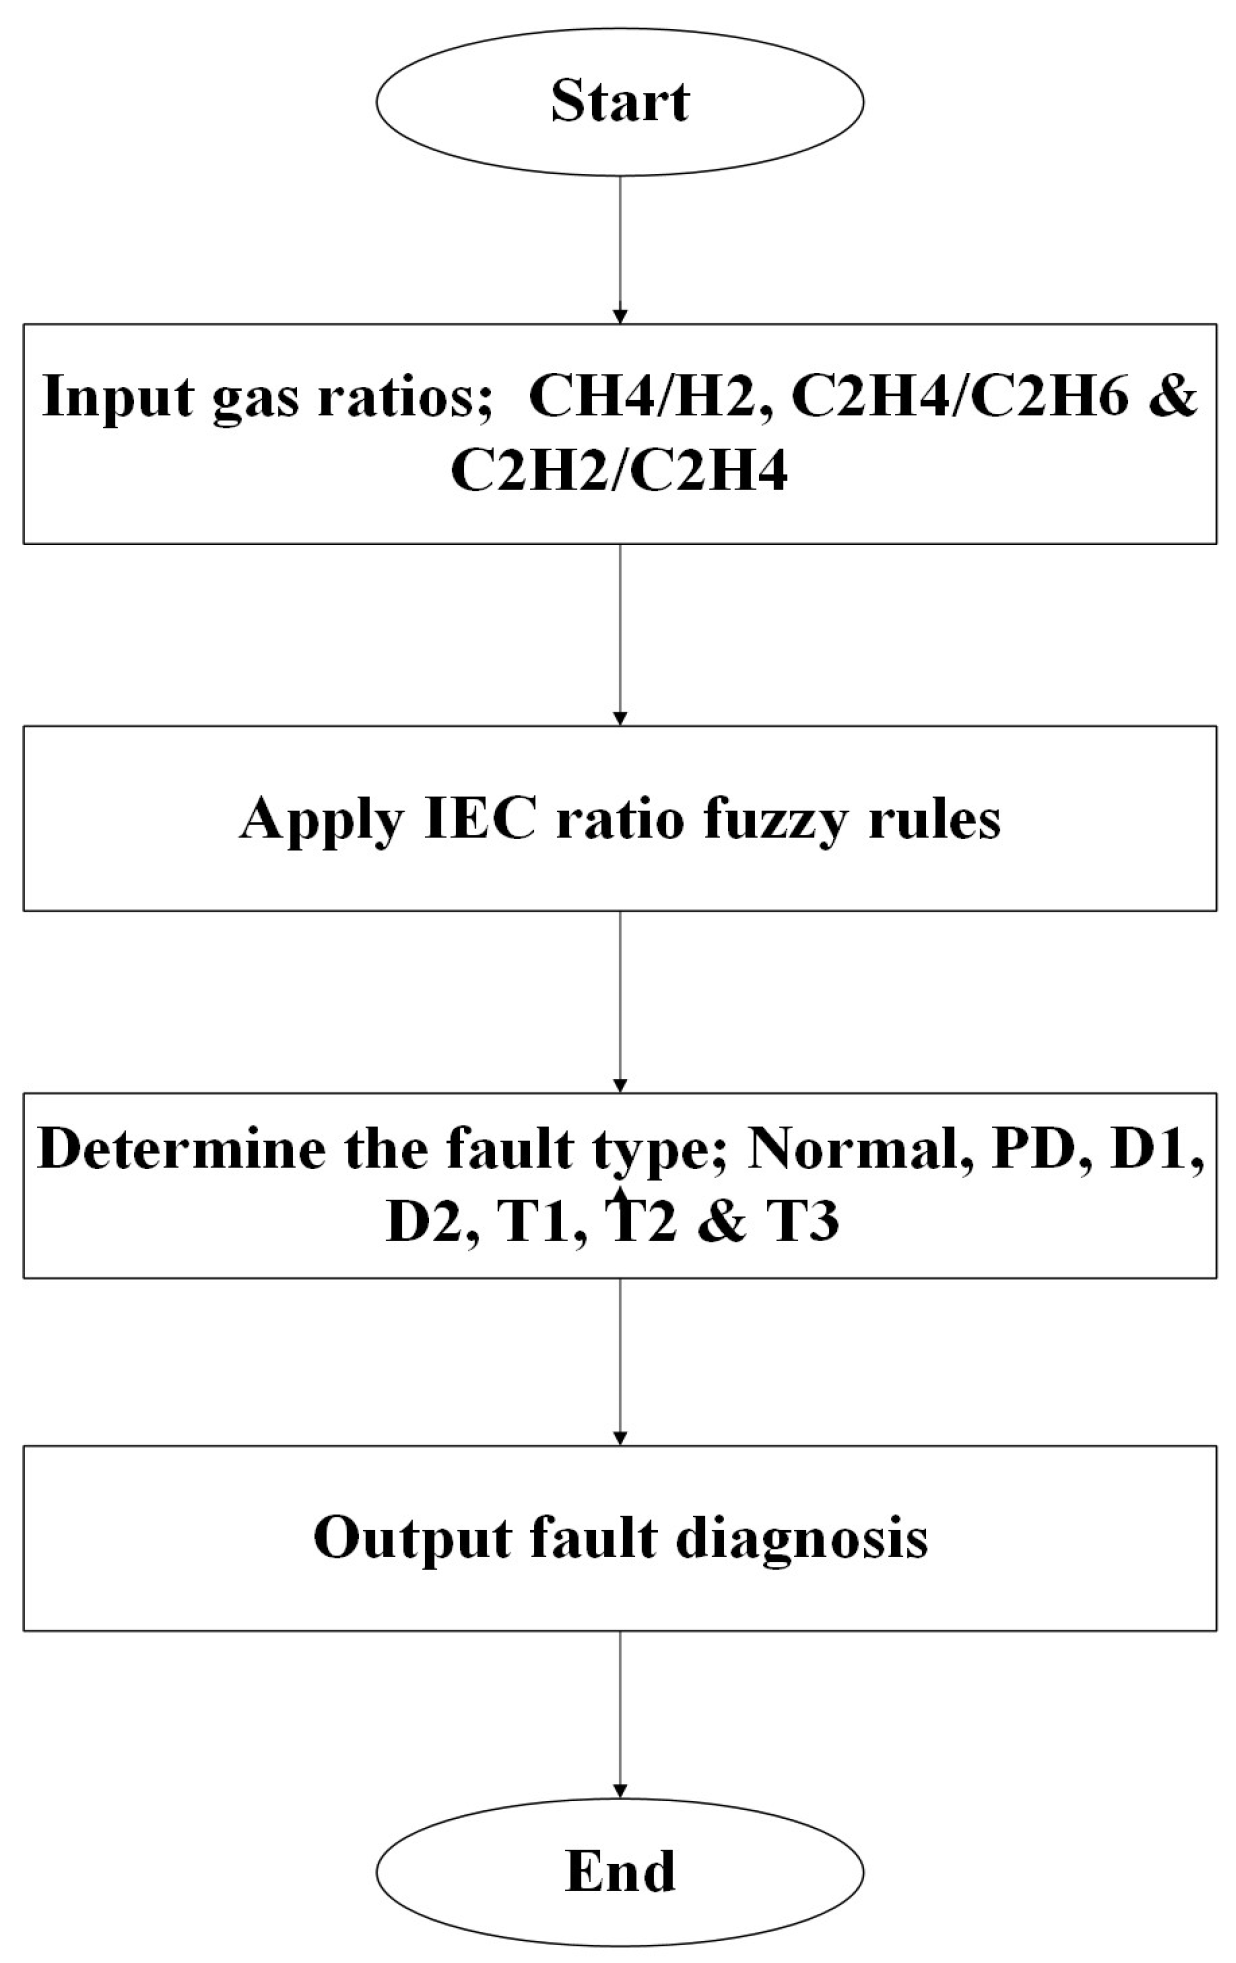
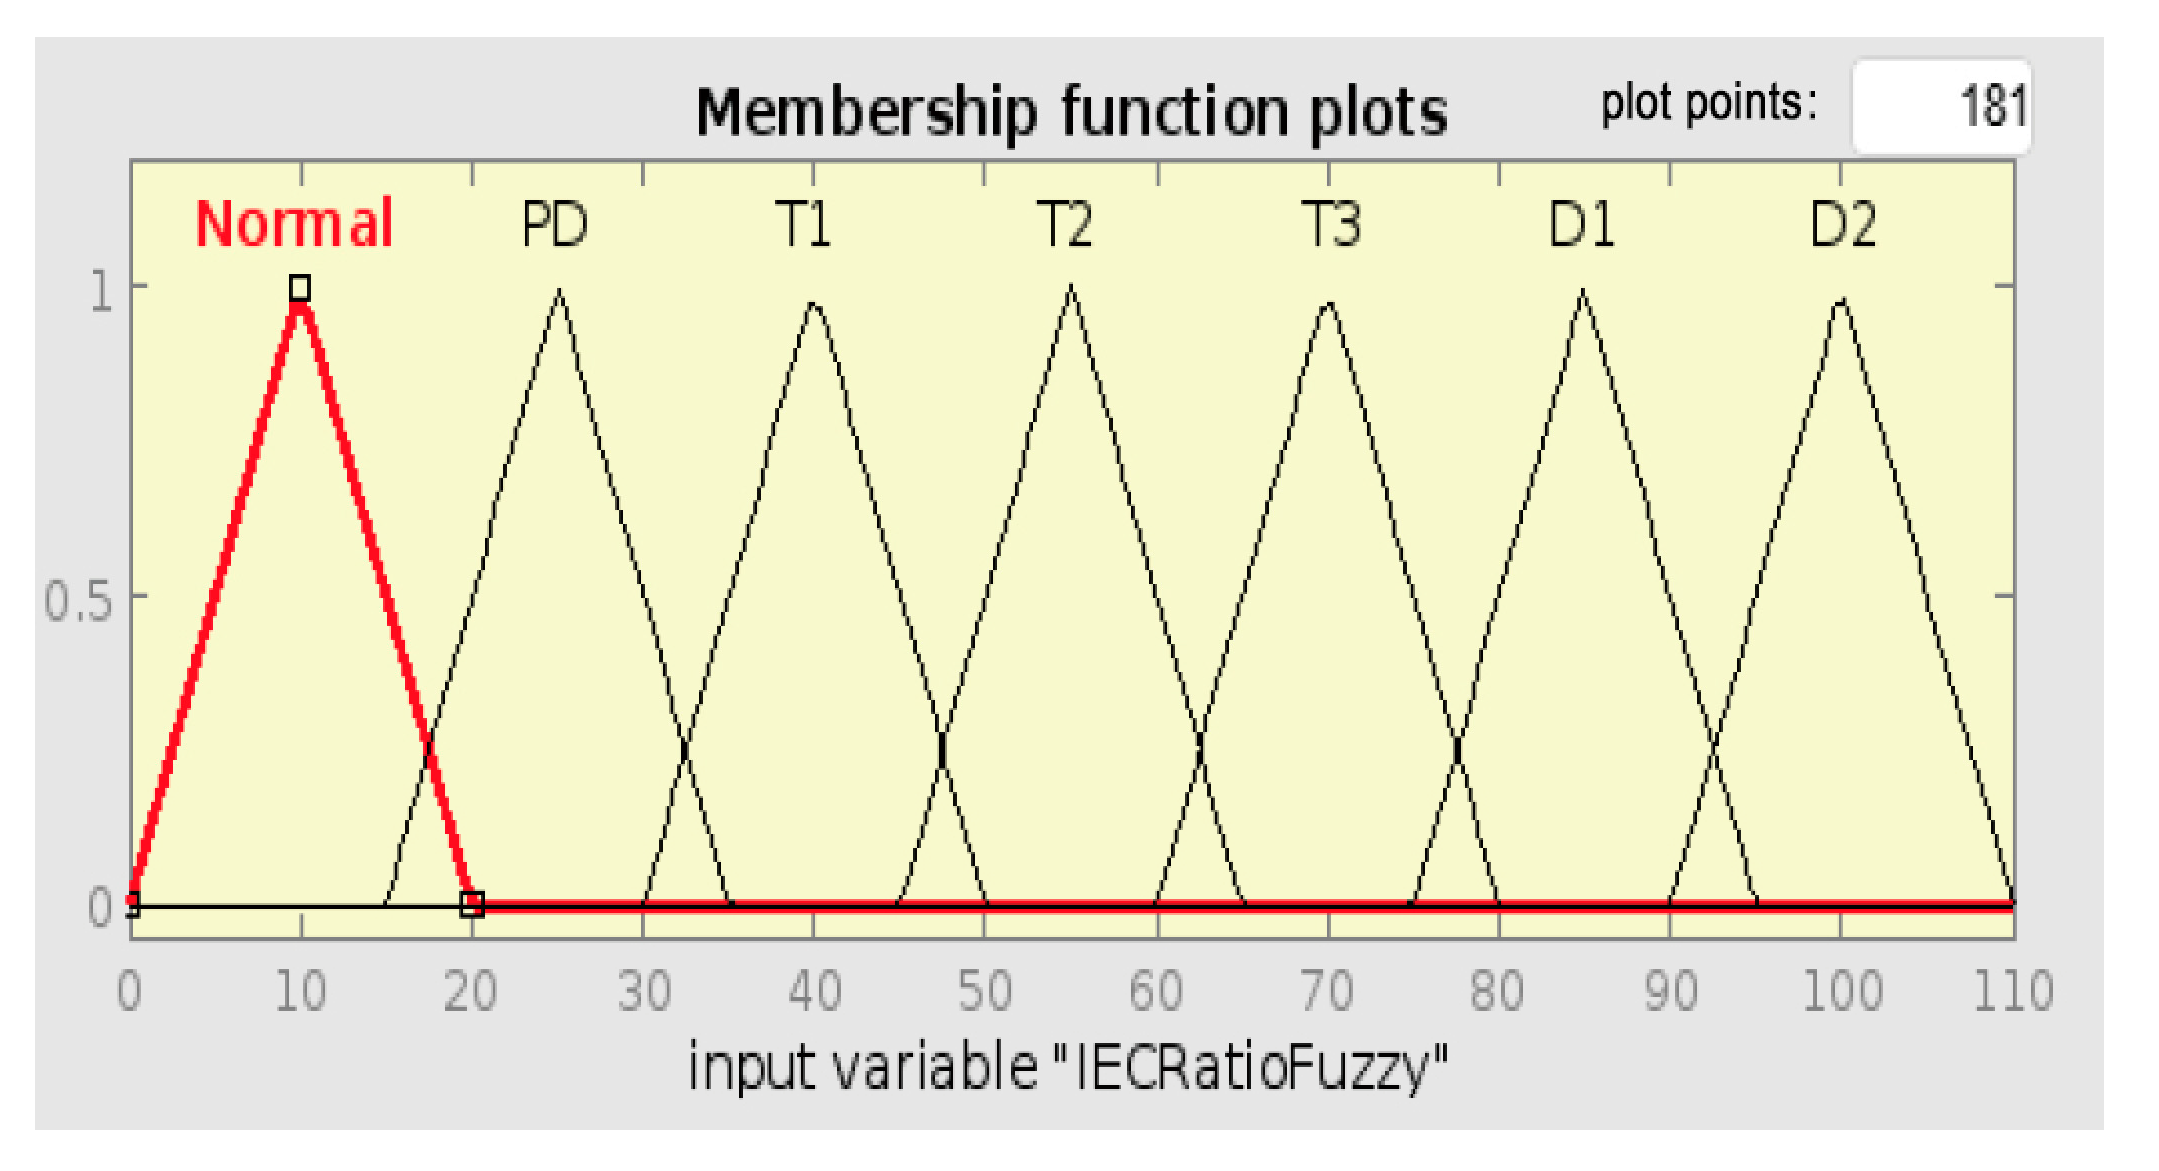
This technique utilizes three very important gas ratios in transformer fault diagnosis, particularly designed for thermal faults [47]. Its usage as a FIS is elaborated in the following subsection. The input ratios C2H2/C2H4, CH4/H2, and C2H4/C2H6 are the inputs whose membership functions are expressed as functions of the codes and ranges of Table 10. Fuzzy rules, derived from the fault conditions of Table 11, relate these input ratios to like fault diagnoses. MFs for the input ratios listed below are depicted in Figure 16, Figure 17 and Figure 18, and output fault type membership functions are depicted in Figure 19. The step-by-step process for this method is illustrated in Figure 20 below.
Table 10 presents the classification scheme of the IEC ratio method. Every input gas ratio is split into fuzzy intensity classes and assigned numerical codes. The codes are utilized by the fuzzy model to tag the input situations and build suitable fuzzy rules.
The IEC ratio method classifies the transformer faults based on combinations of the three gas ratios. Table 11 below presents the various diagnostic conditions on the basis of some ranges for these gas ratios. This table is used for constructing the fuzzy rule set for the IEC ratio FIS.
Similarly to Rogers Ratio method, to develop a fuzzy logic system for the IEC ratio method, the input variables are the gas ratios CH4/H2 (i), C2H4/C2H6 (k), and C2H2/C2H4 (l) [49], each classified into MFs such as low, medium, and high based on their defined ranges, as illustrated by Figure 16, Figure 17 and Figure 18, respectively. As represented by Figure 19, the output variable represents the fault diagnosis, including fault types like Normal Deterioration, PD, T1, T2, and T3, and D1 and D2. MFs are created using trapezoidal shapes to represent the gas ratio ranges. Fuzzy rules are then extracted from Table 11, mapping input ranges to specific fault types, for instance, IF (i) is Low AND (k) is Low AND (l) is Low, THEN Fault Type is Normal Deterioration.
A similar FIS as that of the Roger’s Ratio method used to develop the rules was also used to derive the fuzzy rules of the IEC ratio method.

5.4. Duval Triangle Method

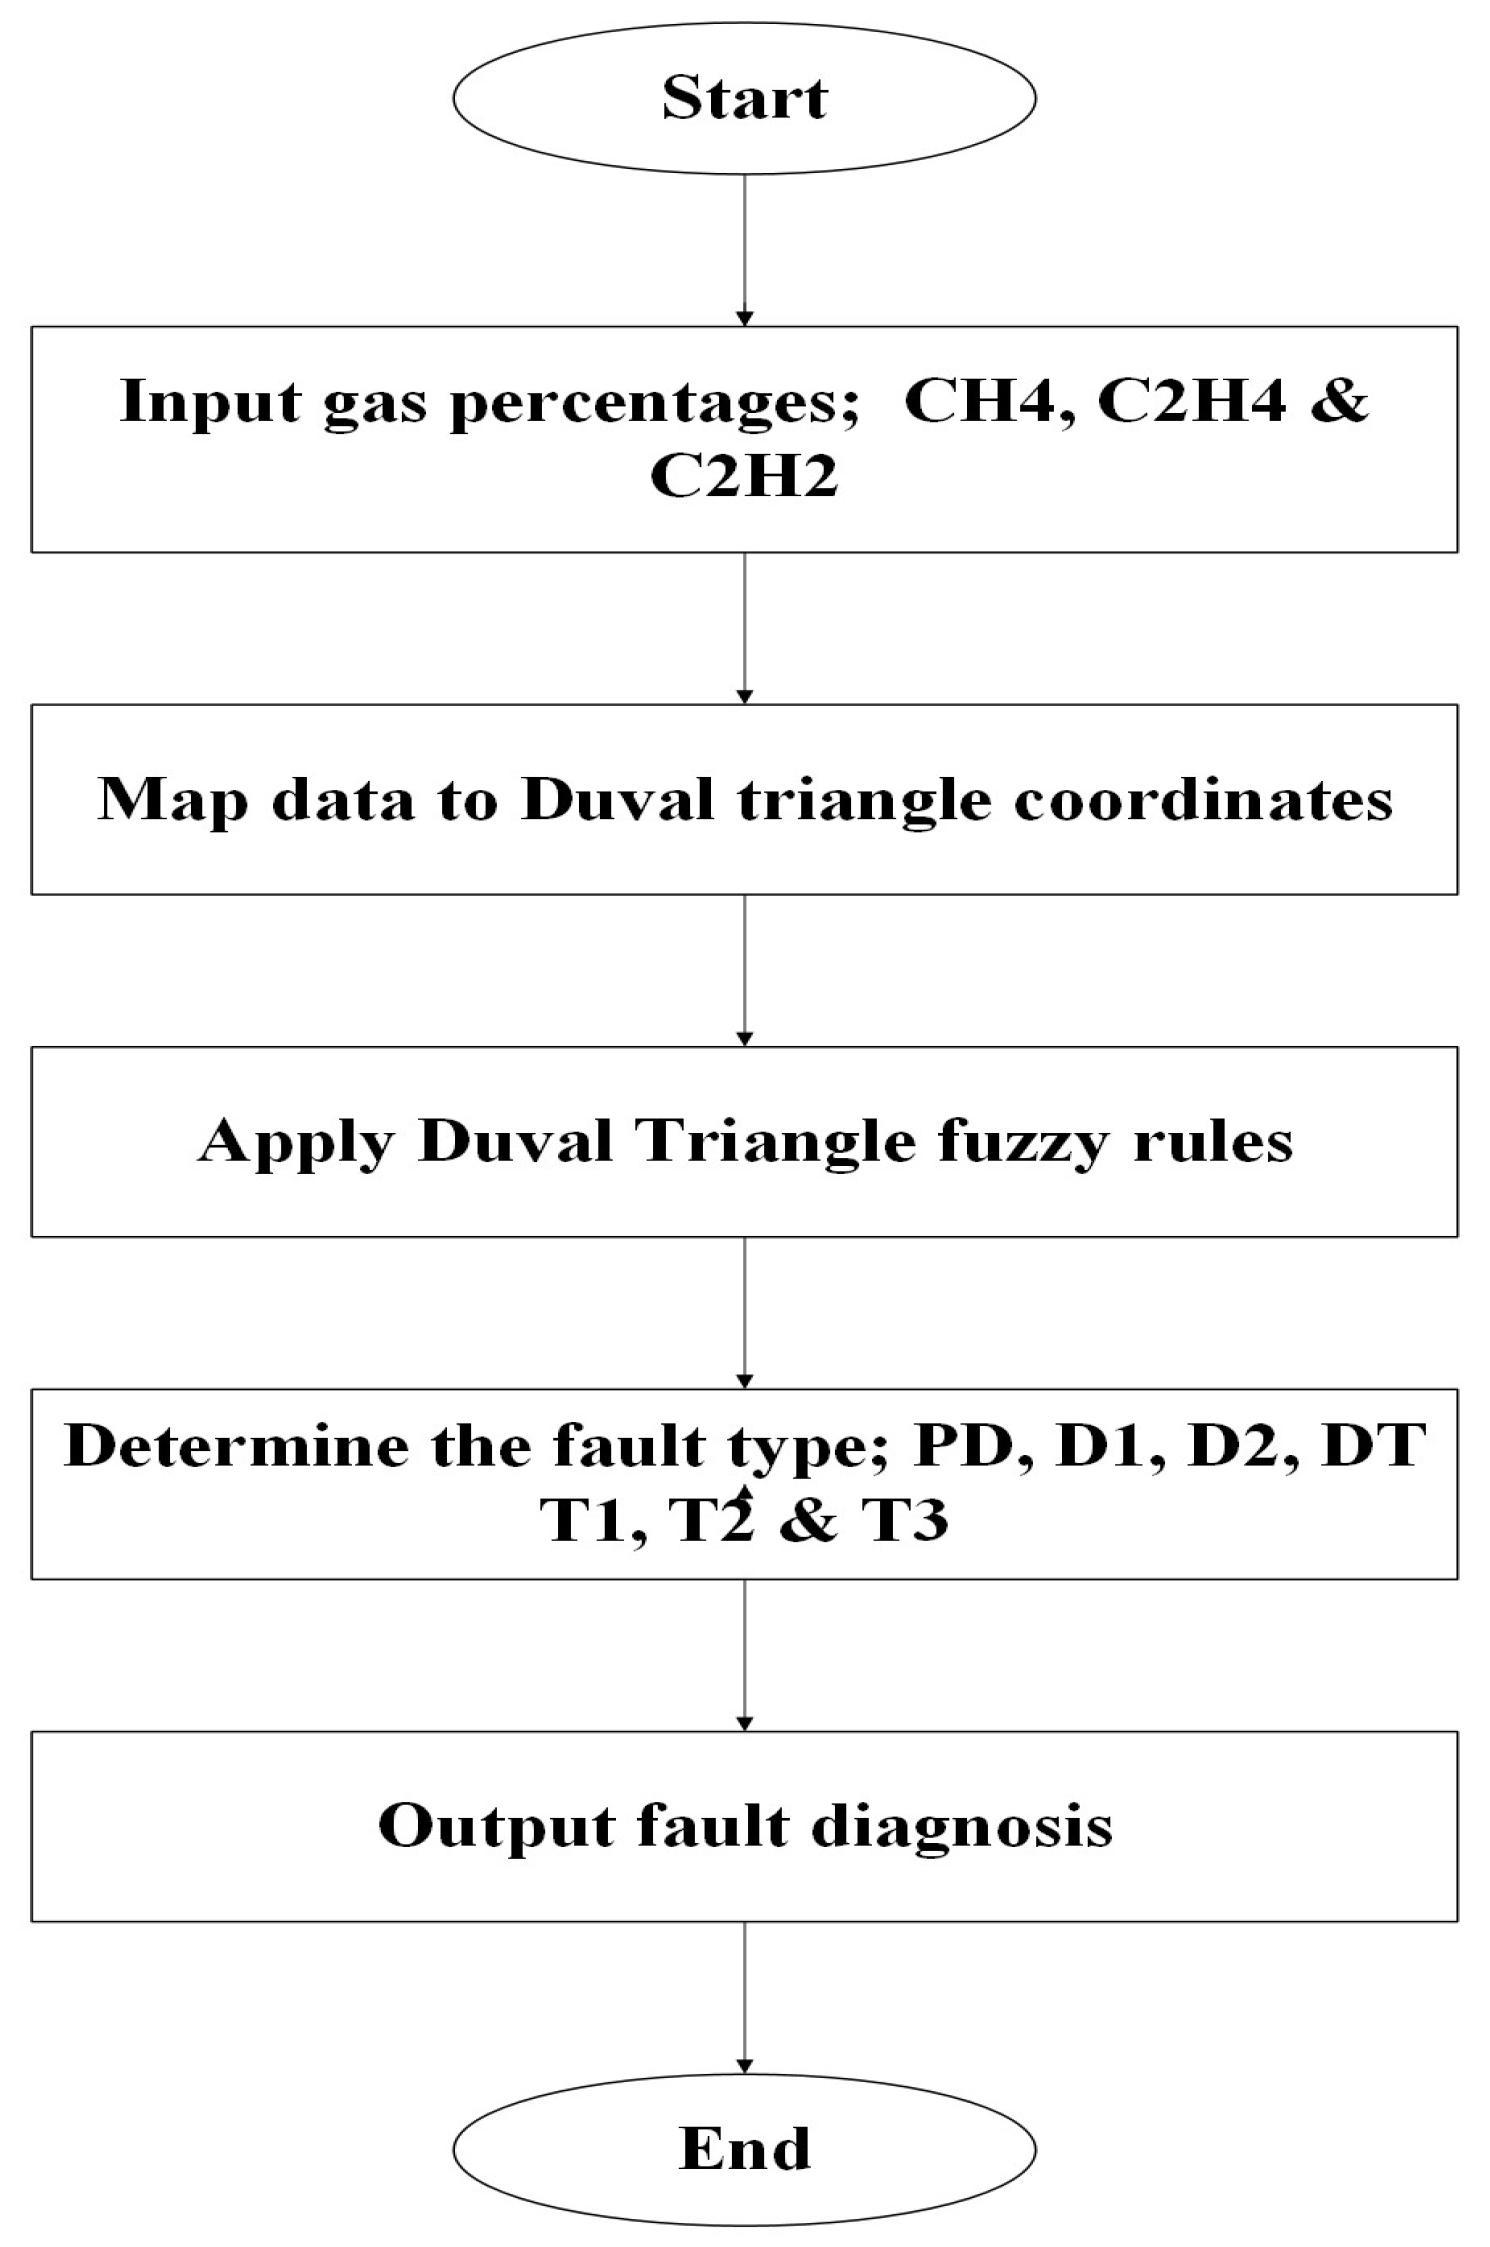
Duval Triangle has three gases percentage or CH4, C2H4, and C2H2 [44] that are converted into an FL controller with three inputs, each of which is subdivided into MFs as needed to achieve the method rules and one output with four MFs describing fault types. The sequence of this method is illustrated in Figure 21 below.

5.4.1. Duval Triangle Fault Zones Coordinates

Distinct fault zones in a Duval Triangle may be classified into seven different categories. The four D1 points, D11, D12, D13, and D14, that comprise the D1 zone’s corners are listed, as shown in Figure 22 below. The percentage values of CH4, C2H4, and C2H2 are used to describe each point, such as D11 [48]. All of the Duval Triangle’s zone points are depicted in the diagram below. Certain zones, like D12 and D21 of D1 and D2, have a common point.
Table 12 presents the coordinate values of %CH4, %C2H4, and %C2H2 used to map gas concentrations on the Duval Triangle. These coordinates represent the graphical input data for fuzzy analysis under the Duval method and help determine fault zones based on gas composition ratios.

5.4.2. Fault Zone Mapping

Table 13 below provides coordinate values for %CH4, %C2H4, and %C2H2 used to plot gas concentrations on the Duval Triangle. The coordinates are required to graphically depict and validate Duval Triangle FIS logic and are used in Figure 22 to plot fault zones.
Table 14 below indicates the percentage ranges (%CH4, %C2H4, and %C2H2) used in the Duval Triangle method. The ranges are essential in the calculation of fuzzy membership functions and computing triangle coordinates for graphical fault zone mapping.
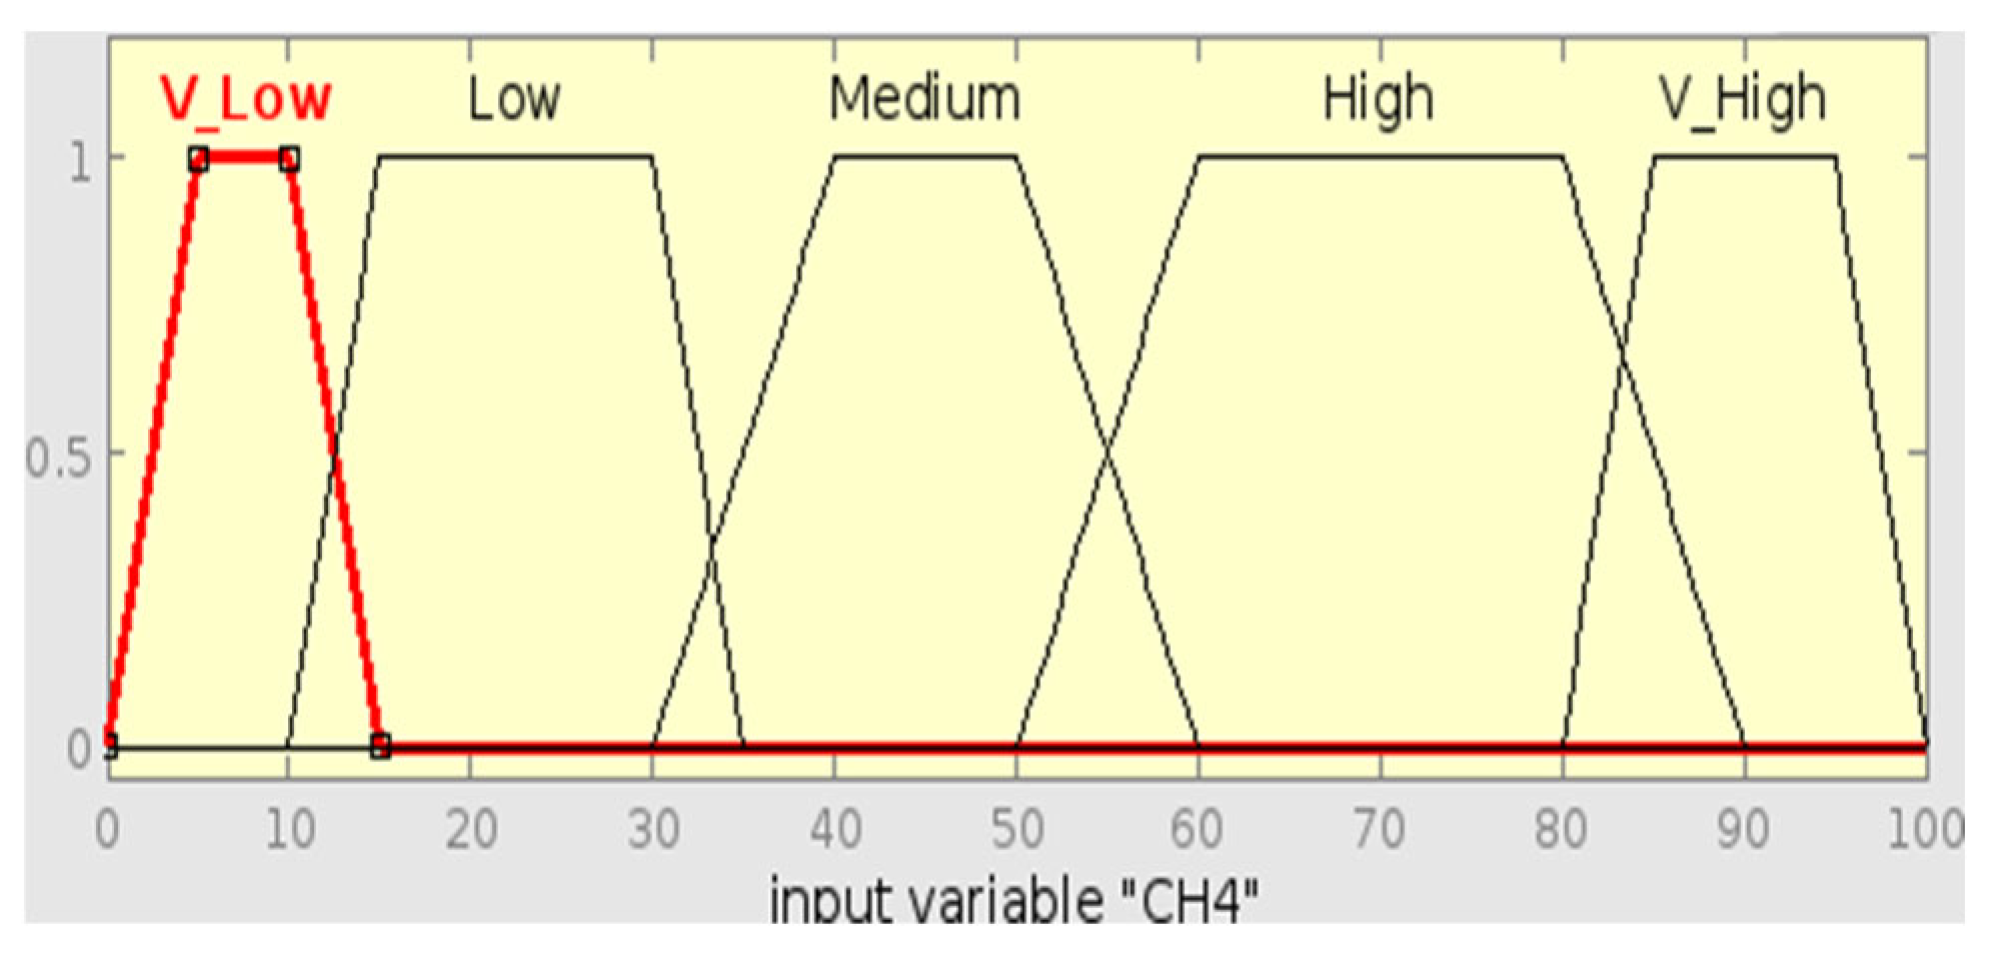
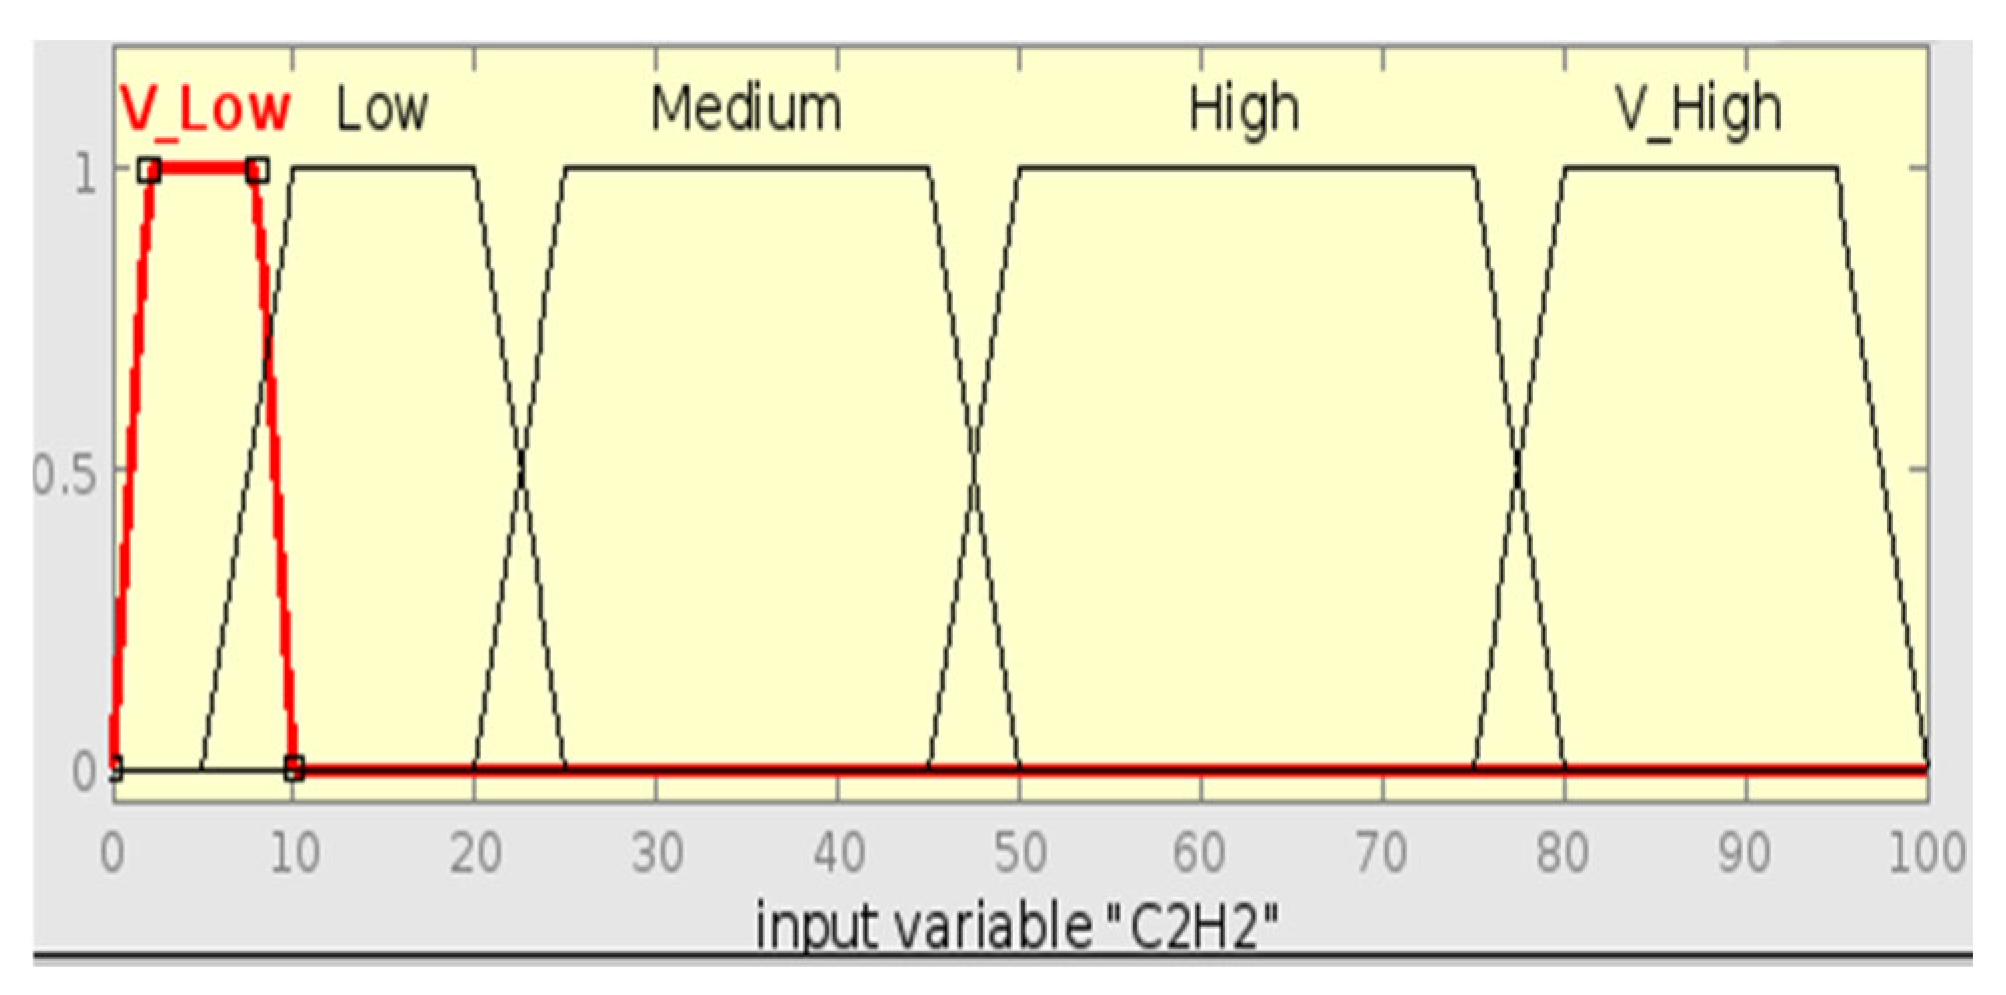
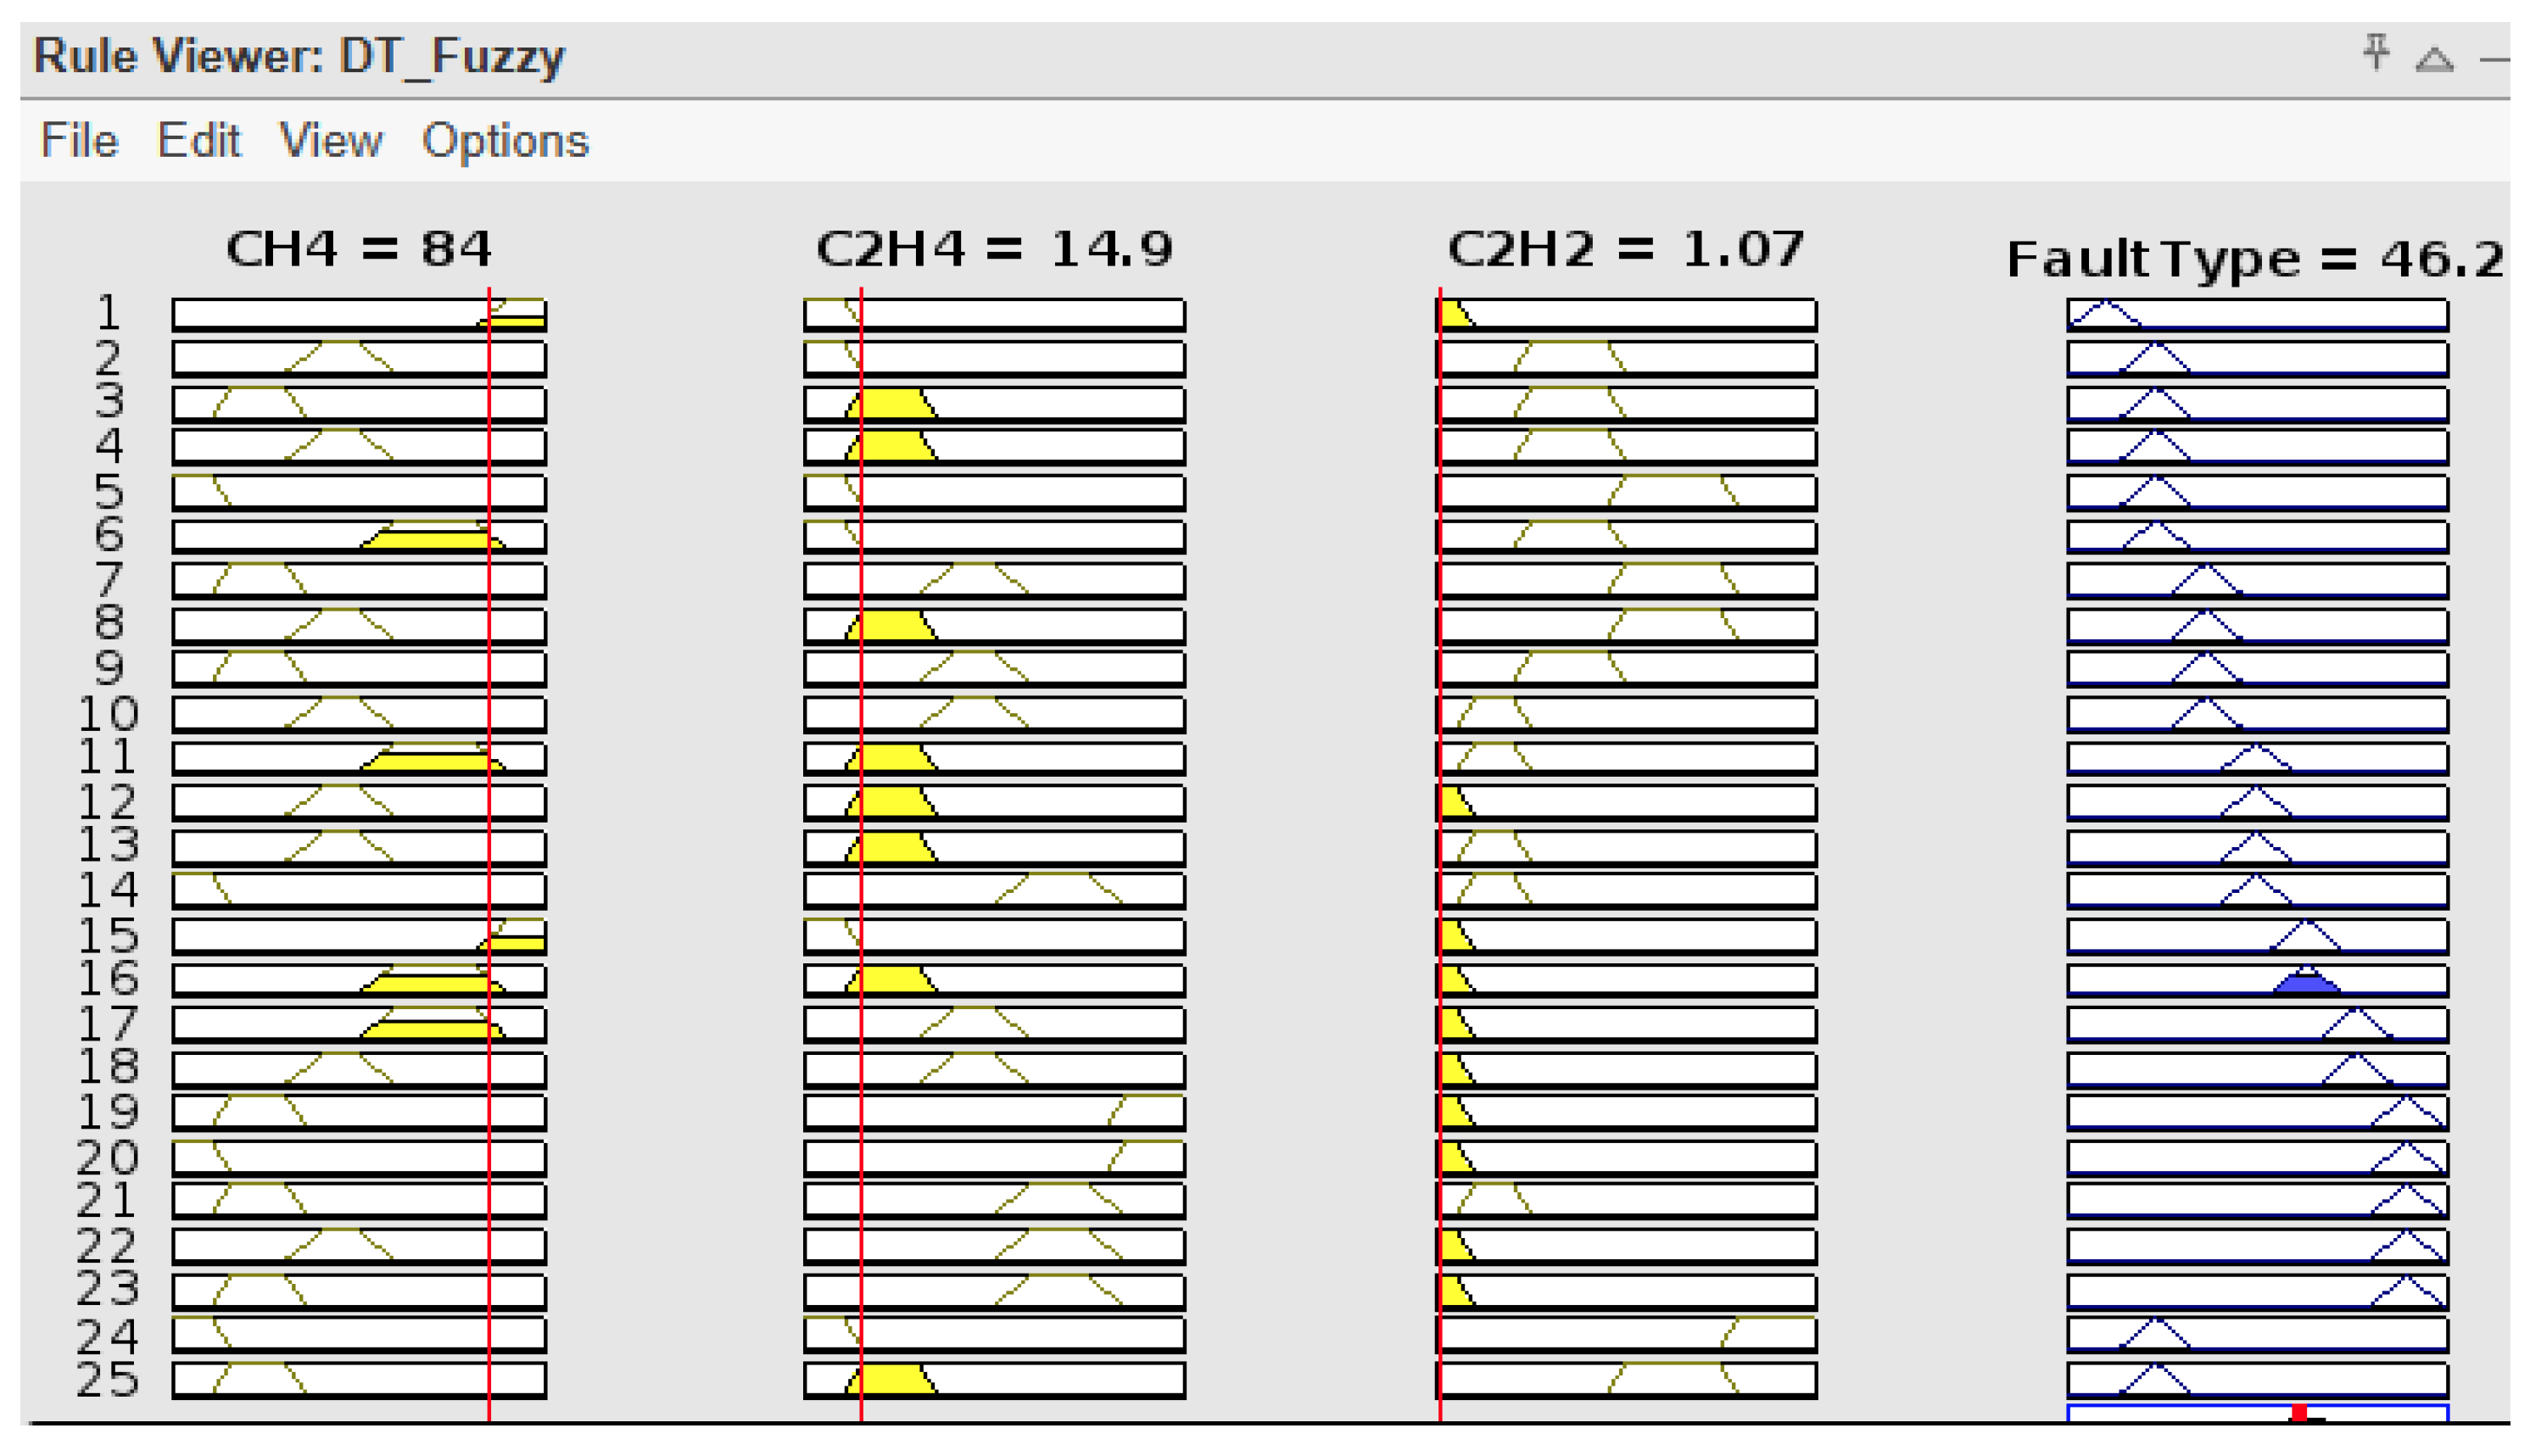
The implementation of a fuzzy logic system for the Duval Triangle method begins with analyzing the gas percentages, which are then used to determine fault zones such as PD, D1, D2, DT (low-temperature thermal fault), T1, T2, and T3. Tables and figures play a critical role in this process. Table 14 provides the percentage ranges of each gas that correspond to specific fault zones, forming the basis for defining input membership functions. It also maps these gas ranges to their respective fault zones, enabling the generation of fuzzy rules. Figure 22 offers a visual representation of the geometric boundaries of fault zones, validating the percentage ranges and ensuring the MFs align accurately. The input variables are defined as the gas percentages, with MFs such as very low, low, medium, high, and very high, as displayed in Figure 23, Figure 24 and Figure 25 below. The output variable is the fault diagnosis, represented by the fault zones, as shown in Figure 26 below. About 24 Fuzzy rules are then constructed using Table 13 and Table 14 to map gas ranges to fault types.
Fuzzy rules were developed using the IF-THEN rule-based system, using the AND operator to obtain the results of the Duval Triangle fuzzy inference system.

5.5. Proposed Integrated DGA Fuzzy Logic System

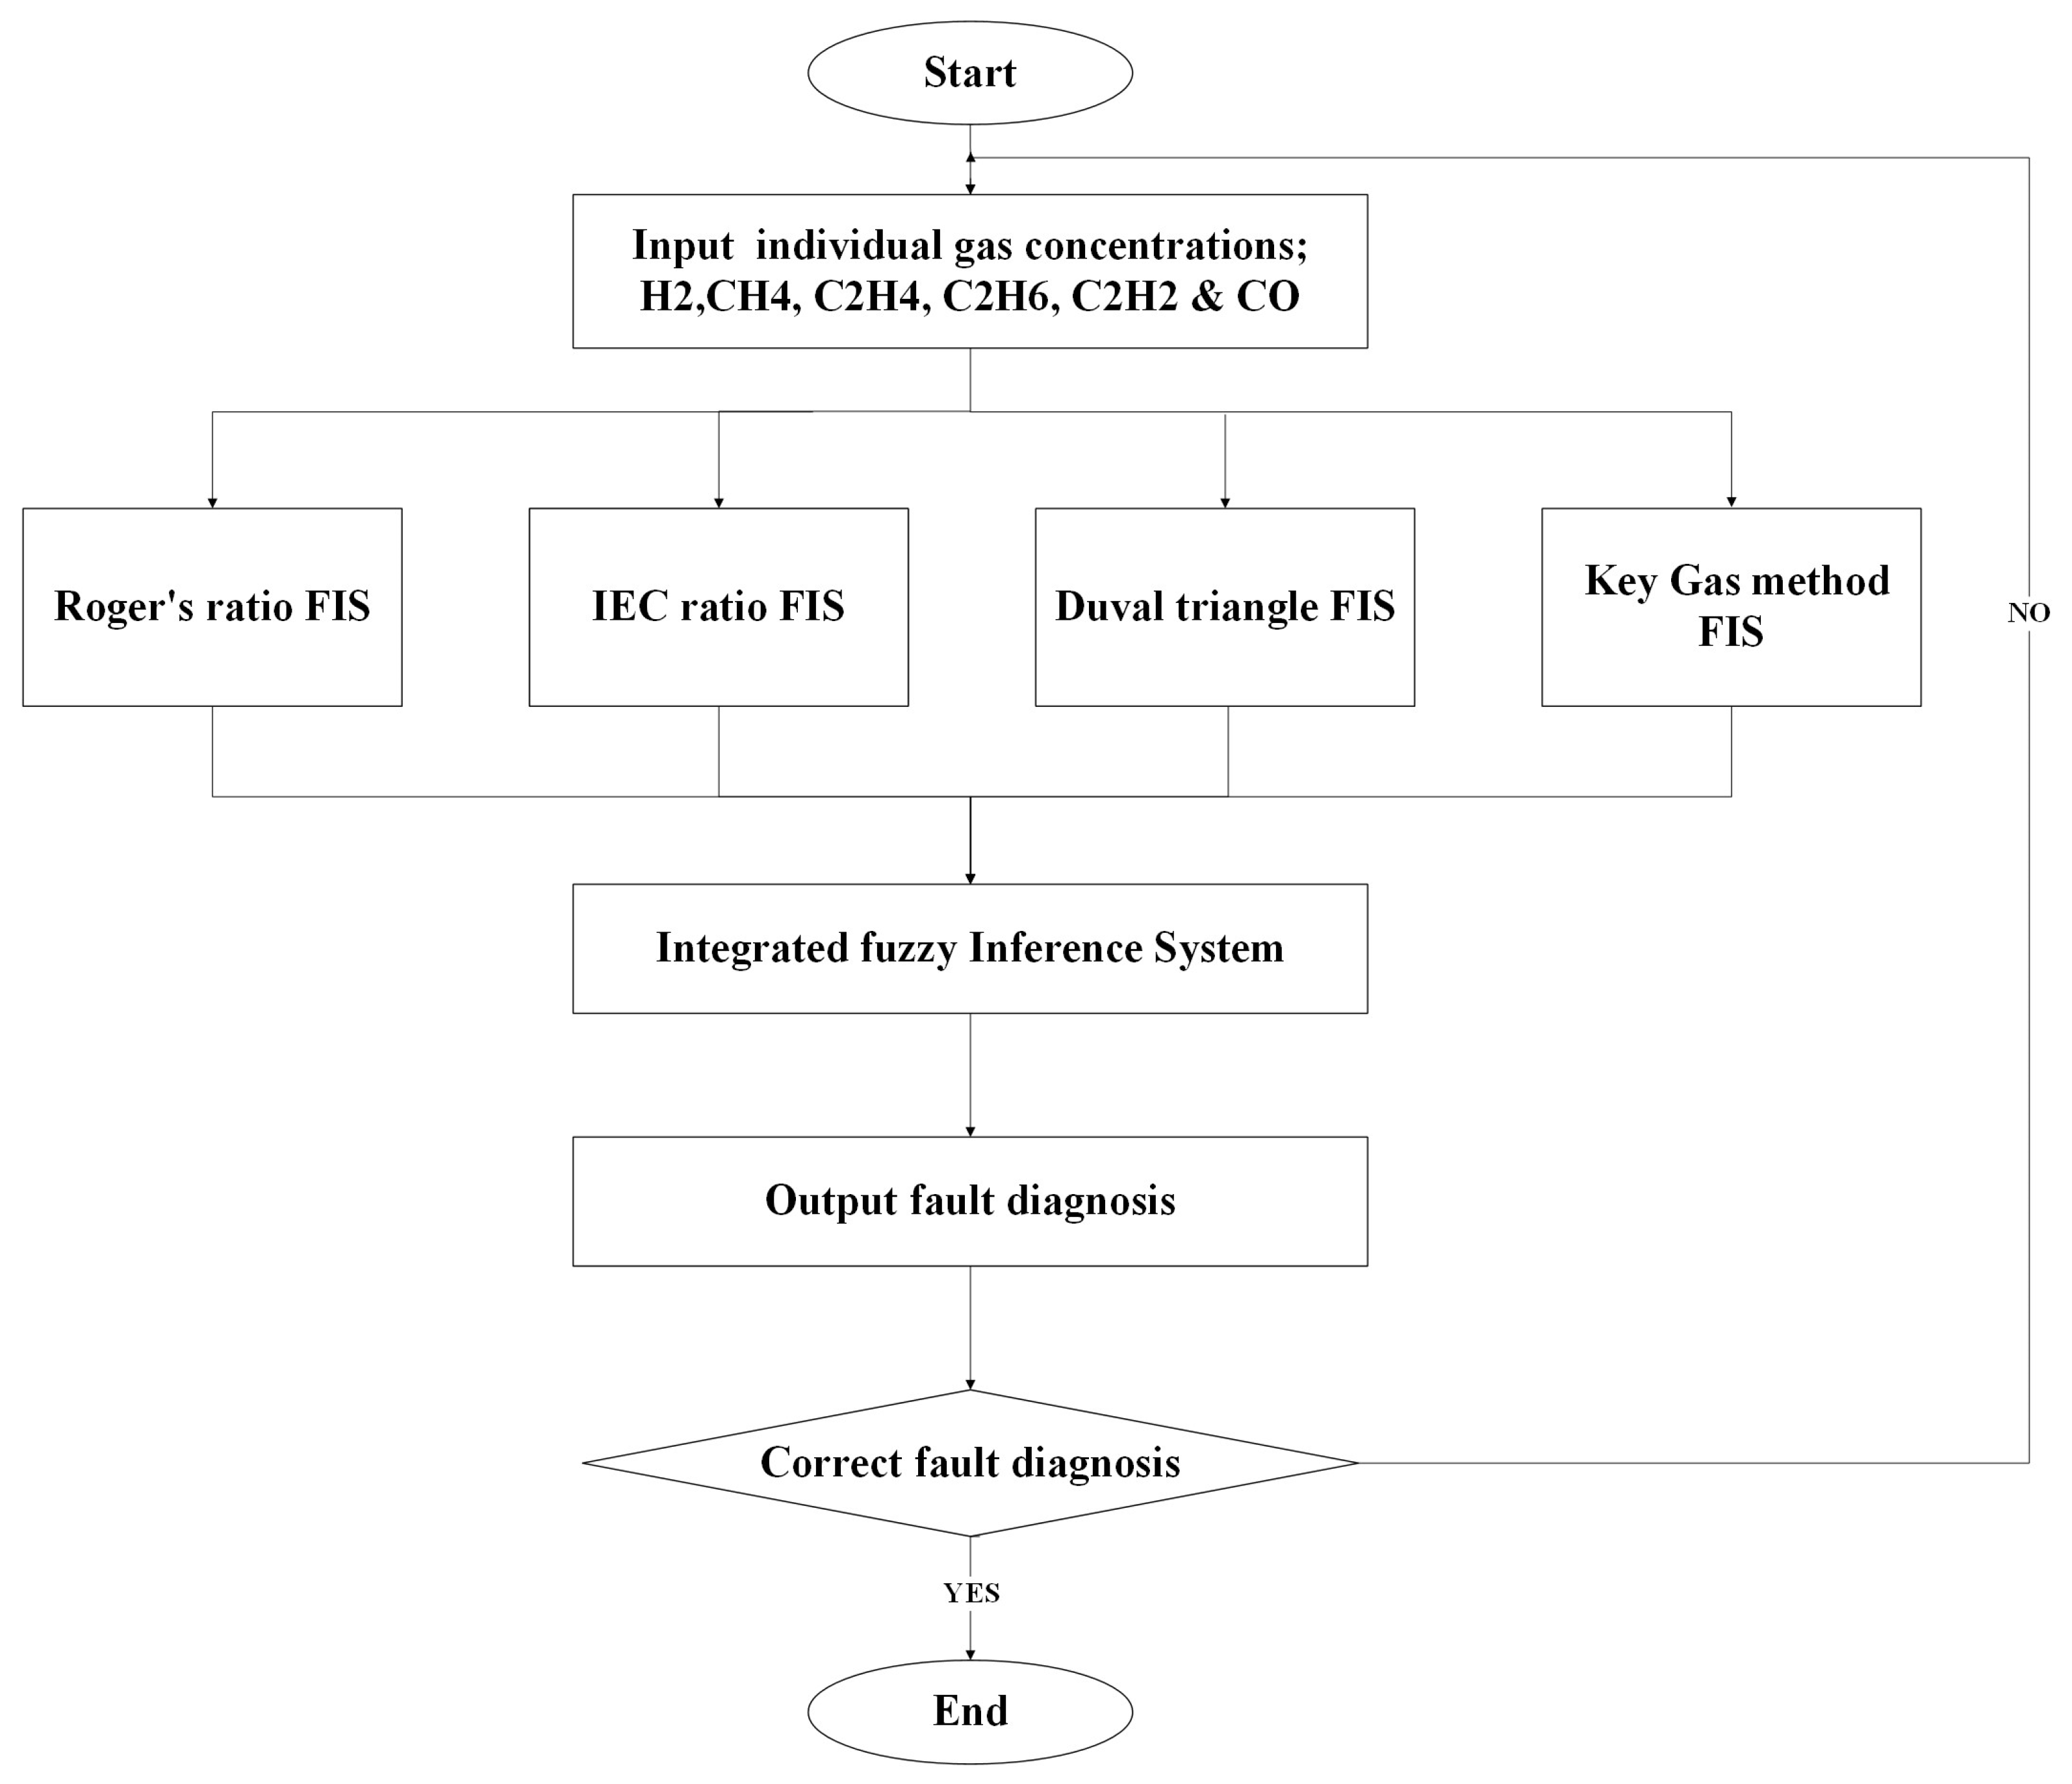
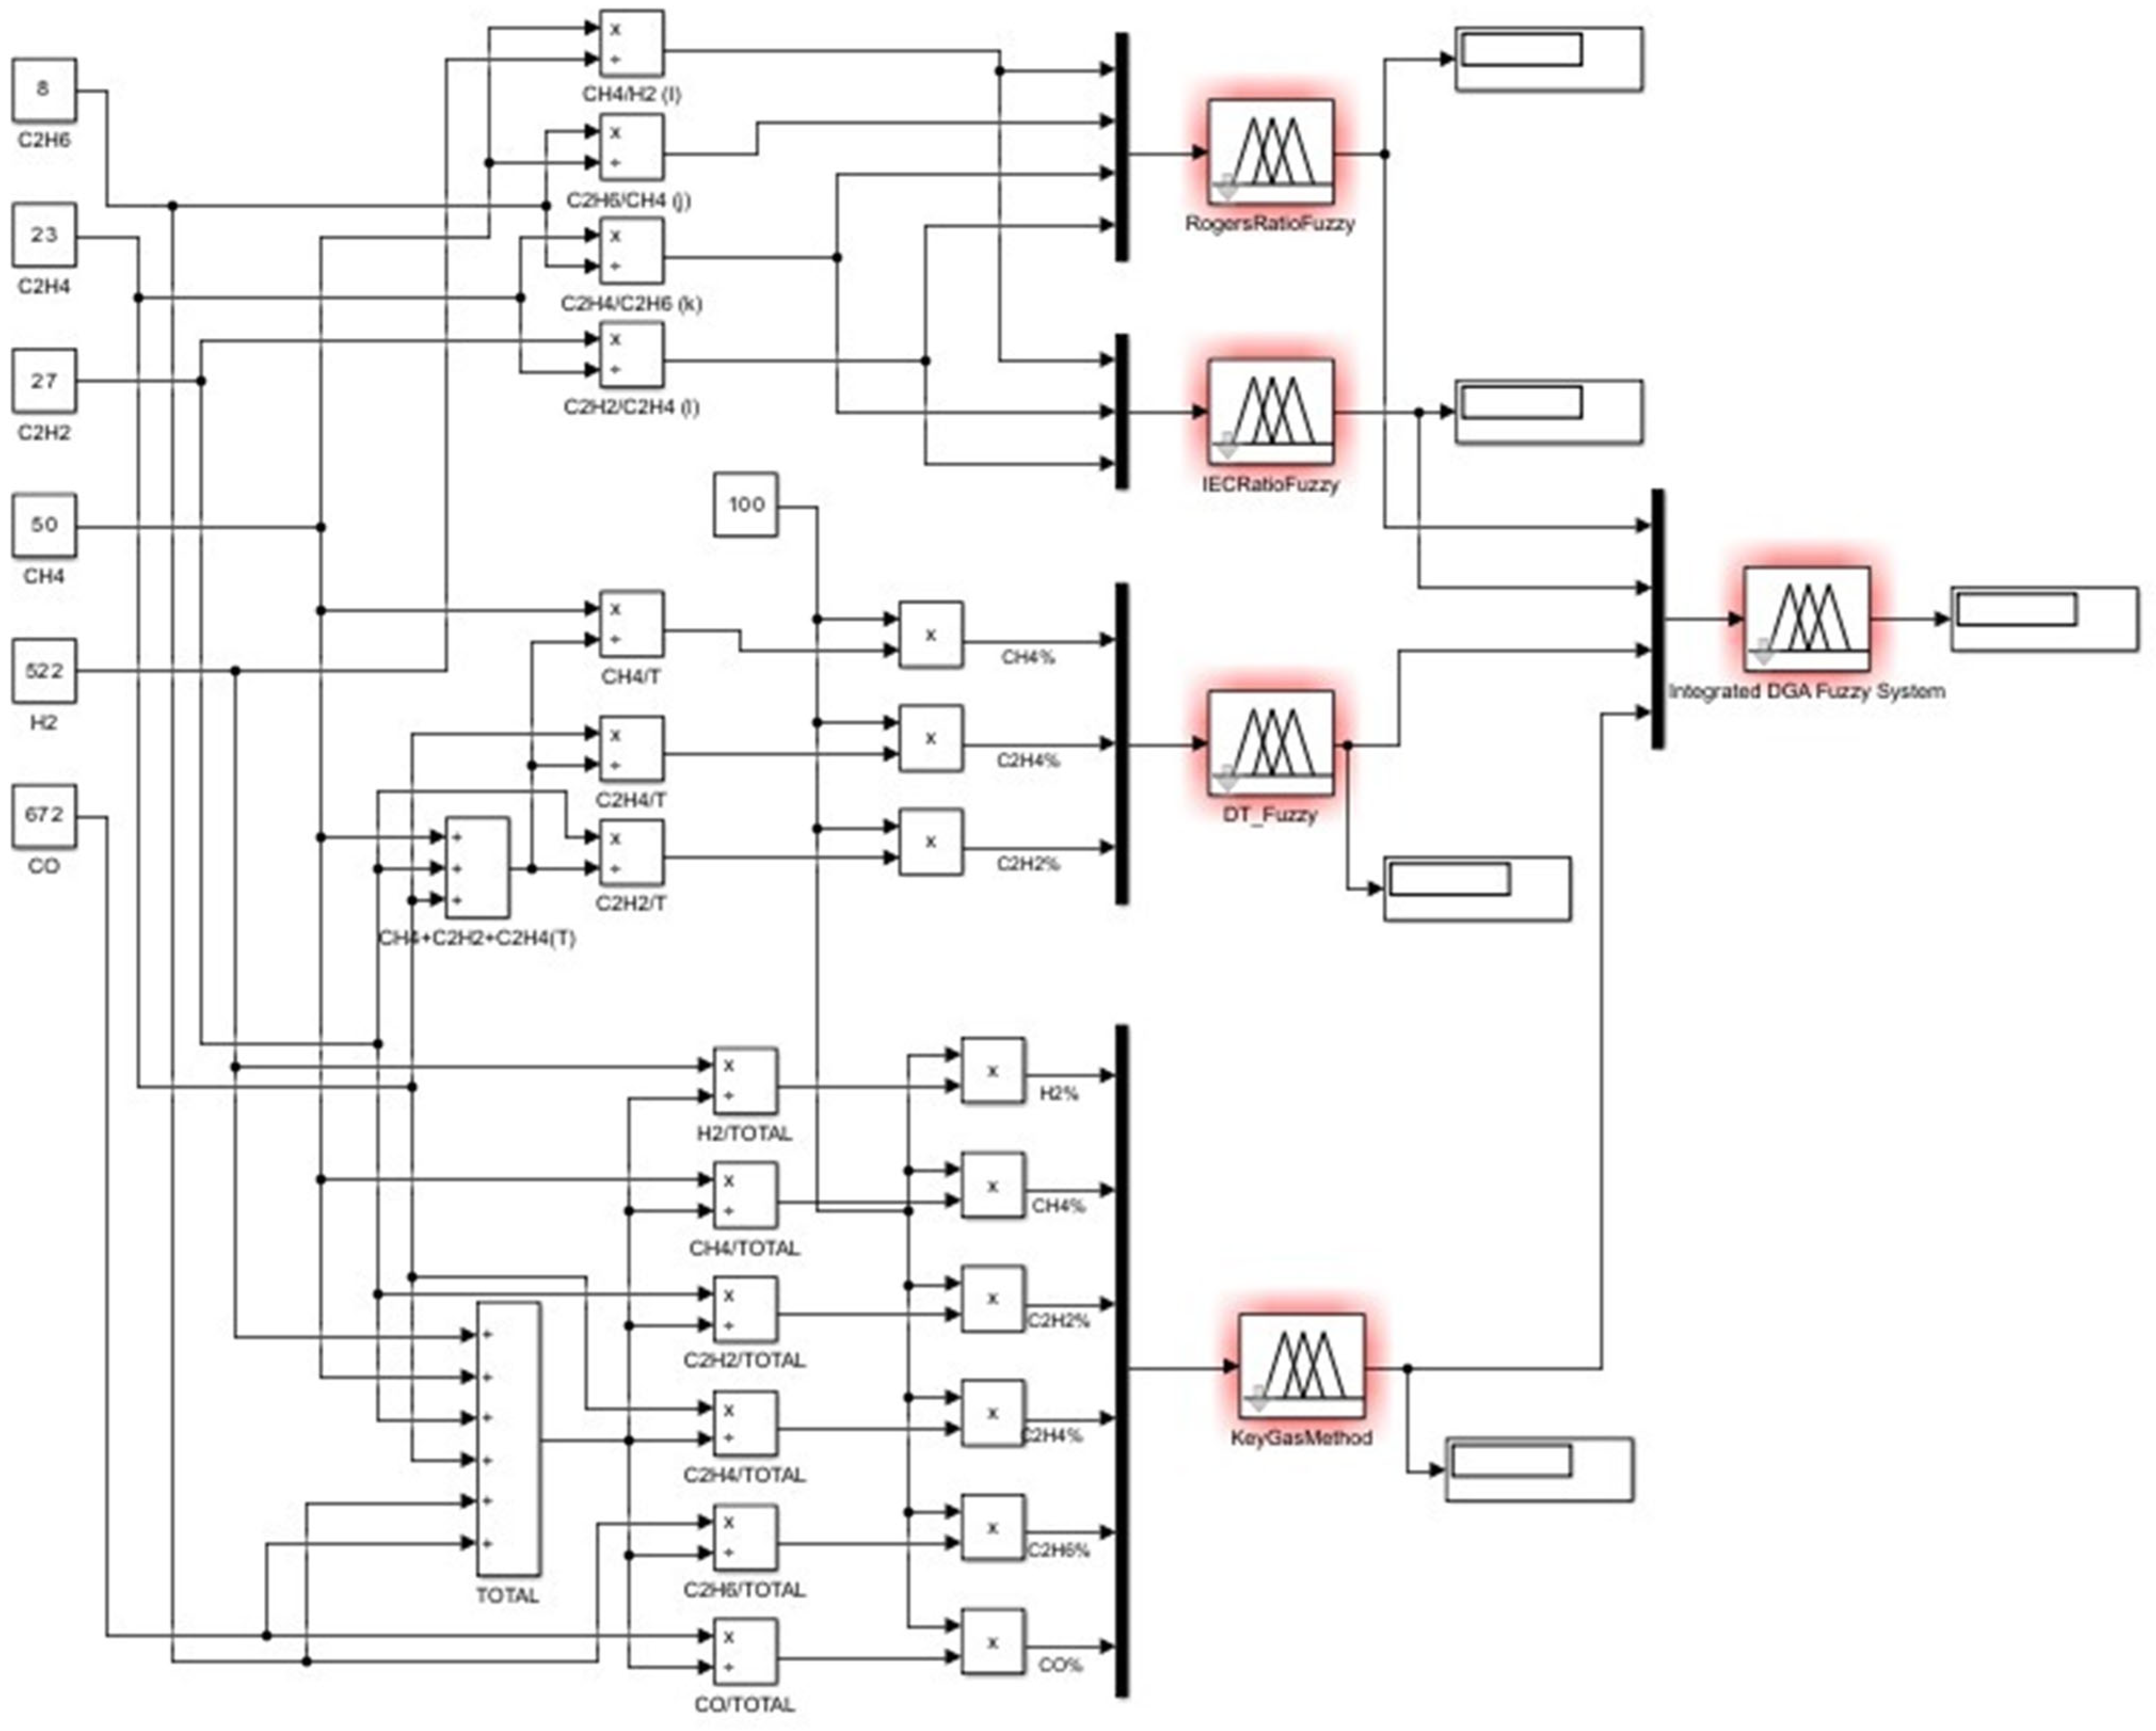
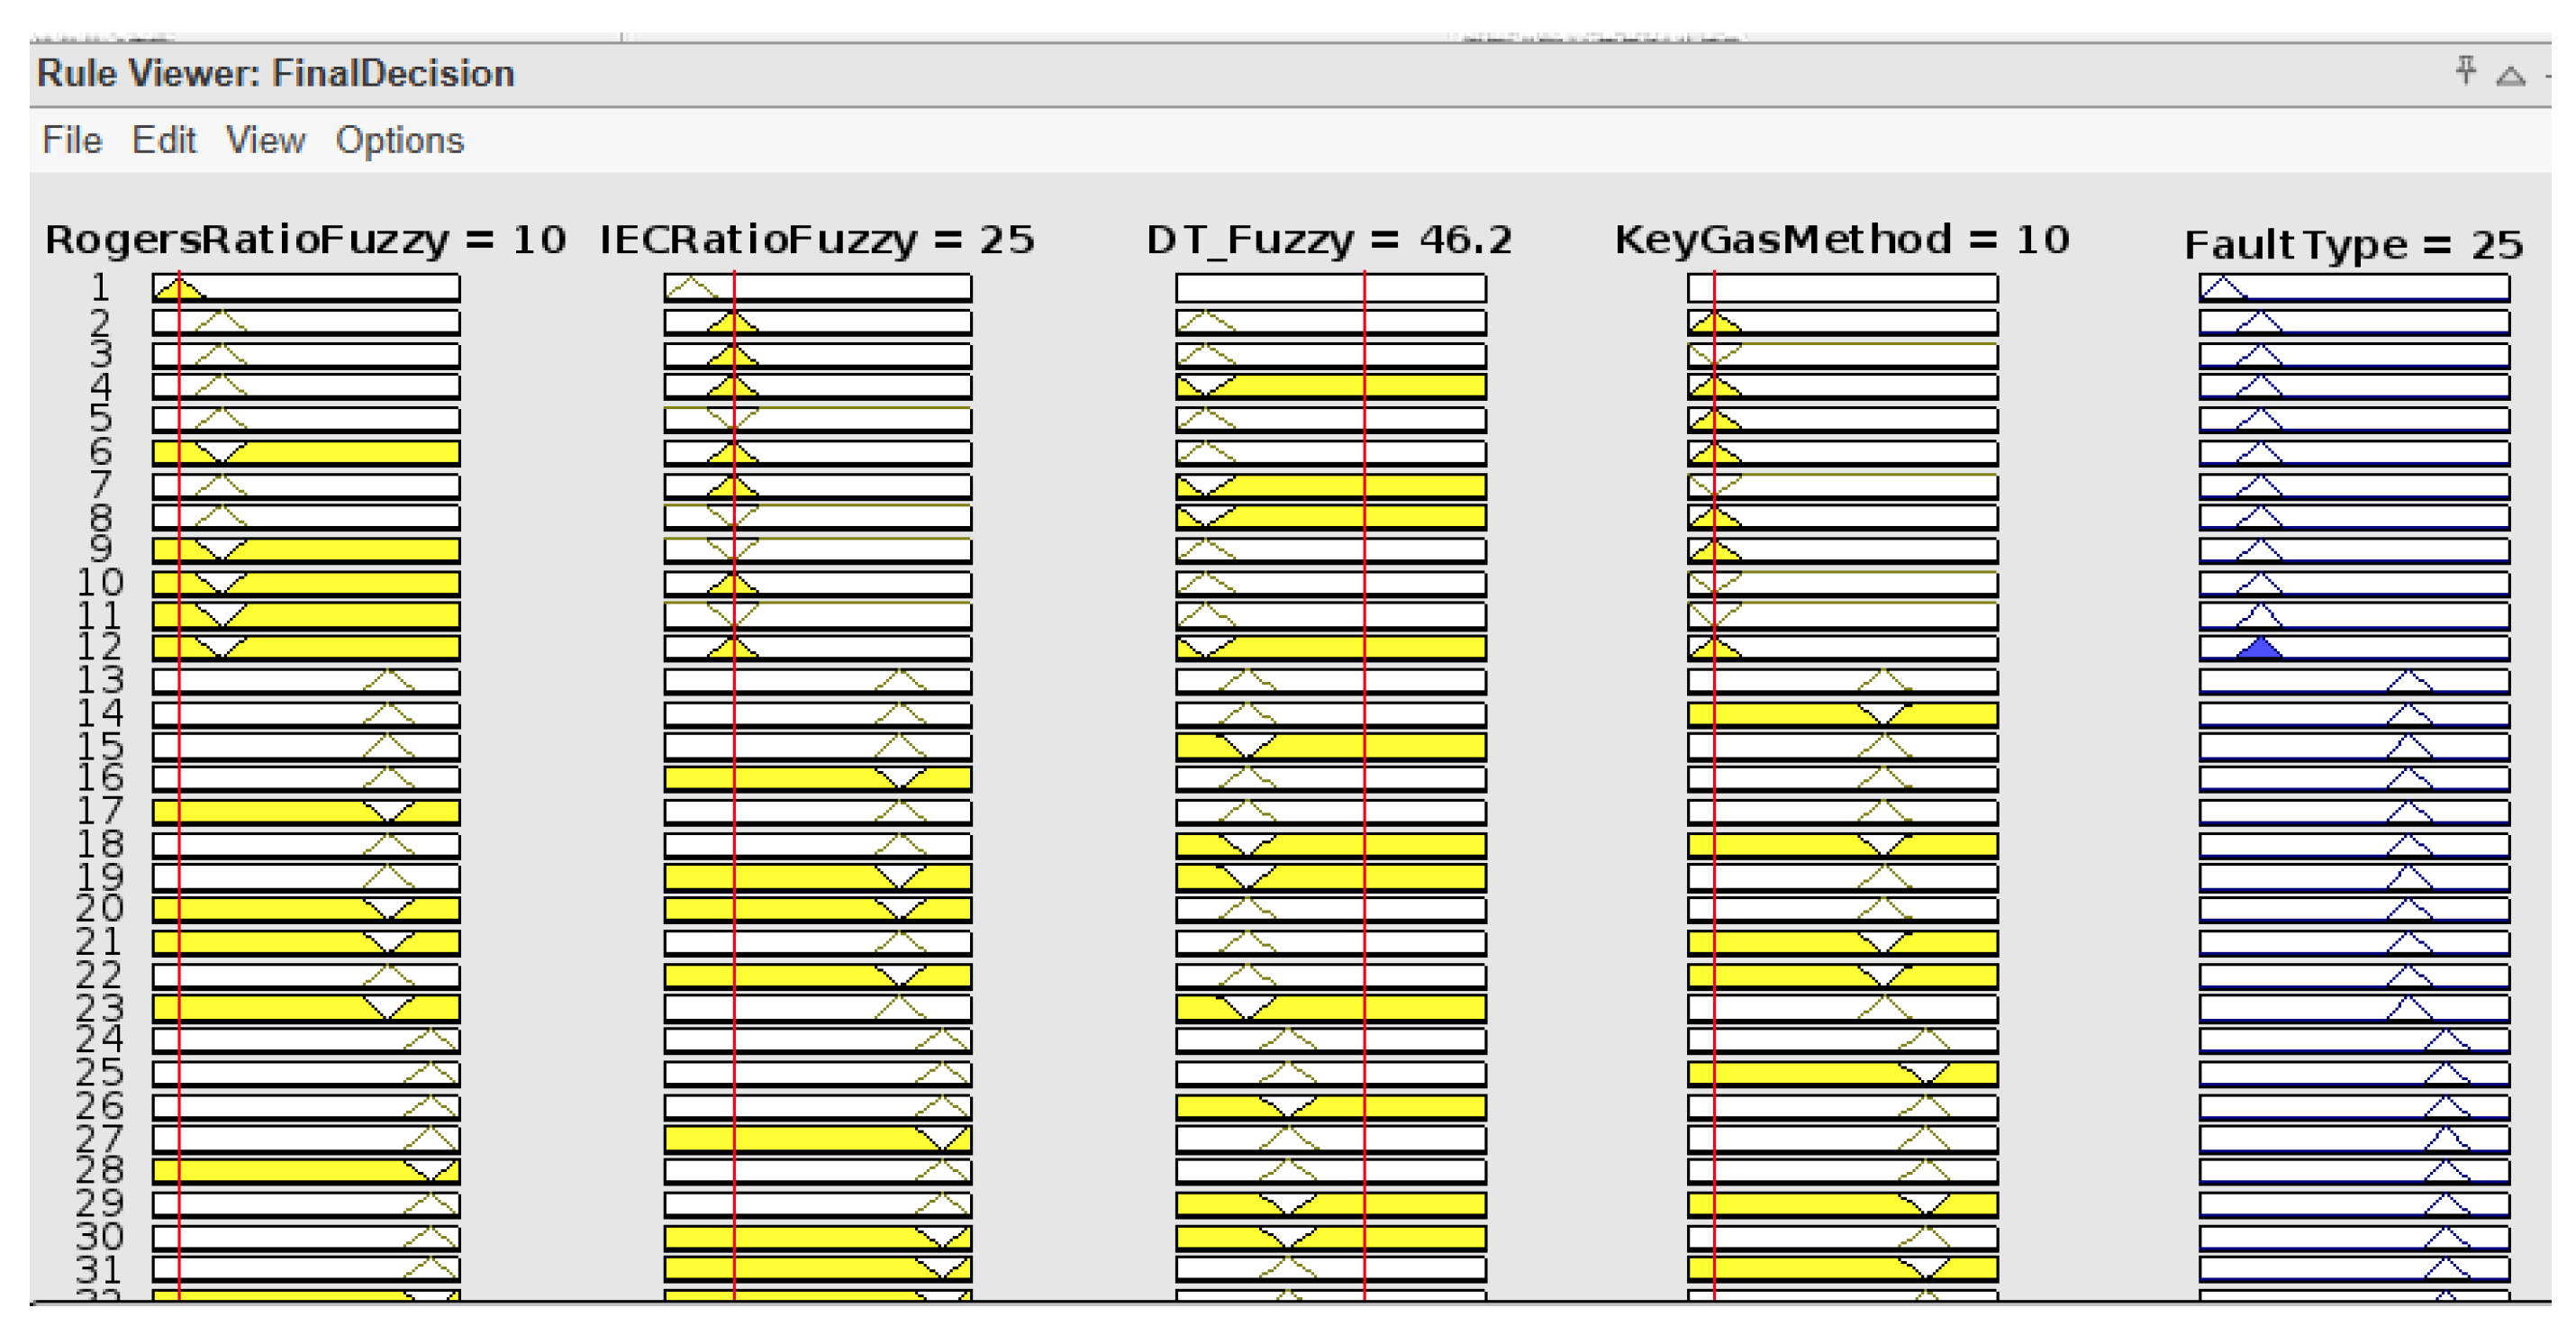
A new fuzzy logic system that combines the outputs of the Key gas technique, Rogers Ratio, IEC ratio, and Duval Triangle FISs is developed in order to improve the diagnostic accuracy of DGA for transformer problem identification. The flowchart in Figure 27 below depicts this system. By employing their fuzzy outputs as inputs to a higher-level integrated fuzzy system, this technique mitigates the drawbacks of each of these traditional methods while utilizing the complementary benefits of the four. Each of these approaches has advantages and disadvantages when used alone. Their outputs are used as inputs to the new fuzzy system called Final Decision, as shown by Figure 28, Figure 29, Figure 30 and Figure 31 below. Then the output MFs of the FIS are shown in Figure 32 below. The integrated system develops diagnostic insights from the four methods used, ensuring a more robust and reliable fault diagnosis. This comprehensive framework is intended to improve fault identification and severity assessment, offering more accurate recommendations for maintenance and operational decisions. The systems will be integrated using Matlab Simulink 2024b version blocks, as shown in Figure 33 below. This integrated system has about 100 fuzzy rules developed to make the final decision. These rules were developed based on a majority basis from the four individual FISs. Below is a sample of the rules used in the proposed integrated DGA FIS.
A.
Rule 1: If Roger’s Ratio is normal and the IEC ratio is normal, then the fault type is normal.
B.
Rule 3: If Roger’s Ratio is PD and the IEC ratio is PD, and the Duval Triangle is not PD, and the Key Gas Method is PD, then the fault type is PD.
C.
Rule 14: If Roger’s Ratio is D1, and the IEC ratio is D1, and the Duval Triangle is D1, and the Key Gas Method is not D1, then the fault type is D1.
D.
Rule 27: If Roger’s Ratio is D2 and the IEC ratio is not D2, and the Duval Triangle is D2 and the Key Gas Method is D2, then the fault type is D2.
E.
Rule 43: If Roger’s Ratio is not T1, and the IEC ratio is T1, and the Duval Triangle is T1, and the Key Gas Method is not T1, then the fault type is T1.
F.
Rule 56: If Roger’s Ratio is not T2 and the IEC ratio is not T2, and the Duval Triangle is T2, and the Key Gas Method is T2, then the fault type is T2.
G.
Rule 63: If Roger’s Ratio is T3 and the IEC ratio is not T3, and the Duval Triangle is T3 and the Key Gas Method is not T3, then the fault type is T3.
Figure 33 represents the complete Simulink block diagram of the integrated DGA fuzzy logic system developed in this work. Using the four FISs of the traditional techniques, the system integrates the outputs of the separate fuzzy models into a single diagnostic system. Each of the subsystems accepts input gas data and contributes a fuzzy inference output that is ultimately combined in the integration layer. The Simulink model presents graphically the behavior of such systems interacting in real time to provide a consolidated and highly precise fault classification of the transformer. It also brings out the modular and scalable nature, which simplifies the task of altering or adding more diagnostic logic in the future.

6. Results and Discussion

Taking some samples of gas concentrations of the seven key gases. The oil samples used are of known fault types collected from high voltage transformers. The concentrations were analyzed using the four developed individual fuzzy logic models, whose outputs are collectively analyzed by the integrated DGA fuzzy logic system for the final decision on the fault diagnosis. For instance, the following concentrations in ppm were used for the system, and Table 15 below displays the results.
Table 16 below is a comparison table of diagnostic results from each individual fuzzy logic system with the output result of the integrated fuzzy logic system proposed. For each oil sample, the known fault is noted and compared with each individual method’s prediction. This table shows the performance of each stand-alone system in identifying individual transformer faults, and more importantly, shows the effectiveness of the integrated system in compiling these results into a more robust and consistent final diagnosis. The integrated method exploits the strengths of all four approaches to synthesize discordant results and maximize the overall accuracy of fault identification, as shown by its agreement with known fault types on a wide range of samples.
The following figures provide a detailed example of how each individual fuzzy logic system interprets the same oil sample (Sample 15) shown in Rule Viewer and how their outputs compare to the known fault. In this case, the actual fault is PD.
The actual discharge fault was not detected by the Rogers Ratio system, which mistakenly reported it as normal. The Duval Triangle system reported T1 (thermal fault), i.e., a thermal fault, because it is highly sensitive to ethylene concentration, whereas the IEC ratio method reported it as PD correctly. The high hydrogen concentration agreed with the correct report of PD by the Key Gas Method. Finally, the integrated fuzzy logic system demonstrated its higher ability to settle on conflicting diagnoses and agreed with the actual type of fault by appropriately establishing PD through fusing the individual outputs. This indicates that the integrated method is stronger and more dependable than any single technique in determining a diagnosis that is more accurate and reliable.
Figure 34 below shows Sample 15’s fuzzy rule assessment using Roger’s Ratio method. The Rule Viewer does not closely match any specific fault condition through the input gas ratios, hence the “Normal” diagnosis. This is an undesirable result, as Sample 15’s known fault is Partial Discharge (PD), which is represented membership function with a range of [15, 25, 35]. The Roger’s Ratio method cannot detect the actual fault due to sensitivity issues. The method might not be sensitive enough to detect PD conditions when gas ratios are near the boundary of defined ranges. It may also be due to rule limitations; the membership functions for PD-related gas ratios might overlap with normal conditions, resulting in a misclassification.
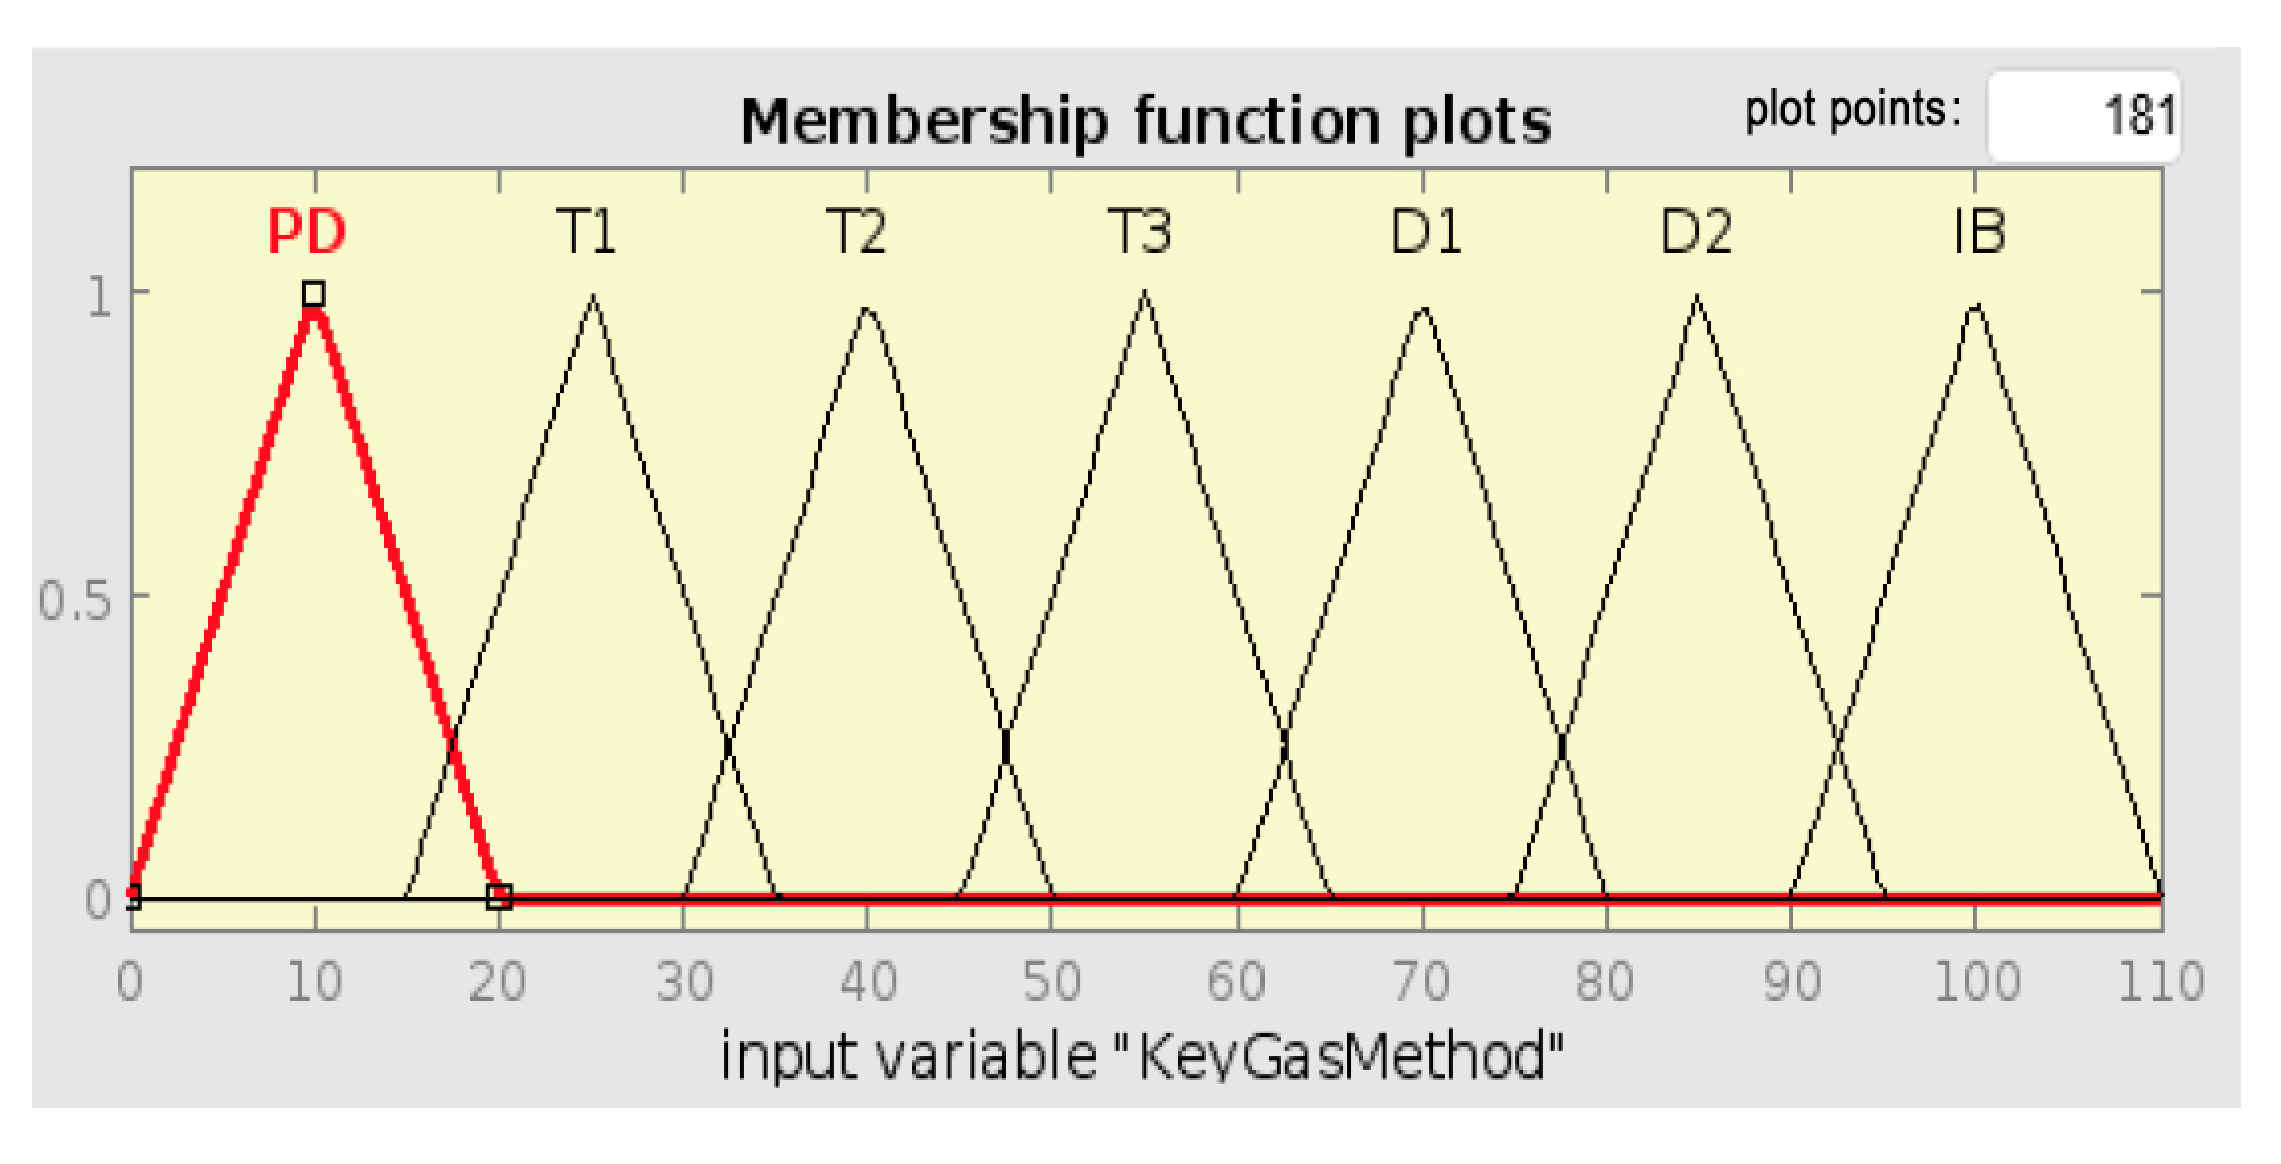
Figure 35 below shows the same sample diagnosed by the Key Gas Method. The FIS correctly diagnoses the fault to be PD. This result is justified by Figure 10, which shows the membership function PD’s range of [0, 10, 20]. The Key Gas Method is better at detecting PD as it specifically looks at high H2 concentrations, which are typical of PD faults. This method alone may not be reliable for other fault conditions, as observed from previous test examples.
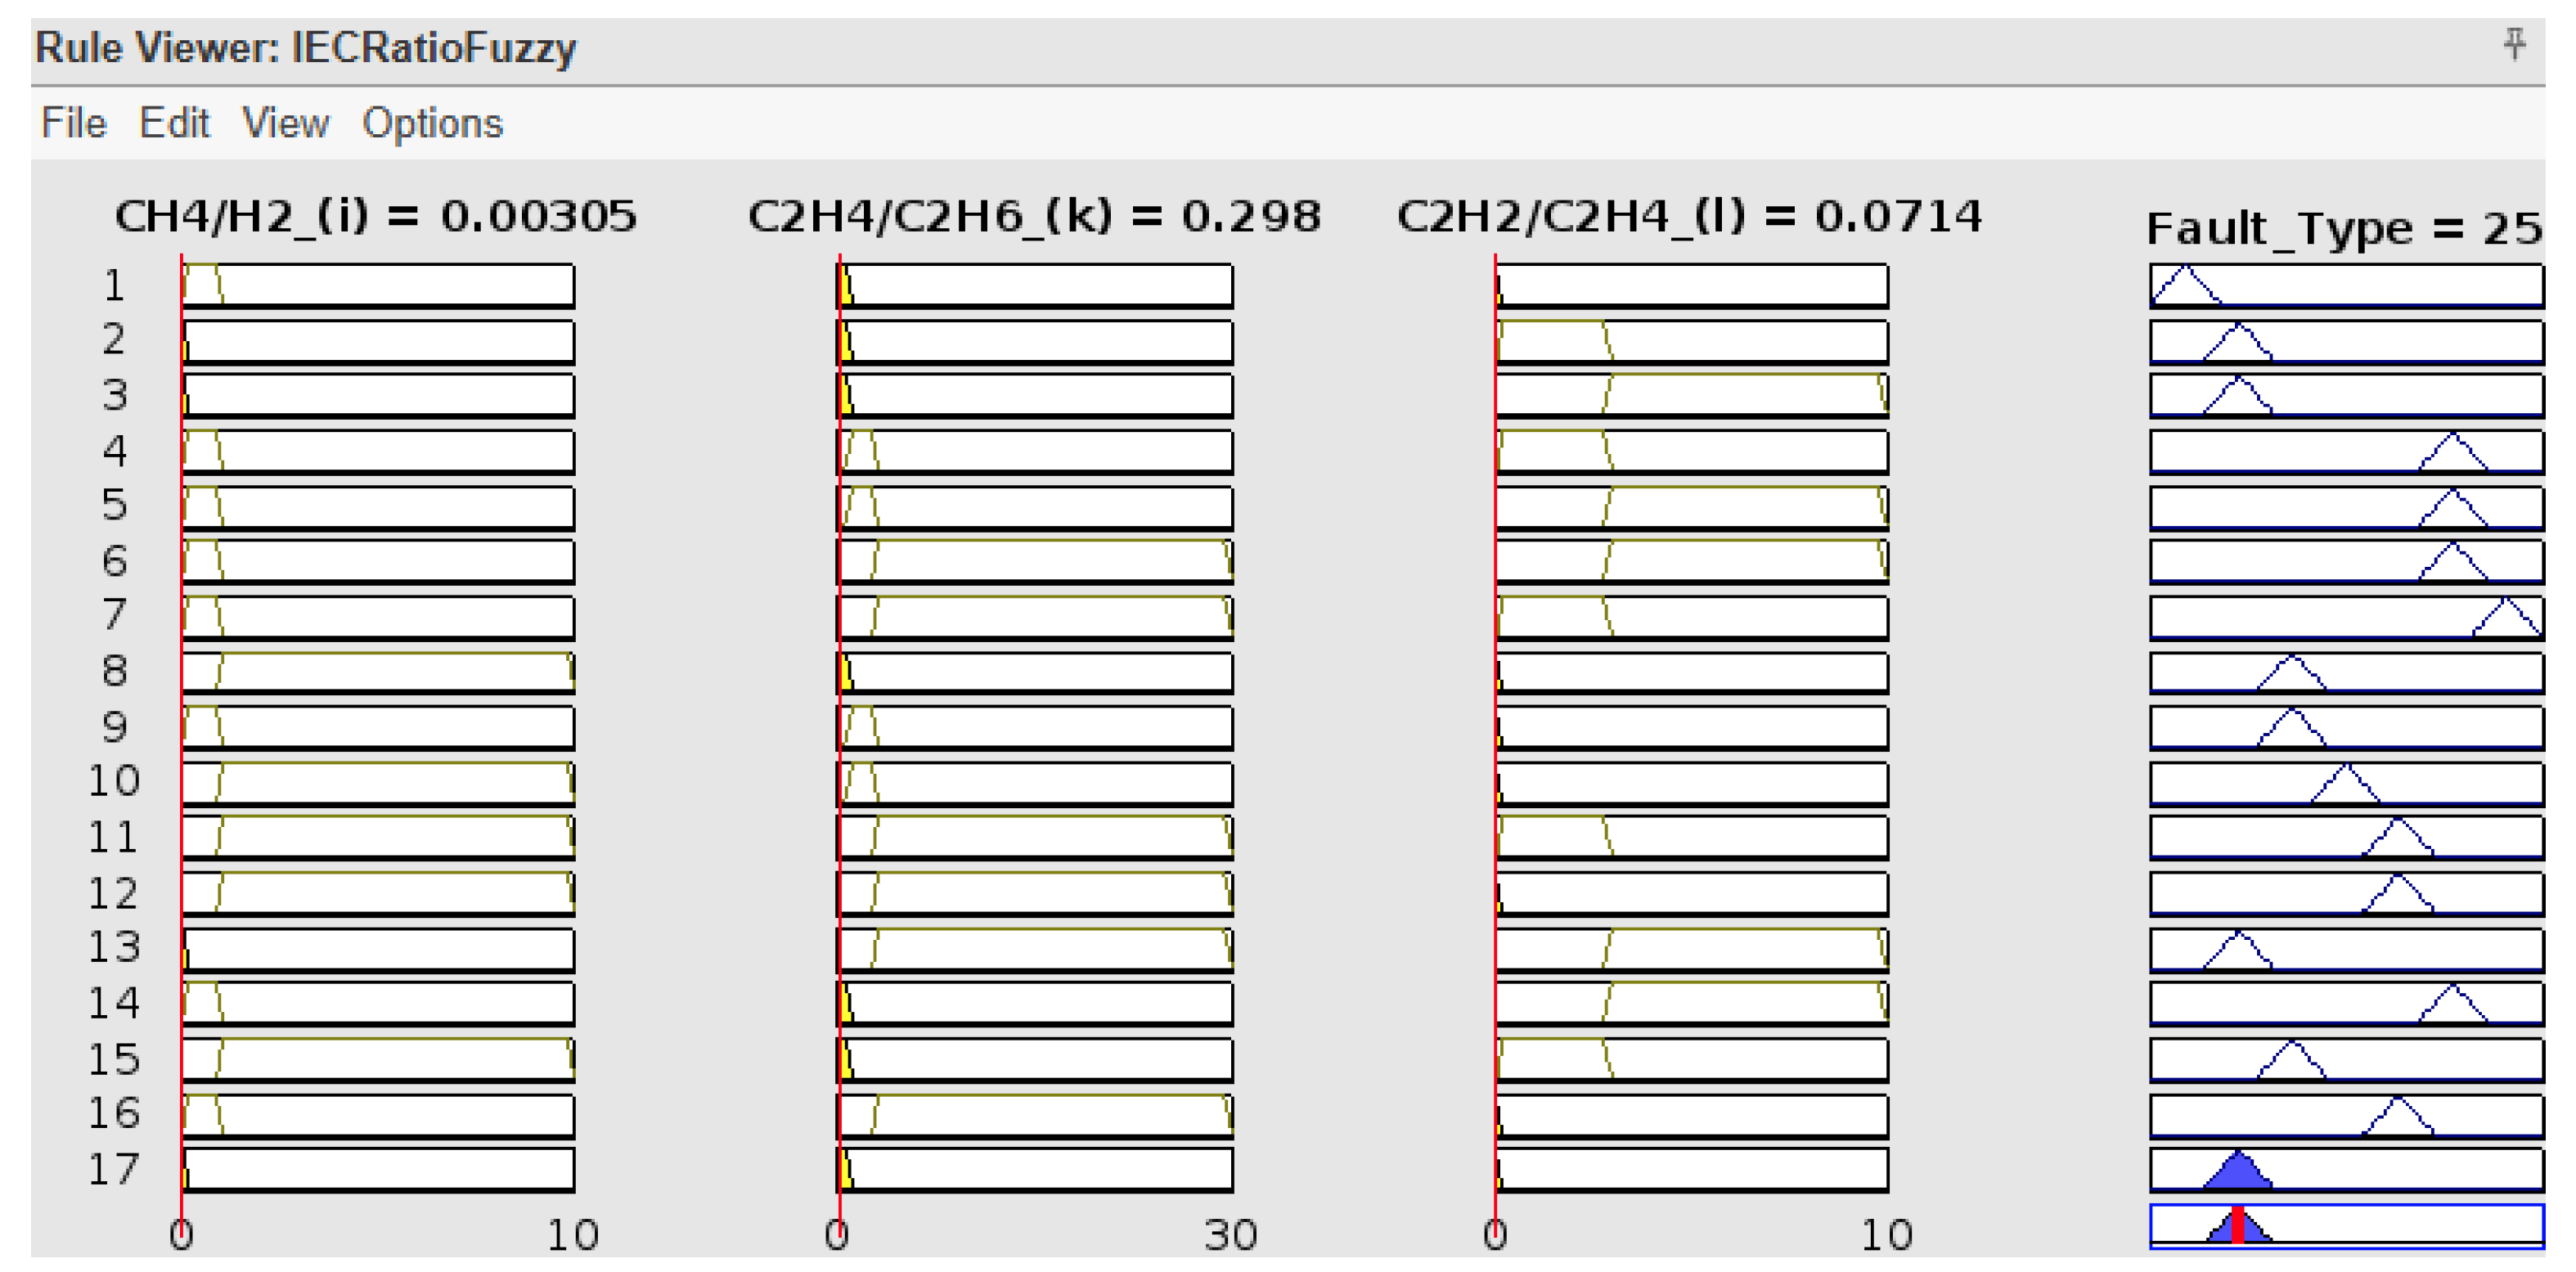
As shown by Figure 36 below, Sample 15 diagnosis using the IEC ratio FIS also diagnosed the fault as PD, defined by the membership function with a central value of 25. This correct detection of the IEC method can be attributed to its robust processing of CH4/H2 and C2H2/C2H4 ratios that well represent the characteristics of PD. This shows that the IEC method is more reliable at identifying discharge faults than Roger’s Ratio.
Duval Triangle FIS incorrectly identifies the fault as T1, as indicated below by Figure 37. This is due to the fact that the concentration of C2H4 in Sample 15 is quite high, and the Duval Triangle method is prone to identifying such a high concentration with thermal faults. This indicates that the method is not discriminative regarding PD when the C2H4 concentration is high.
Figure 38 below shows the final decision with the integrated DGA fuzzy logic system. The integrated system correctly diagnoses the fault as PD. This correct result shows the strength of the integrated method. With the integration of outputs from various methods, the system balances each method’s weakness. The combination of results ensures that even if one method incorrectly diagnoses, the combined output still points to the correct diagnosis.

6.1. Accuracy Comparison of Individual Fuzzy Inference Systems

For comparison of the diagnostic effectiveness of the individual DGA fuzzy logic systems and the proposed integrated method, accuracy is used as the primary measure of evaluation. Accuracy is the percentage of correct diagnoses interpreted by a method of the total number of transformer oil samples examined. By comparing and calculating the accuracy of each fuzzy logic system, we can clearly measure which approach yields the most reliable and consistent fault detection. This research provides important insight into the effectiveness of the integrated model to improve transformer fault diagnosis in comparison to traditional single models. Accuracy is calculated by the following formula:
A c c u r a c y =   N u m b e r   o f   c o r r e c t   d i a g n o s e s T o t a l   n u m b e r   o f   s a m p l e s     × 100

6.1.1. Accuracy of DGA Techniques to Different Fault Types

Understanding the accuracy of each DGA technique in detecting specific transformer fault types is essential to evaluating their diagnostic effectiveness and reliability. Each traditional method demonstrates different levels of sensitivity and accuracy, depending on the specific characteristics of the fault being diagnosed. This section provides a comparative analysis of these individual fuzzy logic-based DGA models, focusing on their performance across different conditions such as Normal, PD, T1–T3, D1–D2, and IB. By analyzing the detection patterns and error cases across fault types, this section highlights the diagnostic strengths and limitations of each method, providing a foundation for assessing the value added by the proposed integrated fuzzy logic system.
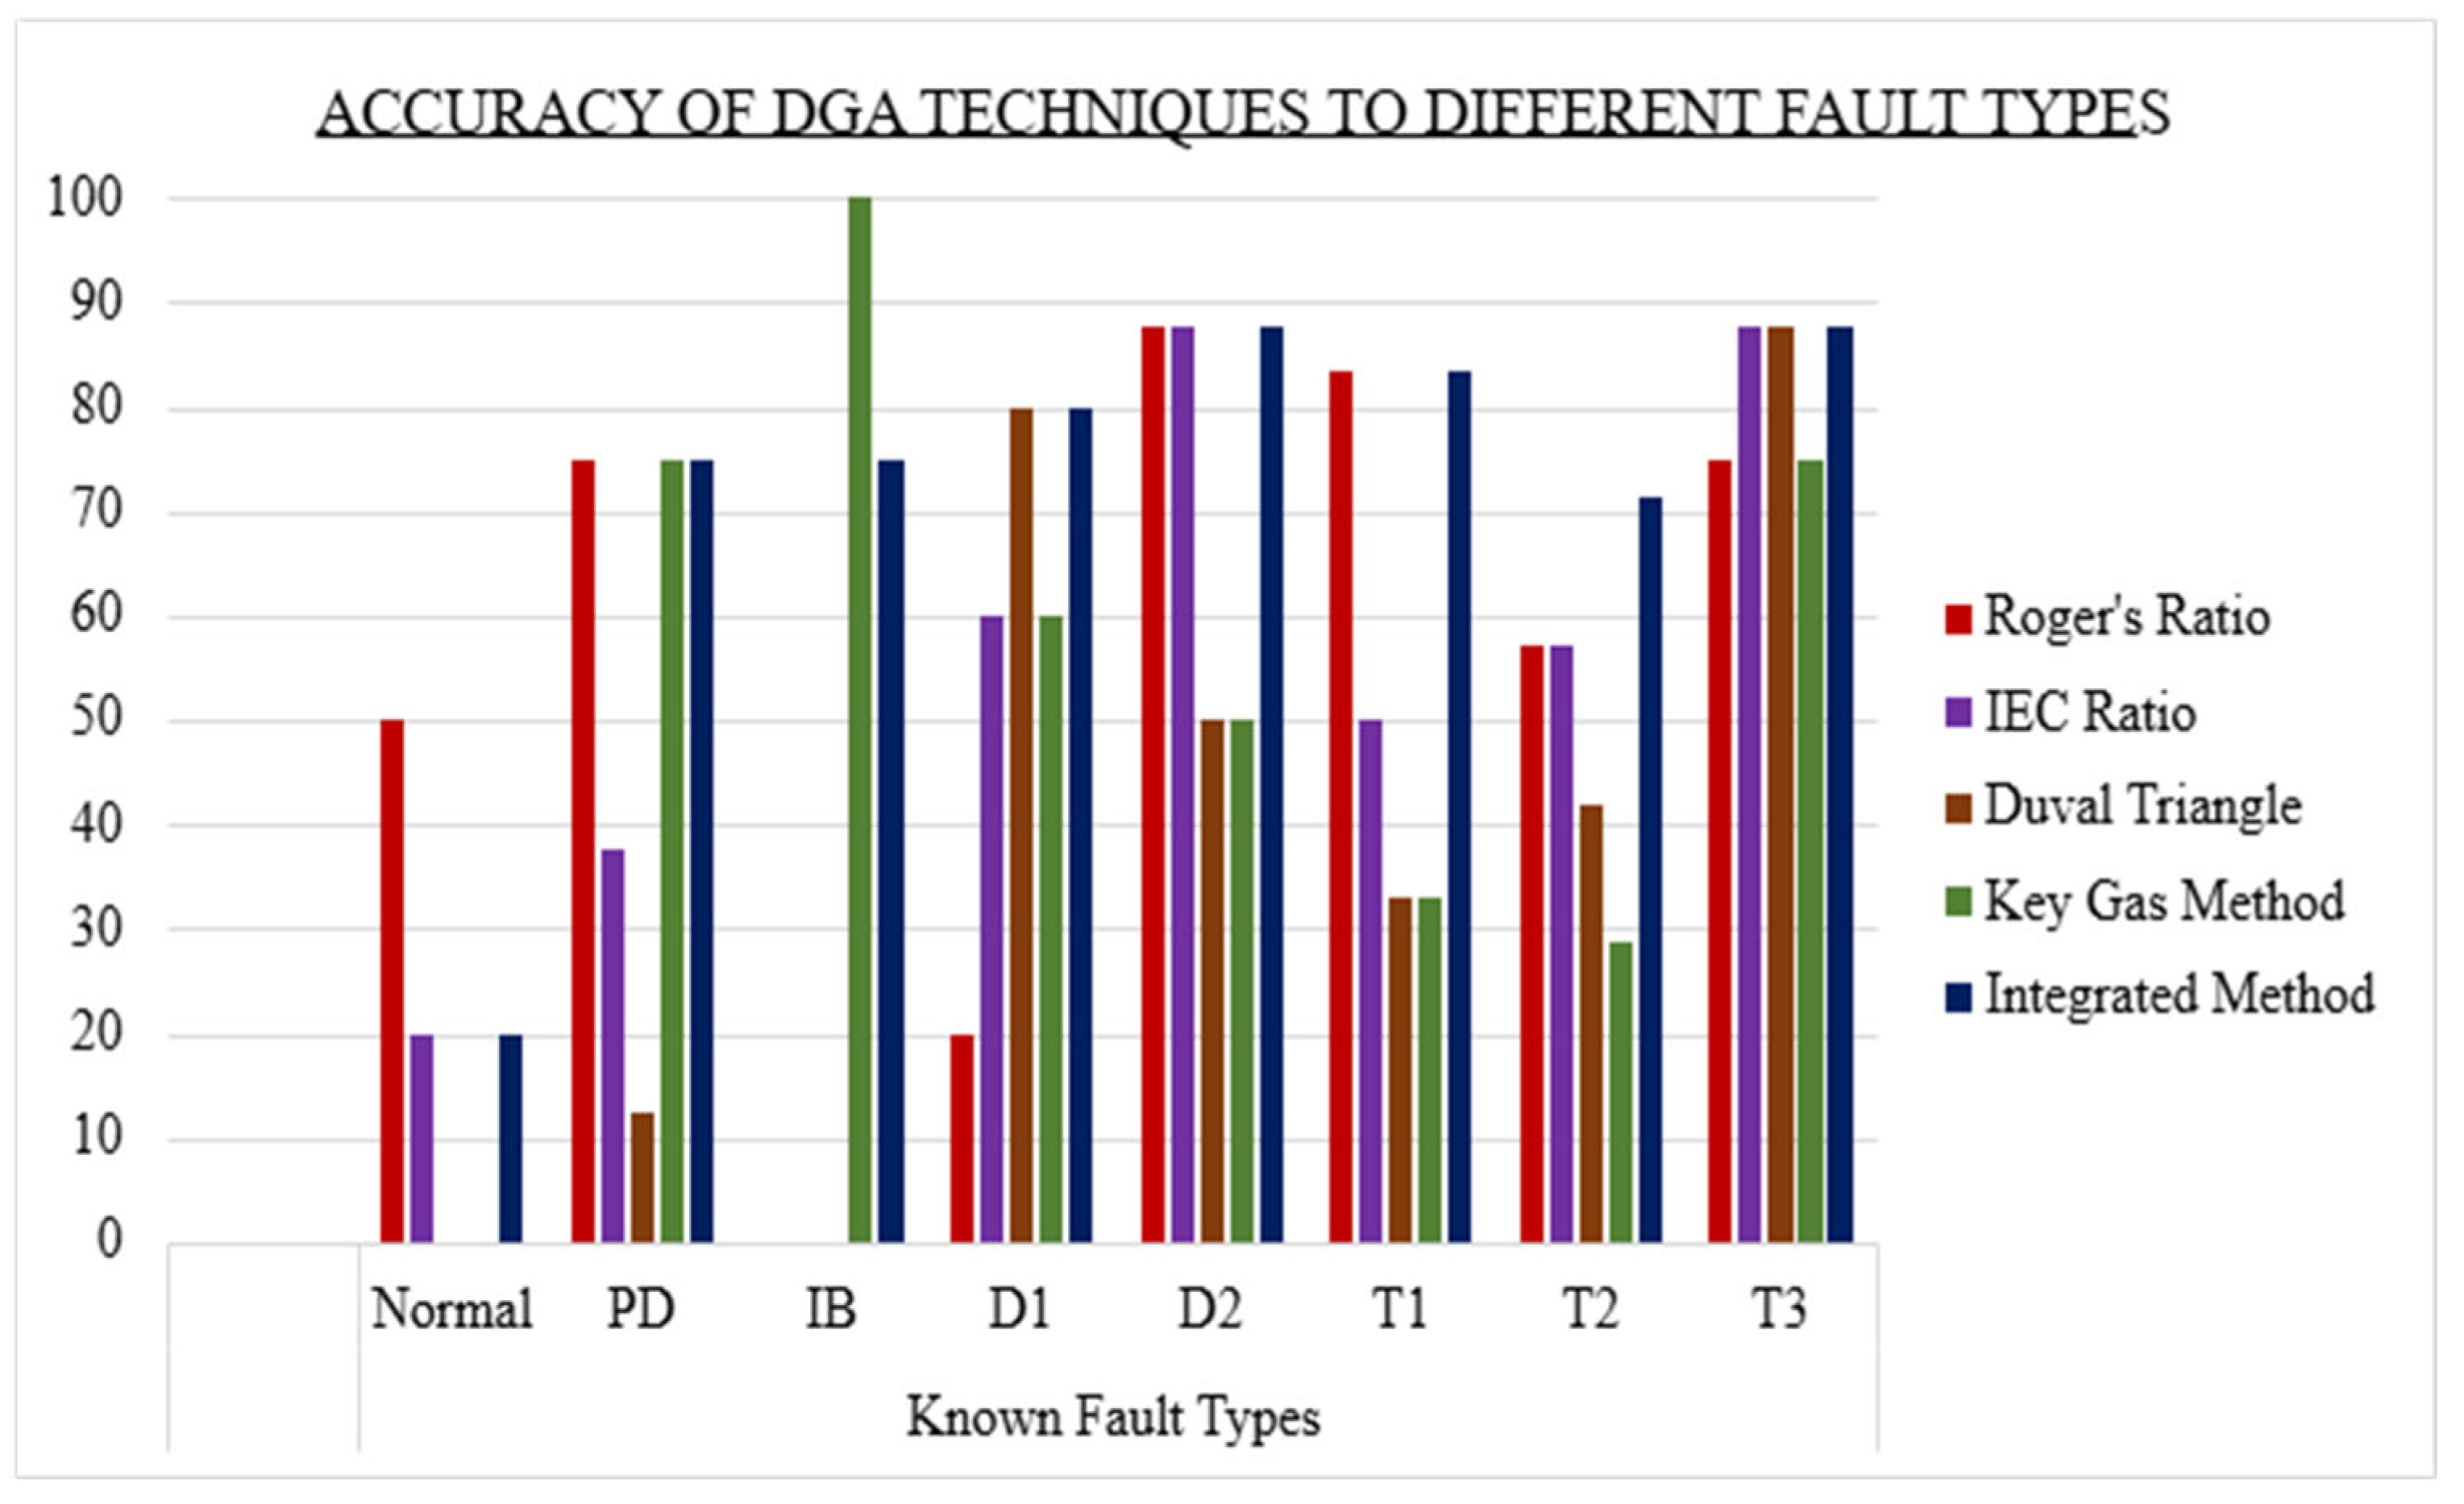
The bar chart in Figure 39 below illustrates how individual traditional techniques show inconsistent performance across different fault types. A technique that performs well for one fault type might perform poorly for another. This is illustrated by Roger’s Ratio FIS, which had a high accuracy of 87.5% in diagnosing D2 and displayed a low accuracy of 20% when it came to diagnosing D1 faults. Another example can be the Duval Triangle method, as it showed a low accuracy percentage of 12.5% when diagnosing PD fault types and had a high accuracy of 87.5% for T3 faults. No single individual DGA technique demonstrates consistently superior accuracy across all fault types. For example, the Key Gas Method’s strength in PD detection comes from its direct focus on Hydrogen, while a ratio-based method might be disadvantaged if that hydrogen is accompanied by other gases that shift the ratios out of the PD diagnostic zone. Their strengths and weaknesses are distributed. It is also important to note certain traditional FISs are not able to diagnose some conditions at all; normal conditions can only be diagnosed by the Roger’s and IEC ratios, as it can be observed in Figure 39, the Duval Triangle, and the Key Gas Method display 0% accuracy for the condition, as they are not designed to detect it at all. Another condition is the Insulation Breakdown (IB), as illustrated by Figure 39. It can only be diagnosed by the Key Gas Method. This shows the importance of the integrated FIS as it helps make up for each technique’s setbacks.
However, with regard to the integrated method, for almost every single fault type displayed the bar representing the integrated method is consistently the tallest or among the tallest, indicating its highest accuracy compared to all other individual DGA techniques. This visually and quantitatively demonstrates that the integrated system effectively combines the diagnostic strengths of the individual. By taking the output of each fuzzified traditional method as input to a higher-level fuzzy inference system, the overall system can mitigate the respective weaknesses and take advantage of the aggregate diagnostic strength of the individual techniques. For example, whereas the Duval Triangle may miss a PD fault when there is ethylene present, the overall system can place more weight on the Key Gas and IEC ratio methods if they strongly indicate PD, leading to a correct overall diagnosis.

6.1.2. Overall Accuracy of DGA Techniques and Integrated Method

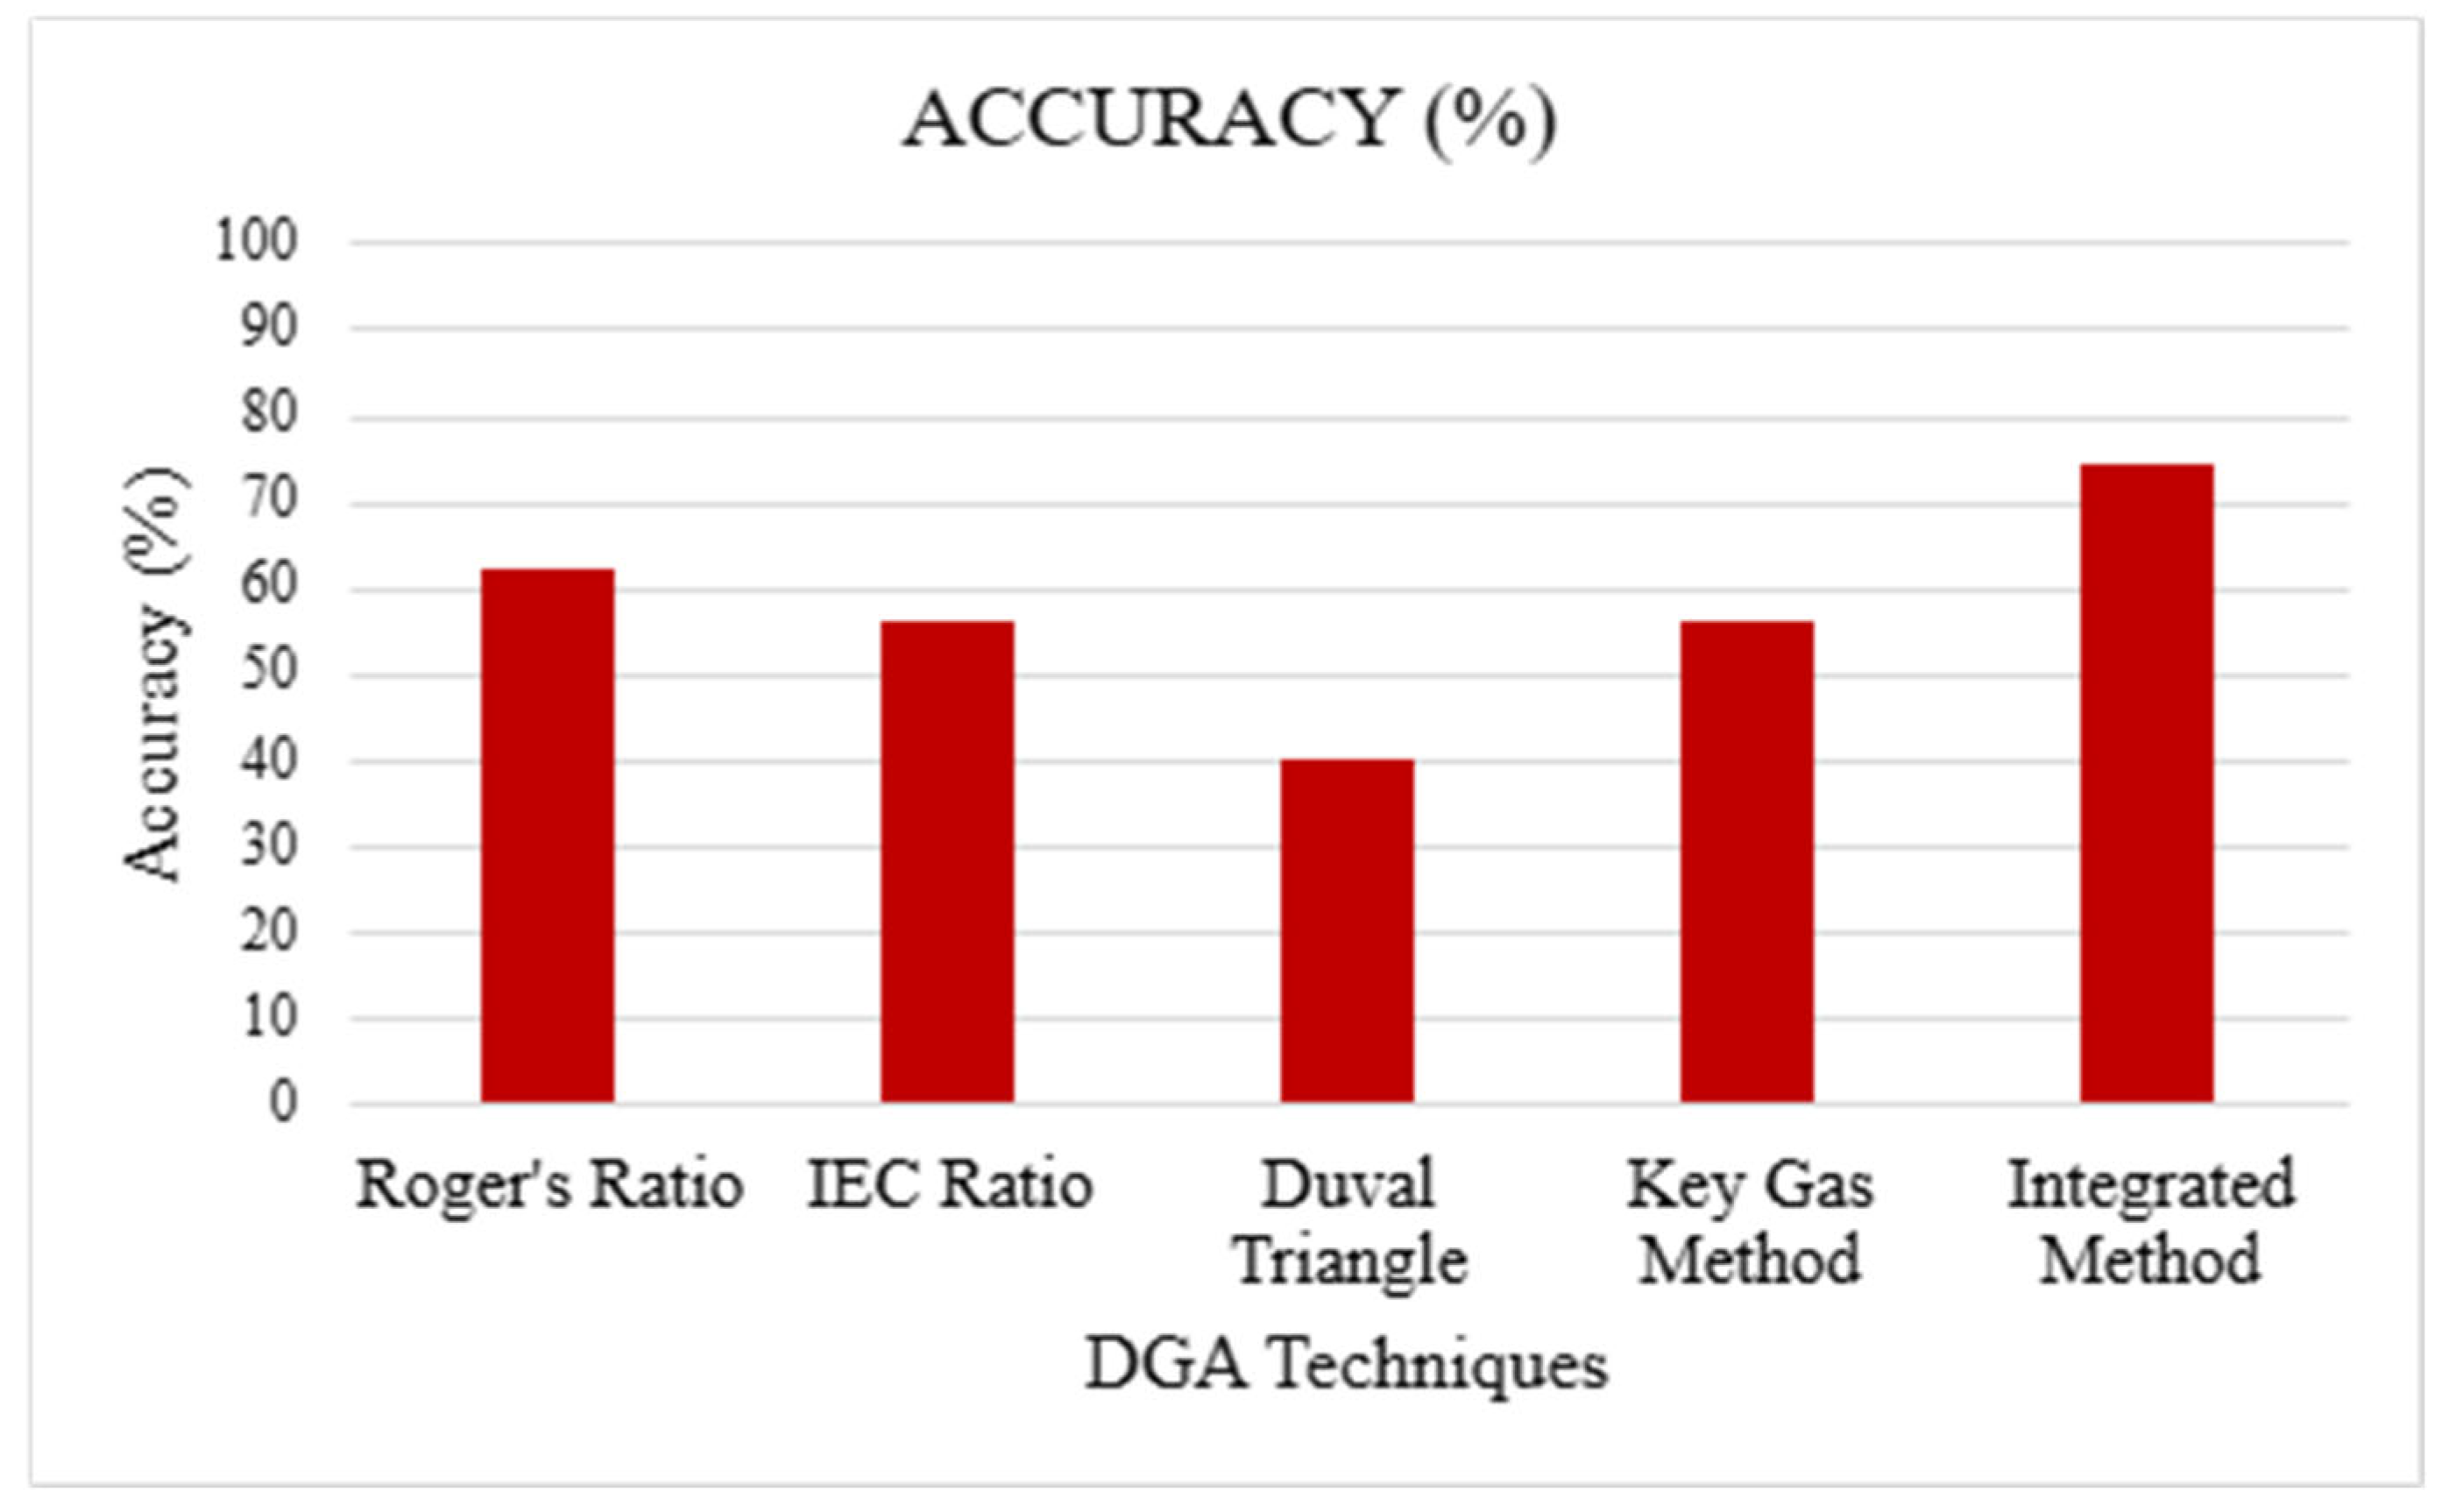
While the above section and Figure 39 gave a close-up view of how each separately DGA-based FIS works in diagnosing fault types of interest, this section now takes a different approach to a more general assessment by examining the overall diagnostic performance of each individual method in comparison to the integrated approach proposed. This overall accuracy, presented visually in Figure 40 below, offers a summative measure of their reliability and is crucial for supporting the enhanced diagnostic capabilities achieved through the integration of these diverse methodologies.
Figure 40 below presents a comprehensive graphical depiction of the diagnostic accuracies attained by the individual traditional DGA-based FISs compared to the success rate of the proposed integrated fuzzy logic system. This figure combines the particular performance metrics observed across specific fault types (as shown in Figure 39 and explained in Section 6.1.1) into a unique, comprehensive assessment of overall diagnostic accuracy for each approach studied.
The primary and most significant observation anticipated from Figure 40 is the demonstrably superior overall accuracy of the proposed integrated diagnostic method, with an accuracy of 76% compared to 62%, 56%, 42% and 56% of Roger’s Ratio, IEC ratio, Duval Triangle, and Key Gas Method, respectively. This great performance is a direct result of the integrated system design, which is aimed at developing the diagnostic capabilities of each individual method while at the same time removing its weaknesses and inconsistencies. The integration facilitates a comprehensive analysis of the DGA data, utilizing the results of fuzzified traditional methods as inputs for an advanced decision-making system. As demonstrated by Sample 15’s accurate diagnosis of PD in spite of variable outputs from several individual techniques, this multilayered approach allows the system to reconcile contradictory diagnoses from individual methods and arrive at a more robust and reliable final diagnosis.
Conversely, Figure 40 reflects the inherent limitations of sole reliance on individual classical DGA techniques. While they will show acceptable accuracy in specific fault categories, their overall diagnostic ability, evaluated over the total range of possible conditions for a transformer, will be relatively lower and more doubtful. This discrepancy emphasizes the fact that there is no one traditional method with the capability to provide high accuracy in all fault situations consistently. As an illustration, a method highly effective with thermal faults will not be equally effective with discharge faults, thus lowering the total rating for accuracy.
The benefits of such improved general accuracy are significant from a practical perspective. Unexpected transformer failure and the resulting financial losses are less in occurrence when a diagnostic system is more accurate in fault detection, since this implies that more accurate and timely maintenance intervention will be necessitated. Moreover, the capacity of the integrated system to provide a more certain and accurate diagnostic output relieves the interpretation load from maintenance staff and asset managers, especially those who may not have in-depth specialized knowledge of every element of every single DGA technique.

7. Conclusions

This thesis addressed the critical limitations of traditional DGA techniques, namely inconsistent results, reliance on specialized expertise, and interpretational complexity, which hinder effective MV/HV transformer condition assessment. Motivated by the need for a more reliable, accurate, and accessible diagnostic tool, this research developed and validated an integrated fuzzy logic system.
The experimental observations gathered strongly confirm the enhanced diagnostic capability of the proposed combined system. A comparative analysis of individual DGA-based FIS tested under various fault scenarios (as indicated in Figure 39) revealed their inherent inconsistencies; a model having expertise for one case generally performed poorly in another. This range was improved by the integrated approach, which consistently showed improved or equal accuracy across the entire fault type spectrum. Condensing this, the overall success rate for diagnostic testing of 76% for the integrated system (Figure 40) far surpassed any single one of the separate traditional approaches, such as Roger’s Ratio (62%), IEC ratio (56%), Duval Triangle (42%), and the Key Gas Method (56%). The system’s capacity for diagnosing inconsistencies, which has been illustrated through the Sample 15 analysis, supports the robustness of the system. While the validation has been conducted on 50 samples of the dataset, implying that further testing with a larger dataset would be useful for broader generalization, the results available are strongly positive.
The proposed integrated system directly solves the established problem statement through the provision of greatly improved diagnostic accuracy and reliability over single traditional methods alone. Its presentation of a clear, human-readable output reduces the need for expert interpretation, thereby fulfilling the motivation of enabling DGA diagnostics to be more user-friendly and accessible. This enables maintenance decisions to be made earlier and more informed.

Author Contributions

Conceptualization, L.L.M. and A.R.; Methodology, L.L.M. and A.R.; Validation, L.L.M., A.R., E.M. and A.A.; Formal analysis, L.L.M., A.R., E.M. and S.A.; Investigation, L.L.M. and A.R.; Resources, L.L.M. and A.R.; Writing—original draft, L.L.M.; Writing—review & editing, L.L.M., A.R., E.M., S.A. and A.A.; Visualization, A.R.; Supervision, A.R.; Project administration, A.R.; Funding acquisition, A.R. All authors have read and agreed to the published version of the manuscript.

Funding

This research received no external funding.

Data Availability Statement

The original contributions presented in this study are included in the article. Further inquiries can be directed to the corresponding author(s).

Conflicts of Interest

The authors declare no conflict of interest.

Abbreviations

The following abbreviations are used in this manuscript:
AIArtificial Intelligence
ANNArtificial Neural Network
CH4Methane
C2H2Acetylene
C2H4Ethylene
C2H6Ethane
COCarbon Monoxide
CO2Carbon Dioxide
CVACommon Vector Approach
DGADissolved Gas Analysis
DPMDuval Pentagon Method
FISFuzzy Inference System
FLFuzzy Logic
FSVMFuzzy Support Vector Machine
H2Hydrogen
IBInsulation Breakdown
IECInternational Electrotechnical Commission
IEEEInstitute of Electrical and Electronics Engineers
MFsMembership Functions
MLPMulti-Layer Perceptron
PCAPrincipal Component Analysis
PDPartial Discharge
PPMParts Per Million
RBFRadial Basis Function
RNNRandom Neural Network
SVM-PSOSupport Vector Machine-Particle Swarm Optimization
TDCGTotal Dissolved Combustible Gas
TFThermal Fault

References

  1. Rengaraj, R.; Venkatakrishnan, G.R.; Moorthy, P.; Pratyusha, R.; Ritika; Veena, K. Transformer Oil Health Monitoring Techniques. In Advances in Smart System Technologies; Springer: Singapore, 2021. [Google Scholar]
  2. Khade, P.S.; Mahajan, G.K.; Chaudhari, A.P. Artificial Neural Network Approach to Dissolved Artificial Neural Network Approach to Dissolved. Int. J. Sci. Eng. Res. 2016, 7. [Google Scholar]
  3. Abu-Siada, A.; Islam, S. A new approach to identify power transformer criticality and asset management decision based on dissolved gas-in-oil analysis. IEEE Trans. Dielectr. Electr. Insul. 2012, 19, 1007–1012. [Google Scholar] [CrossRef]
  4. IEC 60599; Mineral Oil-Filled Electrical Equipment in Service—Guidance on the Interpretation of Dissolved and Free Gases Analysis. International Electrotechnical Commission: Geneva, Switzerland, 2015.
  5. C57.104-1991; IEEE Guide for the Interpretation of Gases Generated in Oil-Immersed Transformers. IEEE: New York, NY, USA, 1991.
  6. C57.104-2019; IEEE Guide for the Interpretation of Gases Generated in Mineral Oil-Immersed Transformers. International Electrotechnical Commission: Geneva, Switzerland, 2019.
  7. Duval, M. A Review of Faults Detectable by Gas-in-Oil Analysis in Transformers. IEEE Electr. Insul. Mag. 2002, 18, 8–17. [Google Scholar] [CrossRef]
  8. Bustamante, S.; Manana, M.; Arroyo, A.; Castro, P.; Laso, A.; Martinez, R. Dissolved Gas Analysis Equipment for Online Monitoring of Transformer Oil: A Review. MDPI Sensors 2019, 19, 4057. [Google Scholar] [CrossRef]
  9. Abu-Siada, A.; Arshad, M.; Islam, S. Fuzz Logic y Approach to Identify Transformer Criticality using Dissolved Gas Analysis. In Proceedings of the IEEE PES General Meeting, Minneapolis, MN, USA, 25–29 July 2010; IEEE: New York, NY, USA, 2010. [Google Scholar]
  10. Abu-Siada, A.; Hmood, S.; Islam, S. A New Fuzzy Logic Approach for Consistent Interpretation of Dissolved Gas-in-Oil Analysis. IEEE Trans. Dielectr. Electr. Insul. 2013, 20, 2343–2349. [Google Scholar] [CrossRef]
  11. Abu-Siada, A.; Hmood, S. A new fuzzy logic approach to identify power transformer criticality using dis-solved gas-in-oil analysis. Electr. Power Energy Syst. 2015, 67, 401–408. [Google Scholar] [CrossRef]
  12. Ashkezari, A.D.; Saha, T.K.; Ekanayake, C.; Ma, H. Evaluating the accuracy of different DGA techniques for improving the transformer oil quality interpretation. In Proceedings of the AUPEC 2011, Brisbane, Australia, 25–28 September 2011. [Google Scholar]
  13. Mahmoudi, N.; Samimi, M.H.; Mohseni, H. Experiences with transformer diagnosis by DGA: Case studies. IET Gener. Transm. 2019, 13, 5431–5439. [Google Scholar] [CrossRef]
  14. Betie, A.; Rao, U.M.; Fofana, I.; Fethi, M.; Yeo, Z. Influence of cellulose paper on gassing tendency of trans-former oil under electrical discharge. IEEE Trans. Dielectr. Electr. Insul. 2019, 26, 1729–1739. [Google Scholar] [CrossRef]
  15. Gouda, O.E.; El-Hoshy, S.H.; -Tamaly, H.H.E.L. Condition assessment of power transformers based on dissolved gas analysis. IET Gener. Transm. Distrib. J. 2019, 13, 2299–2310. [Google Scholar] [CrossRef]
  16. Dessouky, S.S.; Kalas, A.E.; El-Aal, R.A.A.; Hassan, A.M.M. Modification of Duval Triangle for Diagnostic Transformer Fault through a Procedure of Dissolved Gases Analysis. Trans. Environ. Electr. Eng. ISSN 2016, 1, 2450–5730. [Google Scholar] [CrossRef][Green Version]
  17. Garg, P.K. Overview Artificial Intelligence. In Artificial Intelligence; Tyler & Francis: London, UK, 2021; p. 16. [Google Scholar]
  18. IEC 60599:1999+AMD1:2007 CSV; Mineral Oil-Impregnated Electrical Equipment in Service—Guide to the Interpretation of Dissolved and Free Gases Analysis. International Electrotechnical Commission: Geneva, Switzerland, 2007.
  19. Prasojo, R.A.; Gumilang, H.; Maulidevi, N.U.; Soedjarno, B.A. A Fuzzy Logic Model for Power Transformer Faults’ Severity Determination Based on Gas Level, Gas Rate, and Dissolved Gas Analysis Interpretation. Energies 2020, 13, 1009. [Google Scholar] [CrossRef]
  20. Afiqah, R.N.; Musirin, I.; Johari, D.; Othman, M.M.; Rahman, T.; Othman, T. Fuzzy Logic Aplication in DGA Methods to Classify Fault Type in Power Transformer. In Proceedings of the International Conference on Electric Power Systems, High Voltages, Electric Machines, International Conference on Remote Sensing, Takizawa, Japan, 4–6 October 2010. [Google Scholar]
  21. Faiz, J.; Soleimani, M. Assessment of Computational Intelligence and Conventional Dissolved Gas Analysis Methods for Transformer Fault Diagnosis. IEEE Trans. Dielectr. Electr. Insul. 2018, 25, 1798–1806. [Google Scholar] [CrossRef]
  22. Ha’imza, H.; Amirullah, A.; Plangklang, B. Development of nominal rules on the Fuzzy Sugeno method to determine the quality of power transformer insulation oil using Dissolved Gas Analysis data. SINERGI 2023, 27, 31–44. [Google Scholar] [CrossRef]
  23. Suwarno; Sutikno, H.; Prasojo, R.A.; Abu-Siada, A. Machine learning based multi-method interpretation to enhance dissolved gas analysis for power transformer fault diagnosis. Heliyon 2024, 10, e25975. [Google Scholar] [CrossRef] [PubMed]
  24. Ashkezari, A.D.; Ma, H.; Saha, T.P.; Ekanayake, C. Application of Fuzzy Support Vector Machine for De-termining the Health Index of the Insulation System of In-service Power Transformers. IEEE Trans. Dielectr. Electr. Insul. 2013, 20, 965–973. [Google Scholar] [CrossRef]
  25. Biçen, Y.; Aras, F.; İnal, M.; İsmailoğlu, H. Dissolved Gas Analysis and Fault Diagnosis In-terface for Oil-Immersed Transformer Using Fuzzy Logic. Int. Rev. Autom. Control. IREACO 2012, 5, 414–420. [Google Scholar]
  26. Poonnoy, N.; Suwanasri, C.; Suwanasri, T. Fuzzy Logic Approach to Dissolved Gas Analysis for Power Transformer Failure Index and Fault Identification. Energies 2021, 14, 36. [Google Scholar] [CrossRef]
  27. SuganyaBharathi, M.; Iruthayarajan, M.W.; Shunmugam, S.S.; Kalaivani, L. Interpretation of Dissolved Gas Analysis in Transformer Oil using Fuzzy Logic System. In Proceedings of the International Conference on Power, Energy and Control (ICPEC), Dindigul, India, 6–8 February 2013. [Google Scholar]
  28. Li, Y. The State of the Art in Transformer Fault Diagnosis with Artificial Intelligence and Dissolved Gas Analysis; North China Electric Power University: Beijing, China, 2023. [Google Scholar]
  29. Alamuru, V.; Pessapaty, S.R.C.M. Hybrid diagnosing techniques for analysing dissolved gases in power transformers. J. Eng. Technol. Res. 2015, 7, 32–43. [Google Scholar] [CrossRef]
  30. Ahmed, M.R.; Geliel, M.A.; Khalil, A. Power Transformer Fault Diagnosis using Fuzzy Logic Technique Based on Dissolved Gas Analysis. In Proceedings of the 21st Mediterranean Conference on Control & Automation (MED), Chania, Greece, 25–28 June 2013. [Google Scholar]
  31. Bhalla, D.; Bansal, R.K.; Gupta, H.O. Application of Artificial Intelligence Techniques for Dissolved Gas Analysis of Transformers. Int. J. Electr. Comput. Eng. 2010, 4. [Google Scholar]
  32. Jha, M.K.; Barle, P.P.N.; Trivedi, R. Application of Artificial Intelligence Techniques for Dissolved Gas Analysis of Transformers—A Review. IJISET Int. J. Innov. Sci. Eng. Technol. 2015, 2, 244–251. [Google Scholar]
  33. Castro, A.R.G.; Miranda, V. An interpretation of neural networks as inference engines with application to transformer failure diagnosis. Electr. Power Energy Syst. 2005, 27, 620–626. [Google Scholar] [CrossRef][Green Version]
  34. Golkhah, M.; Shamshirgar, S.S.; Vahidi, M.A. Artificial neural networks applied to DGA for fault diagnosis in oil-filled power transformers. J. Electr. Electron. Eng. Res. 2011, 3, 1–10. [Google Scholar][Green Version]
  35. Seifeddine, S.; Khmais, B.; Abdelkader, C. Power Transformer Fault Diagnosis Based on Dissolved Gas Analysis by Artificial Neural Network. In Proceedings of the 2012 First International Conference on Renewable Energies and Vehicular Technoloy, Nabeul, Tunisia, 26–28 March 2012. [Google Scholar]
  36. Ghoneim, S.S.M.; Taha, I.B. Artificial Neural Networks for Power Transformers Fault Diagnosis Based on IEC Code Using Dissolved Gas Analysis. Int. J. Control. Autom. Syst. 2015, 4, 18–21. [Google Scholar][Green Version]
  37. Kaur, A.; Brar, Y.S.; Leena, G. Fault detection in power transformers using random neural networks. Int. J. Electr. Comput. Eng. (IJECE) 2019, 9, 78–84. [Google Scholar] [CrossRef]
  38. Kirkbas, A.; Demircali, A.; Koroglu, S.; Kizilkaya, A. Fault diagnosis of oil-immersed power transformers using common vector approach. Electr. Power Syst. Res. 2020, 184, 106346. [Google Scholar] [CrossRef]
  39. Németh, B.; Laboncz, S.; Kiss, I.; Csépes, G. Transformer condition analyzing expert system using fuzzy neural system. In Proceedings of the 2010 IEEE International Symposium on Electrical Insulation, San Diego, CA, USA, 6–9 June 2010. [Google Scholar]
  40. Golarz, J. Electric Energy Online. November 2015. Available online: https://electricenergyonline.com/energy/magazine/913/article/Guest-Editorial-Understanding-Dissolved-Gas-Analy-sis-DGA-Techniques-and-Interpretations.htm#:~:text=The%20Key%20Gas%20method%20is,gases%2C’%20for%20detecting%20faults (accessed on 27 August 2024).
  41. Febriyanto, A.; Saha, T.K. Oil-immersed Power Transformers Condition Diagnosis with Limited Dissolved Gas Analysis (DGA) Data. In Proceedings of the Australasian Universities Power Engineering Conference (AUPEC), Sydney, Australia, 14–17 December 2008. [Google Scholar]
  42. Power Transformer Health. 2016. Available online: https://powertransformerhealth.com/2016/05/26/dornenburgs-method/#:~:text=The%20Doernenburg%20ratio%20method%20utilizes,2%2FC2H4 (accessed on 27 August 2024).
  43. IEC 60599; Mineral Oil-Impregnated Electrical Equipment—Guide to the Interpretation of Dissolved. International Electrotechnical Commission: Geneva, Switzerland, 1999; pp. 1–69.
  44. Phadungthin, R.; Chaidee, E.; Haema, J.; Suwanasri, T. Analysis of insulating oil to evaluate the condition of power transformer. In Proceedings of the ECTI-CON2010: The 2010 ECTI International Conference on Electrical Engineering/Electronics, Computer, Telecommunications and Information Technology, Chiang Mai, Thailand, 19–21 May 2010. [Google Scholar]
  45. Azirani, A.A.; Setayeshmehr, A.; Borsi, H.; Gockenbach, E. A Software Implementation of the Duval Triangle Method. In Proceedings of the 2008 IEEE International Symposium on Electrical Insulation, Vancouver, BC, Canada, 9–12 June 2008. [Google Scholar]
  46. Bai, Y.; Wang, D. Fundamentals of Fuzzy Logic Control—Fuzzy Sets, Fuzzy Rules and Defuzzifications. In Advanced Fuzzy Logic Technologies in Industrial Applications; Springer: London, UK, 2006. [Google Scholar]
  47. Rogers, R.R. IEEE and IEC Codes to Interpret Incipient Faults in Transformers, Using Gas in Oil Analysis. IEEE Trans. Electr. Insul. 1978, EI-13, 349–354. [Google Scholar] [CrossRef]
  48. Reddy, N.V.; Karmakar, S. Dissolved Gas Analysis–An Early Identification of Faults in High Voltage Power Equipment Using MATLAB GUI. Master’s Thesis, Department of Electrical Engineering National Institute of Technology, Rourkela, India, 2014. [Google Scholar]
  49. Taha, I.B.M.; Hoballah, A.; Ghoneim, S.S.M. Optimal ratio limits of rogers’ four-ratios and IEC 60599 code methods using particle swarm optimization fuzzy-logic approach. IEEE Trans. Dielectr. Electr. Insul. 2020, 27, 222–230. [Google Scholar] [CrossRef]
Figure 1. Duval Triangle.
Eng 06 00228 g001
Figure 2. Key Gas Method flowchart.
Eng 06 00228 g002
Figure 3. MFs of the input variable CO.
Eng 06 00228 g003
Figure 4. MFs of the input variable C2H6.
Eng 06 00228 g004
Figure 5. MFs of the input variable C2H4.
Eng 06 00228 g005
Figure 6. MFs of the input variable C2H2.
Eng 06 00228 g006
Figure 7. MFs of the input variable CH4.
Eng 06 00228 g007
Figure 8. MFs of the input variable H2.
Eng 06 00228 g008
Figure 9. MFs of the output variable “Fault Type”.
Eng 06 00228 g009
Figure 10. Roger’s Ratio flowchart.
Eng 06 00228 g010
Figure 11. MFs of the input CH4/H2 under Roger’s.
Eng 06 00228 g011
Figure 12. MFs of the input C2H6/CH4 under Roger’s.
Eng 06 00228 g012
Figure 13. MFs of the input C2H4/C2H6 under Roger’s.
Eng 06 00228 g013
Figure 14. MFs of the input C2H2/C2H4 under Roger’s.
Eng 06 00228 g014
Figure 15. MFs of the output variable (Fault Type) under Roger’s.
Eng 06 00228 g015
Figure 16. MFs of the input CH4/H2 under the IEC ratio method.
Eng 06 00228 g016
Figure 17. MFs of the input C2H4/C2H6 under the IEC ratio method.
Eng 06 00228 g017
Figure 18. MFs of the input C2H2/C2H4 under the IEC ratio method.
Eng 06 00228 g018
Figure 19. MFs of the output (Fault Type) under the IEC ratio method.
Eng 06 00228 g019
Figure 20. IEC ratio method flowchart.
Eng 06 00228 g020
Figure 21. Duval Triangle method flow chart.
Eng 06 00228 g021
Figure 22. Duval Triangle’s different fault zone coordinates.
Eng 06 00228 g022
Figure 23. MFs of the input CH4% in the Duval Triangle method.
Eng 06 00228 g023
Figure 24. MFs of the input C2H4% in the Duval Triangle method.
Eng 06 00228 g024
Figure 25. MFs of the input C2H2% in the Duval Triangle method.
Eng 06 00228 g025
Figure 26. MFs of the output (fault type) under the Duval Triangle method.
Eng 06 00228 g026
Figure 27. Integrated DGA fuzzy system.
Eng 06 00228 g027
Figure 28. Input Roger’s Ratio MFs.
Eng 06 00228 g028
Figure 29. Input IEC ratio MFs.
Eng 06 00228 g029
Figure 30. Input Duval Triangle MFs.
Eng 06 00228 g030
Figure 31. Input Key Gas Method MFs.
Eng 06 00228 g031
Figure 32. Final Decision output variable MFs.
Eng 06 00228 g032
Figure 33. Simulink block of the integrated DGA fuzzy logic system.
Eng 06 00228 g033
Figure 34. Sample 15 Roger’s Ratio results in Rule Viewer.
Eng 06 00228 g034
Figure 35. Sample 15 Key Gas Method results in Rule Viewer.
Eng 06 00228 g035
Figure 36. Sample 15 IEC ratio results in Rule Viewer.
Eng 06 00228 g036
Figure 37. Sample 15’s Duval Triangle results in Rule Viewer.
Eng 06 00228 g037
Figure 38. Sample 15’s integrated method results in the Rule Viewer.
Eng 06 00228 g038
Figure 39. DGA Techniques’ accuracy for different fault types.
Eng 06 00228 g039
Figure 40. Overall accuracy of DGA techniques and the integrated method.
Eng 06 00228 g040
Table 1. Comparison of fuzzy logic-based DGA systems.
TitleSample Size and TechniqueObjectivesMethodologyFindingsCitations
Application of Fuzzy Support Vector Machine for Determining the Health Index of the Insulation System of In-Service Power Transformers.FSVM applied to historical data from chemical and electrical tests.To develop an FSVM model for evaluating the health of transformer insulation systemsIntegrated historical chemical and electrical test data into an FSVM model for assessing insulation health.The FSVM model improved health index determination and has an accuracy of about 85% but required optimization for imbalanced datasets and noise management.[24]
DGA and Fault Diagnosis Interface for Oil-Immersed Transformer Using FLFuzzy logic applied to DGA, IEC 60599 standards, transformer oil, and paper insulation.To enhance traditional DGA techniques by developing a fuzzy logic-based diagnostic interface.Analyzed key gas ratios and CO2/CO ratios to detect transformer faults and the condition of both oil and paper insulation using fuzzy logic.Achieved 95% diagnostic accuracy, improving the interpretation of borderline cases and fault transitions.[25]
FL Approach to DGA for Power Transformer Failure Index and Fault IdentificationFuzzy logic applied to three DGA methods: Key Gas, IEC, Duval TriangleTo assess transformer condition and determine fault types using fuzzy logic.Used fuzzy logic to assess failure index and classify internal transformer faults by combining three DGA methods (Key Gas, IEC, Duval Triangle).Achieved 92% accuracy in fault identification, improving fault coverage across multiple failure types.[26]
Interpretation of DGA in Transformer Oil using FL SystemFuzzy logic applied to various DGA techniquesTo develop a fuzzy logic system for interpreting dissolved gas concentrations in transformer oil.Implemented fuzzy logic over various DGA techniques, interpreting results without relying on personal experience or experimental results.Enhanced diagnosis consistency without requiring mathematical formulation, though manual rule design was required.[27]
The State of the Art in Transformer Fault Diagnosis with AI and DGAAI and DGA methods, review-based paperTo review AI-based approaches for transformer fault diagnosis using DGA.Reviewed various AI-based techniques such as ANN, fuzzy logic, and hybrid methods for diagnosing faults in a transformer.AI-based methods provide accurate and timely diagnosis, but continued research is needed to address limitations and explore improvements.[28]
Hybrid Diagnosing Techniques for Analyzing Dissolved Gases in Power TransformersHybrid techniques combining ANN and Fuzzy LogicTo develop hybrid diagnostic techniques combining AI and DGA methods for transformer fault diagnosis.Sequential hybrid system where outputs of ANN serve as inputs for fuzzy logic; IEEE/IEC ratios are used in the model to classify faults.Combining ANN with fuzzy logic improved diagnosis accuracy and interpretability, but implementation complexity increased.[29]
Power Transformer Fault Diagnosis using FL Technique Based on DGAFuzzy logic applied to DGA.To diagnose transformer faults using fuzzy logic in combination with DGA.Applied fuzzy logic to interpret DGA data, using membership functions to classify gas concentrations and associated fault types.Fuzzy logic proved effective in diagnosing faults in DGA but required expert-designed membership functions, making it somewhat rigid.[30]
Application of AI Techniques for DGA of TransformersReview of AI techniques for DGA.To evaluate various AI techniques for DGA-based transformer diagnosis.Reviewed ANN, fuzzy logic, and expert systems applied to transformer fault diagnosis based on dissolved gas concentrations.AI techniques such as ANN and fuzzy logic provided higher accuracy but required large datasets and complex training procedures.[31,32]
Table 2. Comparison of Artificial Intelligence-based DGA techniques.
TitleSample Size and TechniqueObjectivesMethodologyFindingsCitations
An interpretation of artificial neural networks (ANNs) as inference engines with application
to transformer failure diagnosis
Data samples with various gas ratios using ANN.To diagnose transformer faults using an ANN and compare with traditional methods.Used back-propagation ANN to analyze gas ratios and mapped ANN into a Fuzzy system to extract rules.ANN outperforms traditional DGA methods with higher accuracy; fuzzy rule extraction improved interpretability but increased rule complexity and reduced readability.[33]
ANNs utilized for DGA fault
diagnosis in oil-filled power
Three ANN models with different methods (Dornenburg, Rogers, and Duval Triangle)To assess the effectiveness of models based on traditional methods and use artificial neural networks (ANN) to classify transformer failures.ANN models were trained on DGA gas ratio data and validated with real transformer data.Every ANN model worked well, but less standardization resulted from the necessity to fine-tune each model for a particular set of techniques.[34]
Power Transformer Fault Diagnosis Based on DGA
by ANN
In total, 600 DGA samples from Tunisian Company of Electricity and Gas (STEG), Multi-Layer Perceptron (MLP) and Radial Basis Function (RBF) ANN.To evaluate the performance of MLP and RBF ANN in diagnosing transformer faults based on DGA data.Both ANN models were trained with gas signatures and tested on real transformer data; feature extraction included key gas methods and graphical representations.RBF network with combined gas signature approach provided the most accurate fault diagnosis; training time for MLP was longer and required significant computational resources.[35]
ANNs for Power Transformers Fault Diagnosis Based on IEC Code Using DGAIn total, 199 transformer DGA samples using a back-propagation ANNTo develop a back-propagation ANN model for DGA fault diagnosis using the IEC Code.The ANN was trained on DGA gas ratios and concentration data based on IEC standards, and accuracy was validated using a confusion matrix.ANN achieved over 90% accuracy in classifying transformer faults but had difficulties distinguishing between certain fault types, such as “no fault” vs. thermal faults.[36]
Fault detection in power transformers
using random neural networks
A total of 600 transformer DGA samples from Punjab
State Transmission Corporation Ltd. (PSTCL) (Patiala, India), RNN with Levenberg–Marquardt and Broyden–Fletcher–Goldfarb–Shanno (BFGS).
To diagnose transformer faults using Random Neural Networks (RNN) and compare the performance of LM and BFGS methodsRNN was trained using DGA data, with feature selection performed via principal component analysis (PCA); LM and BFGS algorithms were tested.BFGS outperformed LM in terms of accuracy (99.33% vs. 94.66%) and required less computational power due to faster convergence.[37]
Fault diagnosis of oil-immersed power transformers using a common vector
approach
A total of 150 DGA samples from the Turkish Electricity Transmission Company, common vector
approach (CVA) technique.
To propose CVA for classifying transformer faults with high accuracy using DGA dataCVA was applied to feature vectors extracted from gas concentrations; performance was evaluated and compared with SVM-PSO, IEC ratios, and Duval Triangle methods.CVA-based method achieved 96% accuracy, outperforming SVM-PSO, Duval Triangle, and IEC ratios; computationally efficient and suitable for real-time fault diagnosis applications.[38]
Transformer condition analyzing expert system using
fuzzy neural system
Fuzzy logic combined with ANN, transformer data incorporated.To develop a hybrid fuzzy-neural system to improve DGA-based transformer fault diagnosis accuracy.A fuzzy-neural expert system was used to combine fuzzy logic for uncertainty handling and ANN for automatic rule learning based on historical data.The fuzzy-neural system achieved higher accuracy than traditional methods and handled multi-fault scenarios better, but required a large dataset for training and was complex.[39]
Table 3. Strengths and limitations of AI techniques.
TechniqueStrengthsLimitations
Fuzzy Logic
Handles imprecise and uncertain data well.
Imitates human reasoning for better fault diagnosis.
Effective for systems with expert knowledge inputs.
Requires expert knowledge to define membership functions and rules.
ANN
Learn non-linear relationships and patterns effectively.
Provides highly accurate fault classification once trained.
Requires large datasets for proper training.
Difficult to interpret because of its “black box” nature.
RNN
Provides robustness in fault detection through probabilistic modeling
Effective in handling random data.
More complex than traditional ANN.
Difficult to implement in real-time systems.
Lacks transparency in decision-making.
CVA
Efficiently reduces dimensionality of DGA data while preserving discriminative features
Less popular and with little evidence to support
Machine Learning
Detects patterns and relationships in large datasets
Flexible in addressing multiple fault types
Models can evolve and improve over time
Requires large historical datasets for training.
Hybrid Methods
Combines strengths of multiple AI techniques
Can improve accuracy and robustness
Increased complexity, making implementation difficult
Longer processing time.
Table 4. Ratios in Dornenburg’s Method [42].
Fault Diagnosis CH4/H2C2H2/C2H4C2H6/C2H2C2H2/CH4
Temperature faults>1<0.75<0.3>0.4
Corona discharge<0.1NS<0.3>0.4
Arcing faults>0.1, <1>0.75>0.3<0.4
Table 5. IEC ratios and associated fault types [18].
Fault Diagnosis CH4/H2C2H2/C2H4C2H4/C2H6
Partial Discharge (PD)<0.1<0.1<0.2
Low energy discharge (D1)0.1–0.5>1>1
High energy Discharges (D2)0.1–10.6–2>2
Thermal Fault—T1 (<300 °C)NSNS<1
Thermal Faults—T2 (300 °C to 700 °C)>1<0.11–3
Thermal Faults—T3 (>700 °C)>1<0.2> 4
NB: Where NS means non-significant, whatever the value.
Table 6. Comparison of traditional DGA methods.
MethodsAdvantagesDisadvantages
Key Gas MethodIt is simple to implement and can separate faults between oil and cellulose with 100% accuracy.Limited to detecting only high-energy discharges. Often provides “No Result,” and it has a lower accuracy for complex faults.
Dornenburg’s Ratio MethodEffective in detecting high-energy electrical discharges and thermal decompositions.Shows “No Result” in many cases, especially for low-energy faults, and fails to detect most healthy transformer cases.
Rogers Ratio MethodHigher success rate in detecting low-temperature thermal faults compared to Dornenburg’s. Capable of incorrectly diagnosing “healthy” low-temperature thermal faults and yet frequently experiences “No Result” situations. 
IEC Ratio MethodIt can detect a wide range of faults with high accuracy, especially between 300 °C and 700 °C.It can misclassify low-energy discharges as high-energy ones and has a low detection rate for low-energy faults. 
Duval Triangle methodHigh accuracy in detecting high-energy discharges and widely used for its detailed classification.Detects many normal situations as thermal faults, and has lower accuracy in detecting low-energy discharges and partial PD.
Duval PentagonMore accurate than the Duval Triangle when it comes to low-energy and partial discharge faults.Still not fully reliable for all types of faults, complex to implement, and requires more refinement for broad fault types.
Table 7. Key Gas Method.
Key GasFault TypeProportions of Generated Combustible Gases
Ethylene (C2H4)Thermal Faults High C2H4 with smaller proportions of Ethane, CH4, and Hydrogen. Traces of C2H2 at very high fault temperatures.
Carbon Monoxide (CO) and Carbon Dioxide (CO2)Cellulose BreakdownHigh CO and CO2 with lesser quantities of the H2 gases, mostly C2H4 with smaller proportions of C2H6, CH4, and H2.
Hydrogen (H2)Partial Discharge (PD)Predominantly H2 with small proportions of CH4 and bits of C2H4 and C2H6.
Hydrogen (H) and Acetylene (C2H2)ArcingHigh quantities of H2 and C2H2 with small traces of CH4, C2H4 and C2H6.
Table 8. Codes used in Roger’s Ratio [48].
Ratio CodeRangeCodeIntensity
CH4/H2—(i)X ≤ 0.15Low
0.1 ≤ X < 1.00Medium
1.0 ≤ X < 3.01High
X ≥ 3.02Very High
C2H6/CH4—(j)X < 1.00Low
X ≥ 1.01High
C2H4/C2H6—(k)X ≤ 1.00Low
1.0 ≤ X < 3.01Medium
X ≥ 3.02High
C2H2/C2H4—(l)X < 0.50Low
0.5 ≤ X < 3.01Medium
X ≥ 3.02High
Table 9. Diagnostic fault scenarios in the Roger’s Ratio method [6,48].
No.CH4/H2 (i)C2H6/CH4 (j)C2H4/C2H6 (k)C2H2/C2H4 (l)Diagnosis (Fault Type)
10000Normal
25000PD
31–2000Thermal (<150 °C)
41–2100Thermal (150–200 °C)
50100Thermal (200–300 °C)
60010Conductor Overheating
71010Winding Circulating Currents
81020Core and Circulating Currents (300–700 °C)
90001Flashover Without Power Follow-Through
10001–21–2Arch With Power Follow-Through
110022Continuous Sparking to Floating Potential
125001–2PD With Tracking
Table 10. IEC ratio coding scheme [48].
Ratio CodeRangeCode
C2H2/C2H4 (l)X < 0.10Low
0.1 < X < 3.01Medium
X > 3.02High 
CH4/H2 (i)X < 0.11Low
0.1 < X < 1.00Medium 
X > 1.02High 
C2H4/C2H6 (k)X < 1.00Low 
1.0 < X < 3.01Medium 
X > 3.02High 
Table 11. Total possible diagnosis faults for the IEC ratio method [5].
No.C2H2/C2H4 (l)CH4/H2 (i)C2H4/C2H6 (k)Diagnosis (Fault Type)
1001Normal aging
21–210PD of low energy density 
3110PD of high-energy discharge
41–201–2D1
5102D2
6001Thermal fault—T1 (<150 °C)
7020T1 (150–300 °C)
8021T2 (300–700 °C)
9022T3 (>700 °C)
Table 12. Coordinates of the Duval Triangle [48].
AreaPoints%CH4%C2H4%C2H2
D1D1100100
D1202377
D13642313
D1487013
D2D2102377
D2207129
D23314029
D24474030
D25642313
DTDT107129
DT20855
DT3355015
DT446504
DT59604
DT687013
DT7474013
DT8314029
T1T1176204
T1280200
T139820
T149822
T159604
T2T2146504
T2250500
T2380200
T2476204
T3T3108515
T3201000
T3350500
T34355015
PDPD19820
PD210000
PD39802
Table 13. Duval Triangle fault zone mapping.
Fault ZoneCH4 (%)C2H4 (%)C2H2 (%)
PD98–1000–20–2
D10–870–2313–100
D20–6423–7113–77
DT0–960–854–29
T176–980–200–4
T246–8020–500–4
T30–5050–1000–15
Table 14. Gas percentage ranges.
V_LowLowMediumHighV_High
CH4 (%)0–1510–3530–6050–9080–100
C2H4 (%)0–1510–3530–6050–9080–100
C2H2 (%)0–105–2520–5045–8075–100
Table 15. Input sample data of known fault types.
No.H2CH4C2H6C2H4C2H2COKnown Fault
1241354331945D1
250710532971440173034IB
33933792991Normal
4107272518650D1
5144338991115600113934T1
6507105329714401722T3
7160103110PD
824020528960PD
972278289176053T1
1094744345353651712,752504D2
11104404138678531T3
12120554199839930T2
13111019442232IB
1444120743224261234D2
1525877.884.71.40.10PD
1614911728211190112D2
176902845049452414D2
18127780137107719602T3
19823591964010397T2
205225082327672D2
21153175722024133T2
22552461708Normal
2313513870185Normal
2422.422.42.6913.441.57112T3
250.670.2240.0450.0670.00211.2T2
2626021535334277416D2
272240157901574567PD
2894744345353651712,752504D2
2916877539530300T3
30800139330428173001543PD
31199770217150872453T3
32244754172128127275T3
33117167484817532T2
34274275339732D1
3512493705660613711673D2
362402052896376D1
37337930215556T3
3830722233109465PD
396014467449954T2
40200497392750511305642T2
41103748091754IB
4212416687590530IB
43540040106Normal
4412710711154224236PD
45391.70.60.10.10D1
461037480900T1
4748610291000T1
48203114920300T1
4962513047200T1
5037,8001740249880PD
Table 16. Fault detection of each individual method and the integrated method.
No.Roger’s RatioIEC RatioDuval TriangleKey Gas MethodIntegrated
Final Method
Known Fault
1No predictionD1D1D1D1D1
2T2T3No predictionIBIBIB
3D1T2T1IBIBNormal
4D1D1D1D1D1D1
5T1T1D2No predictionT1T1
6T2T3T3T3T3T3
7PDPDD1PDPDPD
8PDT2D1D1D1PD
9T1T1T2No predictionT1T1
10D2D2D1D2D2D2
11T3T3T3T3T3T3
12T2T3T2T3T2T2
13T2T1T3IBIBIB
14D2D2D2No predictionD2D2
15NormalPDT1PDPDPD
16D2D2D2D2D2D2
17D2D2D2D2D2D2
18T3T3T3T3T3T3
19No predictionT2T2T2T2T2
20D2D1D1No predictionD1D2
21T2T2DTT3T2T2
22T2T3T3IBD2Normal
23NormalPDT2PDPDNormal
24T3D1T2IBD2T3
25No predictionT1T1IBT1T2
26D2D2D2No predictionD2D2
27PDD1D2PDPDPD
28D2D2D1No predictionD2D2
29T3T3T3T3T3T3
30PDT3D2PDPDPD
31T3T3T3T3T3T3
32T3T3T3T3T3T3
33T2T3T3T3T3T2
34T3T2D1D1D1D1
35T2D2D1D2D2D2
36PDD1D1PDD1D1
37T2T3T3T3T3T3
38PDT1D1PDPDPD
39T2T2T3T2T2T2
40No predictionT2T2No predictionT2T2
41PDNormalD2IBIBIB
42T1T1T1IBT1IB
43NormalNormalT3PDNormalNormal
44T3D2D2D2D2PD
45PDPDD2PDPDD1
46T1NormalD2T1T1T1
47T1T1T1T3T1T1
48NormalPDT1PDPDT1
49T1NormalD2T1T1T1
50PDPDPDPDPDPD
Disclaimer/Publisher’s Note: The statements, opinions and data contained in all publications are solely those of the individual author(s) and contributor(s) and not of MDPI and/or the editor(s). MDPI and/or the editor(s) disclaim responsibility for any injury to people or property resulting from any ideas, methods, instructions or products referred to in the content.