Article

Three-Dimensional Modeling of Natural Convection During Postharvest Storage of Corn and Wheat in Metal Silos in the Bajío Region of Mexico

by
Fernando Iván Molina-Herrera
1,
Luis Isai Quemada-Villagómez
2,
Mario Calderón-Ramírez
3,
Gloria María Martínez-González
4 and
Hugo Jiménez-Islas
1,*
1
Departamento de Ingeniería Bioquímica y Ambiental, Tecnológico Nacional de México, Antonio García Cubas Pte. #600, Celaya 38010, Gto., Mexico
2
Departamento de Ciencias Básicas, Tecnológico Nacional de México, Celaya 38010, Gto., Mexico
3
Departamento de Diseño y Desarrollo de Equipo, Tecnológico Nacional de México, CRODE, Celaya 38020, Gto., Mexico
4
Departamento de Ingeniería Química, Tecnológico Nacional de México, Celaya 38010, Gto., Mexico
*
Author to whom correspondence should be addressed.
Eng 2025, 6(9), 224; https://doi.org/10.3390/eng6090224
Submission received: 6 August 2025 / Revised: 27 August 2025 / Accepted: 1 September 2025 / Published: 3 September 2025
(This article belongs to the Section Chemical, Civil and Environmental Engineering)

Abstract

This study presents a three-dimensional numerical analysis of natural convection during the postharvest storage of corn and wheat in a galvanized steel silo with a conical roof and floor, measuring 3 m in radius and 18.7 m in height, located in the Bajío region of Mexico. Simulations were carried out specifically for December, a period characterized by cold ambient temperatures (10–20 °C) and comparatively lower solar radiation than in warmer months, yet still sufficient to induce significant heating of the silo’s metallic surfaces. The governing conservation equations of mass, momentum, energy, and species were solved using the finite volume method under the Boussinesq approximation. The model included grain–air sorption equilibrium via sorption isotherms, as well as metabolic heat generation: for wheat, a constant respiration rate was assumed due to limited biochemical data, whereas for corn, respiration heat was modeled as a function of grain temperature and moisture, thereby more realistically representing metabolic activity. The results, obtained for December storage conditions, reveal distinct thermal and hygroscopic responses between the two grains. Corn, with higher thermal diffusivity, developed a central thermal core reaching 32 °C, whereas wheat, with lower diffusivity, retained heat in the upper region, peaking at 29 °C. Radial temperature profiles showed progressive transitions: the silo core exhibited a delayed response relative to ambient temperature fluctuations, reflecting the insulating effect of grain. In contrast, grain at 1 m from the wall displayed intermediate amplitudes. In contrast, zones adjacent to the wall reached 40–41 °C during solar exposure. In comparison, shaded regions exhibited minimum temperatures close to 15 °C, confirming that wall heating is governed primarily by solar radiation and metal conductivity. Axial gradients further emphasized critical zones, as roof-adjacent grain heated rapidly to 38–40 °C during midday before cooling sharply at night. Relative humidity levels exceeded 70% along roof and wall surfaces, leading to condensation risks, while core moisture remained stable (~14.0% for corn and ~13.9% for wheat). Despite the cold ambient temperatures typical of December, neither temperature nor relative humidity remained within recommended safe storage ranges (10–15 °C; 65–75%). These findings demonstrate that external climatic conditions and solar radiation, even at reduced levels in December, dominate the thermal and hygroscopic behavior of the silo, independent of grain type. The identification of unstable zones near the roof and walls underscores the need for passive conservation strategies, such as grain redistribution and selective ventilation, to mitigate fungal proliferation and storage losses under non-aerated conditions.

1. Introduction

Grain storage in silos is a crucial part of the agri-food supply chain, as it directly affects the preservation of the nutritional and sanitary quality of products intended for human and animal consumption. Among the most important cereals worldwide are corn and wheat, which are key pillars of food security due to their high nutritional content, wide adaptability to different climatic conditions, and their role as dietary staples in many parts of the world [1,2,3,4]. Furthermore, they serve as essential raw materials in the food, livestock, and biofuel industries. Safe and efficient storage of these grains is crucial to minimize postharvest losses, prevent deterioration caused by fungi and insects, and ensure a consistent supply of staple foods. In this context, metal silos have become the most widely used storage structures, both in large-scale agri-food industries and among small rural producers, due to their numerous advantages. These structures can store large quantities of grain in a relatively small space, facilitate handling and unloading, provide protection against adverse weather conditions, and minimize exposure to insects and fungi. Additionally, their design enables them to adapt to various geographic areas, making them a versatile and practical option for many grain-producing regions worldwide.
However, during the grain storage in silos, two key factors determine the quality of the stored grain: temperature and moisture [5,6,7,8]. These parameters directly influence the grain respiration rate, the development of fungi and insects, and the formation of hot spots prone to condensation or deterioration. The distribution of these two parameters within the silo primarily occurs through the phenomenon of natural convection, which arises from density differences in the intergranular air due to thermal and moisture gradients, both internal and environmentally induced [9]. These convective currents can lead to the formation of high-temperature zones and the migration of moisture toward cooler regions, creating critical conditions for grain preservation.
Considering the importance of temperature and moisture in determining the quality of stored grain, it is essential to understand how these parameters are distributed within the silo over time [10,11]. However, obtaining this distribution experimentally poses a significant challenge, as the measuring devices—such as thermocouples and humidity sensors—are typically limited to discrete locations and cannot accurately capture the conditions throughout the entire silo volume. Moreover, installing dense sensor networks can be costly, invasive, and impractical in silo environments. For these reasons, several research groups have developed mathematical models to simulate temperature and moisture gradients within silos [2,9,12,13,14,15,16,17,18,19,20,21,22]. These models are based on the conservation equations of momentum, mass, and energy, formulated for multiphase systems that represent the coupling between grain and intergranular air in porous media. This numerical approach has enabled more detailed predictions of critical zone evolution, the optimization of preservation strategies, and the development of more accessible and efficient monitoring and control tools.
One of the first contributions to three-dimensional thermal modeling of silos was presented by Alagusundaram et al. [23], who developed a conduction-only heat transfer model applied to the storage of canola and barley. The model was formulated in Cartesian coordinates and incorporated realistic boundary conditions, including solar radiation on the south wall and natural convection with the surrounding environment. It was experimentally validated in two silos located in Winnipeg, Canada. The results showed temperature errors ranging from 1.5 °C to 4.9 °C and demonstrated that 3D models predict temperature gradients more accurately than 2D approaches, particularly when thermally asymmetric conditions are induced by climate change. Years later, Thorpe [24] proposed a comprehensive two-dimensional model of the silo ecosystem, specifically designed for wheat storage, which simultaneously incorporated the interactions between grain, intergranular air, insect dynamics, and the effects of fumigants. This model incorporated natural convection of heat and mass for the different species, enabling the identification of critical zones within the silo where high temperatures, moisture, and insect populations coincide—factors that pose a significant risk for grain spoilage. Additionally, it provided a tool to simulate the impact of aeration and fumigation strategies, becoming one of the first models to treat the silo as a complete multiphase and biological system.
Subsequently, Jia et al. [4] developed a two-dimensional model in cylindrical coordinates to simulate the temperature distribution in a wheat storage silo with an internal heat source. The study showed that the hottest zones are located at the center and upper part of the silo, while the walls follow external temperature fluctuations. Montross et al. [6] developed a 3D model to study the thermal behavior of corn stored in silos, which was validated using experimental data obtained in Kansas. The model considered heat transfer by conduction through the grain and convection between the silo walls and the ambient air, incorporating variables such as external temperature, solar radiation, and wind speed. The results showed that the grain mass has high thermal inertia and that silo walls exhibit greater temperature variability than the core, which remains more stable.
That same year, Andrade et al. [14] developed a 3D model to predict corn temperature in metallic silos, experimentally validated in Brazil. The corrugated steel silo was instrumented with thermocouples distributed across different quadrants and heights. The mathematical model incorporated environmental conditions, such as solar radiation and convection, with the exterior, and accurately reproduced the thermal behavior over a 160-day storage period. The results showed good agreement between simulated and experimental data, with errors below 5%, demonstrating that the center of the silo maintains a more stable temperature than the wall-adjacent zones exposed to radiation.
Jiménez-Islas et al. [25] conducted a two-dimensional numerical study to analyze natural convection of heat and mass in cylindrical silos filled with air and sorghum, using an axisymmetric domain and considering heat and moisture generation due to grain respiration and temperature gradients on the silo walls. The model simultaneously solved the conservation equations for energy, mass, and momentum under the Boussinesq approximation for porous media. A hot core formed at the upper section of the central axis of the silo, along with a single convective flow cell. The warmest regions also showed relative humidity buildup, which poses a risk to the stored grain’s quality. Abalone et al. [16] compared the thermal and hygroscopic behavior of wheat and soybean stored in real silos in Rosario, Argentina, using a two-dimensional axisymmetric model. The study accounted for the specific properties of each grain and the real environmental conditions during winter. It was observed that soybeans had higher moisture accumulation near the wall areas, while wheat exhibited less migration, keeping intergranular air humidity below the critical level for fungal growth. The model enabled the identification of thermal and moisture risk zones that differ between grains.
Jian et al. [26] conducted an experimental study on wheat storage over 15 months under real conditions in Canada. Temperature, intergranular air relative humidity, grain moisture content, and insect population were monitored. It was found that the highest temperatures were concentrated in the upper and central regions of the silo. At the same time, moisture content remained within safe ranges for most of the storage period. The study demonstrated that temperature control is crucial in preventing insect proliferation hotspots. Wang et al. [27] developed a three-dimensional model to simulate the temperature distribution of wheat stored in a metal silo exposed to ambient temperature conditions. The model solved the transient conservation equations of mass, energy, and momentum, taking into account solar radiation and convection between the silo walls and the surrounding air. The simulation results were validated against experimental data obtained in China. The results showed that the warmest area was located in the upper region and along the south-facing wall of the silo, which was exposed to solar radiation, highlighting the impact of solar orientation. Carrera-Rodríguez et al. [19] developed a two-dimensional numerical model to study the effect of variable ambient temperature on natural convection within sorghum silos. The model solved the conservation equations of mass, energy, and momentum in porous media, considering metabolic heat from the grain, environmental thermal gradients, and double diffusion. A hot core was observed forming at the upper central axis, along with zones of elevated relative humidity, which are associated with an increased risk of fungal growth. The model demonstrated that environmental thermal control is critical for designing conservation strategies in the absence of aeration.
In more recent years, Quemada-Villagómez et al. [17] developed a two-dimensional numerical model to simulate natural convection in a cylindrical silo filled with sorghum and exposed to variable environmental conditions. The study solved the conservation equations of mass, energy, and momentum under the Boussinesq approximation, considering the metabolic heat generation from the grain and solar radiation on the south-facing wall. The results showed the formation of an upward flow vortex on the heated side and a downward flow on the shaded side, accompanied by the accumulation of heat and moisture in the upper part of the silo, indicating a critical environment for microbial development. Wang et al. [27] proposed a hybrid model that combines computational fluid dynamics (CFD) with a neural network–based prediction algorithm to forecast the internal temperature of stored rice. The model was trained using historical data and experimentally validated, showing a significant improvement in accuracy compared to traditional methods. This methodology enabled the simulation of long-term storage scenarios, reducing computational time and optimizing thermal management strategies in silos.
Despite the development and implementation of mathematical models for analyzing grain storage in silos, there are no prior studies that specifically examine the thermal and hygroscopic behavior of corn and wheat, two important agri-food cereals in the state of Guanajuato. This is especially true in the Bajío region, where their cultivation is a key economic activity. This study aims to analyze and compare the natural convection phenomena occurring in an industrial-scale metal silo during the storage of corn and wheat separately, under actual climatic conditions and incident solar radiation during December, which aligns with the local harvest and storage period. This analysis will help identify differences in temperature and moisture distribution patterns for each grain, which are crucial for designing more effective preservation strategies. This is particularly important for small-scale producers who rely on passive storage systems and have limited technological means to control internal silo conditions. Additionally, the results will enhance understanding of natural convection in porous media and support efforts to improve regional food security through better management of stored cereals.

2. Materials and Methods

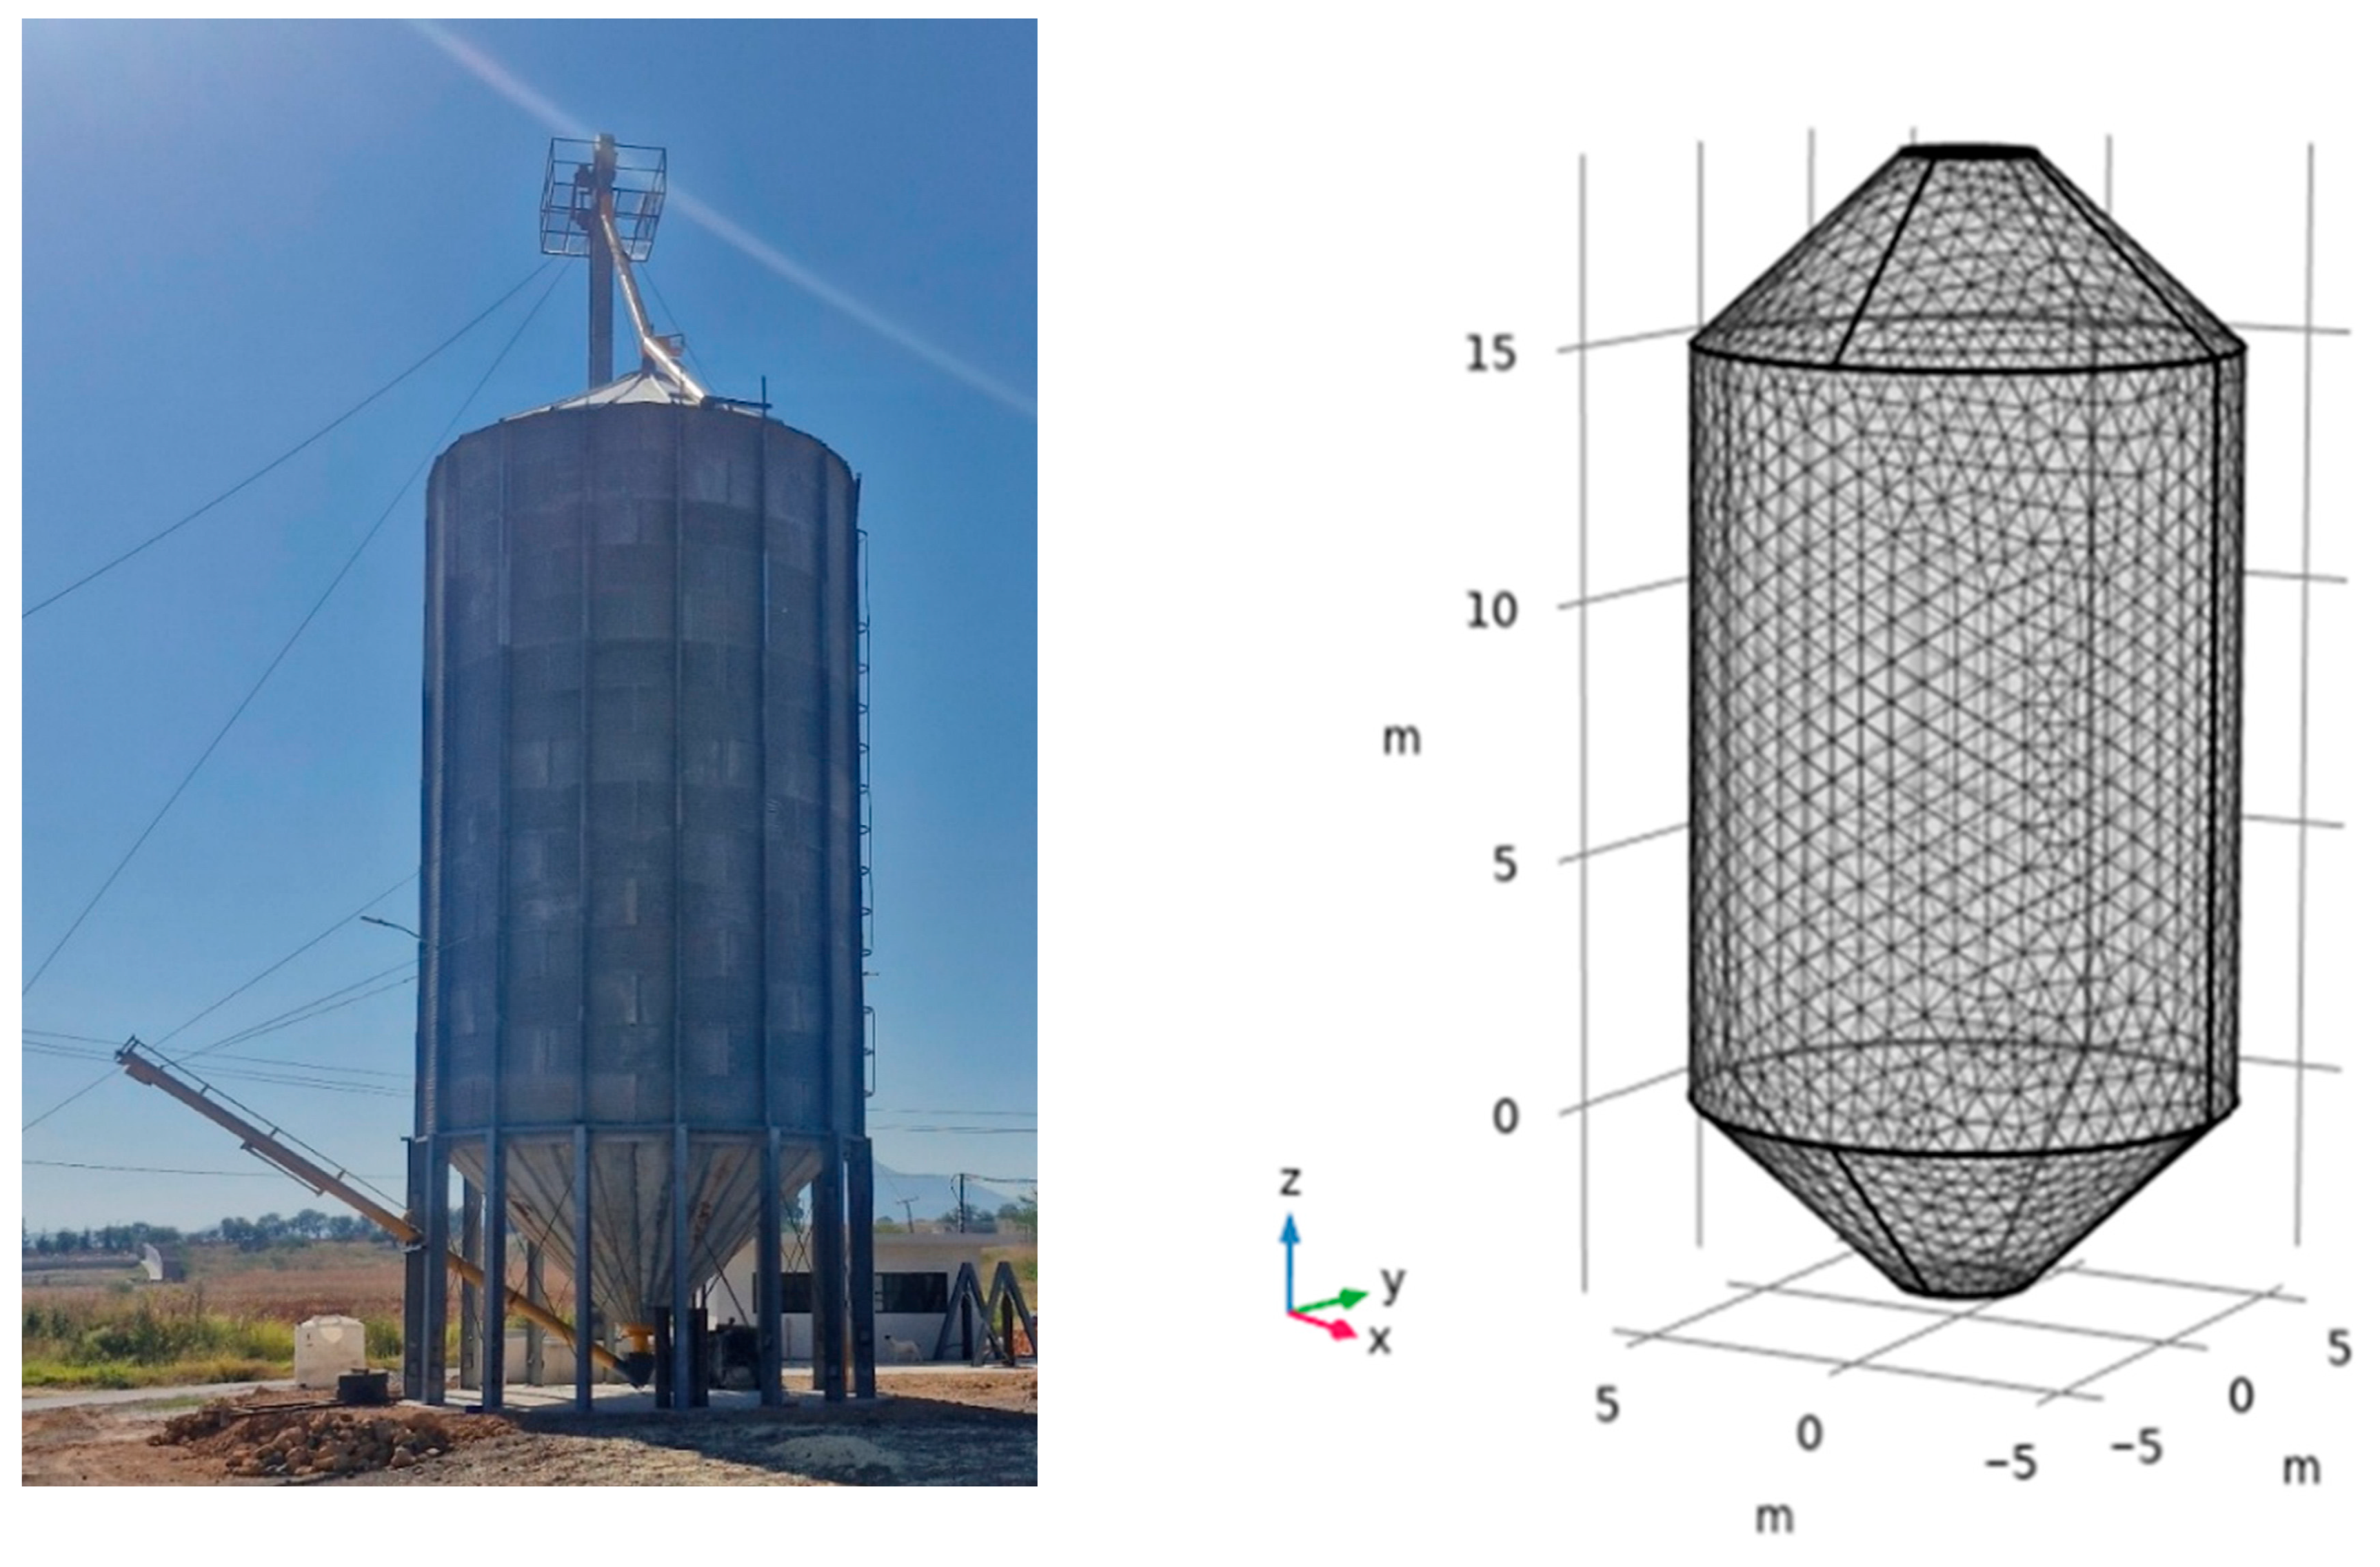
This study analyzes a galvanized steel cylindrical silo with a conical roof and floor, measuring 3 m in radius and 18.7 m in total height. Both the roof and the conical floor represent one-quarter of the total height of the silo. This storage system is located in the Bajío region, specifically in the community of San Miguel Eménguaro, Salvatierra Municipality, Guanajuato, Mexico. The silo has a storage capacity of 450 tons of corn or 420 tons of wheat, and its proximity to cultivation areas enables producers to harvest at the optimal time, avoiding logistical delays or congestion at more distant facilities. Figure 1 shows the physical structure of the silo and the computational domain used in the three-dimensional simulation.

2.1. Mathematical Model

The equations governing transport processes in a grain-filled silo include continuity, momentum, energy, and mass conservation equations. By applying microscopic balances to the discontinuous phase ω (grain) and the continuous phase γ (interstitial air), the equations for an effective medium are derived. It is important to emphasize that these equations are independent of the silo size or the type of grain stored; it is only necessary to know the specific physical and thermodynamic properties of the grain, such as density, porosity, specific heat capacity, thermal conductivity, the hygroscopic equilibrium isotherm, and the geometric dimensions of the silo [11,15,23].
Continuity equation:
ρ γ ( · u γ ) = 0
Momentum equation (Darcy’s law with Brinkman’s extension):
ρ γ ε u γ t + u γ · u γ = · P I + μ u γ + u γ T μ κ 1 u γ + g ρ γ
Energy equation:
ρ c p γ T β t + u γ · T = k e f f 2 T β + Q 0 λ v k y ρ γ a v Y Y i
Mass equation for moisture in the grain:
ρ ω c ω t = D ω 2 c ω + P 0 k y ρ γ a v Y i Y
Mass equation for humidity in the air:
c γ t = D γ 2 c γ + k y a v Y i Y
The mathematical model represented by Equations (1)–(5) was used to study the natural convection that develops independently during the storage of corn and wheat throughout December. Equation (1) corresponds to the conservation of mass for an incompressible fluid within a control volume, which implies that no significant volumetric changes are considered due to pressure or temperature effects. This assumption allows density to be treated as constant, except within the body force term. The latter incorporates buoyancy effects generated by temperature and concentration gradients, leading to the phenomenon known as double diffusion [11,23], which is expressed as ρ γ = ρ 0 1 β T T 0 β c C C 0 . It is worth noting that although grains exhibit low permeability (κ ≈ 10−8), the Darcy equation alone is not suitable for describing the flow near the silo walls, where environmental temperature variations—particularly those associated with solar radiation—can induce significant thermal gradients. These, in turn, generate strong velocity gradients in the interstitial air. Therefore, the correction proposed by Brinkman is applied, which extends the Darcy equation by incorporating the effects of viscous stresses. This version, known as the Darcy–Brinkman equation, integrates elements of both the Darcy and Navier–Stokes equations, allowing for a more accurate description of low-velocity flows in porous media, such as those that occur during natural convection. In the limiting case where κ tends to infinity, the equations reduce to the classical Navier–Stokes model.
Equation (3) represents the energy balance, including the metabolic heat generation of the grain as a function of its temperature and moisture content, as well as the production of water vapor derived from glucose metabolism, which increases the humidity of the intergranular air. Equation (4) expresses the moisture balance within the grain, also accounting for water production due to respiration and moisture exchange with the air based on sorption equilibrium. Finally, Equation (5) describes the moisture balance in the interstitial air, including a term that represents the release of water vapor into the air caused by grain respiration. All these mathematical expressions are summarized in Table 1 for both corn and wheat, and some were obtained through nonlinear regressions based on experimental data [25,28].
For both cases under analysis (corn and wheat), it is assumed that the silo is wholly filled with grain at an initial moisture content X0 (kg water/kg dry solid). At the same time, the interstitial air is saturated, with an initial absolute humidity Y0 (kg water/kg dry air) and a dry-bulb temperature T0. The grain is modeled as an isotropic porous medium saturated with a Newtonian fluid, and effective transport properties are assigned. The specific thermodynamic properties used for corn and wheat are shown in Table 2, while Table 3 presents the physical and thermodynamic properties of air used for both cases.

2.2. Boundary Conditions for Ambient Temperature Variation

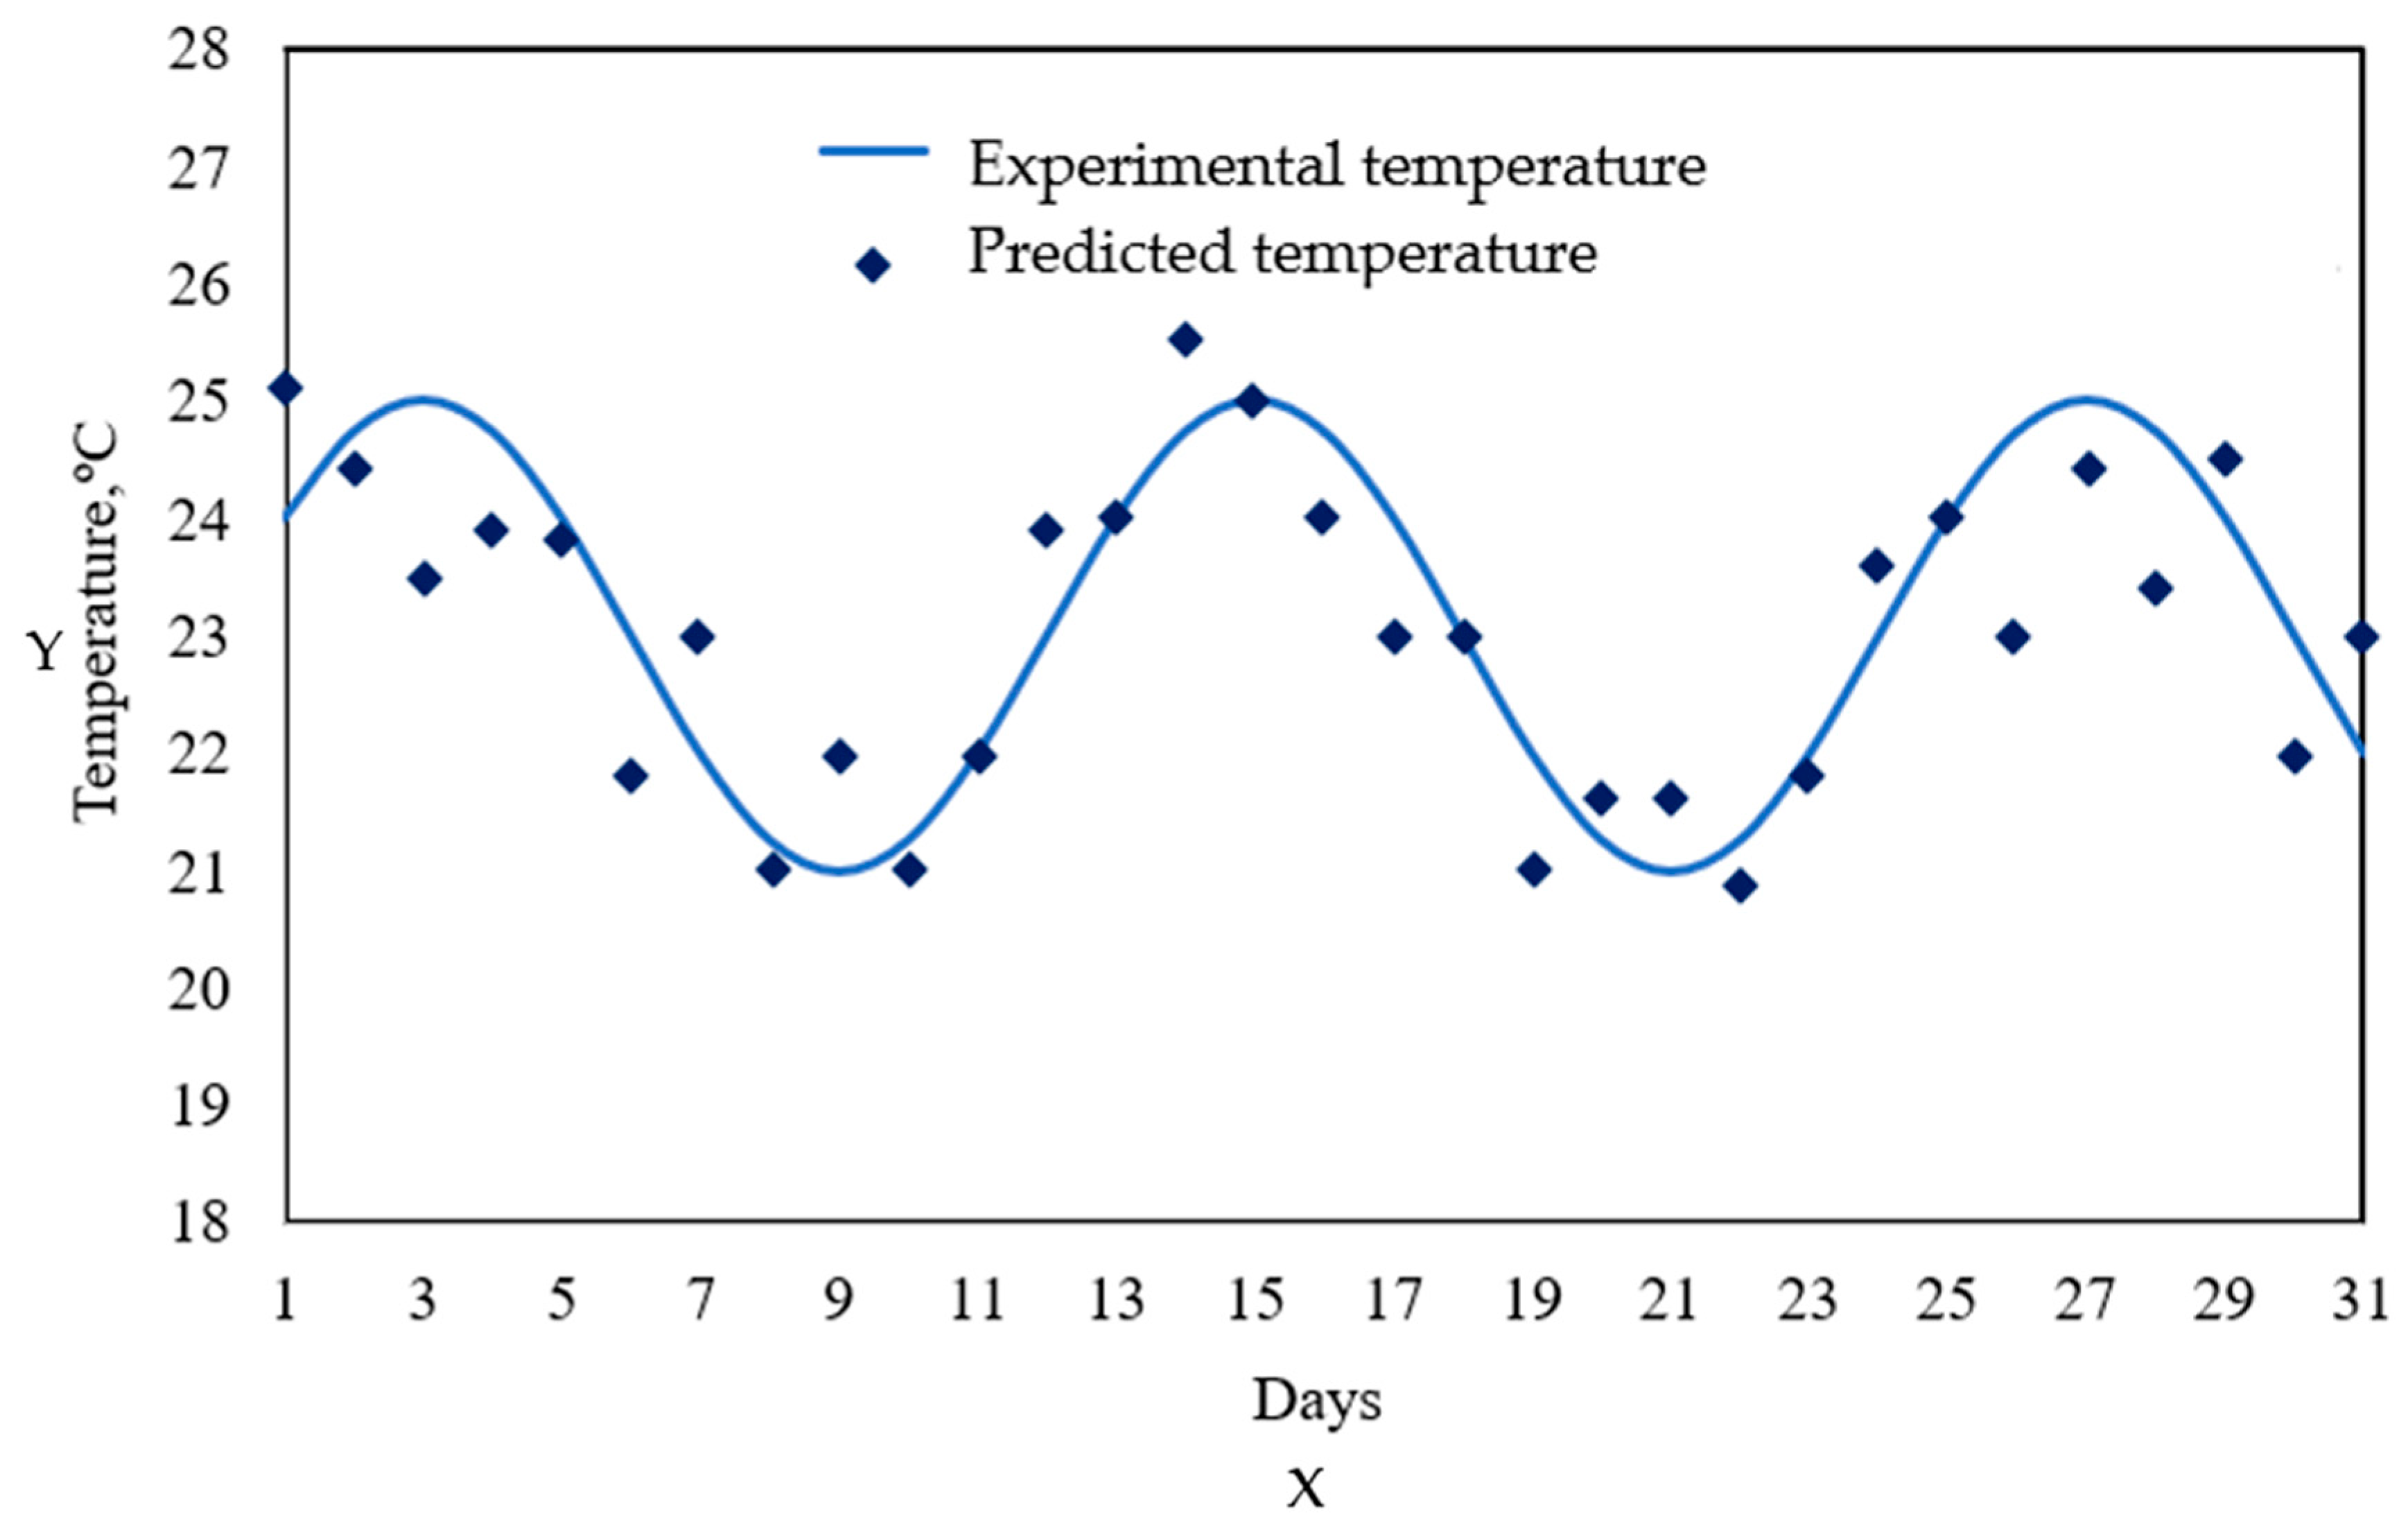
To account for ambient temperature variations over the silo walls and roof, which represent the interaction between natural convection within the porous domain and the external ambient fluid, the model proposed by Quemada-Villagómez et al. [30] was employed for the Bajío region in the state of Guanajuato during the storage period. This model efficiently estimates the evolution of daily ambient temperature based on representative climatic data from the study location. The proposed model combines a Gaussian-type function to estimate daily maximum and minimum temperatures throughout the year (see Equations (4) and (5)), with a cosine function that describes hourly variation during each day. This approach is characterized by its simplicity, accuracy, and low data requirements, as it only needs the annual maximum and minimum recorded temperatures, along with the day number (1 to 365), as inputs. Among its main advantages are its ease of implementation—even with tools such as Microsoft Excel®—its high accuracy, with errors below 2% in most cases, and its versatility, as it can be applied in different regions of the world, particularly between latitudes −62° and +62°. Due to this feature, Equation (8) was used to approximate the average ambient temperatures during December as part of the mathematical model. This equation enables the calculation of hourly average temperature throughout the day using only the maximum and minimum temperature values, previously obtained through curve fitting. Table 4 presents the fitted parameters for the state of Guanajuato, specifically in the Bajío region, which served as a reference for generating the ambient temperature curves in this study. This method provides a reliable and straightforward tool for simulating daily thermal behavior, eliminating the need for extensive databases or computationally intensive models. Figure 2 compares the average temperatures recorded in the Bajío region during December with those predicted by Equation (8). Figure 2 shows excellent agreement between the two curves, confirming the accuracy of the proposed model in predicting ambient temperature variations throughout the month. This consistency between simulated and experimental data supports the reliability of the model presented by Quemada-Villagómez et al. [30] for studying the effect of ambient variations during grain storage.
T M a x = a M a x e t 1 b M a x 2 2 c M a x + d M a x
T M i n = a M i n e t 1 b M i n 2 2 c M i n + d M i n
T a m b = T M a x + T M i n 2 T M a x T M a x + T M i n 2 c o s π 12 t 2 + 2 p π 12 24

2.3. Boundary Conditions for Solar Radiation

Since the silo is located outdoors, it is exposed to solar radiation that directly affects its walls and roof, leading to a significant rise in surface temperature, especially during midday hours [29,30]. This radiation varies throughout the 24 h cycle, being absent during the night (00:00 to 07:00 h), gradually increasing from sunrise, peaking around noon when the Sun is near its highest point, and then decreasing toward sunset. During this daily cycle, the east- and west-facing walls receive different levels of radiation, resulting in uneven heating that can create temperature gradients and heat transfer to the grain in contact with the walls. This thermal effect is significant in metallic silos, as the sheet metal has low thermal inertia and high thermal conductivity, which enables rapid heat absorption [29,30,31]. Therefore, in the model, it is necessary to include equations that predict solar radiation as a function of the time of day. Duffie and Beckman [32] compiled the equations in their book that describe the amount of radiation received by a metallic body, such as a silo, which are shown below.
Time equation:
E = 229.2 0.000075 + 0.001868 cos B 0.032077 sin B 0.014615 cos 2 B 0.04089 sin 2 B
Time constant:
B = 360 365 J 81
Local solar time:
S T = L T + E T 60 + 4 60 L s L L
Hour angle:
ω = 15 12 S T
Solar declination:
δ = 23.5 sin 360 365 J + 284
Solar altitude:
sin α = cos cos δ cos ω + sin sin δ
Air mass ratio:
m = 1229 + 614 sin α 2 0.5 614 sin α
Extraterrestrial intrinsic irradiance:
R a ¯ = R s c 1 + 0.033 cos 2 π J 365
Extraterrestrial irradiance on horizontal surface:
R a h ¯ = R s c 1 + 0.033 cos 2 π J 365 sin α
Extraterrestrial irradiance on vertical surface:
R a v ¯ = R a ¯ 2 R a h ¯ 2
Direct irradiance on horizontal surface:
R h ¯ = R a h ¯ 0.7 m 0.678
Direct irradiance on vertical surface:
R v ¯ = R a v ¯ 0.7 m 0.678
Total irradiance on horizontal surface:
R h t ¯ = 1.1 R h ¯
Total irradiance on vertical surface:
R v t ¯ = 1.1 R v ¯
The earlier equations enable the estimation of the direct solar radiation incident on the metallic surface of the silo by combining astronomical, atmospheric, and geographical components, thereby accurately predicting the amount of solar energy transferred to the surface and contributing to its heating. This analysis is essential, given that metallic sheets exposed to sunlight absorb a significant percentage of this energy, generating thermal gradients toward the interior of the silo and potentially inducing natural convection flows that affect grain storage conditions [29,30,31].
The set of equations begins with the equation of time (E), which accounts for the discrepancy between true solar time and mean solar time resulting from Earth’s orbital eccentricity and axial tilt. This equation depends on an angular parameter, B, which is calculated based on the Julian day (J), representing the number of days since January 1st. Using this correction, the local solar time (ST) is determined, considering the geographic longitude (LL), the standard meridian of the time zone (LS), and the local time (LT). This variable indicates the actual time when the Sun reaches its highest point in the sky (solar noon) at a specific location. From the local solar time, the solar hour angle (ω) is calculated, representing the angular displacement of the Sun relative to the local meridian, with ω = 0° at solar noon. This is essential to determine the sun’s position in the sky throughout the day [32]. The solar declination (δ) is then computed, which is the angle between the Sun’s rays and the Earth’s equatorial plane. This angle varies over the year due to Earth’s axial tilt. It is expressed as a periodic function of Julian day, providing an accurate model of the seasonal changes in solar position. Using δ, along with the solar hour angle (ω) and the site’s latitude (ϕ), the solar altitude angle (α) can be calculated. This angle shows the Sun’s elevation above the horizon at a specific time and influences the amount of solar energy received on a horizontal or inclined surface [32]. Based on the solar altitude α, the air mass ratio (m) is determined. This ratio measures the relative thickness of the atmosphere that solar radiation passes through before reaching the surface. It is a key parameter because the atmosphere attenuates radiation through absorption, scattering, and reflection. When the Sun is near the horizon (at low solar altitude), m increases, indicating more attenuation; conversely, when the Sun is high in the sky (near the zenith), m approaches 1, meaning attenuation is minimal.
With these geometric and atmospheric variables defined, the extraterrestrial irradiance is calculated [Equation (16)], representing the solar radiation at the top of the atmosphere. It is adjusted for the Earth–Sun distance using a harmonic expression involving the Julian day. This irradiance is then projected onto horizontal [Equation (17)] and vertical surfaces [Equation (18)], depending on the solar angle of incidence. The direct solar irradiance on the silo’s horizontal [Equation (19)] and vertical walls [Equation (20)] is estimated using empirical expressions involving a mean atmospheric transmittance factor (typically 0.7) raised to the power of the air mass ratio [32]. These formulas reflect the exponential decay of beam irradiance as solar radiation passes through the atmosphere. Finally, Equations (21) and (22) calculate the total solar irradiance (direct plus diffuse) on horizontal and vertical surfaces, respectively. In this study, diffuse radiation is assumed to be 10% of the direct irradiance, consistent with experimental observations under clear-sky conditions.
Together, these equations enable time-resolved predictions of solar energy input on different sections of the silo throughout the day and year. The outputs feed into the energy boundary conditions of the numerical model, allowing for a realistic simulation of solar-induced heating of the metallic surfaces and the resulting heat transfer to the grain. This is critical for understanding the formation of temperature gradients, natural convection streams, and regions prone to moisture condensation within the storage system.
Based on the experimental measurement of the effect of solar radiation, described below, a simple approach has been proposed to address the light–shadow effect that manifests throughout the solar day. This approach assumes that diffuse solar radiation is 10% of direct solar radiation, keeping in mind that total solar radiation is the sum of direct radiation and diffuse radiation. Therefore, in the morning, the vertical walls of the silo and the lower conical section (which face east) receive total irradiance R v t ¯ . In contrast, the west-facing section is shaded and only receives diffuse solar radiation. For simplicity, the upper conical section will receive total solar radiation throughout the solar day. At zenith time, the light–shade position changes. The west-facing vertical wall and conical bottom now receive total solar irradiance R v t ¯ , while the east-facing vertical wall and conical bottom now receive shadow, so only diffuse radiation will be present. The scheme is applied daily throughout the simulation period.
With these considerations, the boundary condition that incorporates solar radiation incident, dissipation to the environment, and heat transfer to the grain is established, thereby defining the net heat flux across all exposed walls.
k w T w n = a R i n h w T T a m b ε σ T w 4 T s k y 4
Equation (23) not only enables the calculation of incident irradiance R i n (which encompasses above considerations of total and diffuse solar radiation that affect the various sections of the silo) but also serves as the basis for a comprehensive energy analysis that accounts for the thermal dynamics of the metal sheets in the silo, which are essential for predicting their influence on grain temperature and internal natural convection processes. Table 5 presents the properties considered in the boundary condition formulation for solar radiation used for simulations. These include astronomical, geographic, and thermal variables required to calculate the incident irradiance and heat transfer on the silo surface. All values correspond to typical daytime conditions in the state of Guanajuato during the study period (December 2023).
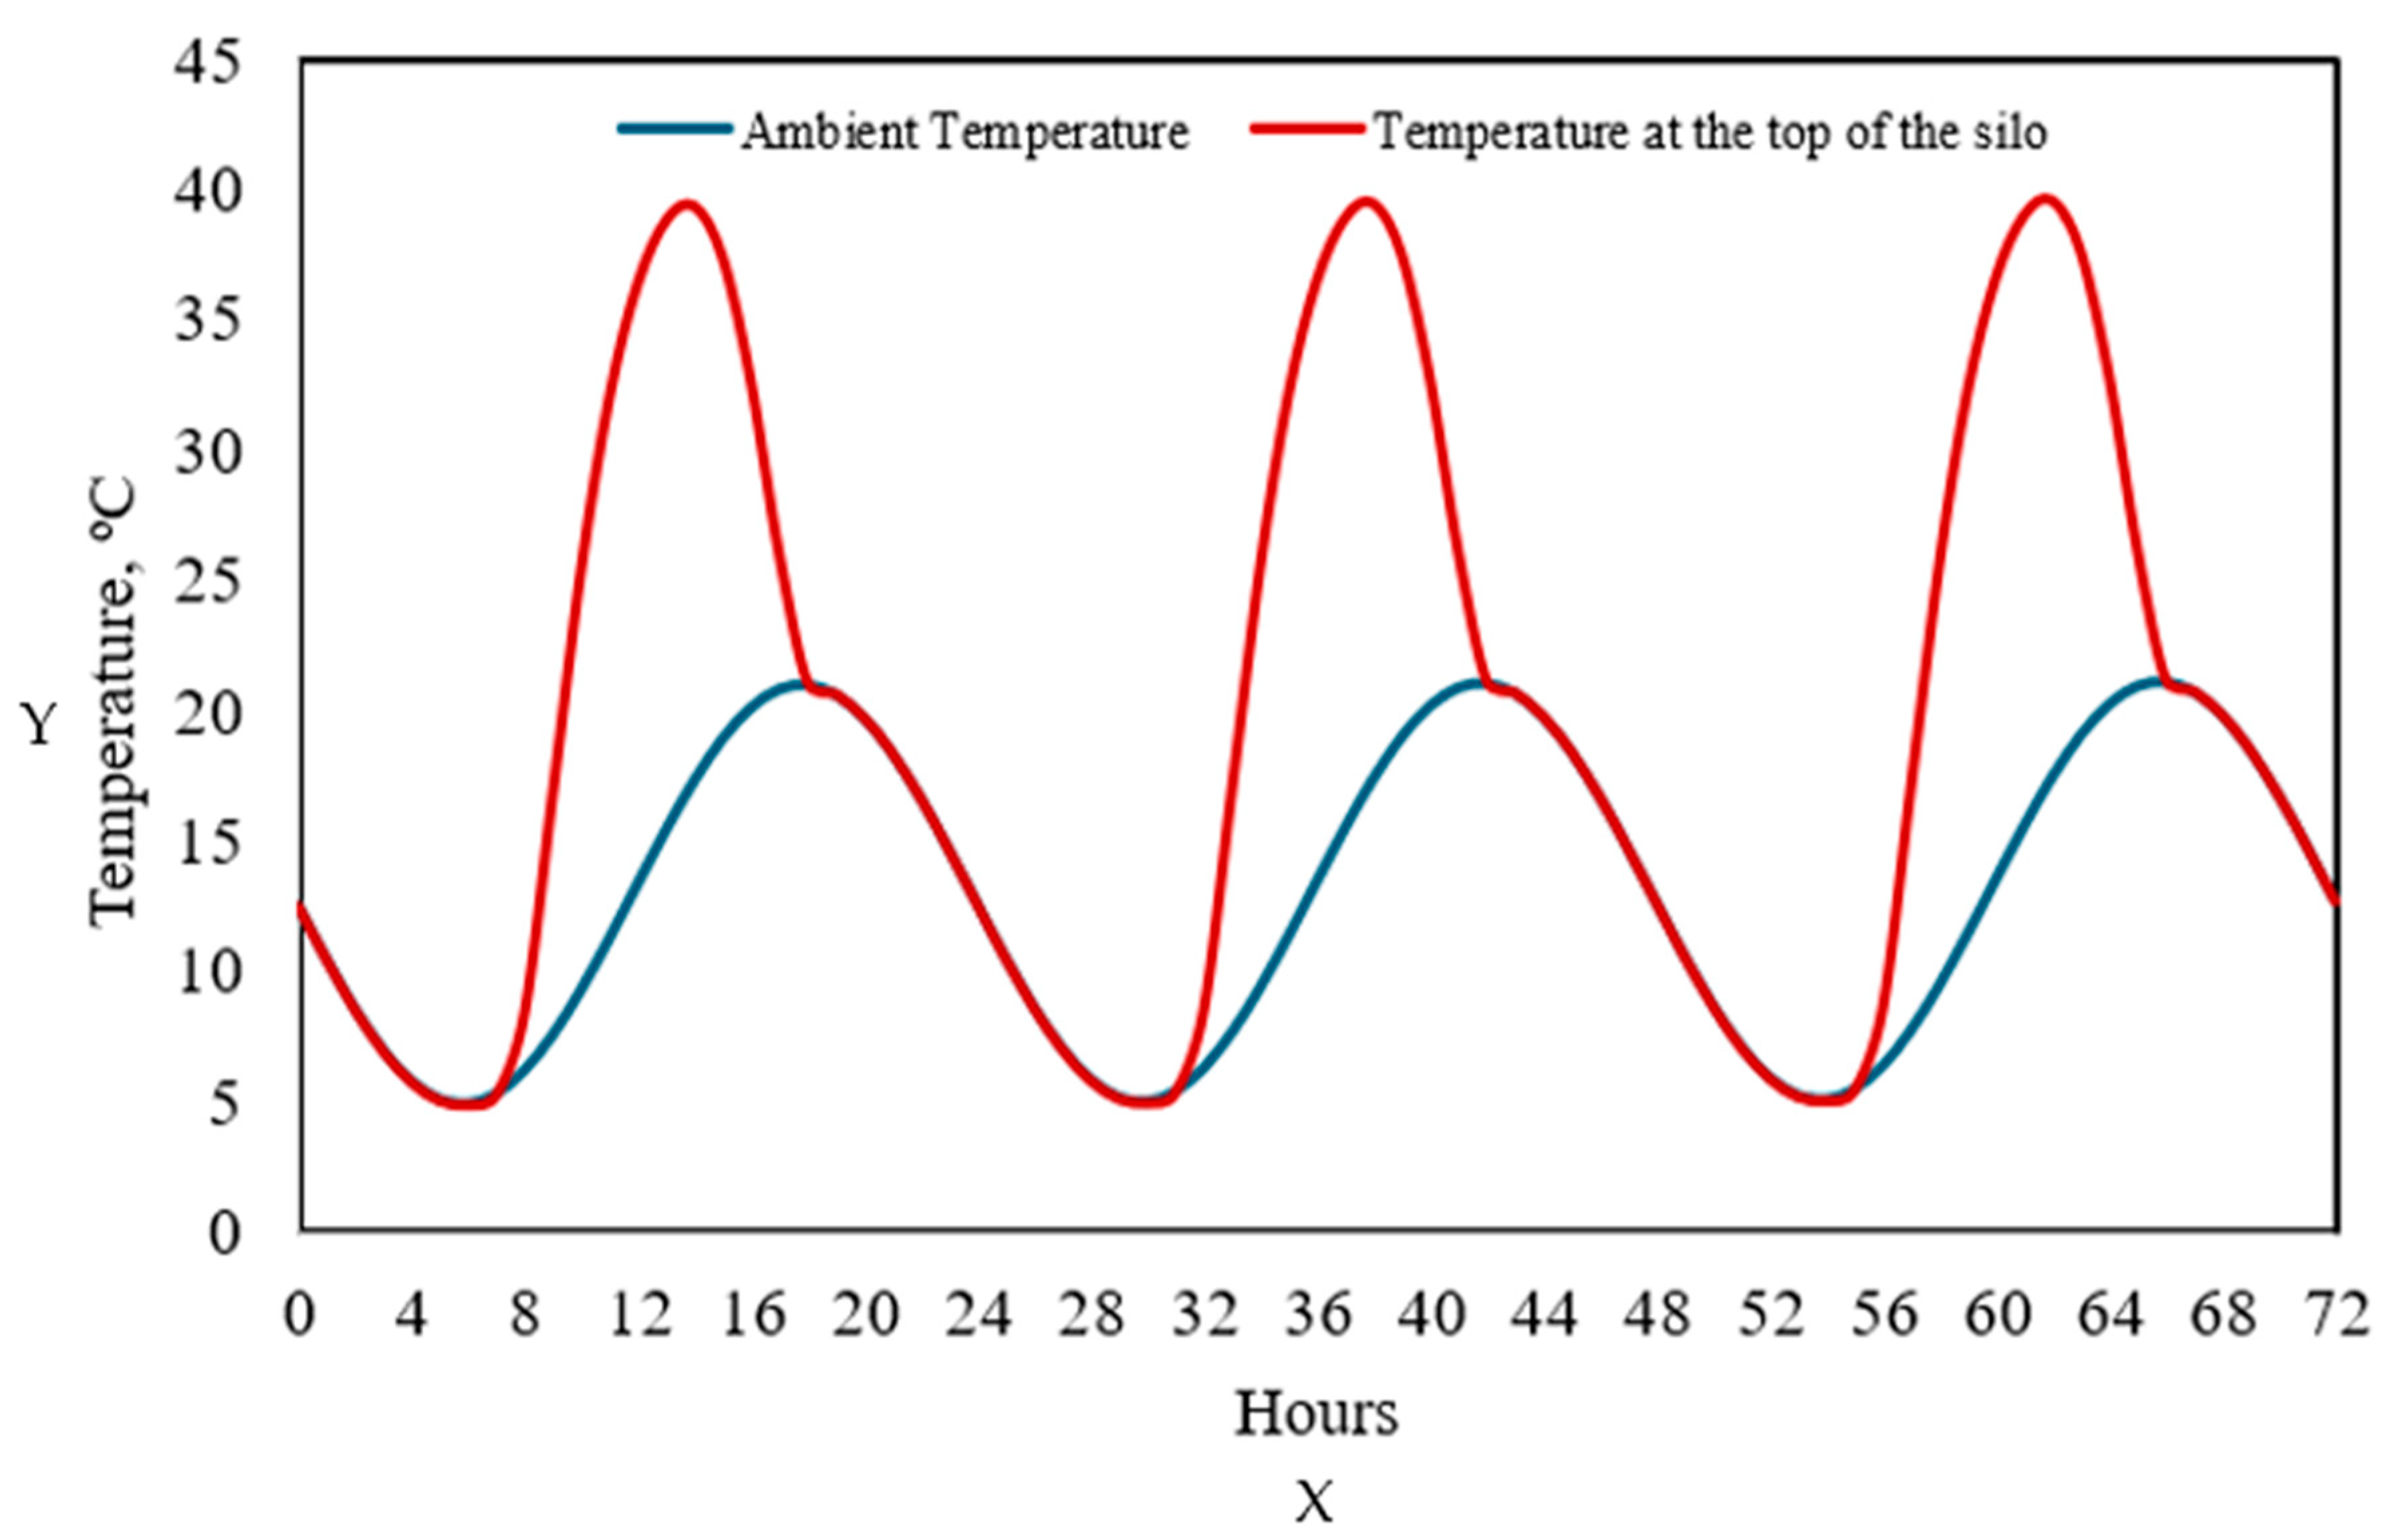
To illustrate the effect of boundary condition (23), Figure 3 presents a comparative evolution of ambient temperature (Tamb) and the temperature at the upper part of the storage structure roof (Ttop) during a continuous 72 h simulation period. The implemented boundary condition, which integrates incident direct solar radiation, absorption by the metal sheet, and heat dissipation by conduction, convection, and radiation, generates a differentiated and dynamic thermal response. It is observed that Ttop experiences a rapid daytime increase of +5.4 °C, reaching a peak of 39 °C at 14:00 h, which represents a positive temperature difference of 10 °C relative to Tamb—directly resulting from solar radiation absorption. Following sunset, two cooling phases are identified: an initial abrupt decrease between 16:00 and 20:00 h with a slope of −3.2 °C and a more gradual decline between 20:00 and 04:48 h of −1.1 °C, during which Ttop tends to equalize with Tamb. This behavior results from the release of heat accumulated in the metal sheet under the influence of boundary condition (18), which includes terms for net radiation, convection with the external air, and conduction toward the stored grain. It is also important to note that during the three simulated days shown in Figure 3, a recurring thermal pattern is observed: the temperature at the top of the metallic structure systematically exceeds the ambient temperature (Tamb) during each diurnal cycle, reaching an average peak of ~39 °C compared to an environmental maximum of ~21 °C, confirming a temperature gradient induced by direct solar radiation. Additionally, a temporal lag is evident between the peaks of both curves, underscoring the importance of accurately modeling the thermal properties of the metal sheet and its interaction with the environment. In contrast, nighttime transitions reflect the progressive dissipation of stored heat without reaching complete equilibrium before the next solar radiation period.
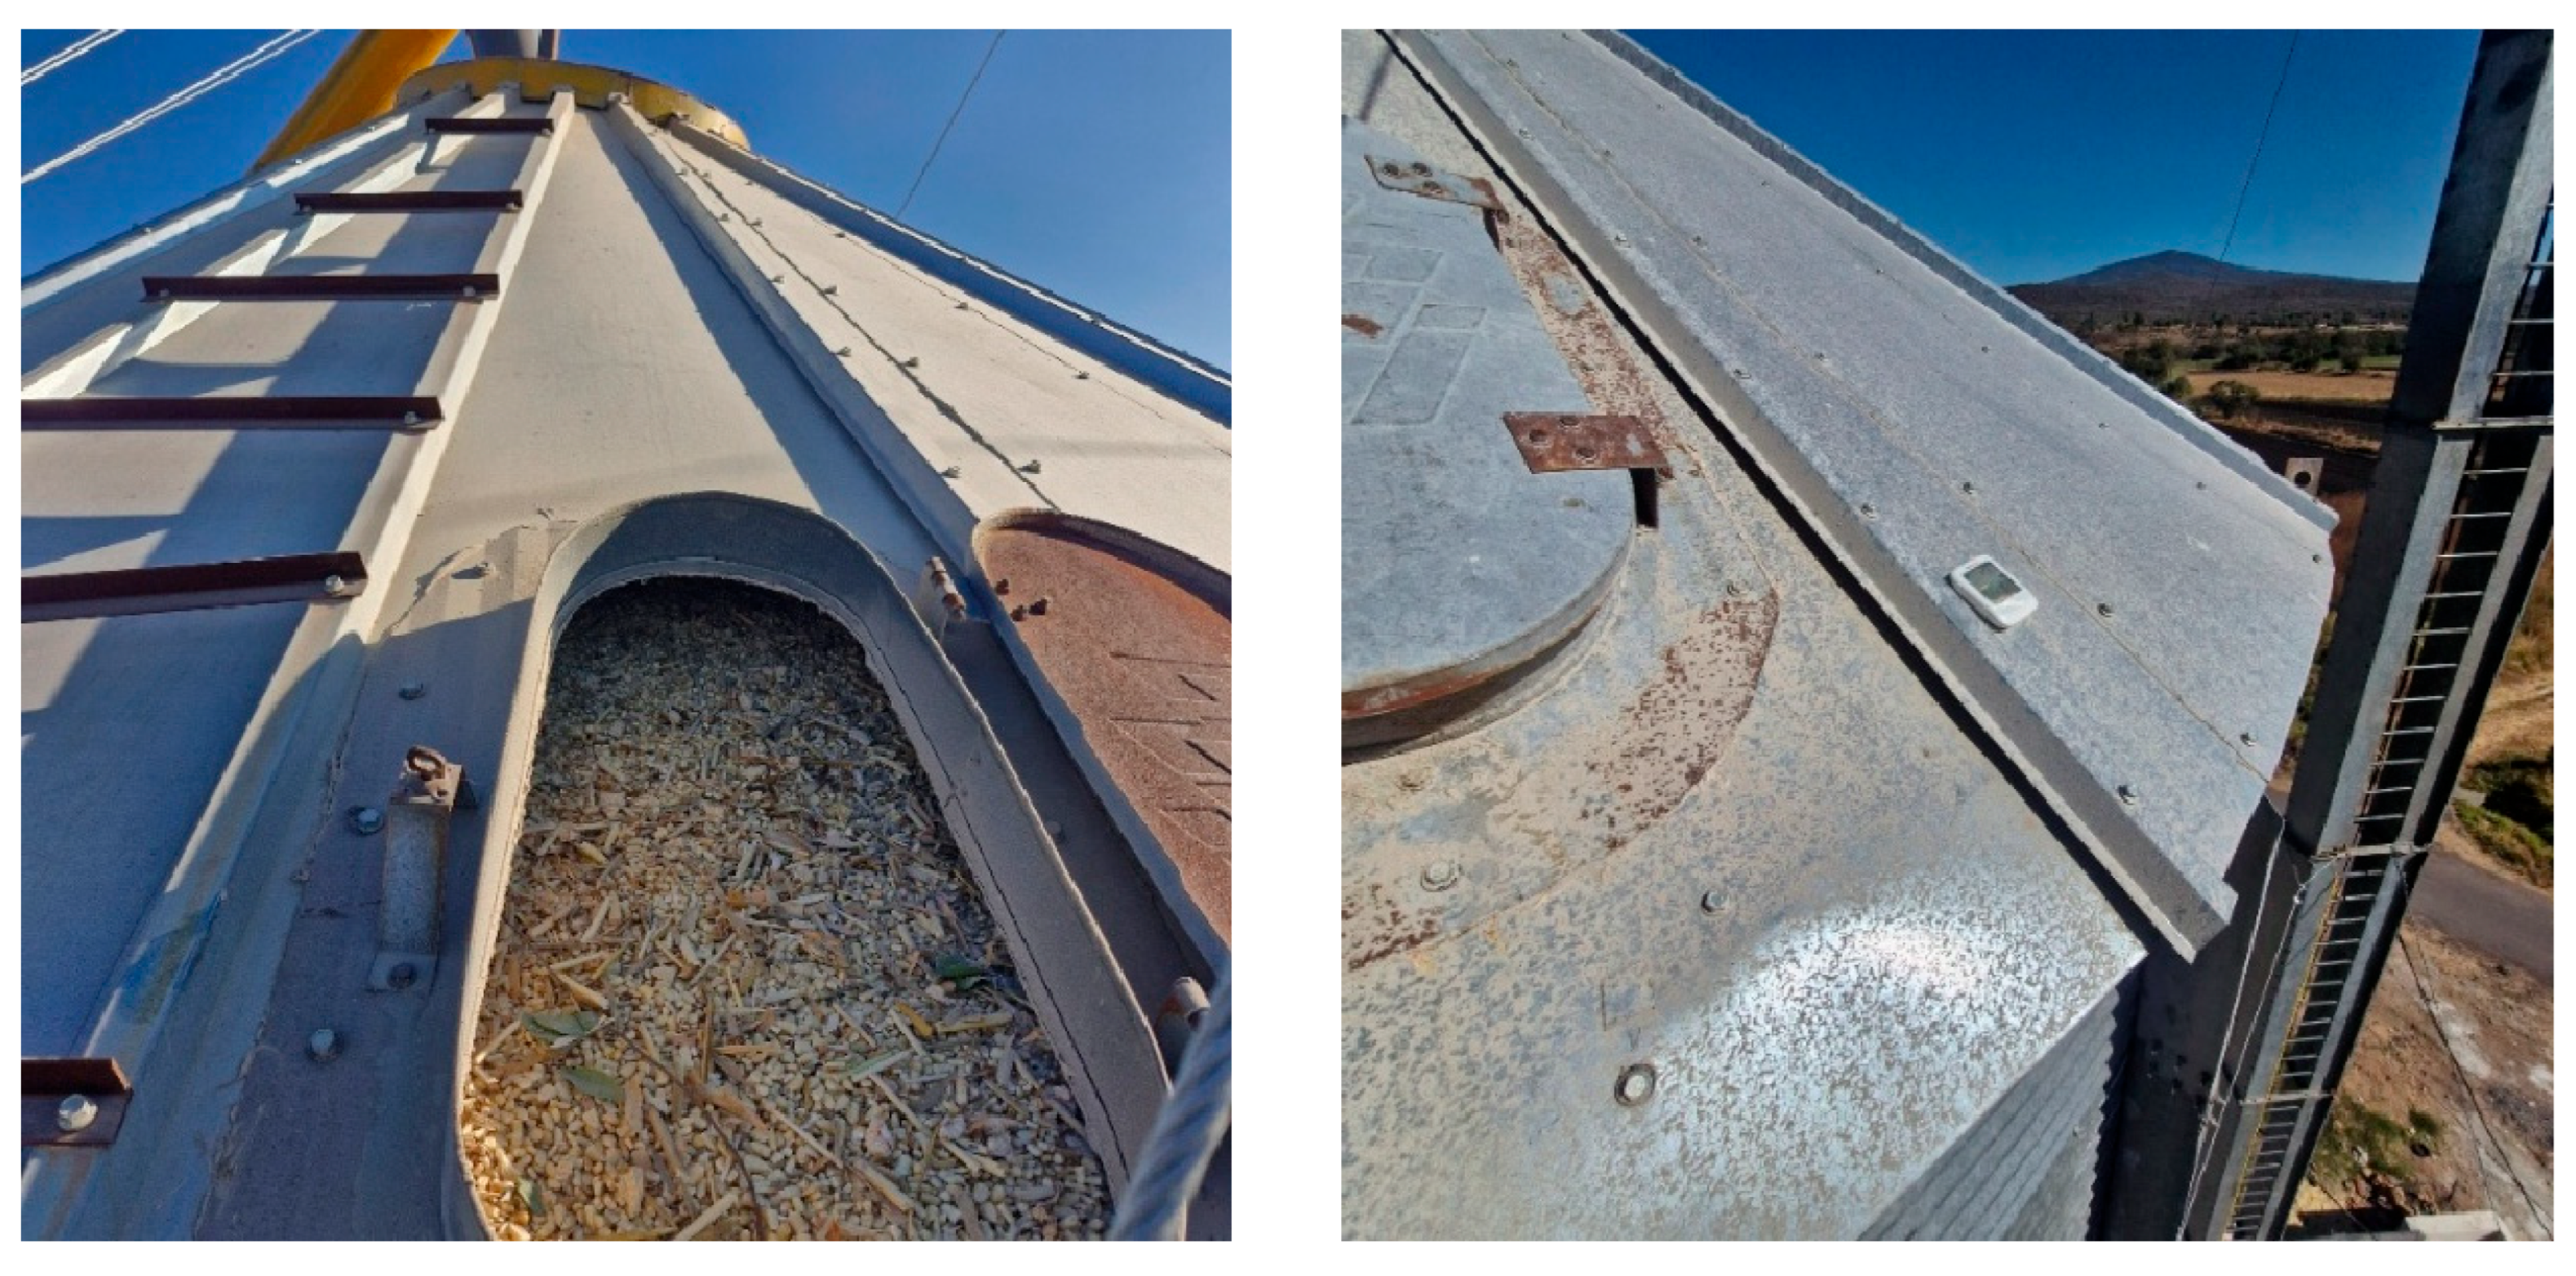
In this context, Figure 4 shows the top section of the silo filled with corn, a condition commonly seen during the harvest season in the region due to the high volume of grain stored. This situation allowed for a more accurate assessment of the effect of the incident solar radiation on the silo’s metal surface and its thermal interaction with the grain at the interface with the metal walls. To achieve this, a TP359 digital thermometer was installed (see Figure 4), which features Bluetooth connectivity for continuous remote temperature monitoring. This device recorded thermal variations over a 24 h cycle in December, enabling the quantification of solar radiation’s impact on the thermal conditions within a full silo under realistic operating conditions. It is worth noting that during this month, the average thermal radiation in the area is around 4.8 kWh/m2. Although moderate compared to warmer months, this value is sufficient to cause significant heating of the silo’s sheet metal and, consequently, the grain near the walls, especially during peak solar hours.
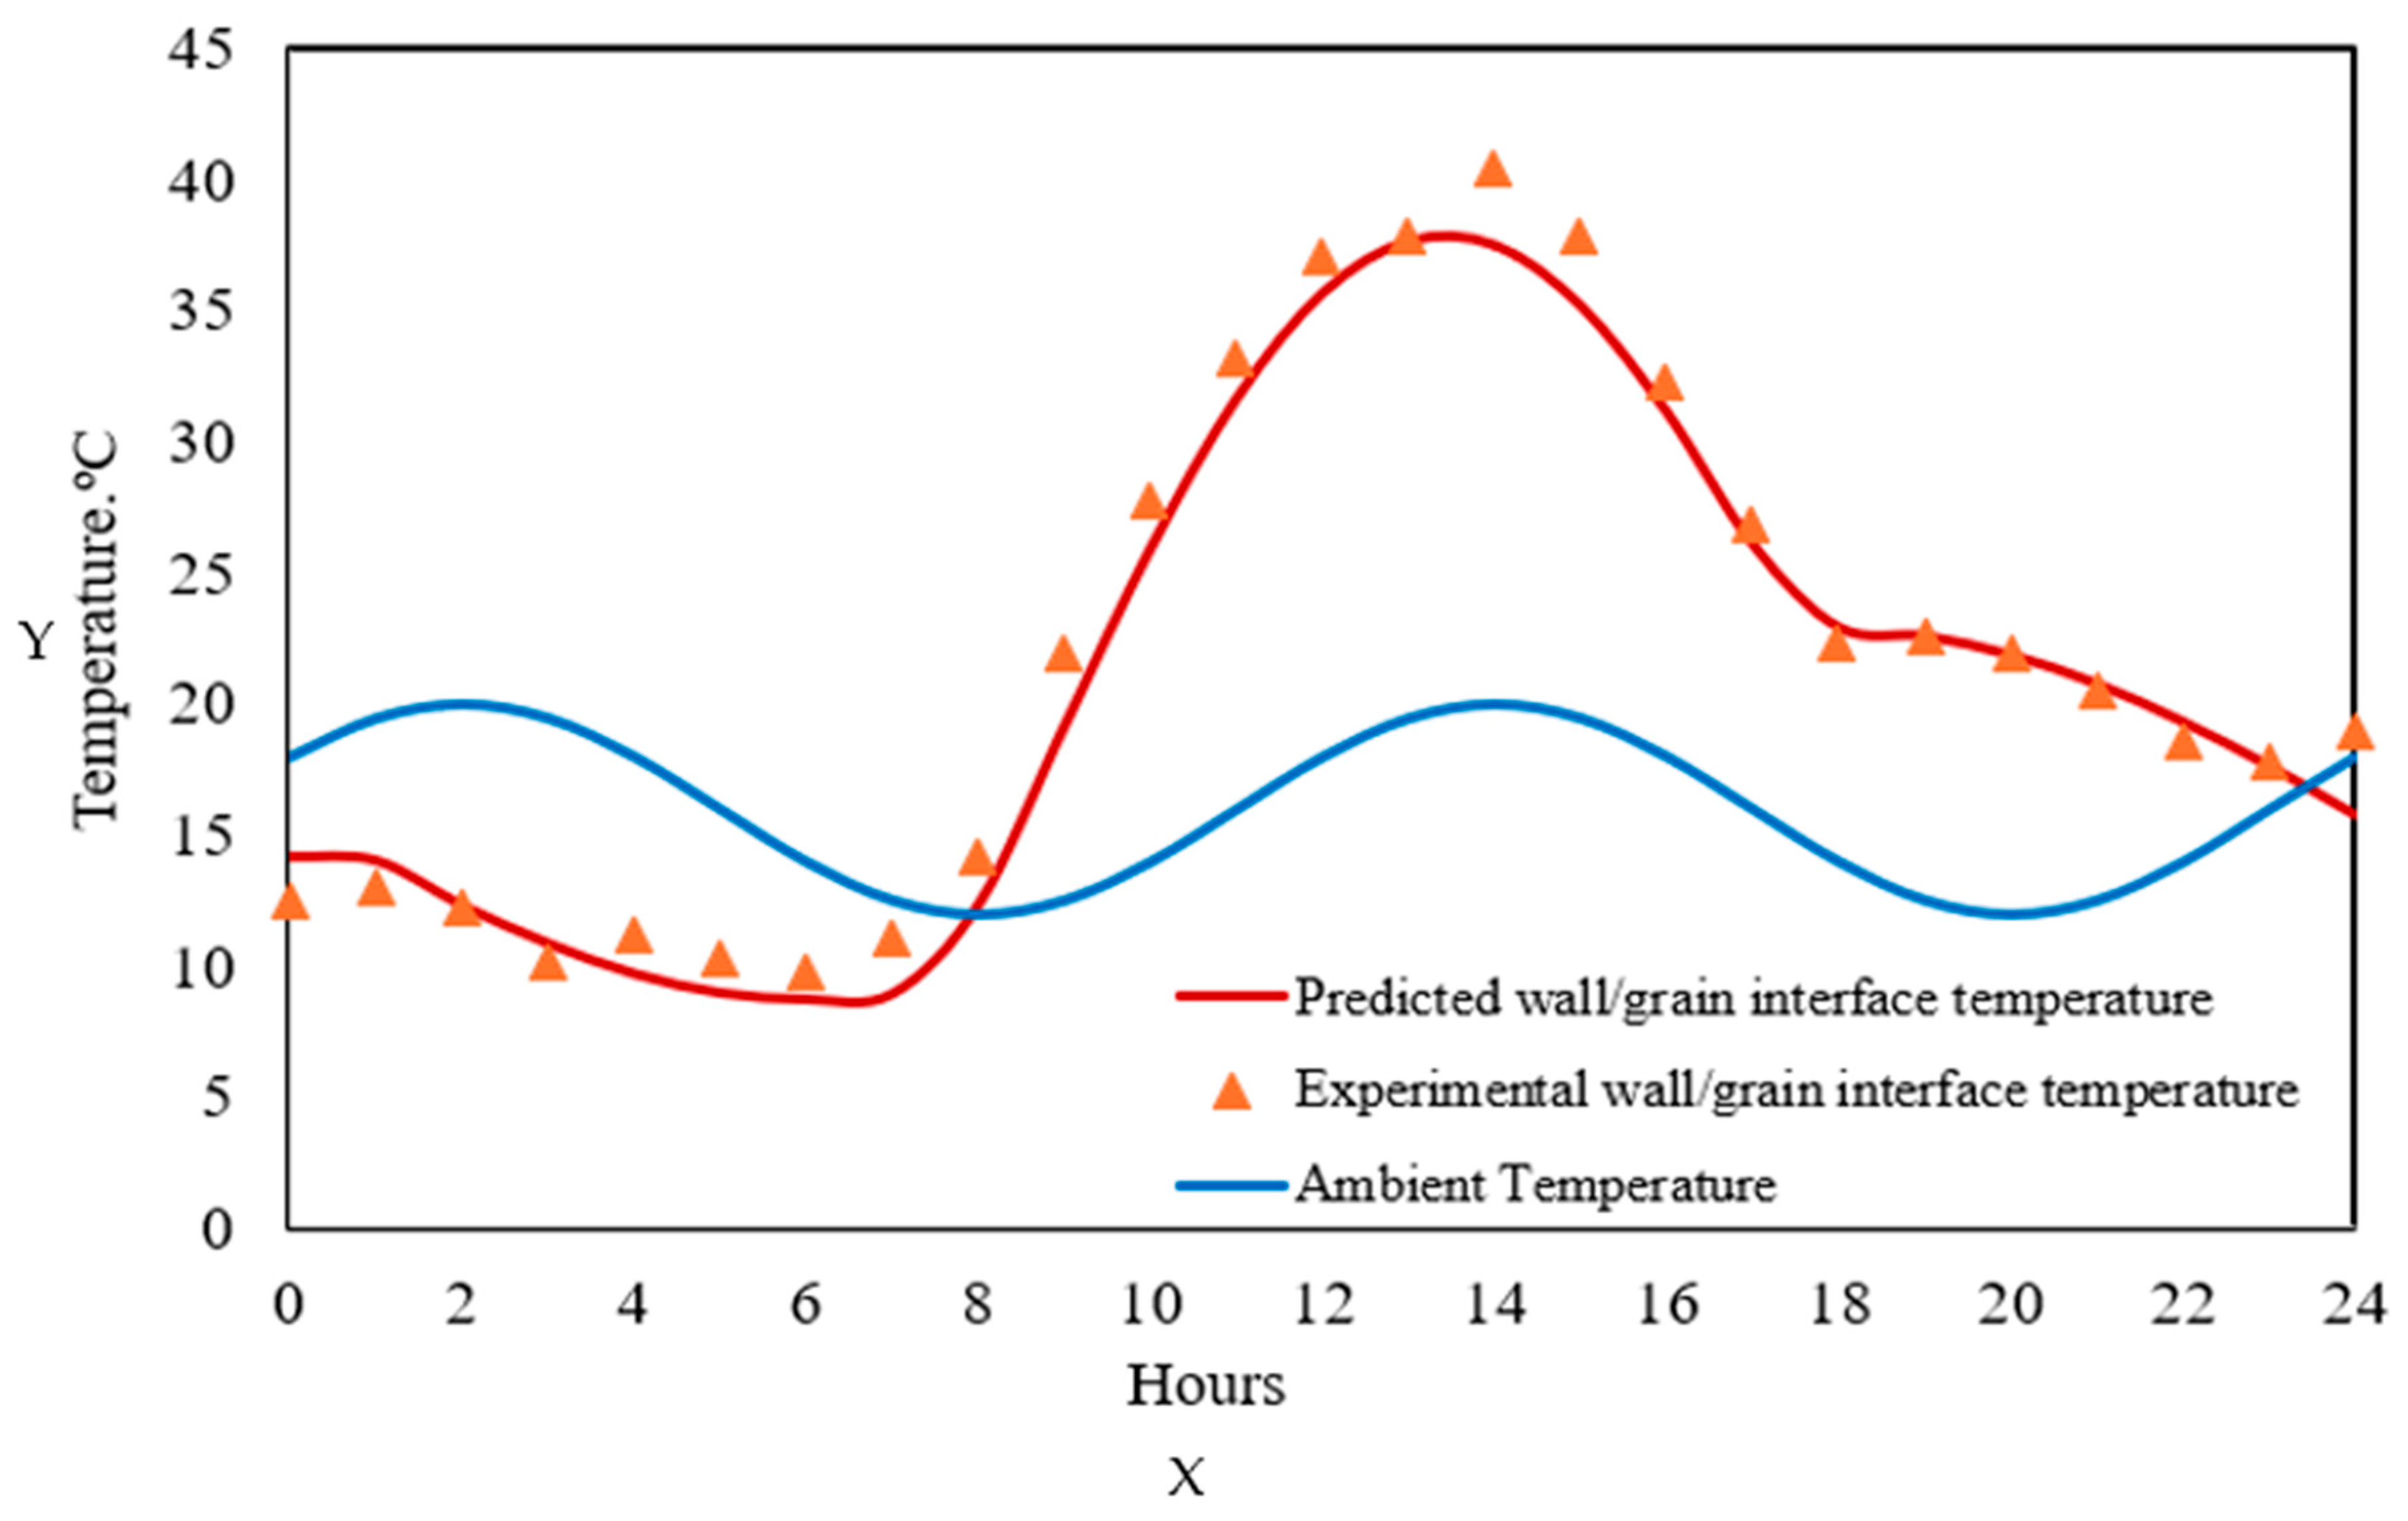
Figure 5 shows the temperature profiles over a 24 h period in December. The blue line represents the average ambient temperature, which remains below 20 °C throughout the day. However, the temperatures of the grain adjacent to the inner walls at the top of the silo, predicted by the model proposed in this study, exhibit distinct behavior. During the first seven hours of the day, a gradual thermal decrease is observed, associated with the nocturnal cooling of the metal sheet and heat exchange with the grain. Subsequently, as the incident solar radiation increases, a rapid temperature rise occurs in the metal sheet, reaching a maximum of 40 °C around 14:00 h [10,30]. This increase demonstrates that the silo structure significantly absorbs solar radiation, transferring heat to the grain closest to the walls. As the afternoon progresses and the irradiance decreases, a rapid drop in the surface temperature of the sheet is recorded. The temperatures predicted by the developed numerical model closely match the values experimentally recorded by the TP359 thermometer, validating both the mathematical model and the numerical solution implemented to describe grain storage under realistic operating conditions.

2.4. Numerical Solution

The numerical solution of the system of Equations (1)–(9), together with their respective initial and boundary conditions, was carried out using the computational fluid dynamics software COMSOL Multiphysics v. 5.4®. This tool enables the definition and resolution of the proposed model, which is based on a set of partial differential equations (PDEs) integrating the complex physical and biochemical processes associated with grain storage in silos. For three-dimensional models, COMSOL Multiphysics® applies the finite element method (FEM), which involves integrating the PDEs over each control volume. This procedure transforms the PDEs into a system of discrete algebraic equations, which are subsequently solved numerically. To achieve this, the software employs the Newton–Raphson method as the default nonlinear solver, efficiently handling the coupled and highly nonlinear systems that characterize this type of simulation [10,33,34,35].
In simulating natural convection processes in porous media, such as those occurring during grain storage, the mesh size used in computational fluid dynamics (CFD) models is a critical parameter, as it directly affects both the accuracy of the results and computational performance [36]. Appropriate mesh sizing is essential, particularly for predicting temperature and moisture distributions, where a coarse mesh may lead to significant errors in identifying critical zones within the silo, such as areas prone to heat and moisture accumulation, which can promote the proliferation of fungi and insects. Conversely, an excessively fine mesh significantly increases the number of elements in the domain, thereby raising computational times and resource demands [37]. This trade-off between resolution and efficiency becomes particularly relevant in large-scale problems, such as modeling industrial silos, where long-term simulations are necessary to accurately capture temperature and moisture gradients over several days or months. In such cases, excessive mesh refinement may become computationally unfeasible.
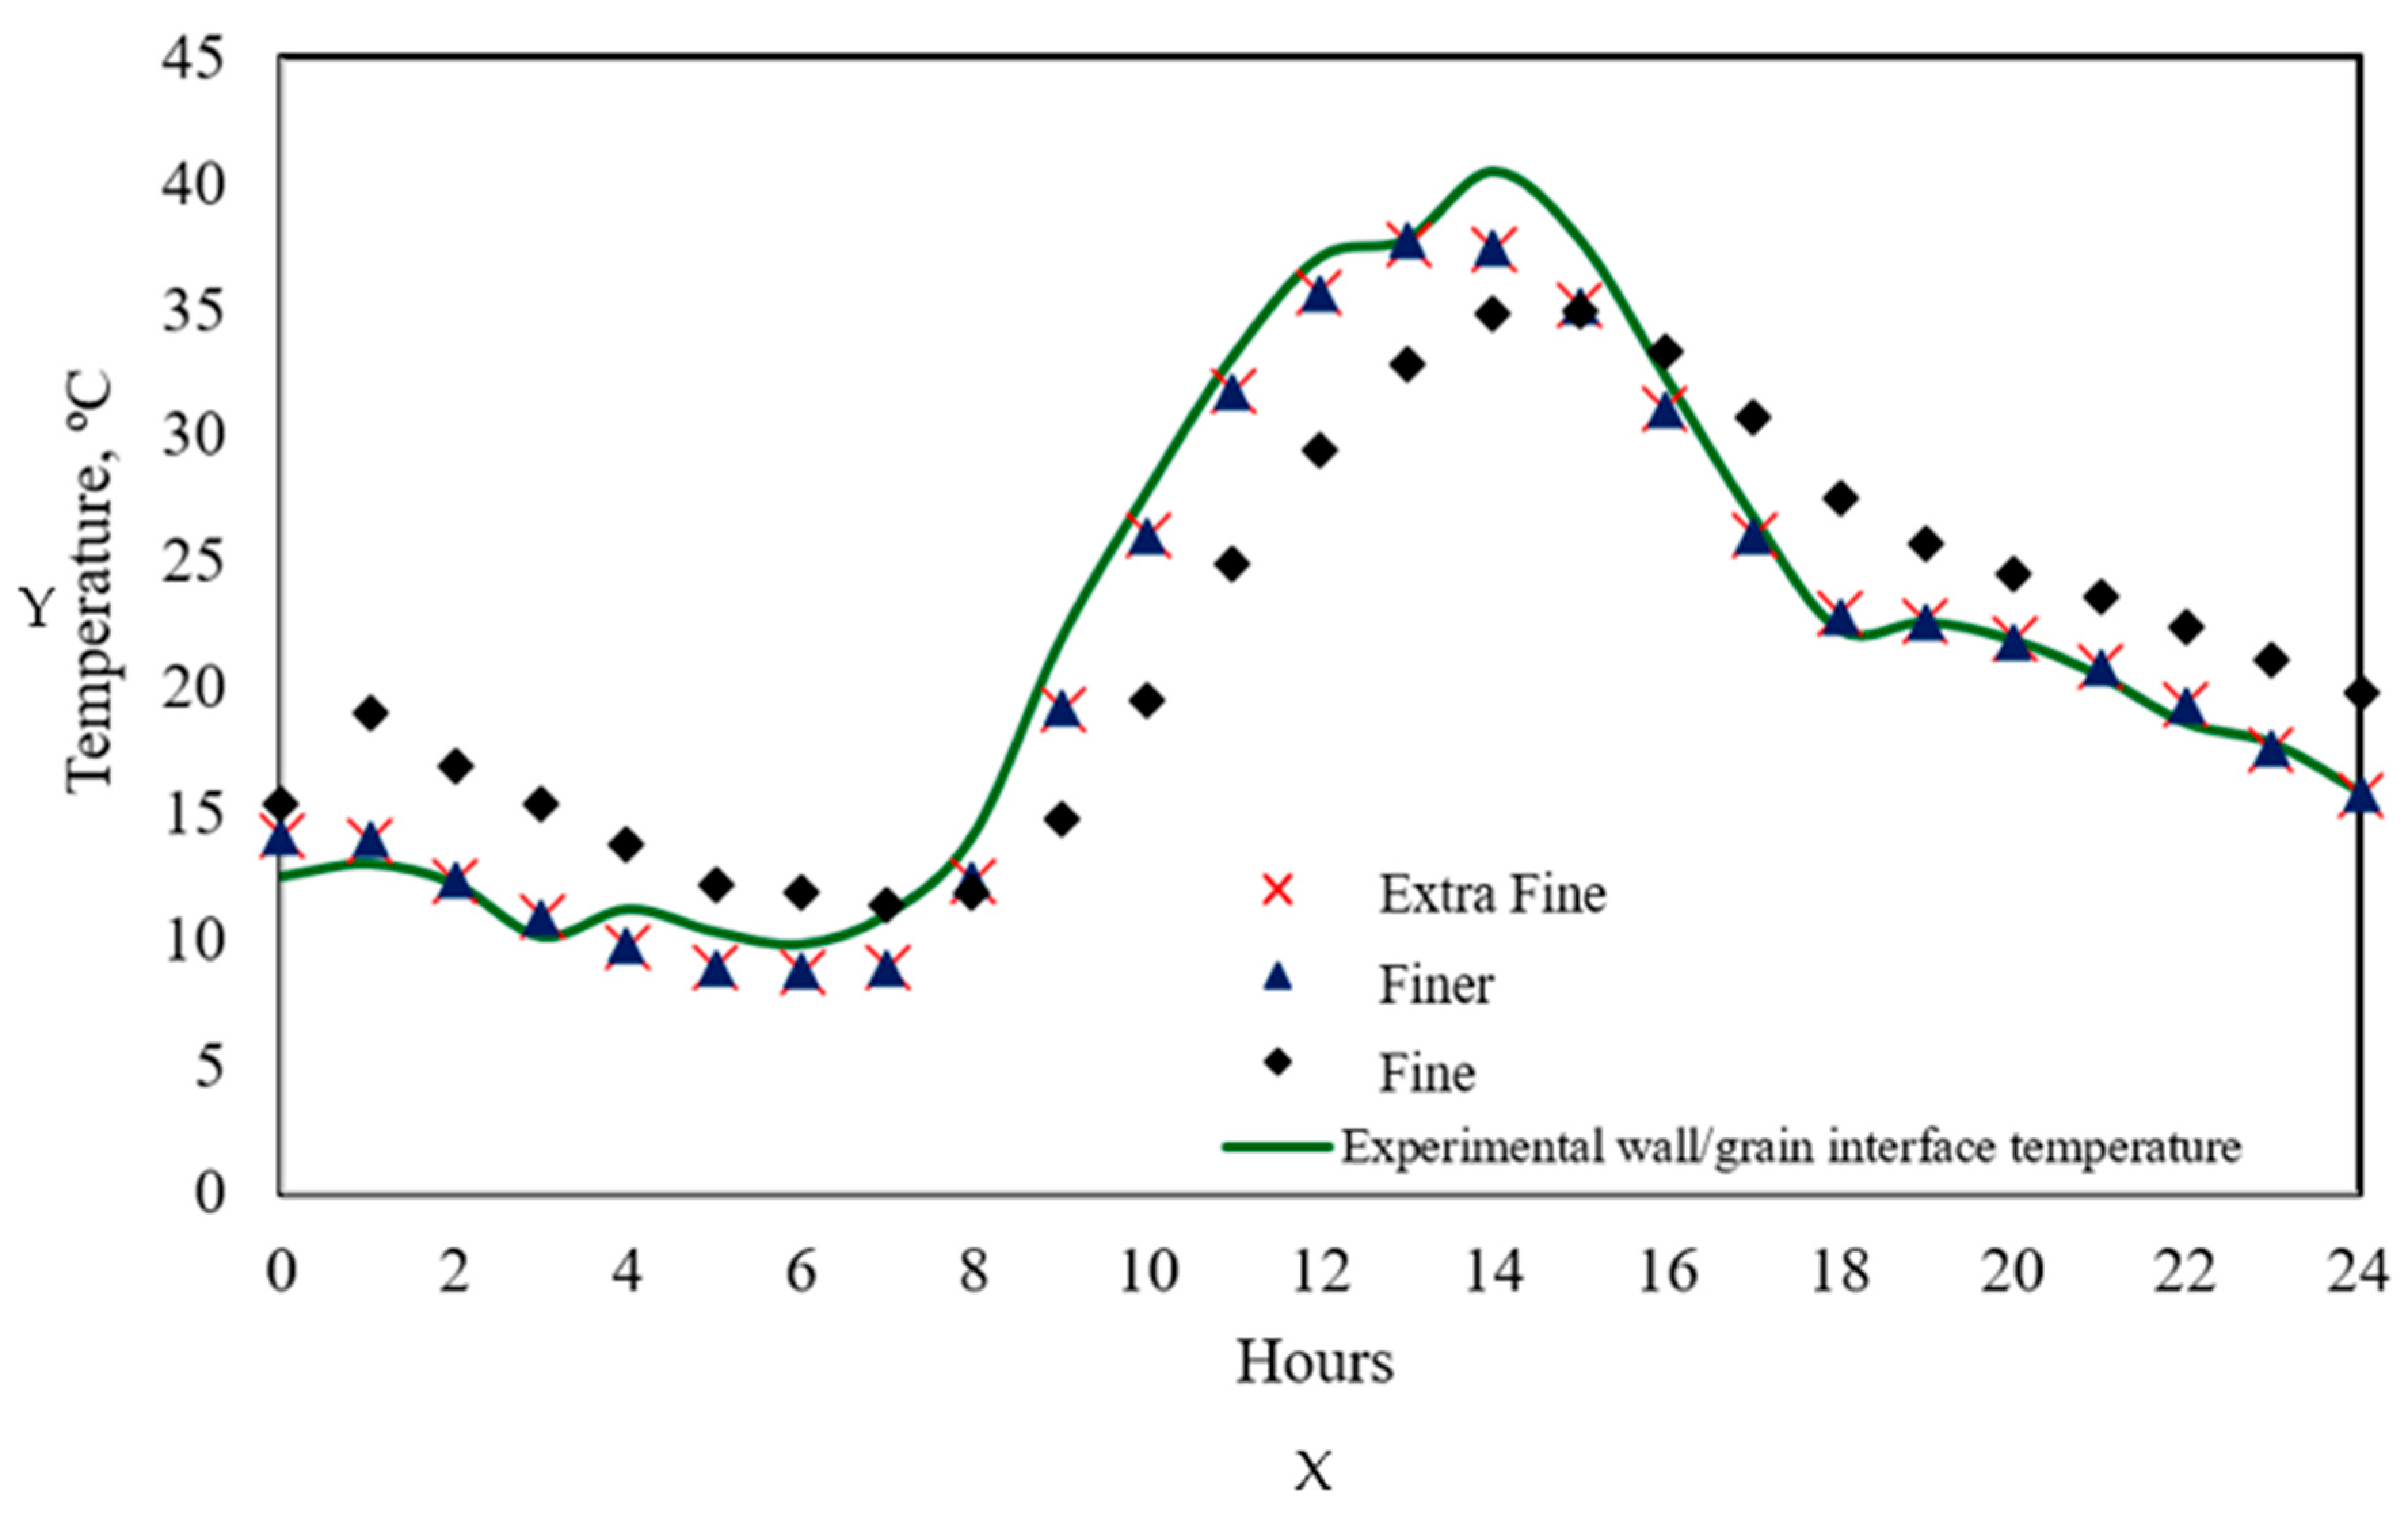
For this reason, to ensure that the mesh size used in the CFD simulation of grain storage was optimal—accurately capturing temperature gradients without compromising computational efficiency—mesh independence analyses were performed to predict temperature profiles over a 24 h storage period in December. The domain was discretized with refined meshing along the silo walls, where the most intense temperature gradients occur. The effect of mesh size was analyzed by predicting temperature profiles at the grain/wall interface of the silo and comparing them with experimental temperatures recorded during corn storage, as shown in Figure 6. This figure reveals that the use of a “Fine” mesh overestimates the minimum morning temperatures by up to 35% compared to experimental values and underestimates the maximum temperatures during the hottest period of the day (12:00–16:00 h) by up to 17%. In contrast, the “Finer” mesh reduces the error for minimum temperatures to 25%, and the difference between predicted and measured maximum temperatures is approximately 5.6%, which is considered acceptable given the complexity of the numerical model and the transient nature of the system. Notably, using an “Extra Fine” mesh produces thermal values and trends nearly identical to those obtained with the “Finer” mesh, with differences of less than 1%. This suggests that further refinement does not significantly improve accuracy, but it does considerably increase computation time. Therefore, the “Finer” mesh was selected for the simulations, as it offers an appropriate balance between accuracy and computational efficiency.
To verify the accuracy of the results as a function of mesh refinement, Table 6 presents a comparative analysis of the predicted maximum and minimum temperatures at the grain/wall interface of the silo, along with the corresponding computation times for the corn and wheat cases. In all simulations, a fixed number of 85,232 tetrahedral elements was used in the interior of the silo, while the number of boundary elements (NEB) varied according to the refinement level. For the corn case, it is observed that using a “Fine” mesh overestimates the minimum temperatures and underestimates the maximum temperatures, with differences of approximately 3 °C compared to more refined meshes. This discrepancy is attributed to the inability of coarse meshes to adequately resolve thermal gradients near the silo walls, where temperature variations induced by solar radiation and the surrounding environment are most significant. In contrast, the differences between the “Finer” and “Extra Fine” meshes are less than 1%, indicating that both provide sufficient resolution to capture the relevant thermal gradients during storage. A similar trend is observed for the wheat case, where the “Fine” mesh overestimates minimum temperatures by 2.75 °C and underestimates maximum temperatures by 3.33 °C. The difference in minimum temperatures predicted with the “Finer” and “Extra Fine” meshes is only 0.16%, while the difference in maximum temperatures reaches 13%. Nevertheless, both grids offer sufficient accuracy to simulate the thermal behavior of the system.
In addition to the thermal analysis, Table 6 presents the computation times required for each mesh size. It is evident that an increase in the number of boundary elements significantly raises the simulation time. For instance, in the corn case, the “Extra Fine” mesh required 173.14 min, whereas the “Finer” mesh reduced this time to 83.19 min without compromising the accuracy in the prediction of extreme temperatures. For wheat, an “Extra Fine” mesh required 146.65 min, while the “Finer” mesh reduced the time to 63.85 min, again without significantly affecting the accuracy of the results. It is worth noting that the difference in computation times between corn and wheat is that, in the corn simulations, the heat generation rate from respiration was modeled as a function of temperature and moisture. In contrast, for wheat, a constant heat generation rate was assumed throughout the simulation. This comparison underscores the importance of striking a balance between numerical accuracy and computational efficiency, particularly in long-term simulations that may span several months or even a full year of grain storage. Finally, it is important to mention that all simulations were performed using COMSOL Multiphysics® version 5.4 installed on a personal computer equipped with a 13th Gen Intel® Core™ i5-13450HX 2.40 GHz processor, 8 GB RAM, and Windows 11 Home.

3. Results

The mathematical model, represented by Equations (1)–(9), was used to compare the distribution of temperature and moisture profiles during the independent storage of corn and wheat throughout December. However, it is essential to note that due to the limited availability of experimental biochemical data in the literature for wheat, a constant respiration heat generation was assumed throughout the simulation period in this case. In contrast, for corn, a more comprehensive model was implemented, in which the respiration heat was considered as a function of grain temperature and moisture, thereby more realistically representing the metabolic heat generation of the grain during storage.
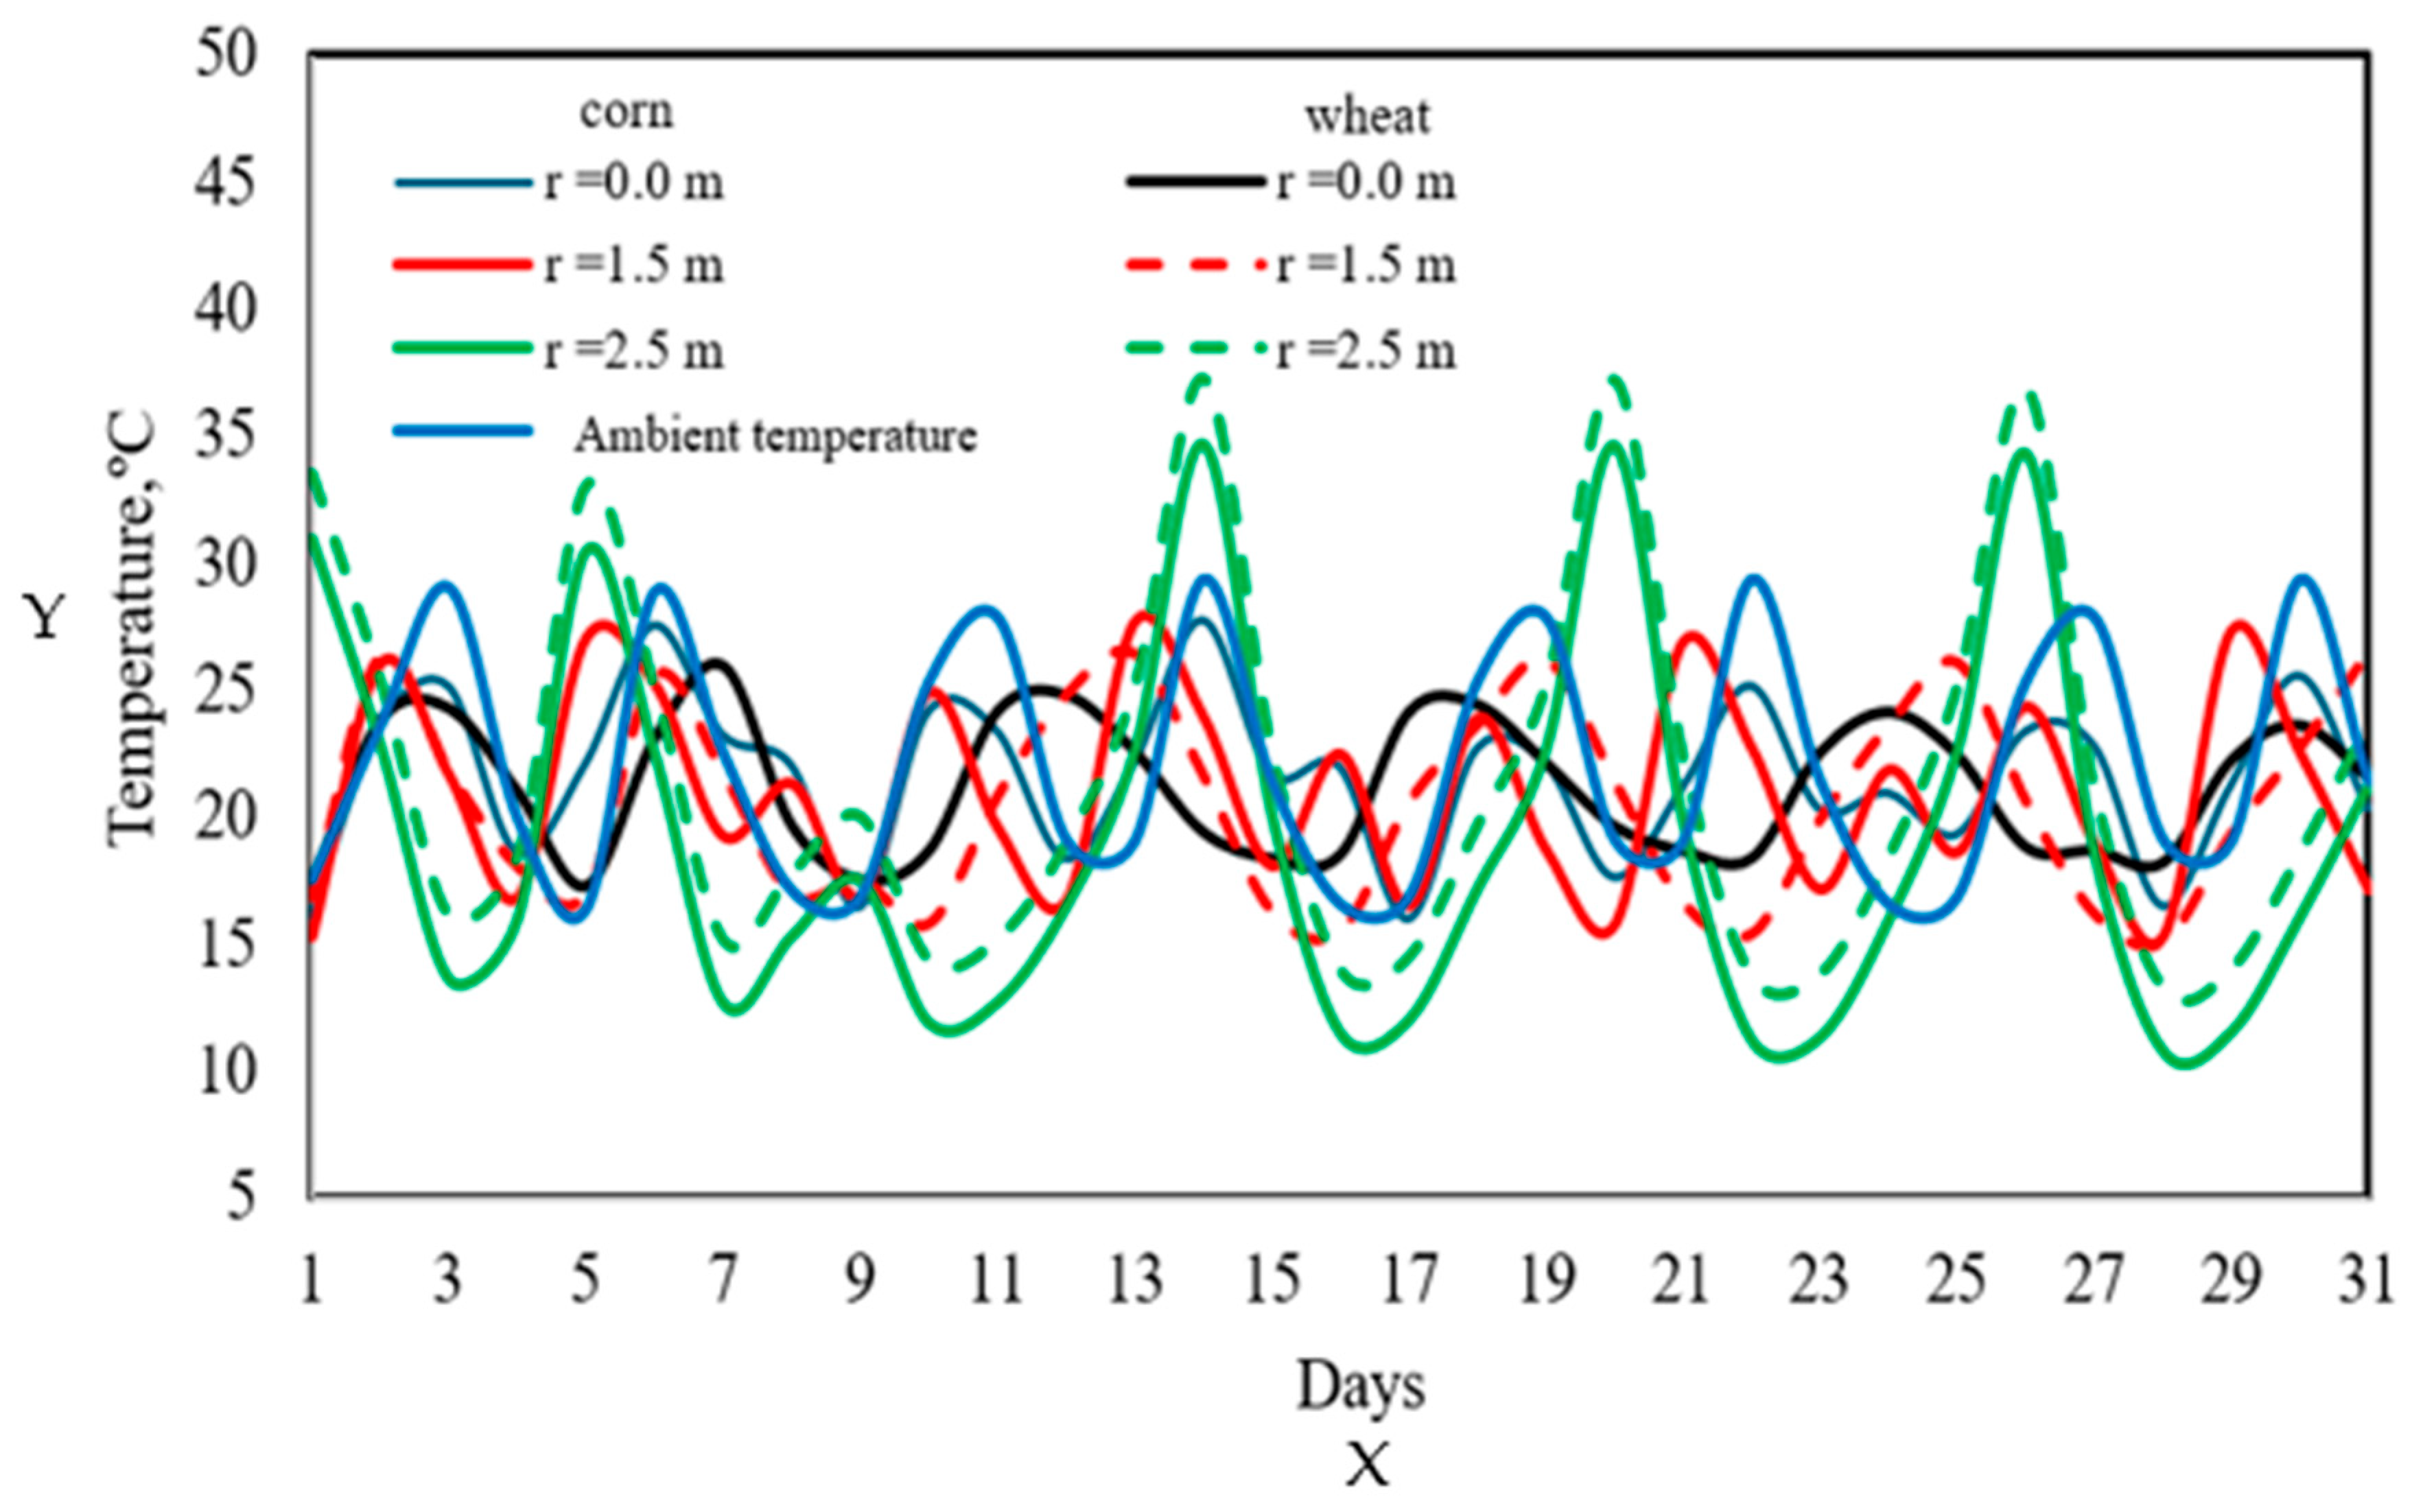
Figure 7 presents the radial temperature profiles during a storage day in December for both corn (solid lines) and wheat (dashed lines). The solid blue line represents the ambient temperature, while the other curves correspond to different distances from the center of the silo to the wall. The figure shows that, for corn, the temperature at the center of the silo remains higher than the ambient temperature during the early morning and lower during the warmest hours of the day, increasing again in the afternoon. This behavior highlights the thermal buffering effect of the grain, acting as an insulator, as also reported by Balzi et al. [5], Montross et al. [6], Barreto et al. [9], and Gastón et al. [15], who observed a thermal lag in the silo core relative to the ambient temperature due to the low thermal conductivity of grain. At 1 m from the center, the temperature profiles exhibit similar behavior to those at the center, although with a slightly greater thermal amplitude. At 1.5 m from the center, the temperatures exhibit a progressive transition toward ambient temperature variations, remaining lower than at the center until noon. After 16:00 h, the temperatures in this region become higher than the ambient temperature due to the combined effect of respiration heat and the onset of ambient temperature decline. In the zones closest to the wall, 2.5 m from the center, the temperature profiles more closely follow the fluctuations of the ambient temperature, but with higher values reaching peaks of approximately 40 °C [15,18,30]. This phenomenon is explained by the absorption of solar radiation by the metal sheet, whose high thermal conductivity allows for rapid heat transfer to the adjacent grain. This effect was also observed by Wang et al. [27] and Lawrence et al. [33], who noted that zones near the wall are thermally unstable and susceptible to grain deterioration due to the accumulation of heat and moisture. In the case of wheat, the temperature profiles (dashed lines) exhibit a qualitatively similar trend to that of corn, although with slightly lower values, particularly at the center and at 1.5 m. This difference is attributed to two main factors: on the one hand, the model applied to wheat assumes a constant rate of heat generation due to respiration; on the other hand, wheat has a lower thermal conductivity compared to corn [38]. However, in the zone adjacent to the wall, the predicted temperatures for both grains are practically identical, both qualitatively and quantitatively. This highlights the dominant influence of environmental conditions and solar radiation in this region, regardless of the type of grain being stored. As reported by Markowski et al. [18] and Thorpe [24], these zones represent critical points during storage due to their susceptibility to moisture condensation and fungal proliferation.
Figure 8 shows the temperature profiles at different heights within the silo, corresponding to the previous case, for a one-day storage period. As shown in the last figure, the solid lines represent the temperature gradients for corn, while the dashed lines represent those for wheat; the blue line indicates the variation in ambient temperature over the 24 h period. The figure reveals that the temperature gradients at the bottom of the cylinder are higher than the ambient temperatures, with differences of up to 10 °C compared to the ambient temperature, particularly between 00:00 and 10:00 h. This difference decreases during the hours of maximum solar radiation. However, it widens again after 18:00, when the external temperature begins to fall, while the grain still retains part of the absorbed heat. This thermal lag has been reported by Barreto et al. [9], Markowski et al. [18], Wang et al. [27], Ledao et al. [39], and Zheng et al. [40], who showed that grain exhibits a delayed response to environmental variations, particularly in regions with low air exchange. In the case of the grain adjacent to the top of the silo, the temperature gradients coincide with ambient temperature during hours without solar radiation (before 08:00). However, after this time, the direct incidence of sunlight on the upper part of the silo causes a rapid temperature increase, reaching up to 40 °C around 13:00 h, when the Sun is nearly perpendicular to the silo roof [31]. This behavior confirms the findings of Thorpe [24] and Lawrence et al. [33], who identify the top section of the silo as a critical zone for thermal accumulation due to direct solar radiation. For wheat (dashed lines), the temperature profiles exhibit a qualitatively similar trend to those of corn at the same heights, but with lower thermal gradients. These differences arise from the constant respiration heat model applied to wheat, as well as from the low thermal diffusivity, which limits the rapid transfer of heat through the grain. While corn exhibits a thermal diffusivity of 1.33 × 10⁻⁷ m2/s, the diffusivity of wheat is only 6.48 × 10⁻¹¹ m2/s—approximately four orders of magnitude lower. This disparity means that wheat responds much more slowly to temperature changes, acting as a more effective insulator but also posing a greater risk of heat accumulation in poorly ventilated areas [6,19,38].
It is also important to note that, in both cases, the areas near the roof and walls of the silo exhibit the highest grain temperatures, primarily due to direct solar radiation. This underscores the need to implement monitoring and control measures in these zones, as they are particularly susceptible to moisture condensation, which can promote fungal growth and grain spoilage, as also reported by Abalone et al. [16] and Balzi et al. [5].
To evaluate the thermal behavior during the postharvest period characteristic of the region, numerical simulations were conducted for both corn and wheat over a continuous 31-day storage period corresponding to December. The simulations began on 1 December at 00:00 h. They ended on 31 December at 00:00 h, allowing for the analysis of temperature profile evolution inside the silo in response to daily variations in ambient temperature, incident solar radiation, and the grain’s respiration heat. This analysis helps identify cumulative temperature trends, critical zones within the silo, and thermal differences between the grains, considering both external conditions and the specific physical properties of each grain [6,9,14,22,23].
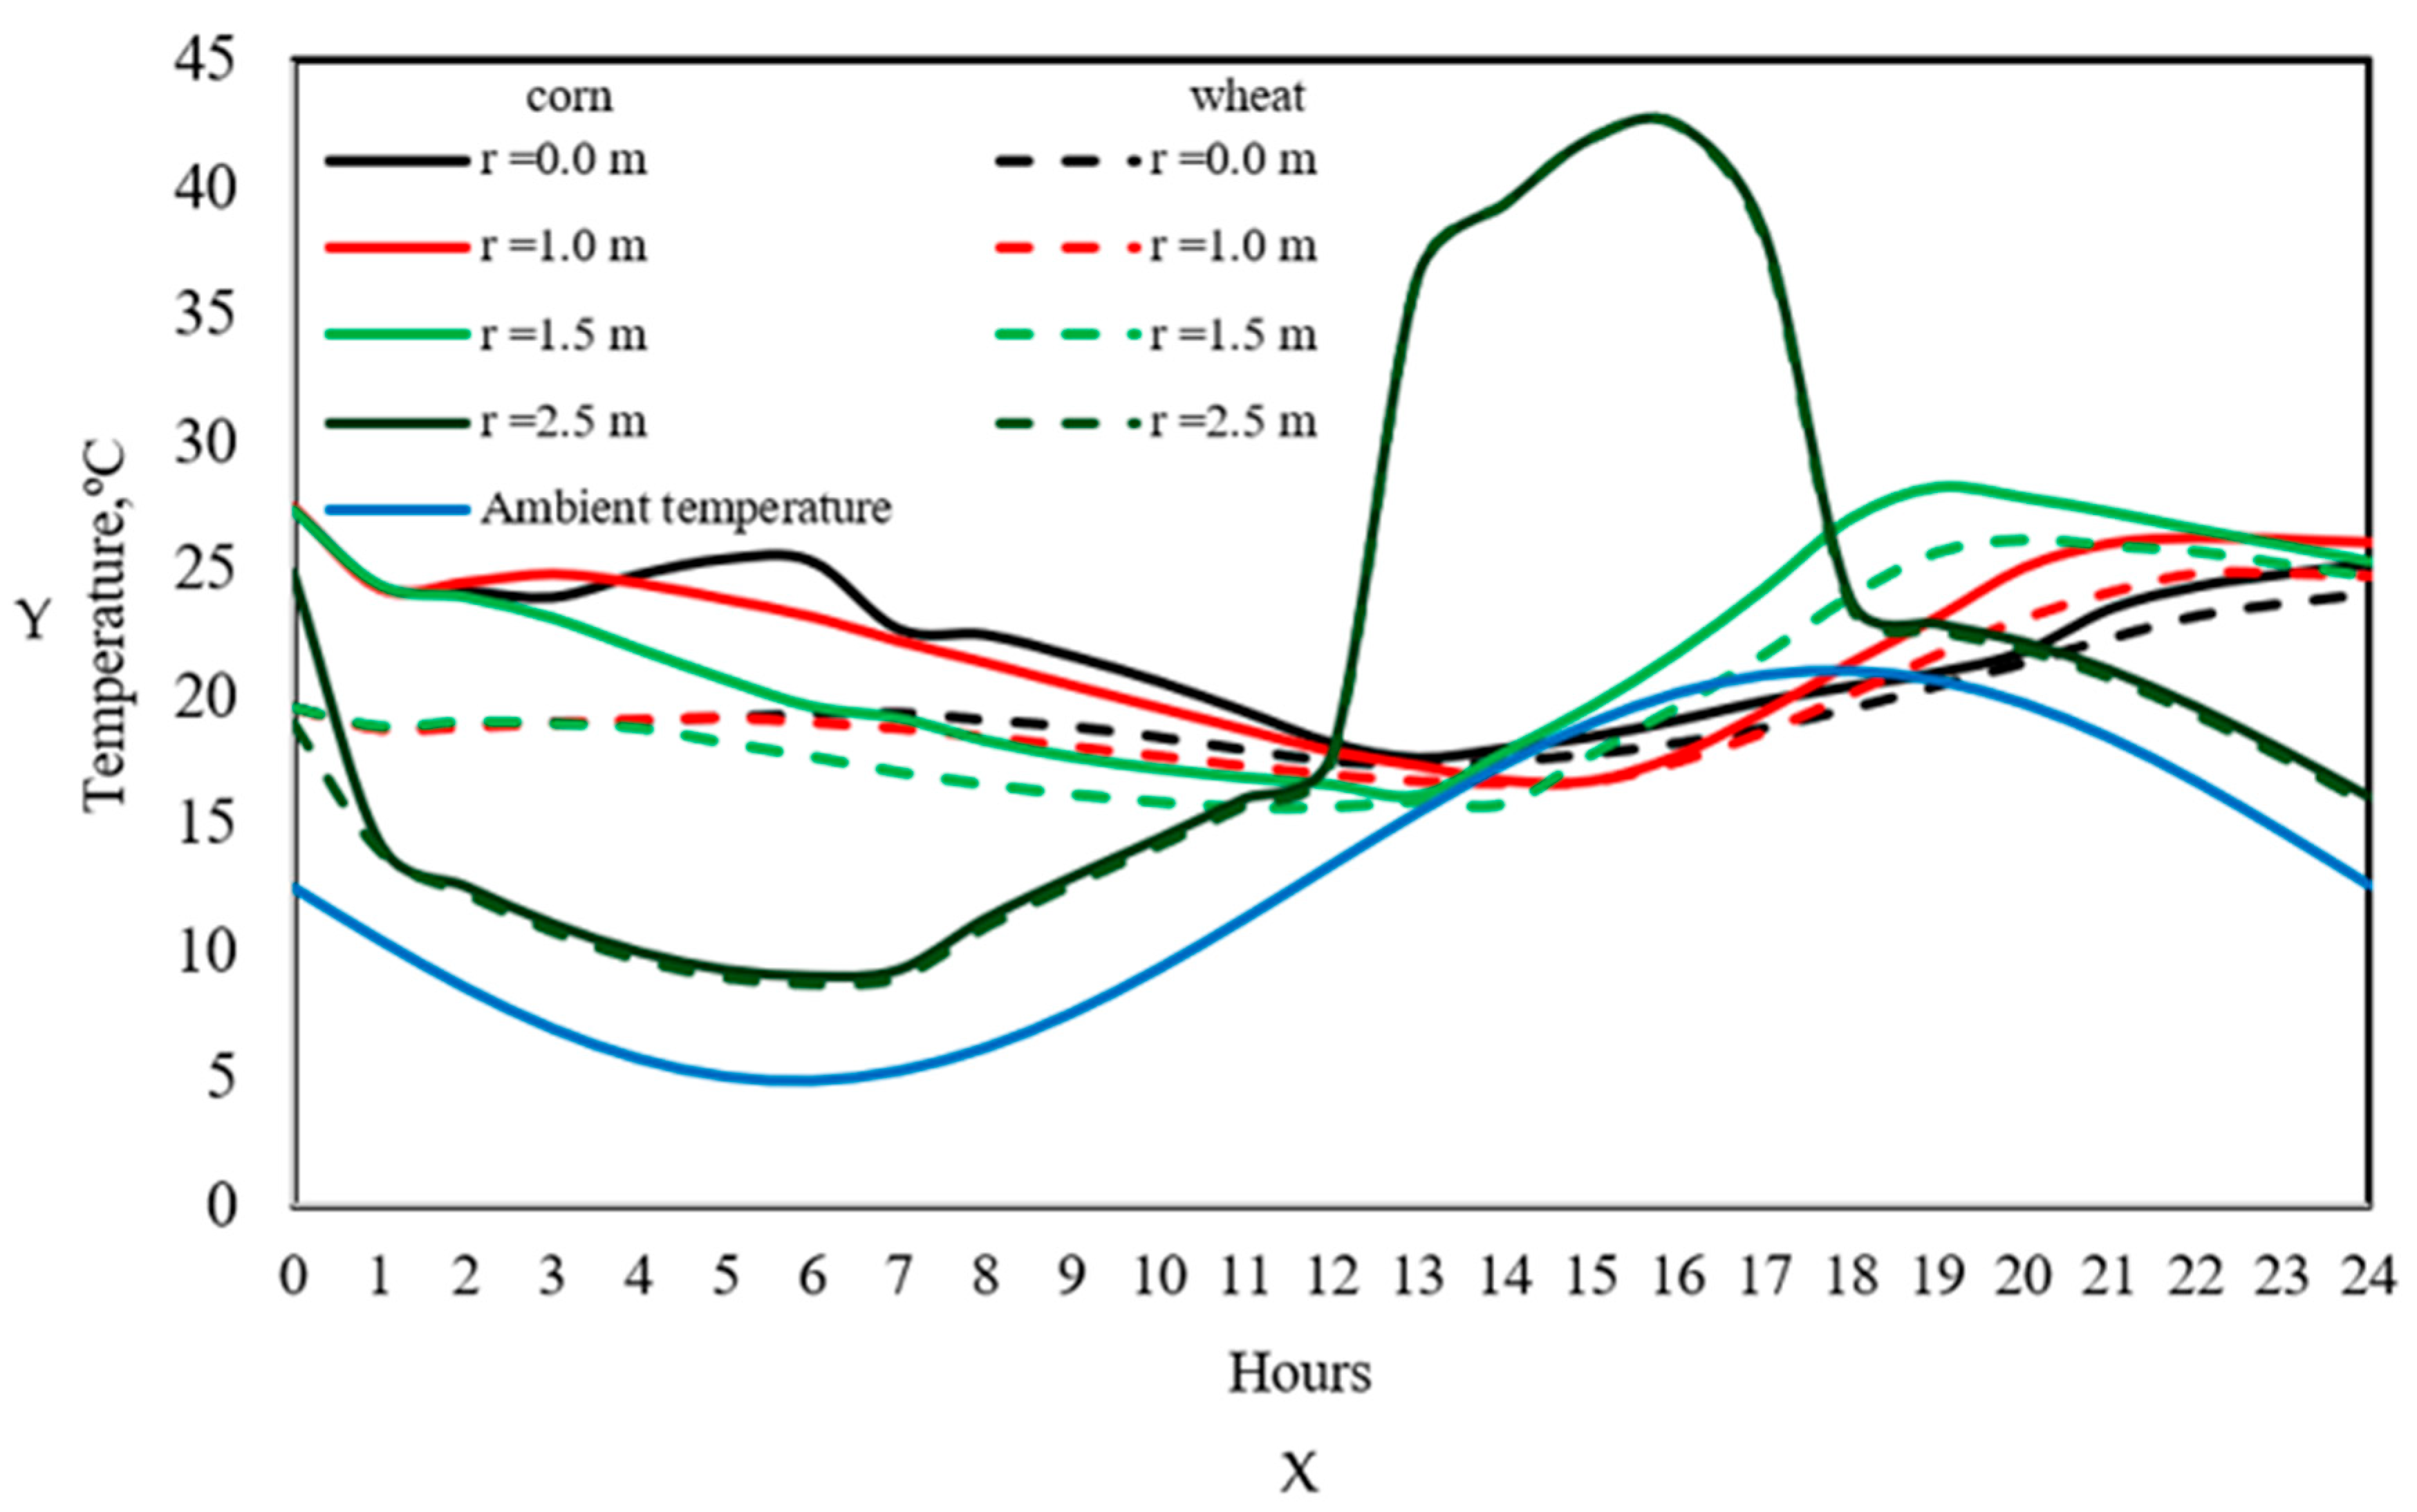
Figure 9 shows the evolution of temperature profiles as a function of the silo radius during December for corn (solid lines) and wheat (dashed lines), compared with the ambient temperature (blue line). It is important to note that the ambient temperature during this period does not exceed 30 °C, which establishes an upper limit for interpreting the radial temperature profiles of both grains. In the case of corn, the temperature at the center of the silo (solid black line) follows a trend similar to the ambient temperature, but with values up to 5 °C lower. This difference is attributed to two factors: first, the insulation effect of the grain, whose low thermal conductivity slows down heat diffusion toward the lower regions, and second, the limited direct influence of solar radiation in this zone. Additionally, the metabolic heat generated by respiration is distributed gradually and does not fully compensate for nighttime heat losses. At 1.5 m from the center, corn temperature profiles exhibit values comparable to the ambient temperature, but with a time lag in the thermal peaks. This phenomenon is typical during grain storage, where heat diffusion is not instantaneous and temperature gradients propagate with a delay from the surface to the interior, as described by Khankari et al. [3], Barreto et al. [9], Lawrence et al. [21], and Thorpe [24]. Near the wall of the silo (2.5 m from the center), grain temperatures exceed ambient temperatures, particularly from the tenth day of storage onward, reaching peaks of approximately 40 °C. This progressive increase is explained by the accumulation of heat caused by the incident solar radiation on the metal sheet, which has high thermal conductivity and transfers energy to the adjacent grain. The cumulative effect persists until approximately day 27 of storage, after which a thermal decrease begins, coinciding with a drop in ambient temperature during the final days of the month. This pattern indicates that although silo buffers rapid thermal changes, external conditions remain a key factor in areas near the walls and roof [1,21,30]. In the case of wheat, temperature gradients exhibit a qualitatively similar behavior to that of corn, with center and intermediate zone temperatures being lower throughout the storage period compared to corn gradients. As a result, wheat transfers heat more slowly, remaining more thermally insulated and exhibiting lower gradients along the radial axis. However, in the zone near the wall, wheat and corn temperatures are both quantitatively and qualitatively similar, highlighting the dominant influence of external conditions—particularly solar radiation—on the thermal behavior in that region. In this case, grain properties play a secondary role, as direct exposure to the external heat source homogenizes temperatures regardless of the type of grain stored. This phenomenon is consistent with observations by Thorpe [24], who identifies these zones as critical for condensation and fungal infestation due to elevated temperatures and potential moisture differences [2,19,28].
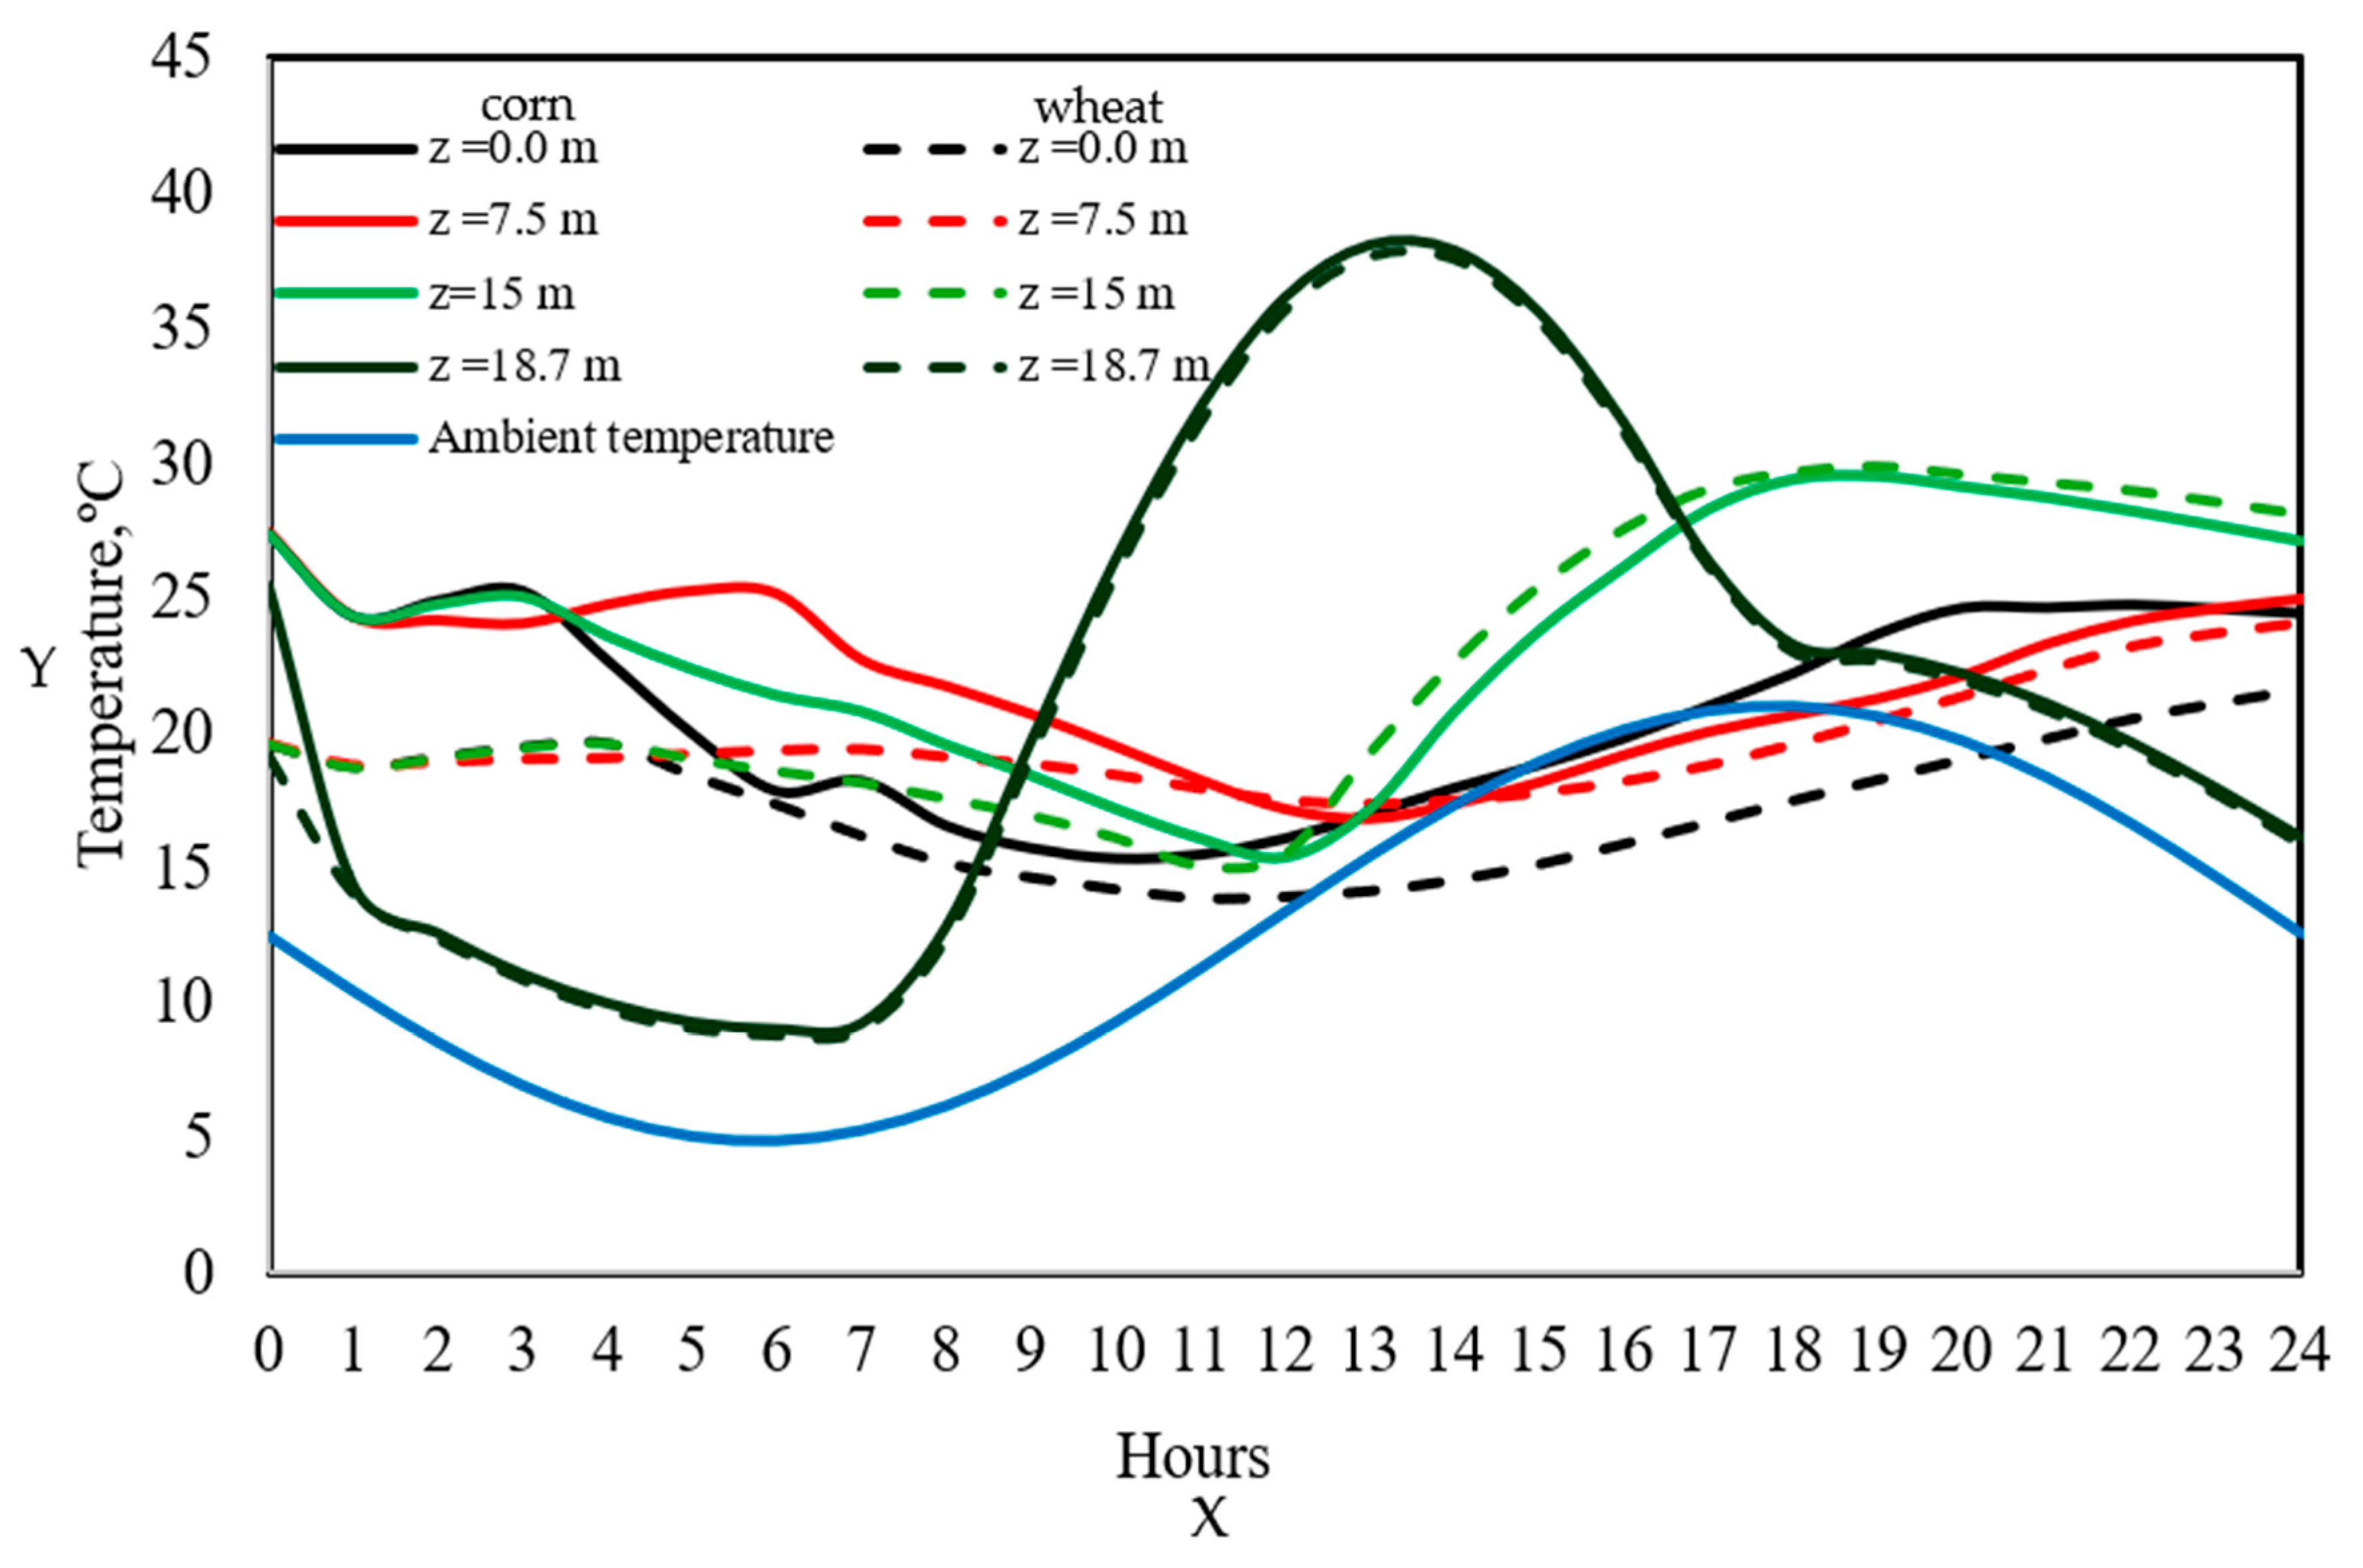
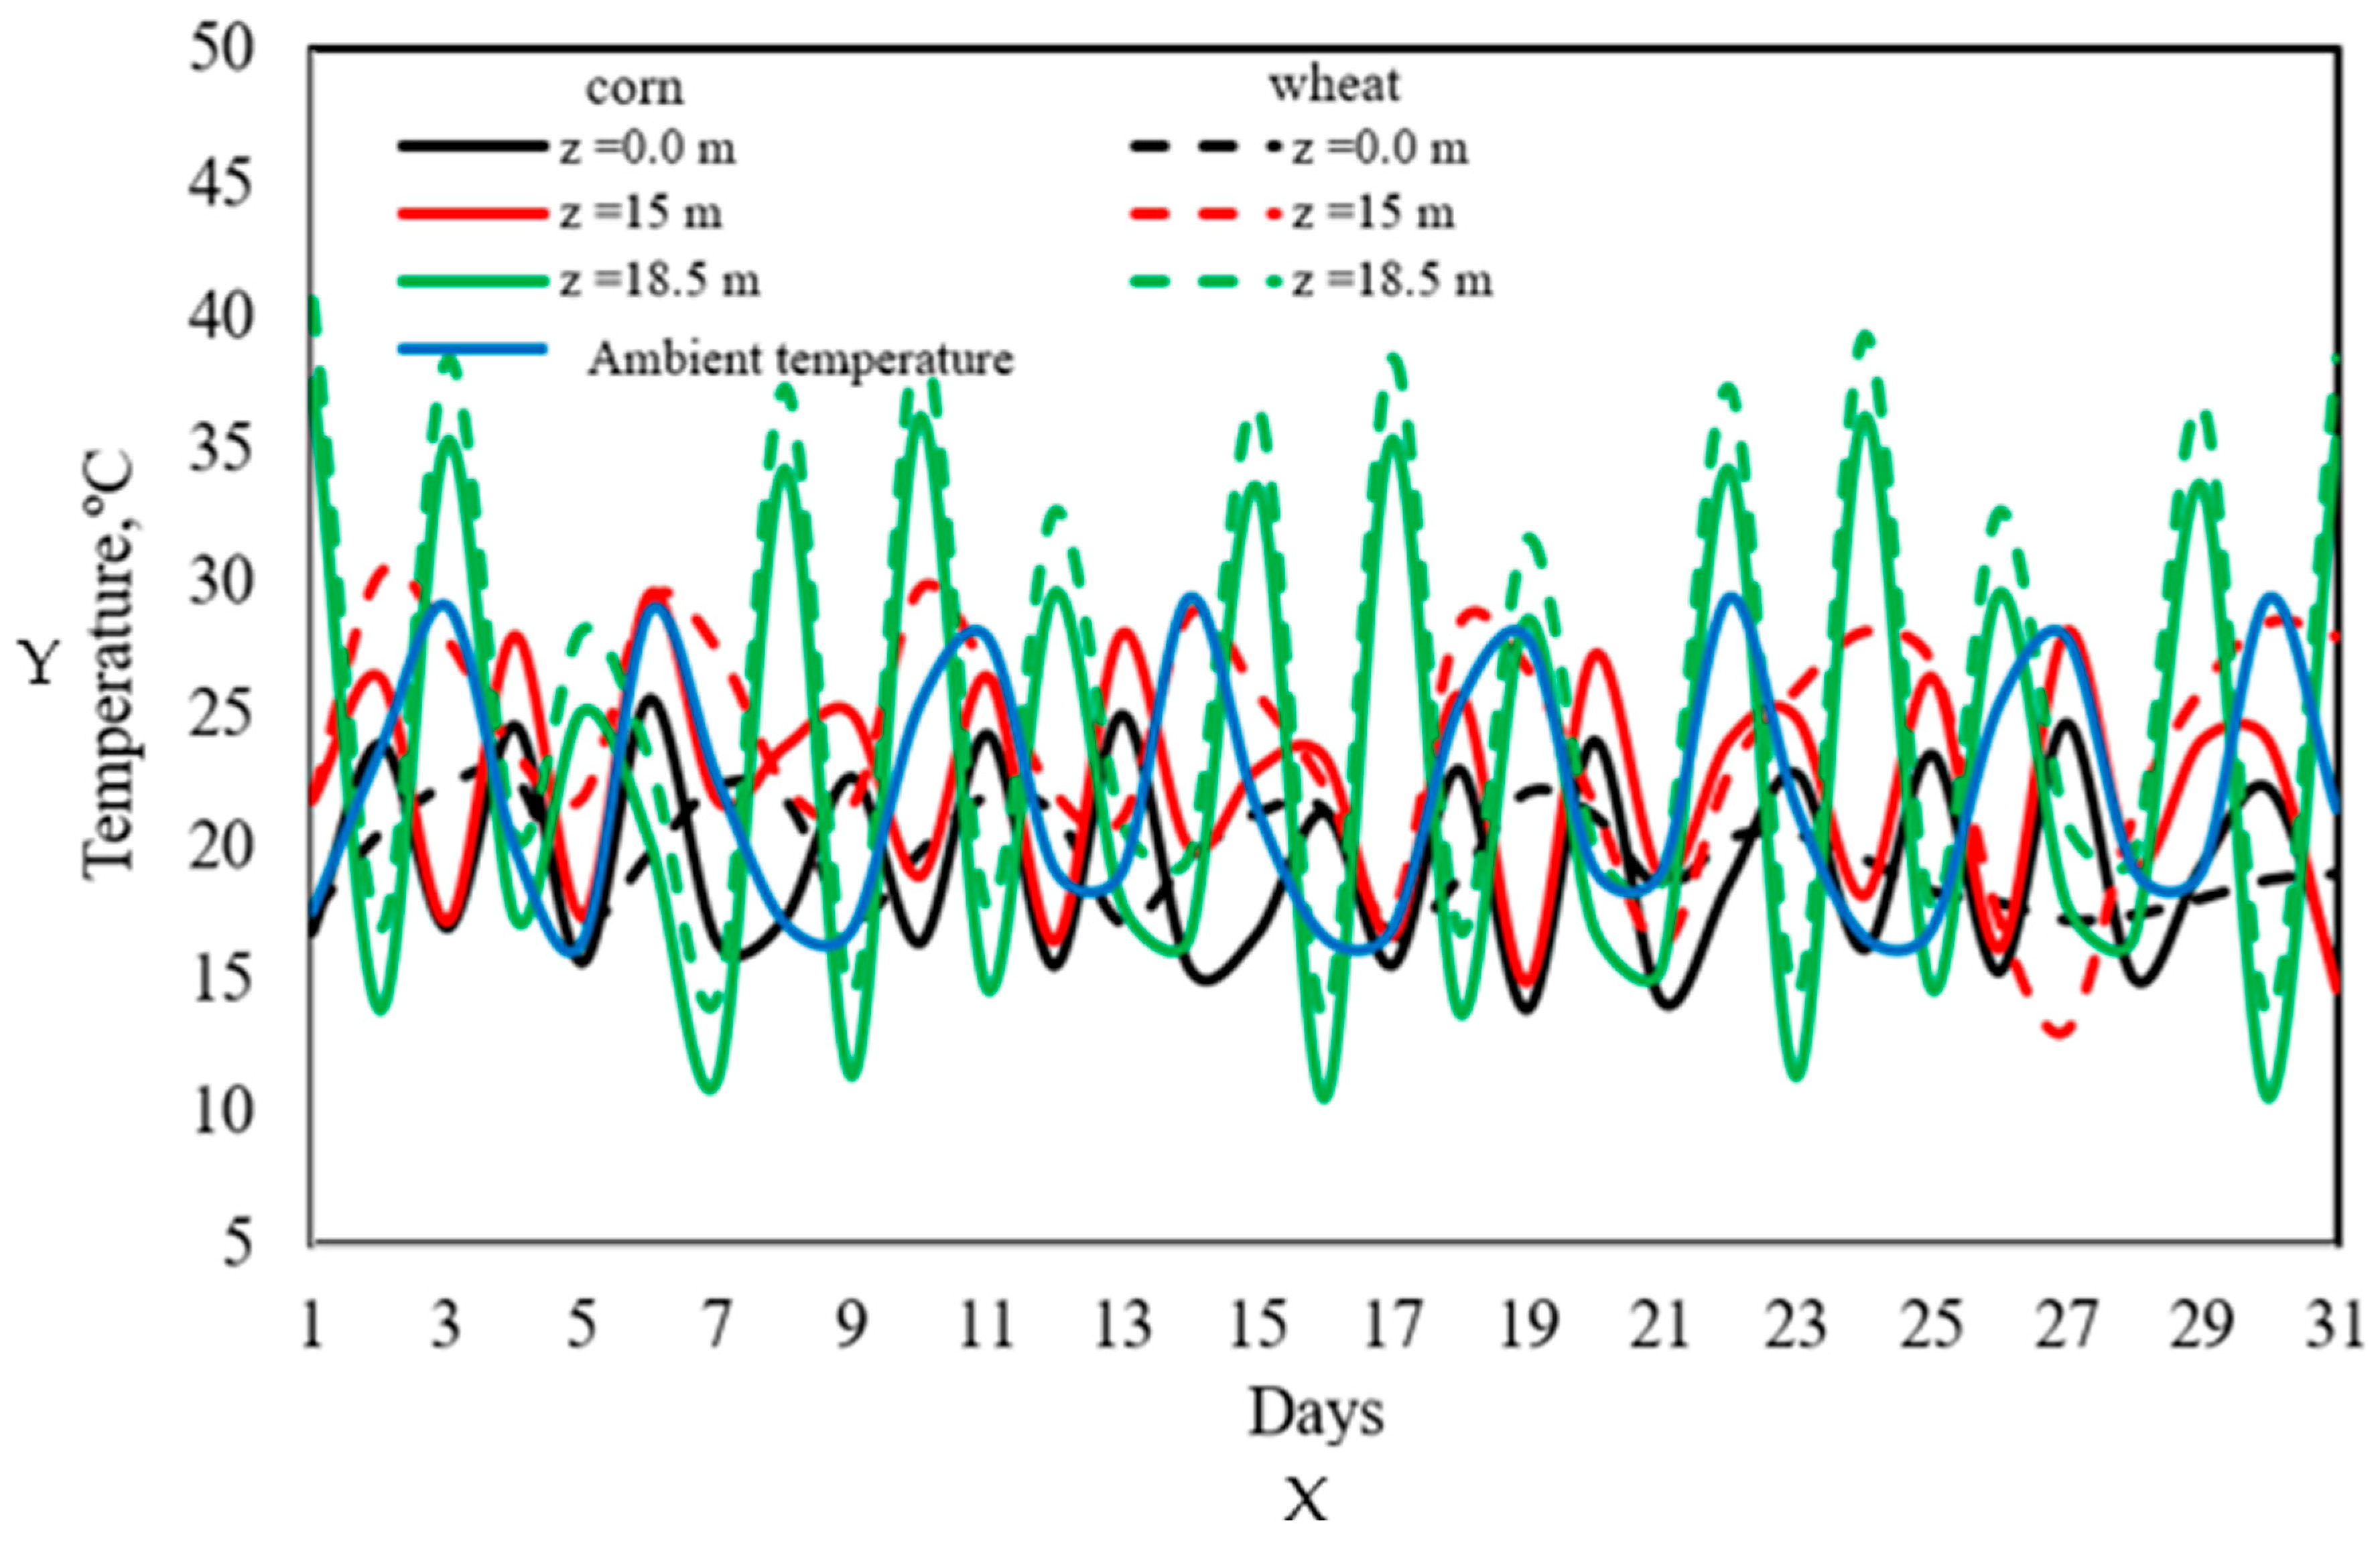
Regarding the axial temperature profiles, Figure 10 illustrates the temperature distribution along the height of the silo for corn (solid lines) and wheat (dashed lines), compared to the ambient temperature throughout December. For corn, it is observed that at the bottom of the silo (black solid line), temperatures remain below the ambient temperature for most of the month. This occurs because this region does not receive direct solar radiation and is less exposed to environmental heat exchange, acting as a thermal buffer zone, as previously reported by Montross et al. [6], Lawrence and Maier [7], and Barreto et al. [8]. At a height of 15 m, temperatures increase significantly compared to the bottom and begin to partially follow the ambient temperatures, reflecting greater sensitivity to environmental thermal variations, particularly during the warmest hours of the day. In the upper part, near the walls adjacent to the roof, grain temperatures exceed ambient values, reaching peaks of up to 40 °C and lows of 10 °C, indicating the cumulative effect of direct solar radiation on the metal roof. This zone exhibits the most significant temperature fluctuations, making it a critical area for grain preservation, as demonstrated in studies by Thorpe [24]. In the case of wheat (dashed lines), the temperature gradients display a qualitatively similar pattern to that of corn, but with slightly higher values, particularly in the upper region. This is due to the low thermal diffusivity of wheat, which allows for more heat retention in the grain mass, thereby preventing the rapid dissipation of energy. Despite this, the overall shape of the curves and the sensitivity to radiation are comparable for both grains.
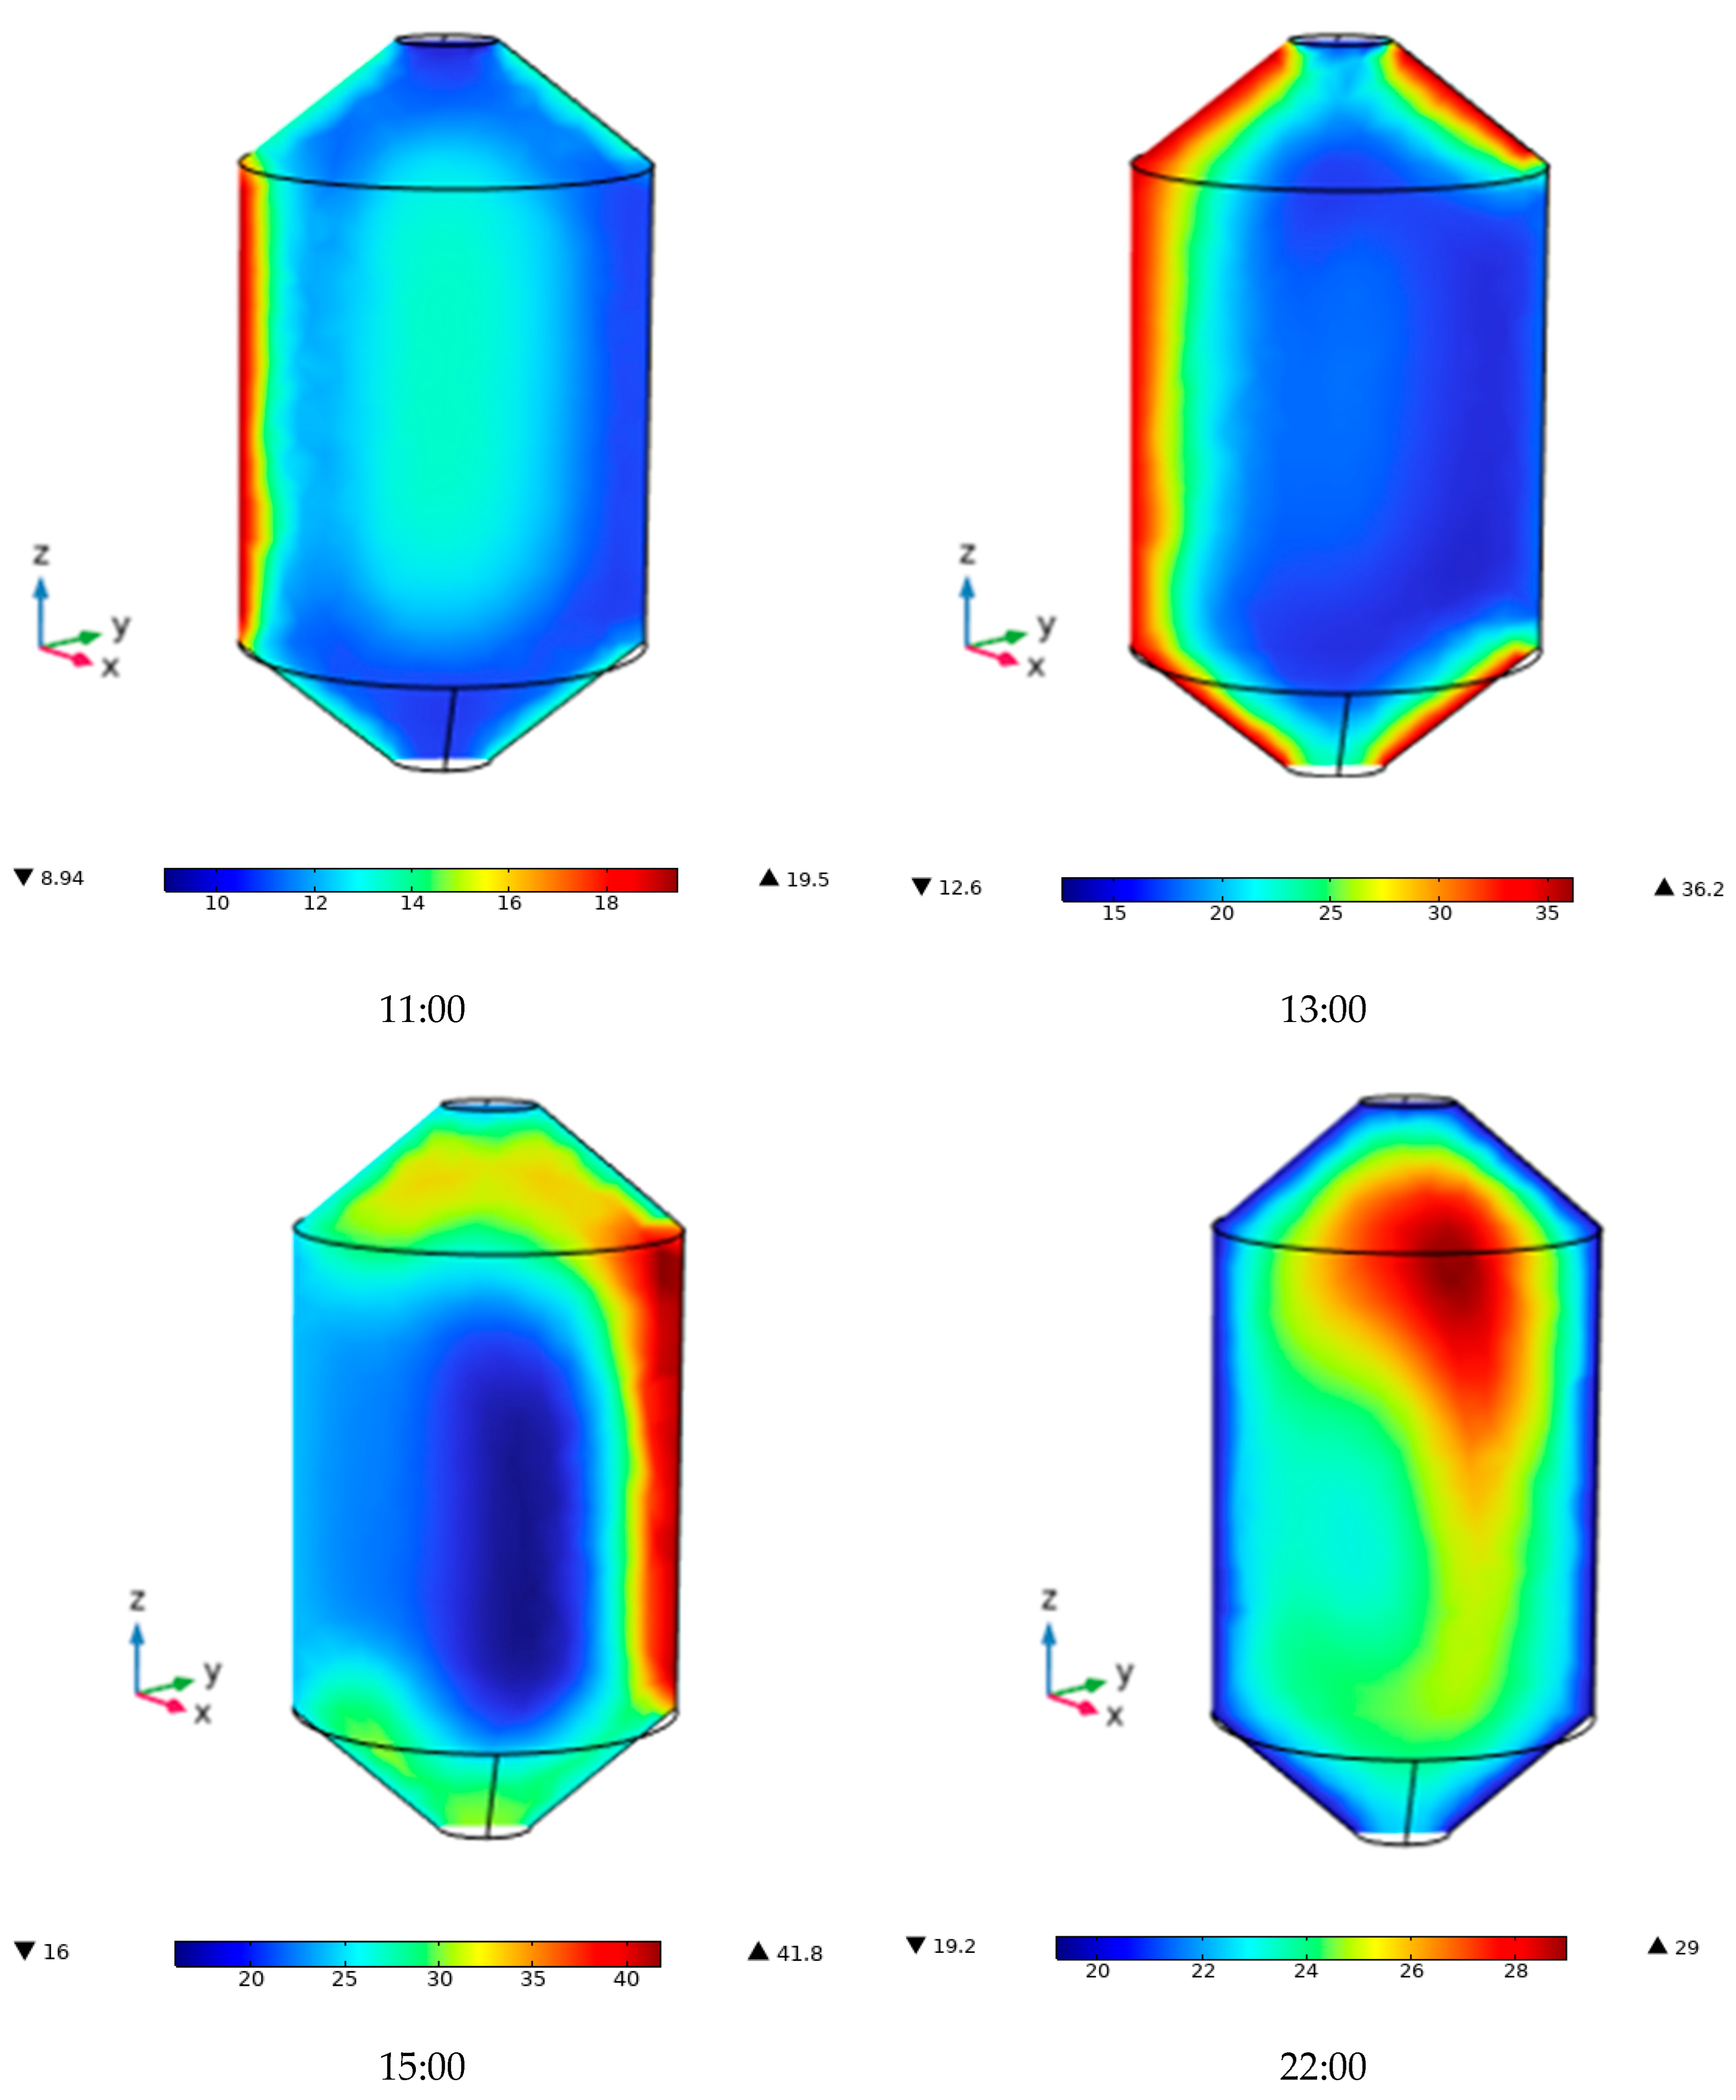
The following section analyzes the temperature contours, which serve as a fundamental tool for understanding the dynamics of grain storage in silos. Unlike point temperature profiles, contours enable the spatial and continuous visualization of how heat is distributed within the stored volume. This is crucial for identifying critical zones of heat accumulation, temperature gradients, and potential areas of deterioration due to condensation or microbial growth. The analysis of temperature contours obtained through computational fluid dynamics (CFD) clearly illustrates the thermal evolution of the grain inside the silo under realistic conditions of solar radiation and ambient variation. The orientation of the silo (with east on the left and west on the right), combined with the solar incidence model, captures the thermal asymmetrical energy generated throughout the day. Figure 11 shows the temperature contours for a day in December in the case of stored corn. During the early hours of the day, the left wall of the silo receives a greater amount of solar radiation. The temperature of the grain adjacent to the metal sheet reaches approximately 30 °C due to direct solar incidence. Meanwhile, the west wall, in shadow, remains near 15 °C, and the center of the silo reaches about 20 °C, indicating that the grain acts as a thermal insulator. This behavior is consistent with that described by Zheng et al. [40], who identified horizontal thermal gradients in partially irradiated silos. As the Sun approaches its zenith (noon h), the angle of solar incidence becomes more perpendicular, intensifying heat absorption on the roof and east wall. The maximum temperature of the grain near the sheet rises to 36 °C, and the heat begins to propagate toward the silo core, increasing internal temperatures. The west wall remains cooler, further accentuating the horizontal thermal gradients. These gradients not only affect grain uniformity but can also induce internal natural convection flows, as reported by Balzi et al. [5] and Abalone et al. [16]. During the afternoon, around 15:00 h, the Sun is nearly perpendicular to the silo roof, causing significant overheating in the upper section of the silo. The heat is rapidly transferred to the grains adjacent to the roof and descends along the west wall, which now begins to warm up. In contrast, the left wall begins to cool, creating a thermal inversion. This dynamic asymmetry favors nighttime condensation processes, particularly at the grain–metal sheet interface. In the absence of solar radiation during the nighttime hours (22:00), the silo cools down due to ambient temperature, and both the walls and roof lose heat rapidly. However, a hot core forms near the west wall, with temperatures of around 30 °C, which represents an optimal condition for insect development. This residual heat originates from the energy accumulated during peak hours and is reinforced by heat generated through grain respiration, which increases in magnitude due to previous thermal gradients. Moreover, the cyclic heating and cooling of the silo walls can induce condensation in the outer layers of grain, promoting fungal development [21,30,39].
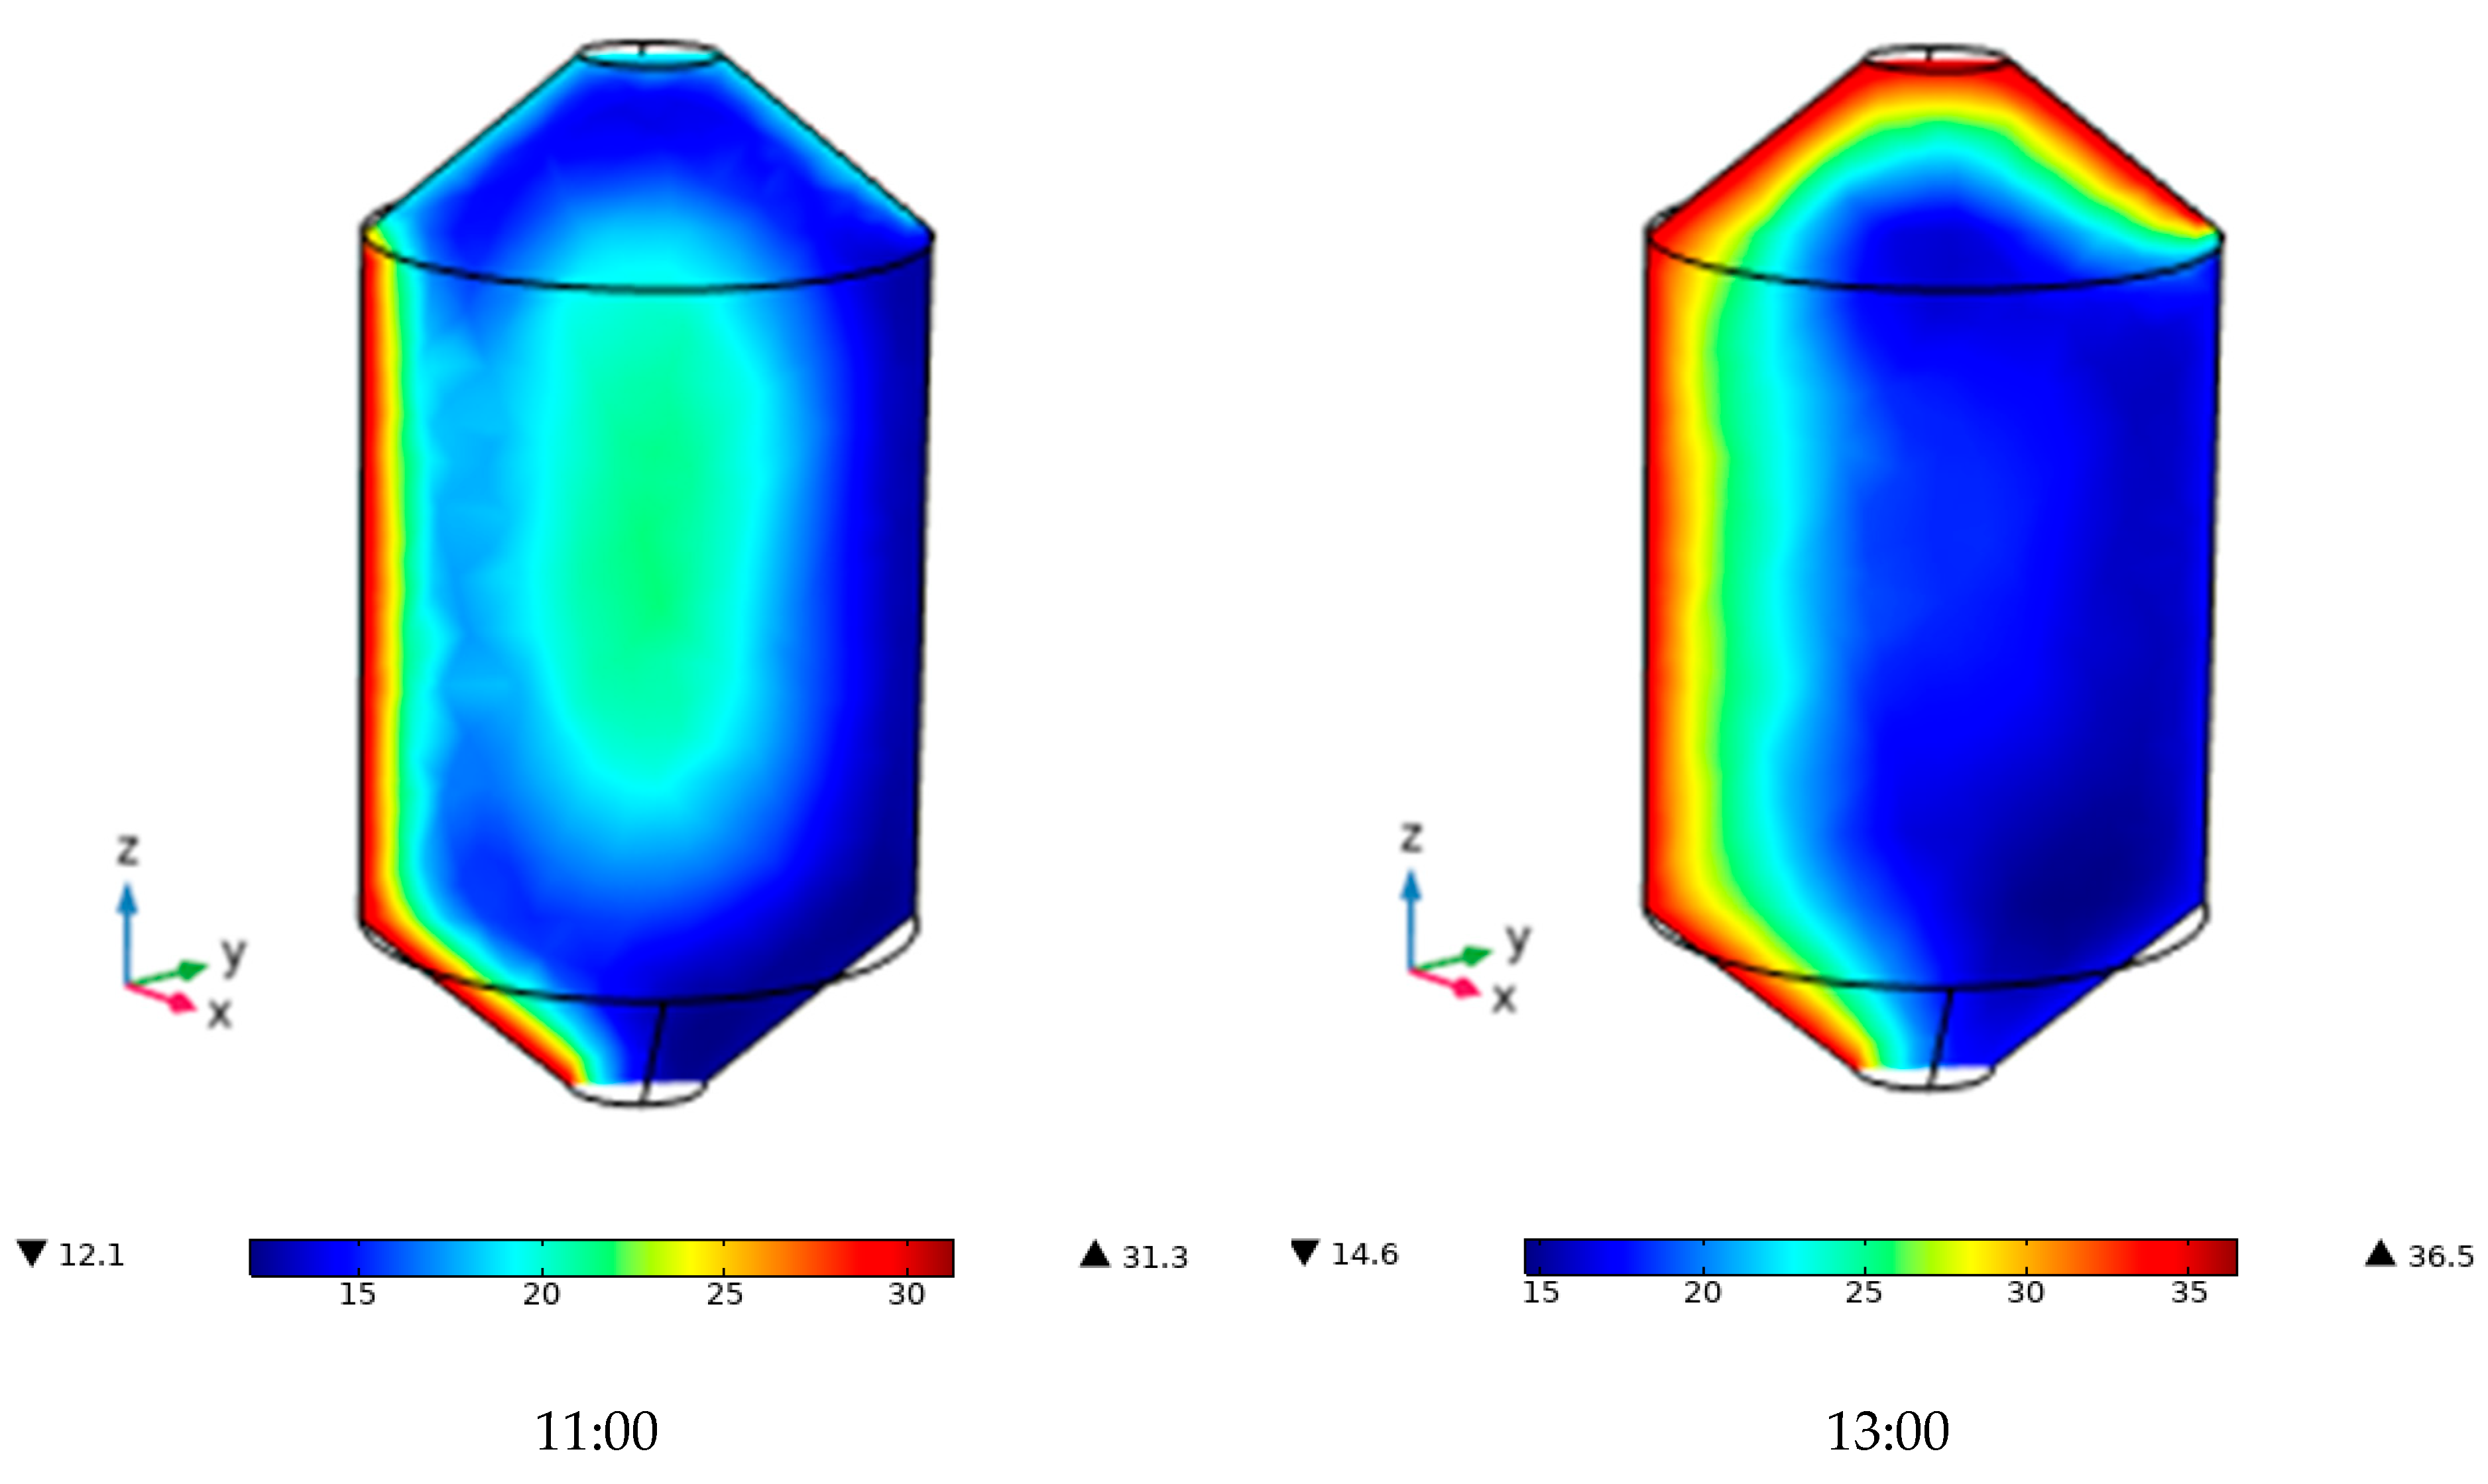
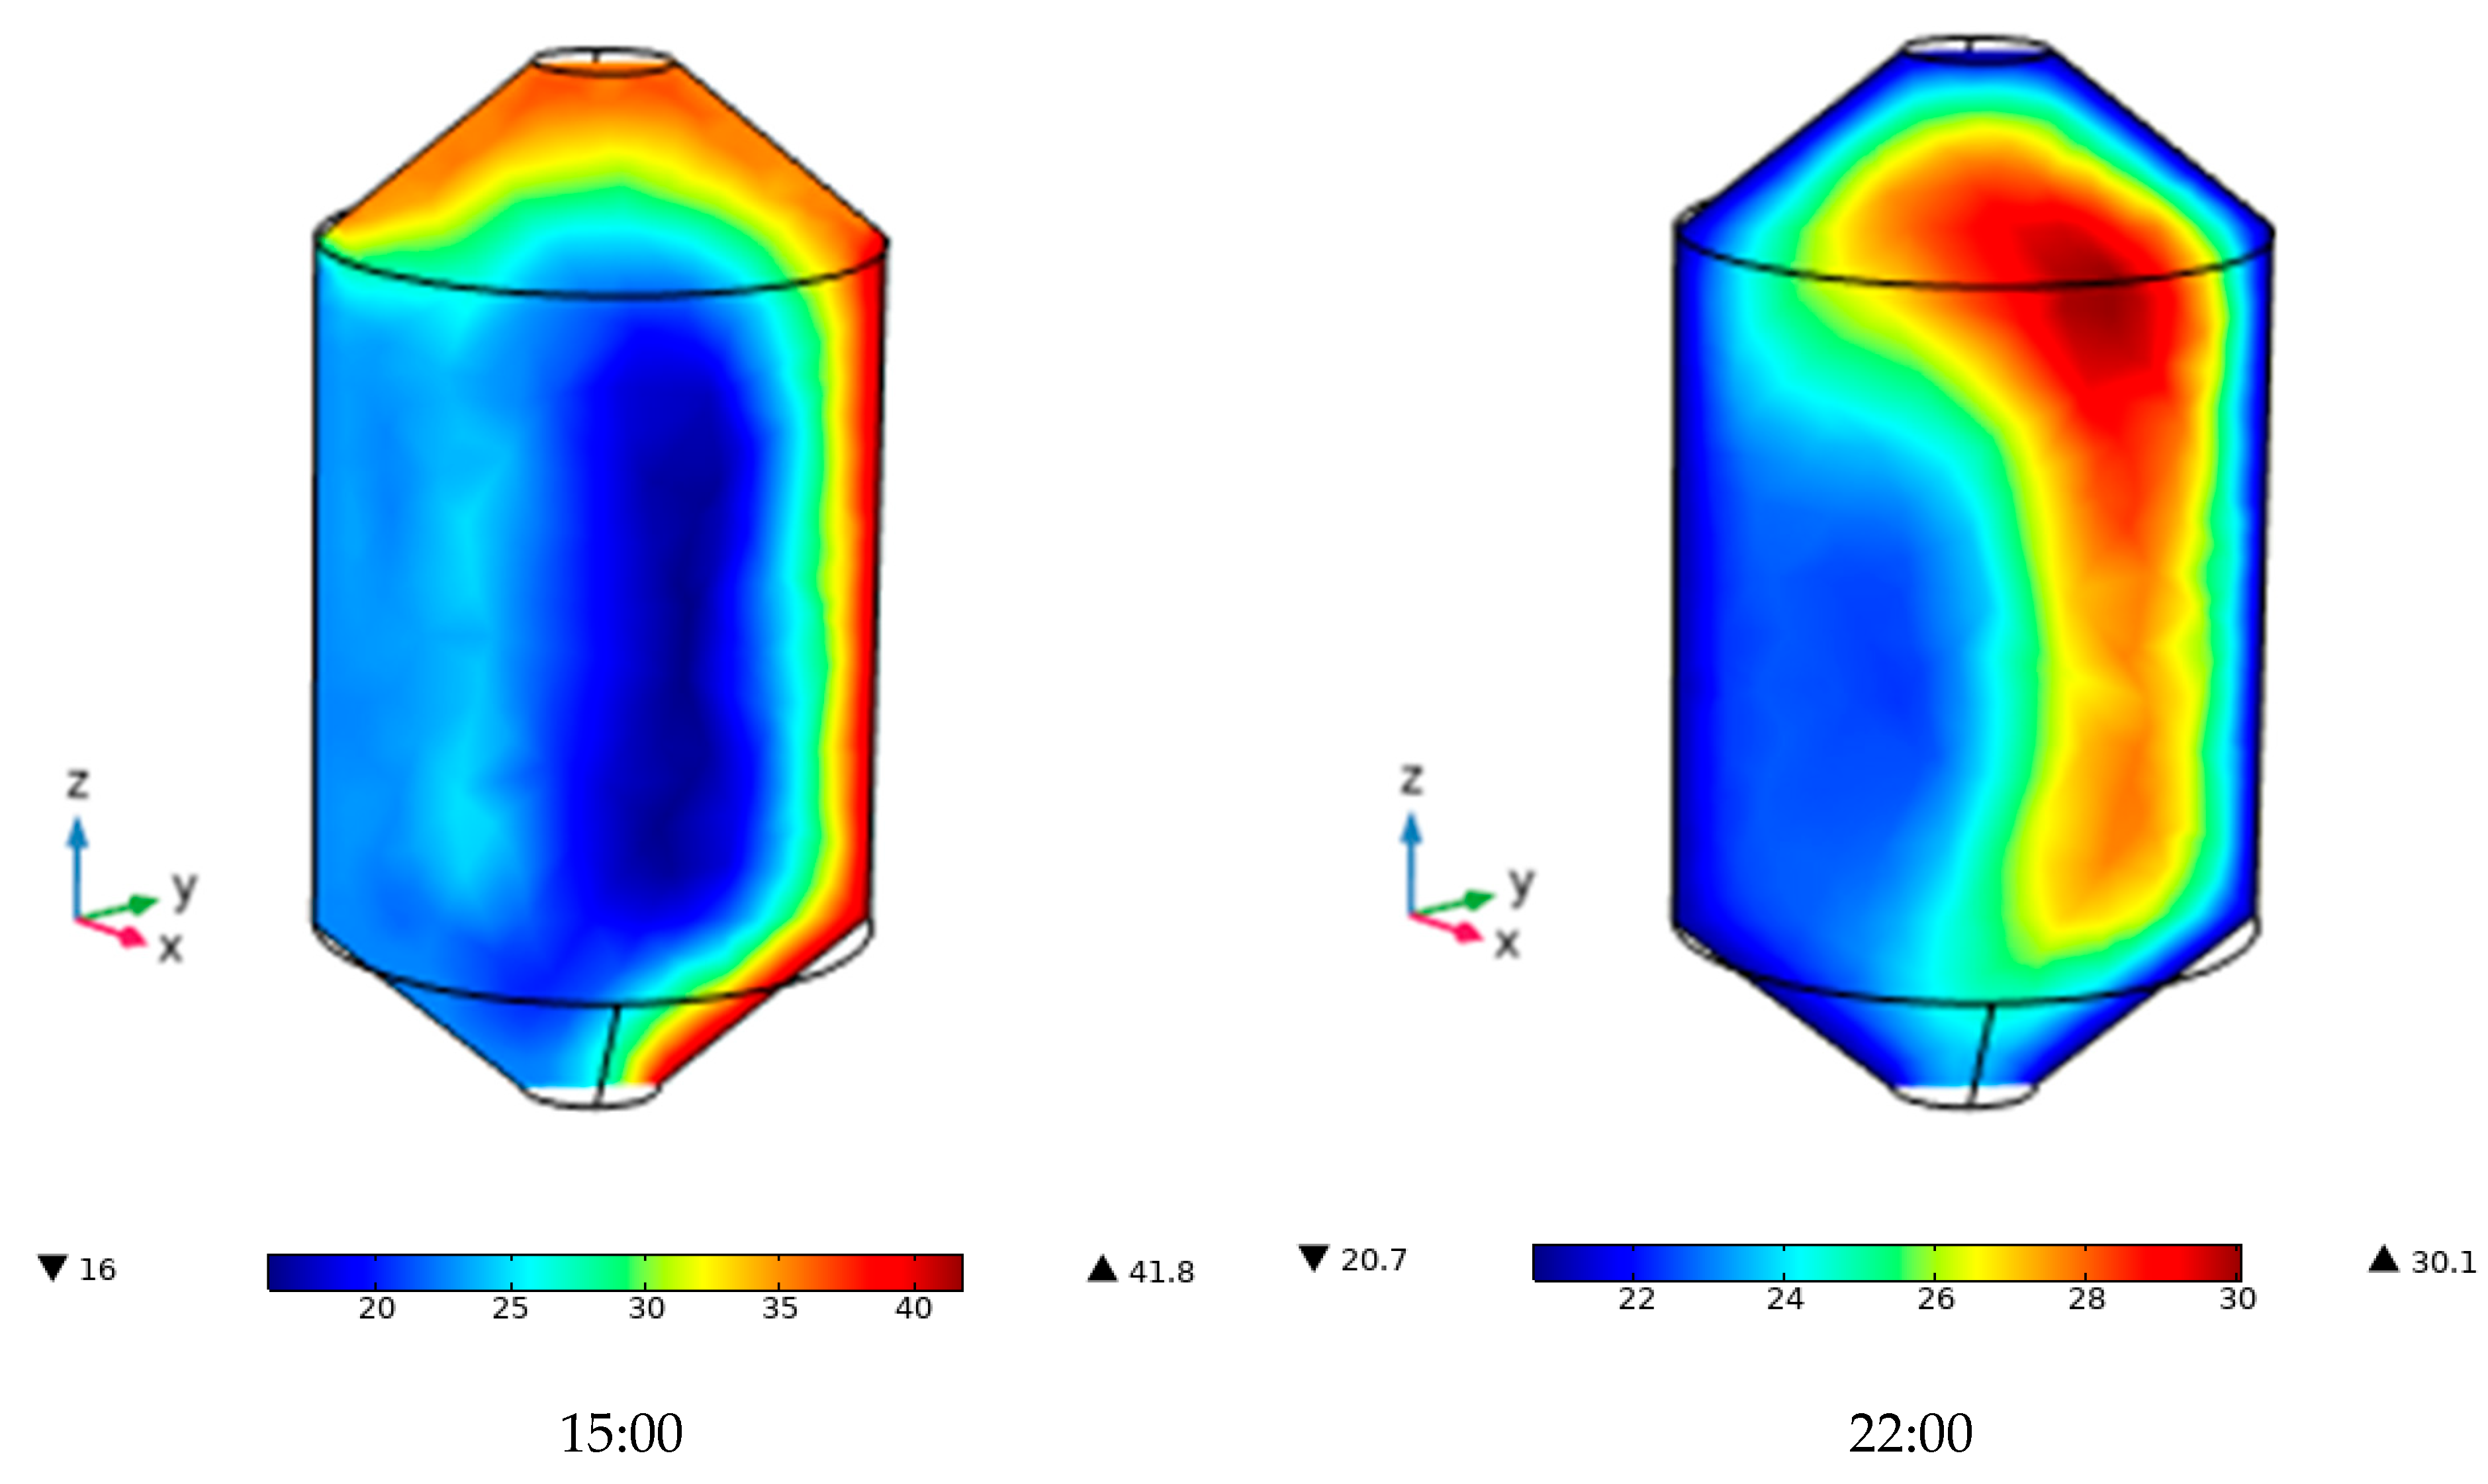
Figure 12 shows the temperature contours for wheat during a single day of storage in December. The thermal behavior is mainly characterized by low thermal diffusivity, which influences how the grain absorbs, transfers, and retains heat throughout the day. At 11:00 h, the temperature distribution shows a predominantly cool interior, with a slight increase in temperature on the east-facing wall due to early solar radiation. A thin thermal gradient appears on the outer surface. At the same time, the inner mass remains cool, indicating that wheat, due to limited thermal conductivity, initially retains heat on the metal sheet surface without transferring it inward. Around 13:00 h, the temperature contours indicate the start of heating in the upper grain layers, especially near the roof of the silo, where solar radiation strikes more directly as the Sun approaches zenith.
The angle of incidence becomes nearly perpendicular, increasing heat absorption on the metal surface [22,30]. As a result, the thermal core shifts upward, replacing the previous central position and marking the beginning of a thermal gradient from the top to the interior. By 15:00 h, a critical point in thermal behavior is reached. The figures for this time show widespread overheating in the upper section and along both lateral walls of the silo, with maximum temperatures occurring in the grain next to the metal sheet. These elevated temperatures, symmetrically distributed on both sides, result from the accumulated solar radiation. In contrast, the central core stays relatively cool, confirming the insulation properties of wheat and its high thermal inertia [29,31]. This uneven temperature distribution creates steep gradients between the outer and inner layers, which may cause condensation and localized deterioration in the outermost grain layers. At 22:00 h, without direct or diffuse solar radiation, a general cooling of the silo walls and bottom occurs due to the drop in ambient temperature [40,41,42,43,44]. However, a well-defined warm core remains in the upper central region of the silo, where temperatures stay close to 30 °C. This residual heat, retained because of wheat’s low thermal dissipation, represents a critical zone for preservation. The presence of warm internal layers and cold external surfaces causes interstitial air condensation, especially near the top of the silo, which may promote fungal and insect development, as reported by several authors [45,46,47,48,49].
Overall, the thermal behavior of wheat shows a resistance profile, with significant surface heat retention and a tendency to form persistent hot spots. This sets it apart from other grains and calls for specific ventilation and thermal monitoring strategies. Compared to corn, wheat exhibits a slower and more symmetrical thermal response, with limited heat penetration toward the center but a higher risk of localized accumulation in the upper region of the silo, especially during nighttime cooling.
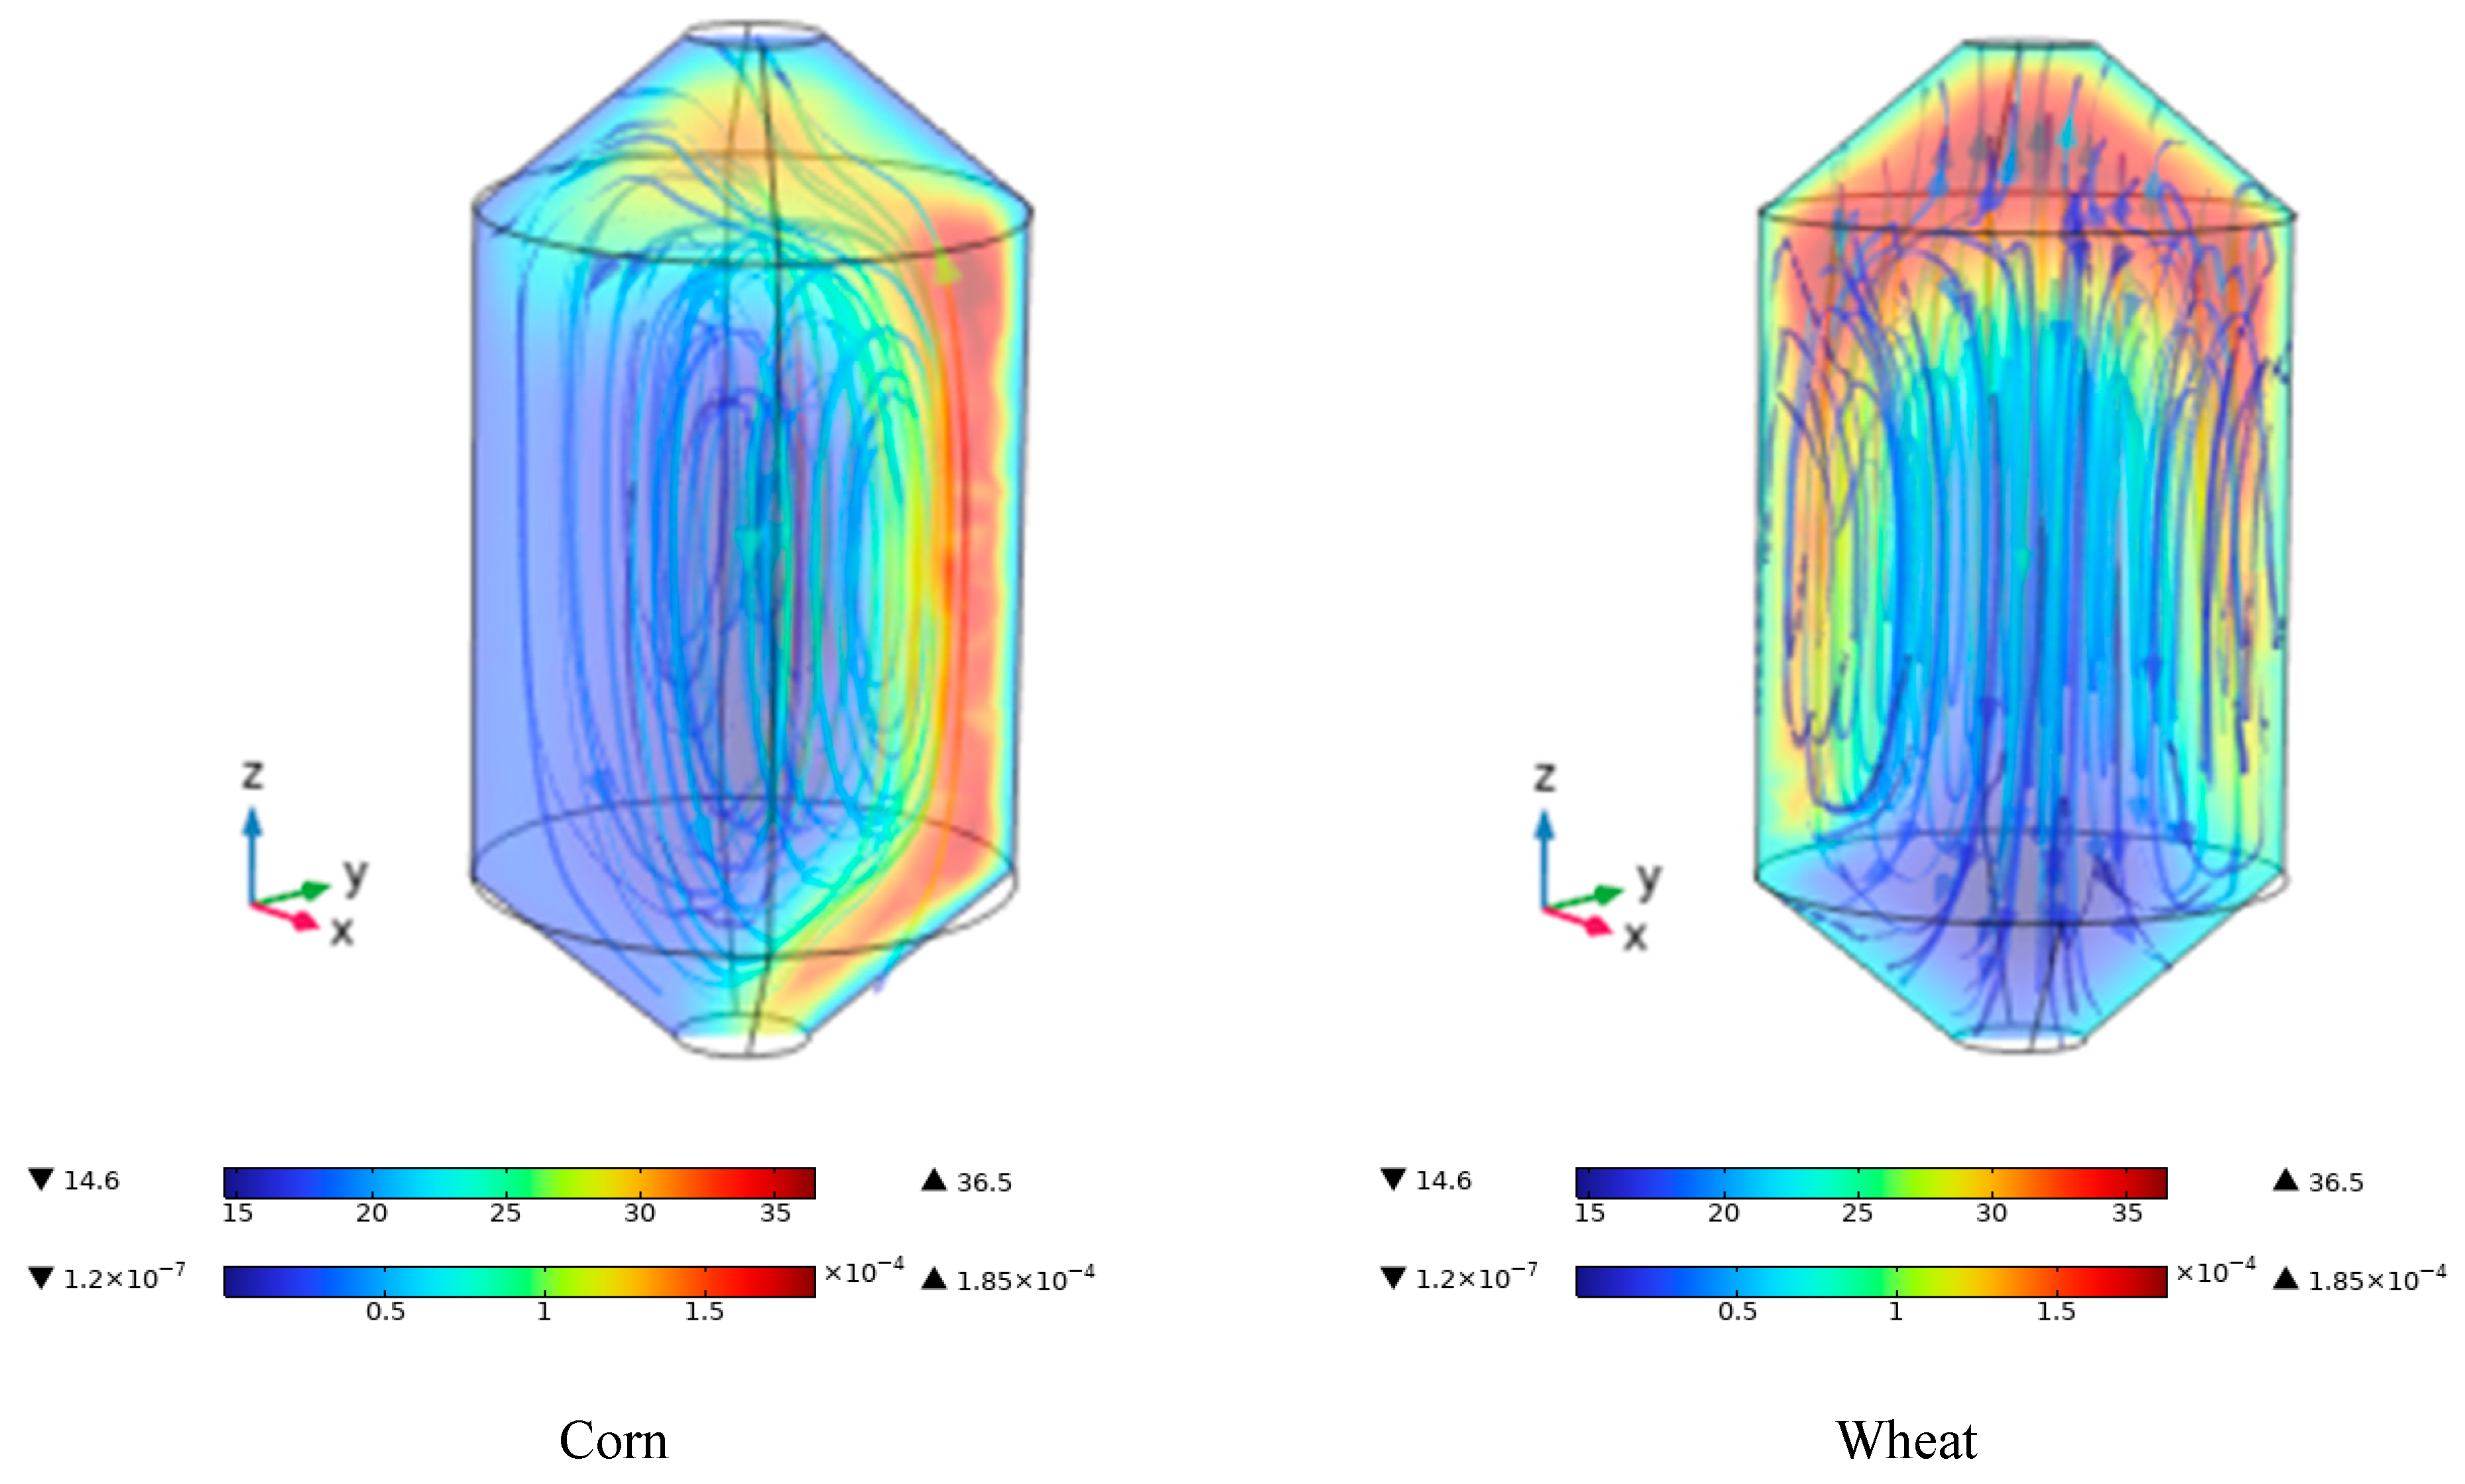
Figure 13 illustrates the effect of external temperature conditions at 14:00 h—when solar radiation is at its peak—on natural convection during the storage of corn and wheat. The figure corresponding to the corn case illustrates how heat accumulation on the left wall of the silo, which corresponds to the east-facing side, generates a strong temperature gradient that drives natural convection within the stored grain mass. This differential heating creates intense streamlines in the sun-exposed zone, which induce interstitial air movement from cooler to warmer regions. As a result, the warm air rises along the left side, and this convective flow tends to displace cooler air toward the center and the opposite side of the silo, promoting a thermal recirculation cycle. This flow pattern is characteristic of natural convection driven by temperature gradients in porous media, as described by Thorpe [24], Barreto et al. [8], and Gastón et al. [15]. These authors demonstrated that irradiated areas generate upward flows that intensify interstitial air circulation. In this situation, the air movement not only transfers heat but also generates localized cooling zones near the hot wall, due to the contact of cooler air with the grain. However, this circulation also poses significant risks, as the resulting thermal gradients create conditions for moisture condensation—especially when warm, humid air encounters cooler regions of the silo, such as the center or the shaded side. These condensation-prone zones are critical points for fungal development and grain spoilage, underscoring the importance of understanding and controlling natural convection patterns during long-term storage. The extreme values of temperature (14.6 °C to 36.5 °C) and air velocities (1.2 × 10⁻⁷ to 1.85 × 10⁻⁴ m3/day) reflect the magnitude of the phenomenon, with well-defined flow patterns highlighting the influence of solar radiation on the thermal behavior within the silo [1,29].
In the case of wheat, the temperature contours and streamlines reveal a distinct natural convection dynamic, unlike that observed in corn. Due to the low thermal diffusivity of wheat, heat does not rapidly penetrate the grain mass, allowing the center of the silo to remain thermally more stable and cooler throughout the day. This thermal stability is further reinforced by the higher specific heat capacity of wheat (1900 J/kg·K) compared to corn (1780 J/kg·K), meaning that more energy is required to raise the temperature of wheat grain, which therefore heats up more slowly. As a result, the metabolic heat generated by the grain dissipates more evenly toward the exterior, producing symmetrical and vertical interstitial airflows throughout the silo. Although this behavior indicates a more uniform thermal distribution, it also presents a potential risk: the homogeneous natural convection flow may facilitate condensation of interstitial air moisture not only on the walls and roof—as typically observed in corn—but throughout the entire grain mass [50]. This phenomenon has been reported by authors such as Barreto et al. [8,9] and Thorpe [24], who warn that in the absence of controlled ventilation, natural convection driven by mild temperature and humidity gradients can create ideal conditions for fungal development in various regions of the silo. Thus, while wheat’s slower and more symmetrical thermal response may initially appear advantageous, it requires close attention to prevent adverse effects associated with localized moisture accumulation [18].
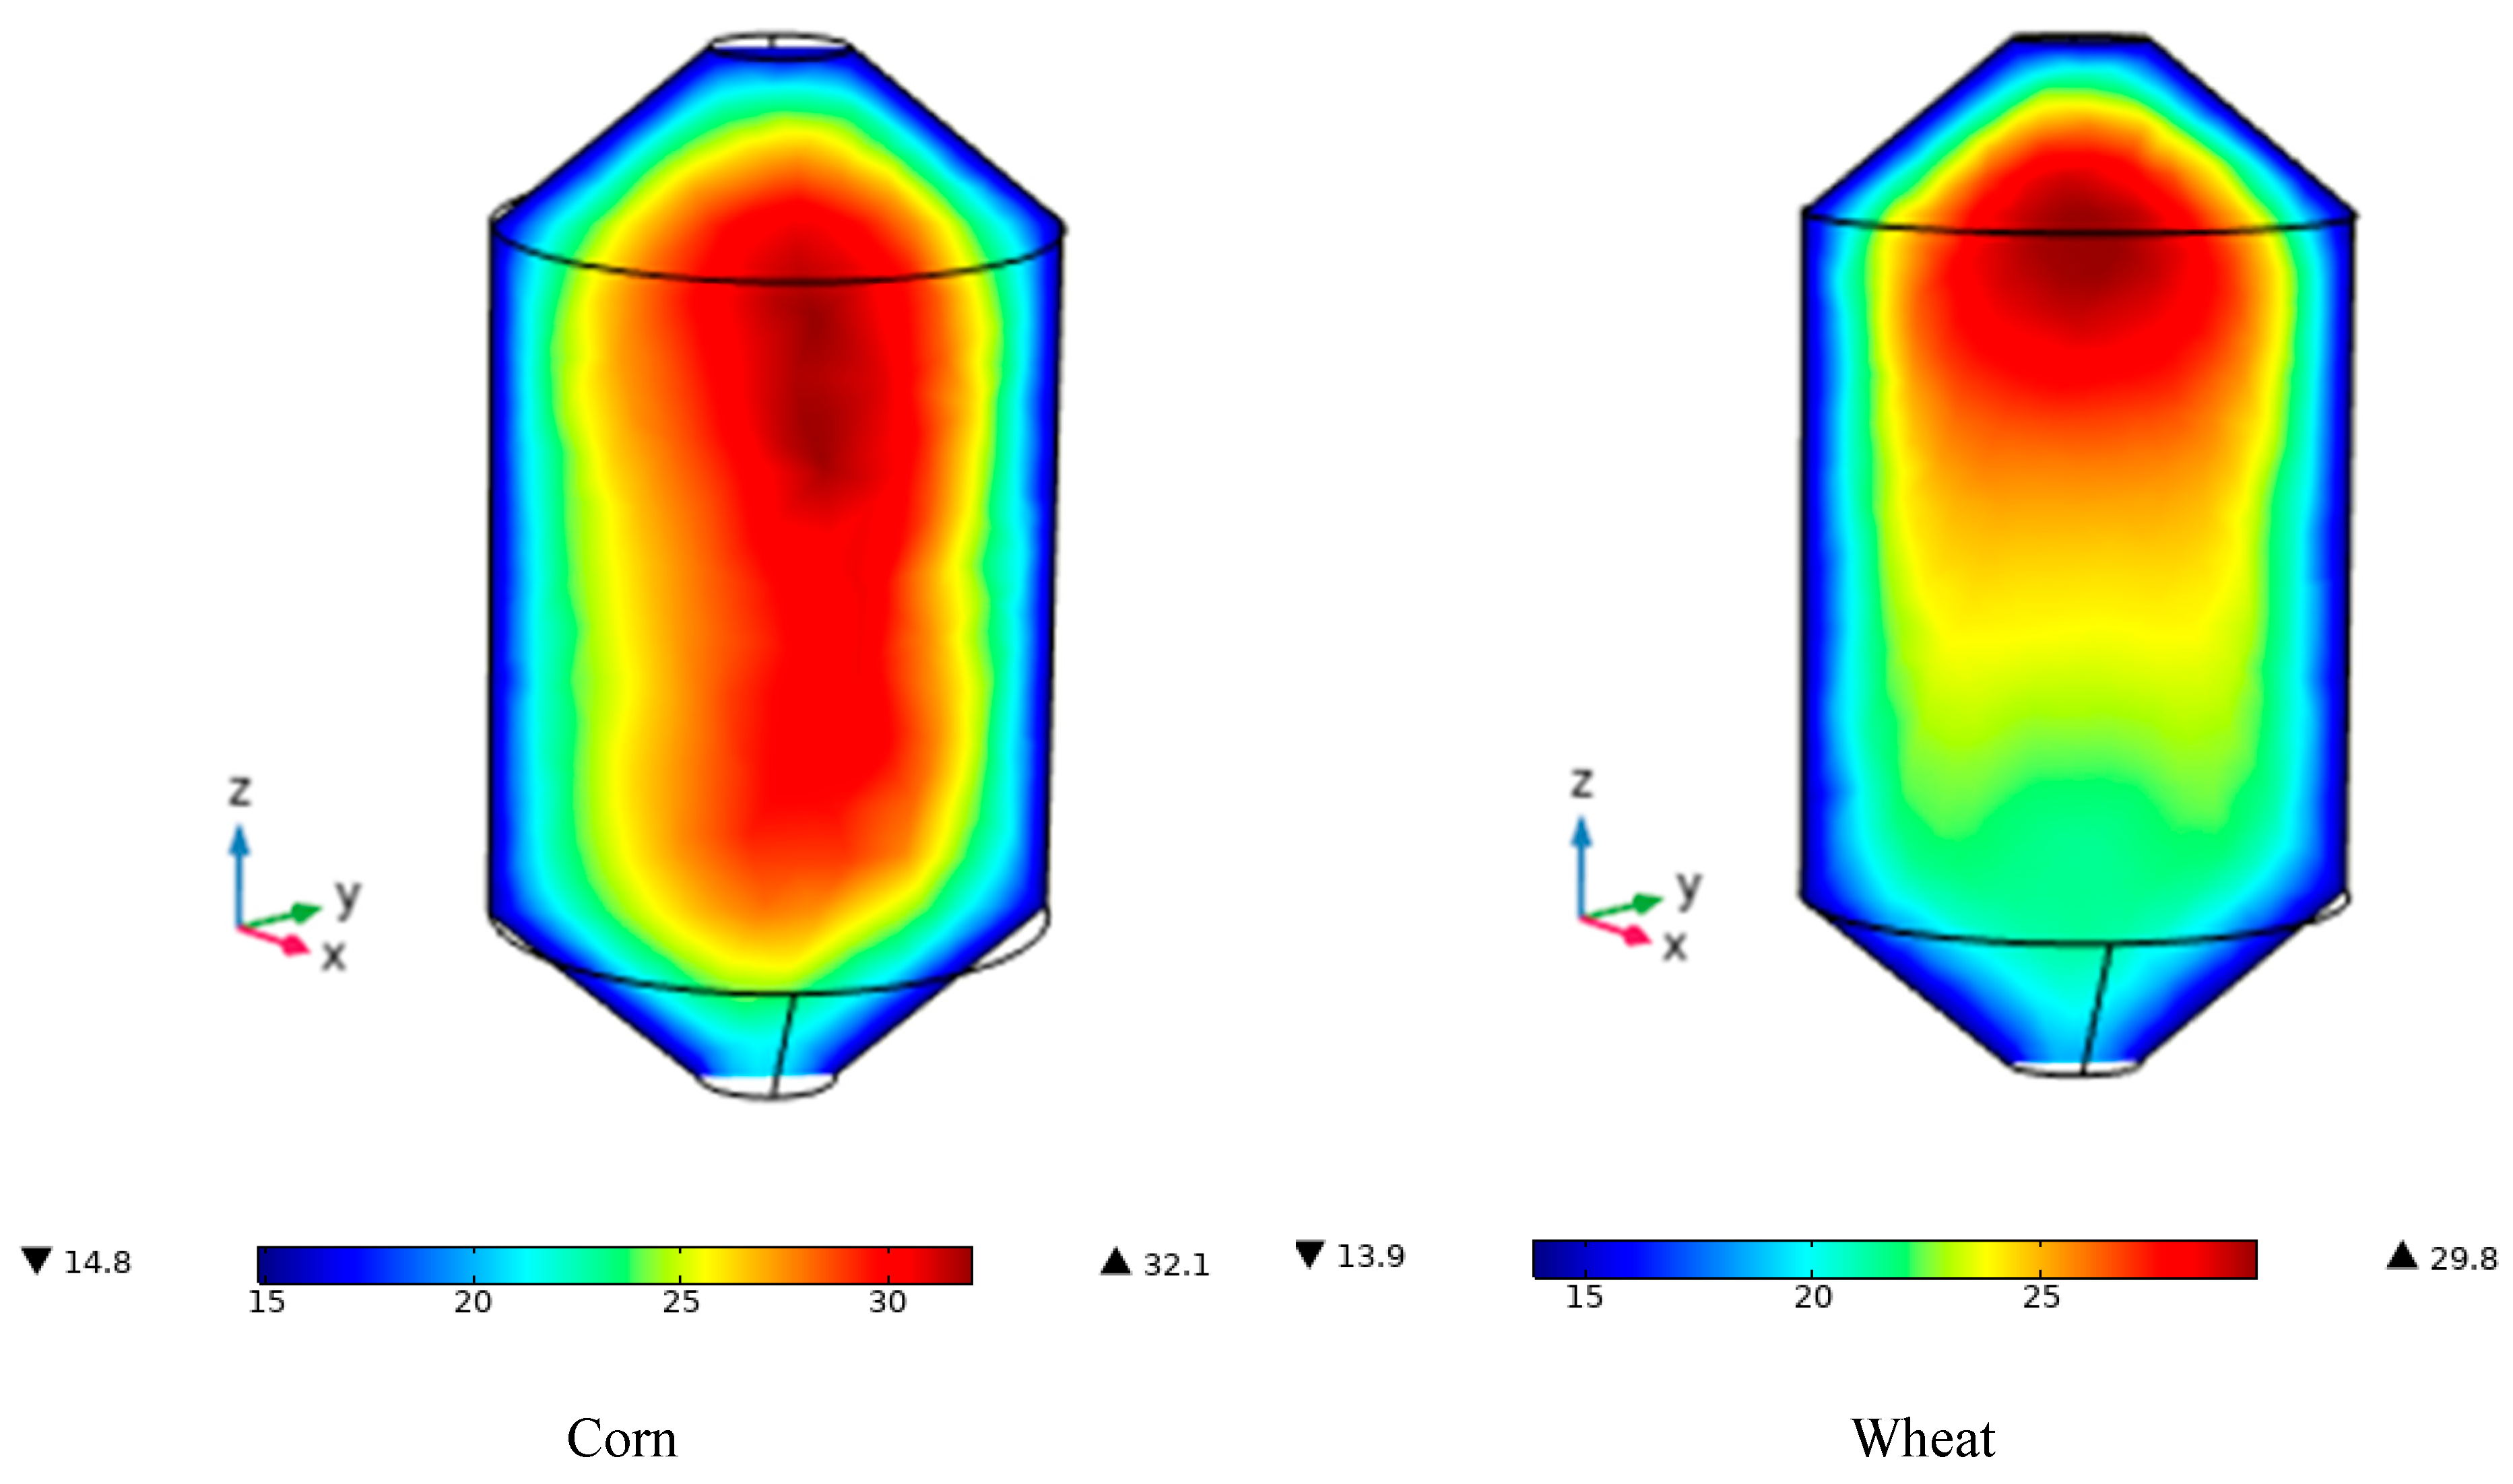
Figure 14 shows the temperature contours at the end of the storage period on December 31 at 00:00 h, corresponding to the corn case. The figure reveals the formation of a hot core in the central region of the silo, a phenomenon widely known in practice among operators as the appearance of a thermal heart. This area becomes a critical point for grain preservation, as it is far from the walls and therefore lacks direct contact with the cooler silo surfaces. Moreover, during storage without active ventilation systems or with poor airflow distribution, this area receives little or no aeration, favoring the accumulation of heat and moisture. This situation is further exacerbated by the heat generated by grain respiration and, in some cases, by the metabolic activity of insects and microorganisms, which can lead to a significant temperature rise, as noted by Khankari et al. [3], Balzi et al. [5], and Thorpe [24]. The thermal data support this observation, with maximum temperatures of 32.1 °C recorded at the center of the silo and minimum temperatures of 14.8 °C at the walls, indicating a significant temperature gradient even in the absence of direct solar radiation [29].
This nighttime thermal contrast highlights the cumulative effect of the grain’s metabolic heat during prolonged storage, underscoring the need for effective monitoring and ventilation strategies to prevent spoilage in these critical zones. In the case of wheat, by the end of the storage period, a different thermal behavior is observed compared to corn. Instead of forming a centered hot core, the thermal hotspot shifts toward the top of the silo, where the highest temperatures—around 29 °C—are concentrated, while the lower regions remain at approximately 25 °C. This vertical redistribution of heat is directly related to the thermal properties of wheat, which has a higher specific heat capacity than corn, allowing it to absorb more energy without experiencing rapid temperature increases. However, this also makes it more prone to retaining heat in its surface regions. Likewise, its lower thermal diffusivity limits the rate at which heat propagates inward, allowing respiration heat generated during storage to accumulate in the upper region, which is also indirectly affected by the residual effect of solar radiation [29,38]. Although the silo walls display the same cooling pattern observed in corn (minimum temperatures around 14.8 °C), this confirms that ambient variation continues to significantly influence the silo’s surface temperature, even in the absence of direct solar radiation. It is essential to note that, despite differences in the location of the thermal core, both corn and wheat cases present optimal conditions for insect development, as internal areas exceed 25 °C during the early morning hours when external temperatures are lower. Additionally, the silo’s cold walls create thermal gradients that promote interstitial air condensation, thereby establishing ideal conditions for fungal growth and microbiological spoilage [22,40]. These observations underscore the importance of thermal monitoring across various zones and the implementation of targeted ventilation strategies to maintain grain quality, tailored to each grain’s thermal properties [51].
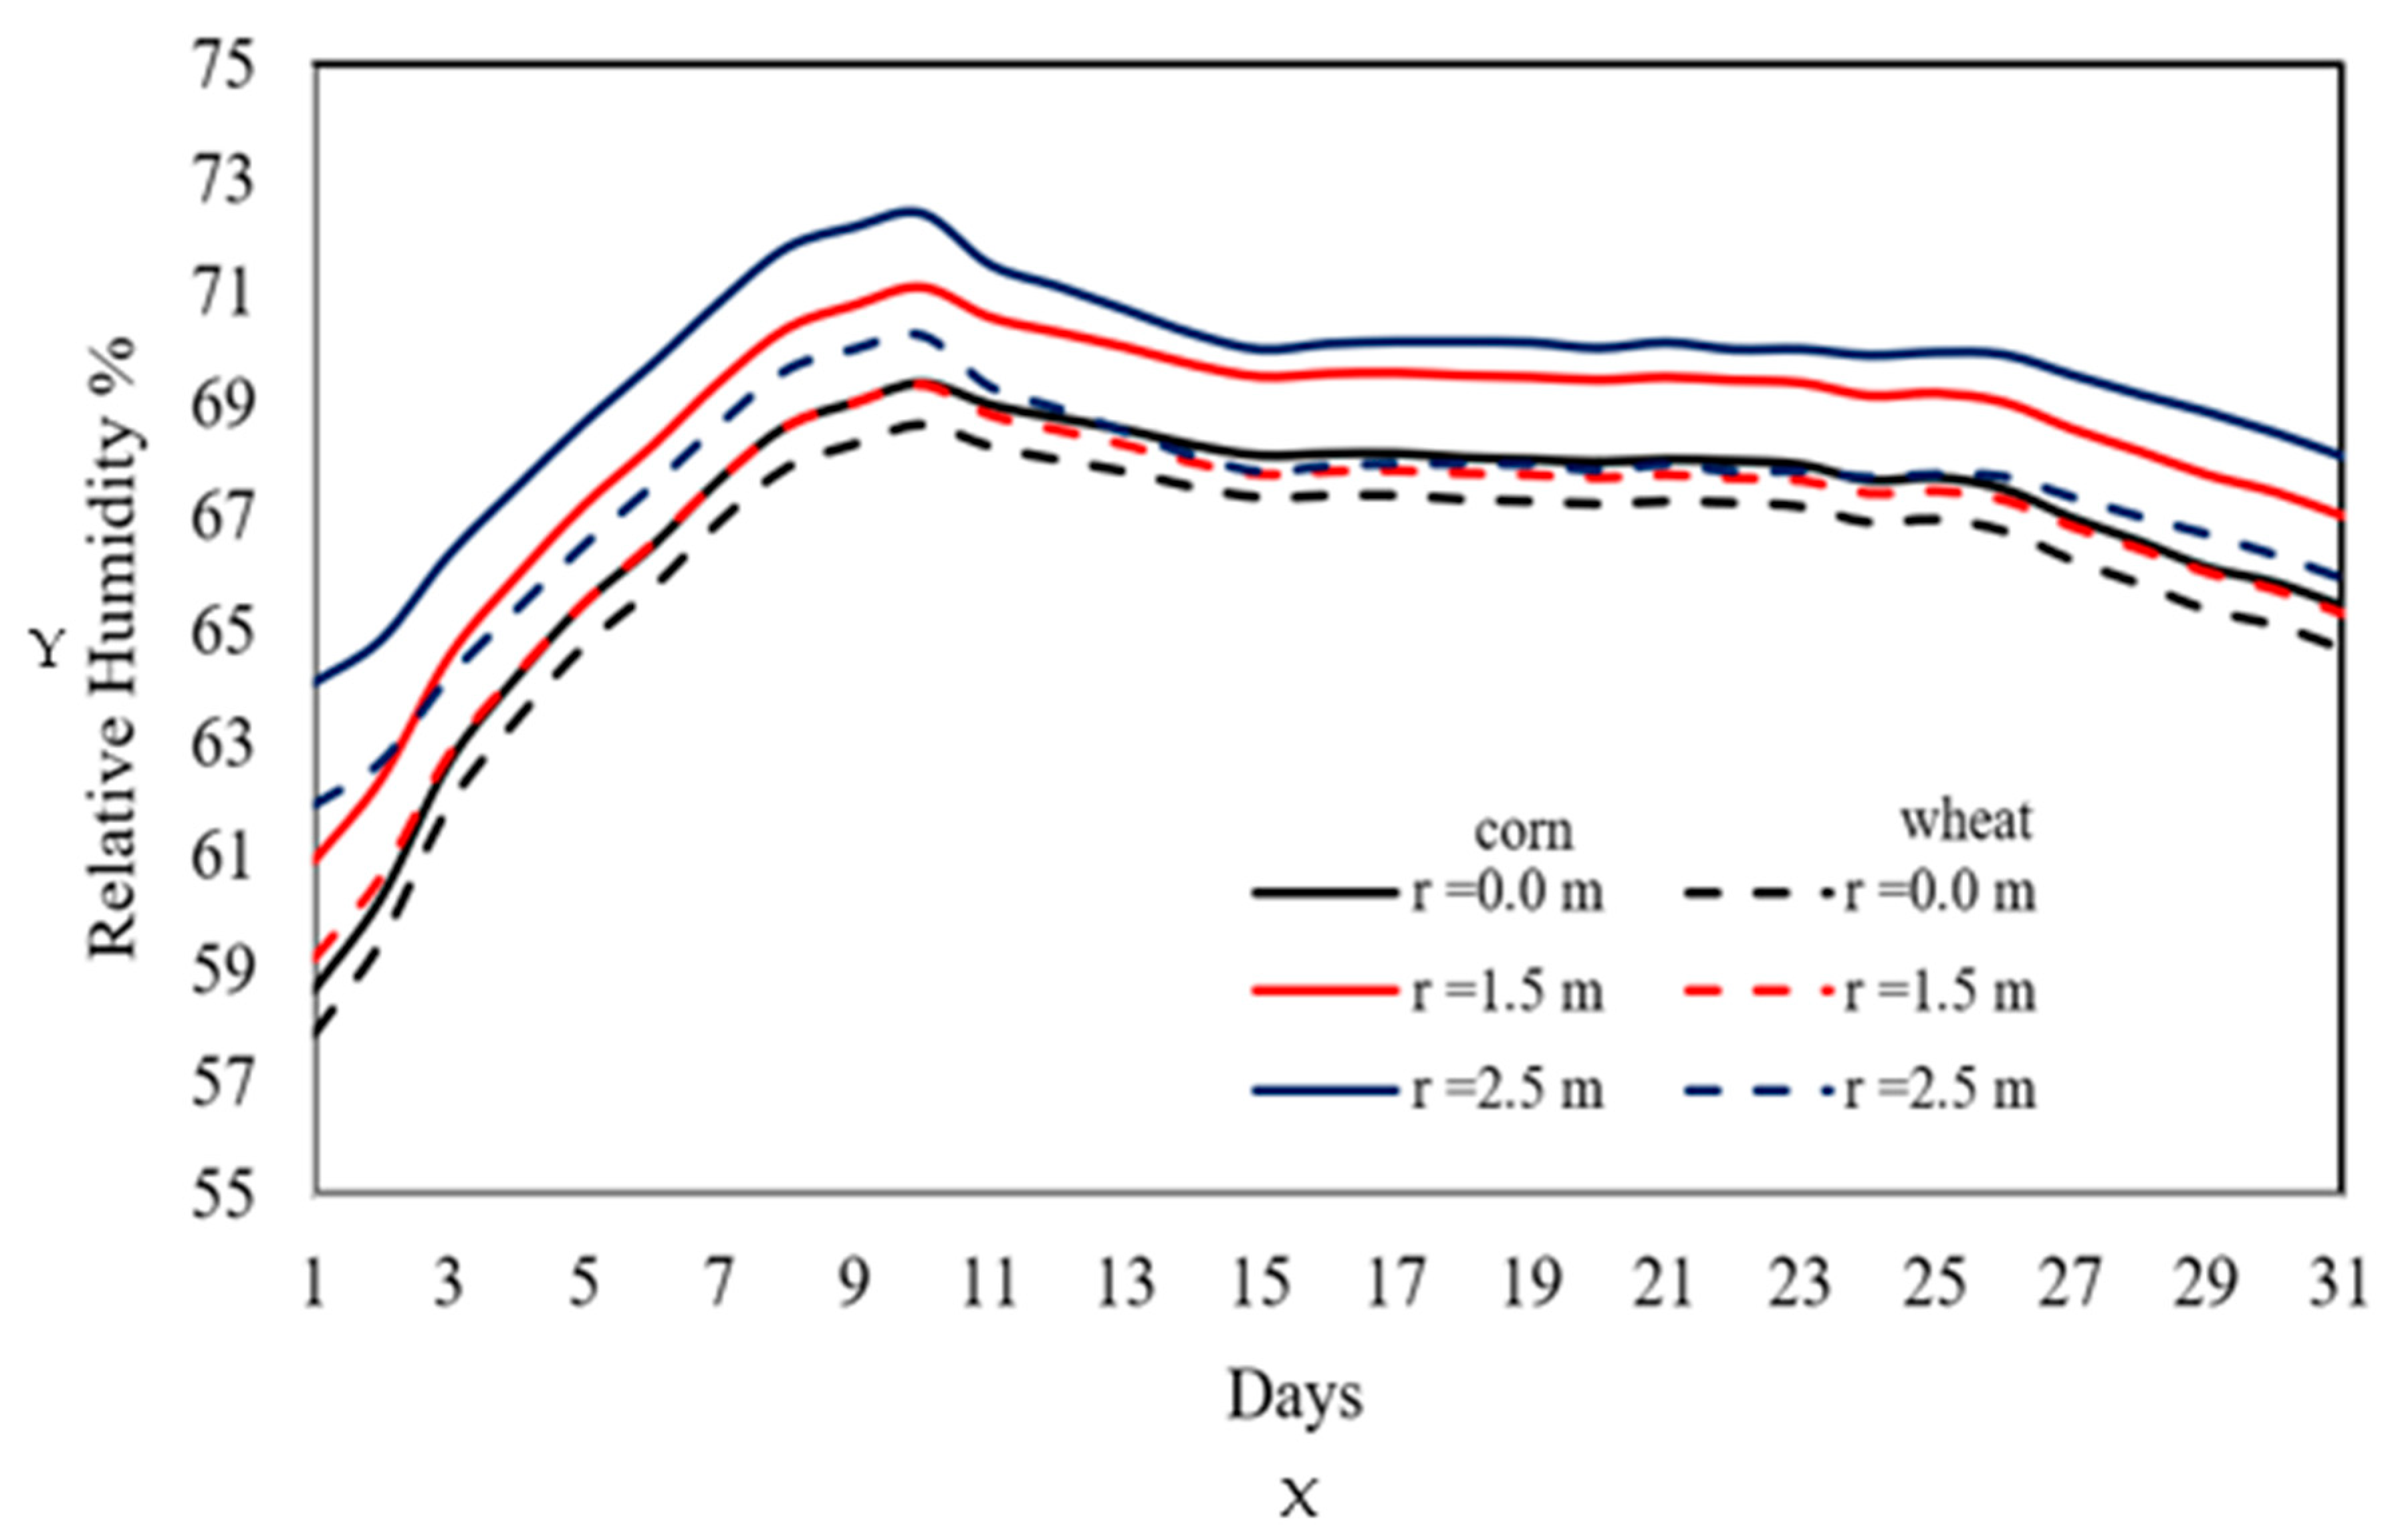
Figure 15 shows the distribution of interstitial air relative humidity (RH) at different radial positions inside the silo during the storage period of corn (solid lines) and wheat (dashed lines) in December. In the case of corn, it can be observed that RH in the center of the silo increases during the first 10 days, reaching a maximum value of 69%, followed by a gradual decrease that stabilizes around 66%. This distribution is associated with the high temperatures recorded in the silo core, as well as with the insulating effect of the grain, which helps maintain the moisture content within the optimal range for safe corn storage—typically between 65% and 68%. At 1.5 m from the center, RH values are slightly higher, reaching 70% in the first days and stabilizing at around 69%, which already represents a potential risk for the development of fungi and insects, especially when combined with temperatures above 25 °C. Finally, in the area closest to the silo walls (2.5 m), a significant increase in RH is observed, reflecting the effects of diurnal and nocturnal environmental variations that induce heating and cooling cycles. These cycles promote the condensation of interstitial moisture in this region, creating favorable conditions for biological deterioration [6,40,41,51].
In the case of wheat, a general trend like that of corn is observed, although with slightly lower values at all radial positions. This difference is attributed to two specific factors: first, the physical properties of wheat—particularly its higher specific heat capacity and lower thermal diffusivity—and second, the assumption of a constant respiration heat in this case, which makes water vapor production by metabolism less sensitive to temperature variations. Despite these differences, RH values in the zone near the silo walls also exceed 70%, especially during the initial days of storage. This indicates that external environmental conditions and solar radiation continue to play a key role in moisture distribution. These conditions equally promote condensation and fungal growth, reinforcing the need to carefully monitor these silo regions, even when the thermal properties of the grain appear to offer greater stability [2,22,42,47,48,50].
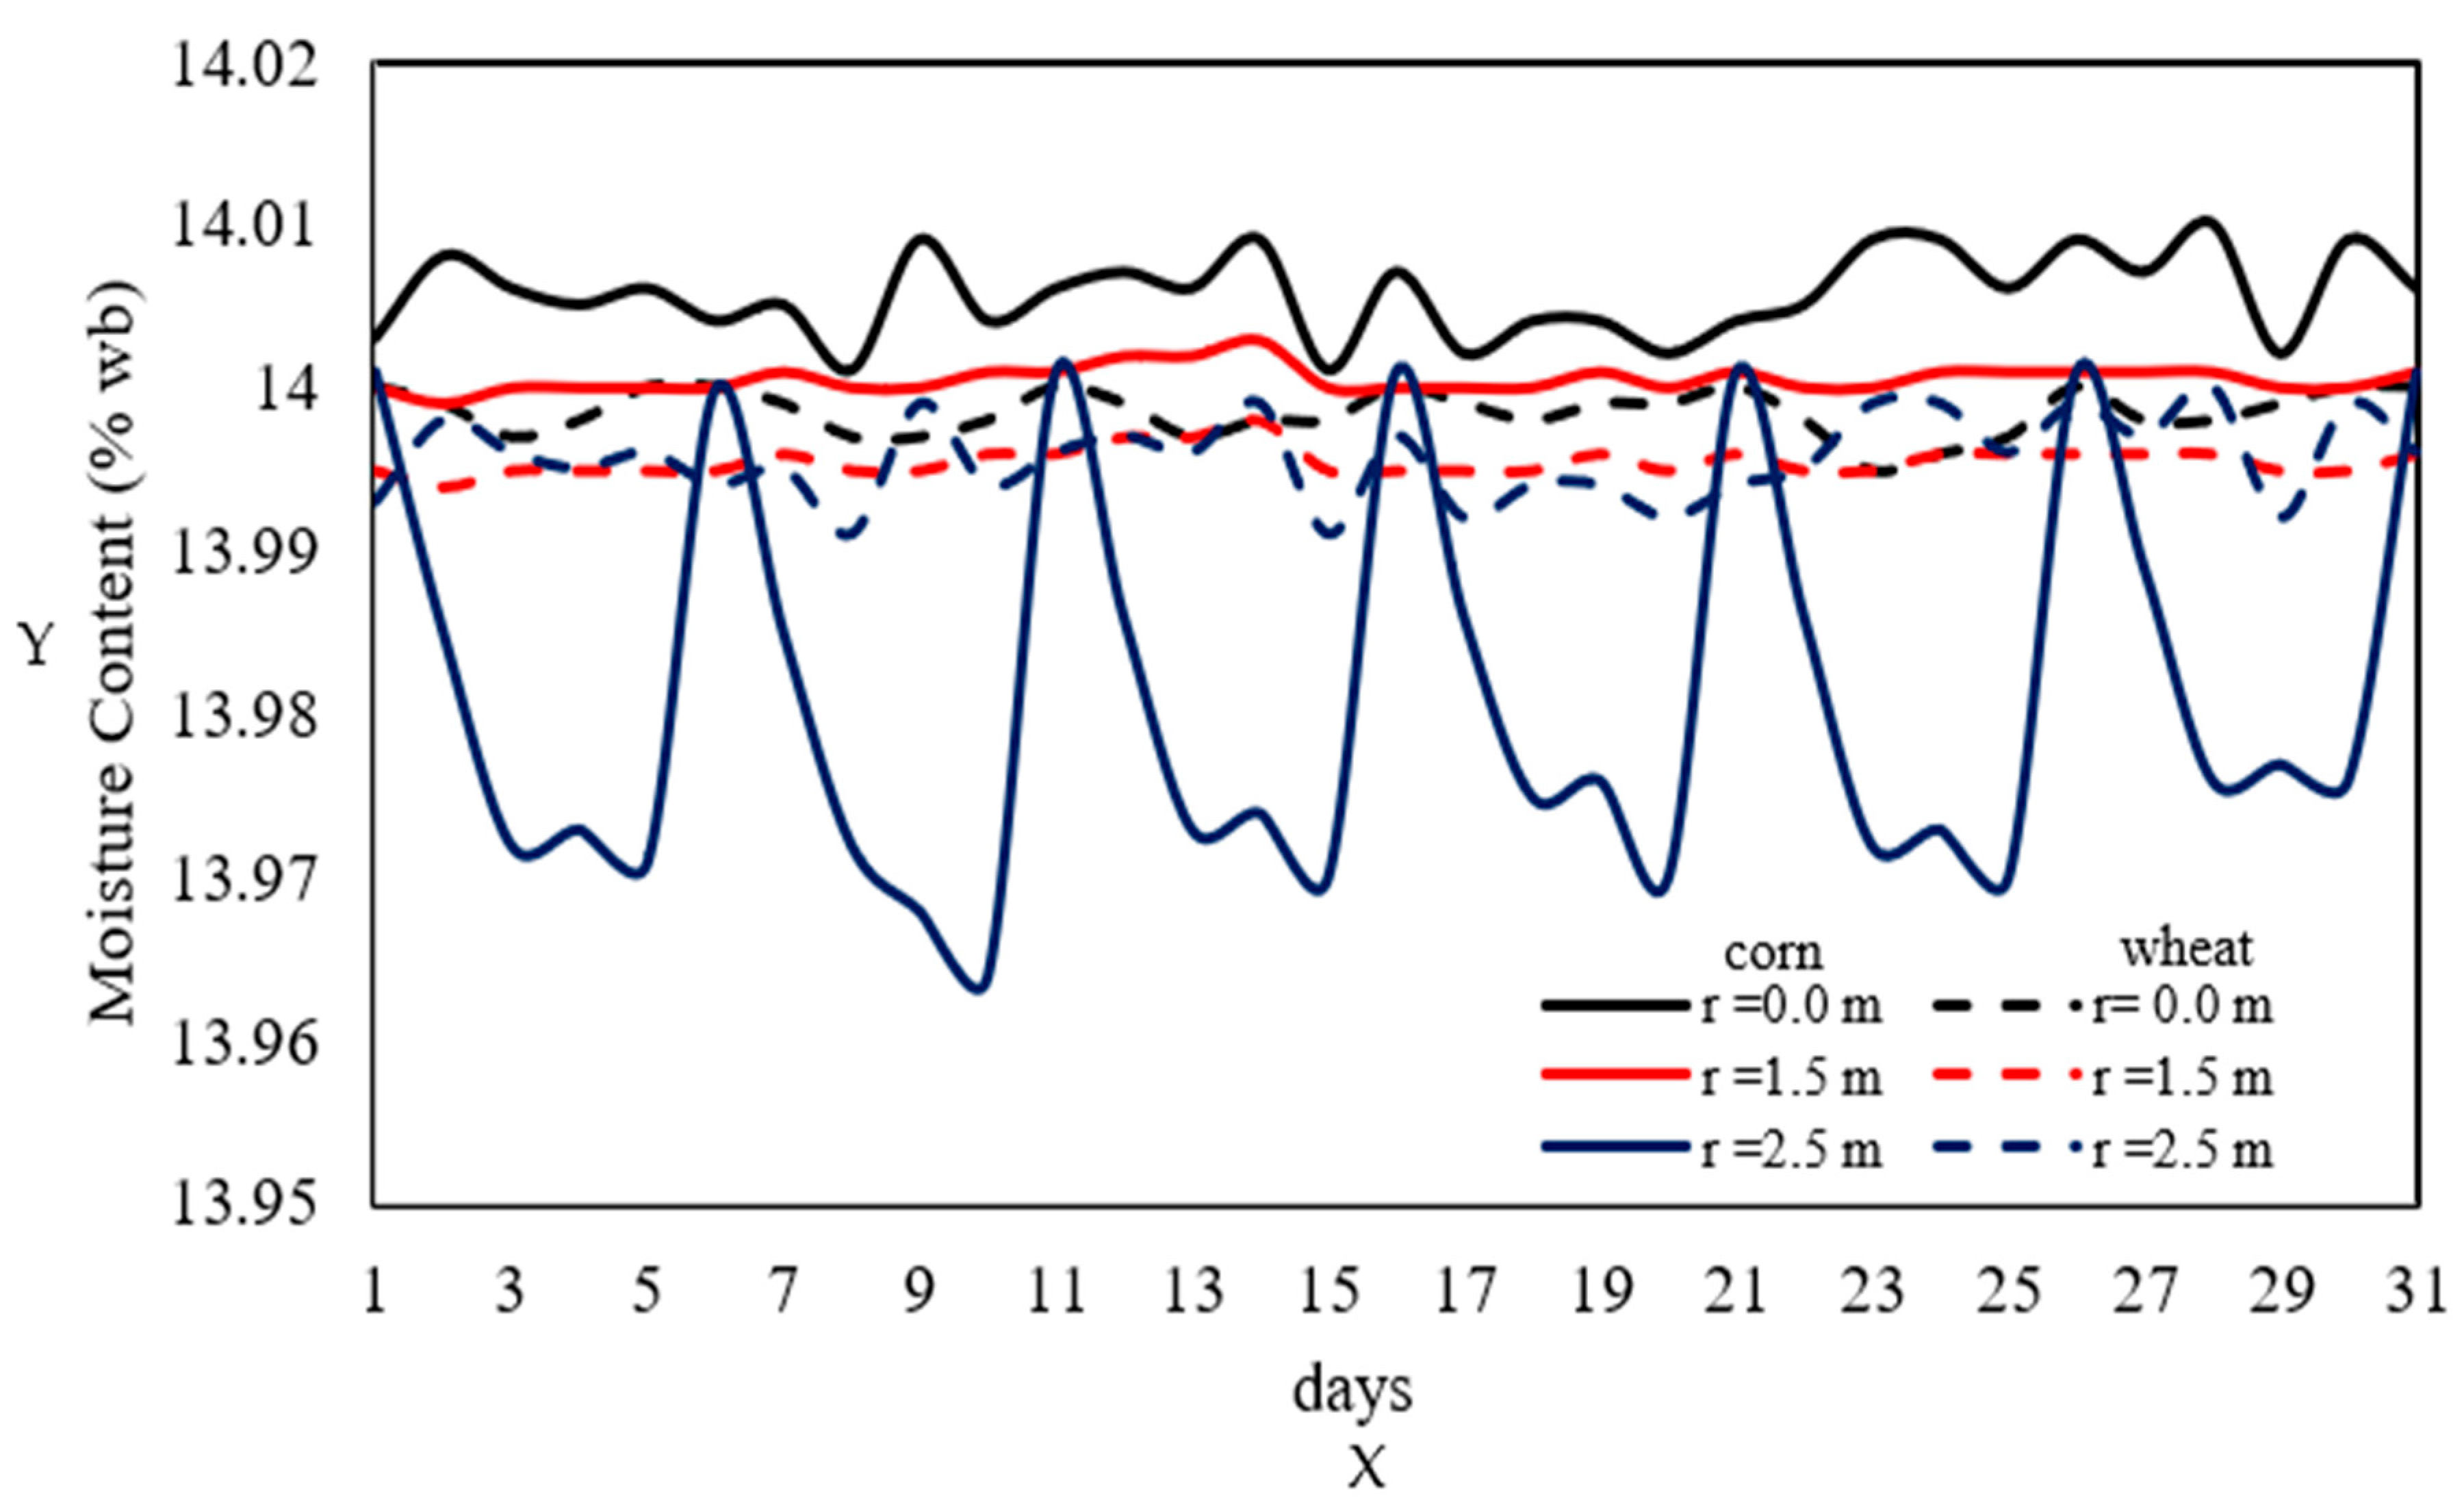
Figure 16 shows the variation in grain moisture content as a function of time and radial position inside the silo for corn (solid lines) and wheat (dashed lines) during December. For corn, the moisture content at the center of the silo exhibits slight variations throughout the storage period, not exceeding 14.01%. This behavior is consistent with the previously analyzed thermal and relative humidity patterns, confirming that the center remains relatively stable due to the insulating effect of the grain. At 1.5 m from the center, the moisture content shows a slight decrease, indicating a minor migration of moisture toward cooler regions. At 2.5 m from the center, near the silo walls, larger fluctuations are observed, attributed to the combined effects of solar radiation during the day and nighttime cooling, which generate condensation and evaporation cycles in the outer grain layers [6,22,44,45]. These variations intensify the interstitial relative humidity near the walls, as previously shown. In contrast, the behavior is much more stable, particularly at the center of the silo, where the moisture content remains virtually constant throughout the storage period. At 1.5 m from the center, a slight and insignificant decrease is observed, attributed to the low thermal diffusivity of wheat, which slows down heat and moisture transfer [6,42,43,44]. Finally, at approximately 2.5 m from the center, near the silo walls, the moisture content also exhibits fluctuations, albeit with a lesser amplitude than in corn, never dropping below 13.99%. This indicates low variability in wheat’s interstitial relative humidity in these regions. Overall, these results confirm that wheat exhibits more stable hygrothermal behavior than corn. However, both grains present specific risks depending on the silo region, with areas near the walls being the most vulnerable to condensation and microbiological spoilage [39,41,42,43,44,45].
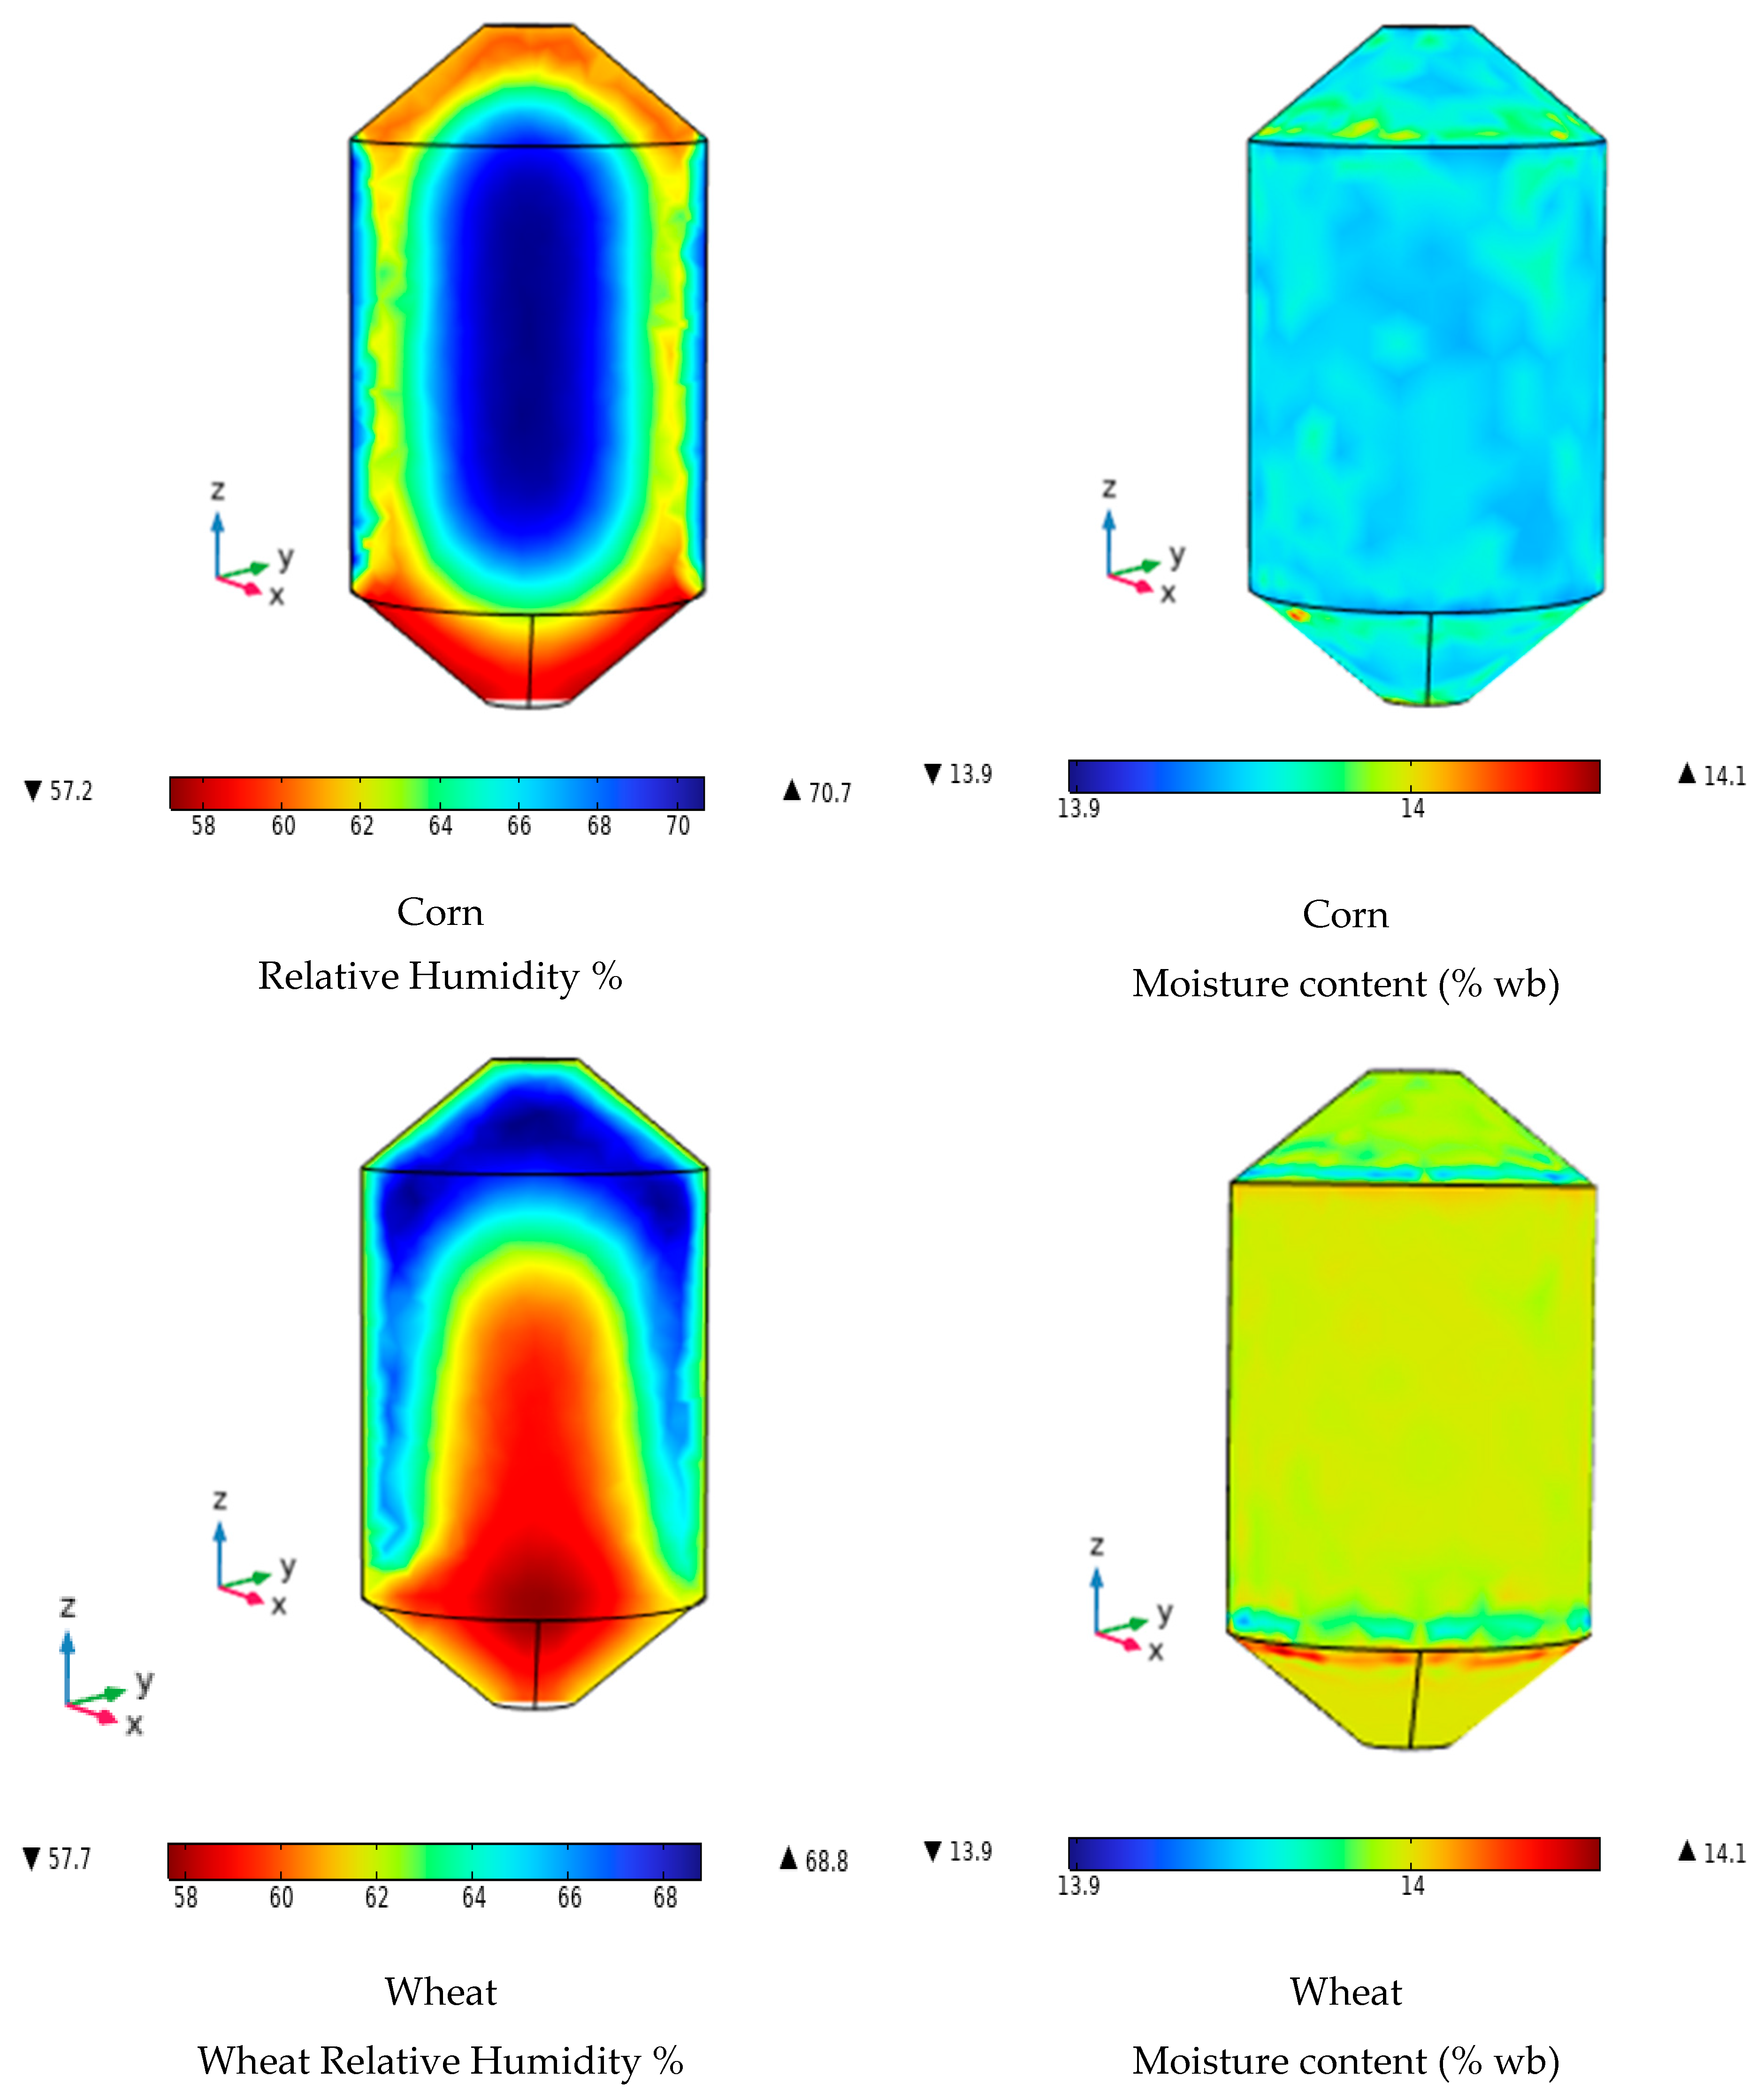
Finally, Figure 17 shows the contours of interstitial relative humidity and grain moisture content of corn and wheat at the end of the storage period. In the case of corn, a core forms in the interior of the silo where the relative humidity reaches approximately 70.5%, increasing the risk of insect and fungal growth. In contrast, the regions near the silo walls, especially the bottom, maintain values around 60%, which are considered safe for storage. Regarding the grain moisture content of corn, it remains nearly uniform, close to the initial value of approximately 14.1%; however, respiration heat—dependent on temperature—promotes water transfer to the interstitial air, contributing to an increase in relative humidity [15,16,40,42]. For wheat, the interstitial relative humidity reaches its highest values (around 68%) near the silo walls and at the top, posing a risk of biological deterioration. In contrast, in the lower zone, values close to 58% are observed, which are considered safe. Meanwhile, the grain moisture content of wheat stays constant and nearly unchanged at about 14%, due to its physical properties—specifically its higher specific heat capacity and lower thermal diffusivity—and the assumption of constant respiration heat, which limits moisture transfer from the grain to the interstitial air. Overall, these results show that corn is more vulnerable in the central core of the silo, while in wheat, risks are mainly in the walls and upper part, emphasizing the need for targeted control and monitoring strategies to ensure safe storage [14,32,36].

4. Conclusions

This study enabled a detailed and comparative analysis of the thermal and moisture gradients in corn and wheat during a representative postharvest storage period, using a three-dimensional model formulated under the Boussinesq approximation and solved through the finite element method (FEM). The silo geometry, which includes a conical roof and floor, was modeled with realistic boundary conditions that incorporate daily temperature fluctuations, direct and diffuse solar radiation, solar incidence angle, and the apparent motion of the Sun, aiming to accurately replicate the local climatic conditions of the Bajío region in Mexico. The numerical simulation results revealed differences in the internal distribution of temperature and interstitial air humidity for each type of grain, attributable to their specific thermal and metabolic properties. Corn, due to its higher thermal diffusivity, developed a more pronounced central hot core, with temperatures reaching up to 32 °C. In contrast, wheat grains exhibited heat accumulation in the upper region of the silo, with maximum temperatures of 29 °C, attributed to their lower thermal diffusivity and higher specific heat capacity. However, areas adjacent to the roof and silo walls reached similar temperatures in both cases (36 °C to 41 °C), as a direct result of solar radiation absorption by the metal sheet, regardless of the type of grain stored. For both grains, critical conservation zones were identified: in corn, the central core exceeded 32 °C, while in wheat, the upper part of the silo recorded temperatures of up to 29 °C—conditions conducive to insect development. Additionally, the interstitial air relative humidity surpassed 70% near the silo walls, promoting fungal proliferation. Although the grain moisture content remained relatively stable at the center (14.01% for corn and 13.99% for wheat), greater fluctuations were observed near the metallic walls, which were associated with thermal variations induced by solar radiation. Despite December being considered a cold month in the Bajío region, the results indicate that neither temperature nor relative humidity remains within the optimal storage ranges (≤17 °C and ≤65% RH), highlighting the need to implement corrective strategies. In this context, passive practices such as ‘de-coring’ or corrective grain transfer are proposed to disrupt critical zones of heat and moisture accumulation. This technique enables grain redistribution, reduces moisture content, and improves thermal dissipation, making it particularly useful in rural settings without access to active aeration systems. Furthermore, the importance of continuous thermal monitoring and the implementation of conservation strategies adapted to both the grain’s properties and external environmental conditions is emphasized, including the silo’s solar orientation and the intensity of incident radiation.

Author Contributions

Conceptualization, F.I.M.-H. and H. J-I.; methodology, L.I.Q.-V. and G.M.M.-G.; software, M.C.-R. and L.I.Q.-V.; validation, F.I.M.-H., L.I.Q.-V., and H.J.-I.; formal analysis, H.J.-I.; investigation, F.I.M.-H.; resources, G.M.M.-G.; writing—original draft preparation, F.I.M.-H.; writing—review and editing, H.J.-I., F.I.M.-H., and M.C.-R.; supervision, G.M.M.-G. and H.J.-I.; project administration, H.J.-I. All authors have read and agreed to the published version of the manuscript.

Funding

This research received no external funding.

Data Availability Statement

The data that support the findings of this study are available upon reasonable request from the authors.

Acknowledgments

The authors acknowledge SECIHTI’s financial support via the Postdoctoral Fellowships for the Training and Consolidation of Researchers in Mexico and TecNM for research funding. We also thank AgroArreguin for its support and facilities in obtaining experimental data.

Conflicts of Interest

The authors declare no conflicts of interest.

Nomenclature

List of Symbols
a absorptivity of galvanized steel
a v grain–air interface, m2·m−3
a w water activity, dimensionless
c concentration of grain moisture, kg/m3
c A concentration of water vapor, kg/m3
c p specific heat, J/kg· °C
D scalar diffusivity, m2/s
G solar radiation incident on the silo surface, W/m2
g acceleration of gravity, m/s2
h c heat transfer coefficient, W/m2· °C
M A molecular mass of water
M B molecular mass of air
M ¯ average molecular mass
k thermal conductivity of the porous media, W/m °C
k w thermal conductivity of the silo, W/m °C
k y mass transfer coefficient, m/s
L height of the cavity, m
n normal direction
P air pressure, mmHg
P 0 volumetric generation of water by respiration, kg/m3· s
P V 0 vapor pressure, mmHg
Q 0 volumetric heat of respiration of cereal grain, J/m3· s
R radius of the silo, m
t time, hours
T fluid temperature, °C
T 0 initial temperature of the grain, °C
T a m b ambient temperature, °C
T s k y sky temperature, °C
u ¯ average air velocity
X moisture of the grain on a dry basis, kg H2O/kg dry grain
x moisture of the grain on a wet basis, kg H2O/kg wet grain
x a m b ambient moisture content
X0initial moisture content, kg H2O/kg dry grain
Y absolute humidity of the air, kg H2O/kg dry air
Y0initial absolute moisture, kgH2O/kg dry air
Yiabsolute humidity of air in the grain–air interface, kg H2O/kg dry air
Greek Symbols
β volumetric coefficient of thermal expansion, K−1
β c volumetric coefficient of mass expansion, m3/kg
γcontinuous phase
εporosity
κ permeability, m2
boundary of the calculation domain
ξ sky emissivity
ξ c steel emissivity
λ v latent heat of vaporization of water, J/kg
μ fluid viscosity, kg/m·s
ρ a density of dry air, kg/m3
ρ β density of the continuous phase, kg/m3
σStefan–Boltzmann constant, W/m2 ·K4
ωdiscontinuous phase
Abbreviations
CFDComputational fluid dynamics
FEMFinite element method
PDEsPartial differential equations
RHRelative humidity (%)
wbWet basis (moisture content)

References

  1. Jiang, N.S.; Jofriet, N.J.C. Finite Element Prediction of Silage Temperatures in Tower Silos. Trans. ASAE 1987, 30, 1744–1750. [Google Scholar] [CrossRef]
  2. Khankari, N.K.K.; Morey, N.R.V.; Patankar, N.S.V. Mathematical Model for Moisture Diffusion in Stored Grain Due to Temperature Gradients. Trans. ASAE 1994, 37, 1591–1604. [Google Scholar] [CrossRef]
  3. Khankari, N.K.K.; Morey, N.R.V.; Patankar, N.S.V. Application of a Numerical Model for Prediction of Moisture Migration in Stored Grain. Trans. ASAE 1995, 38, 1789–1804. [Google Scholar] [CrossRef]
  4. Jia, C.; Sun, D.; Cao, C. Finite Element Prediction of Transient Temperature Distribution in a Grain Storage Bin. J. Agric. Eng. Res. 2000, 76, 323–330. [Google Scholar] [CrossRef]
  5. Balzi, U.; Gastón, A.; Abalone, R. Efecto de la Convección Natural en la Distribución de Temperatura y Migración de Humedad en Granos Almacenados en Silos; Mecánica Computacional Asociación Argentina: Santa Fe, Argentina, 2008; Volume XXVII, pp. 1471–1485. [Google Scholar]
  6. Montross, N.M.D.; Maier, N.D.E.; Haghighi, N.K. Validation of a Finite Element Stored Grain Ecosystem Model. Trans. ASAE 2002, 45, 1465. [Google Scholar] [CrossRef]
  7. Lawrence, N.J.; Maier, N.D.E. Aeration Strategy Simulations for Wheat Storage in the Sub-Tropical Region of North India. Trans. ASABE 2011, 54, 1395–1405. [Google Scholar] [CrossRef]
  8. Barreto, A.A.; Abalone, R.; Gastón, A. Mathematical Modelling of Momentum, Heat, and Mass Transfer in Grains Stored in Silos: Part II: Model Application. Lat. Am. Appl. Res. 2013, 43, 385–391. [Google Scholar]
  9. Barreto, A.A.; Abalone, R.; Gastón, A. Mathematical Modelling of Momentum, Heat, and Mass Transfer in Grains Stored in Silos: Part I: Model Application. Lat. Am. Appl. Res. 2013, 43, 377–384. [Google Scholar]
  10. Panigrahi, S.S.; Singh, C.B.; Fielke, J.; Zare, D. Modeling of Heat and Mass Transfer within the Grain Storage Eco-System Using Numerical Methods: A Review. Dry. Technol. 2019, 38, 1677–1697. [Google Scholar] [CrossRef]
  11. Panigrahi, S.S.; Singh, C.B.; Fielke, J. CFD Modelling of Physical Velocity and Anisotropic Resistance Components in a Peaked Stored Grain with Aeration Ducting Systems. Comput. Electron. Agric. 2020, 179, 105820. [Google Scholar] [CrossRef]
  12. Rosentrater, K.A. Storage of Cereal Grains and Their Products, 5th ed.; Woodhead Publishing: London, UK, 2022. [Google Scholar] [CrossRef]
  13. Pagidi, M.; Pandey, L.M.; Dixit, U.S. Post-harvest grain storage: Methods, factors, and eco-friendly solutions. Food Control 2025, 174, 111236. [Google Scholar] [CrossRef]
  14. Andrade, N.E.T.; Couto, N.S.M.; Queiroz, N.D.M.; Faroni, N.L.R.A.; De Sousa Damasceno, N.G. Three-Dimensional Simulation of the Temperature Variation in Corn Stored in Metallic Bin. In Proceedings of the 2002 ASAE Annual Meeting, Chicago, IL, USA, 28–31 July 2002. [Google Scholar] [CrossRef]
  15. Gastón, A.; Abalone, R.; Cassinera, A.; Lara, M.A. Predicción de la Distribución de Temperatura de Granos Almacenados en Silos. Av. Energías Renov. Medio Ambiente (AVERMA) 2005, 9, 13–18. [Google Scholar]
  16. Abalone, R.; Gastón, A.; Cassinera, R.; Lara, M. Modelización de la Distribución de la Temperatura y Humedad en Granos Almacenados en Silos; Mecánica Computacional Asociación Argentina: Santa Fe, Argentina, 2006; Volume XXV, pp. 233–247. [Google Scholar]
  17. Quemada-Villagómez, L.I.; Molina-Herrera, F.I.; Carrera-Rodríguez, M.; Calderón-Ramírez, M.; Martínez-González, G.M.; Navarrete-Bolaños, J.L.; Jiménez-Islas, H. Numerical Study to Predict Temperature and Moisture Profiles in Unventilated Grain Silos at Prolonged Time Periods. Int. J. Thermophys. 2020, 41, 52. [Google Scholar] [CrossRef]
  18. Markowski, M.; Bialobrzewski, I.; Bowszys, J.; Suchecki, S. Simulation of Temperature Distribution in Stored Wheat Without Aeration. Dry. Technol. 2007, 25, 1527–1536. [Google Scholar] [CrossRef]
  19. Carrera-Rodríguez, M.; Martínez-González, G.M.; Navarrete-Bolaños, J.L.; Botello-Álvarez, J.E.; Rico-Martínez, R.; Jiménez-Islas, H. Transient Numerical Study of the Effect of Ambient Temperature on 2-D Cereal Grain Storage in Cylindrical Silos. J. Stored Prod. Res. 2011, 47, 106–122. [Google Scholar] [CrossRef]
  20. Lawrence, N.J.; Maier, N.D.E.; Stroshine, N.R.L. Three-Dimensional Transient Heat, Mass, Momentum, and Species Transfer in the Stored Grain Ecosystem: Part I. Model Development and Evaluation. Trans. ASABE 2013, 56, 179–188. [Google Scholar] [CrossRef]
  21. Lawrence, N.J.; Maier, N.D.E.; Stroshine, N.R.L. Three-Dimensional Transient Heat, Mass, Momentum, and Species Transfer in the Stored Grain Ecosystem: Part II. Model Validation. Trans. ASABE 2013, 56, 189–201. [Google Scholar] [CrossRef]
  22. Novoa-Muñoz, F. Simulation of the Temperature of Barley During its Storage in Cylindrical Silos. Math. Comput. Simul. 2018, 157, 1–14. [Google Scholar] [CrossRef]
  23. Alagusundaram, N.K.; Jayas, N.D.S.; White, N.N.D.G.; Muir, N.W.E. Three-Dimensional, Finite Element, Heat Transfer Model of Temperature Distribution in Grain Storage Bins. Trans. ASAE 1990, 33, 577–584. [Google Scholar] [CrossRef]
  24. Thorpe, G. Modelling Ecosystems in Ventilated Conical Bottomed Farm Grain Silos. Ecol. Model. 1997, 94, 255–286. [Google Scholar] [CrossRef]
  25. Jiménez-Islas, H.; Navarrete-Bolaños, J.L.; Botello-Álvarez, E. Numerical Study of the Natural Convection of Heat and 2-D Mass of Grain Stored in Cylindrical Silos. Agrociencia 2004, 38, 325–342. [Google Scholar]
  26. Jian, F.; Jayas, D.S.; White, N.D. Temperature Fluctuations and Moisture Migration in Wheat Stored for 15 Months in a Metal Silo in Canada. J. Stored Prod. Res. 2009, 45, 82–90. [Google Scholar] [CrossRef]
  27. Wang, D.; Liu, K.; Zhang, X. Modeling of a Three-Dimensional Dynamic Thermal Field Under Grid-Based Sensor Networks in Grain Storage. IISE Trans. 2018, 51, 531–546. [Google Scholar] [CrossRef]
  28. Valle, F.J.M.; Gastón, A.; Abalone, R.M.; De la Torre, D.A.; Castellari, C.C.; Bartosik, R.E. Study and Modelling the Respiration of Corn Seeds (Zea mays L.) During Hermetic Storage. Biosyst. Eng. 2021, 208, 45–57. [Google Scholar] [CrossRef]
  29. Rafiee, S.; Keyhani, A.; Jafari, A. Modeling Effective Moisture Diffusivity of Wheat (Tajan) During Air Drying. Int. J. Food Prop. 2008, 11, 223–232. [Google Scholar] [CrossRef]
  30. Quemada-Villagómez, L.; Miranda-López, R.; Calderón-Ramírez, M.; Navarrete-Bolaños, J.; Martínez-González, G.; Jiménez-Islas, H. A Simple and Accurate Mathematical Model for Estimating Maximum and Minimum Daily Environmental Temperatures in a Year. Build. Environ. 2021, 197, 107822. [Google Scholar] [CrossRef]
  31. Jofriet, J.C.; Jiang, S.; Tang, S.W. Finite Element Prediction of Temperature Gradients in Walls of Cylindrical Concrete Storage Structures. Can. J. Civ. Eng. 1991, 18, 12–19. [Google Scholar] [CrossRef]
  32. Duffie, J.A.; Beckman, W.A. Solar Engineering of Thermal Processes; John Wiley & Sons: Hoboken, NJ, USA, 2013. [Google Scholar] [CrossRef]
  33. Lawrence, J.; Maier, D.E.; Hardin, J.; Jones, C.L. Development and Validation of a Headspace Model for a Stored Grain Silo Filled to Its Eave. J. Stored Prod. Res. 2012, 49, 176–183. [Google Scholar] [CrossRef]
  34. Yisa, M.G.; Fadeyibi, A.; Adisa, O.; Alabi, K.P. Finite Element Simulation of Temperature Variation in Grain Metal Silo. Res. Agric. Eng. 2018, 64, 107–114. [Google Scholar] [CrossRef]
  35. Dick, E. Introduction to Finite Volume Methods in Computational Fluid Dynamics; Springer: Berlin/Heidelberg, Germany, 2008; pp. 275–301. [Google Scholar] [CrossRef]
  36. Moukalled, F.; Mangani, L.; Darwish, M. The Finite Volume Method in Computational Fluid Dynamics; Fluid Mechanics and Its Applications; Springer: Cham, Switzerland, 2015. [Google Scholar] [CrossRef]
  37. Kay, N.R.L.; Bern, N.C.J.; Hurburgh, N.C.R., Jr. Horizontal and Vertical Airflow Resistance of Shelled Corn at Various Bulk Densities. Trans. ASAE 1989, 32, 733–736. [Google Scholar] [CrossRef]
  38. Delele, M.A.; Mihret, Y.C.; Mellmann, J. Performance Evaluation and Improvement of Prototype Rice Husk Fueled Mixed Flow Rough Rice Dryer Using CFD Model. Dry. Technol. 2023, 41, 2447–2463. [Google Scholar] [CrossRef]
  39. Zhang, L.; Chen, X.; Liu, H.; Peng, W.; Zhang, Z.; Ren, G. Experiment and Simulation Research of Storage for Small Grain Steel Silo. Int. J. Agric. Biol. Eng. 2016, 9, 170–178. [Google Scholar] [CrossRef]
  40. Zheng, D.; Li, L.; Chen, G.; Zhou, Y.; Liu, K. Numerical Study of Low-Temperature Ventilation Drying in a Wheat Grain Silo Considering Non-Uniform Porosity Distribution. Appl. Sci. 2023, 14, 96. [Google Scholar] [CrossRef]
  41. Frisvad, J.C. Mycotoxins in Grain, Compounds Other than Aflatoxin. Trends Food Sci. Technol. 1994, 5, 235–236. [Google Scholar] [CrossRef]
  42. Trombete, F.M.; De Ávila Moraes, D.; Porto, Y.D.; Santos, T.B.; Direito, G.M.; Fraga, M.E.; Saldanha, T. Determination of Aflatoxins in Wheat and Wheat By-Products Intended for Human Consumption, Marketed in Rio de Janeiro, Brazil. J. Food Nutr. Res. 2014, 2, 671–674. [Google Scholar] [CrossRef]
  43. Li, X.; Yang, K.; Wang, Y.; Du, X. Simulation of Fluid Flow and Heat-Moisture Transfer Mechanism in Packed Bed Based on Double-Diffusion Model. Chem. Eng. Commun. 2023, 211, 647–663. [Google Scholar] [CrossRef]
  44. Wu, Y.; Wu, W.; Chen, K.; Zhang, J.; Liu, Z.; Zhang, Y. Progress and Prospective in the Development of Stored Grain Ecosystems in China: From Composition, Structure, and Smart Construction to Wisdom Methodology. Agriculture 2023, 13, 1724. [Google Scholar] [CrossRef]
  45. Epstein, A.; Lubitz, W.; Dineen, G.; Dyck, J. Performance Evaluation of a Non-Equilibrium Model for Low Temperature Grain Drying and Simulation of Seasonal Dryer Operation. Dry. Technol. 2020, 40, 835–851. [Google Scholar] [CrossRef]
  46. Babangida, L.Y.; Yong, H. Design, Development and Techniques for Controlling Grains Post-Harvest Losses with Metal Silo for Small and Medium Scale Farmers. Afr. J. Biotechnol. 2011, 10, 14552–14561. [Google Scholar] [CrossRef]
  47. Bharathi, V.; Jian, F.; Jayas, D. Effects of Weather on Temperatures of the Grain Bin Components and Headspace of a 10-m Diameter Corrugated Steel Bin. Can. Biosyst. Eng. 2022, 64, 3.1–3.11. [Google Scholar] [CrossRef]
  48. Jian, F.; Jayas, D.S.; White, N.D.G.; Alagusundaram, K. A Three-Dimensional, Asymmetric, and Transient Model to Predict Grain Temperatures in Grain Storage Bins. Trans. ASAE 2005, 48, 263–271. [Google Scholar] [CrossRef]
  49. Close, D.; Peck, M. Experimental Determination of the Behaviour of Wet Porous Beds in Which Natural Convection Occurs. Int. J. Heat Mass Transf. 1986, 29, 1531–1541. [Google Scholar] [CrossRef]
  50. Jian, F.; Jayas, D.S.; Fields, P.G.; White, N.D.G.; Zhang, H.; Tang, P. Demography of Rusty Grain Beetle in Stored Bulk Wheat: Part I, Population Dynamics at Different Temperatures and Grain Bulk Sizes. Environ. Entomol. 2018, 47, 244–255. [Google Scholar] [CrossRef]
  51. Khatchatourian, O.; De Oliveira, F. Mathematical Modelling of Airflow and Thermal State in Large Aerated Grain Storage. Biosyst. Eng. 2006, 95, 159–169. [Google Scholar] [CrossRef]
Figure 1. The physical structure of the silo and the computational domain used.
Eng 06 00224 g001
Figure 2. Comparison of ambient temperatures recorded in the state of Guanajuato/Bajío region versus those predicted by the model proposed by Quemada-Villagómez et al. [30].
Eng 06 00224 g002
Figure 3. Thermal evolution of the roof surface of the storage structure versus ambient temperature over 72 h under boundary conditions (Equation (18)).
Eng 06 00224 g003
Figure 4. Silo filled with corn during the harvest season and a TP359 thermometer used to record temperature during December.
Eng 06 00224 g004
Figure 5. Temperature profiles predicted by the model proposed in this study versus those measured experimentally.
Eng 06 00224 g005
Figure 6. Effect of mesh size on the prediction of temperature at the grain/wall interface compared to experimental measurements.
Eng 06 00224 g006
Figure 7. Comparison of radial temperature profiles of corn and wheat during one day of storage on the centered z-plane of the silo.
Eng 06 00224 g007
Figure 8. Comparison of axial temperature profiles of corn and wheat during one day of storage on the axial axis of the silo.
Eng 06 00224 g008
Figure 9. Comparison of radial temperature profiles of corn and wheat during one month of storage at the center of the silo.
Eng 06 00224 g009
Figure 10. Comparison of the radial temperature profiles of corn and wheat during one month of storage in the central region of the silo.
Eng 06 00224 g010
Figure 11. Temperature contours (°C) for corn grain during one day of storage.
Eng 06 00224 g011aEng 06 00224 g011b
Figure 12. Temperature contours (°C) for wheat grain during one day of storage.
Eng 06 00224 g012
Figure 13. Comparison of the temperature (in °C) effect on natural convection (in m/s) during corn and wheat storage at the time of maximum solar radiation.
Eng 06 00224 g013
Figure 14. Comparison of temperature contours for corn and wheat at the end of the storage period in °C.
Eng 06 00224 g014
Figure 15. Comparison of radial relative humidity profiles for corn and wheat during one month of storage at the center of the silo.
Eng 06 00224 g015
Figure 16. Comparison of the moisture content distribution in corn and wheat at different radial positions during one month of storage in the center of the silo.
Eng 06 00224 g016
Figure 17. Contours of interstitial relative humidity and grain moisture content of corn and wheat at the end of the storage period.
Eng 06 00224 g017
Table 1. Physical properties used in the model for corn and wheat.
Physical PropertyEquationValidity Ranges
Boussinesq approximation a ρ γ = ρ 0 1 β T T 0 β c C γ C 0
β c = R T M A M B M ¯
Corn respiration heat a, b Q 0 = 1.24793 × 10 4 A / 1 + e x p B t / 86400 A / 2
A = 8.92 × 10 6 e x p 13.4983161 + 0.21853298 T a m b 0.0039572 T a m b 2 e x p 72.06 x / x + 1 + 20.96 t a n h 62.44 x / x + 1
B = 4.76 × 10 7 e x p 0.80207394 + 0.00898836 T a m b 0.0049439 T a m b 2 e x p 53.9681888 x / x + 1 + 7.737674909 t a n h 62.44 x / x + 1 Q 0 = 0.001 × ρ ω W / m 3
4.4 < T < 37.8   ° C
0.12 < x < 0.21
Wheat respiration heat a Q 0 = 0.001 × ρ ω W / m 3
Corn water generation a, b P 0 = 2.74181 × 10 8 Q 0
Wheat water generation a P 0 = 2.74181 × 10 8 Q 0 / ρ ω
Corn sorption isotherm b a w = 1 e x p 0.0031 T a m b + 21.57609100 x + 6.034 1.6 1.3   ° C   < T < 48.9   ° C  
0.2 < a w < 0.8
Wheat sorption isotherm b a w = 1 e x p 1.22 × 10 5 T a m b + 64.346 100 × c γ 2.55
Water vapor pressure a P V 0 = e x p 18.304 3816.44 T 277.02 10   ° C < T < 150   ° C
Equilibrium moisture at the interface a Y i = 18 P V 0 a w 29 P P V 0 a w
a Jiménez-Islas et al. [25]. b Valle et al. [28].
Table 2. Thermodynamic properties of corn and wheat used for the simulations.
Corn Parameters #ParametersValor
ToReference temperature 20 °C
X0 Initial moisture content of corn14%
ρ ω c Density754 kg/m3
cp-ωSpecific heat1780 J/kg K
kωThermal conductivity0.18 W/m K
keffEffective thermal conductivity0.089 W/m K
αwThermal diffusivity1.33 × 10−7 m2/s
D w A Water diffusivity in air2.43 × 10−5 m2/s
D A w Water diffusivity in corn2.8 × 10−11 m2/s
dpParticle diameter0.005 m
κ Permeability3.5 × 10−9 m2
εPorosity0.38
avInterfacial area744 m2/m3
Wheat Parameters *
ToReference temperature 20 °C
X0 Initial moisture content of wheat14%
ρ ω Density754 kg/m3
cp-ωSpecific heat 1900 J/kg K
kωThermal conductivity 0.13 W/m K
keffEffective thermal conductivity0.086 W/m K
αwThermal diffusivity9.07 × 10−8 m2/s
D w A Water diffusivity in air 2.43 × 10⁻⁵ m2/s
D A w Water diffusivity in wheat 6.48 × 10⁻¹¹ m2/s
dpParticle diameter 0.00364 m
κPermeability 5.96 × 10⁻⁹ m2
εPorosity 0.41
avInterfacial area972 m2/m3
# Khankari et al. [3]. * Rafiee et al. [29].
Table 3. Physical and thermodynamic properties of air used in the simulations.
Air parameters ##ParametersValue
ToReference temperature 25 °C
HR0Relative humidity 50%
ρ Density 1.2 kg/m3
cSpecific heat 972.92 kJ/kg K
kγThermal conductivity 0.023697 W/m K
μ Viscosity 1.78 × 10⁻⁵ Pa-s
h w Heat transfer coefficient 15 W/m2 K
k y Mass transfer coefficient1.00 × 10−4 m-s−1
## Khankari et al. [3].
Table 4. Parameters obtained for temperatures in the Bajío region, Guanajuato (20.52° N, 100.85° W).
MaximumValuesMinimumValues
a M a x 76.2969 a M i n 73.1563
b M a x 189.1155 b M i n 201.1467
c M a x 472.2426 c M i n 395.7085
d M a x 223.6434 d M i n 213.6370
t 1 Day (1–365) t 2 Hour (0–23)
p6 Hour of minimal ambient temperature
Quemada-Villagómez et al. [30].
Table 5. Properties considered in the boundary condition formulation for solar radiation.
ParameterSymbolValueUnitSource/Comment
Month of the year-December--
Standard timeGTM6hLocal time zone (UTC-6)
Solar constantGsc1.367kW/m2Standard value ASTM E490-22
Time of minimum temperaturep6hIn situ measurements
Latitudeϕ20.5°Coordinates UTM: 20°30′0″ N
Longitudeλ100.8°Coordinates UTM: 100°48′0″ O
Angle of incidenceα45°Solar geometry for 12:00 LST
Surface absorptancea0.4-Material property (galvanized steel)
Heat transfer coefficienth15W/m2KCalculation by natural convection
Ambient temperatureTambVariable°CClimatic model
Stefan–Boltzmann constantσ5.6703 × 10⁻⁸W/m2K4Physical constant
Emissivityϵ0.4-Material property (galvanized steel)
Table 6. Effect of mesh size on the prediction of maximum and minimum temperatures at the grain/roof interface of the silo for corn and wheat, and computation times for both cases.
CornWheatCornWheat
Mesh SizeNEBTmax
°C
Tmin
°C
Tmax
°C
Tmin
°C
Computation Time (min)Computation Time (min)
Fine157834.8713.4233.4514.4254.6945.25
Finer321437.688.8236.8811.8383.1463.85
Extra fine767037.758.9636.9311.87173.22145.65
Disclaimer/Publisher’s Note: The statements, opinions and data contained in all publications are solely those of the individual author(s) and contributor(s) and not of MDPI and/or the editor(s). MDPI and/or the editor(s) disclaim responsibility for any injury to people or property resulting from any ideas, methods, instructions or products referred to in the content.