Article

A Novel Condition Monitoring Technique for Mining Ground Engagement Tools via Modal Analysis

1
School of Engineering, Deakin University, Geelong, VIC 3216, Australia
2
College for Clean Growth and Future Mobility, Centre for Manufacturing and Materials, Coventry University, Coventry CV1 5FB, UK
3
Offshore Renewable Energy Catapult, Offshore House, Albert St., Blyth NE24 1LZ, UK
*
Author to whom correspondence should be addressed.
Eng 2025, 6(9), 220; https://doi.org/10.3390/eng6090220
Submission received: 2 July 2025 / Revised: 11 August 2025 / Accepted: 22 August 2025 / Published: 2 September 2025

Abstract

Ground engaging tools (GETs) are critical consumable components on mining excavators, and their timely replacement is essential to prevent risks and excessive downtime. This paper presents a monitoring method utilising the modal properties—natural frequencies and mode shapes. The method is applied in a test case to show how the GETs on an excavator bucket could be monitored. Modal analysis and dynamic analysis are conducted with ANSYS to verify the effectiveness of the proposed method. The finite element analysis models are validated by experimental vibration experiments. The results demonstrate a strong correlation between changes in natural frequencies and the conditions of the teeth on the excavator bucket, when comparing the intact to the worn-out condition. In conclusion, the presented method offers a promising approach for real-time monitoring of the GETs on mining excavators and similar equipment. It will contribute to efficient maintenance interventions and enhancing operational efficiency and safety.

1. Introduction

Tool wear and tool breakage are critical problems in the mining industry that cause unwanted wasted energy, consumables, and cost. There is a very large amount of energy consumed by wear in mining operations. Around 2 EJ of energy is used to replace worn out parts and remanufacturing due to wear in 2017, equalling 17.4% of global annual energy consumption in mining [1]. Wear issues can also influence the production efficiency and the product quality and cost more energy.
Ground engaging tools (GETs) are designed as consumable components that first contact the ore or earth, protecting the major structures by wearing the GETs first. Examples of GETs on the excavators include digger teeth, dozer blades, etc. [2,3]. GETs can break and fall off from the machine due to wear, fracture, fatigue, or connections working loose. Since the GETs are typically made from hard materials for working in harsh environments, this can cause catastrophic issues further down the mineral processing line if the failed GET parts are mixed into the ores and transferred into the crushers [4,5,6]. Hence, the condition of GETs needs to be monitored frequently, and they should be replaced when they reach the end of their service life. Early replacement increases GET costs and causes additional downtime [7].
The commonly used techniques to monitor the wear conditions of GETs include using the following: embedded electric circuits (EEC) to measure the change in the electrical resistance or impedance [8,9,10,11]; closed circuit television (CCTV) to take the images above the machines [12,13,14]; and radio frequency identification (RFID) to locate the components of interest [15,16,17]. However, the EEC method is vulnerable to metal particles that may short the circuit, impacting its accuracy and repeatability. CCTV is limited to working environments where a clear line-of-sight to the GETs can be maintained and requires frequent cleaning and calibration [6]. Finally, RFID tags only warn in the extreme cases where the parts with RFID tags fall off, and they cannot continuously measure the wear rate.
In addition to these currently widely used methods for monitoring GETs, some non-destructive damage detection techniques from the field of structural health monitoring (SHM) are also applicable. These techniques can de classified into static, dynamic, and combined measurement categories [18]. Among them, dynamic measurement methods, such as vibration-based damage identification, have been employed to continuously detect cracks or damage inside structures [19,20,21,22]. The underlying principle is that any change in the physical properties, such as mass loss, stiffness change, or deformation, will cause change in modal properties (such as natural frequencies, modal shapes [23], and modal damping [24]). As a result, the change in the physical properties can be continuously monitored by measuring the variations in modal parameters, without disassembly of the system or visual/physical access to the damaged regions [21]. Within these types of modal parameters, natural frequency is the most convenient to be measured. For the other parameters (mode shapes and mode damping), more sensors need to be used, and the quantity and placement of sensors will affect the accuracy of the results [25]. Vibration-based analysis techniques have been explored to identify damage in structures. For example, Zhang and Yan [21], Sha et al. [26], and Patil and Maiti [27] have proved the method of detecting and localising damage on cantilever beams by measuring the natural frequencies and the relevant changes. Wang et al. [28] numerically and experimentally analysed the dynamic characteristics of a compressor blade with a microcrack under variable working conditions. Their results confirmed that a decrease in frequency indicates the presence of a crack in the blade. Wang [29] effectively utilised the natural frequency change of transmission towers to identify if one or more parts of the structure are missing. However, despite the utilisation of vibration-based damage identification methods for structural health monitoring, its application for wear monitoring in mining machinery, where significant mass loss typically occurs, remains largely unexplored.
Simultaneously, the challenges associated with conducting wear tests and measurements directly on site should be considered, such as operational interruptions, limited access to equipment, and shutdown-related costs. The computational techniques of finite element analysis (FEA) are commonly used to simulate and extract the modal parameters of structures. Several studies [30,31] have focused on large-scale bucket wheel excavators during excavation. In these works, FEA-based modal analysis was conducted as the baseline of their experimental investigations. The numerical and experimental results showed good agreement with acceptable differences. Similarly, Li et al. [32] simulated vibration tests and successfully predicted the frequency response of a rotary platform on a hydraulic excavator under different working conditions. These studies suggest that FEA-based modal analysis can provide reliable predictions of natural frequencies of complex structures and large-scale mechanisms relevant to the mining industry.
For these reasons, this paper proposes a novel application of vibration-based damage identification, particularly focused on exploring whether the natural frequencies of the first few vibration modes can be used as a measure of the wear of GETs in the mining industry. Two case studies are explored: a simple model (cantilever beam) and a more representative system (excavator bucket). The cantilever beam case is validated through both FEA modal analysis and experimental impact vibration tests, while the excavator bucket case is examined solely via FEA modal and dynamic simulations, as full-scale experimental testing of the bucket is beyond the scope of this study.
The key innovations in this paper are outlined as follows: (1) a novel tool condition monitoring methodology for GETs on the mining machineries is proposed, which overcomes the limitations of being able to work in harsh environments, while providing continuous real-time monitoring; (2) an advanced application of vibration-based damage identification method from SHM to mining tool condition monitoring; (3) demonstration of the successful application of the vibration-based damage identification method on a complex structure system, such as an excavator bucket.

2. Methodology

2.1. Principle of Vibration-Based Damage Identification

The vibration-based damage identification method, as the name indicates, is based on analysis of the vibration of the system to detect damage. The general motion equation is expressed as:
M x ¨ ( t ) + C x ˙ ( t ) + K x ( t ) = F ( t )
where M is the mass matrix, C is the damping matrix, K is the stiffness matrix, F ( t ) is the external force, and x ¨ ( t ) , x ˙ ( t ) , and x ( t ) are the acceleration, velocity, and displacement vectors as a function of time (t). When the physical properties change, such as mass, damping, and stiffness (i.e., M , C , and K in Equation (1)), the vibration features will change, including the natural frequencies and mode shapes. The vibration-based damage identification method can be considered as the reverse problem, where the damage that occurs in a structure must be determined based on the change in modal features.
Modal analysis gives the dynamic characteristics of a system in forms of natural frequencies, mode shapes, and damping factors [33]. For free vibrations, no external force is acting on the system after the initial disturbance, which makes F ( t ) equal to zero. When we consider a structure with no damping, the general motion equation is expressed as:
M x ¨ ( t ) + K x ( t ) = 0
Assuming the solution of Equation (2) takes a harmonic form:
x t = { Φ } s i n ( ω t )
where { Φ } is the eigenvectors (i.e., vector of mode shapes), and ω is angular frequency.
Substituting Equation (3) into Equation (2):
K ω 2 M Φ = 0
It can be rewritten as:
[ K ] Φ = λ [ M ]   Φ
where the eigenvalue λ =   ω 2 , and the natural frequency ω =   λ . By conducting modal analysis, the dynamic properties of a system including the natural frequencies and mode shapes will be solved.
Among the vibration-based damage identification methods, the natural frequency-based method utilises the global modal property, resonance frequency, as the feature to determine the damage in structures. This has the advantage of providing an easy and convenient measurement and is less prone to being contaminated by noise [24]. This paper implements the natural frequency-based method to determine the conditions in GETs.

2.2. Mass Loss Detection with the Vibration-Based Method

To confirm the validity and effectiveness of the proposed vibration-based tool condition monitoring methodology, a cantilever beam and an excavator bucket were used for testing. The analysis of the cantilever beam provided a simplified case study that can be used to experimentally validate the proposed vibration-based method for mass loss detection. This validated approach was then used for the analysis of the bucket, which provides a more complex system and is more representative of systems relevant to the mining industry. The ability to experimentally measure changes in natural frequencies with respect to changes in mass of the beam provides confidence that changes in tool conditions for the excavator bucket case can be experimentally measured.
In this section, the methodology of FEA modal analysis and impact vibration tests (both via FEA and experiments) are described. This paper employs the commercial software ANSYS Workbench 2023 R1 to implement the FEA simulation. The modal analysis and experiment verification of the beam case verified the effectiveness of the proposed method. Application of the validated FEA modal analysis to the case of the bucket allowed the validity of the technique to the area of mining GETs to be assessed. The experimental verification of the industrial-scale bucket case is beyond the scope of this work.

2.2.1. Cantilever Beam—FEA

The proposed methodology utilising vibration-based damage identification was first tested on a simple specimen, an aluminium cantilever beam.
Model Description
The beam specimen is 400 mm long, 32 mm wide, and 6.5 mm thick. The material properties are as follows: density 2700 kg/m3, Young’s modulus 67 GPa, and Poisson ratio 0.33. The baseline case is a cantilever beam with no additional weight on it. However, GETs are essential parts on the end of mining excavator buckets that change in mass as they wear out. Therefore, the mass loss situations were established by adding weights to the cantilever beam. Figure 1 demonstrates the setup of the beam specimen, weight, and sensor (accelerometer) placements. The aim of simulating these different masses is to represent a similar effect as the excavator bucket under a mass loss situation as the GETs wear out or fall off. CAD models were generated according to the geometries and properties of the beam specimen. For the FEA modal analysis, different condition cases were explored, including the free-free condition and fixed-free condition. The details of each case are explained in Table 1. It should be noted that the beam was suspended and free at both ends in Condition 1, which means that the length of ‘a’ is zero in Figure 1. The geometry and mass of the accelerometer were considered in the CAD model. Natural frequencies of different cases were measured. Correlation between the mass loss and frequency change was explored.
Modal Analysis
All scenarios in Table 1 were analysed numerically in ANSYS. The free-free condition was simulated with free modal analysis, and the fix-free condition was simulated with pre-stressed modal analysis. A hexahedral mesh with 5 mm size was used on the beam. No boundary conditions were applied in the free modal analysis for the free-free condition. The first six modal frequencies should be close to 0, since the first six modes are the rigid body motions in the six degrees of freedom in 3D space, instead of deformations. The following 7 to 12 modal frequencies and mode shapes of the beam were retrieved in the free modal analysis. In the pre-stressed modal analysis of the fixed-free conditions, the model was constrained with standard Earth gravity and a fixed support boundary condition at the end of the beam. The natural frequencies and mode shapes of the first six non-zero modes were obtained. The results are presented in Section 3.1.1.

2.2.2. Cantilever Beam—Experiments

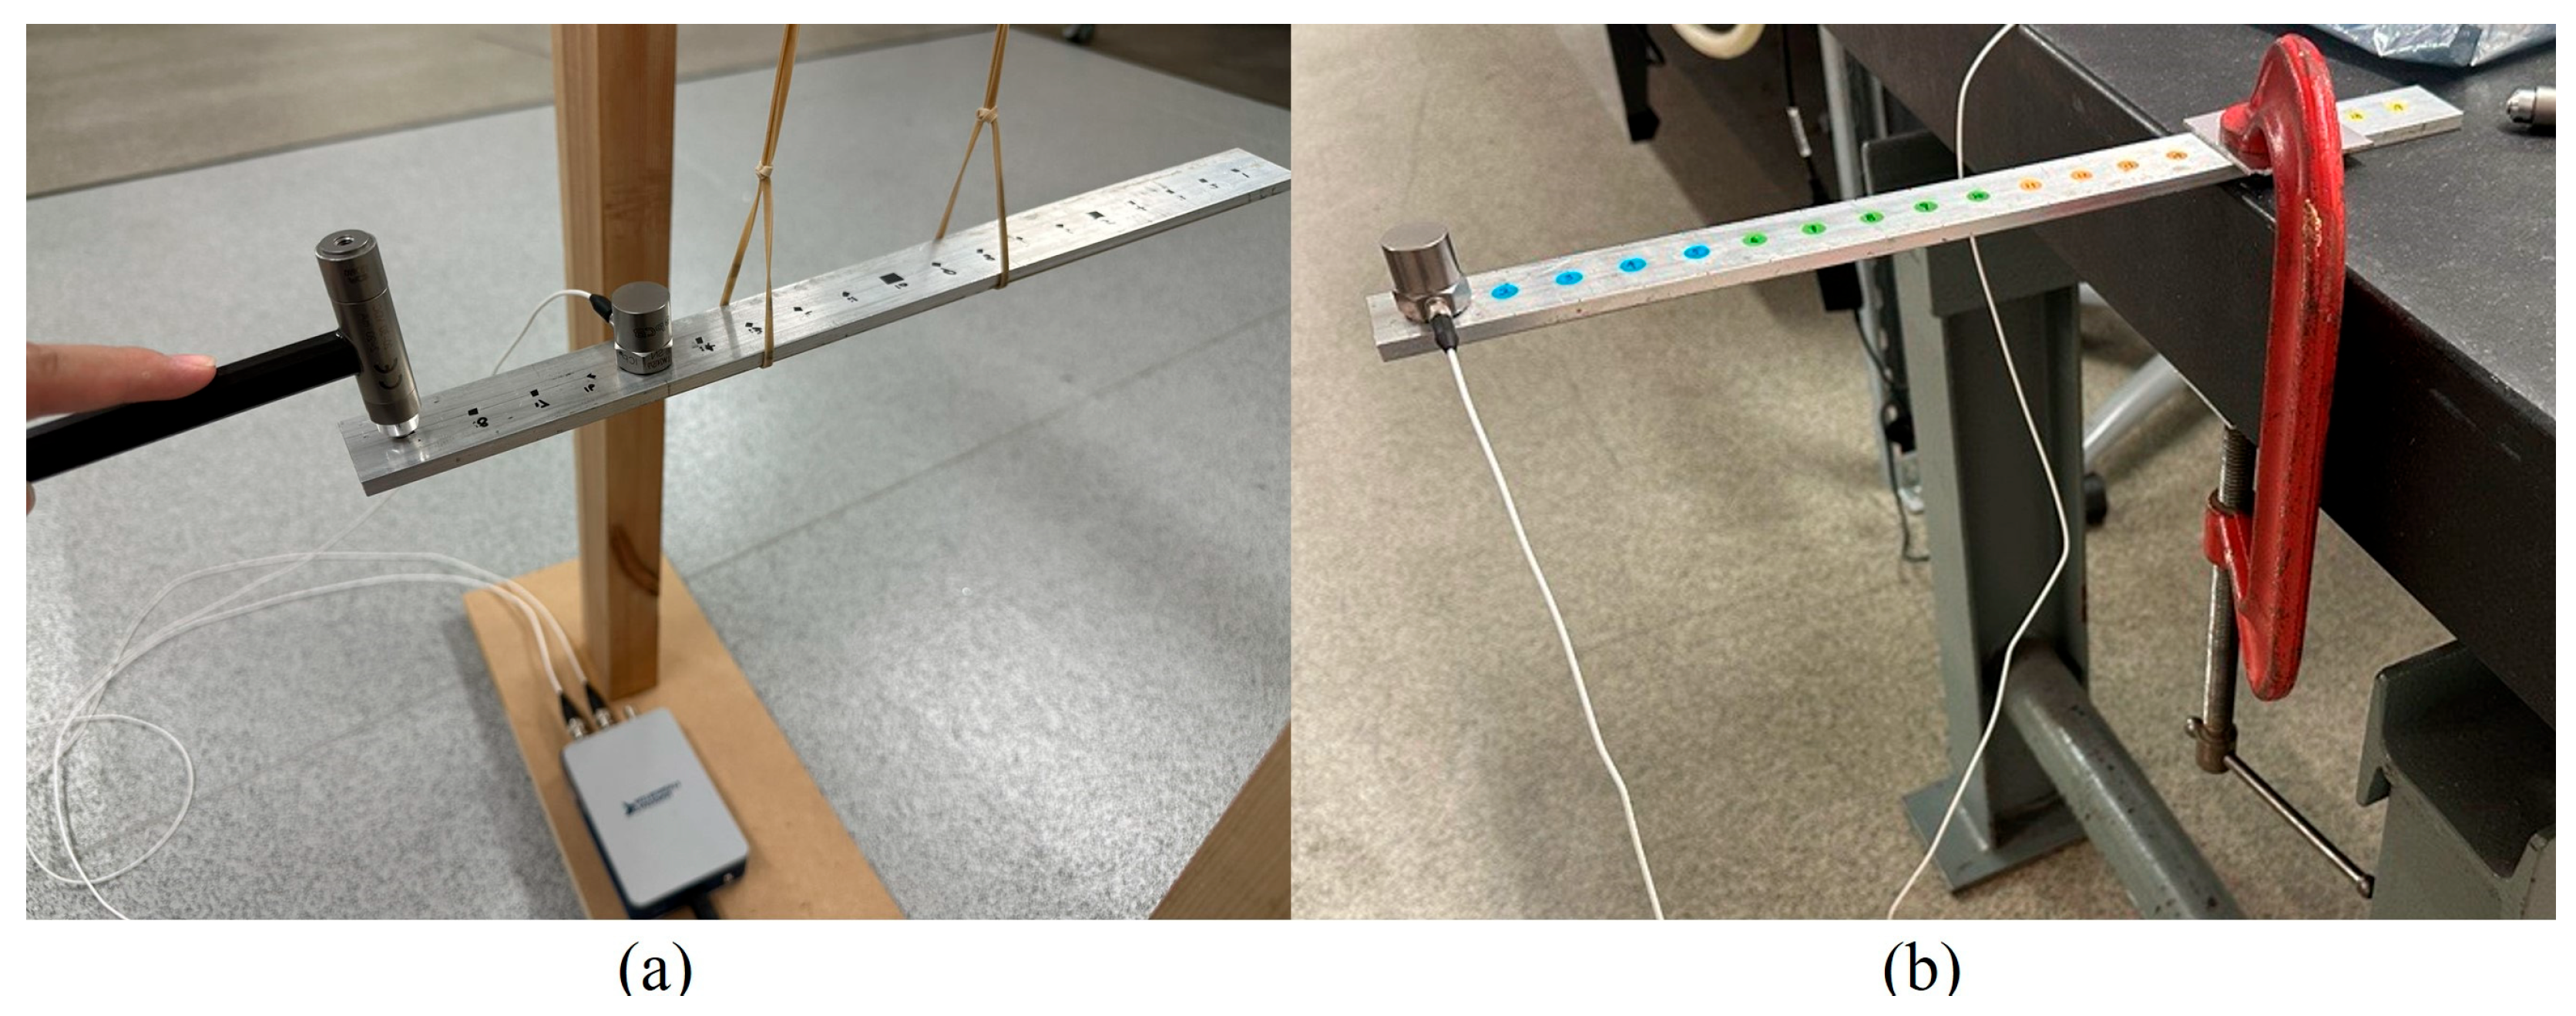
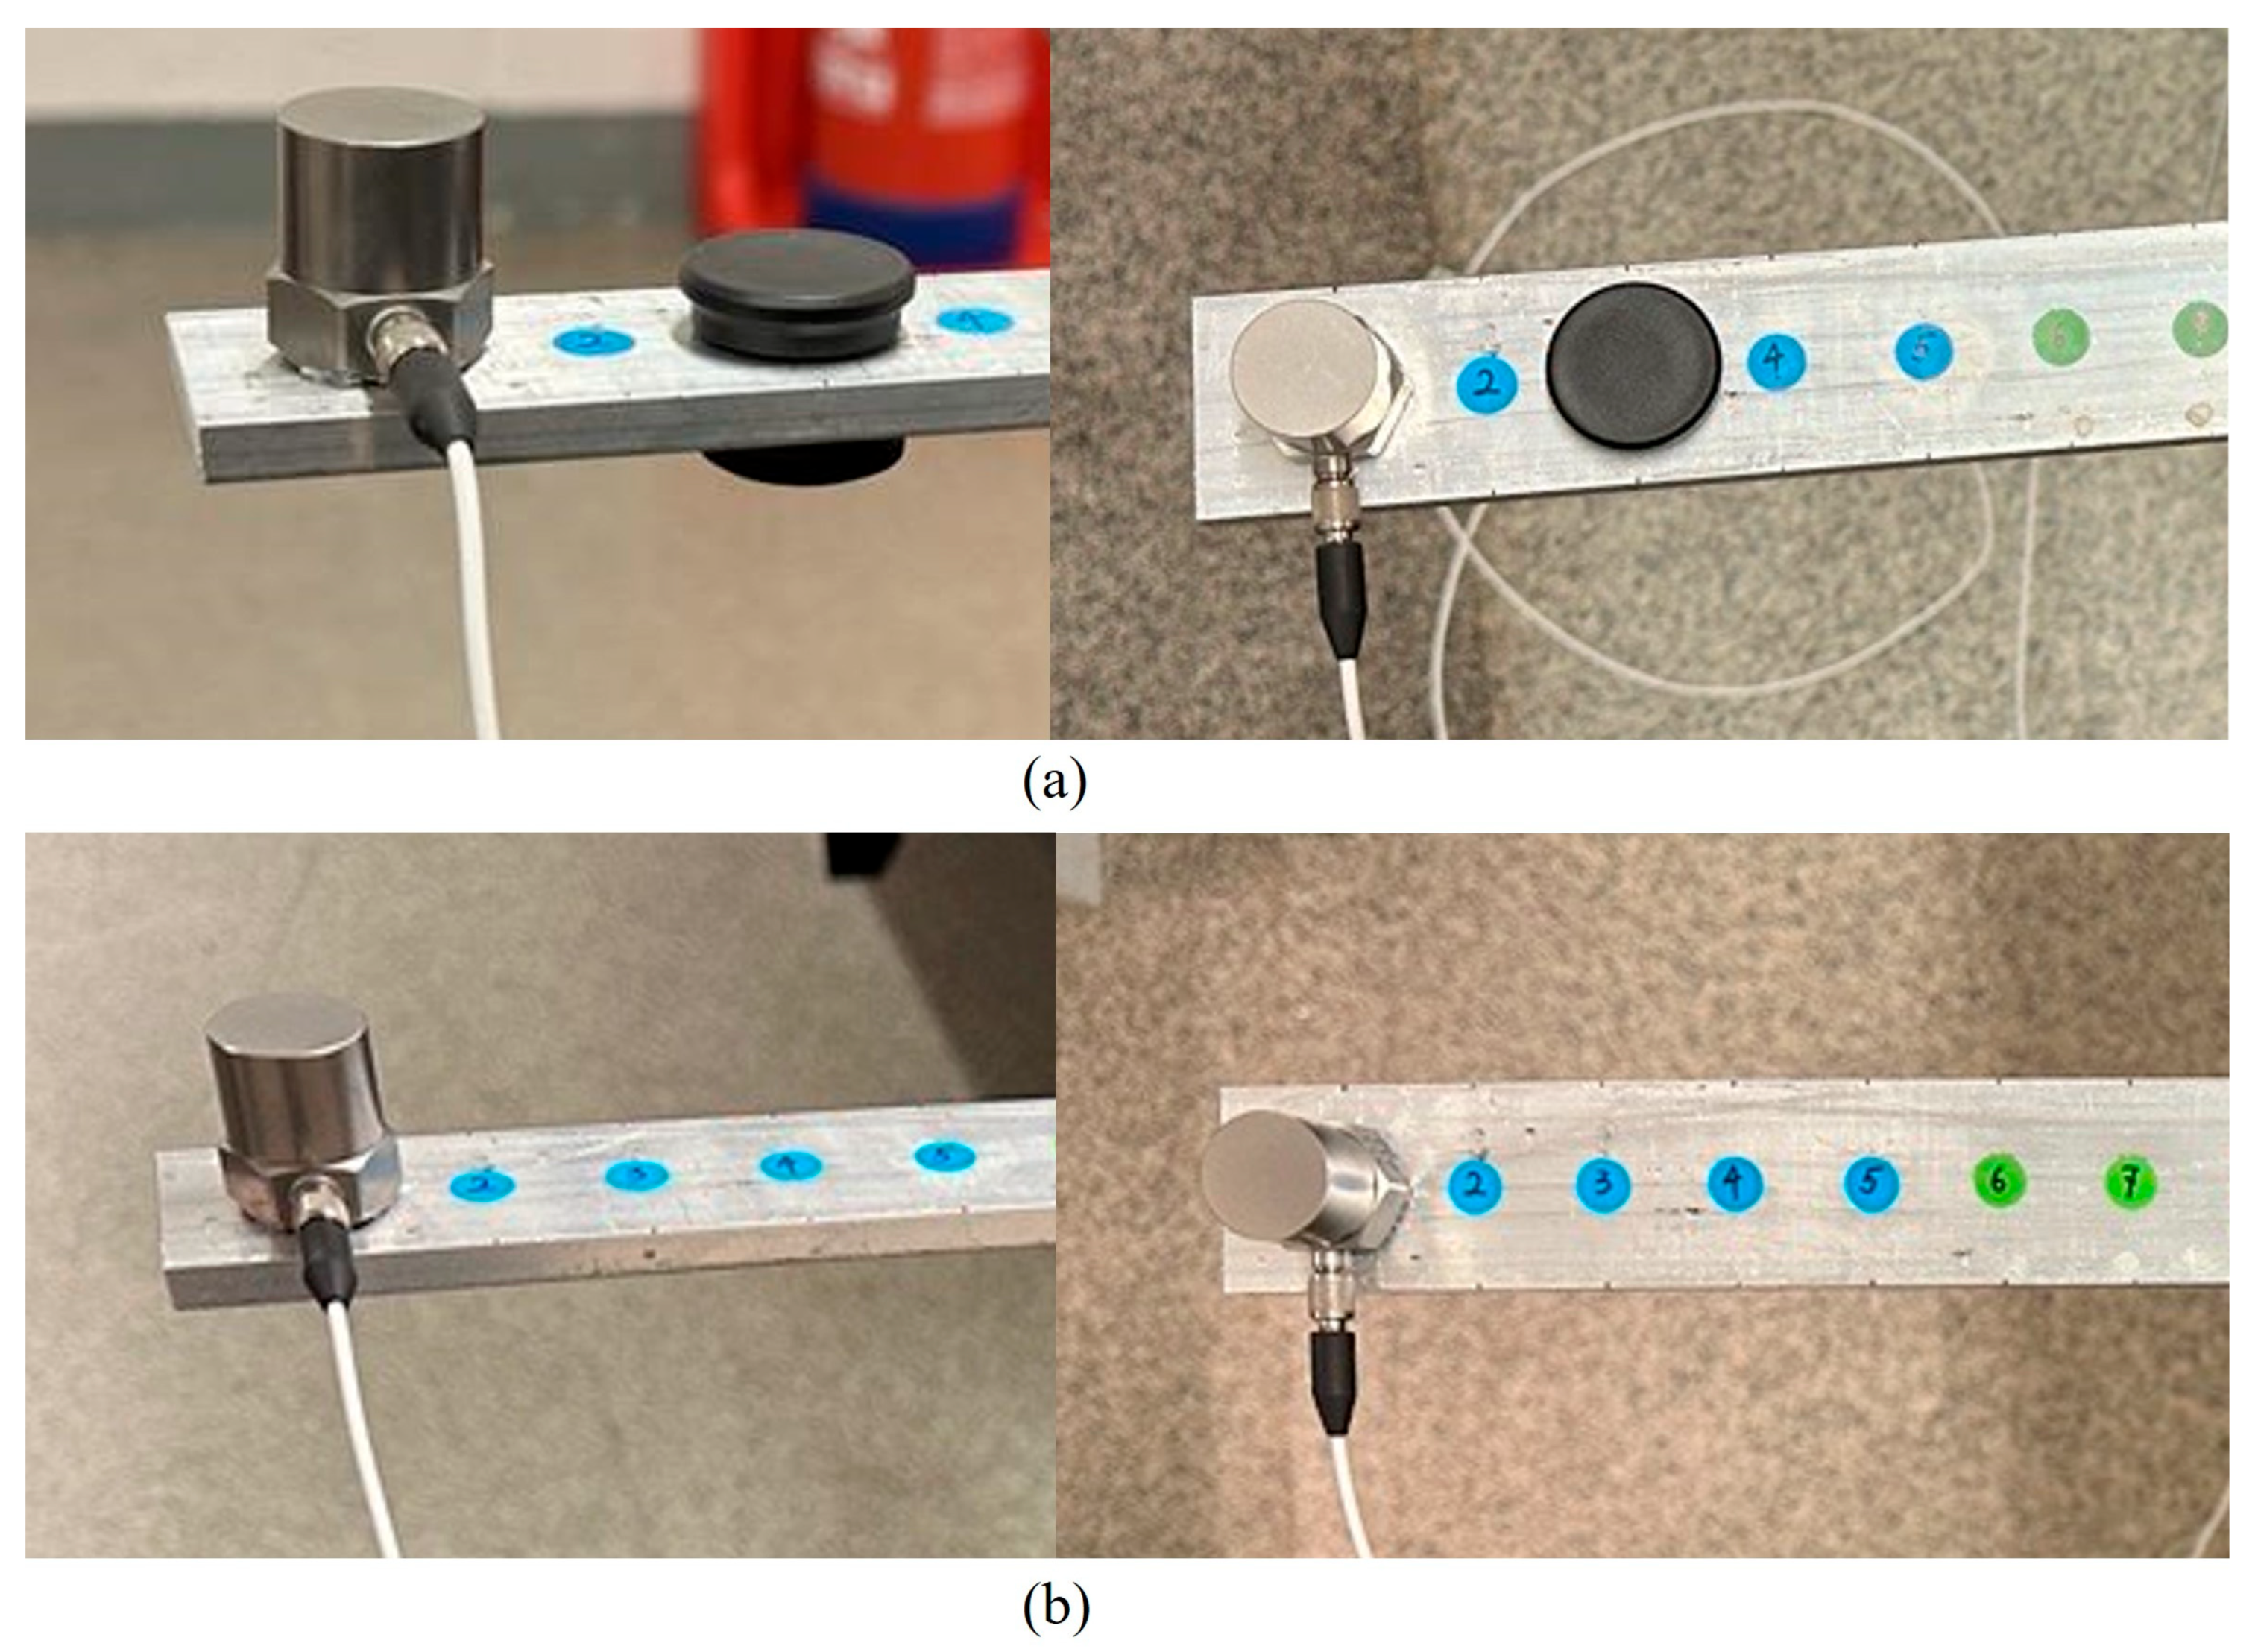
Experimental modal analysis of the beam was conducted using the impact hammer test, as shown in Figure 2. The beam was tested under two conditions. As shown in Figure 2a, it was suspended by elastic bands for the free-free condition test, and as shown in Figure 2b, it was then fixed perpendicularly to a steady platform for the fixed-free condition test. An impact hammer (PCB 086C03, PCB Piezotronics, Inc., Depew, NY, USA) supplied an impulse excitation to the beam and an accelerometer (PCB 353B33, PCB Piezotronics, Inc., Depew, NY, USA) was utilised for the low frequency vibration measurement, whose measurement frequency range is up to 4000 Hz (±5%). The sampling rate was 4096 Hz, since the frequency range of interest is under 2000 Hz, and the recording duration was 2 s for each test. Figure 3 demonstrates the mass loss scenarios of Conditions 2 and 4 in Table 1. The impact vibration test was first conducted for the case with weights attached to the beam and then repeated for the case without the weights.
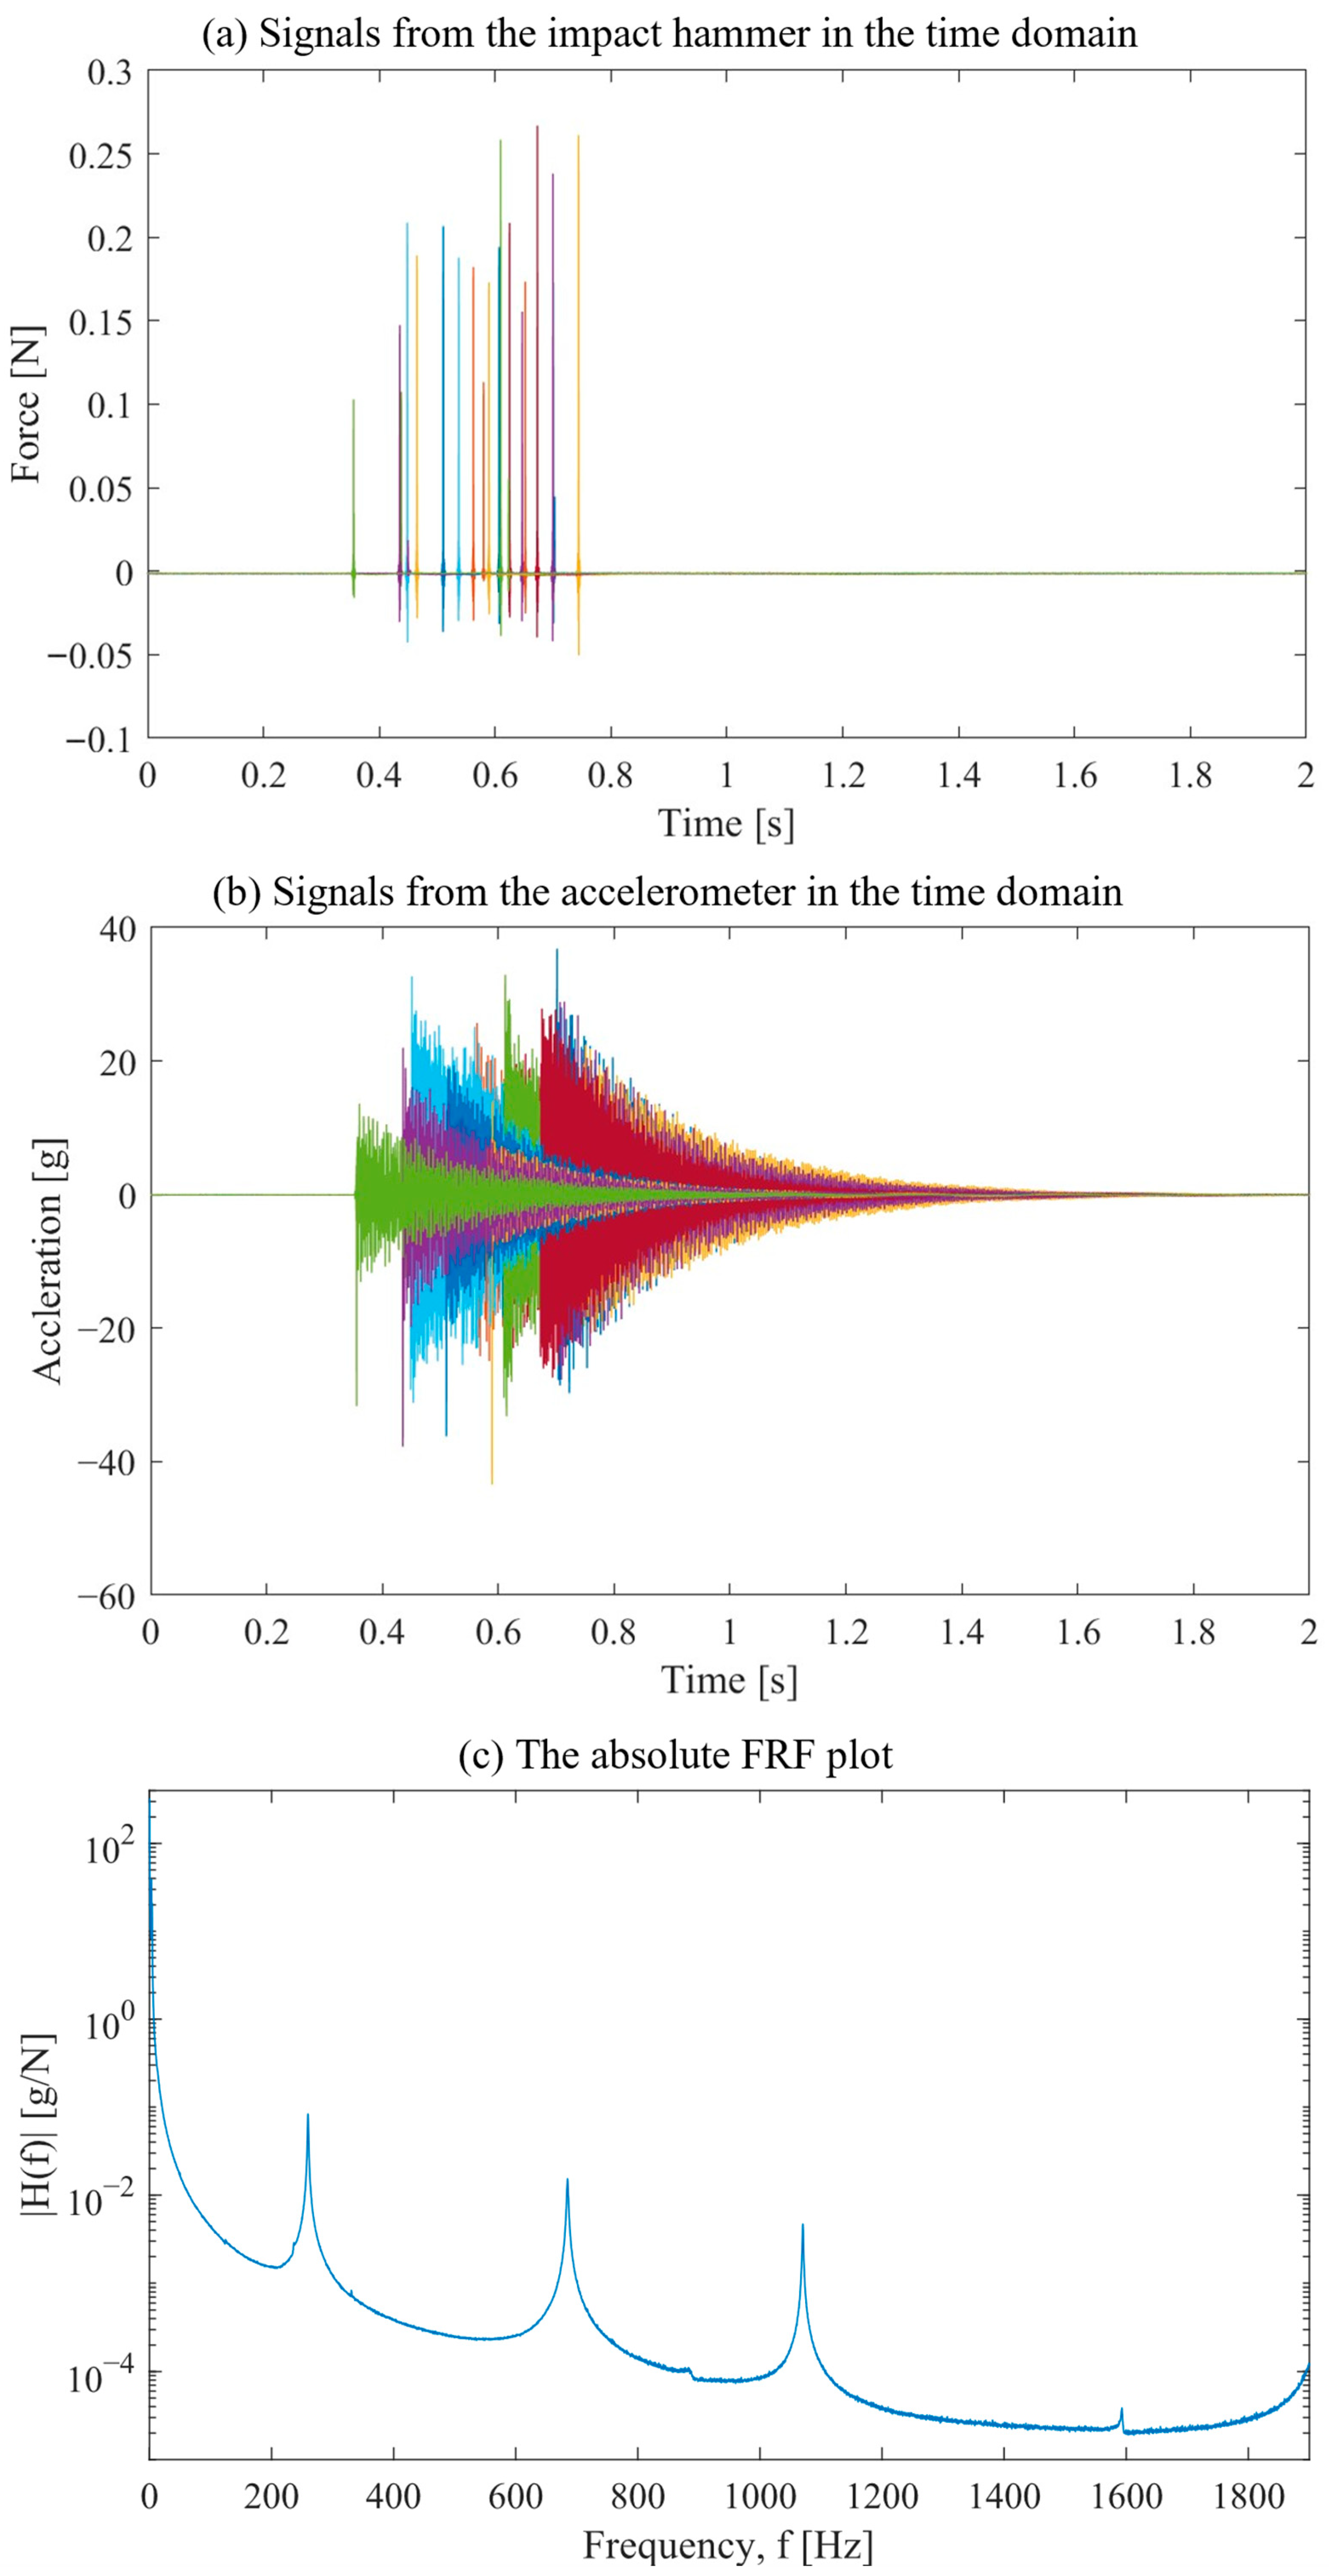
The force signals from the impact hammer and the acceleration signals from the accelerometer were measured by a high-speed data acquisition (DAQ) system (NI-9234). An example of the measured signals in the time domain from the impact hammer and the accelerometer is shown in Figure 4a,b. These signals were processed in MATLAB R2023b using the Fast Fourier Transform (FFT) algorithm, converting the time domain signals into the frequency domain. Vibration features were extracted by identifying the peaks from the frequency response function (FRF) plot, which was calculated by dividing the FFT of the output signal by the FFT of the input signal. The transfer function H(f), as shown in Figure 4c, represents the absolute magnitude of the output acceleration (g) per input force (N) and is plotted against the frequency of interest. Each peak represents a resonance mode, with the corresponding frequency being the natural frequency at that mode.
There are two methods to obtain the mode shapes from the impact hammer test [34]. One method is to fix the position of the accelerometer and move the impact hammer, called the roving hammer method. Another method is to change the positions of the accelerometer and keep the same position of impact with the hammer, called roving accelerometer method. Chandra and Samal [35] have proved that the experimental mode shapes determined by both methods are identical, while the roving hammer method is more convenient and efficient. This paper employs the roving hammer method in the impact vibration test to obtain the experimental mode shapes. The beam was divided into 20 segments. The hammer struck at each segment in the vertical direction and moved along the longitudinal direction. The measured natural frequencies from this impact vibration test are presented in Section 3.1.2.

2.2.3. Mining Bucket with GETs—FEA

After examining the simple cantilever beam model, a more complex model, which is the focus of the research, was analysed. A heavy-duty excavator bucket with GETs was used in this paper as a typical representation of the geometry and mass found in large scale mining excavation equipment. Teeth are the consumable GETs that contact the ore/soil, which can protect the components further from the tip. The teeth should be replaced frequently according to the wear conditions [4].
Model Description
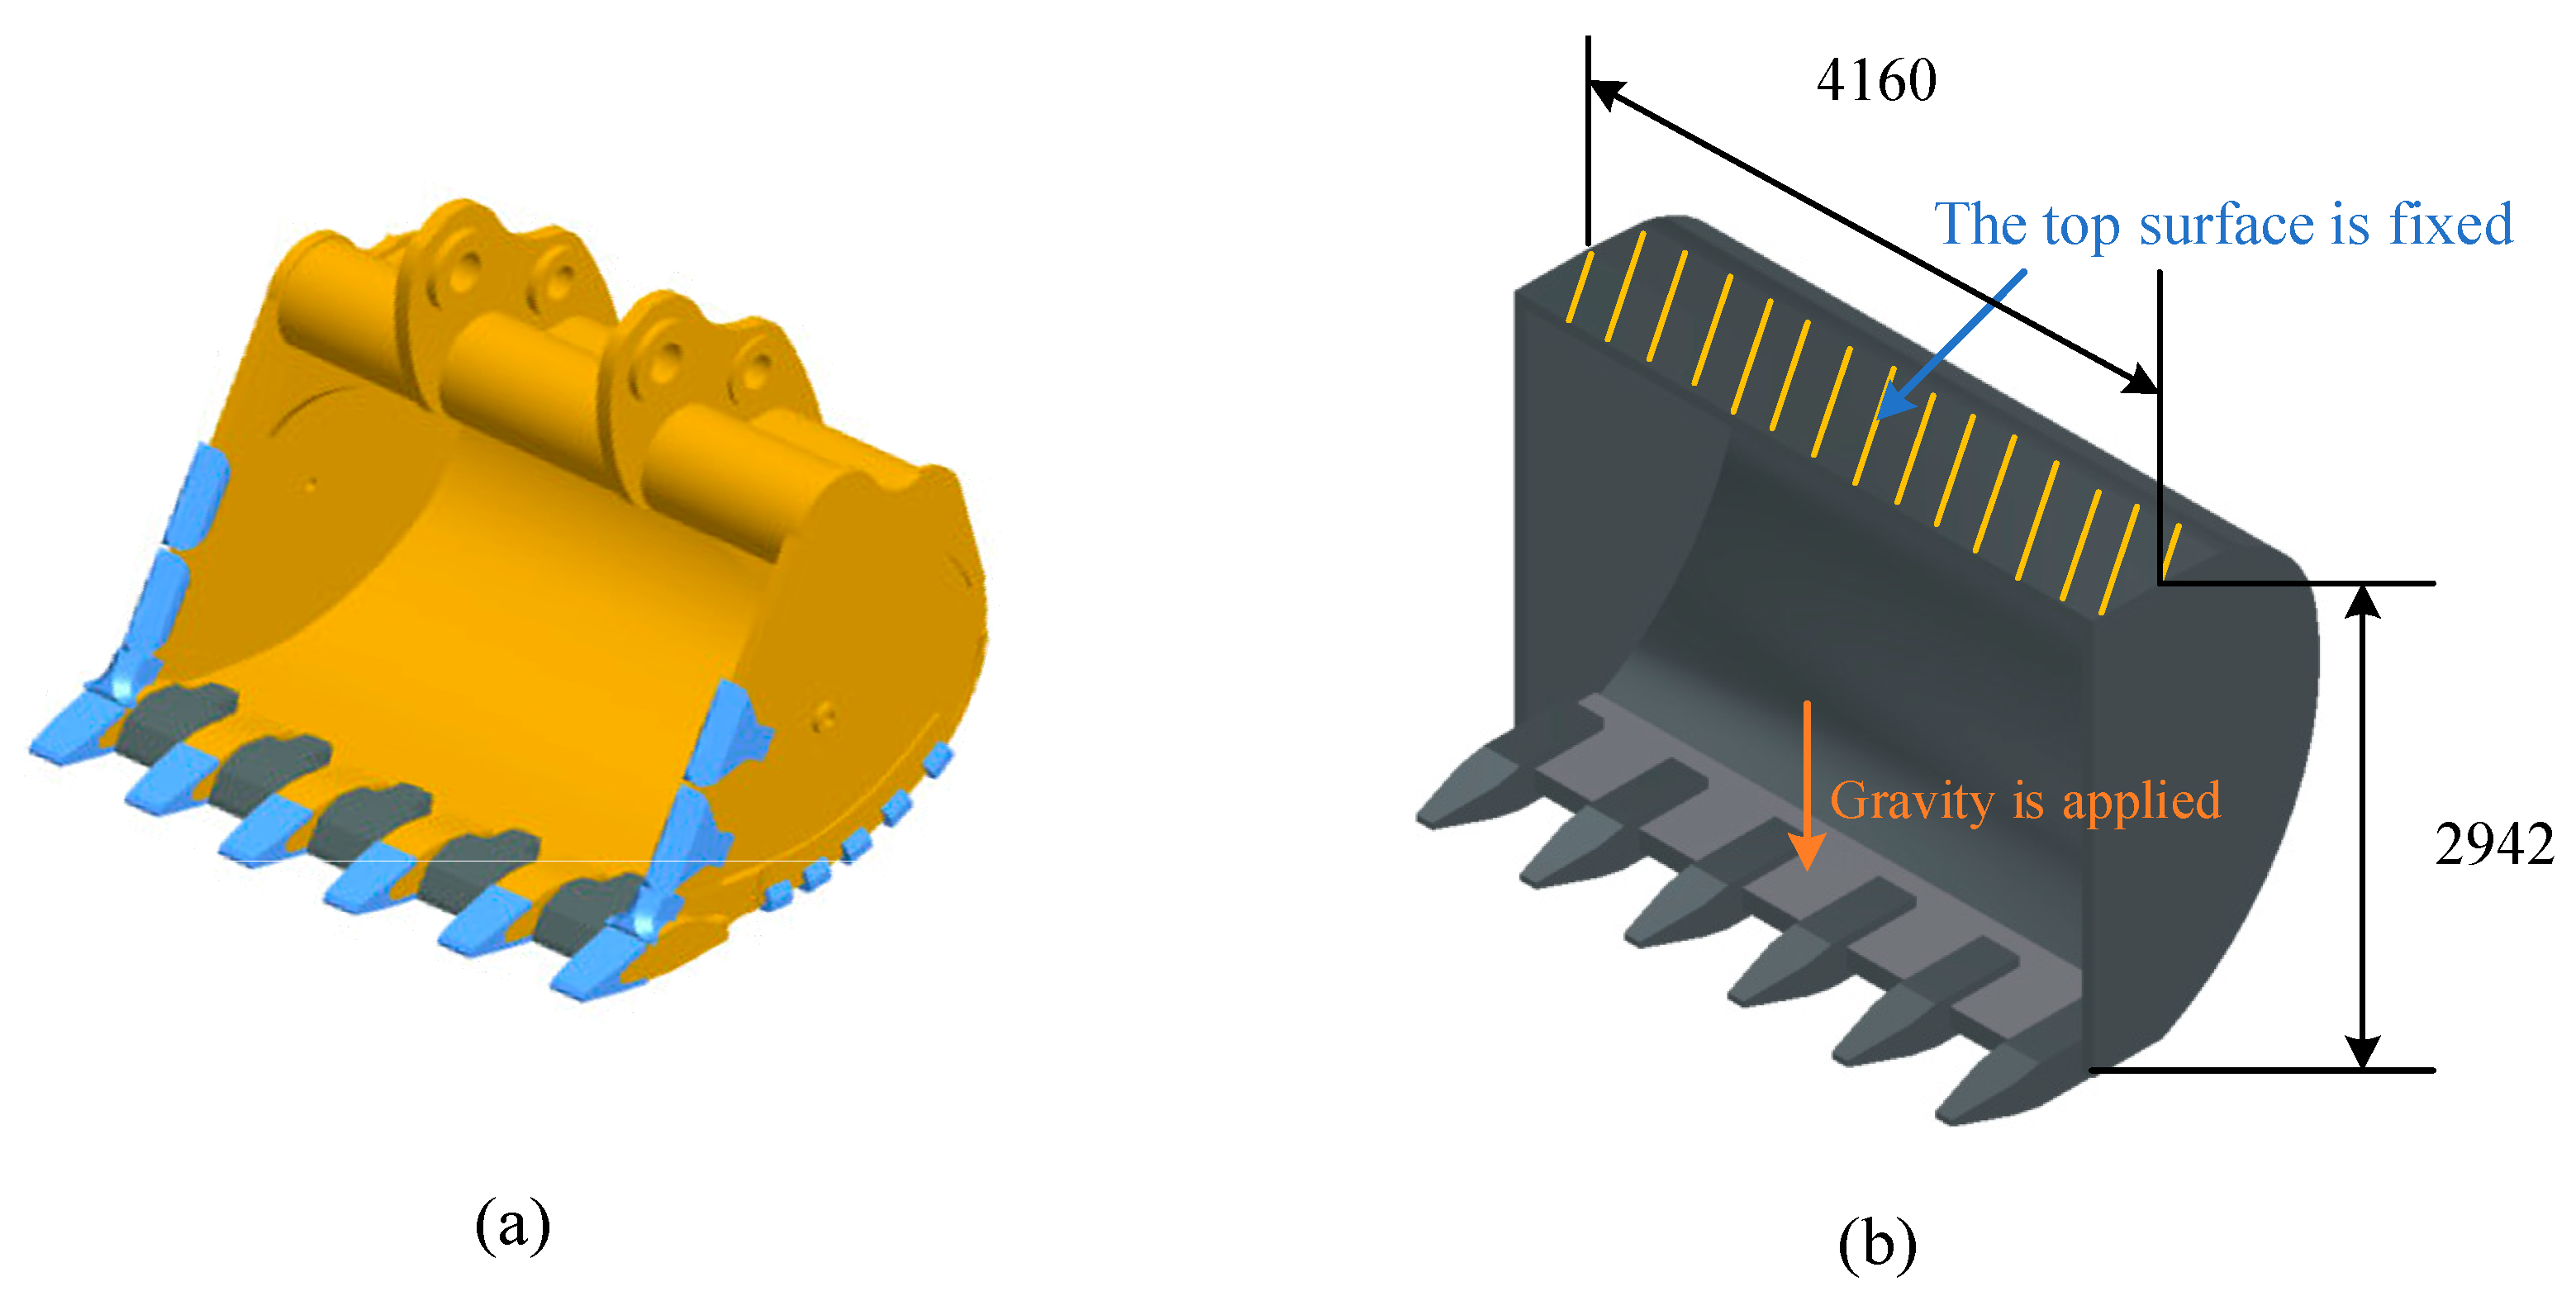
Figure 5a shows an example of a heavy-duty excavator bucket with GETs. To endure operations in harsh environments, a tooth assembly consists of two components—a connector (coloured in yellow in Figure 5a) and a harder tooth (coloured in blue in Figure 5a). Such a system can make the maintenance and replacement quick and easy by disassembling and replacing only the worn tooth part, instead of the whole tooth assembly. By first having the convenience of being able to change the teeth, it is then advantageous to know when to change the teeth with a real-time wear condition monitoring method [4,36].
The size of heavy-duty excavator buckets can vary from 2 to 5 m in width. This paper focuses on a relatively large bucket model that is approximately 4 m wide and 3 m high. To save computation time, the original geometry was simplified to the model shown in Figure 5b by reducing the redundant components, such as the hooks, rounds, fillets, wear strips, hinges, etc., but keeping the original mass. The mass of the models plays an important role in the modal/vibration analysis simulations, since the overall geometry of the tooth assembly and how it changes represent the tool condition.
The simplified model of the excavator bucket consisted of a simplified bucket and six simplified tooth assemblies. The simplified bucket removed the hinges and most of the plate/edge protectors, while the bucket wall thickness and weight were kept as similar as possible to the original geometry. It should be noted that in the original tooth assembly, the tooth is attached to the connectors. However, in the simplified model, these two parts—tooth and connector—were represented together as one tooth assembly. In this way, the original complex geometries, such as hollows, grooves, and locking parts, were removed, but the key features, such as length, width, thickness, and the gap between the teeth, remained. The final weight of the simplified bucket model is 19.5 tonnes, an 11.4% difference compared to the original bucket model [37]. This was deemed to be acceptable, since the heavy and rigid mounting geometry (used to connect the bucket to the excavator) was not modelled. Instead, this was represented by the fixed boundary condition in the simplified model.
Building upon the methodologies employed in the simulations of the transmission tower by Wang [29] and offshore platform by Li and Huang [20], where scenarios were generated to account for missing components at various locations, this research considers a sequence of scenarios that examine the effects of worn teeth at different locations.
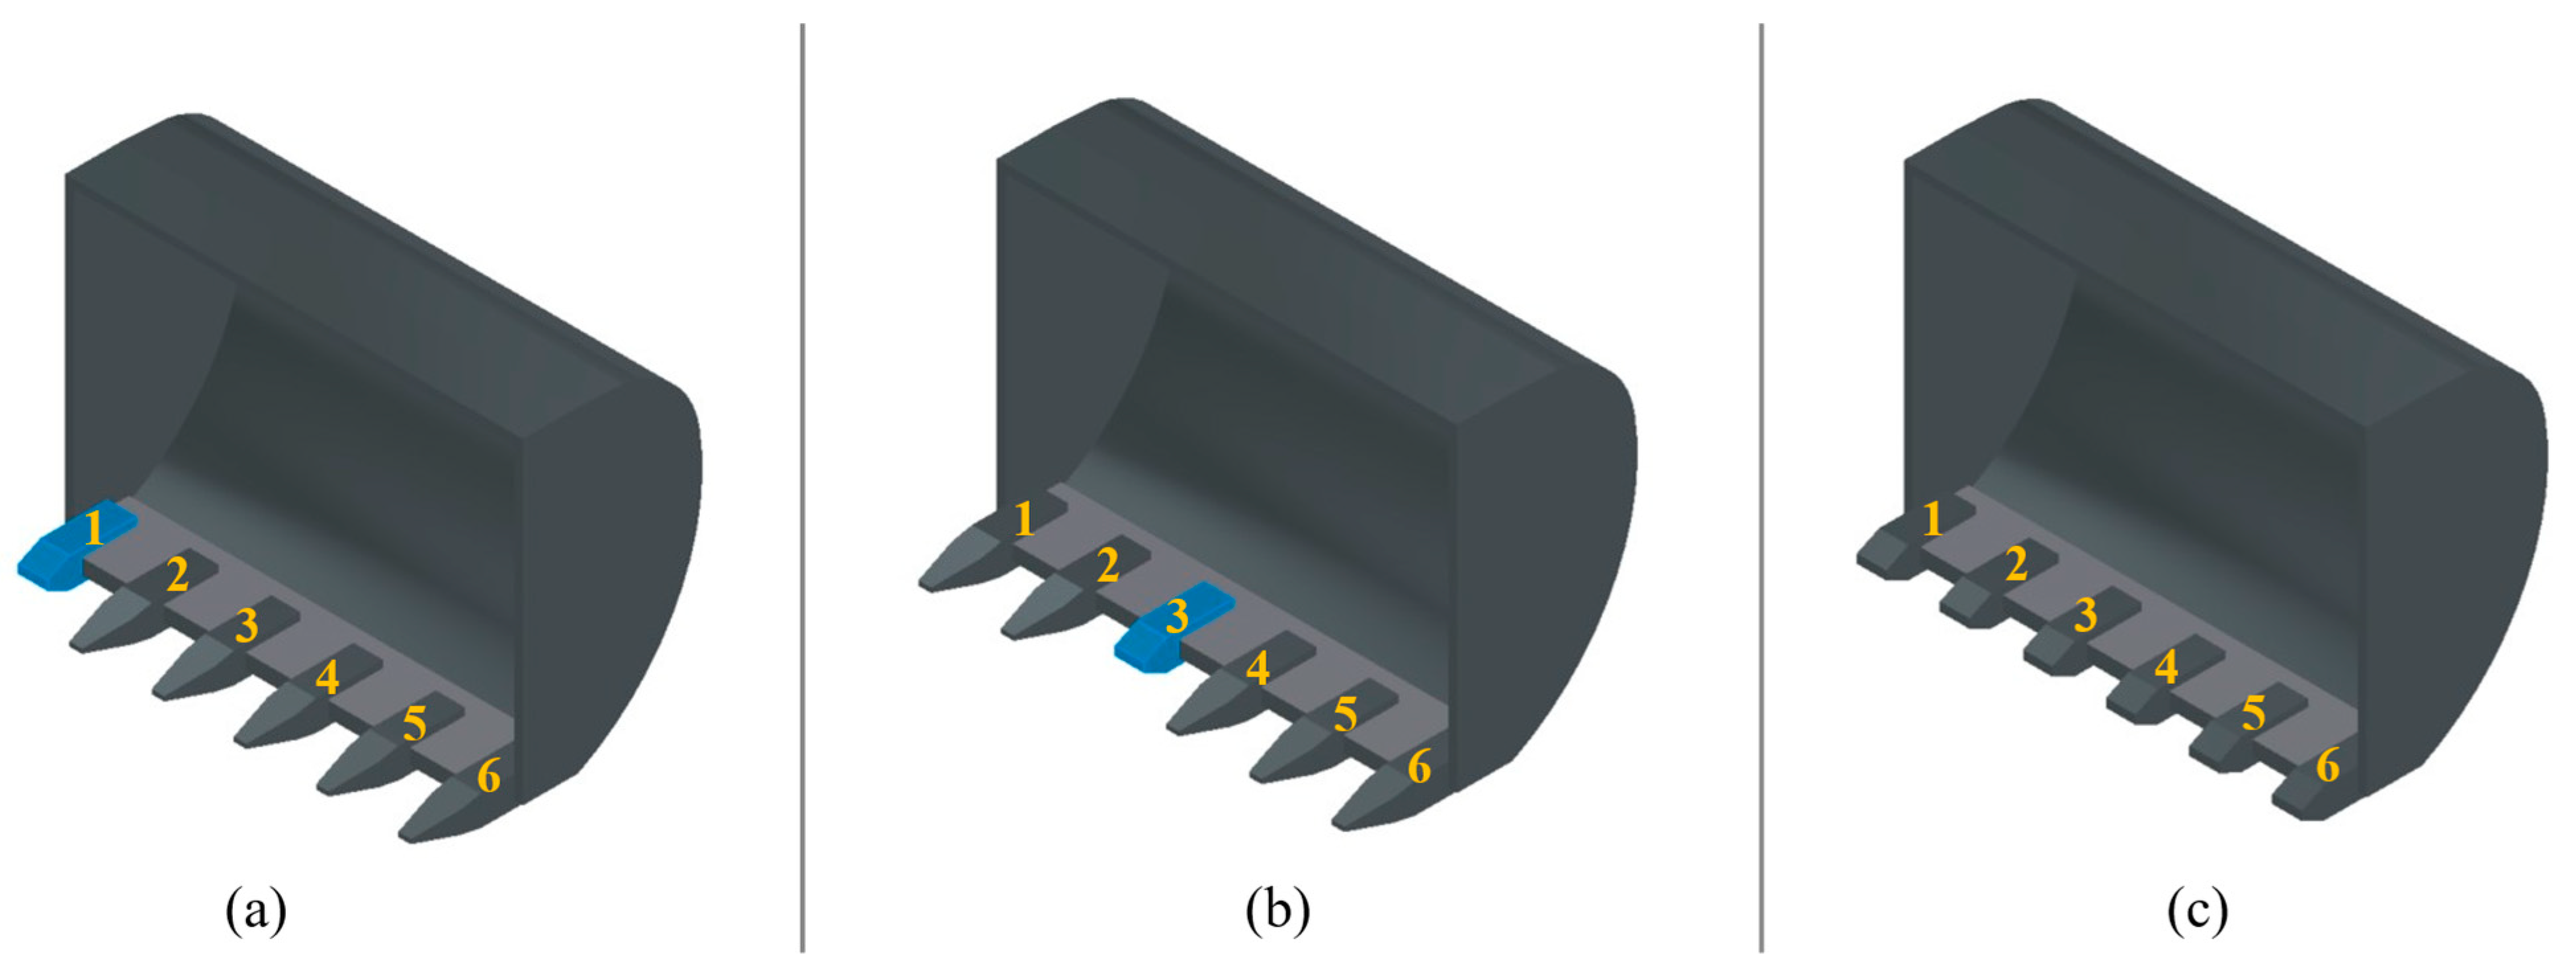
The models of these scenarios were created by replacing the tooth assembly, consisting of one tooth and one connector, with a single connector at one specific location. This method was chosen because the result will be more obvious than decreasing the mass of the tooth slightly and represents the case where the tooth is completely broken or fully worn (100% of mass loss), and only the connector remains. Teeth are labelled as No. 1 tooth to No. 6 tooth, counting from the left-hand side of the bucket in the front view (facing the open bucket) as shown in Figure 6. A series of CAD models were created for the situations when the tooth is fully worn at positions No. 1 (Figure 6a), 2, 3 (Figure 6b), 4, 5, and 6, and an extreme case when all of the teeth are fully worn (Figure 6c).
To verify the method of detecting damage of GET by measuring the change in modal parameters, the natural frequencies of the intact and damaged GET were predicted numerically by modal analysis and dynamic analysis.
Modal Analysis
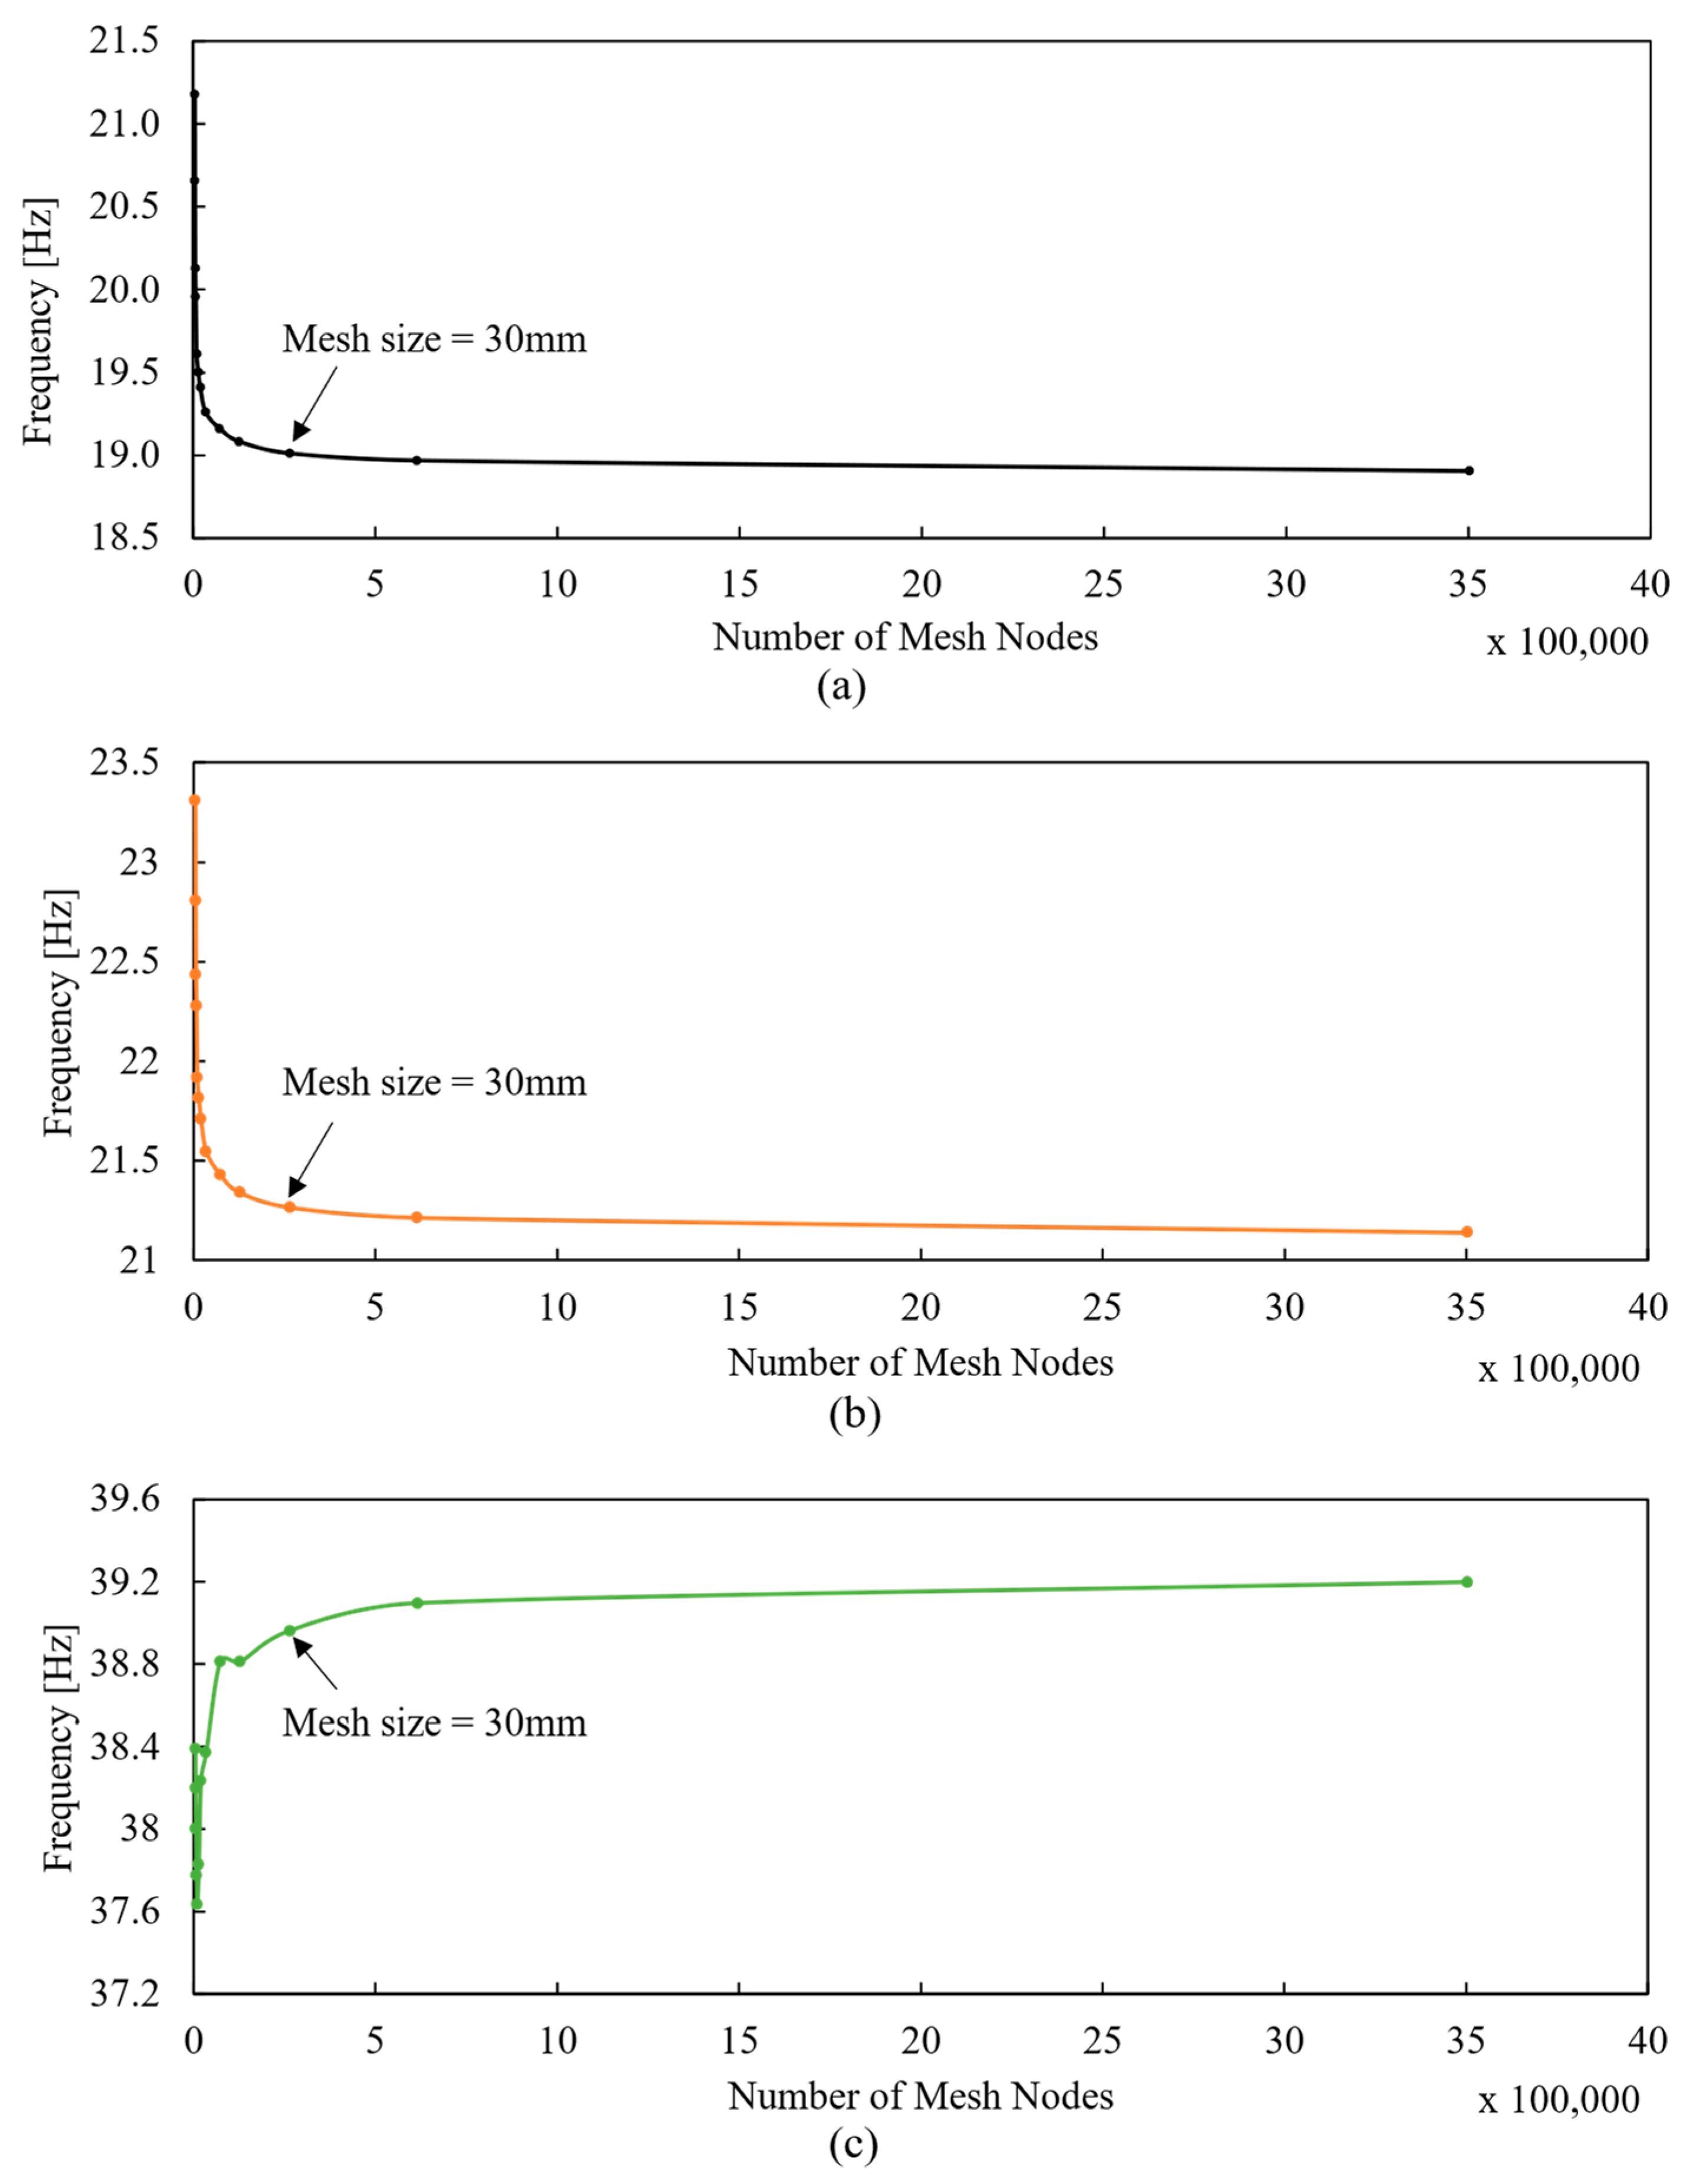
Modal analysis can be used to determine the modal parameters, such as the natural frequency and mode shapes. Pre-stressed modal analysis was used in this project since it considers boundary conditions that aim to represent the real operating conditions of the excavator bucket. First, standard gravity was applied in the y-direction (downwards). Second, the simplified bucket was fixed at the top face (highlighted with yellow in Figure 5b), representing the rigid support from the hinge of the bracket. The mesh contains a hexahedral mesh in the bucket lip area and a tetrahedral mesh around the rest of the bucket and the teeth areas, with mesh size of 30 mm, as shown in Figure 7. The mesh size was chosen according to the mesh convergence analysis, which is discussed in the Appendix A. The bucket was tested without objects inside the bucket. For the rest of the scenarios, the same boundary conditions and analysis processes were applied.
Dynamic Analysis
In this paper, the dynamic analysis simulated the vibration of the bucket system from the moment of impact. This dynamic analysis can be used to assess whether future vibration-based analysis can capture the required natural frequencies and mode shapes.
Similar to the modal analysis, all scenarios were assigned standard Earth gravity and had their top faces fixed. For the dynamic analysis, a 10 N impulse force was applied to the top face of tooth No. 1 in the y-axis. The force linearly ramped up from 0 N to 10 N over 0.01 s, then linearly decreased back to 0 N over the following 0.01 s. The vibration of the bucket was analysed over a period of 10 s. After convergence analysis, the step time interval was set to 0.0005 s, which is short enough to obtain a precise result but long enough for the computation time to be acceptable.
The output signal probes were chosen in the midpoint of the top surfaces of each tooth and a right-side wall edge, as shown as points from A to G in Figure 7. The output signal probes positioned in the dynamic analysis can be a guide for sensor placement in future vibration-based tool condition monitoring analysis. The output signals were the directional displacements in x-, y-, and z-axes since displacements have been found to contain less noise in the low-frequency range compared to velocities or accelerations [38]. The signals were transmitted to the software MATLAB for the fast Fourier transform (FFT), and the natural frequencies of the model were obtained by measuring the peaks in the FFT diagrams. Identifying whether there is good correlation between the results of modal analysis and dynamic analysis can increase confidence in using dynamic analysis for the simulation of vibration experiments. This method helps accurately capture the natural frequencies of real structures and evaluate tool conditions.

3. Results and Discussion

In this section, the numerical predictions of the modal properties and the experimental dynamic response of the cantilever beam specimen are presented, followed by the numerical analysis of the simplified excavator bucket.

3.1. Cantilever Beam

3.1.1. FEA Modal Analysis

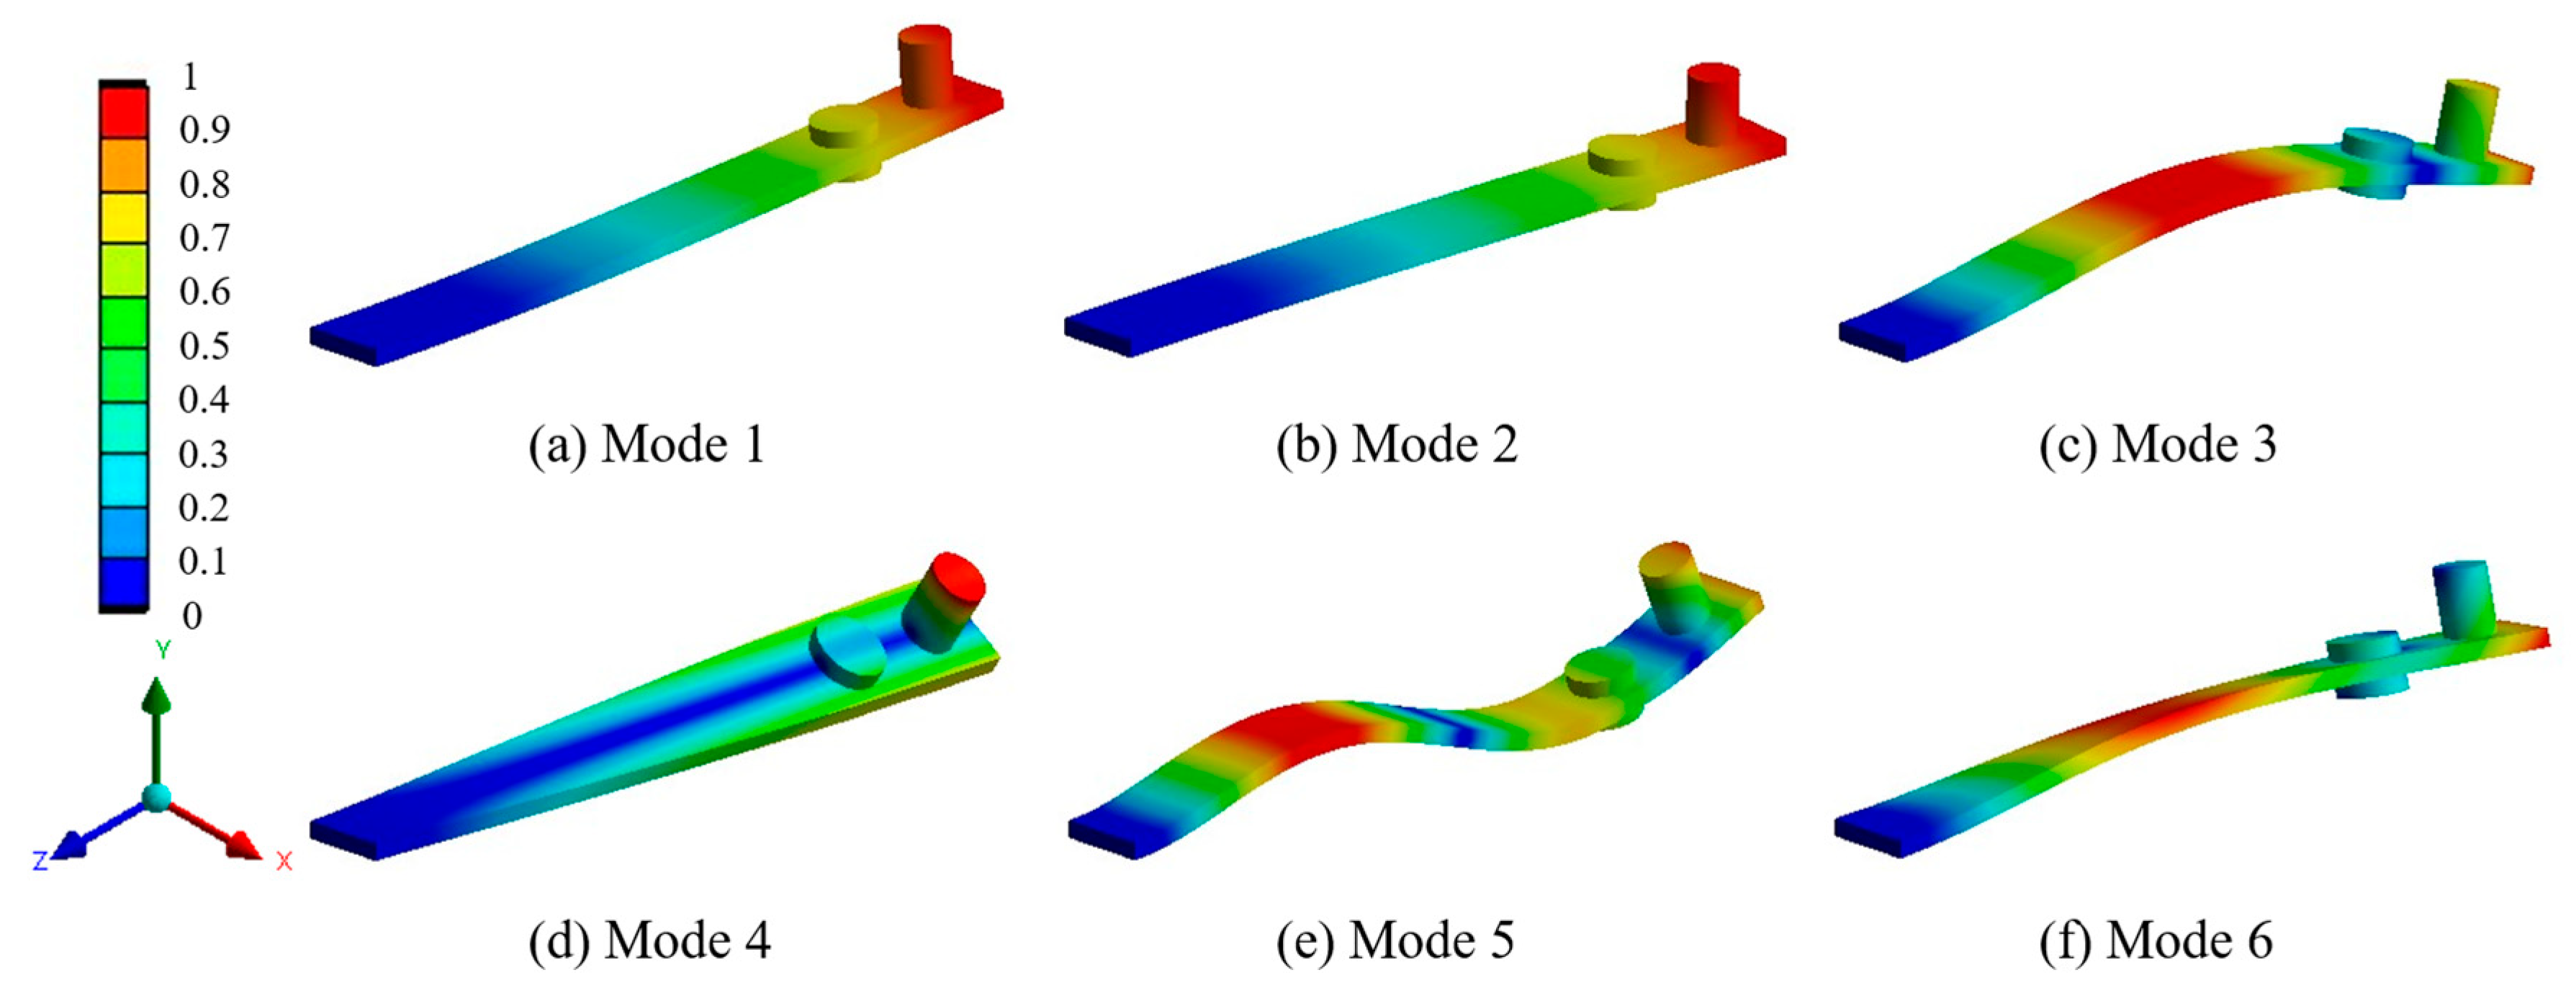
The natural frequencies of all beam scenarios are summarised in Table 2. Figure 8 demonstrates the first six mode shapes for the scenario with a 300 mm beam length and 15 g weights attached. For the other condition scenarios, the mode shapes of each mode are similar to those shown in Figure 8. It is evident that the natural frequencies change as the mass changes. The principal tendency is that the natural frequency will increase when the mass of the system decreases—i.e., as the mass loss increases. The first, second, and sixth mode frequencies follow this tendency. It is observed that the fourth and fifth modes show an exception, where the frequencies decrease from Condition 3 to 4 in Table 1. This is due to the reduction in stiffness having a greater impact than the decrease in mass after completely removing the weights. However, the frequencies for the 300 mm beam without weights (Condition 4) remain higher than those for the intact status (Condition 2 as shown in Table 1).
From the intact status (Condition 2) to the condition of a 7.5 g mass decrease (Condition 3), which equals 3.7% of the mass loss, the differences in the first, second, and fourth natural frequency are 2.9%, 2.6%, and 3.6%, respectively. For a 15 g mass decrease (Condition 4), which equals 7.3% of mass loss, the changes in the first, second, and fourth frequency are 6.0%, 5.7%, and 3.0%, respectively. When the length of the beam decreases by 60 mm (Condition 5), which is one-fifth of the total length and corresponds to 15.9% of mass loss, the first three mode natural frequencies increase by 51.9%, 49.9%, and 55.5% compared to the original length scenario. Therefore, the effectiveness of the proposed method to detect damage or mass loss based on the change in natural frequencies is proved numerically.

3.1.2. Experimental Impact Vibration Tests

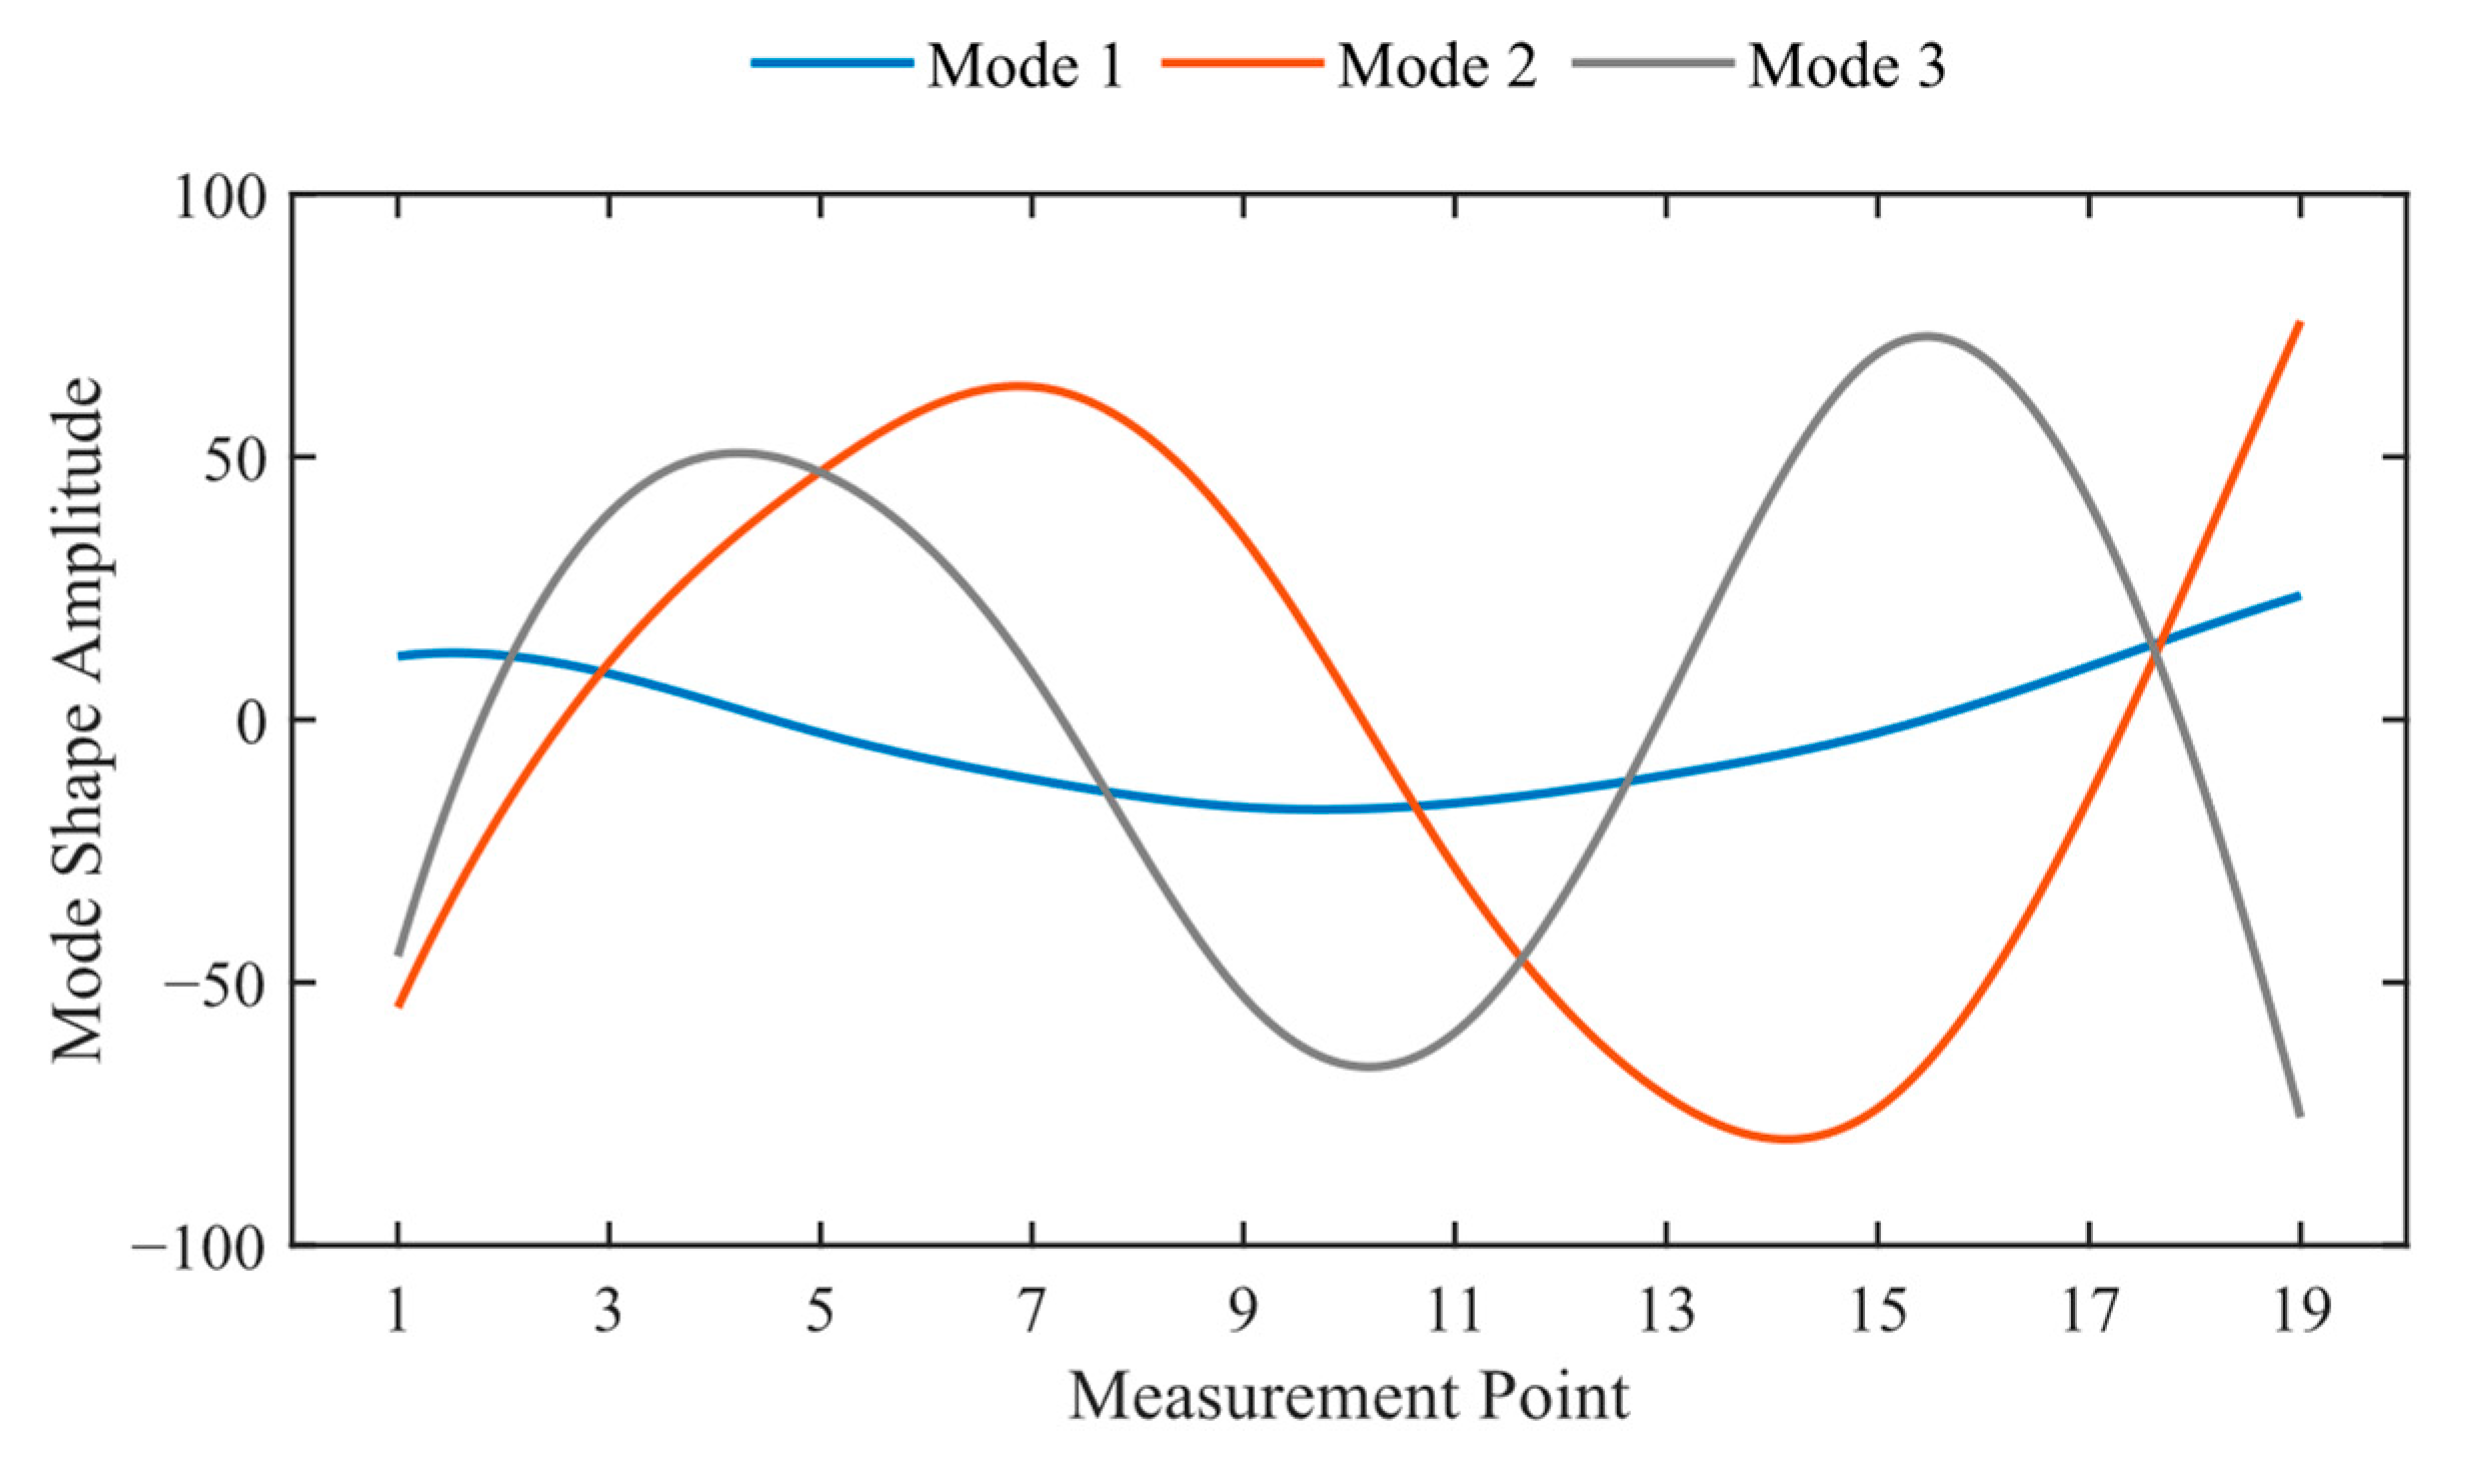
Table 3 compares the natural frequencies identified by the FEA modal analysis and the experimental impact vibration test under free-free boundary conditions, where the beam is suspended. Three bending modes are captured in the impact vibration test, as shown in Figure 9, as the beam was excited vertically by the impact hammer. According to Table 3, the absolute differences between the FEA-predicted and experimentally measured frequencies are 1.7 Hz, 6.5 Hz, and 7.0 Hz, corresponding to relative differences ranging from 0.7% to 1.2%. These results confirm that the numerical simulation is in good agreement with the experimental measurements.
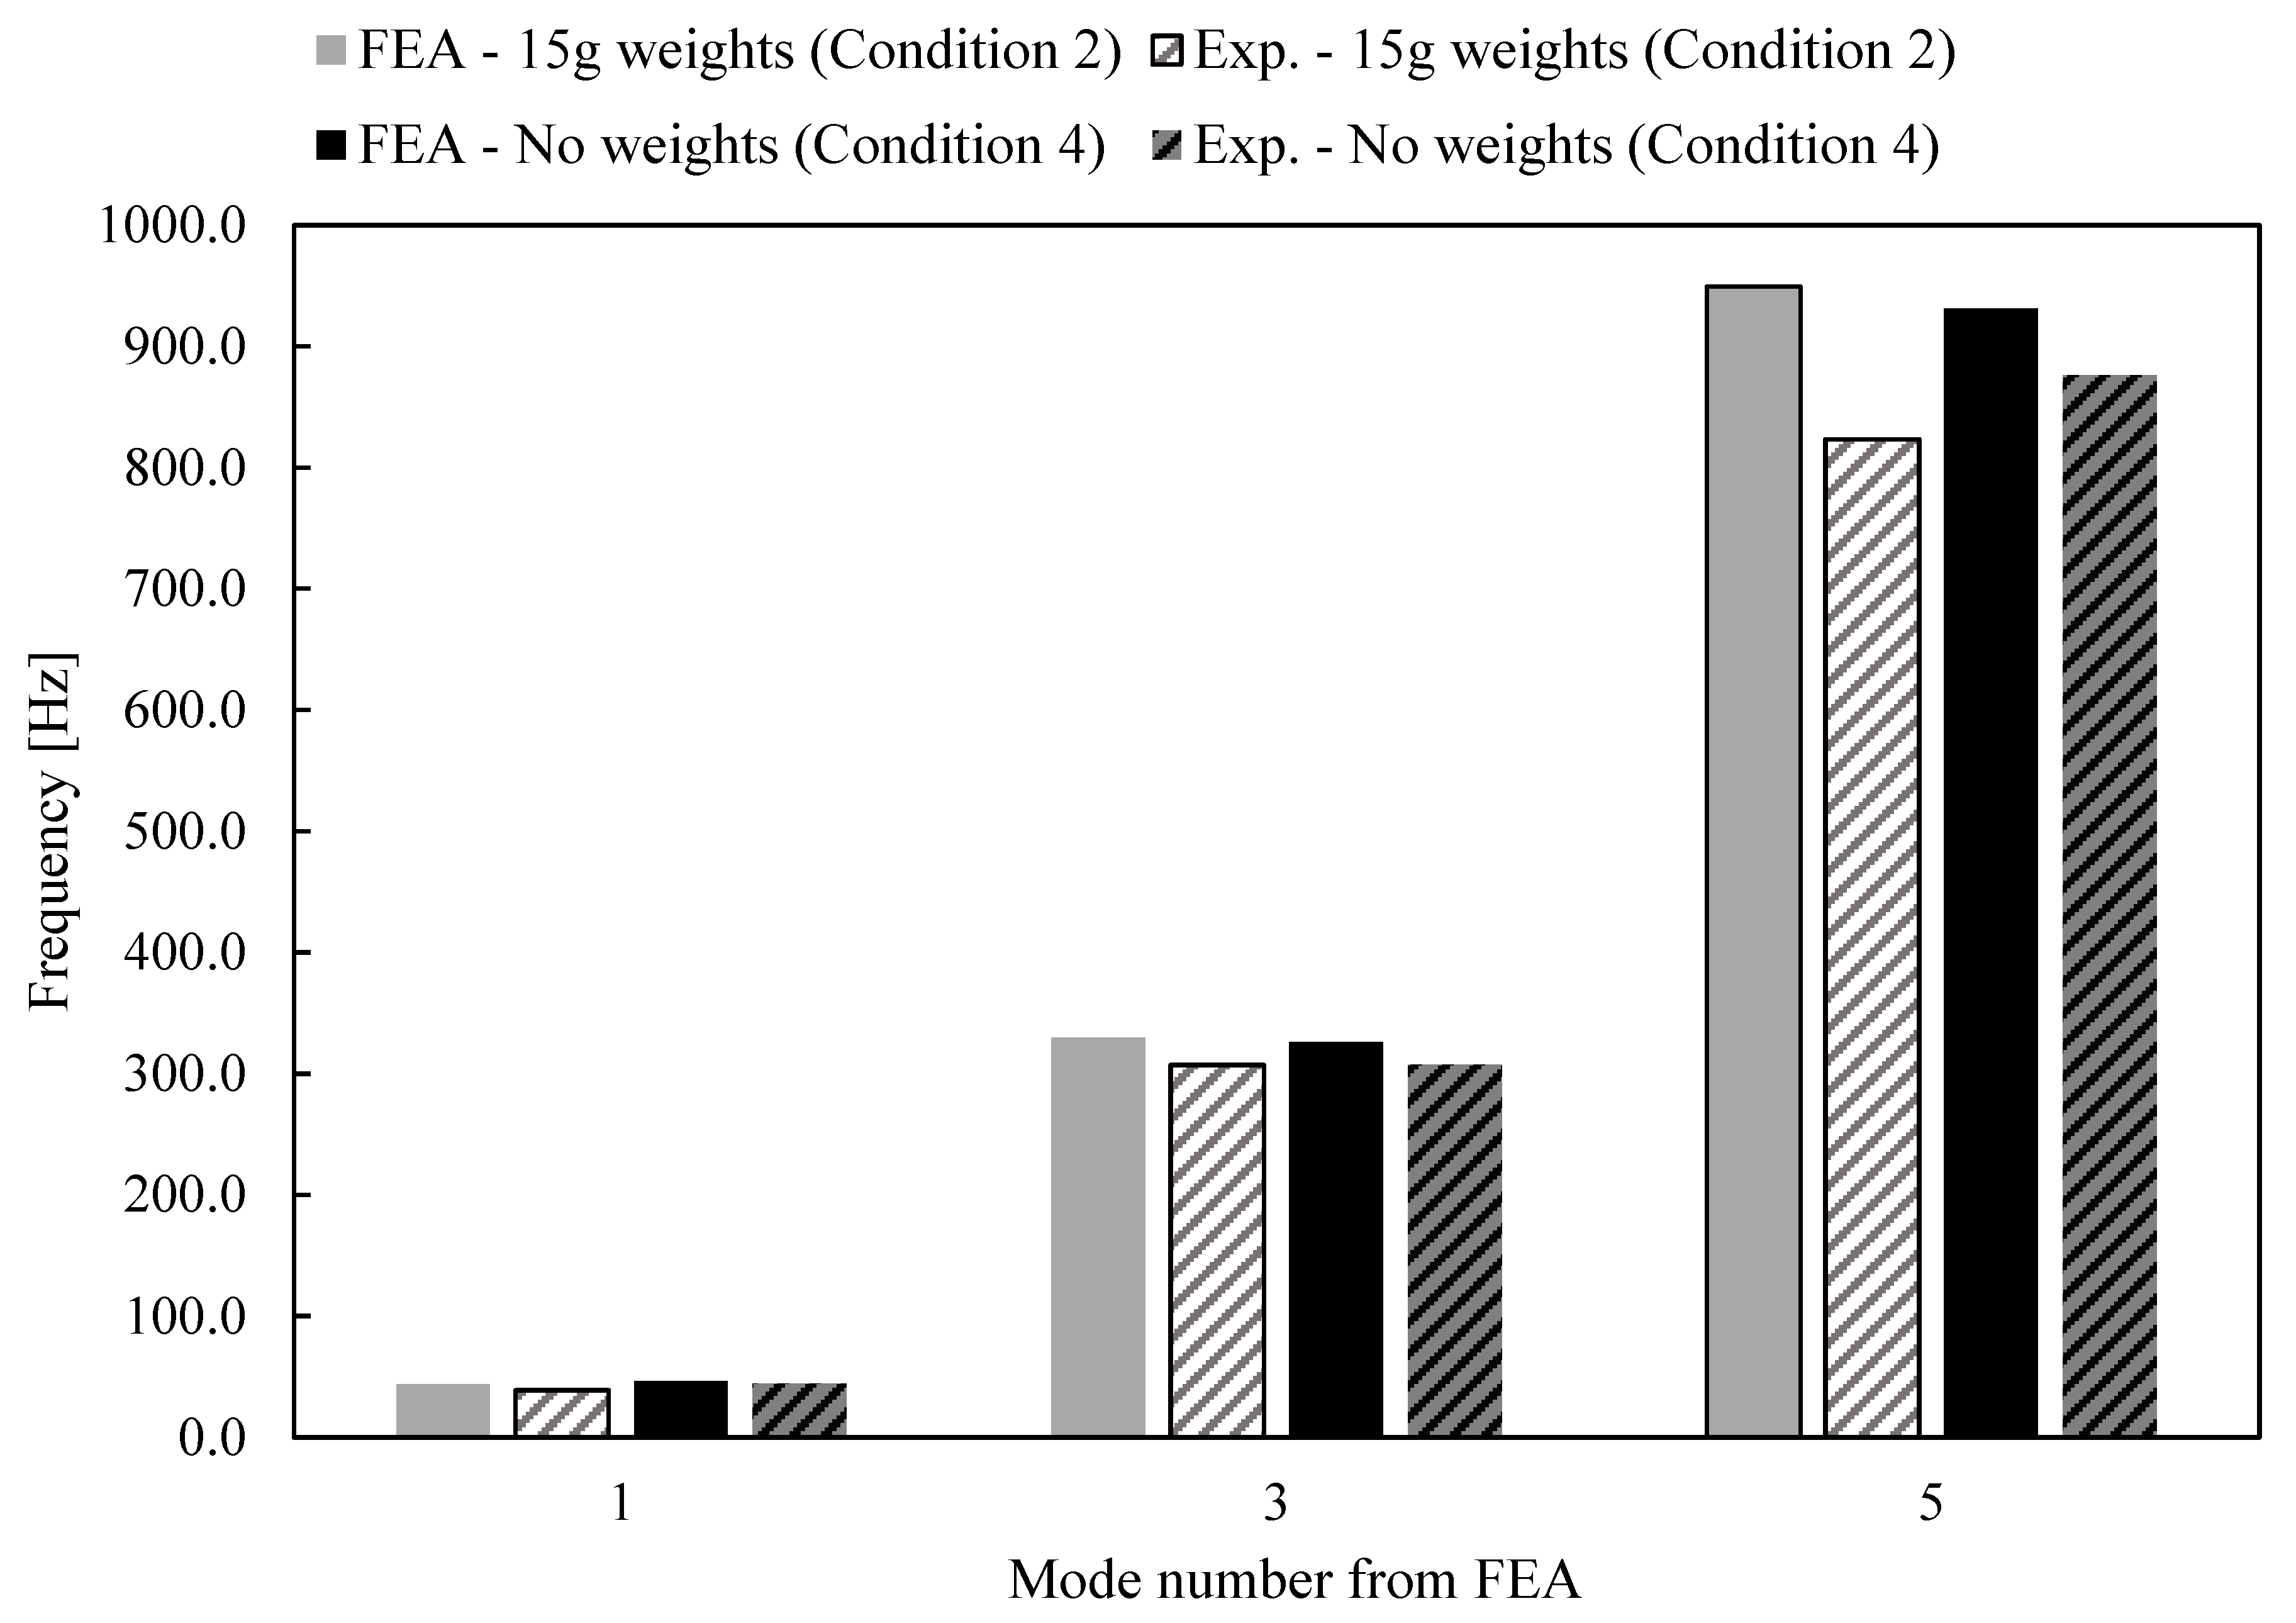
Figure 10 represents a comparison between the natural frequencies determined by FEA modal analysis and those from the impact vibration test conducted under fixed-free conditions, where the beam is fixed at one end. Similar to the free-free vibration test, three modes in the vertical direction are identified for the fixed-free vibration conditions. The simulation of the beam with a length of 300 mm without weights shows a better correlation with the experiment, where there is 5.3% relative difference for the first frequency, 6.0% for the second frequency and 6.3% for the third frequency. However, the experiment of Condition 2 has relative differences with FEA results that are larger: 13.4% for the first frequency and 15.3% for the third frequency. These discrepancies can be caused by imperfect correlations between the experimental model and the FEA model, such as the bonding between the weight and the beam, the attachment method of the accelerometer, and the fixed connection between the beam and the platform. Additionally, unpredictable environmental factors, such as noise and nearby activities during the experiment, can further contribute to the differences between the experimental results and numerical FEA results. Nevertheless, the remaining relative differences are under 10% and are considered acceptable. Overall, the numerical modal analysis shows a good correlation with the impact vibration tests.

3.2. Excavator Bucket

3.2.1. Modal Analysis

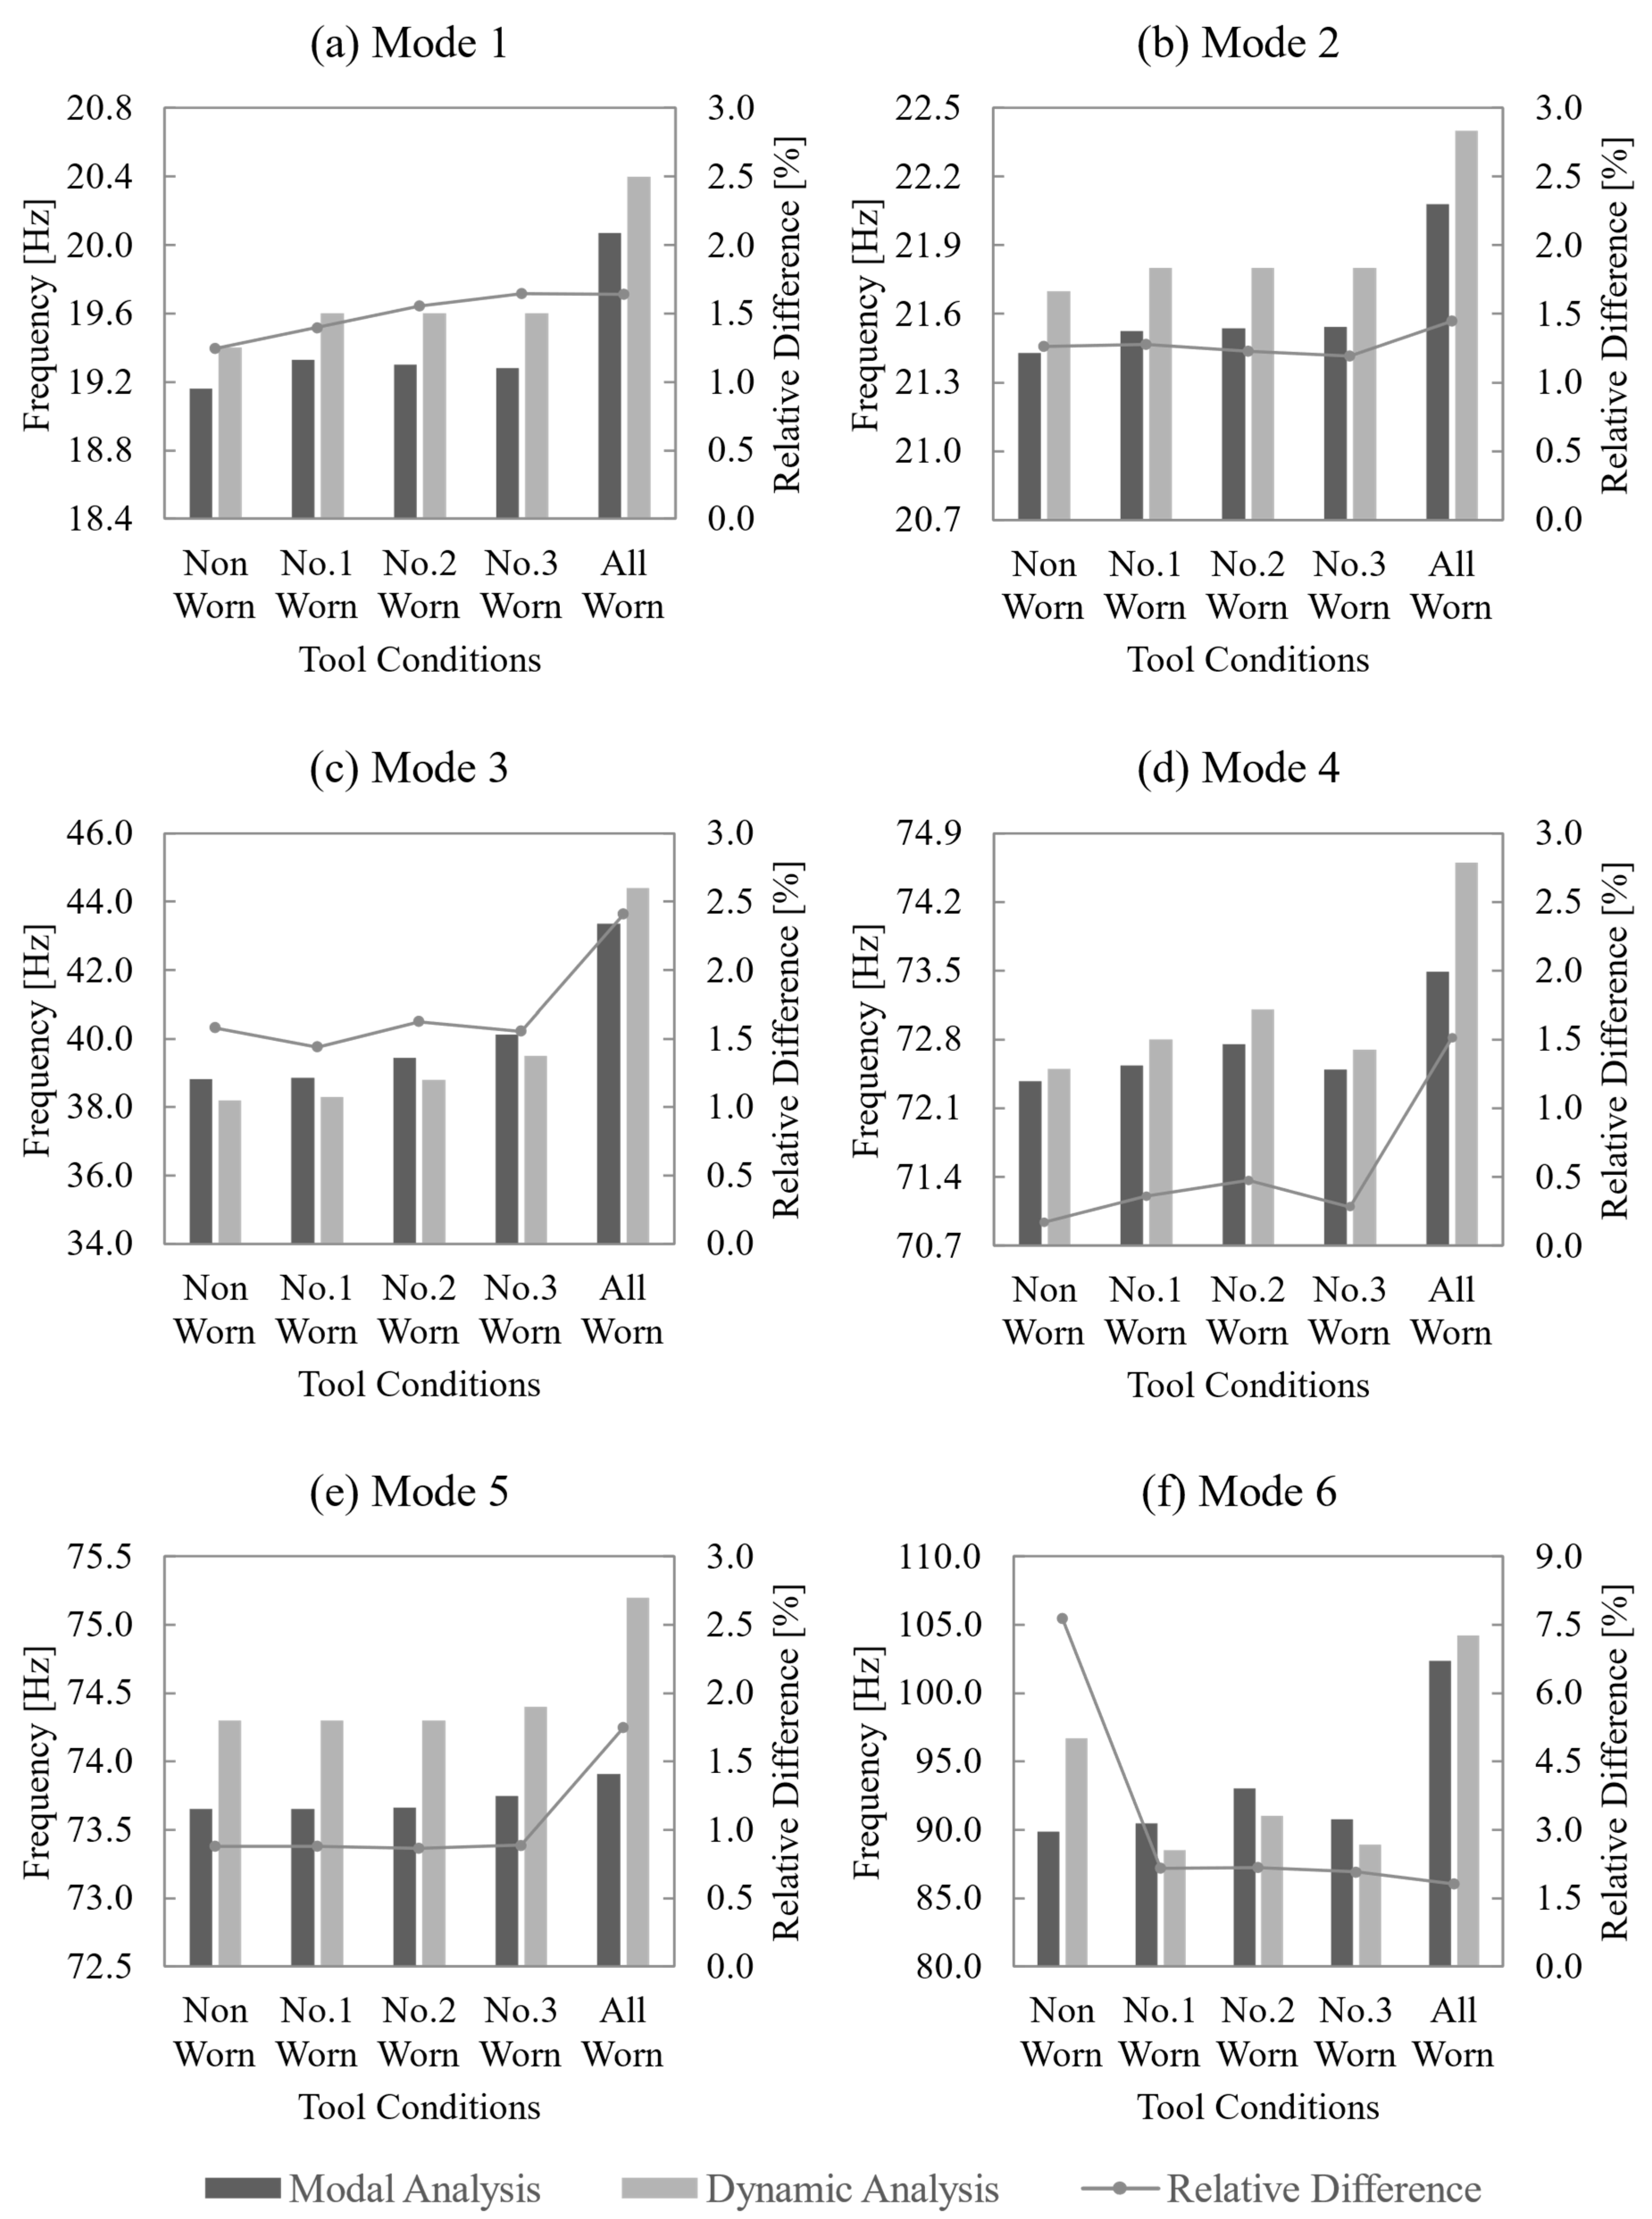
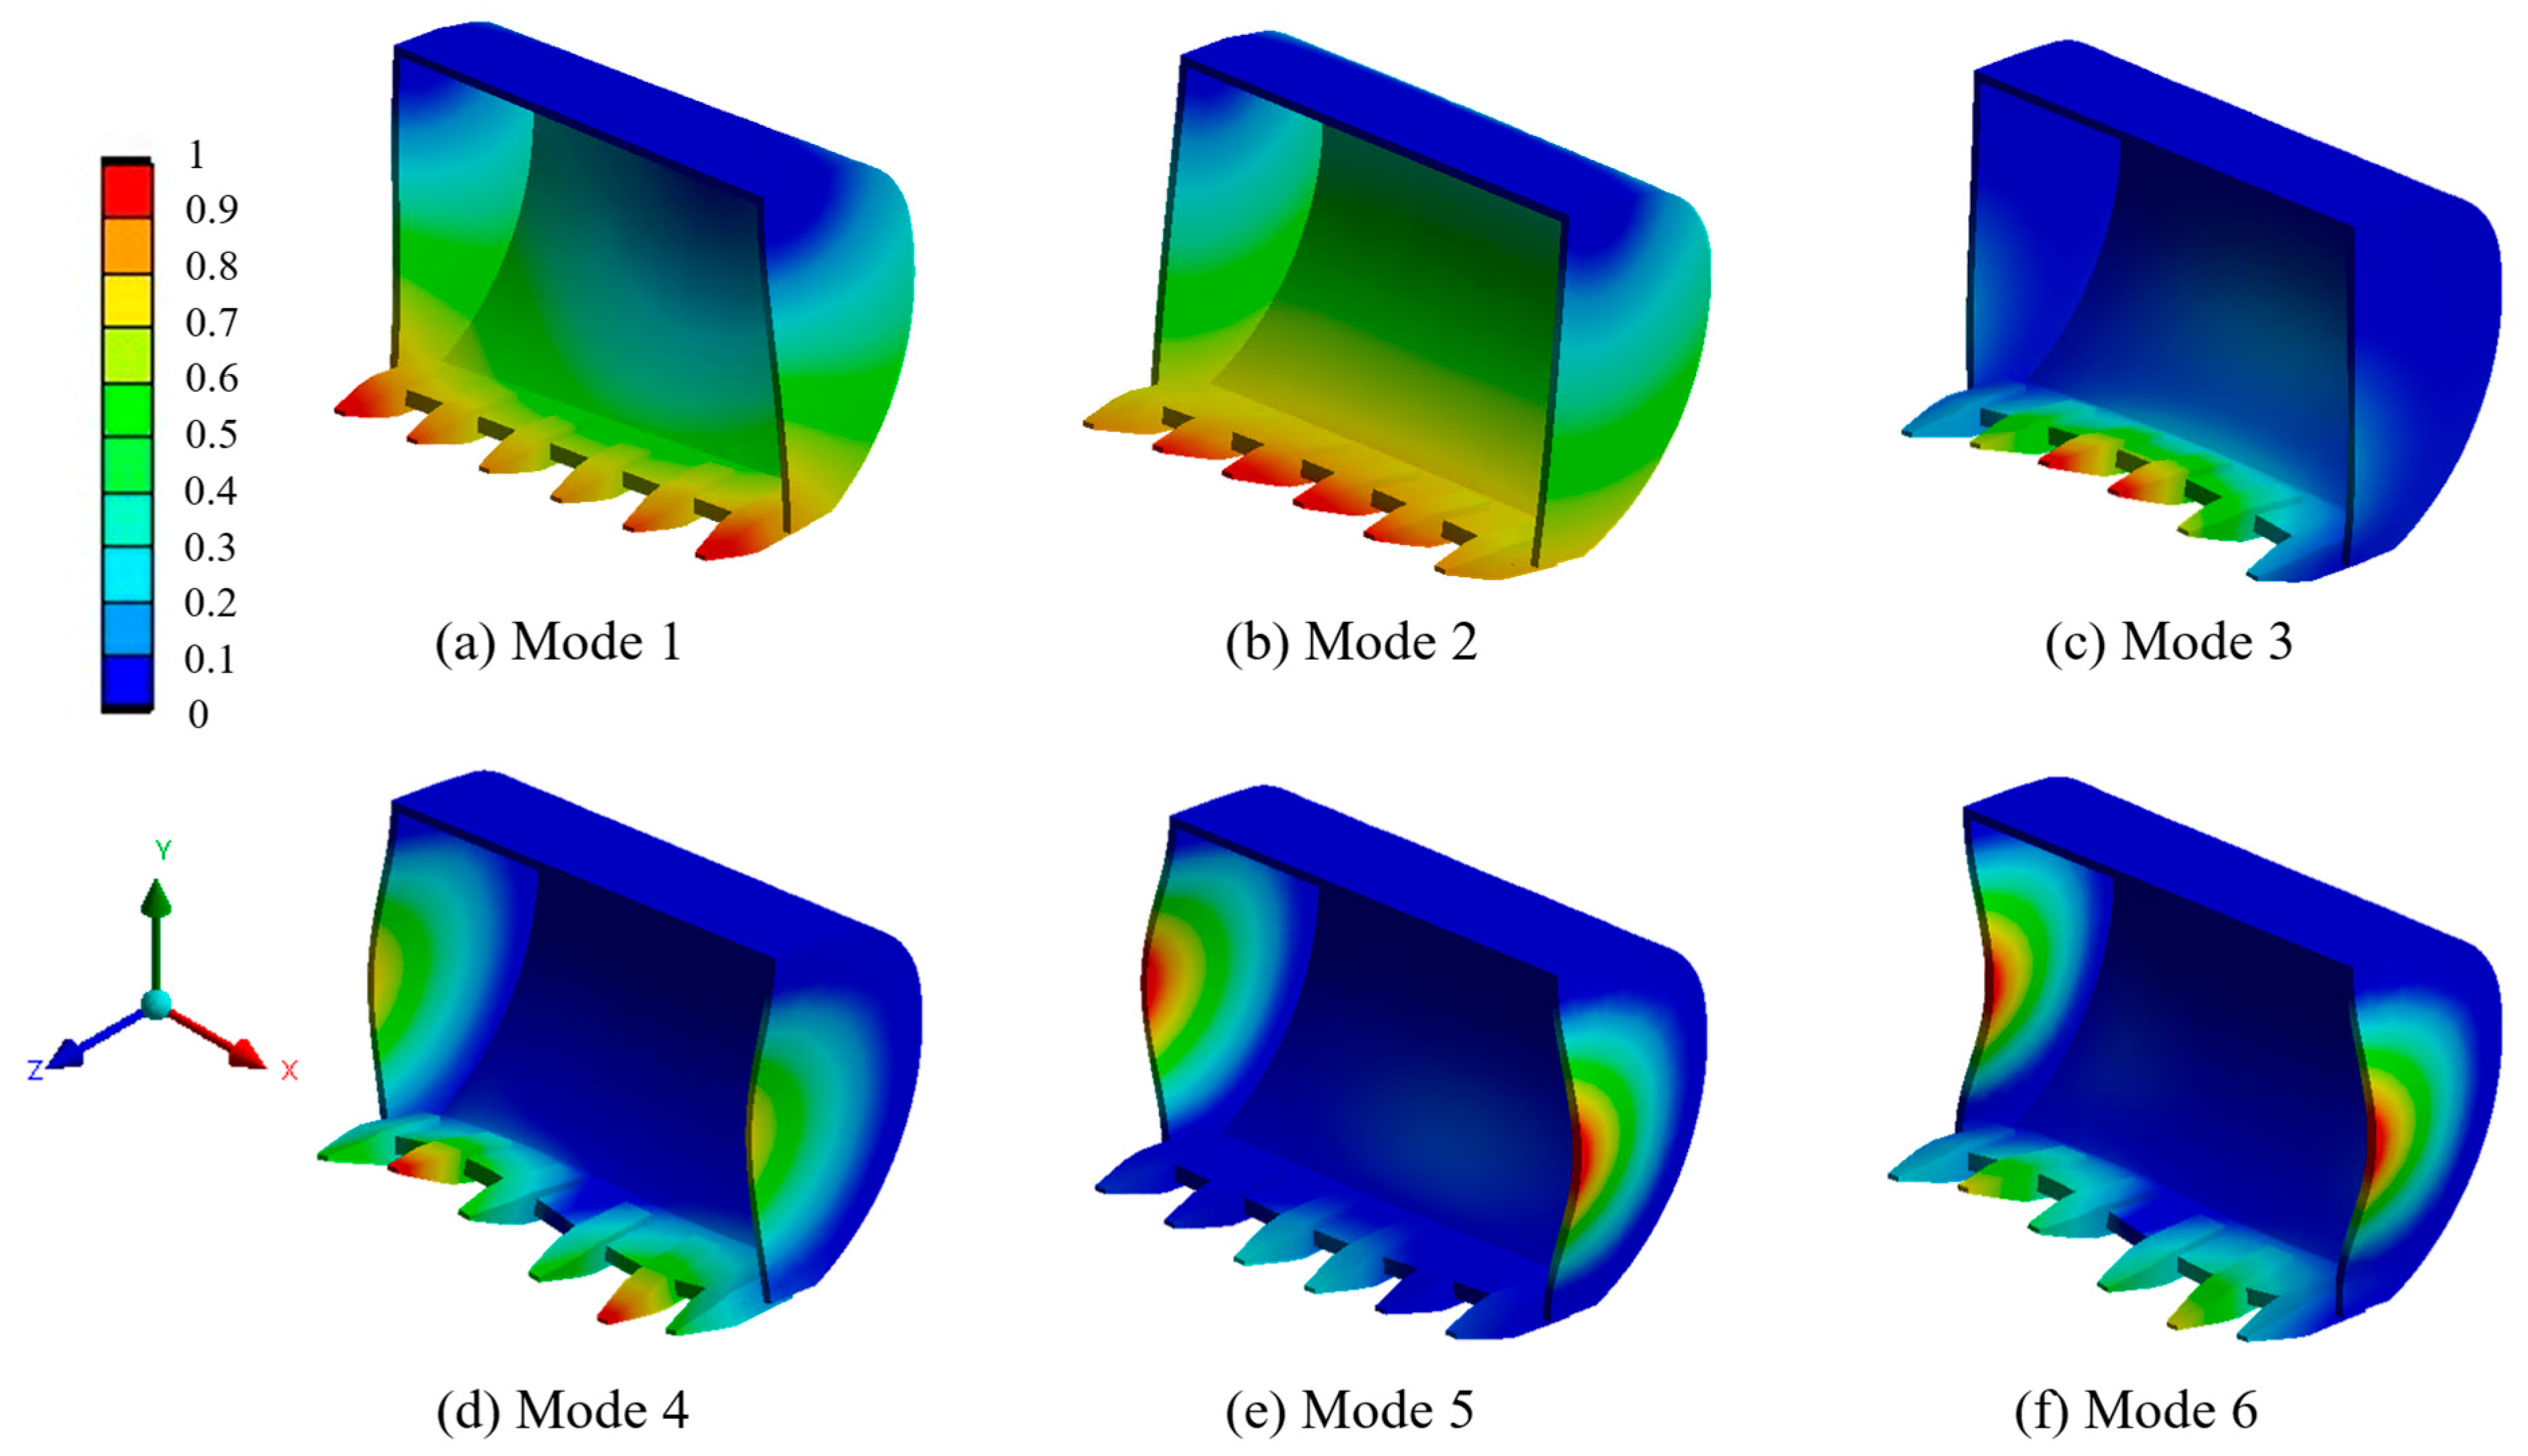
In this section, the simulation results of the pre-stressed modal analysis of the simplified excavator bucket are discussed. The natural frequencies for all cases in the first six modes are presented in Figure 11. The patterns of the natural frequency for each mode can be observed. The natural frequency changes when there is mass loss on the tooth. Due to the symmetric geometry of the excavator bucket, the frequencies for cases with tooth at positions No. 4, 5, and 6 fully worn are identical to those at positions No. 3, 2, and 1, respectively. Therefore, these results are omitted in Figure 11. Figure 12 shows the first 6 mode shapes of the intact bucket. The first six mode shapes of the worn cases are identical to those of the intact case according to the MAC (modal assurance criterion) plots in Appendix B (Figure A2). Hence, the mode shapes for the worn cases can be seen in Figure 12. The mode shapes indicate that mode 1 deforms mainly around the lower half of the bucket in the left-right direction, mode 2 involves more deformation in the front-back direction, and mode 3 shows deformation concentrated on the bucket lip and teeth. Modes 4, 5, and 6 exhibit deformation of the bucket walls along with the lip and teeth in various patterns.
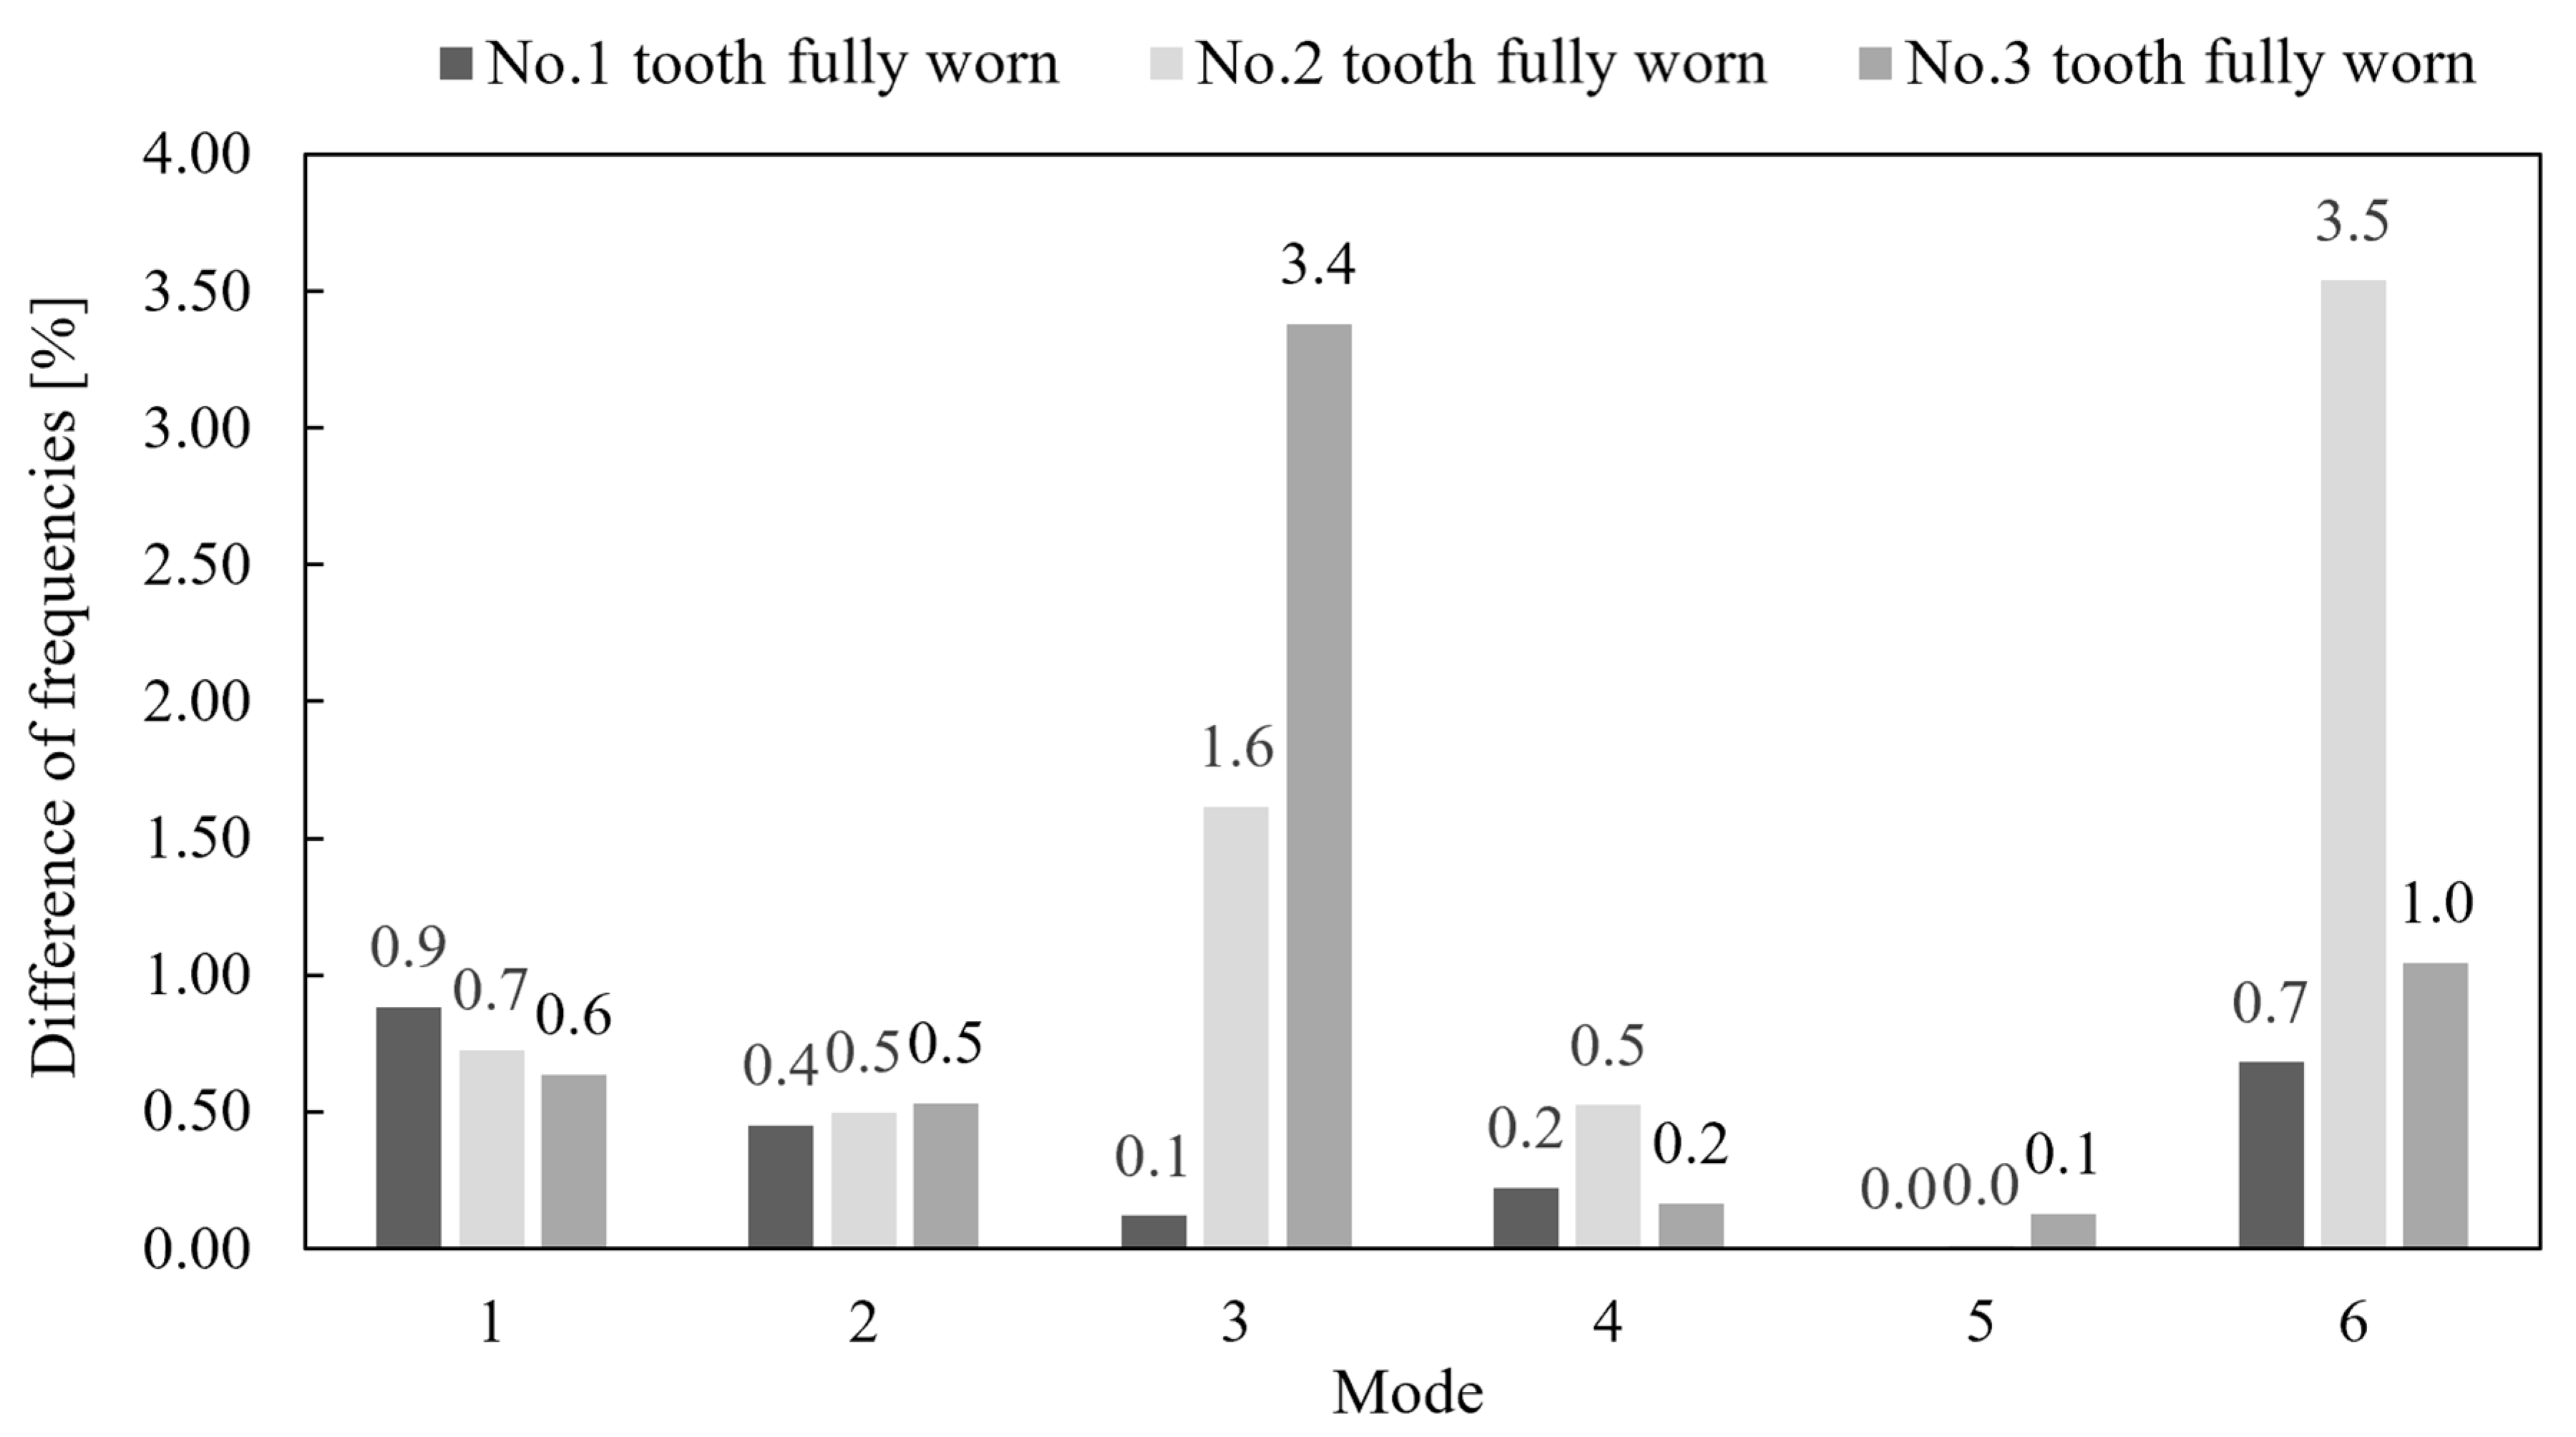
The variations in the first six natural frequencies for different worn-tooth locations, compared to the intact condition, are presented in Figure 13. Different natural frequency modes show different behaviours to the mass loss at the specific locations. For example, mode 1 is more sensitive to the mass loss at side locations (i.e., tooth fully worn at positions No. 1 and No. 6). Mode 3 shows obvious change with the mass loss in the middle (positions No. 3 and 4), while Mode 6 is the most sensitive to the mass loss at positions No. 2 and No. 5. These conclusions can be correlated to the mode shapes in Figure 12, which shows that the modes that have the largest deformation at the locations of the different tooth positions, are most sensitive to mass loss at those locations. For example, mode 1 in Figure 12 has the largest deformation at tooth positions No. 1 and No. 6, which correlates to the change in natural frequency for mode 1 being most sensitive to mass loss for tooth positions No. 1 and 6 (see Figure 13).
Focusing on mode 3, where the deformation is concentrated around the middle tooth area, Table 4 shows the highest natural frequency increases by 3.4% compared to the intact case, for the case where tooth No. 3 is fully worn (or No. 4 due to symmetry). For the scenario where all teeth are fully worn, the natural frequency increased by 11.7%.
In the absence of full-scale experimental data for the bucket structure in this paper, the standard deviation (SD) from repeated cantilever beam tests was used to estimate the system’s measurement resolution. A 2σ threshold, which is commonly utilised to represent the 95% confidence range, indicates that frequency shifts smaller than twice the SD are likely to be indistinguishable from measurement errors [39]. From the cantilever beam tests, the SD was approximately 0.3 Hz, resulting in a 2σ threshold of 0.6 Hz. Therefore, frequency shifts smaller than this may be unable to be distinguished from environmental or operational noise by this system, such as the 0.1 Hz shift observed in the No. 1 tooth fully worn case. Nevertheless, more obvious frequency shifts observed in other scenarios are above the estimated resolution threshold and can be detected.
Furthermore, the simulations presented in this paper primarily focus on cases where a single tooth is fully worn at various locations. However, in actual operations, all teeth undergo wear, with more severe wear typically occurring on the side teeth. Therefore, the measurable change in natural frequency under field conditions is expected to be more pronounced than that observed in the individual tooth wear cases. This is supported by the result for the all teeth fully worn scenario, in which mode 3 exhibits a 11.7% increase in natural frequency.

3.2.2. Dynamic Analysis

The results of the dynamic analysis are presented in this section. The first six frequencies obtained from the FFT plots for different tooth conditions are listed and compared with the modal analysis results in Figure 11. It is evident that the trends of frequencies match those observed in the modal analysis. The natural frequencies of the cases with any worn condition are higher than that of the intact status.
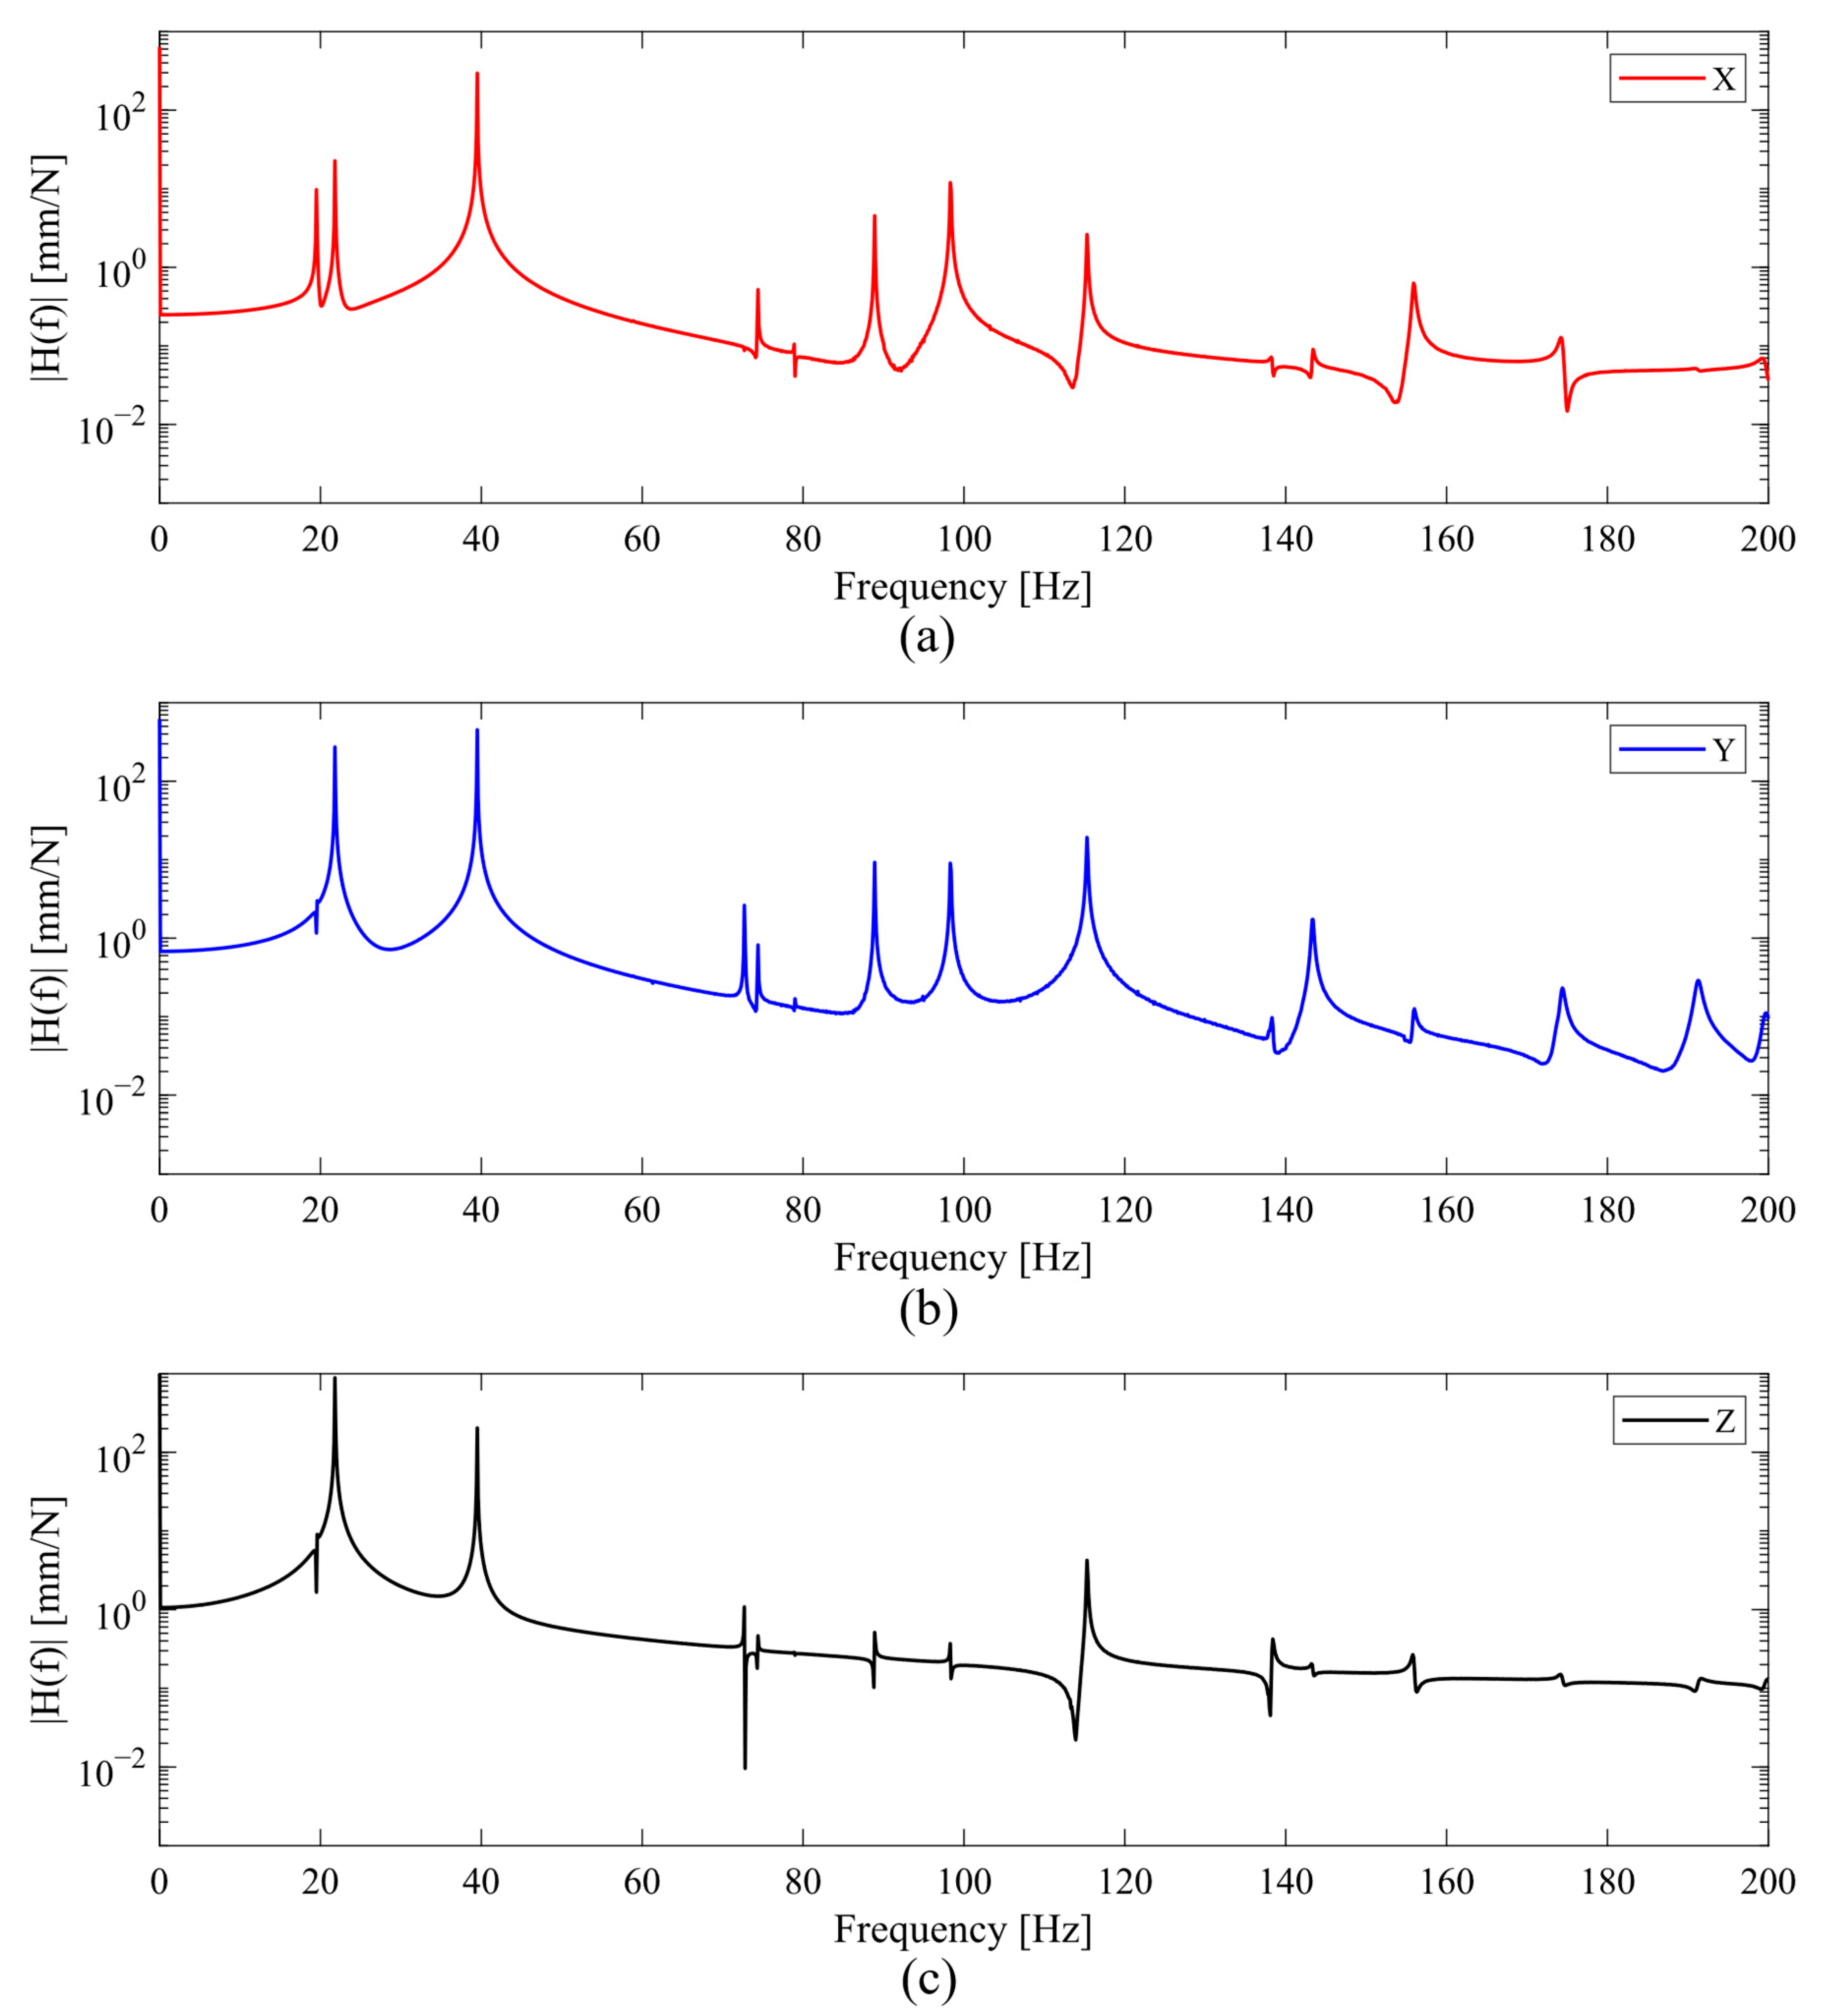
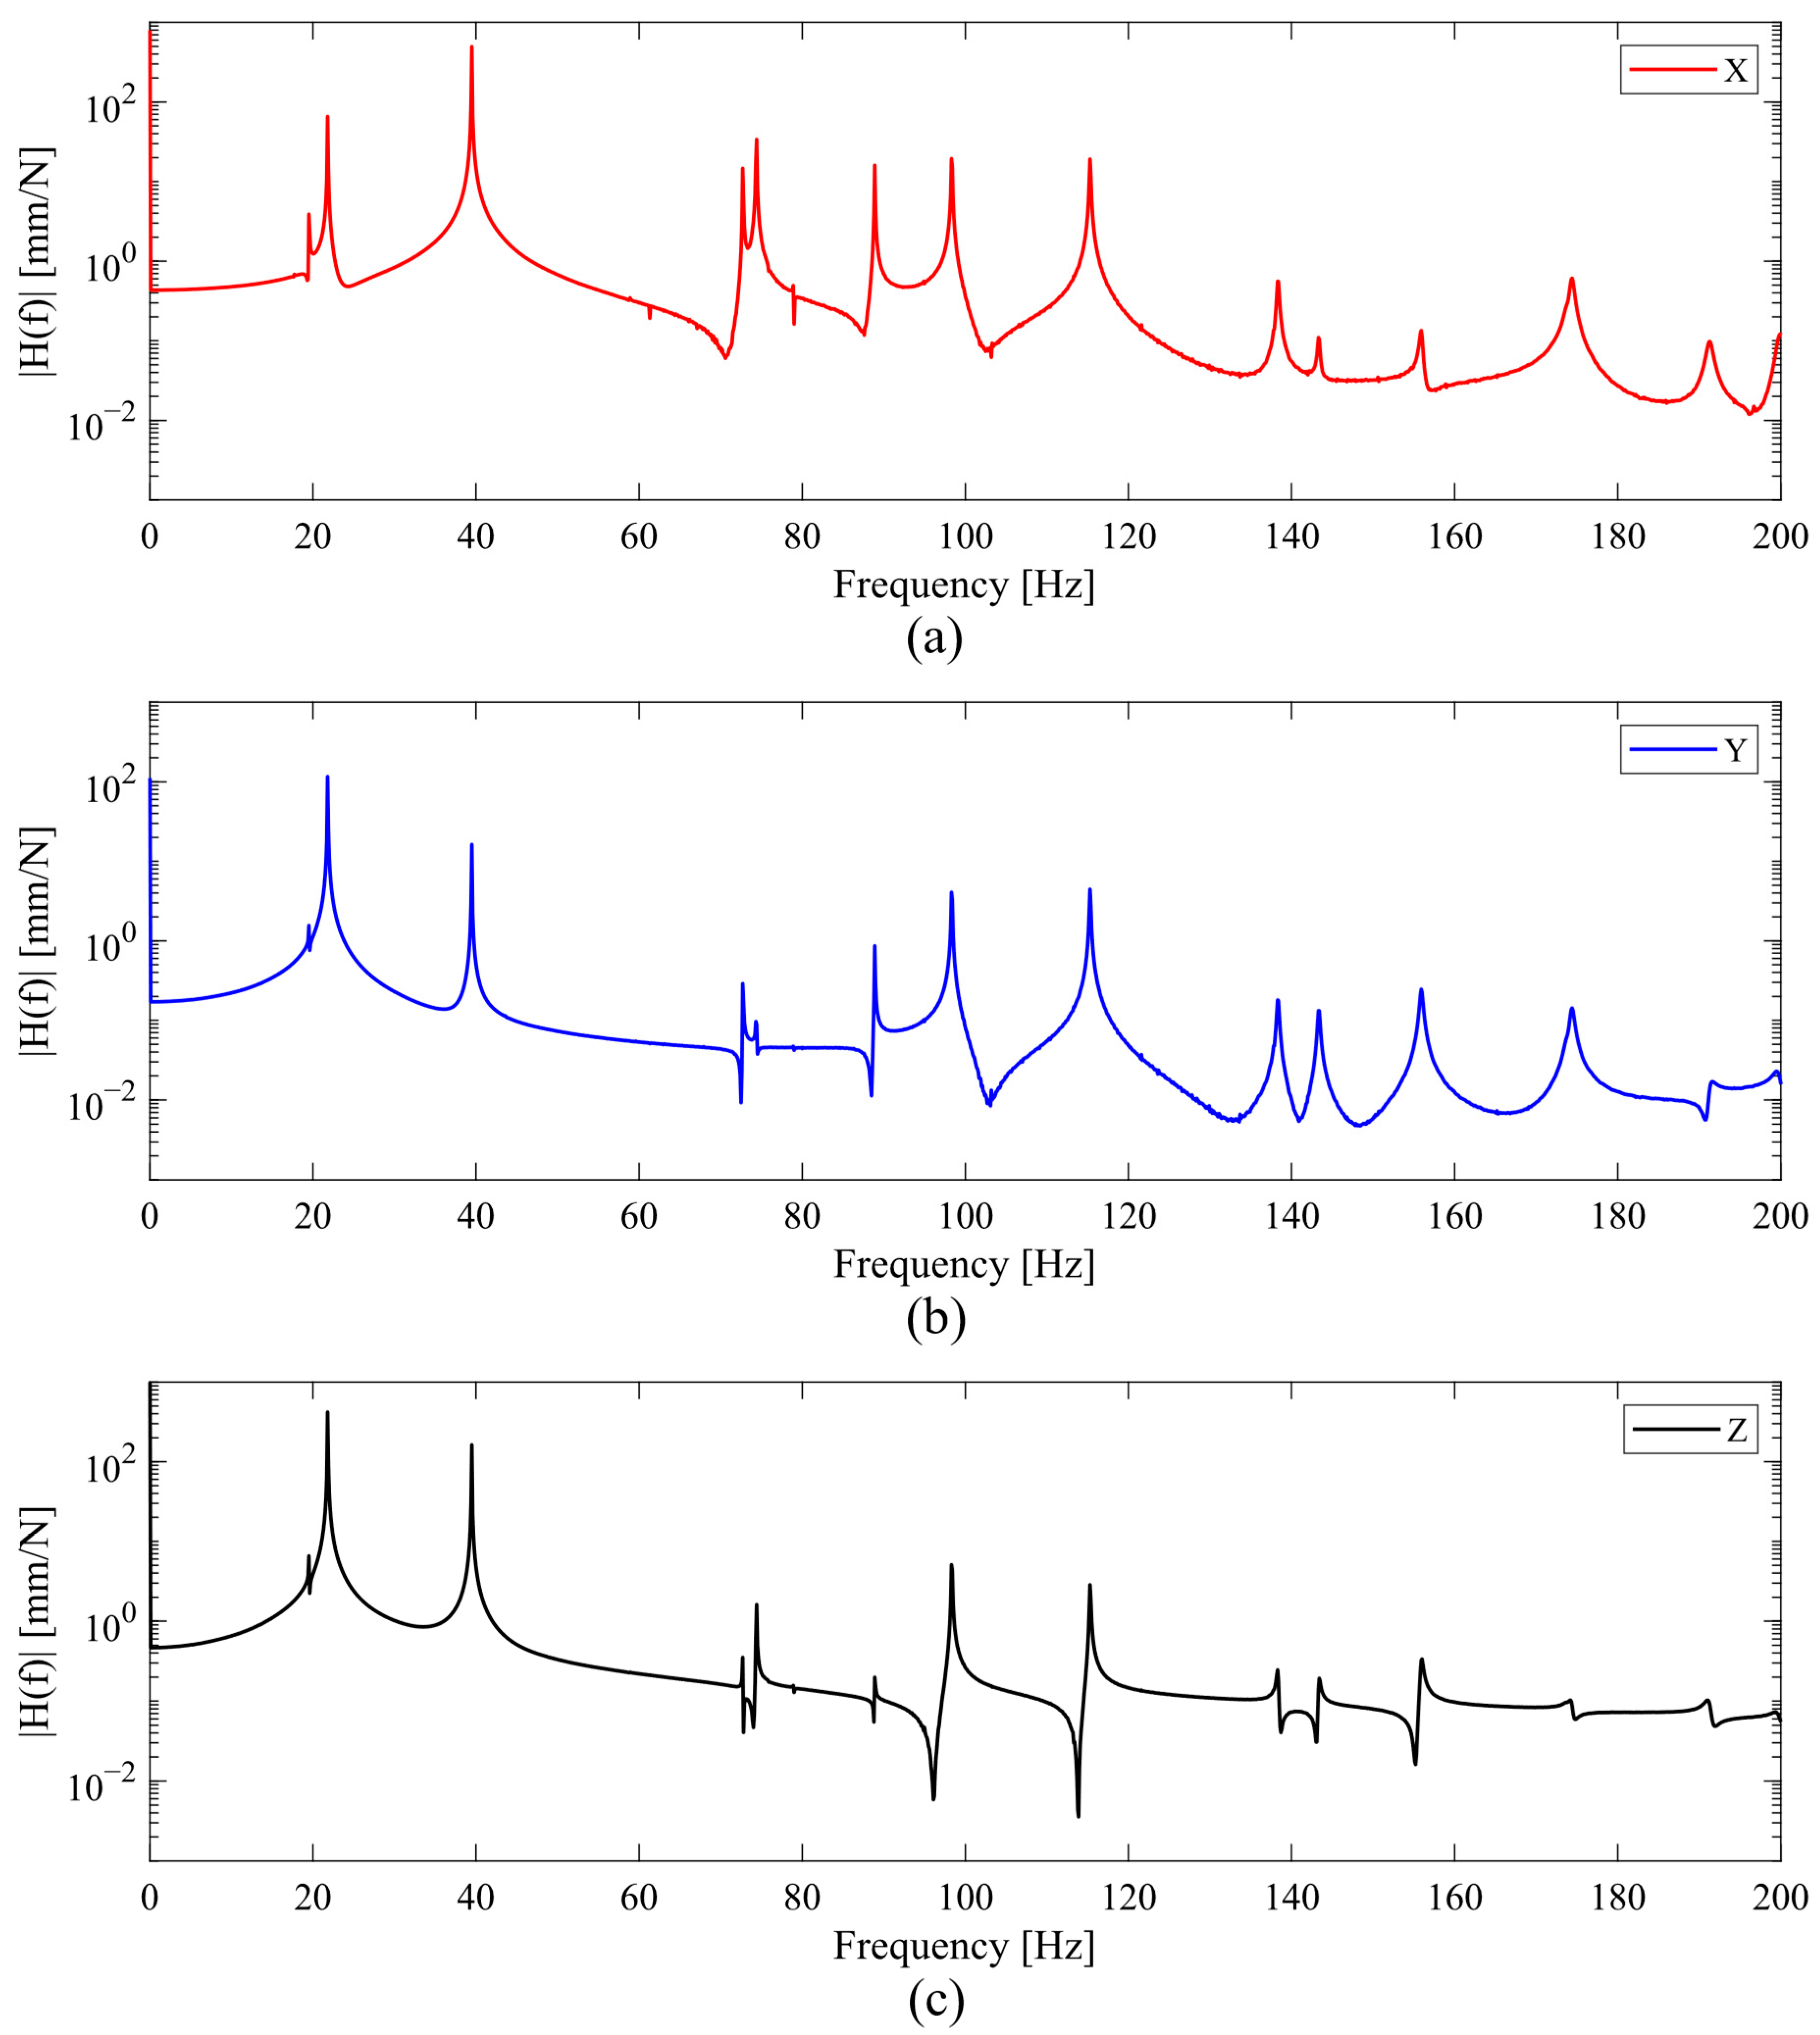
The relative differences between the frequencies identified from modal analysis and dynamic analysis are small. The minimum and maximum relative differences are 0.2% and 7.6%, respectively, for the fourth and sixth natural frequencies of the intact condition. These minor differences indicate a good correlation between the FEA modal analysis and FEA dynamic analysis. Since the dynamic analysis numerically simulates the dynamic response of the system with specific impulse and sensing locations, it provides a guideline for conducting vibration experiments on the excavator bucket to identify changes in natural frequencies, detecting the change in tool conditions. Table 5 summarises the details of the locations and orientations of the probes on the bucket that can capture distinct natural frequencies in the dynamic analysis simulations. To further clarify this, Figure 14 and Figure 15 present example FRF plots from two representative probe locations. It is evident that the sensor location and orientation significantly influence which natural frequencies are detectable. For a sensor positioned on tooth No. 1 (probe A in Figure 7), as shown in Figure 14, only aligning the sensor in the x-axis can capture the 1st frequency (19.5 Hz), while aligning in the y- and z-axis cannot. However, alignment of the sensor in the x-axis cannot capture the 4th frequency (72.7 Hz), while the other orientations can. Additionally, by comparing the sensor at different positions (comparing Figure 14 and Figure 15), it is evident that frequencies with different amplitudes are output. This can be explained by the mode shapes, as shown in Figure 12, that a specific mode frequency can be captured only when the location deforms in that mode. Therefore, it can be concluded that optimal sensor placements should exhibit deformation across multiple modes, which can be determined by the dynamic FEA. Additionally, utilising sensors at multiple locations can capture a wider range of modes of interests.
Based on this, it is observed that the dynamic analysis simulations can have the following advantages:
(1)
Allows the prediction of dynamic response behaviours of the system under specific impact magnitudes and locations, which is useful for designing the experimental verification.
(2)
Can be used to evaluate optimal sensor locations to capture maximum signal, which can be achieved by analysing the amplitude in the FFT plots.
(3)
Can assist the choice of sensor placement to capture frequencies of targeted modes. The locations and orientations of the sensors can be informed by dynamic analysis and mode shapes in the modal analysis.

4. Conclusions

This paper proposes a method for monitoring the conditions of GETs on mining machinery by measuring the changes in natural frequencies. The effectiveness of this method was investigated through studies on a cantilever beam and an industrial excavator bucket. The main findings are summarised as follows:
(1)
Numerical modal analysis for the cantilever beam specimen proves that natural frequencies change with mass loss, specifically increasing as the mass loss increases. The vibration tests with an impact hammer verify the numerical predictions with acceptable differences, also demonstrating the ability for such changes in modal frequencies to be measured.
(2)
For the industrial excavator bucket scenario, the natural frequency changes as the conditions of the GETs vary. The maximum increase in natural frequency observed was 13.9% at mode 6, for the scenario when all teeth are fully worn to the non-worn/intact condition. The patterns of the frequency changes for the worn teeth at different positions were observed in this paper.
(3)
For the finite element model predictions, the dynamic analysis results closely align with the modal analysis results, with minimal differences. This consistency builds confidence in assessing tool conditions by experimental measurements of natural frequencies, while also guiding the design of impact and sensor locations and orientations for experimental verification.
While the effectiveness of the proposed method for the excavator bucket has been demonstrated through numerical analysis, several limitations remain. The current study assumes linear structural behaviour and does not account for environmental noise, temperature variations, or residual material in the bucket, all of which may affect frequency measurements under operational conditions. Additionally, the method has not yet been experimentally validated on a full-scale excavator bucket in the field.
It should also be noted that the present models represent severe wear scenarios, where a single tooth is fully worn and all teeth are fully worn. These cases serve to establish the bounds of frequency variation but do not capture the progressive wear that typically occurs in real operations. Future work will therefore focus on more realistic wear modelling, including progressive wear scenarios, combinations of partially worn teeth, and sensitivity analysis to identify the most responsive parameters to different wear patterns and locations.
From a practical deployment perspective, future studies will include experimental validation under realistic mining conditions. This will incorporate a sensor optimisation strategy for robust installation on bucket structures. Reliable wireless data acquisition systems will be developed to withstand harsh environments. Real-time signal processing and machine learning-based analysis will be explored. These enhancements aim to enable both accurate diagnosis and predictive assessment of wear progression. Ultimately, this will support proactive maintenance planning, minimise downtime, and improve operational efficiency and safety.

Author Contributions

Conceptualization, M.P.P., B.F.R. and S.C.; methodology, S.C. and M.P.P.; software, S.C.; validation, S.C.; formal analysis, S.C.; investigation, S.C.; resources, M.P.P., J.G. and A.D.C.; data curation, S.C.; writing—original draft preparation, S.C.; writing—review and editing, M.P.P., B.F.R., J.G., A.D.C., P.L. and S.C.; visualization, S.C.; supervision, M.P.P., B.F.R. and J.G.; project administration, M.P.P.; funding acquisition, M.P.P. and B.F.R. All authors have read and agreed to the published version of the manuscript.

Funding

This research reveived no external funding.

Institutional Review Board Statement

Not applicable.

Informed Consent Statement

Not applicable.

Data Availability Statement

The original contributions presented in this study are included in the article. Further inquiries can be directed to the corresponding author.

Conflicts of Interest

The authors declare no conflict of interest.

Appendix A. Mesh Convergence Analysis

The mesh size was investigated through the mesh convergence analysis, which defines the appropriate mesh size for accurate results and shorter computation time. The mesh size was tested from 250 mm to 10 mm. Figure A1 shows the variation of the first three frequencies of the intact case with respect to the number of nodes (corresponding to the mesh size). It is evident that the frequencies convergence as the mesh size decreases. Additionally, the mesh quality metrics provide another criterion for evaluating the mesh. A mesh quality value of close to 1 indicates high quality mesh elements. For instance, with a coarse mesh size of 225 mm, half of the mesh elements on the bucket have mesh quality values significantly less than 1, resulting in a frequency result that is not close to the converged value. As the mesh improves with a finer mesh size, more elements approach a quality value of 1, and the simulation output reaches convergence. Using a 10 mm mesh size with 3,503,882 nodes can obtain the most converged result. However, since the number of nodes is 13 times more, the calculation time increases dramatically compared to the 30 mm mesh size with 265,717 nodes. In addition, the predicted first, second, and third natural frequencies using a 30 mm mesh size only show a 0.6% relative difference compared to those obtained with a 10 mm mesh size. Considering this, 30 mm was selected to be the mesh size for the FEA model.
Figure A1. FEA predicted frequencies with respect to the number of mesh nodes (mesh size dependent)—intact case: (a) mode 1 frequency, (b) mode 2 frequency, (c) mode 3 frequency.
Eng 06 00220 g0a1

Appendix B. MAC of the Bucket Under Different Conditions
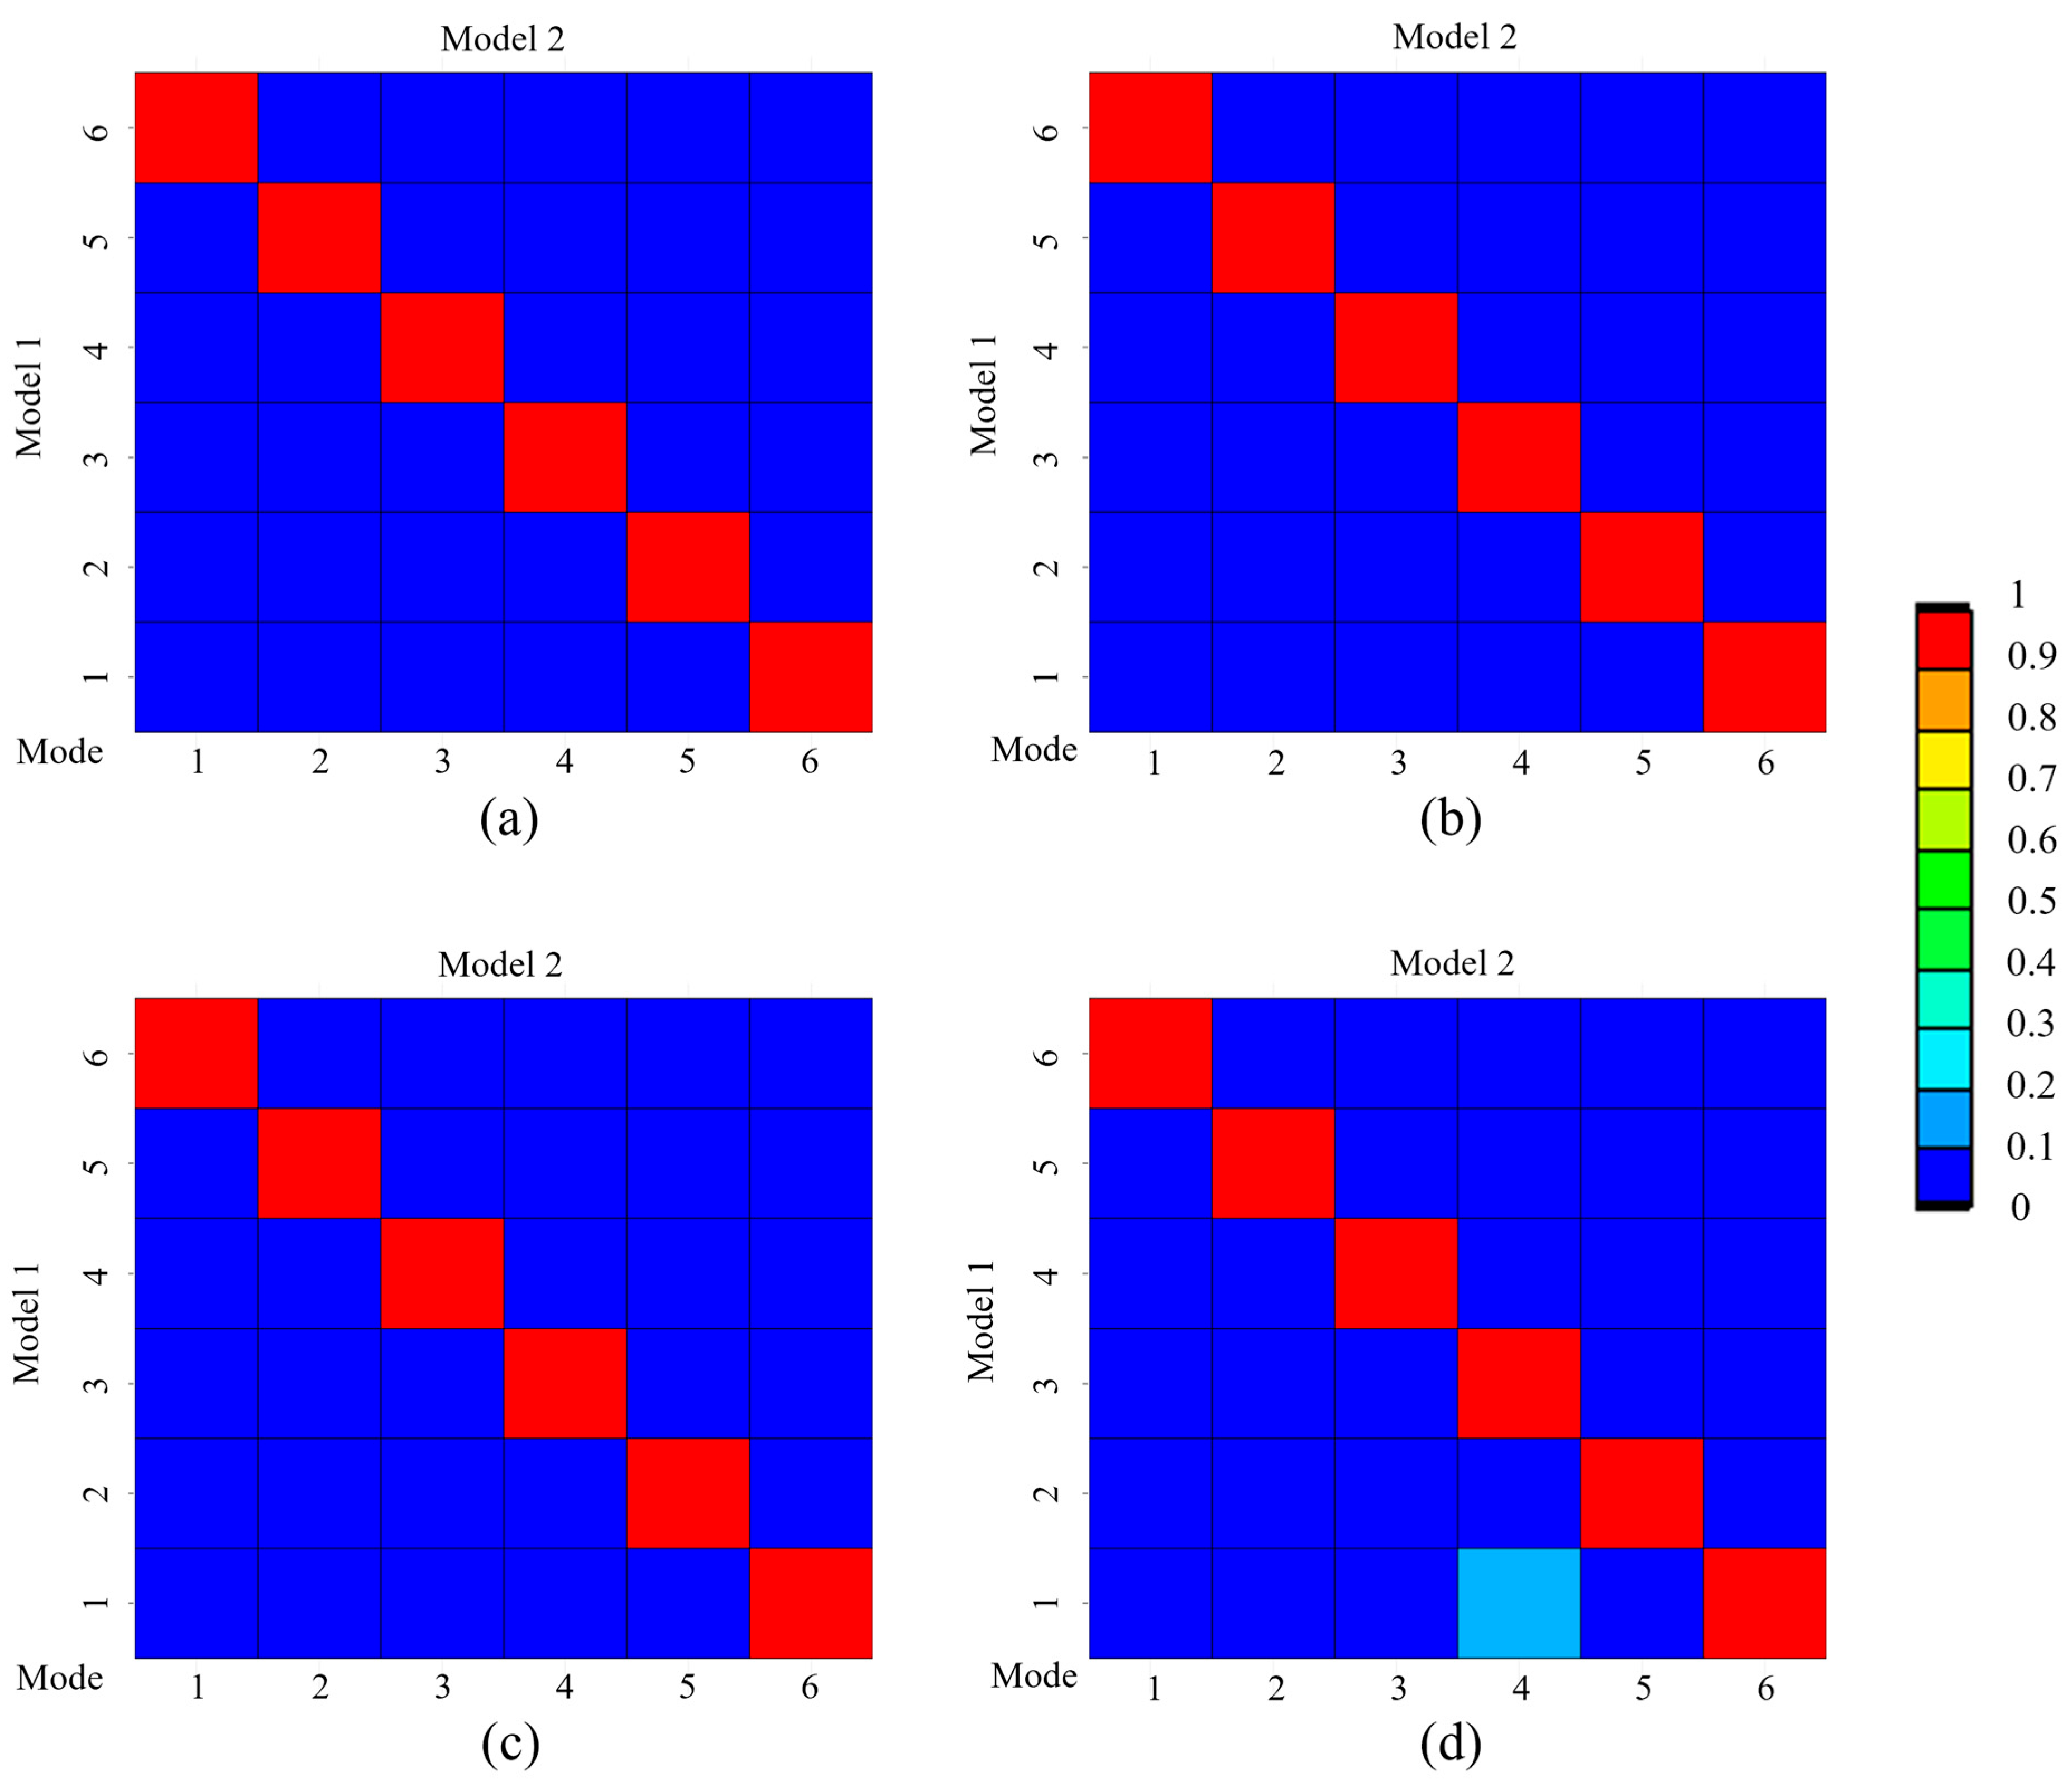
Figure A2. MAC plots of the bucket under different wear conditions. Model 1: (a) No. 1 tooth fully worn, (b) No. 2 tooth fully worn, (c) No. 3 tooth fully worn, (d) all teeth fully worn. Model 2: Non-worn tooth.
Eng 06 00220 g0a2

References

  1. Holmberg, K.; Kivikytö-Reponen, P.; Härkisaari, P.; Valtonen, K.; Erdemir, A. Global energy consumption due to friction and wear in the mining industry. Tribol. Int. 2017, 115, 116–139. [Google Scholar] [CrossRef]
  2. Ibrahim, M.A.; Hassan, G.; Hassanein, H.S.; Obaia, K. Wireless Sensing for Ground Engaging Tools. In Proceedings of the GLOBECOM 2020—2020 IEEE Global Communications Conference, Taipei, Taiwan, 7–11 December 2020; pp. 1–6. [Google Scholar] [CrossRef]
  3. Saha, G. Abrasive Wear of Alloys for Ground Engaging Tools. Ph.D. Thesis, Deakin University, Burwood, VIC, Australia, 2017. [Google Scholar]
  4. Liu, X.; Qi, X.; Jiang, Y. Electric Shovel Teeth Missing Detection Method Based on Deep Learning. Comput. Intell. Neurosci. 2021, 2021, 6503029. [Google Scholar] [CrossRef]
  5. Lu, J.; Liu, Y. A real-time and accurate detection approach for bucket teeth falling off based on improved YOLOX. Mech. Sci. 2022, 13, 979–990. [Google Scholar] [CrossRef]
  6. Rafezi, H.; Hassani, F. Drill bit wear monitoring and failure prediction for mining automation. Int. J. Min. Sci. Technol. 2023, 33, 289–296. [Google Scholar] [CrossRef]
  7. Rafezi, H.; Hassani, F. Drilling signals analysis for tricone bit condition monitoring. Int. J. Min. Sci. Technol. 2021, 31, 187–195. [Google Scholar] [CrossRef]
  8. Radziszewski, P.; Martins, S.; Benson, C. Method and Device for Sensing Wear. US7677079B2, 16 March 2010. Available online: https://patents.google.com/patent/US7677079B2/en (accessed on 27 September 2023).
  9. Nicoson, R.; Popp, J.R.; Schlegel, D.; Pomerenke, K. Methods and Systems for Detecting Heavy Machine Wear. US10024034B2, 17 July 2018. Available online: https://patents.google.com/patent/US10024034B2/en (accessed on 27 September 2023).
  10. Steed, D.J.; Poulsen, S.D. Wear Indication Devices, and Related Assemblies and Methods. US9724697B2, 8 August 2017. Available online: https://patents.google.com/patent/US9724697B2/en (accessed on 27 September 2023).
  11. Davies, B. Wear Sensor. 20120043980, 23 February 2012. Available online: https://www.freepatentsonline.com/y2012/0043980.html (accessed on 27 September 2023).
  12. Motion Metrics® ShovelMetricsTM | Weir, (n.d.). Available online: https://www.global.weir/product-catalogue/motion-metrics-shovelmetrics/ (accessed on 27 September 2023).
  13. Finley, T.M.; Carpenter, C.M.; Wilkinson, E.E. Ground Engaging Tool Management. 20170352199, 7 December 2017. Available online: https://www.freepatentsonline.com/y2017/0352199.html (accessed on 27 September 2023).
  14. Ridley, R.K.; Kazmierczak, T.; Cai, L.; Johnston, P.C.; Pinto, H.; Sun, J.; Provencher, M.; Woolley, J.H.; Cardinal, G. System and a Method for Detecting a Damaged or Missing Machine Part. 8411930, 2 April 2013. Available online: https://www.freepatentsonline.com/8411930.html (accessed on 27 September 2023).
  15. Hamilton, I.H. Detection System. 2012. Available online: https://patentscope.wipo.int/search/en/detail.jsf?docId=WO2012116408 (accessed on 27 September 2023).
  16. Darlington, B.; Knowles, B.; Schild, P.; Dallard, B. Attachment Status Monitoring of Ground Engaging Tools (GET) at Heavy Machinery. US11280067B2, 22 March 2022. Available online: https://patents.google.com/patent/US11280067B2/en (accessed on 27 September 2023).
  17. Betournay, J.W.; Carpenter, C.M.; Hyde, S.D.; Lander, J.; Zuendel, K.D. Monitoring Ground-Engaging Products from Earth Working Equipment. AU2020264339B2, 24 March 2022. Available online: https://patents.google.com/patent/AU2020264339B2/en?q=(Monitoring+Gound-Engaging+Products+Earth+Working+Equipment)&oq=Monitoring+Gound-Engaging+Products+for+Earth+Working+Equipment (accessed on 27 September 2023).
  18. Nguyen, Q.-B.; Nguyen, H.-H. An Efficient Approach for Damage Identification of Beams Using Mid-Span Static Deflection Changes. Eng 2024, 5, 895–917. [Google Scholar] [CrossRef]
  19. Iliopoulos, A.; Shirzadeh, R.; Weijtjens, W.; Guillaume, P.; Hemelrijck, D.; Devriendt, C. A modal decomposition and expansion approach for prediction of dynamic responses on a monopile offshore wind turbine using a limited number of vibration sensors. Mech. Syst. Signal Process. 2015, 68, 84–104. [Google Scholar] [CrossRef]
  20. Li, W.; Huang, Y. A method for damage detection of a jacket platform under random wave excitations using cross correlation analysis and PCA-based method. Ocean. Eng. 2020, 214, 107734. [Google Scholar] [CrossRef]
  21. Zhang, K.; Yan, X. Multi-cracks identification method for cantilever beam structure with variable cross-sections based on measured natural frequency changes. J. Sound Vib. 2017, 387, 53–65. [Google Scholar] [CrossRef]
  22. Loutas, T.H.; Sotiriades, G.; Kalaitzoglou, I.; Kostopoulos, V. Condition monitoring of a single-stage gearbox with artificially induced gear cracks utilizing on-line vibration and acoustic emission measurements. Appl. Acoust. 2009, 70, 1148–1159. [Google Scholar] [CrossRef]
  23. Kouhpangi, M.Z.; Yaghoubi, S.; Torabipour, A. Improved Structural Health Monitoring Using Mode Shapes: An Enhanced Framework for Damage Detection in 2D and 3D Structures. Eng 2023, 4, 1742–1760. [Google Scholar] [CrossRef]
  24. Fan, W.; Qiao, P. Vibration-based Damage Identification Methods: A Review and Comparative Study. Struct. Health Monit. 2011, 10, 83–111. [Google Scholar] [CrossRef]
  25. Salawu, O.S. Detection of structural damage through changes in frequency: A review. Eng. Struct. 1997, 19, 718–723. [Google Scholar] [CrossRef]
  26. Sha, G.; Radzieński, M.; Cao, M.; Ostachowicz, W. A novel method for single and multiple damage detection in beams using relative natural frequency changes. Mech. Syst. Signal Process. 2019, 132, 335–352. [Google Scholar] [CrossRef]
  27. Patil, D.P.; Maiti, S.K. Experimental verification of a method of detection of multiple cracks in beams based on frequency measurements. J. Sound Vib. 2005, 281, 439–451. [Google Scholar] [CrossRef]
  28. Wang, J.; Guo, T.; Wang, Z.; Liu, W.; Yu, T.; Zhang, Y. Simulation and experimental research on vibration response of microcracked compressor blades under variable working conditions. Appl. Acoust. 2024, 216, 109766. [Google Scholar] [CrossRef]
  29. Wang, H. Study on natural-frequency-based structural damage identification of steel transmission tower. In Proceedings of the 2011 International Conference on Transportation, Mechanical, and Electrical Engineering (TMEE), Changchun, China, 16–18 December 2011; pp. 1382–1385. [Google Scholar] [CrossRef]
  30. Popescu, F.D.; Radu, S.M.; Andraș, A.; Kertesz, I. Simulation of the frequency response of the ERC 1400 Bucket Wheel Excavator boom, during the excavation process. New Trends Prod. Eng. 2019, 2, 153–167. [Google Scholar] [CrossRef]
  31. Jiang, Y.Z.; Liu, C.J.; Li, X.J.; He, K.F.; Xiao, D.M. Low-Frequency Vibration Testing of Huge Bucket Wheel Excavator Based on Step-Decay Signals. Shock. Vib. 2018, 2018, 6182156. [Google Scholar] [CrossRef]
  32. Li, T.; Liu, F.; Li, Z.; Lu, M.; He, Q. Analysis and Experimental Investigation of Vibration Characteristics of Rotary Platform of Hydraulic Excavator under Complex Working Conditions. Shock. Vib. 2021, 2021, 4469251. [Google Scholar] [CrossRef]
  33. Fu, Z.-F.; He, J. Modal Analysis; Elsevier: Amsterdam, The Netherlands, 2001. [Google Scholar]
  34. Avitabile, P. Experimental modal analysis. Sound Vib. 2001, 35, 20–31. [Google Scholar]
  35. Chandra, C.A.; Samal, P.K. Experimental determination of mode shapes of beams by roving impact test. Mater. Today Proc. 2021, 46, 9159–9163. [Google Scholar] [CrossRef]
  36. Alma’aitah, A.; Hassanein, H.S. Utilizing Sprouts WSN platform for equipment detection and localization in harsh environments. In Proceedings of the 39th Annual IEEE Conference on Local Computer Networks Workshops, Edmonton, AB, Canada, 8–11 September 2014; pp. 777–783. [Google Scholar] [CrossRef]
  37. KOMATSU. Hydraulic Excavator, KOMATSU (n.d.). Available online: https://cdn.machine.market/specifications/komatsu-mining-shovel-excavators-spec-0cf49e.pdf (accessed on 5 July 2024).
  38. Gao, S.; Liu, F.; Jiang, C. Improvement study of modal analysis for offshore structures based on reconstructed displacements. Appl. Ocean. Res. 2021, 110, 102596. [Google Scholar] [CrossRef]
  39. Bendat, J.S.; Piersol, A.G. Random Data: Analysis and Measurement Procedures; John Wiley & Sons: Hoboken, NJ, USA, 2011; Available online: https://books.google.com.au/books?hl=zh-CN&lr=&id=qYSViFRNMlwC&oi=fnd&pg=PT20&dq=random+data+analysis+and+measurement+procedures+4th+edition&ots=Ud-LRIISwh&sig=XUjH74pV2r_Ex5R6_yBgufBuEv4 (accessed on 10 August 2025).
Figure 1. Schematic of the cantilever beam specimen setup.
Eng 06 00220 g001
Figure 2. (a) Condition 1 in Table 1—the beam was suspended by elastic bands (free-free condition); (b) Condition 4 in Table 1—the beam was fixed to a granite table by a G-clamp (fixed-free condition).
Eng 06 00220 g002
Figure 3. Cantilever beam vibration experimental tests (fixed-free condition) for: (a) cantilever beam with weights attached (Condition 2 in Table 1); (b) cantilever beam without weights attached (Condition 4 in Table 1).
Eng 06 00220 g003
Figure 4. An example of signal processing output by FFT method in the vibration impact tests. Each coloured line denotes one roving measurement.
Eng 06 00220 g004
Figure 5. (a) An example heavy-duty excavator bucket with GETs [37]; (b) a simplified model with dimensions and boundary conditions in modal analysis. Dimensions in mm.
Eng 06 00220 g005
Figure 6. Example of the simplified excavator bucket with different situations: (a) tooth No. 1 fully worn, (b) tooth No. 3 fully worn, (c) all teeth fully worn. Teeth are numbered from left to right, from 1 to 6.
Eng 06 00220 g006
Figure 7. The mesh of the simplified bucket and the locations of the output signal probes on the teeth, labelled from A to G.
Eng 06 00220 g007
Figure 8. Mode shapes for the first six vibration modes of the beam with 15 g weights attached under the fixed-free condition.
Eng 06 00220 g008
Figure 9. Experimental mode shapes of the beam under free-free condition.
Eng 06 00220 g009
Figure 10. Comparison of FEA and experimental modal analysis identified frequencies of the 300 mm length beam under fixed-free conditions.
Eng 06 00220 g010
Figure 11. Natural frequency results for all cases of the excavator bucket scenario for the first six modes (refer to Figure 12 for images of the mode shapes). The term ‘worn’ means tooth is fully worn (100% of mass loss) at that location.
Eng 06 00220 g011
Figure 12. Mode shapes of the first six modes of the simplified excavator bucket for the intact condition.
Eng 06 00220 g012
Figure 13. Percentage of natural frequency change for the individual worn tooth conditions compared to the intact condition.
Eng 06 00220 g013
Figure 14. FFT plots of directional displacement signals measured at the No. 1 tooth (probe A in Figure 7) for sensor orientation in: (a) x-axis, (b) y-axis, (c) z-axis, with the No. 3 tooth fully worn. Alignment along the x-axis captures the 1st frequency (19.5 Hz) but not the 4th frequency (72.7 Hz), whereas y- and z-axis alignments detect the 4th frequency but not the 1st frequency.
Eng 06 00220 g014
Figure 15. FFT plots of directional displacement signals measured at the midpoint of the right-side wall edge (probe G in Figure 7) for sensor orientation in: (a) x-axis, (b) y-axis, (c) z-axis, with No. 3 tooth fully worn. Compared with probe A (Figure 14), amplitudes for the same frequencies are different.
Eng 06 00220 g015
Table 1. Conditions of different scenarios for cantilever beam tests with FEA and experiments.
ConditionL—Free end Length [mm]a—Length of Fixing [mm]b—Distance of Accelerometer [mm]c—Distance of Weight [mm]Weight [g]Boundary ConditionMass Loss [%]
14000100-0Free-free-
2300100206015Fixed-free-
330010020607.5Fixed-free3.7
430010020-0Fixed-free7.3
5240160206015Fixed-free15.9
Table 2. FEA modal analysis identified frequencies of different beam configurations.
ModesFrequencies Under Free-Free Condition [Hz]Frequencies Under Fixed-Free Conditions [Hz]
400 mm Beam 300 mm Beam with 15 g Weights (Intact)300 mm Beam with 7.5 g Weights300 mm Beam240 mm Beam with 15 g Weights
1206.844.045.246.666.7
2546.5216.0221.7228.4323.8
31010.1329.6329.0326.1512.4
41068.3693.1718.1714.1850.8
51270.1949.0951.0931.31457.5
61768.81605.51607.01609.42413.6
Table 3. Comparison between the FEA and experimental impact vibration test determined frequencies of the beam under free-free conditions.
Mode Number from FEAFEA Frequencies [Hz]Exp. Frequencies [Hz]Relative Difference = (FEA − Exp.)/Exp. [%]
1206.8208.50.8
3546.5540.01.2
51068.31061.30.7
Table 4. Mode 3 natural frequency results of all scenarios, and the difference between the worn tooth case and the intact case.
Scenario Mode 3 Frequency [Hz]Absolute Difference Compared to Intact Case [Hz]Relative Difference Compared to Intact Case [%]
Intact38.8--
No. 1 tooth fully worn38.90.10.1
No. 2 tooth fully worn39.40.61.6
No. 3 tooth fully worn40.11.33.4
All teeth fully worn43.44.511.7
Table 5. Summary of the sensor orientations capable of capturing distinct peaks in the FRFs.
Sensor LocationMode 1Mode 2Mode 3Mode 4Mode 5Mode 6
A
(Tooth 1)
xxx xx
yyyyy
zz
B
(Tooth 2)
xxxx x
yyy y
zz z
C
(Tooth 3)
xxxx x
yy y
zz
G
(Midpoint of the right-side wall edge)
xxxxxx
yyy y
zz z
Disclaimer/Publisher’s Note: The statements, opinions and data contained in all publications are solely those of the individual author(s) and contributor(s) and not of MDPI and/or the editor(s). MDPI and/or the editor(s) disclaim responsibility for any injury to people or property resulting from any ideas, methods, instructions or products referred to in the content.