Abstract
This study introduces a novel approach to enhance the sustainability of road pavement construction by utilizing palm oil clinker (POC), an industrial waste product, as a replacement for fine aggregates (passing 4.75 mm) in stone mastic asphalt (SMA) mixtures. Departing from conventional practices, this research comprehensively evaluates the feasibility of using POC at varying replacement levels (0% to 100%) across a range of binder contents (5.0% to 7.0%). A significant contribution of this work is the application of Response Surface Methodology (RSM) to optimize the proportions of POC and binder content (BC), achieving target Marshall and volumetric properties for superior pavement performance. The results demonstrate that POC can effectively substitute fine aggregates in SMA mixtures, meeting all requirements for Marshall stability, flow, stiffness, and volumetric properties, even at a 100% replacement rate. Statistical analysis using RSM confirmed the model’s validity, exhibiting a high R-squared value (>0.80), significant p-values, and an adequate precision exceeding 4. Optimization analysis revealed that a 60% POC content with a 6% BC yields the most desirable combination for achieving optimal SMA mixture characteristics. Further validation through experimental testing showed a strong correlation with the theoretical RSM predictions, with an error margin below 5%. This research underscores the potential of POC as a sustainable alternative to traditional aggregates, paving the way for more environmentally friendly and cost-effective road construction practices while simultaneously addressing waste management challenges in the palm oil industry.
1. Introduction
Asphalt concrete, composed of aggregate, asphalt binder, and filler, is widely used for constructing smooth and long-lasting road surfaces. Stone Mastic Asphalt (SMA) features a structure where coarse aggregates account for about 70–80% of the total aggregate mass, filler makes up 8–12%, and the binder content ranges from 6 to 7%. Among these, aggregates contribute most significantly to the overall pavement volume, necessitating large quantities that must be extracted from natural sources [1,2].
Recently, there has been growing concern over the rapid exhaustion of natural resources, driven by the high daily demand for raw materials. Population growth has also led to increased waste generation, primarily due to the expansion of agricultural and industrial activities. As a result, a substantial amount of waste ends up in landfills each year, raising environmental concerns. In response, researchers are exploring ways to reduce the ecological footprint of waste by repurposing it as a replacement for conventional road construction materials. This approach supports the development of eco-friendly and sustainable pavements by addressing solid waste management challenges and conserving natural resources [3,4,5].
Various waste materials are turned into asphalt pavement by replacing traditional aggregates. These alternative materials include waste glass, steel slag, palm kernel shells, plastic waste, construction and demolition debris, recycled asphalt and shingles, scrap tire rubber, coal bottom ash, marble, and basalt residues, as well as mining by-products [2,6,7,8,9,10,11,12,13,14]. While various agricultural waste materials have also been explored in asphalt mixtures, such as palm kernel shells [15,16], rice husk ash [17], sugarcane bagasse [18,19], and coconut shell ash and fiber [20,21], many of these require preprocessing or have relatively high density and limited porosity. In contrast, POC offers distinct advantages: it is a by-product that requires minimal treatment, has a naturally porous structure, and exhibits lower density compared to most natural or waste-derived aggregates. These properties contribute to better interlocking, reduced dead load.
Incorporating waste materials into asphalt pavement helps lower construction costs and protects the environment by decreasing the demand for natural aggregate extraction. Additionally, sourcing natural aggregates is often a time-intensive process [22].
In 2015, Malaysia, Indonesia, and Thailand accounted for about 91% of global palm oil demand, establishing them as the leading producers worldwide. Malaysia, in particular, plays a significant role in palm oil production, contributing 32% to the global supply [23]. In 2019, Malaysia produced 19.9 million tons of palm oil and exported 18.5 million tons [24]. The cultivation of oil palm in Malaysia continues to grow, aligned with the government’s goal to promote palm oil biodiesel. According to the Malaysian Palm Oil Board (MPOB), the area dedicated to oil palm cultivation reached approximately 5.9 million hectares in 2019 [24].
The palm oil sector significantly impacts Malaysia’s economy, contributing a substantial portion to the nation’s gross domestic product (GDP). In 2018, the industry contributed RM80 billion, representing 8.7% of the total GDP [25].
Only about 10% of the oil extracted during palm oil processing comes from fresh fruit and kernels, while the remaining 90% is categorized as underutilized biomass or waste [26]. In Malaysia, the palm oil industry generates vast quantities of waste, including empty fruit bunches, palm oil mill effluent, fronds, trunks, fibers, and kernel shells. This extensive waste output, amounting to millions of tons annually, contributes significantly to environmental pollution. As global demand for palm oil continues to grow, waste production is expected to rise correspondingly [27].
Because of their high calorific value, oil palm shells and fibers are typically incinerated at palm oil mills to generate energy. This combustion process yields additional waste by-products, most notably palm oil clinker (POC) and palm oil fuel ash (POFA) [28,29,30], as depicted in Figure 1. POC, a prominent by-product, appears as a gray, porous, flaky stone with an irregular shape [31]. The color of POFA varies from light to dark gray, with darker tones indicating higher residual carbon content. POFA typically accounts for around 5% of the total waste produced from the combustion of oil palm shells and fibers for energy generation [32]. POC offers numerous environmental advantages when reused [33].
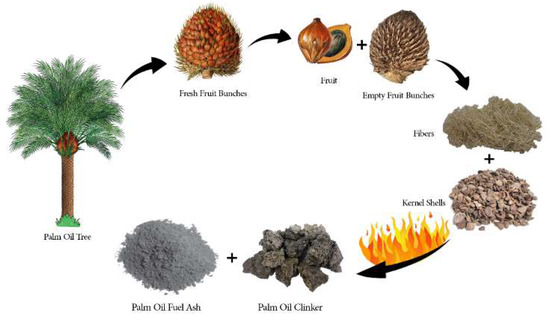
Figure 1.
By-products generated from the combustion of oil palm waste materials.
Oil palm waste with commercial potential can be transformed into construction materials, such as aggregate or cement alternatives, offering both engineering and economic benefits. Utilizing POC in particular allows for the production of lightweight aggregate, which reduces structural weight without compromising strength. Numerous studies have investigated the application of POC as a replacement for conventional aggregates in concrete construction [34,35,36,37]. Furthermore, using POC is more sustainable than using other recycled materials since it is locally sourced, whereas other materials are, in many situations, transported over longer distances [38]. Compared to other waste materials investigated for use in asphalt pavements, POC offers potential advantages such as lower density, potentially leading to lighter and more cost-effective pavement structures. The inherent porous nature of POC also contributes to improved drainage and noise reduction in road surfaces, benefits that warrant further investigation [39].
The physical characteristics of POC were documented by several studies, as seen in Table 1, and the oxide’s composition is presented in Table 2. A growing body of research on palm oil waste repurposing, particularly POC, underscores the timeliness and relevance of investigating a various number of applications in asphalt pavement.

Table 1.
Characteristics of the POC materials.

Table 2.
Chemical oxide composition of POC.
This research explores the experimental application of POC waste as a partial-to-full substitute for fine aggregate in SMA. The main objective is to optimize the SMA mix design incorporating POC aggregate through the use of response surface methodology (RSM). A series of asphalt mixtures were prepared with varying POC content, specifically 10%, 20%, 40%, 60%, 80%, and 100%, referred to as POC-(10), POC-(20), POC-(40), POC-(60), POC-(80), and POC-(100), respectively. These were compared against a conventional control mix containing no POC. Each mix underwent evaluation through Marshall stability, Marshall flow, and volumetric property tests. By turning a waste product into a resource, this research supports a circular economy and gives a waste product a new use, lowering the demand for new materials [54].
2. Materials
2.1. Asphalt Binder
Asphalt binder with an 80/100 penetration grade was used in this study. The asphalt binder specifications are detailed in Table 3.

Table 3.
Physical and rheological attributes of the asphalt binder.
2.2. Aggregate
Crushed granite aggregates used in this study were supplied by Kajang Rock. The gradation of these aggregates conformed to the requirements for Stone Mastic Asphalt (SMA) 20, as specified by the Malaysian Public Works Department (Jabatan Kerja Raya, JKR) [61], and is illustrated in Figure 2. The corresponding physical properties of the aggregates are detailed in Table 4.
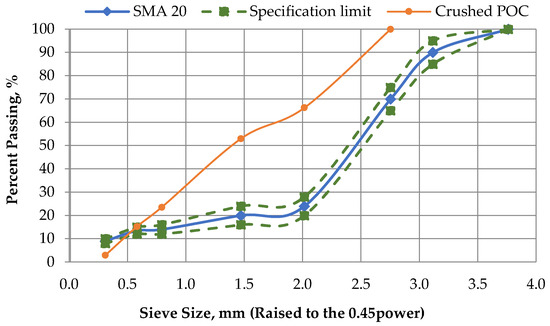
Figure 2.
Aggregates gradation.

Table 4.
Granite aggregates properties.
2.3. Palm Oil Clinker (POC)
POC is generated as a by-product of the combustion of oil palm shells and fibers in palm oil mills, where these biomass materials are used as fuel to generate energy [67]. POC was acquired from a facility that produces palm oil. The raw POC obtained from mills typically exists in the form of irregularly shaped, porous clinkers, with a gray hue and a potentially flaky structure [31]. POC was gathered in substantial portions, as seen in Figure 3, and then pulverized into fine aggregates; the gradation is presented in Figure 2. The chemical components are shown in Table 5, and the physical properties are presented in Table 6.
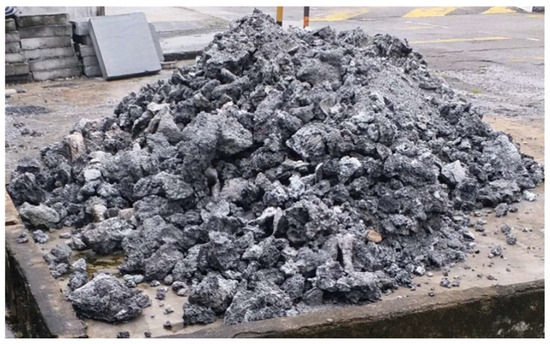
Figure 3.
POC as a large chunk.

Table 5.
Elemental composition of POC.

Table 6.
Physical properties of POC.
The initial size of these clinkers can vary significantly, ranging from relatively large chunks to smaller pieces. The utilization of POC as a fine aggregate substitute in stone mastic asphalt (SMA) mixtures necessitates careful preparation and characterization to ensure its compatibility and performance within the asphalt matrix.
To be used as a fine aggregate replacement, the raw POC is reduced to a particle size distribution comparable to that of conventional fine aggregates used in SMA mixtures; the necessary pulverization process involves crushing and grinding. The initial step involved crushing the large POCs into smaller, more manageable pieces, achieved using a jaw crusher, which is commonly employed in the aggregate processing industry to reduce the size of large rocks and similar materials [68]. In this study, although no external fibers were added, the POC fine aggregates inherently contain fibrous materials, which act similarly to added fibers in conventional SMA, as shown in Figure 4. Generally, fibers are able to reinforce the SMA mixtures and assist in generating a three-dimensional network, which could improve the mix adhesion. Based on the literature review, many different types of plant-derived fibers were incorporated in the SMA to improve the mixture’s mechanical properties [69,70,71,72]. As shown in Table 5, the POC aggregates contain a high silicon dioxide (SiO2) content of 65.36%. A high SiO2 content in aggregates can enhance the adhesion between asphalt and aggregate, particularly when paired with emulsifiers that possess strong polar functional groups. The presence of Si–O bonds and surface hydroxyl groups in SiO2 facilitates hydrogen bonding and electrostatic interactions with the emulsifier’s hydrophilic ends, resulting in improved bonding at the asphalt–aggregate interface [73].
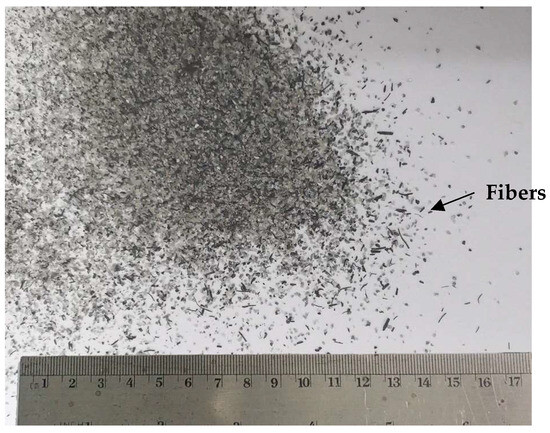
Figure 4.
POC fine aggregates.
Following the grinding process is the control of particle size distribution of POC, typically achieved through sieving, and the process works by involving the passing of the material through a series of sieves with progressively smaller mesh sizes. Based on Table 1 in the provided information, some studies used POC with particle sizes less than 5 mm and others with particle sizes less than 4.75 mm. This study was carried out based on the specifications provided by the Malaysian Public Works Department (JKR) for Stone Mastic Asphalt. As per JKR guidelines, materials that pass through the 4.75 mm sieve are categorized as fine aggregates [61].
3. Experimental Procedures
The Marshall mix design process involves three straightforward steps: selecting the aggregate, choosing the asphalt binder, and determining the optimum asphalt binder content. The Marshall compactor produces cylindrical specimens with a diameter of 102 mm and a height of 64 mm. The compaction is achieved with a specified pressure that is specified using a hammer assembly with a sliding weight of 4536 g dropped from a free-fall height (457.2 mm). The number of blows, which can be set to 35, 50, or 75 per side, is adjusted based on traffic loading conditions.
In this study, 50 compaction blows were chosen in line with the Malaysian Public Works Department specifications for road works [61]. A higher compaction of 75 blows was not employed, as it did not achieve greater intensity than 50 blows. Additionally, SMA mixtures have been noted to compact more easily to the desired density compared to conventional mixtures [74]. Previous studies have recommended applying 50 blows per side for SMA mixtures rather than 75 blows [75,76,77,78,79,80,81,82].
Preparation of Samples
Approximately 1100 g of the aggregate blend were weighed based on the predetermined mix design, which involved substituting fine aggregates with prepared palm oil clinker (POC) at varying replacement levels of 0%, 10%, 20%, 40%, 60%, 80%, and 100%. The weighed materials were then heated to a temperature range of 160–170 °C for two hours. Simultaneously, the asphalt binder was heated separately in another oven at a mixing temperature between 150 and 155 °C for one hour. The mixture was prepared using the dry mixing method. For each group, three replicate samples were prepared with asphalt binder contents of 5.0%, 5.5%, 6.0%, 6.5%, and 7.0% by total mix weight, ensuring complete and uniform coating of the aggregate particles.
The hot mix was transferred into a Marshall mold and compacted using a Marshall compactor, applying 50 blows on each side at a compaction temperature of 140–145 °C, following the guidelines set by the Malaysian Public Works Department [61]. After compaction, the specimens were allowed to cool at room temperature for 24 h. Once cooled, the samples were extracted from the molds using a mechanical jack and stored in the laboratory for subsequent testing. These tests included Marshall stability and flow, Marshall quotient, and various volumetric properties such as bulk density, voids in mineral aggregate (VMA), air voids or voids in the mixture (VIM), and voids filled with asphalt (VFA).
4. Design of Experiments and ANOVA Analysis Using RSM
The construction and development of roads are crucial drivers of economic and cultural progress. However, the significant costs involved in asphalt installation and maintenance highlight the growing need for adopting innovative and advanced approaches to asphalt design and quality control [83]. Statistical and data-driven techniques can be employed to predict the Marshall characteristics. One such technique is the Design of Experiments (DOE). Response Surface Methodology (RSM), a subset of DOE, combines statistical and mathematical methods to design experiments efficiently. RSM is widely applied across various fields to assess the impact of independent variables on response outcomes. One of the key advantages of RSM is that it reduces the number of required experiments, which in turn minimizes both the time and cost associated with experimental procedures. For this study, Design Expert software version 11.1.0 was utilized. The software offers advanced tools for generating an optimal experimental design matrix, incorporating various process and mix combinations using both dependent and independent variables. It also facilitates the visualization of data, highlighting the most significant effects of one variable on another, and enables accurate modeling of results. The output provides a wide selection of graphs that aid in identifying the influence of different variables. The factors considered were palm oil clinker content (POC) and binder content (BC), while the responses, based on JKR Malaysia specifications, included stability, flow, quotient, VMA, VIM, and VFA. Table 7 outlines the levels of these factors along with their corresponding codes.

Table 7.
RSM factor design and related coding.
The volumetric properties of the mixtures containing POC, including VMA, VIM, and VFA, as well as the Marshall properties such as stability, flow, and stiffness, were examined using experimental runs designed with RSM. Quadratic polynomial models were proposed based on their ability to effectively predict performance outcomes. A second-order polynomial equation was utilized to estimate the responses, and the generalized form of the predicted model is presented in the equation below.
where Y represents the predicted response obtained from the experimental data, such as stability, flow, quotient, VMA, VIM, and VFA. X1 and X2 are independent variables (i.e., POC and BC). The interception constant is C, and the coefficients in the equation are A1 to A5.
Using Design Expert software, the high and low levels for designated factors were assigned. A design matrix consisting of 21 experimental runs was created as shown in Table 8. To enhance the reliability of the experimental design and analysis, six replicates of the central points were included. According to experimental design, the mixtures containing POC with different asphalt binder content were prepared and assessed for stability, flow, stiffness, VMA, VIM, and VFA. The resulting data from these characterizations were entered into the corresponding response slots for analysis, modeling, and optimization.

Table 8.
Experimental design matrix.
The statistical parameters and interaction effects of each factor were analyzed using ANOVA, with adequacy measures like the lack-of-fit test, F-value, and p-value confirming the model’s suitability. ANOVA assessed the model’s significance by comparing predicted and experimental responses. Design Expert provided 3D graphs showing how independent variables influence the selected responses, with each graph representing two variables while keeping others constant at their mean values.
5. Results
5.1. Marshall Properties
The results of Marshall properties, which included stability and flow for different asphalt mixtures with varying levels of binder, are displayed in Table 9 and Table 10.

Table 9.
Results of Marshall stability (kN) for asphalt mixtures with varying levels of binder.

Table 10.
Results of Marshall flow (mm) for asphalt mixtures with changing levels of binder.
From Table 9, it can be observed that stability slightly increases with the increase in POC content and decreases with the increase in asphalt binder content. Moreover, all the asphalt mixtures achieved the minimum stability value of 6200 N, as required by the Malaysian Standard Specification for Road Works. POC, with its porous and potentially angular structure, as we have mentioned in the introduction, enhances the interlock between aggregate particles within the asphalt mixture, leading to a more rigid and stable matrix, capable of resisting higher loads before deformation, and hence the higher stability [51]. The figure also indicates that most of the POC replacement levels, increasing the asphalt binder content, generally lead to a decrease in Marshall stability. This trend is consistent across most of the data points. Another essential finding is that higher binder contents reduce the friction and interlock between aggregate particles. This increases the work to make the mixture more susceptible to deformation under load, resulting in a lower stability [84,85]. Balance between interlock and viscosity means optimum POC content represents a balance between the positive effects of improved aggregate interlock and the negative effects of excessive binder viscosity. Moreover, POC enhances interlock without being overly susceptible to the viscosity effects of higher binder contents.
As shown in Table 10, unlike the stability results, it is not possible to observe a straightforward increase or decrease in flow with either increasing POC content or BC. Nevertheless, all the mixtures produced results that fall within the recommended range of 2–4 mm, in accordance with the Malaysian Standard Specification for Road Works. This indicates that the mixtures meet the basic flow requirements for road construction within the tested range of POC and BC. Similar findings have been reported for waste materials used in asphalt mixtures, where acceptable flow values were achieved across varying replacement levels [86,87]. Flow value is sensitive to slight variations in the compaction process; minor differences in compaction energy or temperature could influence the flow measurements, particularly when dealing with materials of POC that have a different response to compaction compared to conventional aggregates.
5.2. Volumetric Properties
Volumetric properties of asphalt concrete mixtures play a critical role in determining their overall performance and durability [88]. In the process of designing asphalt mixes, air voids are an essential parameter that is utilized to select the optimal amount of asphalt binder for asphalt mixtures. Asphalt mixture performance is influenced by the amount of air voids present. It is possible for the mixture to crack due to an inadequate amount of binder coating the aggregates if there is an excessive number of air voids. On the other hand, an inadequate number of air voids can result in excessive deformation and bleeding from the binder [7]. The volumetric properties results for different asphalt mixtures with varying levels of binder, which included air voids, density, VFAM, and VMA, are shown in the figures below.
Table 11 presents the air voids results for different asphalt mixtures with varying levels of BC. It shows that all the asphalt mixtures follow the same pattern, where air voids decrease as the asphalt binder content increases. This is because the air voids are filled with asphalt binder, which leads to a reduction in the percentage of air voids. A similar finding was reported in several previous studies [9,89,90,91,92,93].

Table 11.
Results of air voids (%) for asphalt mixtures with varying levels of binder.
In this study, the optimum binder content (OBC) for all SMA mixtures was determined based on achieving 4% air voids, in accordance with the specifications of the Malaysian Public Works Department (Jabatan Kerja Raya, JKR). The resulting OBC values for the various mixtures are presented in Figure 5. It was observed that all the values are within the range of 6.14 ± 0.09, so the inclusion of POC did not influence the air void content of the mixtures. Consequently, the use of POC had no impact on the OBC, implying that there would be no additional asphalt binder required.
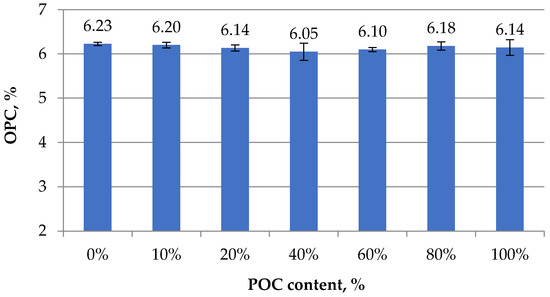
Figure 5.
Optimal asphalt binder content across different mixtures.
Table 12 shows the density results for different asphalt mixtures with varying BC. It indicates that the density of the asphalt mixtures increases with higher BC but decreases with an increase in POC content. This decrease is attributed to the specific gravity of POC (2.08), which is lower compared to the base aggregates. In Stone Mastic Asphalt mixes, air voids are a key factor in determining the optimum binder content (OBC) [94].

Table 12.
Results of density (g/mL) for asphalt mixtures with varying levels of binder.
Table 13 illustrates the VFA results for different asphalt mixtures with varying BCs. The figure shows a typical trend for all asphalt mixtures, where the percentage of VFA increases as the BC increases. Upon closer observation and comparing VFA values across different POC replacement levels with all the BCs, mixtures with higher POC contents tend to exhibit slightly lower VFA values compared to the control mixture and with lower POC contents. This behavior can be attributed to the porous nature of POC material, which increases the overall porosity and, consequently, the VMA of the asphalt mixture compared to conventional aggregates. A higher VMA, for the same BC, naturally results in a lower VFA.

Table 13.
Results of VFA (%) for asphalt mixtures with varying levels of binder.
The porous structure of POC leads to absorption of a portion of the asphalt binder, effectively reducing the amount of binder available to fill the voids between aggregate particles. However, at higher binder contents, the effect of binder absorption becomes less significant due to the excess binder available to fill the voids. This phenomenon, as reported in the Oklahoma Department of Transportation’s study on the effect of VMA on HMA, highlights that the amount of asphalt binder absorbed by an aggregate depends on factors such as porosity, void volume, pore size, and the binder’s viscosity. Aggregates with larger pore sizes allow for increased asphalt binder absorption, which reduces the effective BC. However, as the BC increases, the relative effect of absorption diminishes because there is sufficient binder to fill the voids [95]. Additionally, the irregular shape of POC, in contrast to the rounded and cubical shape of conventional aggregates, influences the packing density of the aggregate skeleton. This can potentially result in higher VMA and, consequently, lower VFA value.
Table 14 illustrates the VMA values for different asphalt mixtures varying in both POC content as a replacement for fine aggregates and BC. VMA represents the intergranular void space between the aggregate particles in the compacted asphalt mixtures. The voids in mineral aggregate (VMA) results range from 17.5% to 18.92%. All the mixtures satisfied the minimum requirement of 17%, in accordance with the Malaysian Public Works–Road Department specifications. This indicates that the VMA values for all mixtures meet the basic requirement for road construction. The porous nature of POC interferes with the regular relationship between BC and VMA due to the absorption of binder into the POC pores, counteracting the expected reduction in VMA with increasing BC, and the effect is highly possible at a higher POC content. However, the resulting VMA complex is influenced by other factors such as binder absorption, particle packing, and compaction characteristics.

Table 14.
Results of VMA (%) for asphalt mixtures with varying levels of binder.
5.3. Statistical Analysis
The RSM technique was employed to analyze, optimize, and validate the Marshall and volumetric properties of asphalt mixtures. Different percentages of POC and BC were selected as factors X1 and X2, while stability, flow, stiffness, VIM, VFA, and VMA served as the corresponding responses (Y1 to Y5). ANOVA was applied to evaluate the statistical impact of the factors (POC and BC) on the responses and to assess the significance of the proposed models. A quadratic polynomial was suggested on the model’s significance to predict the Marshall and volumetric properties of asphalt, as shown below:
where Y represents the predicted response obtained from the experimental data, such as stability, flow, quotient, VMA, VIM, and VFA. X1 and X2 are independent variables (i.e., POC and BC). The interception constant is C, and the coefficients in the equation are A1 to A5.
The statistical analysis was performed using ANOVA; the significance and fit characteristics are shown in Table 15.

Table 15.
ANOVA results.
The significance of the model is indicated by the high F-value and low p-value (<0.05), which means that the factor and its associated factors are in excellent agreement. The lack-of-fit F-values are relatively low, and the corresponding p-values are greater than 0.05 except for flow and VIM, which are close to 0.05. This indicates that a lack of fit is not statistically significant, suggesting that the chosen quadratic models adequately capture the relationship between the factors and the responses within the experimental region. Moreover, the R2 values exceeding 0.80 and the numerical discrepancy between the adjusted and predicted R2 values being less than 0.2 further support the significance of the established models in predicting responses. The coefficient of determination, also known as R2, quantifies the quality of the model and the appropriate level of fit that has been established. An R2 value greater than 0.80 indicates that the developed model is well-fitted and exhibits a strong and statistically significant agreement between the actual and predicted responses.
The degree of influence (DI) analysis, based on ANOVA sum of squares, aligns with literature that has similarly quantified the influence of input factors in asphalt optimization [96,97,98]. The DI analysis in the current study revealed that both POC and BC exerted statistically significant effects on the measured responses, namely stability, flow, stiffness, VMA, VIM, and VFA. However, their relative contributions varied considerably across the different properties. BC demonstrated a dominant role, particularly in governing air void-related parameters, where its influence exceeded 90% for both VIM and VFA. It also exhibited substantial contributions to stability and flow, underscoring its critical role in mechanical performance. Conversely, the influence of POC was more moderate and localized, with its highest contribution observed in VMA (27.56%), suggesting a notable effect on volumetric characteristics. In comparison, its influence on flow, stiffness, and air void parameters remained relatively minor. These findings emphasize that while BC serves as the primary determinant of mechanical and volumetric behavior, POC contributes as a secondary but meaningful factor, particularly in enhancing volumetric properties.
To enhance comprehension of model correctness, diagnostic plots including the predicted values compared to the actual values, normal probability, residuals compared to predicted, and residuals number of runs are presented in Figure 6, Figure 7, Figure 8, Figure 9, Figure 10 and Figure 11. It may be inferred from the figures that there is a sufficient level of agreement between the actual values and the projected ones. These results confirm that the predicted models can navigate the design space specified by the central composite design (CCD).
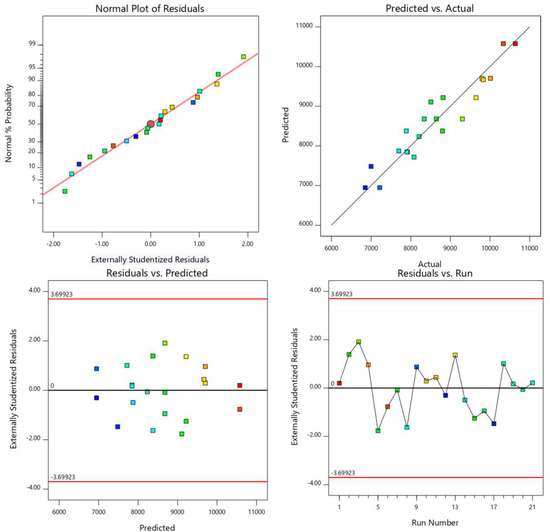
Figure 6.
Diagnostic plots for stability response.
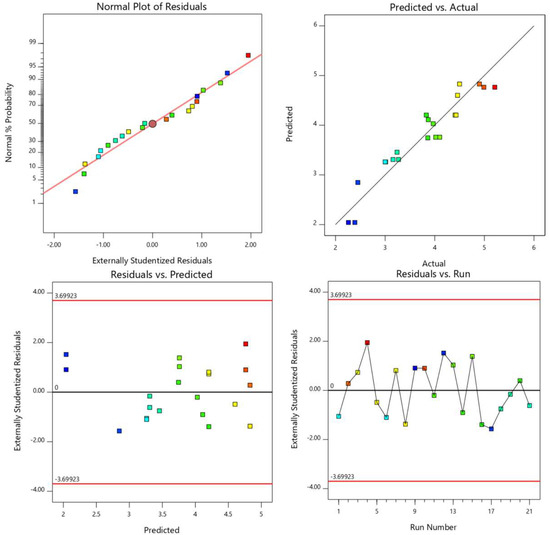
Figure 7.
Diagnostic plots for flow response.
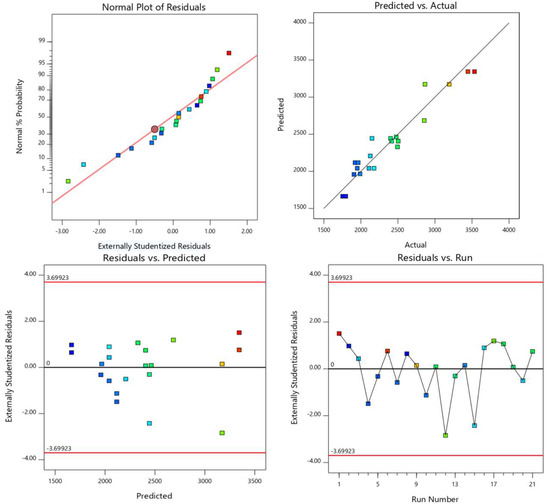
Figure 8.
Diagnostic plots for stiffness response.
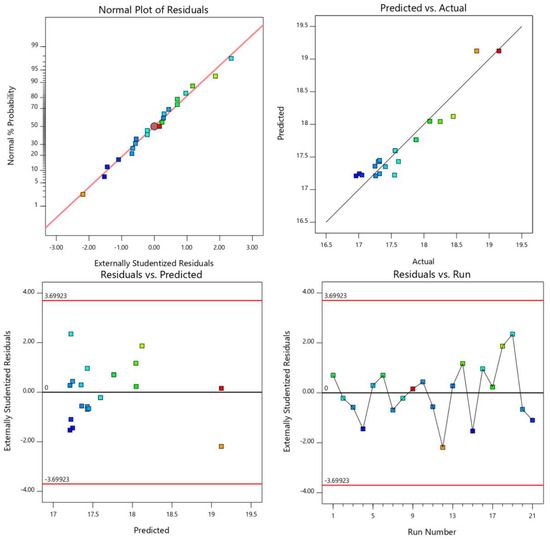
Figure 9.
Diagnostic plots for VMA response.
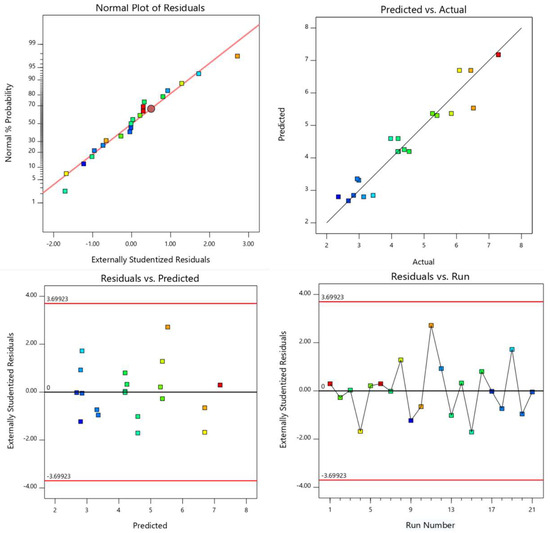
Figure 10.
Diagnostic plots for VIM response.
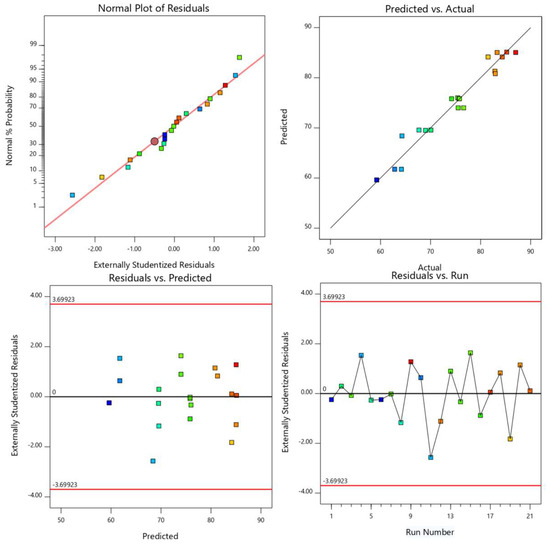
Figure 11.
Diagnostic plots for VFA response.
The adequacy of the model and the analysis of lack of fit can be assessed to determine the variation in data produced by a fitted model. A low lack of fit value and a p-value not exceeding 0.05 suggest that the proposed models are well fitted. Referring to Table 15, the ANOVA revealed that the smaller F-value and lack of fit error insignificance indicate that the highly significant models chosen are well-suited for establishing a correlation between the variables and responses. The measurements revealed that POCs and BCs significantly impact the Marshall and volumetric properties. For the prediction of responses that included stability, flow, stiffness, VMA, VIM, and VFA after the reduction in model, empirical equations as shown below are derived using factors (POC and BC). The insignificant terms were eliminated using the model reduction technique.
The squared terms (POC2 and BC2) in the quadratic model allow for the exploration of curvature in the response surface, which is important to identify potential optimum points, such as maxima or minima, within the design space, for example, optimum POC content that maximizes stability, or the optimum binder content that minimizes flow. The interaction term (POC * BC) allows the model to account for potential interactions between POC content and BC, meaning the effect of one factor on the response might depend on the level of the other factor. Response Surface Methodology (RSM) is employed here to utilize the quadratic models as effective in approximating the true response surface within the experimental region.
In addition, three-dimensional (3-D) diagrams were drawn, as shown in Figure 12, Figure 13, Figure 14, Figure 15, Figure 16 and Figure 17, to illustrate the relationship between the independent variables (POC and BC) and the dependent variables (stability, flow, stiffness, VMA, VIM, and VFA) that correspond to them. This was performed in order to provide the most accurate description possible and provide a robust foundation for understanding the effects of POC on asphalt mixture properties and for optimizing mixture designs.
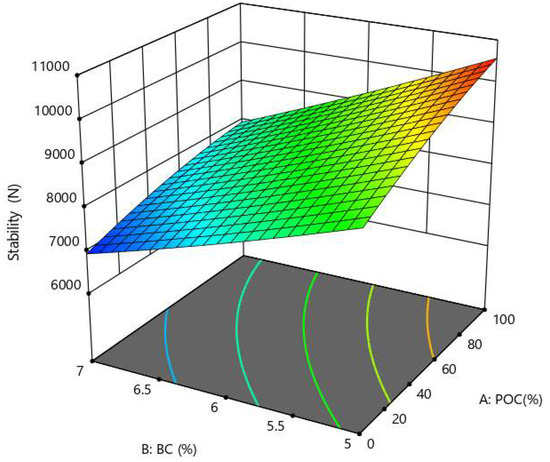
Figure 12.
Effect of POC and BC on stability.
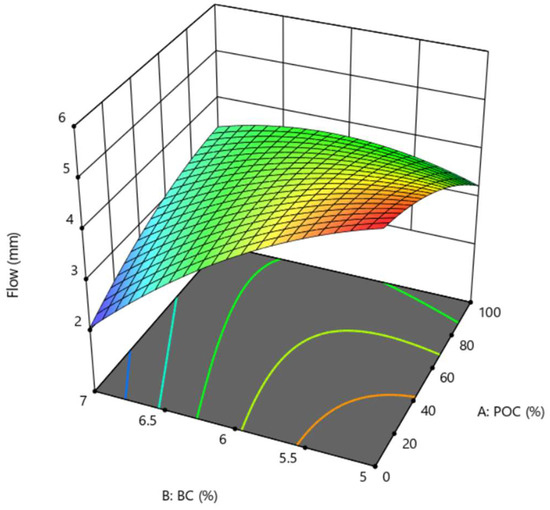
Figure 13.
Effect of POC and BC on flow.
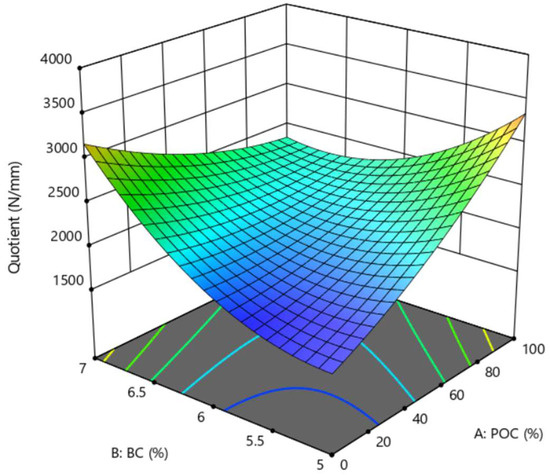
Figure 14.
Effect of POC and BC on stiffness.
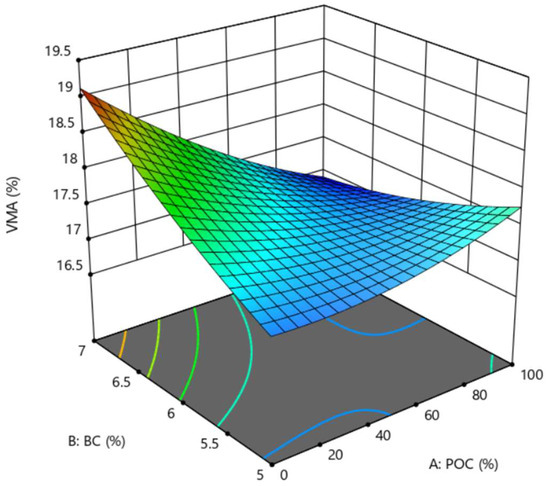
Figure 15.
Effect of POC and BC on VMA.
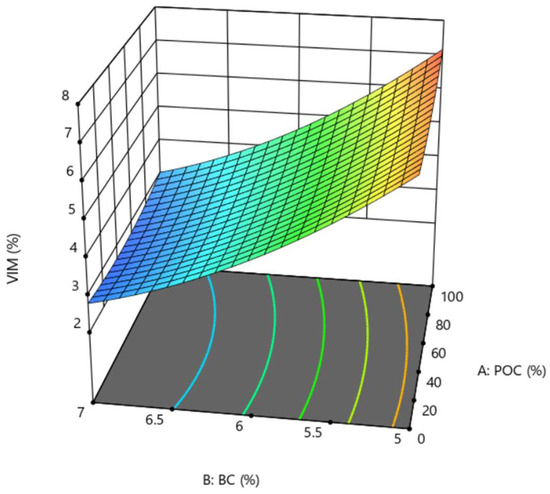
Figure 16.
Effect of POC and BC on VIM.
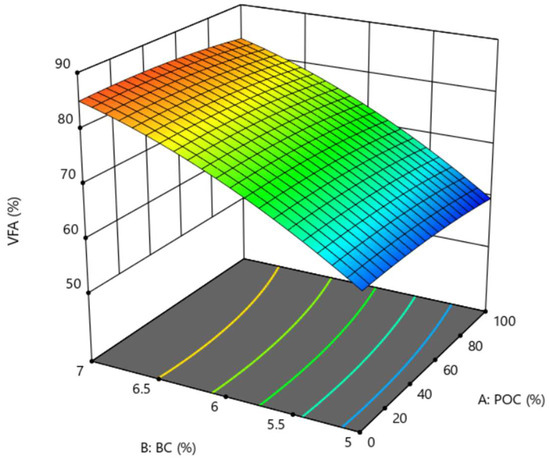
Figure 17.
Effect of POC and BC on VFA.
Figure 12 indicates the variation in Marshall stability versus POCs and BCs. As can be seen in the figure, the stability of the asphalt mixtures improves as the percentage of POC increases, while the stability of the material decreases as the percentage of BC increases. Based on the steepness of the slopes in the plot, it appears that POC content has a dominant positive effect on stability compared to the negative effect of BC, evident from the steeper upward slope along the POC axis compared to the downward slope along the BC axis. Higher stability values are achievable with higher POC contents and lower binder contents at 100% POC content and 5% BC.
Figure 13 illustrates the variation in Marshall flow in relation to different percentages of POC and BC. The graph shows that when the BC is low, increasing the POC content results in a reduction in the flow values of the asphalt mixtures. While, at higher binder percentages, the flow values show an increasing trend as the POC content increases.
The stiffness (quotient) values represent the proportion of flow to stability. The relationship between the quotient and the different percentages of POC and BC is depicted graphically in Figure 14. It has been observed that the quotient decreases when the percentage of binder is lower, and it increases when the percentage of POC content increases, particularly when the binder percentage is made higher. There is a nonlinear interaction between the POC and the BC on the quotient, as indicated by the contour lines at the base, which highlight the influential nature of both variables.
Figure 15 shows the variation in voids in mineral aggregate (VMA) percentage as a function of POC and BC. As the binder percentage decreases, the VMA initially shows a slight decrease, but as the POC content increases, there is a more significant reduction in VMA. The surface plot and contour lines illustrate how the interaction between these two variables leads to a complex, nonlinear behavior in VMA, with the lowest values occurring at higher POC contents and lower binder percentages.
Figure 16 depicts the variation in voids in mix (VIM) percentage of different mixtures with respect to POC and BC. The VIM percentage increases with decreasing BC. This is because the air voids are filled with asphalt binder, which leads to a reduction in the percentage of air voids. On the other hand, the VIM percentage seems to be leveled with increasing POC.
Figure 17 illustrates the variation in VFA percentage as a function of POC percentage and BC. As the BC increases, the VFA also increases, reaching its highest values at higher binder percentages. Conversely, the VFA slightly decreases with the increase in POC content.
5.4. Multi-Objective Optimization and Validation
Multi-objective optimization involves finding solutions that balance multiple conflicting objectives. In this research, two independent factors, POC and BC, and different dependent responses, including stability, flow, stiffness, VIM, VMA, and VFA. So, for this purpose, the RSM technique was used to optimize the findings to achieve the target Marshall and volumetric properties. The optimization criteria based on the JKR specification are presented in Table 16.

Table 16.
Criteria for optimization based on JKR specification.
Based on the defined criteria shown in Table 16, the optimization analysis was performed using the RSM technique, and the achieved combinations of different factors are shown in Table 17. The results indicate that the use of 60% POC and 6% BC can achieve the optimum Marshall and volumetric properties.

Table 17.
Result of multi-objective optimization.
Finally, based on the optimized two independent factors, POC and BC, additional testing was performed using 60% POC and 6% BC to validate optimized values and justify the agreement between the predicted responses and experimental results. The experimental results are shown in Table 18. The errors between the predicted and experimental results were calculated as shown in Table 18. It shows that there is a strong correlation between the predicted results and the experimentally obtained values.

Table 18.
Validation between predicted and experimental results.
6. Conclusions
This research introduces a novel and sustainable approach to pavement construction through investigating the use of POC replaced fine aggregates in stone mastic asphalt (SMA) mixtures. Seven SMA groups were constructed with different POC contents. Binder contents of 5.0%, 5.5%, 6.0%, 6.5%, and 7.0% were created for each POC concentration. The volumetric and Marshall properties were performed in the control and replaced SMA mixtures. The asphalt mixtures with POC satisfied Marshall stability, flow, stiffness, and volumetric criteria and may substitute fine aggregate in SMA combinations. Statistical analysis, optimization, and validation of various POC and asphalt binder contents were conducted using Response Surface Methodology (RSM). The main conclusions derived from this investigation are as follows.
- •
- In this study, two independent factors, POC and BC, were investigated. The experimental results displayed that incorporating POC has a minimal impact on Marshall stability, flow, stiffness, VFA, and VMA. However, it does influence the density, as the density of the compacted sample decreases with an increase in POC content due to its lower specific gravity compared to conventional aggregates. On the other hand, the asphalt binder content significantly affects the Marshall and volumetric properties.
- •
- Based on the mix design criteria, POC was found to be suitable for use as a fine aggregate replacement in stone mastic asphalt mixtures, up to 100%, while still meeting the design requirements according to JKR Malaysia specifications.
- •
- The optimum binder content was designed to achieve 4% air voids, with all mixtures falling within the range of 6.15 ± 0.1% of the total mixture weight.
- •
- Using ANOVA, different models were developed to cover six responses: stability, flow, stiffness, VIM, VFA, and VMA. These models were statistically validated, and the results showed that all models were significant and well-fitted, based on an R2 value greater than 0.80, low p-values, and insignificant lack-of-fit for all the predicted responses.
- •
- Based on multi-objective optimization, the results indicate that using 60% POC and 6% BC achieves the optimum Marshall and volumetric properties. Moreover, the optimized values were validated, showing a strong correlation (error < 5%) between the predicted results and the experimentally obtained values.
7. Future Research Directions
While this study demonstrates the feasibility of using POC as a fine aggregate replacement in stone mastic asphalt (SMA), future research could explore the long-term performance of POC-SMA mixtures under various environmental conditions such as moisture damage, freeze–thaw cycles, and high-temperature rutting. Additionally, studies may investigate the use of surface treatments or additives to enhance the moisture resistance of POC. Life-cycle cost analysis and field-scale implementation are also recommended to validate laboratory findings under real-world traffic loading conditions.
Author Contributions
Conceptualization, A.M.B., A.M., and S.K.; methodology, A.M.B., S.K., W.R., and S.S.; formal analysis, A.M.B., A.S.B.A., and A.A.A.; investigation, A.M.B. and W.R.; resources, S.K. and W.R.; writing—original draft preparation, A.M.B., W.R., and S.S.; writing—review and editing, S.K., A.M., A.S.B.A., and A.A.A.; visualization, A.M.B.; supervision, S.K.; project administration, A.M.B. All authors have read and agreed to the published version of the manuscript.
Funding
This research received no external funding.
Institutional Review Board Statement
Not applicable.
Informed Consent Statement
Not applicable.
Data Availability Statement
The original contributions presented in the study are included in the article, further inquiries can be directed to the corresponding author.
Acknowledgments
The authors express their appreciation to the Interdisciplinary Research Center for Construction and Building Materials (IRC-CBM) at King Fahd University of Petroleum and Minerals, Saudi Arabia. They also wish to thank the University of Malaya, Kuala Lumpur, Malaysia.
Conflicts of Interest
The authors declare no conflicts of interest.
Abbreviations
The following abbreviations are used in this manuscript:
| POC | Palm oil clinker |
| SMA | Stone mastic asphalt |
| RSM | Response surface methodology |
| ANOVA | Analysis of variance |
| GDP | Gross domestic product |
| S. G | Specific gravity |
| W. A | Water absorption |
| M. C | Moisture content |
| F. A | Fine aggregate |
| C. A | Coarse aggregate |
| ASTM | American Society for Testing and Materials |
| BS | British Standard |
| JKR | Malaysian Public Works Department (Jabatan Kerja Raya) |
| VMA | Voids in the mineral aggregate |
| VIM | Air voids or voids in the mixture |
| VFA | Voids filled with asphalt |
| DOE | Design of experiments |
| BC | Binder content |
| OBC | Optimum binder content |
References
- Milad, A.; Babalghaith, A.M.; Al-Sabaeei, A.M.; Dulaimi, A.; Ali, A.; Reddy, S.S.; Bilema, M.; Yusoff, N.I.M. A comparative review of hot and warm mix asphalt technologies from environmental and economic perspectives: Towards a sustainable asphalt pavement. Int. J. Environ. Res. Public Health 2022, 19, 14863. [Google Scholar] [CrossRef]
- Mohammed, S.A.; Koting, S.; Babalghaith, A.M.; Isa, M.H.M.; Khairuddin, F.H. Influence of Coal Bottom Ash as Fine Aggregate Replacement on the Mechanical Properties of Stone Mastic Asphalt. Appl. Sci. 2025, 15, 6826. [Google Scholar] [CrossRef]
- Mondal, A.; Ransinchung, R.; Choudhary, J. Sustainable recycling of industrial waste fillers and reclaimed asphalt pavement to produce environmentally feasible warm mix asphalt. Innov. Infrastruct. Solut. 2023, 8, 34. [Google Scholar] [CrossRef]
- Shaheen, A.u.H.; Ahmed, K.S.; Sarfraz, Y.; Riaz, M.T.; Shahzad, A. Physico-Mechanical Characterization of Cement Concrete using Quarry Waste as Fine Aggregate Replacement of Natural Sand. Arab. J. Sci. Eng. 2023, 48, 13807–13821. [Google Scholar] [CrossRef]
- Odugbose, B.D.; Halim, H.B.; Izwan, J.; Johari, M.A.M.; Mazlan, D.; Wan Mamat Ali, W.M.A. Effects of Incorporating Oil Palm Mesocarp Fiber as Partial Replacement of Fine Aggregate on the Sound Absorption Performance and Mechanical Properties of Standard Concrete. Arab. J. Sci. Eng. 2024, 50, 13267–13282. [Google Scholar] [CrossRef]
- Ragab, M.; Abo El-Naga, I. Performance Assessment of Cold Asphalt Concrete Mixtures Containing Recycled Paving Materials. Arab. J. Sci. Eng. 2022, 47, 4351–4360. [Google Scholar] [CrossRef]
- Babalghaith, A.M.; Koting, S.; Sulong, N.H.R.; Khan, M.Z.H.; Milad, A.; Yusoff, N.I.M.; Ibrahim, M.R.; Mohamed, A.H.b.N. A systematic review of the utilization of waste materials as aggregate replacement in stone matrix asphalt mixes. Environ. Sci. Pollut. Res. 2022, 29, 35557–35582. [Google Scholar] [CrossRef] [PubMed]
- Mohammed, S.A.; Koting, S.; Katman, H.Y.B.; Babalghaith, A.M.; Abdul Patah, M.F.; Ibrahim, M.R.; Karim, M.R. A review of the utilization of coal bottom ash (CBA) in the construction industry. Sustainability 2021, 13, 8031. [Google Scholar] [CrossRef]
- Akbulut, H.; Gürer, C. Use of aggregates produced from marble quarry waste in asphalt pavements. Build. Environ. 2007, 42, 1921–1930. [Google Scholar] [CrossRef]
- Nwakaire, C.M.; Yap, S.P.; Yuen, C.W.; Onn, C.C.; Koting, S.; Babalghaith, A.M. Laboratory study on recycled concrete aggregate based asphalt mixtures for sustainable flexible pavement surfacing. J. Clean. Prod. 2020, 262, 121462. [Google Scholar] [CrossRef]
- Dughaishi, H.A.; Lawati, J.A.; Bilema, M.; Babalghaith, A.M.; Mashaan, N.S.; Yusoff, N.I.M.; Milad, A. Encouraging sustainable use of RAP materials for pavement construction in Oman: A Review. Recycling 2022, 7, 35. [Google Scholar] [CrossRef]
- Khan, M.Z.H.; Koting, S.; Katman, H.Y.B.; Ibrahim, M.R.; Babalghaith, A.M.; Asqool, O. Performance of High Content Reclaimed Asphalt Pavement (RAP) in Asphaltic Mix with Crumb Rubber Modifier and Waste Engine Oil as Rejuvenator. Appl. Sci. 2021, 11, 5226. [Google Scholar] [CrossRef]
- Qomaruddin, M.; Lie, H.A.; Widayat, P. Chemical and Microstructural Changes in Reclaimed Asphalt Pavement Aggregates by Pyrolysis. Arab. J. Sci. Eng. 2024, 49, 13429–13438. [Google Scholar] [CrossRef]
- Abdulrahman, S.; Wahhab, H.A.-a.; Rafiq, W.; Babalghaith, A.M.; Baig, M.G.; Farouk, A.I.B. Stripping and cracking resistance of sustainable warm stone mastic asphalt incorporating construction and demolition waste aggregates with digital image processing. Clean. Mater. 2025, 17, 100324. [Google Scholar] [CrossRef]
- Ndoke, P.N. Performance of palm kernel shells as a partial replacement for coarse aggregate in asphalt concrete. Leonardo Electron. J. Pract. Technol. 2006, 5, 145–152. [Google Scholar]
- Oyedepo, O.J.; Olanitori, L.M.; Olukanni, E.O. Investigation of palm kernel shell as partial replacement for aggregate in asphaltic concrete. Malays. J. Civ. Eng. 2015, 27, 223–234. [Google Scholar] [CrossRef]
- Ameli, A.; Babagoli, R.; Norouzi, N.; Jalali, F.; Poorheydari Mamaghani, F. Laboratory evaluation of the effect of coal waste ash (CWA) and rice husk ash (RHA) on performance of asphalt mastics and Stone matrix asphalt (SMA) mixture. Constr. Build. Mater. 2020, 236, 117557. [Google Scholar] [CrossRef]
- Li, Z.; Zhang, X.; Fa, C.; Zhang, Y.; Xiong, J.; Chen, H. Investigation on characteristics and properties of bagasse fibers: Performances of asphalt mixtures with bagasse fibers. Constr. Build. Mater. 2020, 248, 118648. [Google Scholar] [CrossRef]
- Mansor, S.; Zainuddin, N.I.; Aziz, N.A.; Razali, M.; Joohari, M.I. Sugarcane bagasse fiber—An eco-friendly pavement of SMA. In Proceedings of the International Conference on Advances in Civil Engineering and Science Technology, ICACEST 2018, Penang, Malaysia, 5–6 September 2018. [Google Scholar]
- Jeffry, S.N.A.; Jaya, R.P.; Hassan, N.A.; Yaacob, H.; Mirza, J.; Drahman, S.H. Effects of nanocharcoal coconut-shell ash on the physical and rheological properties of bitumen. Constr. Build. Mater. 2018, 158, 1–10. [Google Scholar] [CrossRef]
- Prasad, S.G.S.; Venkatesh, U.M.V. An experimental investigation on stone matrix asphalt by using coconut and banana fibers. Int. J. Civ. Eng. Technol. 2018, 9, 964–973. [Google Scholar]
- Bolden, J.; Abu-Lebdeh, T.; Fini, E. Utilization of recycled and waste materials in various construction applications. Am. J. Environ. Sci. 2013, 9, 14–24. [Google Scholar] [CrossRef]
- Lam, M.K.; Jamalluddin, N.A.; Lee, K.T. Chapter 23—Production of Biodiesel Using Palm Oil. In Biofuels: Alternative Feedstocks and Conversion Processes for the Production of Liquid and Gaseous Biofuels, 2nd ed.; Pandey, A., Larroche, C., Dussap, C.-G., Gnansounou, E., Khanal, S.K., Ricke, S., Eds.; Academic Press: Cambridge, MA, USA, 2019; pp. 539–574. [Google Scholar]
- Malaysian Palm Oil Board. Monthly Production of Oil Palm Products Summary for The Month of December. Available online: http://bepi.mpob.gov.my/index.php/en/production/production-2019/production-of-oil-palm-products-2019.html (accessed on 10 January 2020).
- Andiappan, V.; Ng, D.K.; Tan, R.R. Cooperative Game Theory Analysis for Implementing Green Technologies in Palm Oil Milling Processes. In Green Technologies for the Oil Palm Industry; Springer: New York, NY, USA, 2019; pp. 173–190. [Google Scholar]
- Dungani, R.; Aditiawati, P.; Aprilia, S.; Yuniarti, K.; Karliati, T.; Suwandhi, I.; Sumardi, I. Biomaterial from Oil Palm Waste: Properties, Characterization and Applications. In Palm Oil; IntechOpen: London, UK, 2018; Volume 31. [Google Scholar] [CrossRef]
- Mohammed, M.; Salmiaton, A.; Azlina, W.W.; Amran, M.M.; Fakhru’l-Razi, A.; Taufiq-Yap, Y. Hydrogen rich gas from oil palm biomass as a potential source of renewable energy in Malaysia. Renew. Sustain. Energy Rev. 2011, 15, 1258–1270. [Google Scholar] [CrossRef]
- Hamzah, N.; Tokimatsu, K.; Yoshikawa, K. Solid fuel from oil palm biomass residues and municipal solid waste by hydrothermal treatment for electrical power generation in Malaysia: A review. Sustainability 2019, 11, 1060. [Google Scholar] [CrossRef]
- Yusof, M.; Hanim, S.J.; Roslan, A.M.; Ibrahim, K.N.; Abdullah, S.; Soplah, S.; Zakaria, M.R.; Hassan, M.A.; Shirai, Y. Life Cycle Assessment for Bioethanol Production from Oil Palm Frond Juice in an Oil Palm Based Biorefinery. Sustainability 2019, 11, 6928. [Google Scholar] [CrossRef]
- Kroehong, W.; Damrongwiriyanupap, N.; Sinsiri, T.; Jaturapitakkul, C. The Effect of Palm Oil Fuel Ash as a Supplementary Cementitious Material on Chloride Penetration and Microstructure of Blended Cement Paste. Arab. J. Sci. Eng. 2016, 41, 4799–4808. [Google Scholar] [CrossRef]
- Ahmad, H.; Hilton, M.; Mohd Noor, N. Physical properties of local palm oil clinker and fly ash. In Proceedings of the 1st Engineering Conference on Energy and Environment, Kuching, Sarawak, 27–28 December 2007. [Google Scholar]
- Tangchirapat, W.; Saeting, T.; Jaturapitakkul, C.; Kiattikomol, K.; Siripanichgorn, A. Use of waste ash from palm oil industry in concrete. Waste Manag. 2007, 27, 81–88. [Google Scholar] [CrossRef] [PubMed]
- Rame, R.; Purwanto, P.; Sudarno, S. Biotechnological approaches in utilizing agro-waste for biofuel production: An extensive review on techniques and challenges. Bioresour. Technol. Rep. 2023, 24, 101662. [Google Scholar] [CrossRef]
- Askari, D.F.A.; Shkur, S.S.; Rafiq, S.K.; Hilmi, H.D.M.; Ahmad, S.A. Prediction model of compressive strength for eco-friendly palm oil clinker light weight concrete: A review and data analysis. Discov. Civ. Eng. 2024, 1, 140. [Google Scholar] [CrossRef]
- Jamaludin, N.; Ghazali, N.; Muthusamy, K.; Razi, P.; Jaafar, M.M. Compressive strength of lightweight aggregate concrete with palm oil clinker waste as river sand replacement. In AIP Conference Proceedings; AIP Publishing: Melville, NY, USA, 2024; p. 030004. [Google Scholar]
- Nayaka, R.R.; Alengaram, U.J.; Jumaat, M.Z.; Yusoff, S.B.; Ganasan, R. Performance evaluation of masonry grout containing high volume of palm oil industry by-products. J. Clean. Prod. 2019, 220, 1202–1214. [Google Scholar] [CrossRef]
- Ibrahim, H.A.; Razak, H.A.; Abutaha, F. Strength and abrasion resistance of palm oil clinker pervious concrete under different curing method. Constr. Build. Mater. 2017, 147, 576–587. [Google Scholar] [CrossRef]
- Lee, K.M.; Zanil, M.F.; Chan, K.K.; Chin, Z.P.; Liu, Y.C.; Lim, S. Synergistic ultrasound-assisted organosolv pretreatment of oil palm empty fruit bunches for enhanced enzymatic saccharification: An optimization study using artificial neural networks. Biomass Bioenergy 2020, 139, 105621. [Google Scholar] [CrossRef]
- Karim, M.R.; Hashim, H.; Razak, H.A.; Yusoff, S. Characterization of palm oil clinker powder for utilization in cement-based applications. Constr. Build. Mater. 2017, 135, 21–29. [Google Scholar] [CrossRef]
- Bayagoob, K.H.; Zeyad, A.M.; Amin, M.; Agwa, I.S.; Abd-Elrahman, M.H. Influence of palm oil ash and palm oil clinker on the properties of lightweight concrete. Rev. Adv. Mater. Sci. 2024, 63, 20240079. [Google Scholar] [CrossRef]
- Babalghaith, A.M.; Koting, S.; Sulong, N.H.R.; Karim, M.R.; AlMashjary, B.M. Performance evaluation of stone mastic asphalt (SMA) mixtures with palm oil clinker (POC) as fine aggregate replacement. Constr. Build. Mater. 2020, 262, 120546. [Google Scholar] [CrossRef]
- Hamada, H.M.; Yahaya, F.M.; Muthusamy, K.; Jokhio, G.A.; Humada, A.M. Fresh and hardened properties of palm oil clinker lightweight aggregate concrete incorporating Nano-palm oil fuel ash. Constr. Build. Mater. 2019, 214, 344–354. [Google Scholar] [CrossRef]
- Abutaha, F.; Razak, H.A.; Ibrahim, H.A.; Ghayeb, H.H. Adopting particle-packing method to develop high strength palm oil clinker concrete. Resour. Conserv. Recycl. 2018, 131, 247–258. [Google Scholar] [CrossRef]
- Abutaha, F.; Abdul Razak, H.; Kanadasan, J. Effect of palm oil clinker (POC) aggregates on fresh and hardened properties of concrete. Constr. Build. Mater. 2016, 112, 416–423. [Google Scholar] [CrossRef]
- Ahmmad, R.; Jumaat, M.Z.; Alengaram, U.J.; Bahri, S.; Rehman, M.A.; bin Hashim, H. Performance evaluation of palm oil clinker as coarse aggregate in high strength lightweight concrete. J. Clean. Prod. 2016, 112, 566–574. [Google Scholar] [CrossRef]
- Kanadasan, J.; Razak, H.A. Mix design for self-compacting palm oil clinker concrete based on particle packing. Mater. Des. 2014, 56, 9–19. [Google Scholar] [CrossRef]
- Mohammed, B.S.; Foo, W.; Abdullahi, M. Flexural strength of palm oil clinker concrete beams. Mater. Des. 2014, 53, 325–331. [Google Scholar] [CrossRef]
- Darvish, P.; Alengaram, U.J.; Poh, Y.S.; Ibrahim, S.; Yusoff, S. Volume based design approach for sustainable palm oil clinker as whole replacement for conventional sand in mortar. J. Build. Eng. 2020, 32, 101660. [Google Scholar] [CrossRef]
- Nayaka, R.R.; Alengaram, U.J.; Jumaat, M.Z.; Yusoff, S.B.; Alnahhal, M.F. High volume cement replacement by environmental friendly industrial by-product palm oil clinker powder in cement–lime masonry mortar. J. Clean. Prod. 2018, 190, 272–284. [Google Scholar] [CrossRef]
- Karim, M.R.; Chowdhury, F.I.; Zabed, H.; Saidur, M.R. Effect of elevated temperatures on compressive strength and microstructure of cement paste containing palm oil clinker powder. Constr. Build. Mater. 2018, 183, 376–383. [Google Scholar] [CrossRef]
- Karim, M.R.; Hashim, H.; Razak, H.A. Thermal activation effect on palm oil clinker properties and their influence on strength development in cement mortar. Constr. Build. Mater. 2016, 125, 670–678. [Google Scholar] [CrossRef]
- Karim, M.R.; Hashim, H.; Abdul Razak, H. Assessment of pozzolanic activity of palm oil clinker powder. Constr. Build. Mater. 2016, 127, 335–343. [Google Scholar] [CrossRef]
- Kanadasan, J.; Abdul Razak, H. Utilization of palm oil clinker as cement replacement material. Materials 2015, 8, 8817–8838. [Google Scholar] [CrossRef]
- Kirchherr, J.; Reike, D.; Hekkert, M. Conceptualizing the circular economy: An analysis of 114 definitions. Resour. Conserv. Recycl. 2017, 127, 221–232. [Google Scholar] [CrossRef]
- ASTM D5; Standard Test Method for Penetration of Bituminous Materials. ASTM International: West Conshohocken, PA, USA, 2013.
- ASTM D36; Standard Test Method for Softening Point of Bitumen (Ring-and-Ball Apparatus). ASTM International: West Conshohocken, PA, USA, 2014.
- ASTM D113; Standard Test Method for Ductility of Bituminous Materials. ASTM International: West Conshohocken, PA, USA, 2007.
- ASTM D4402; Standard Test Method for Viscosity Determination of Asphalt at Elevated Temperatures Using a Rotational Viscometer. ASTM International: West Conshohocken, PA, USA, 2015.
- ASTM D70; Standard Test Method for Density of Semi-Solid Bituminous Materials (Pycnometer Method). ASTM International: West Conshohocken, PA, USA, 2009.
- ASTM D7175; Standard Test Method for Determining the Rheological Properties of Asphalt Binder Using a Dynamic Shear Rheometer. ASTM International: West Conshohocken, PA, USA, 2015.
- Jabatan Kerja Raya (JKR) Malaysia. Standard Specification for Road Work, in Section 4: Flexible Pavement 2008; Malaysian Public Works Department: Kuala Lumpur, Malaysia, 2008. [Google Scholar]
- ASTM C131; Standard Test Method for Resistance to Degradation of Small-Size Coarse Aggregate by Abrasion and Impact in the Los Angeles Machine. ASTM International: West Conshohocken, PA, USA, 2014.
- ASTM D4791; Standard Test Method for Flat Particles, Elongated Particles, or Flat and Elongated Particles in Coarse Aggregate. ASTM International: West Conshohocken, PA, USA, 2010.
- BS 812-3; Testing Aggregates—Part 3: Methods for Determination of Aggregate Impact Value. British Standards Institution: London, UK, 1975.
- ASTM C127; Standard Test Method for Relative Density (Specific Gravity) and Absorption of Coarse Aggregate. ASTM International: West Conshohocken, PA, USA, 2015.
- ASTM C128; Standard Test Method for Relative Density (Specific Gravity) and Absorption of Fine Aggregate. ASTM International: West Conshohocken, PA, USA, 2022.
- Hasan, K.; Roy, S.; Yahaya, F.M. An experimental and numerical investigation of using palm oil fuel ash as a partial cement replacement in steel fiber-reinforced concrete. Innov. Infrastruct. Solut. 2024, 9, 361. [Google Scholar] [CrossRef]
- Wills, B.A.; Finch, J. Wills’ Mineral Processing Technology: An Introduction to the practical Aspects of Ore Treatment and Mineral Recovery; Butterworth-Heinemann: Oxford, UK, 2015. [Google Scholar]
- Masri, K.; Fatin, N.N.; Chin, S.; Syafiqah, S.N.; Shaffie, E. Utilization of Bamboo Fiber towards sustainable asphalt mixture. In IOP Conference Series: Earth and Environmental Science; IOP Publishing Ltd.: Bristol, UK, 2021; p. 012002. [Google Scholar]
- Yu, D.; Jia, A.; Feng, C.; Liu, W.; Fu, T.; Qiu, R. Preparation and mechanical properties of asphalt mixtures reinforced by modified bamboo fibers. Constr. Build. Mater. 2021, 286, 122984. [Google Scholar] [CrossRef]
- Chen, Z.; Chen, Z.; Yi, J.; Feng, D. Application of Corn Stalk Fibers in SMA Mixtures. J. Mater. Civ. Eng. 2021, 33, 04021147. [Google Scholar] [CrossRef]
- Fauzi, N.M.; Masri, K.; Ramadhansyah, P.; Samsudin, M.; Ismail, A.; Arshad, A.; Shaffie, E.; Norhidayah, A.; Hainin, M. Volumetric Properties and Resilient Modulus of Stone Mastic Asphalt incorporating Cellulose Fiber. In IOP Conference Series: Materials Science and Engineering; IOP Publishing Ltd.: Bristol, UK, 2020; p. 012028. [Google Scholar]
- Zhu, S.; Kong, L.; Fu, Y.; Peng, Y.; Chen, Y.; Wang, H.; Jian, O.; Zhao, P.; Zhang, W. Effect of hydrophilic group substituent position on adhesion at the emulsified asphalt/aggregate interface. Constr. Build. Mater. 2024, 444, 137783. [Google Scholar] [CrossRef]
- Al-Hadidy, A.; Yi-qiu, T. Effect of polyethylene on life of flexible pavements. Constr. Build. Mater. 2009, 23, 1456–1464. [Google Scholar] [CrossRef]
- Chen, J.-S.; Wei, S.-H. Engineering properties and performance of asphalt mixtures incorporating steel slag. Constr. Build. Mater. 2016, 128, 148–153. [Google Scholar] [CrossRef]
- Rongali, U.; Singh, G.; Chourasiya, A.; Jain, P. Laboratory performance of stone matrix asphalt containing composite of fly ash and plastic waste. J. Ssientifc Ind. Res. 2013, 72, 186–192. [Google Scholar]
- Hainin, M.R.; Rusbintardjo, G.; Aziz, M.A.A.; Hamim, A.; Yusoff, N.I.M. Laboratory evaluation on steel slag as aggregate replacement in stone mastic asphalt mixtures. J. Teknol. 2013, 65. [Google Scholar] [CrossRef]
- Pourtahmasb, M.S.; Karim, M.R. Utilization of recycled concrete aggregates in stone mastic asphalt mixtures. Adv. Mater. Sci. Eng. 2014, 2014, 902307. [Google Scholar] [CrossRef]
- Devulapalli, L.; Kothandaraman, S.; Sarang, G. Evaluation of rejuvenator’s effectiveness on the reclaimed asphalt pavement incorporated stone matrix asphalt mixtures. Constr. Build. Mater. 2019, 224, 909–919. [Google Scholar] [CrossRef]
- Devulapalli, L.; Kothandaraman, S.; Sarang, G. Effect of rejuvenating agents on stone matrix asphalt mixtures incorporating RAP. Constr. Build. Mater. 2020, 254, 119298. [Google Scholar] [CrossRef]
- Huang, Q.; Qian, Z.; Hu, J.; Zheng, D. Evaluation of Stone Mastic Asphalt Containing Ceramic Waste Aggregate for Cooling Asphalt Pavement. Materials 2020, 13, 2964. [Google Scholar] [CrossRef] [PubMed]
- Babalghaith, A.M.; Koting, S.; Ibrahim, M.R.; Mohd, N.S.; Rozali, S.; Muhamad, M.R.; Zubir, M.N.M.; El-Shafei, A.; Khairuddin, F.H.; Yusoff, N.I.M. Effect of Black PET Fiber as Additive on the Mechanical Properties of Stone Mastic Asphalt (SMA) Mixtures. In Proceedings of the Advances in Civil Engineering Materials: Selected Articles from the International Conference on Architecture and Civil Engineering (ICACE2020), Kuala Lumpur, Malaysia, 21–23 December 2020; pp. 249–260. [Google Scholar]
- Azarhoosh, A.; Pouresmaeil, S. Prediction of Marshall Mix Design Parameters in Flexible Pavements Using Genetic Programming. Arab. J. Sci. Eng. 2020, 45, 8427–8441. [Google Scholar] [CrossRef]
- Zhang, Y.; Zhu, W.; Chu, X.; Shi, L.; Zhan, X.; Cheng, H.; Sun, L. The mechanical behavior of designing recycled hot-mix asphalt containing fine RAP particles with multiple parameters using orthogonal experimental approach. Constr. Build. Mater. 2025, 458, 139654. [Google Scholar] [CrossRef]
- Esmaeili, N.; Alavi, M.Z.; Samadzad, M. Evaluation of the impacts of polymeric fibers and modifiers on the fracture properties of asphalt mixtures. Results Eng. 2025, 25, 103862. [Google Scholar] [CrossRef]
- Belc, A.L.; Costescu, C.; Belc, F. Considerations concerning the determination and interpretation of Marshall flow values in asphalt concretes. Int. Multidiscip. Sci. GeoConference SGEM 2018, 18, 97–104. [Google Scholar]
- Kuchu, J. Sustainable utilisation of sugar cane molasses as a partial replacement to bitumen in bituminous pavements. In IOP Conference Series: Earth and Environmental Science; IOP Publishing Ltd.: Bristol, UK, 2024; p. 012018. [Google Scholar]
- Zeiada, W.; Abu Dabous, S.; Al-Ruzouq, R.; Hamad, K.; Souliman, M.I.; Mirou, S. Effect of air voids and asphalt content changes on laboratory and simulated long-term fatigue performance of asphalt concrete pavements. Innov. Infrastruct. Solut. 2023, 8, 48. [Google Scholar] [CrossRef]
- Abdul-Rahman, M.N.; Abdul-Wahab, A.F. Green pavement using recycled polyethylene terephthalate (PET) as partial fine aggregate replacement in modified asphalt. Procedia Eng. 2013, 53, 124–128. [Google Scholar] [CrossRef]
- Acosta Álvarez, D.; Alonso Aenlle, A.; Tenza-Abril, A.J.; Ivorra, S. Influence of Partial Coarse Fraction Substitution of Natural Aggregate by Recycled Concrete Aggregate in Hot Asphalt Mixtures. Sustainability 2020, 12, 250. [Google Scholar] [CrossRef]
- Panda, M.; Suchismita, A.; Giri, J. Utilization of ripe coconut fiber in stone matrix asphalt mixes. Int. J. Transp. Sci. Technol. 2013, 2, 289–302. [Google Scholar] [CrossRef]
- Asi, I.M. Laboratory comparison study for the use of stone matrix asphalt in hot weather climates. Constr. Build. Mater. 2006, 20, 982–989. [Google Scholar] [CrossRef]
- Ahmadinia, E.; Zargar, M.; Karim, M.R.; Abdelaziz, M.; Shafigh, P. Using waste plastic bottles as additive for stone mastic asphalt. Mater. Des. 2011, 32, 4844–4849. [Google Scholar] [CrossRef]
- National Asphalt Pavement Association. Designing and Constructing SMA Mixtures: State of the Practice; Quality Improvement Series 122-2002; National Asphalt Pavement Association (NAPA): Greenbelt, MD, USA, 2002. [Google Scholar]
- Chadbourn, B.A.; Skok Jr, E.L.; Newcomb, D.E.; Crow, B.L.; Spindle, S. The Effect of Voids in Mineral Aggregate (VMA) on Hot-Mix Asphalt Pavements; Minnesota Department of Transportation: Saint Paul, MN, USA, 1999. [Google Scholar]
- Liu, Z.; Sun, L.; Li, J.; Liu, L. Effect of key design parameters on high temperature performance of asphalt mixtures. Constr. Build. Mater. 2022, 348, 128651. [Google Scholar] [CrossRef]
- Wang, W.; Cheng, Y.; Tan, G. Design optimization of SBS-modified asphalt mixture reinforced with eco-friendly basalt fiber based on response surface methodology. Materials 2018, 11, 1311. [Google Scholar] [CrossRef] [PubMed]
- Sheidaei, M.; Zhu, J.; Agardh, S. Assessing the Effect of Specimen Preparation Methods on DSR Test Results of Bitumen Using Factorial Design Analysis. Materials 2024, 17, 5117. [Google Scholar] [CrossRef] [PubMed]
Disclaimer/Publisher’s Note: The statements, opinions and data contained in all publications are solely those of the individual author(s) and contributor(s) and not of MDPI and/or the editor(s). MDPI and/or the editor(s) disclaim responsibility for any injury to people or property resulting from any ideas, methods, instructions or products referred to in the content. |
© 2025 by the authors. Licensee MDPI, Basel, Switzerland. This article is an open access article distributed under the terms and conditions of the Creative Commons Attribution (CC BY) license (https://creativecommons.org/licenses/by/4.0/).