Article

Characterization of Slurry Sedimentation and Microstructure in Immersed Tube Tunnel Trenches: A Case Study of the Tanzhou Waterway Dredging Strategy

1
Foshan Shunde District Construction Project Center, Foshan 528000, China
2
School of Civil Engineering, Sun Yat-sen University, Guangzhou 510275, China
3
CCCC Highway Consultants Co., Ltd., Beijing 100088, China
4
CCCC Highway Bridges National Engineering Research Centre Co., Ltd., Beijing 100088, China
*
Author to whom correspondence should be addressed.
Eng 2025, 6(8), 200; https://doi.org/10.3390/eng6080200
Submission received: 8 June 2025 / Revised: 29 July 2025 / Accepted: 12 August 2025 / Published: 13 August 2025
(This article belongs to the Section Chemical, Civil and Environmental Engineering)

Abstract

This study investigates sedimentation dynamics and microstructural evolution of silty clay and mucky sediments from the immersed tube tunnel trench of the Shunde Tanzhou Waterway. Experiments examined different initial unit weights (11.5–12.6 kN/m3) and heights (10–60 cm) through sedimentation tests (N = 30, representing five heights × three unit weights × two soil types) and scanning electron microscopy (SEM) imaging. Results identified two sedimentation patterns: consolidation (inverse “S” curve) and hindered (three-stage) types. Key findings reveal that silty clay exhibits height-dependent transition between patterns (critical height = 30 cm at γ = 12.6 kN/m3). Mucky soil demonstrates stable hindered settlement across conditions (rate = 0.09 ± 0.01 cm/min at γ = 12.0 kN/m3). Moisture distribution analysis reveals that unstable structures in low-unit-weight slurries exhibit slow drainage and steady moisture content changes. Microstructural analysis uncovered height-dependent porosity increases and pore complexity in mucky soils, alongside reduced honeycomb-like cavities and enhanced particle aggregation in silty clay under lower unit weights. These results provide novel insights into the interplay between initial slurry conditions and sedimentation behavior, offering a theoretical foundation for optimizing dredging strategies and ensuring long-term sediment stability in immersed tube tunnel projects.

1. Introduction

With the growing number of large-scale transportation infrastructure construction projects in coastal areas, immersed tube tunnels have been widely adopted for cross-river and sea-crossing projects due to their excellent adaptability to complex environments, relatively short construction periods, and significant economic advantages [1,2,3]. However, abnormal back-silting in the trenches is one of the primary causes of construction hazards during immersed tube tunnel construction [4]. Back-silting, which is a typical sediment redeposition phenomenon during trench excavation [5], results from hydrodynamic conditions, sediment transport, and geological factors [6,7]. Typically, back-silted materials mainly consist of mucky soils with high water content and low strength, which can significantly reduce the bearing capacity of the trench foundation and threaten the long-term stability of the immersed tube structure [8,9]. Understanding the causes behind abnormal back-silting phenomena, such as sudden intense back-silting or heterogeneous sedimentary layers, and characterizing the silt-clay sedimentation characteristics within the foundation trench are not only essential for ensuring precise immersion and docking of the immersed tube but also represent scientific challenges in achieving dynamic prediction and prevention of back-silting.
Research on the sedimentation characteristics of back-silted materials has established a relatively systematic theoretical framework [10,11]. Zhang et al. [12] experimentally demonstrated the inverse particle size effect in underwater sedimentation (where finer particles settle faster due to fluid interactions), which challenges conventional Stokes law predictions. However, their study was limited to idealized non-cohesive particles. In contrast, cohesive silty clay exhibits more complex flocculation–sedimentation coupling behavior. This study reveals that the initial unit weight has a greater influence on sedimentation rate than particle size alone, providing a new parameter dimension for predicting back-silting in engineering applications. While Vasudevan et al. [13] showed traction current as the dominant sediment transport mechanism along the Kerala coast, the Tanzhou Waterway is an inland channel with markedly different hydrodynamic conditions: (1) significantly weaker tidal influence and (2) substantially higher suspended sediment concentrations (120–180 mg/L versus <50 mg/L). These distinctive conditions result in flocculent sedimentation patterns observed in our study that align more closely with Imai’s [14] Type II mode, rather than the rolling saltation-dominated mechanism reported in [13]. This comparative analysis highlights the key role of regional hydrodynamic conditions in governing sedimentation regimes. Imai et al. [14] elucidated the sedimentation mechanisms of clayey materials through laboratory experiments, dividing the sedimentation process into three distinct phases: flocculation, settling, and consolidation. Their study emphasized that sediment formation is primarily governed by initial water content rather than a specific critical threshold. Building upon this, subsequent research [15] further classified mucky sediment settling into four types: dispersed free settling, flocculated free settling, zone settling, and consolidation settling, with the dominant mode being controlled by water salinity (affecting flocculation degree) and sediment concentration (determining interparticle interactions). In numerical modeling, Toorman et al. [16] developed a coupled settling-consolidation model for cohesive sediments based on hindered settling theory. By incorporating classical soil mechanics principles and experimental calibration, this model effectively predicts density evolution and stratification characteristics under varying initial conditions. For practical engineering applications, Balaji et al. [17] combined field observations (tidal dynamics, flow velocity and direction, suspended sediment concentration, and multi-period bathymetric data) with Delft3D hydrodynamic modeling to successfully quantify siltation hydrodynamics in navigation channels. Notably, Gao et al. [18] systematically demonstrated, through comparative experiments, the scale effect of settling column diameter on dredged slurry settling patterns and rates, providing crucial insights for standardizing laboratory testing methodologies.
Recent advances in multi-scale characterization have greatly enhanced our understanding of sediment microstructural characteristics and evolution mechanisms. Yang et al. [19] characterized Tianjin dredged soft clay, documenting systematic depth-dependent microstructural variations: a surface flocculated sheet-stacking structure (face-to-face contact) that gradually transitions to a granular mosaic structure at greater depths, accompanied by pore system evolution from fine, poorly connected voids to uniformly distributed pores. These structural changes elucidate the microstructure-mechanical property relationships. Hu et al. [20] analyzed South China Sea deep-sea sediments, finding that micro-fossil pores (0.5–2.0 μm) remain stable under loading while interparticle pores reorganize. This distinctive structural characteristic explains the marked difference in compression behavior between undisturbed and remolded samples. Oberhollenzer et al. [21] demonstrated the influence of mineral evolution on structural stability, showing that authigenic calcite crystals significantly enhance soil structure stability through particle bridging. Cai et al. [22] employed multi-scale techniques to verify the key role of hydration product cementation and pore-filling in microstructural improvement during CaO-activated slag treatment of marine dredged sludge, providing mechanistic insights into stabilization processes.
Despite these advances, critical gaps remain in understanding how initial slurry conditions (unit weight/height) govern both macroscopic sedimentation patterns and concurrent microstructural reorganization. Existing studies [12,16,23] primarily focus on hydrodynamic controls, neglecting the role of sediment microstructure in long-term trench stability. Furthermore, the interaction between sedimentation dynamics (e.g., hindered vs. consolidation) and pore-scale particle arrangements—crucial for predicting back-silting heterogeneity—has yet to be quantitatively established.
This study investigates the silty clay and mucky soil sediments from the immersed tunnel trench in Shunde’s Tanzhou Waterway through systematic sedimentation experiments and multi-scale characterization. The research aims to elucidate the sedimentation dynamics and microstructural evolution of slurry under varying initial conditions (unit weight and height), with particular focus on (1) the temporal variation patterns of sedimentation time–history curves and settling rates, (2) spatiotemporal distribution characteristics of moisture content along the vertical profile, and (3) the correlation mechanisms between microstructural features (pore morphology, particle arrangement) and macroscopic sedimentation behavior. The findings provide theoretical foundations for predicting back-silting in immersed tunnel trenches and optimizing dredging criteria while also serving as a methodological reference for sediment characterization in similar engineering projects.

2. Materials and Methods

2.1. Field Sampling and Soil Characterization

Sampling was conducted along the Hengyi Road to Hengwu Road section of the Lun-Gui Road Project in Shunde District, Foshan City, where the immersed tube tunnel traverses the Tanzhou Waterway. Sediment samples were collected from the bottom of the Tanzhou Waterway, consisting primarily of silty clay and mucky soil layers. Figure 1 shows the specific sampling locations and detailed sampling procedures. During low tide periods (water depth 2.1 ± 0.3 m), sediment samples were collected from 12 representative locations along the 2.3 km Hengyi-Hengwu section, with triplicate samples taken at each location to ensure statistical reliability. In situ measurements included water content of 58–72% (determined by vane shear test), undrained shear strength of 12–18 kPa (measured by pocket penetrometer), and temperature of 22.5 ± 1.5 °C. A stratified random sampling design was used: the surface layer (0–1 m) yielded 36 samples (12 locations × 3 replicates), collected using stainless steel scoops, while the subsurface layer (1–2 m) provided 24 core samples (8 locations × 3), obtained with a 50 mm diameter piston corer.
The study area encompasses a 2.3 km section of Tanzhou Waterway (23.85° N, 113.25° E) characterized by complex hydrodynamic and geological conditions. Field measurements revealed a mean water depth of 8.2 ± 1.5 m with maximum tidal currents reaching 1.5 m/s during spring ebb tides, while wave monitoring indicated that 90% of observed wave heights were below 0.8 m. The waterway undergoes biannual maintenance dredging, with historical records showing an average annual sediment accumulation of 120,000 m3 and the most recent 2023 dredging removing 85,000 m3 of sediment. The strata of the Tanzhou Waterway, from top to bottom, consist of the Quaternary Holocene artificial fill layer, the Quaternary Holocene marine–continental transitional sedimentary layer, and the Lower Cretaceous bedrock of argillaceous siltstone. The artificial fill layer features uneven composition and a loose structure. The marine–continental transitional sedimentary layer comprises soft soils such as silt and silty soil, characterized by high porosity and compressibility. The bedrock comprises argillaceous siltstone, with rocks in the strongly and moderately weathered zones being relatively fragmented and exhibiting low bearing capacity. Additionally, the site is characterized by special rock and soil conditions, as well as adverse geological phenomena, including soft soil seismic subsidence and sand liquefaction [24].
The basic characteristics of the soil, as summarized in Table 1, were determined using the pycnometer method in conjunction with a combined liquid and plastic limit tester. Following geotechnical testing standards [25], soil samples collected from the site were dried, crushed, and passed through a sieve with a 2 mm aperture. Subsequently, particle size analysis was performed on the soils of varying particle sizes using both the sieving method and densitometry. The test results are illustrated in Figure 2. For particle size analysis, sieve analysis was used for coarse particles (>0.075 mm), while the hydrometer method was employed for fine particles (<0.075 mm). For sieve analysis, there was an approximately ±2% error due to residual cohesive soil on the sieves, while the hydrometer measurements exhibited ±3–5% variability resulting from temperature fluctuations, parallax errors in readings, and timing inaccuracies. The standard sieves had an aperture tolerance of ±5%, and the hydrometer resolution ranged from 0.0005 to 0.001 g/cm3.

2.2. Experimental Design

To address engineering problems caused by abnormal siltation following the excavation of the foundation trench, different initial unit weights of slurry were prepared for two types of soil that may experience siltation at the bottom of the Tanzhou Waterway, and the sedimentation characteristics were compared considering the influence of different initial heights. The experimental parameters were systematically designed based on both engineering specifications and fundamental sedimentation research:
(1) Unit weight selection:
11.5 kN/m3: The mandatory dredging threshold when silt thickness exceeds 8 cm, as specified in the Hong Kong–Zhuhai–Macao Bridge project [26,27,28]. 12.6 kN/m3: The allowable limit for temporary siltation (< 4 cm thickness) per Shenzhen–Zhongshan Link standards [29,30]. 12.0 kN/m3: An intermediate operational control target established through field practice.
(2) Initial height design:
Shallow conditions (10–20 cm): Simulating post-dredging monitoring scenarios. Critical transition (30 cm): Corresponding to the flocculation-to-hindered settling transition identified by Imai [14,15]. Deep scenarios (40–60 cm): Covering extreme siltation cases during construction pauses. The initial heights of the slurry were set to five levels: 10 cm, 20 cm, 30 cm, 40 cm, and 60 cm.
It should be noted that both the Hong Kong–Zhuhai–Macau Bridge and Shenzhen–Zhongshan Link projects, like this study, address geotechnical challenges posed by soft soils and sandy layers. Their sedimentation history is influenced by sediment transport processes in the Pearl River Basin, and their construction faces comparable hydroclimatic constraints (e.g., tidal dynamics and typhoons). The key distinction lies in the referenced projects’ deep-water settings with more pronounced tidal/wave effects, whereas the Tanzhou Waterway is a shallow inland channel. Given these shared geological and hydrological fundamentals, the dredging standards from these projects provide a scientifically robust basis for this experimental design.
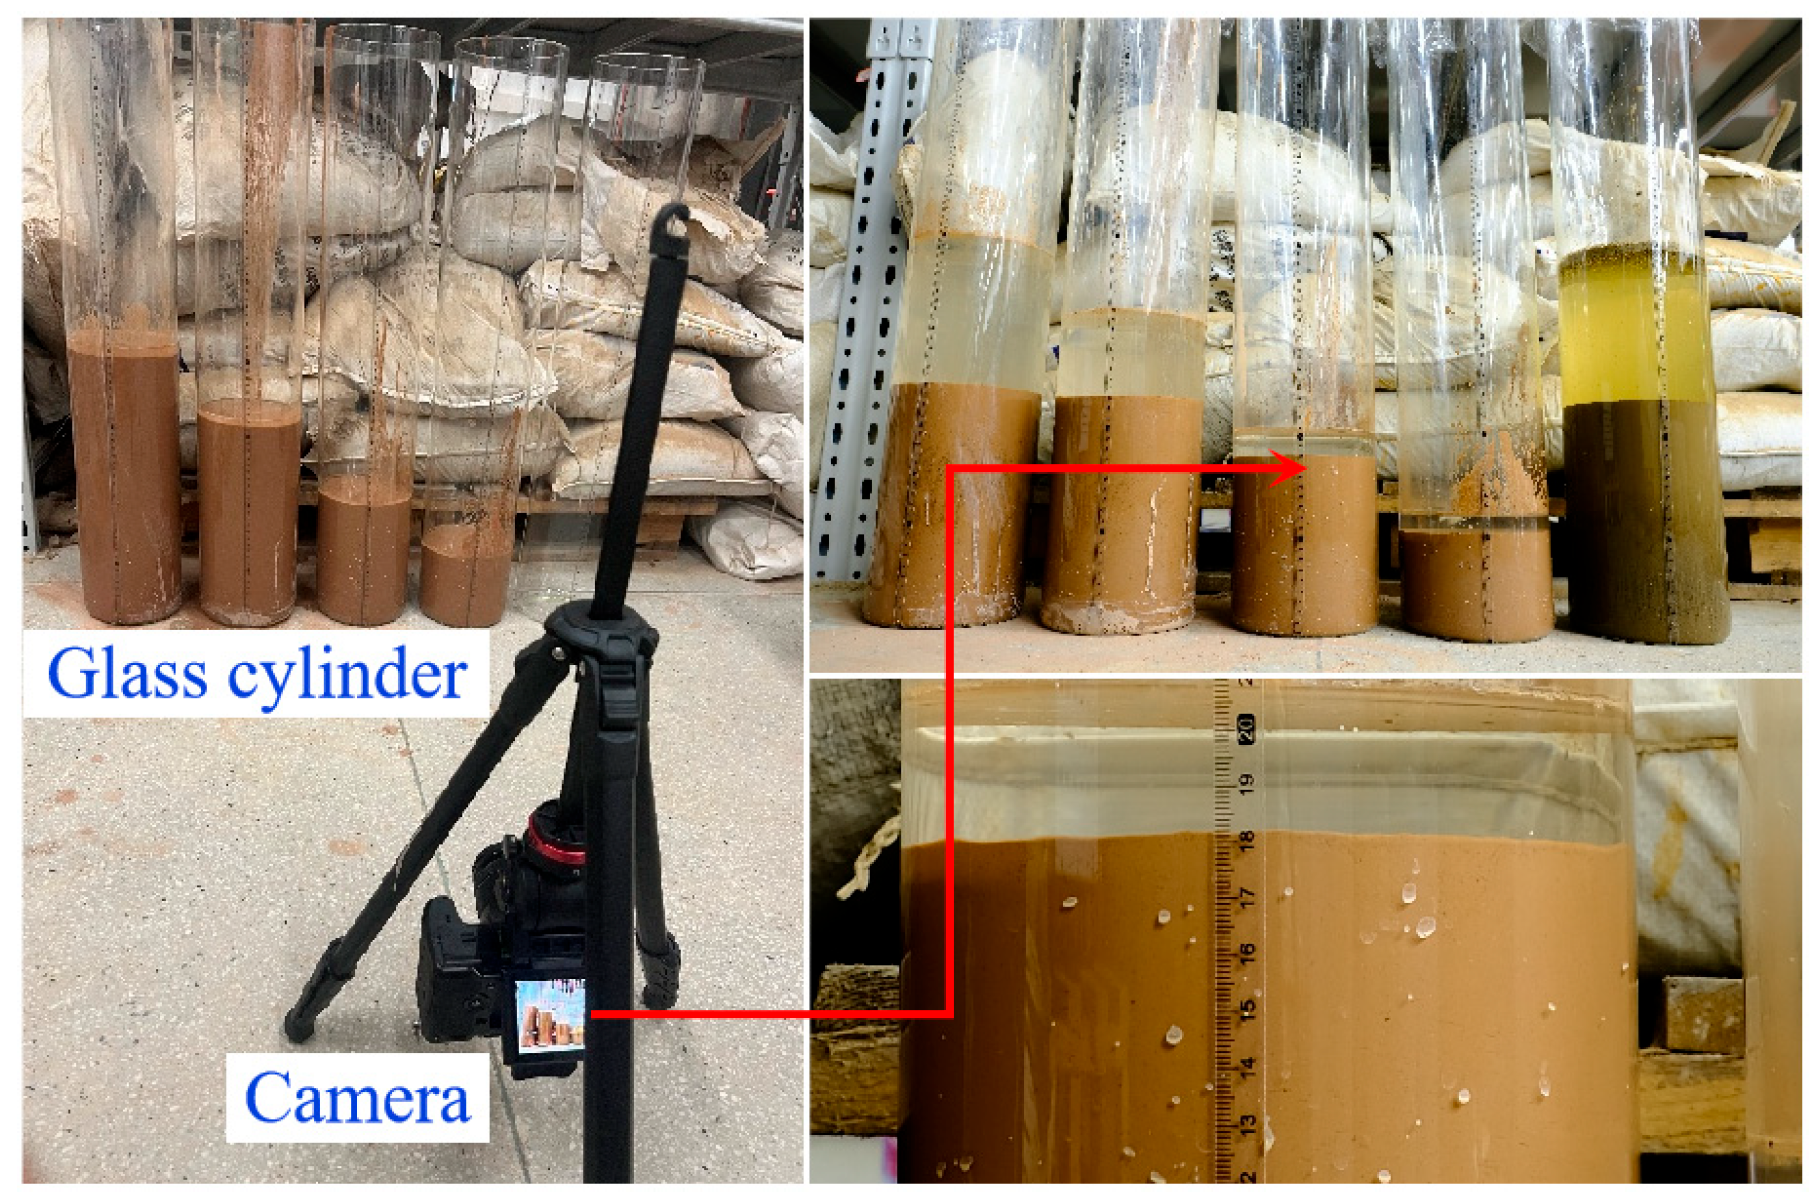
A total of 30 test conditions were examined (5 heights × 3 unit weights × 2 soil types). Given the substantial workload required for manual readings in sedimentation column tests and the stringent requirement for sample uniformity, single tests were conducted under standardized operational conditions with reference to previous research [15]. To ensure maximum accuracy of test results, the sedimentation process was recorded in real-time using Fujifilm X-H1 camera (Fujifilm Holdings Corporation, Tokyo, Japan). Previous studies have indicated that when the column diameter exceeds 14.5 cm, the wall effect of settlement column can be disregarded for typical marine clays [15]. Notably, Tanzhou sediments exhibit lower plasticity indices (PI = 12.6–18.8) compared to those in [15] (PI = 37.4; high clay content and large specific surface area), which significantly reduces particle–wall adhesion effects. Consequently, the selected 15.8 cm diameter cylindrical glass column (height = 60 cm) not only meets but exceeds the critical threshold, ensuring negligible frictional resistance and minimal wall-induced flow distortion. To minimize water evaporation during the sedimentation process, the top of the settlement column was sealed with plastic film.
Upon initiation of the experiment, soil particles begin to settle under gravity. The boundary between the mud and water interfaces can be measured using a ruler affixed to the cylinder wall, where the difference between these measurements represents the settled volume of soil particles (Figure 3). Following thorough stirring of the slurry, the descent of the mud–water interface was monitored continuously, with interface positions recorded at progressively longer intervals to characterize the settling behavior. To minimize bias, readings from 0 to 10 min were verified by dual-observer agreement, ensuring consistency (mean discrepancy of 0.3 mm). From 10 to 600 min, recordings were made using a standardized upward-angle camera with automated edge detection performed in ImageJ (Fiji distribution, version 2.9.0/1.53t; threshold set at a 5% grayscale gradient), achieving a resolution of 0.05 mm per pixel.
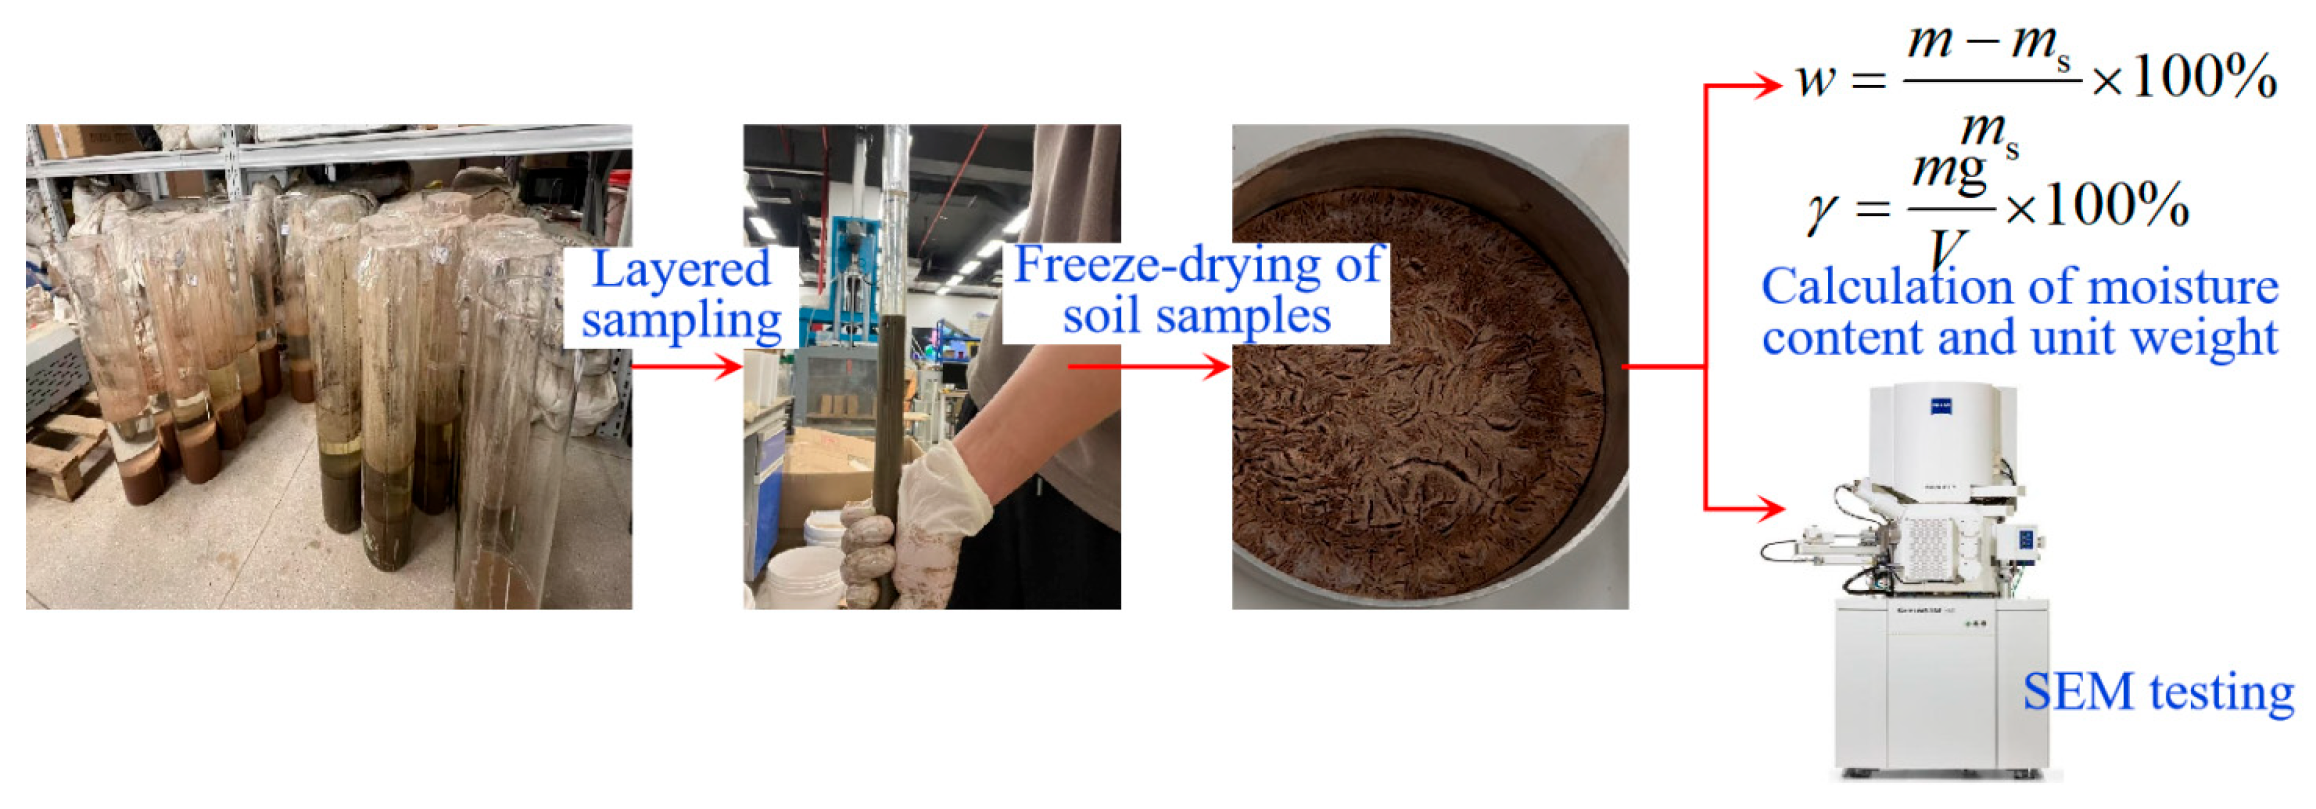
To characterize the vertical distribution and microstructural features of sediment during the sedimentation process, samples were collected from different layers at regular intervals for moisture content and microstructural properties.
Following procedures adapted from the Hong Kong–Zhuhai–Macao Bridge Island Tunnel Project, where foundation trench mud thickness was monitored every 7 d using a depth gauge or diver inspection after leveling with riprap and crushed stone. Once the immersed tube was placed in the foundation trench, it required a drying period of 10–15 d, with a monitoring interval and a sedimentation threshold of 4 cm [31]. In this study, sediment samples were collected in three layers (approximately 4–5 cm each; three parallel specimens were taken from the same batch) on the 7th, 14th, 21st, and 28th days after the experiment began. Liquid sampling tubes were utilized to extract a series of soil samples arranged along the height direction as intactly as possible, which were then injected into soil sample boxes layer by layer. The sediment sampling followed a stratified protocol with precisely defined layer boundaries. The upper layer samples were collected from the 4–5 cm thick segment immediately below the mud–water interface, capturing the active flocculation zone where particle–water interactions dominate. Middle layer samples were obtained from the mid-height region (1/2 of total sediment height ±2 cm), representing the transitional hindered settling regime. Lower layer samples comprised the 4–5 cm thick segment above the sediment–container interface, characteristic of consolidated sediments. The samples were immediately flash-frozen in liquid nitrogen (−196 °C) after collection and subsequently freeze-dried for 48 h using a Christ Alpha 1-2 LDplus freeze-dryer (Martin Christ Gefriertrocknungsanlagen GmbH, Osterode am Harz, Germany) at −50 °C under 0.1 mbar vacuum (with a controlled temperature ramp rate of 1 °C/min). The freeze-dried samples were then fractured along natural planes using a pre-cooled scalpel, mounted on aluminum stubs with conductive carbon tape, and sputter-coated with a 10 nm gold–palladium layer (60:40) using a Quorum Q150T ES coater (Quorum Technologies Ltd., Laughton, East Sussex, UK; 20 mA current for 120 s under 0.1 mbar argon atmosphere) prior to SEM examination. The testing equipment used was the Zeiss GeminiSEM 360 field emission scanning electron microscope (Carl Zeiss AG, Oberkochen, Germany), which boasts high-resolution imaging capabilities. The spacious sample chamber of this device facilitates the observation of large samples. The testing procedure is illustrated in Figure 4.

3. Soil Sedimentation Test Results

3.1. Settlement Time-Dependent Characteristics

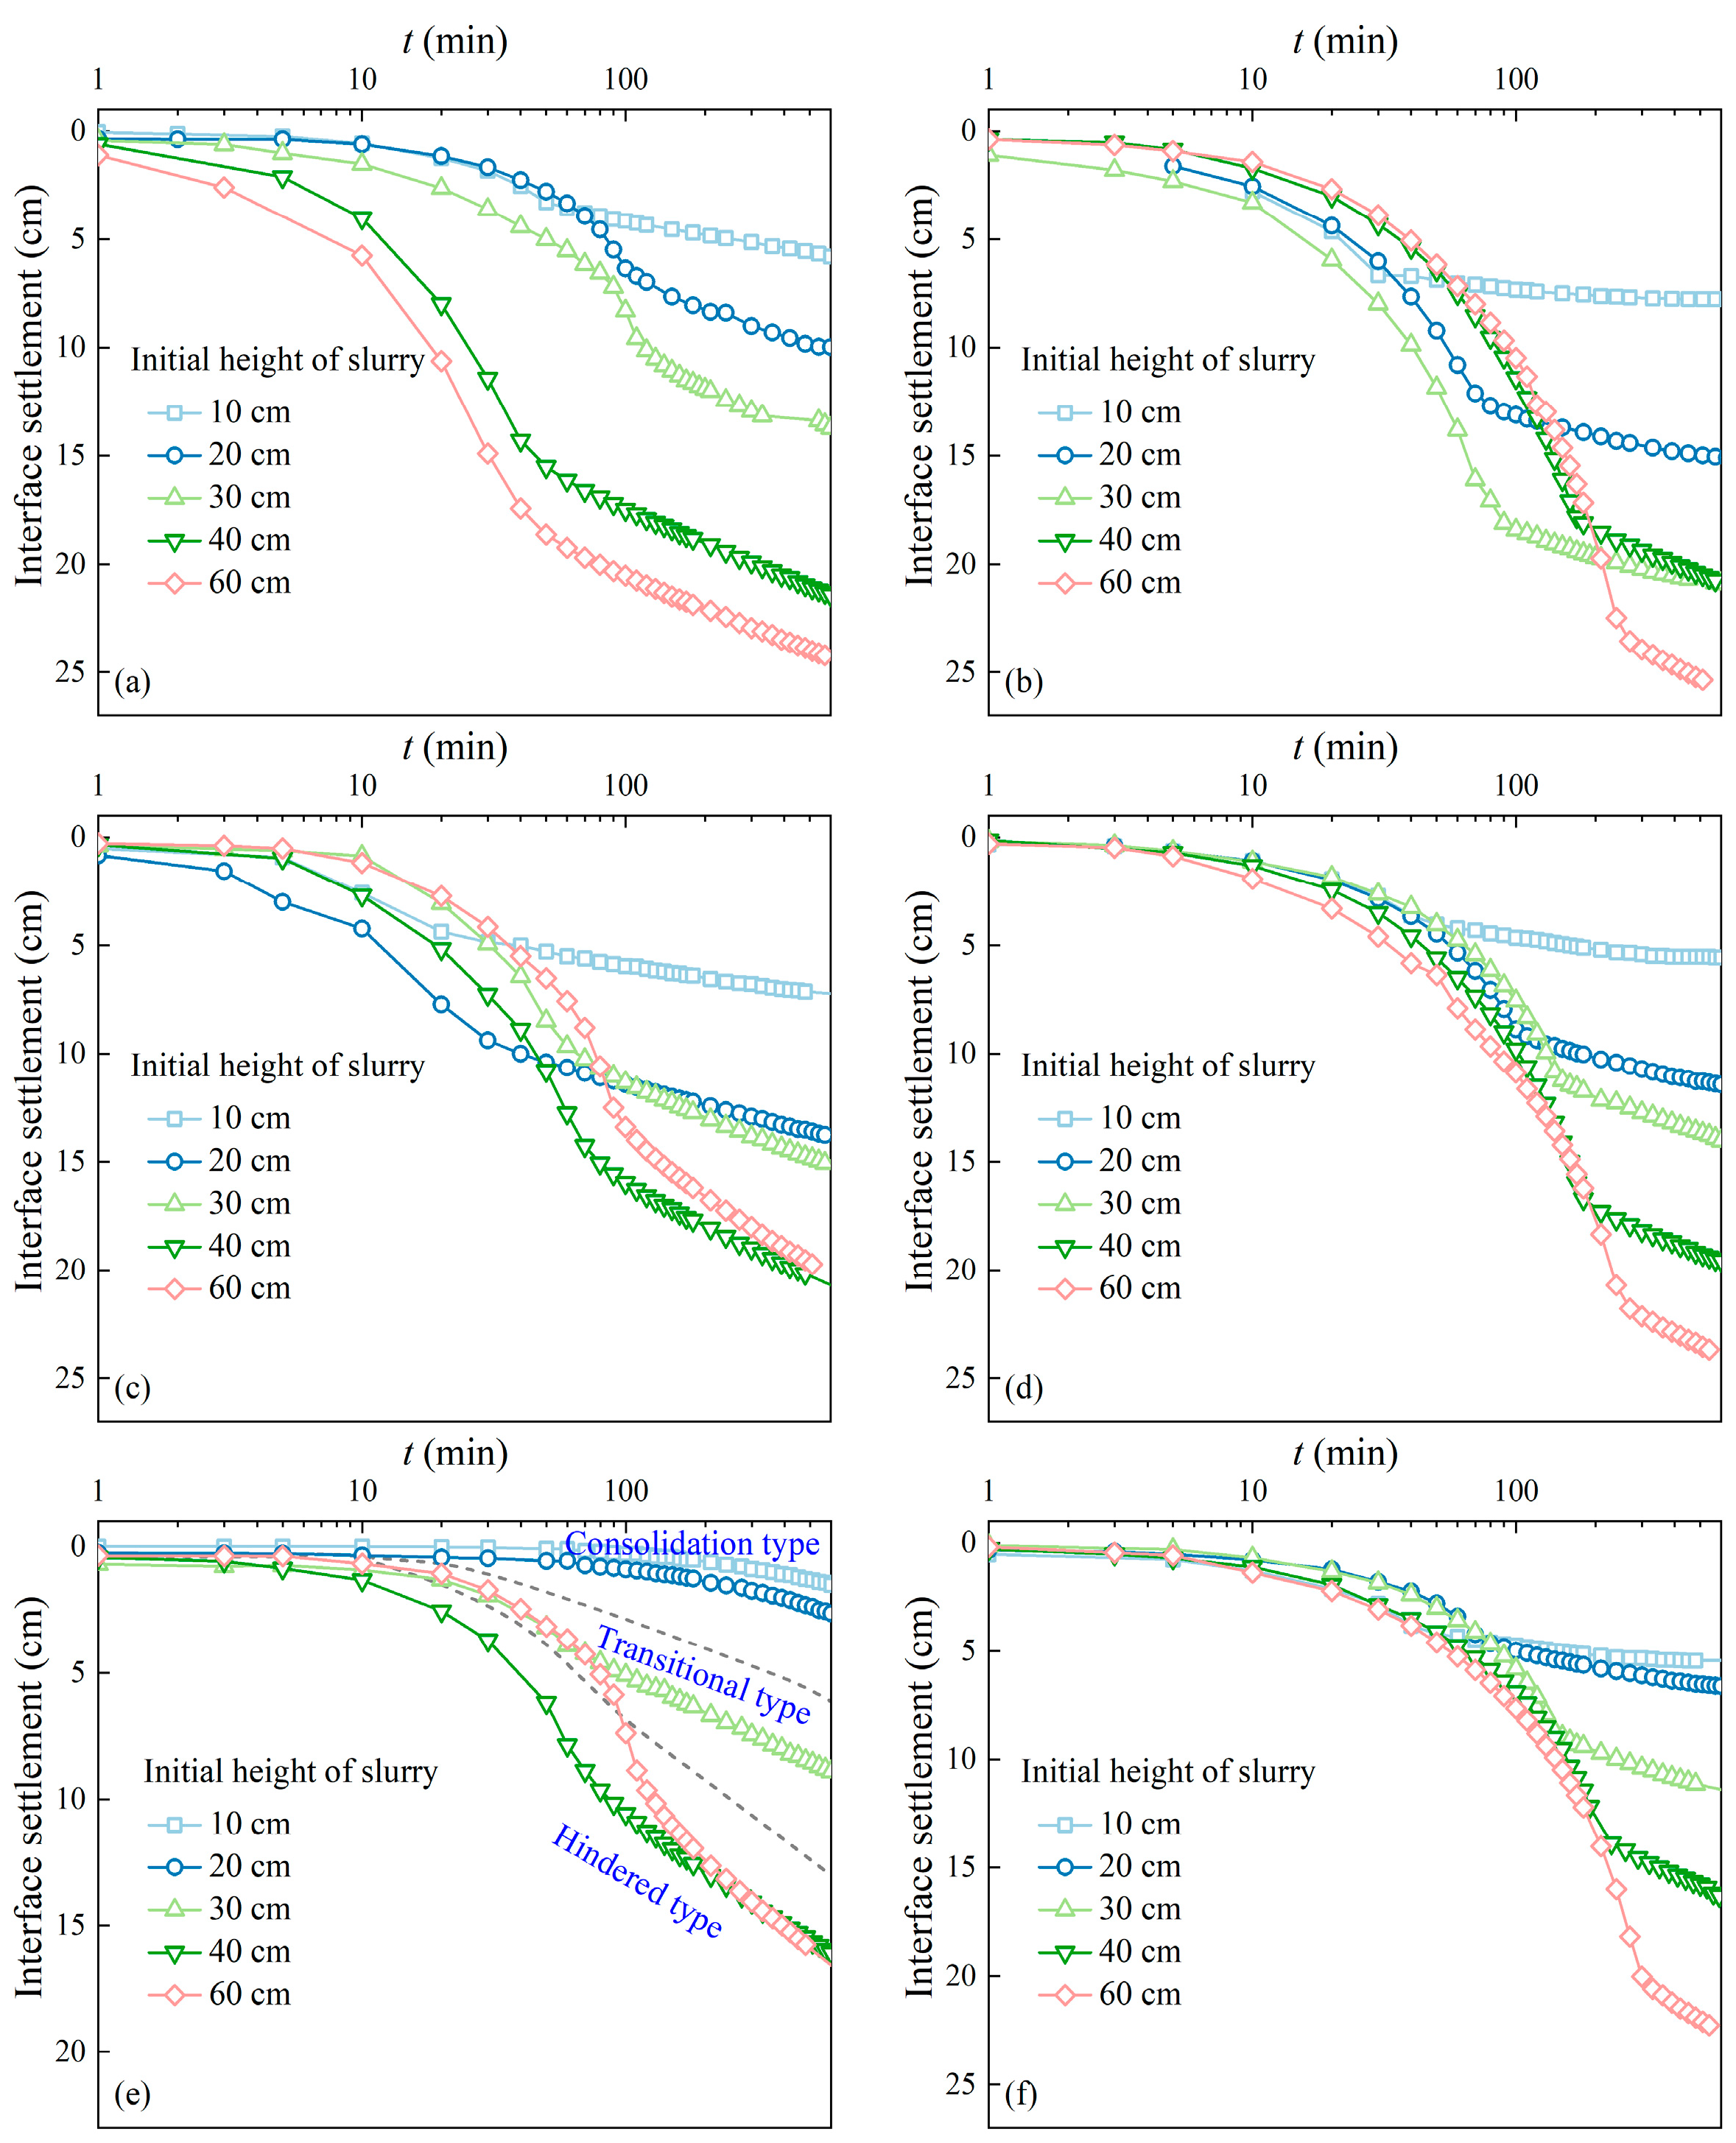
The settlement curves of silty clay and mucky soil, measured under various unit weights and initial heights in this experiment, are depicted in Figure 5. Based on Imai’s research [14], the curves can be categorized into two types according to their shape characteristics on a logarithmic time scale: consolidation settlement and hindered settlement. The consolidation settlement curve appears smooth and exhibits an inverse “S” shape over longer time periods, initially convex and then concave. In contrast, the hindered settlement curve exhibits distinct stages, which can be divided into three phases: A relatively short flocculation stage, a linear settlement phase where the mud surface rapidly sinks at an accelerated rate, and a final phase where the subsidence rate decelerates and continues to diminish. The classification criteria can be further refined based on the number of inflection points in the settlement curves: the consolidation type shows no distinct inflection points; the hindered type is characterized by two inflection points in the second derivative of the settlement curve, demonstrating clear three-phase transition characteristics; while curves with only one inflection point should be classified as a transitional type. The transition between consolidation and obstructive settlement is governed by the interplay of gravitational forces, interparticle interactions, and drainage conditions. At lower initial heights (e.g., 10–20 cm), the shorter sedimentation distance allows for rapid particle settling and efficient pore water dissipation, leading to consolidation-dominated behavior characterized by the inverse “S” curve. Conversely, at greater heights (e.g., 40–60 cm), the increased slurry volume exacerbates hindered settling effects due to prolonged particle collisions and slower drainage, resulting in the three-stage obstructive settlement pattern. The critical height for this transition was observed at 30 cm in silty clay slurry with 12.6 kN/m3 unit weight. Figure 5e reflects the threshold where gravitational forces are balanced by upward pore pressure and interparticle friction.
Experimental results demonstrate that silty clay slurry predominantly exhibits consolidation settlement at lower initial heights (10–20 cm) but transitions to hindered settlement behavior at greater initial heights (40–60 cm). In contrast, mucky soil slurry consistently displays hindered settlement characteristics across all tested initial conditions due to its higher plasticity and stronger flocculation tendencies, which impede rapid consolidation. A strong positive correlation exists between the duration of hindered settlement and initial slurry height, conclusively indicating that settling distance serves as the primary determinant governing settlement stage duration, as illustrated in Figure 5b, though this relationship is less pronounced in low-unit-weight silty clay due to its faster structural collapse. Specifically, for slurry with initial heights of 10 cm, 20 cm, 30 cm, 40 cm, and 60 cm, the durations in the second phase are 10 min, 50 min, 70 min, 130 min, and 180 min, respectively.

3.2. Variation Patterns of Settlement Rate

Under the arithmetic time scale, the settlement rate for consolidation-type curves is determined by the slope of the tangent line at the origin, whereas for hindered-type settlement, it is calculated as the ratio of the settlement difference between the end of the settlement stage and the flocculation stage to the corresponding time interval [15]. Figure 6 presents the resulting settlement rates as a function of initial unit weight for silty clay and mucky soil slurries at different initial heights.
The slurry height exerts a dual influence on settlement rates (1) by governing the gravitational driving force for particle settling and (2) by modulating pore water dissipation efficiency. For silty clay slurries (Figure 6a), higher initial heights (40–60 cm) amplify gravitational forces, accelerating particle settling in the hindered regime. However, this effect is counterbalanced by increased pore pressure and prolonged drainage paths, which decelerate consolidation at later stages. At low unit weights (11.5 kN/m3), the dominance of gravitational forces results in an 80–90% higher settlement rate for 60 cm slurries compared to 10 cm slurries. Conversely, at higher unit weights (≥12.0 kN/m3), the increased particle concentration enhances interparticle friction, diminishing the height-dependent rate disparity to <55%.
Mucky soil slurries with varying initial heights and unit weights exhibit consistent settling patterns, characterized by greater regularity and uniformity in settlement rates compared to silty clay slurries, with limited variations across initial conditions. The settlement rates show a decreasing trend with increasing initial slurry height. However, when the initial unit weight reaches 12.0 kN/m3, the difference caused by different initial slurry heights becomes less pronounced.

3.3. Distribution of Water Content in Sediments and Its Temporal Variations

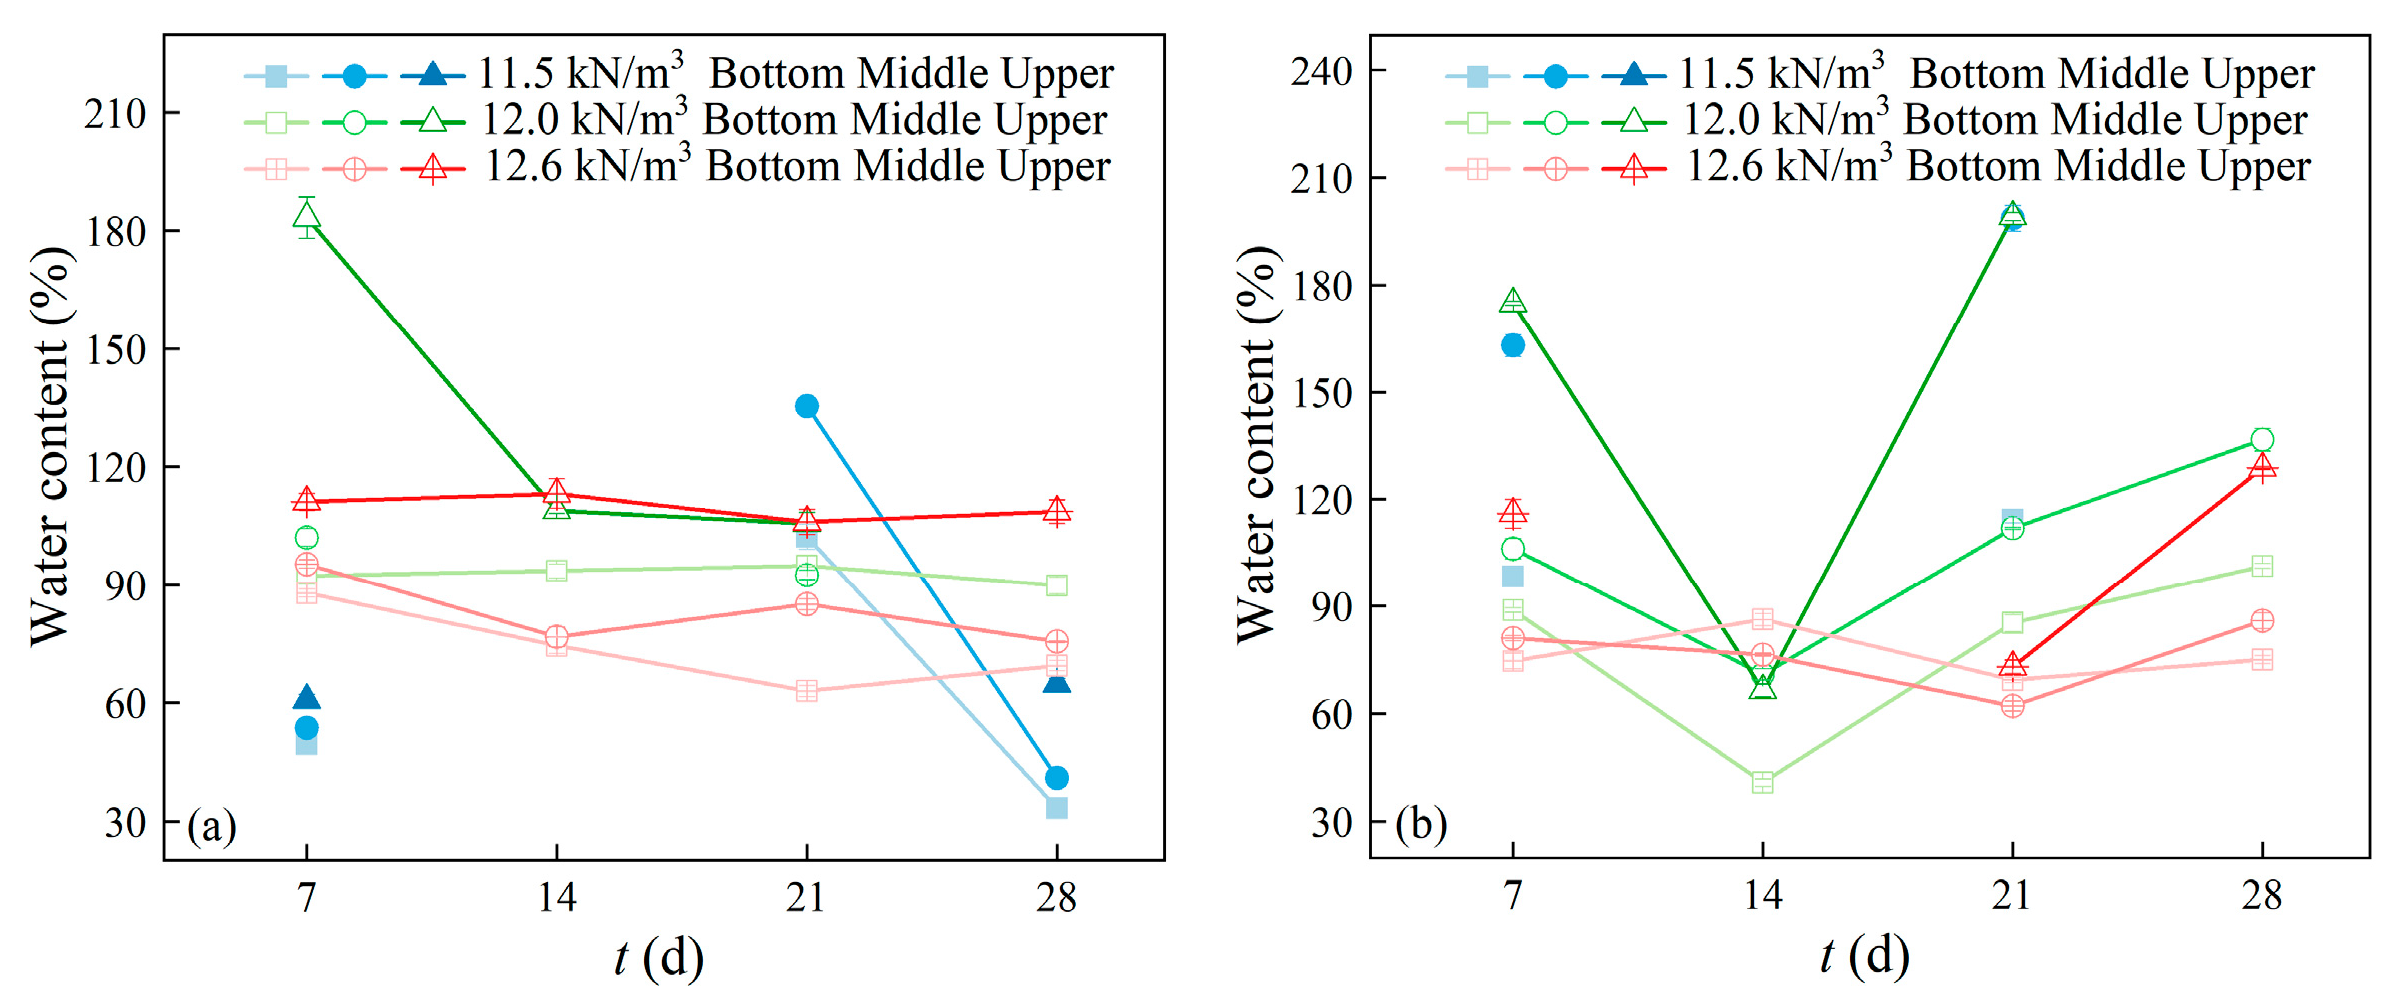
The water content test results for two types of soil slurries with different initial unit weights after 7 d, 14 d, 21 d, and 28 d of sedimentation are shown in Figure 7. During stratified sampling, upper layer specimens were discarded when the mud–water interface height was less than 15 cm. Notably, the absence of direct pore water pressure measurements necessitates caution in interpreting water content fluctuations. The following analyses of drainage behavior (e.g., rapid initial drainage) and structural instability (e.g., anomalous data points in low-unit-weight slurries) are inferred from temporal-spatial moisture patterns, pending further validation with pore pressure data. These measurements reveal critical patterns in dewatering behavior that directly impact sediment stability. As shown in Figure 7a, the measured water content of silty clay exhibited relatively stable temporal variations, primarily ranging between 80% and 120%. This stability range indicates balanced drainage conditions favorable for uniform consolidation. The low-unit-weight slurry (11.5 kN/m3) exhibits pronounced temporal fluctuations in sediment water content, with limited interpretable data and no discernible trends, suggesting structural instability that may lead to differential settlement in engineering applications. For high-unit-weight slurries (12.6 kN/m3), the middle and bottom layers demonstrate a slight rebound after an initial decrease in water content, a phenomenon attributed to pore water redistribution that typically occurs during secondary consolidation phases, with minor fluctuations—consistent with the characteristics of dense soils having low drainage rates and gradual stabilization. This behavior implies these sediments require extended consolidation periods but ultimately achieve better long-term stability. Sediments at 12.0 kN/m3 unit weight exhibited stable structural characteristics in the middle and bottom layers, as evidenced by minimal temporal water content variations, whereas upper layer sediments demonstrated structural instability through erratic water content fluctuations. The middle-layer rebound in water content reflects dynamic pore water redistribution during microstructural reorganization, a characteristic of high-unit-weight silty clay, as evidenced by SEM images showing particle aggregation over time.
The low-unit-weight (11.5 kN/m3) mucky soil exhibited a highly unstable structure, manifested as numerous anomalous data points in stratified water content measurements (see Figure 7b). These anomalies correlate with the formation of preferential drainage paths that compromise homogeneity. For sediments with 12.0 kN/m3 unit weight, the significant decrease in water content in bottom layers indicates high drainage rates during initial sedimentation. While rapid initial dewatering enhances short-term stability, it may create overconsolidated crusts that hinder subsequent uniform compaction. The synchronized rebound in upper, middle, and bottom layers (14–21 d) suggests a systemic reorganization of pore water. Upper layers exhibit this due to delayed flocculation, while deeper layers experience localized water retention during particle compaction. During 21–28 d, water content rebound occurred in the middle and bottom layers, a critical transition period where microstructural reorganization occurs, potentially creating weak zones, attributable to pore water redistribution and localized moisture retention caused by soil structure reorganization. The high-unit-weight (12.6 kN/m3) mucky soil demonstrates minimal water content fluctuations in bottom layers (<15% variation amplitude), reflecting its low permeability and slow drainage characteristics, establishing this as the optimal condition for long-term stability. This behavior is consistent with theoretical predictions for dense soils nearing equilibrium in the late-stage consolidation phase.

4. Microscopic Characteristics of Sediments

Representative sediment samples, characterized by different soil types, initial unit weights, settlement durations, and sampling positions, were selected for SEM testing. Pore and fracture characteristics of these samples were quantitatively analyzed using PCAS image analysis software (version 2.3, Nanjing University, Nanjing, China). The SEM results are presented in Figure 8 and Figure 9. Images were acquired using a Zeiss GeminiSEM 360 operating at 1 kV with 1.2 nm resolution. Standardized contrast and brightness settings were maintained to ensure consistent visualization of pore structures and particle arrangements.

4.1. Microstructural Evolution with Sedimentation Time

Figure 8(a1–a3) show the microstructure of the bottom layer of mucky soil sediment after 14 d at different magnifications. The sediment particles predominantly exhibit a flaky structure, with face-to-face and face–edge contacts between particles forming the soil skeleton mainly through stacked aggregation. Some cross-sections display a loose flocculated structure, with numerous pores exhibiting a certain degree of connectivity. In Figure 8(a2,a3), rougher aggregate structures can be observed on the surface. In the middle layer, edge–corner contacts between particles are more prevalent (Figure 8b). The upper layer sediment shows flaky particles primarily connected through face–edge and face–body contacts, with rounded edges and a looser arrangement that exhibits significantly higher porosity than the bottom layer. After longer sedimentation periods, the particle arrangement became more compact (Figure 8d).
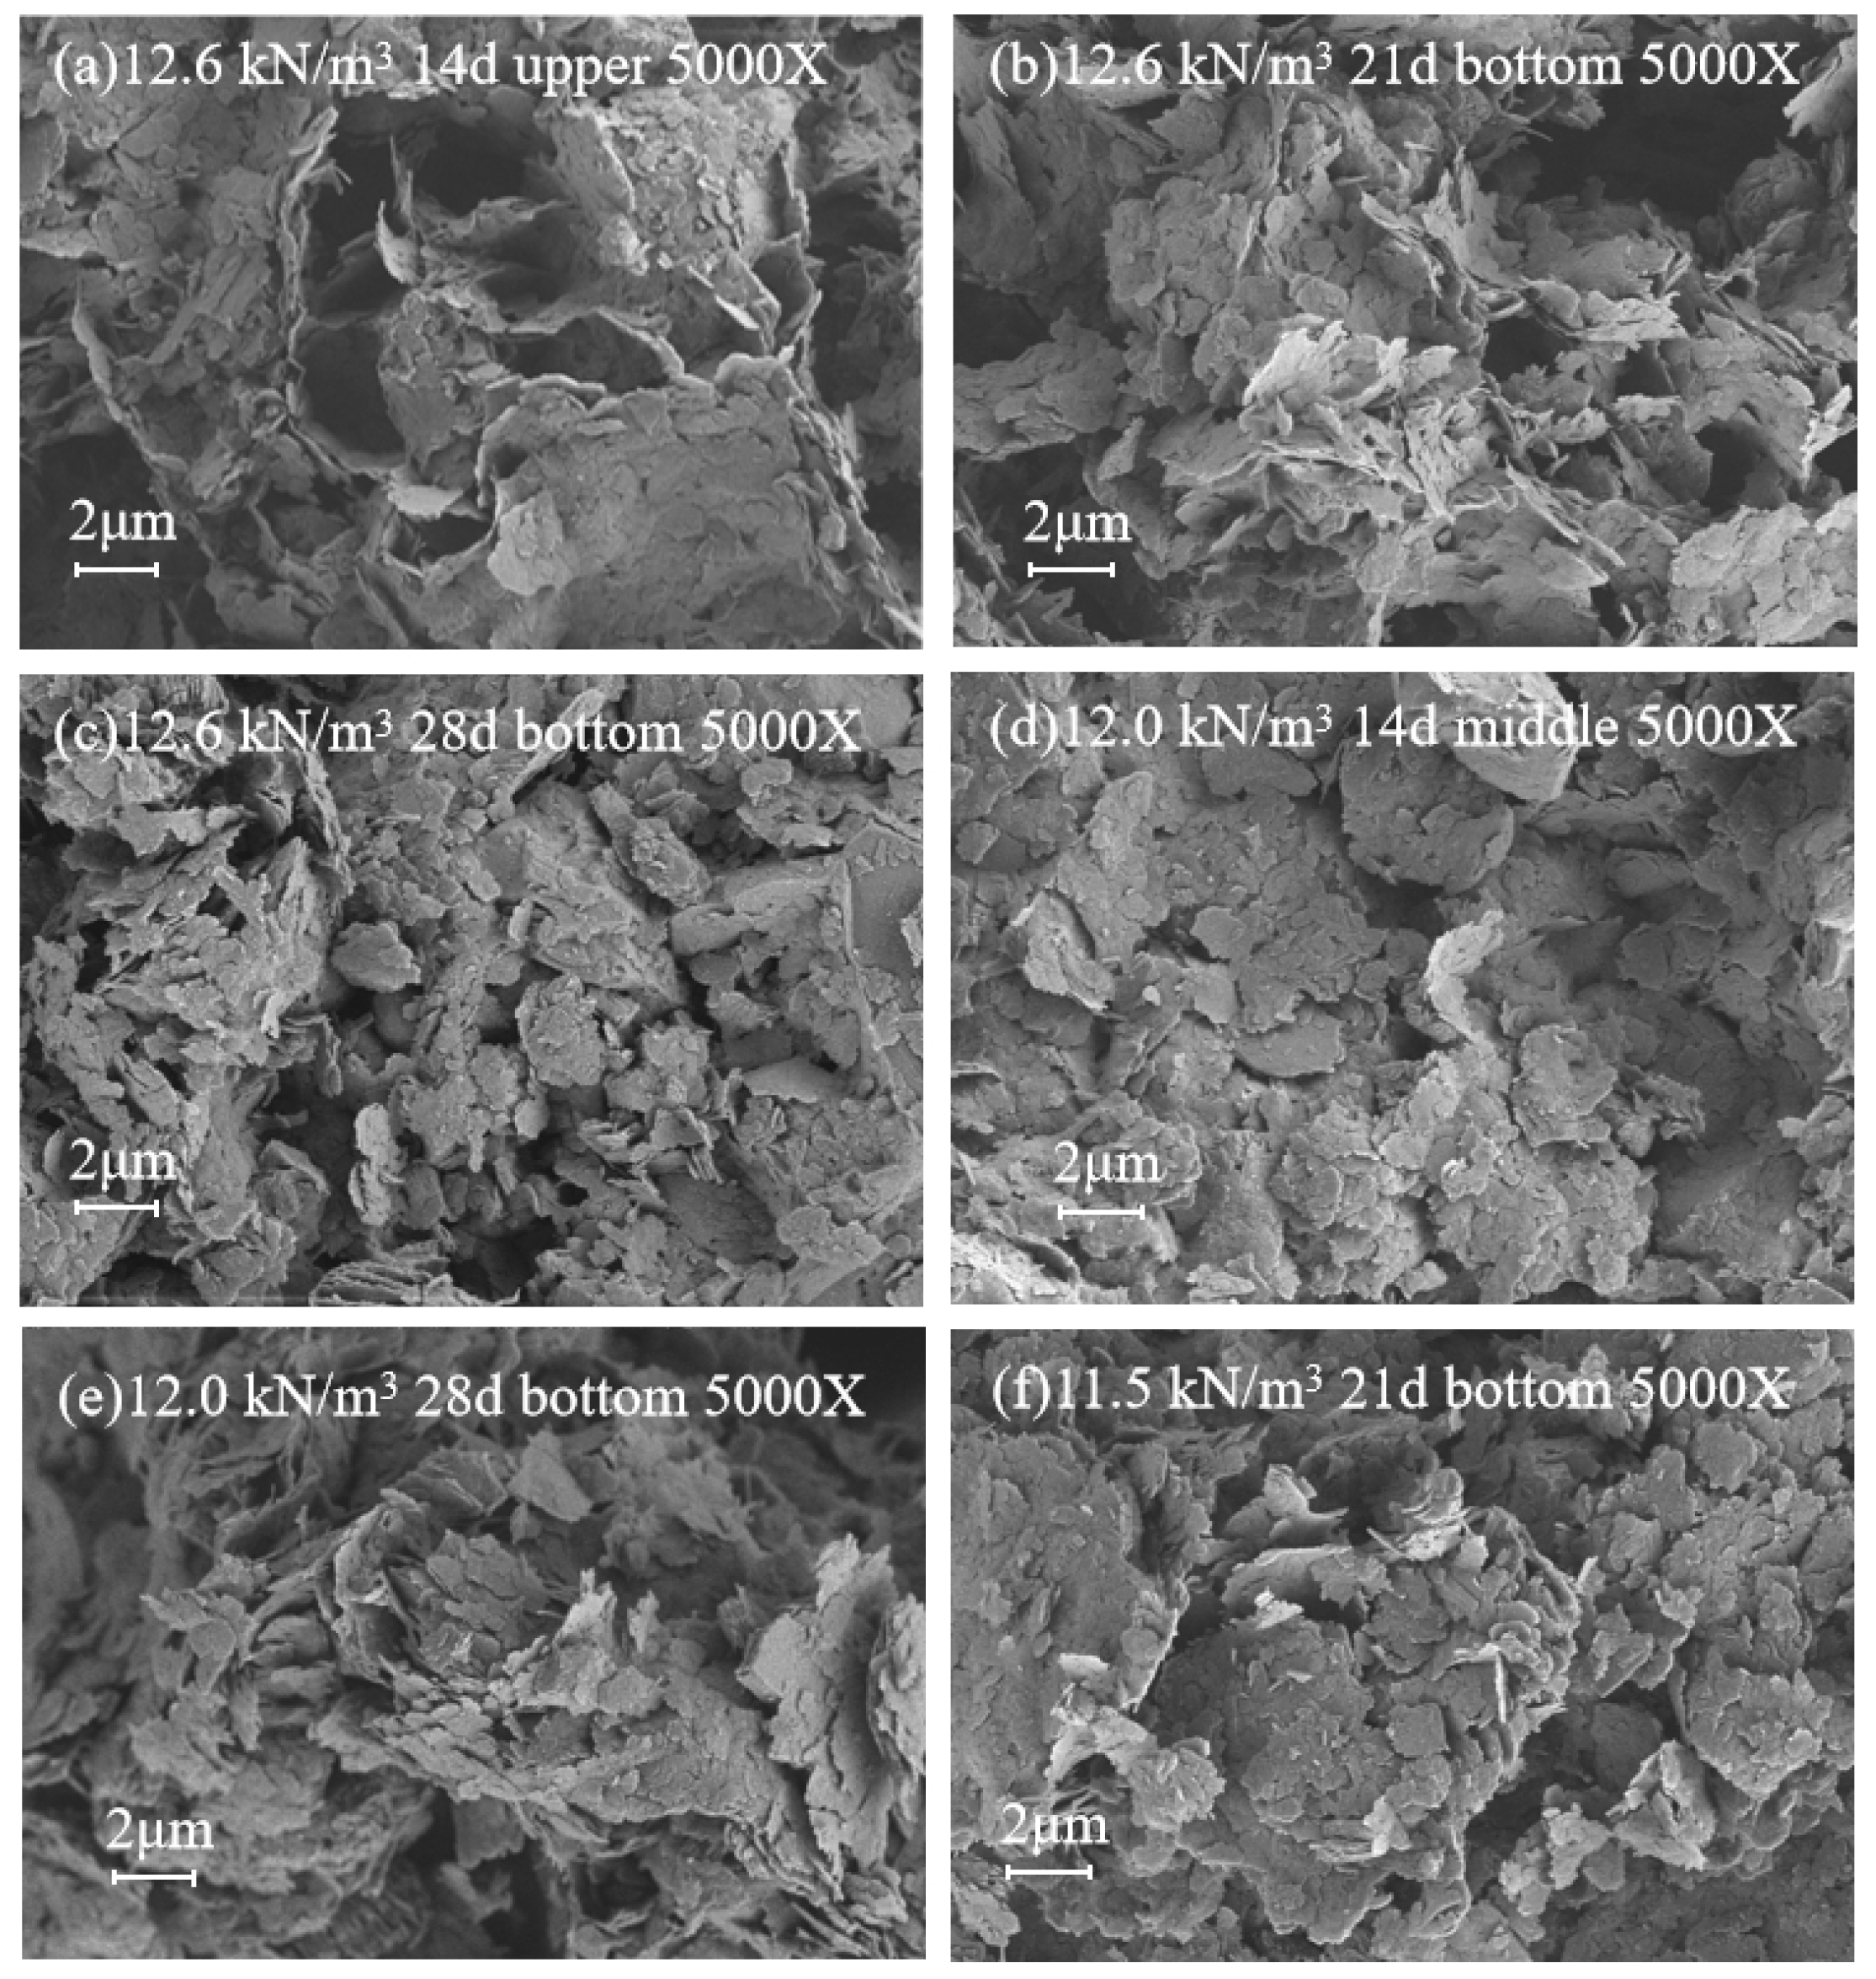
The microstructural evolution of silty clay slurries with different initial unit weights at varying sedimentation times is shown in Figure 9. Consistent with observations in mucky soil, the silty clay sediment particles exhibit a flaky structure, primarily with face-to-face contacts and secondarily face–edge contacts between particles. Figure 9a reveals a honeycomb-like cavity structure formed by face–edge contacts among soil particles. As time progresses and sedimentation depth increases, the cavity size gradually decreases, and discrete soil particles progressively develop into aggregates (Figure 9b,c). As the initial unit weight decreases, the honeycomb-like cavity structure gradually disappears, and the soil particles become stacked face-to-face into larger particles (Figure 9b,d,f).
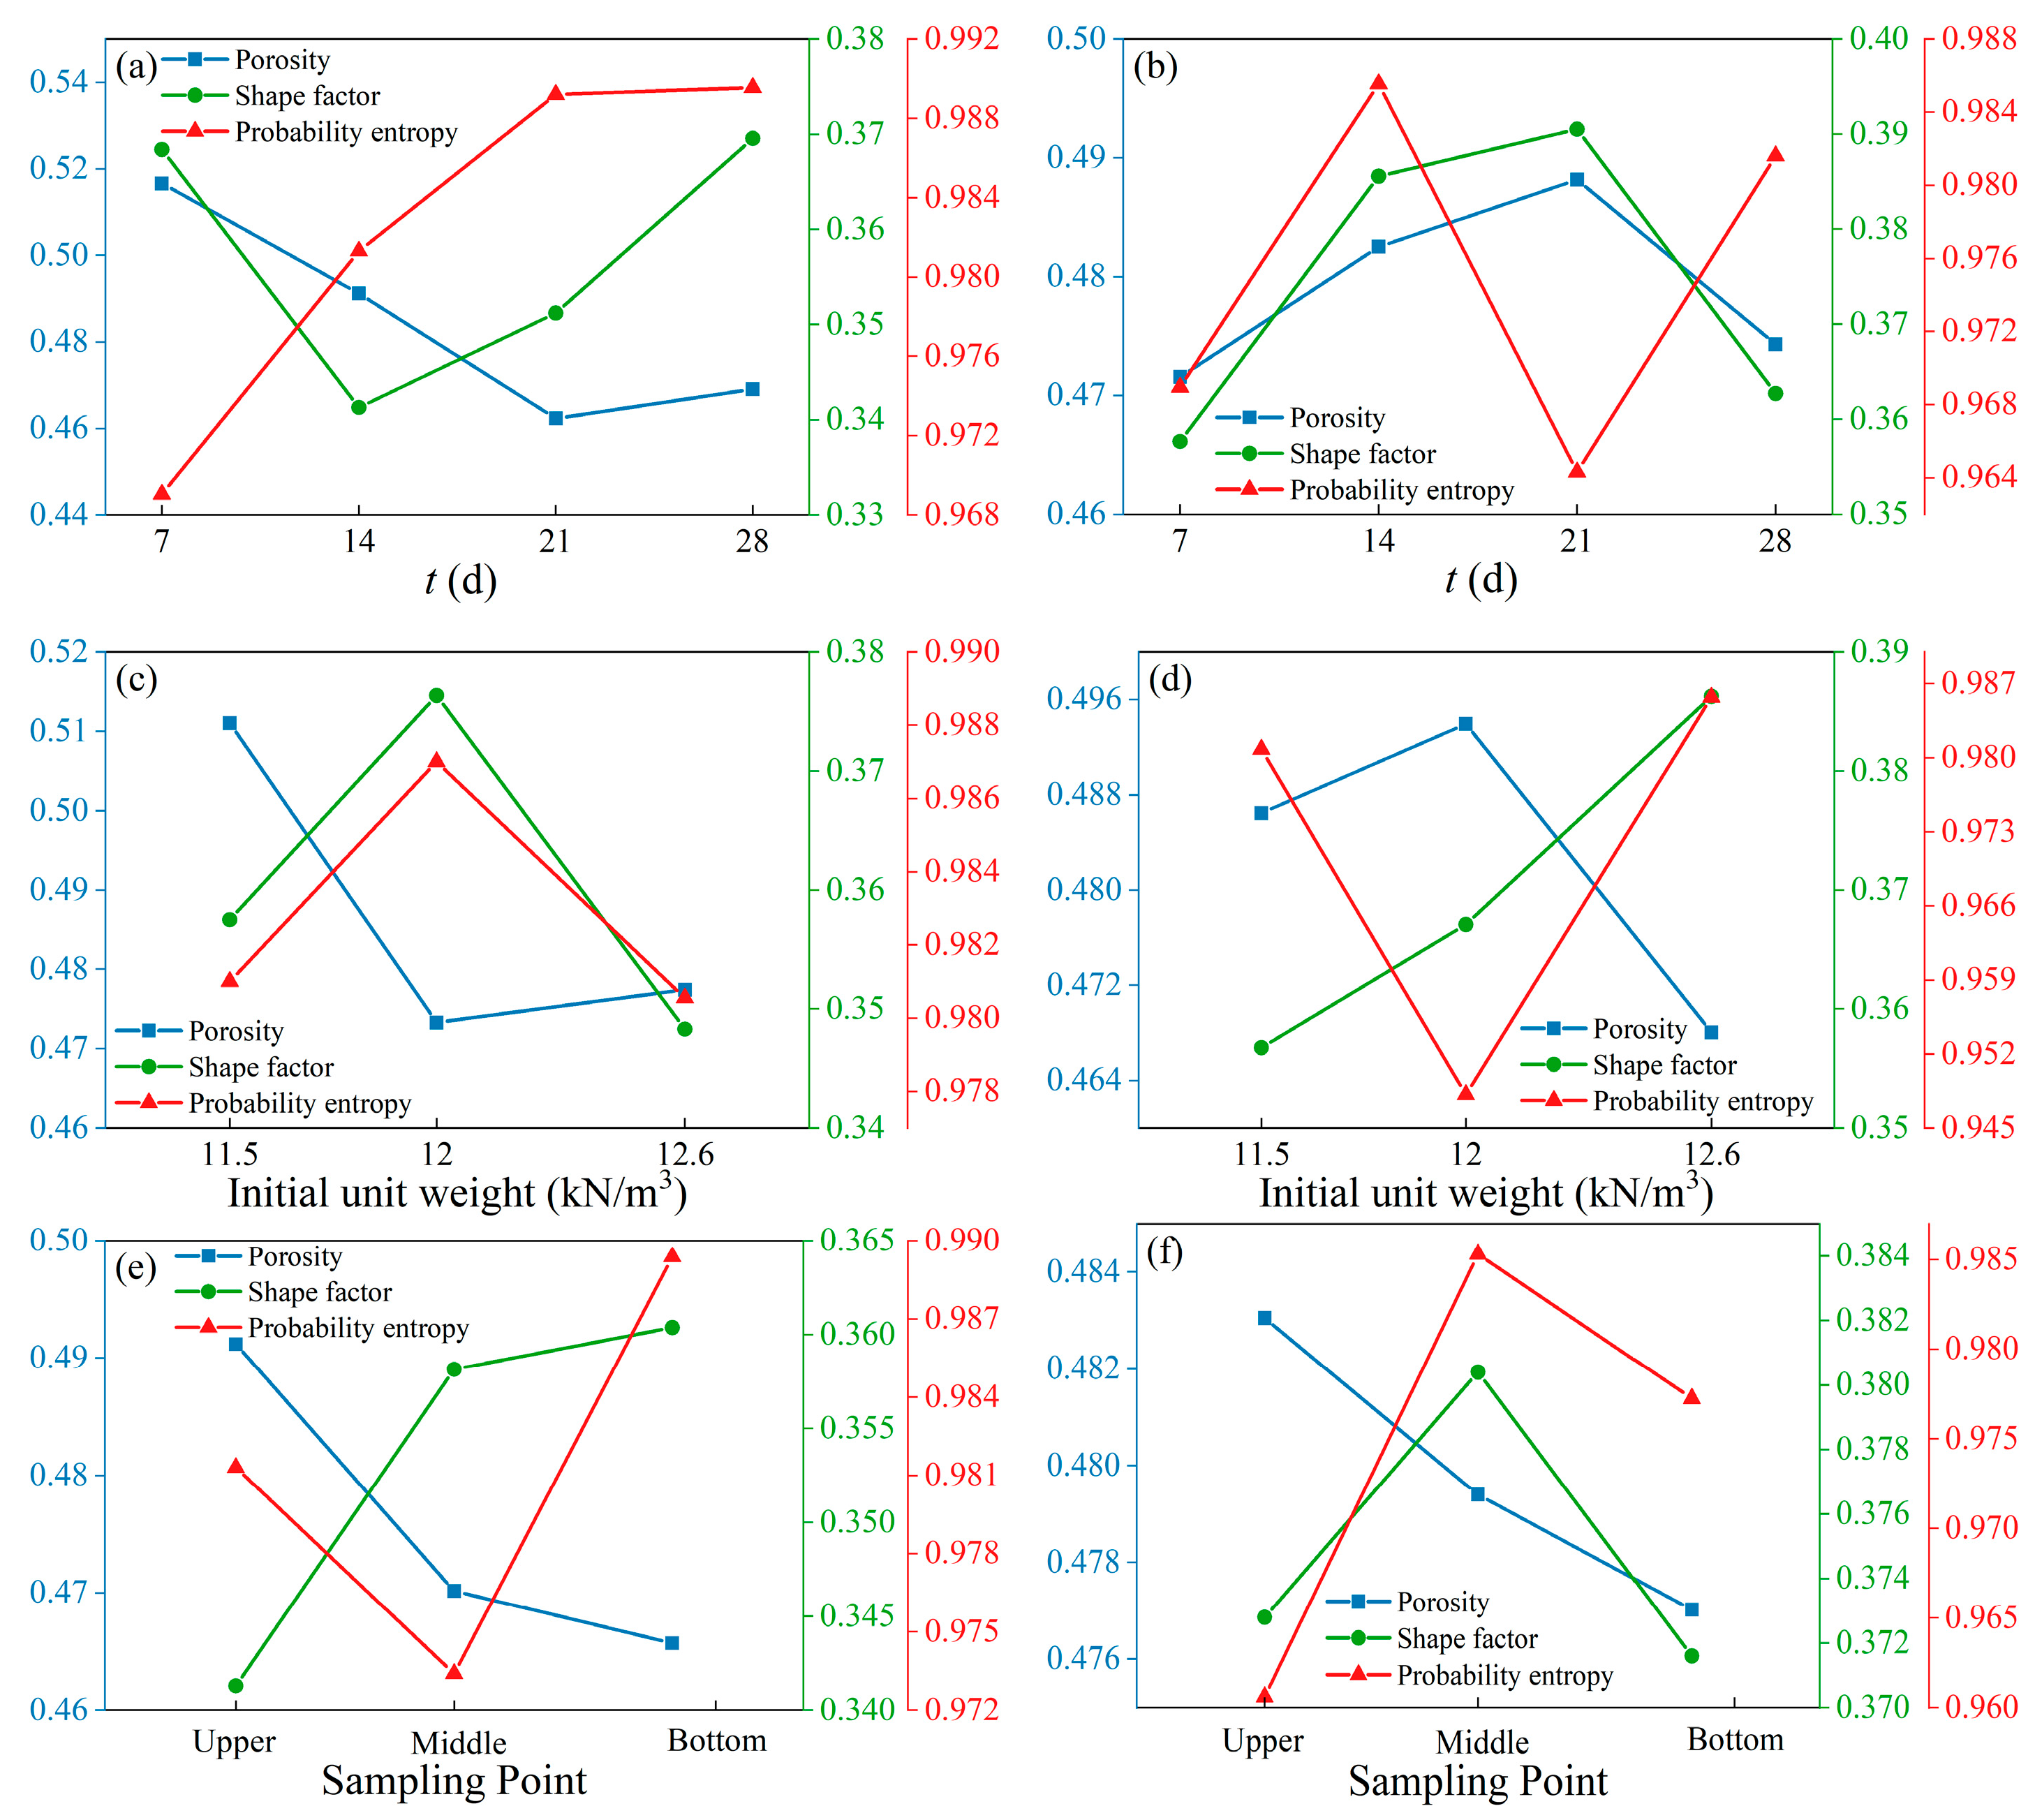
Quantitative pore structure analysis of mucky soil and silty clay slurry sediments was conducted using PCAS software (see Supplementary Material S1 for image processing methodology), evaluating sedimentation time, initial unit weight, and sedimentation depth, as shown in Figure 10. Both sediment types showed 45–50% porosity, with values decreasing at lower sampling positions, consistent with sedimentary principles. The lower layer, having undergone the longest sedimentation time and containing the highest number of soil particles, demonstrated the highest compactness and the lowest porosity. The porosity decline with depth (Figure 10e,f) aligns with theoretical drainage models: lower porosity (<48%) in compacted layers corresponds to slower moisture reduction rates (Section 3.3), suggesting hindered flow through tortuous pores. While porosity tended to decrease with increasing initial unit weight, the magnitude of this change is relatively small. The shape factor, F (pore area/perimeter2, range: 0–1), reflects structural defects/anisotropy. In the test results, the average pore shape factor ranged from 0.35 to 0.40, showing minimal variation across test conditions. The consistent F-porosity relationship suggests stable pore morphology during sedimentation, albeit with some anisotropy. As demonstrated by Hu et al. [20], F significantly influences sediment compressibility. SEM observations (Figure 8 and Figure 9) of face-to-face particle contacts in high-F layers (e.g., 12.6 kN/m3 bottom sediments) support this finding, suggesting enhanced shear resistance—though direct strength measurements would be required for confirmation. Probability entropy analysis revealed near-unity values, indicating highly disordered pore distribution. A higher probability entropy corresponds to a more disordered pore distribution. The test results show that the probability entropy values approach 1, indicating a more chaotic and disordered pore distribution. While microstructural parameters (porosity, F, entropy) show consistent trends with drainage/compaction behavior, these correlations remain qualitative due to the lack of in situ rheological data.
Figure 11 displays a rose diagram depicting pore orientations (0–360°), generated using PCAS. The pore azimuths were divided into 18 sectors at 10° intervals within the 0–180° range, with pore counts determined in polar coordinates. These data were then symmetrically extended to 360° to construct the rose diagram. The elliptical outline reflects the pore density distribution, with radial length indicating pore quantity per orientation. Figure 11a–c demonstrate that as conditions transition from low initial unit weight and short durations to high initial unit weight and medium–long duration, the diagram’s diameter decreases while directionality weakens, approaching circularity. However, extended sedimentation re-establishes directional preference (Figure 11d).
The observed evolution in pore orientation distribution, as revealed by the rose diagrams, carries significant implications for sediment behavior in engineering applications. The directional preference of pores (evident in elliptical distributions) suggests structural anisotropy that could influence both hydraulic conductivity and mechanical response. This anisotropy may create preferential pathways for pore water flow while simultaneously generating directional variability in shear strength—a critical consideration for foundation stability under asymmetric loading conditions. As sedimentation progresses and unit weight increases, the transition toward more isotropic pore arrangements correlates with reduced permeability and enhanced particle interlocking. However, the re-emergence of directionality after extended sedimentation periods (28 d) indicates ongoing microstructural reorganization that could lead to progressive settlement or heterogeneous strength development in trench foundations. These findings underscore the importance of considering both initial slurry conditions and temporal evolution when predicting long-term sediment behavior, particularly for immersed tunnel projects where foundation consistency directly impacts structural performance.

4.2. Microstructural Comparison of Various Soil Sediments

The microstructural analysis reveals fundamental differences between silty clay and mucky soil sediments that explain their distinct sedimentation behaviors. In terms of particle arrangement, mucky soil (Figure 8) exhibits a predominantly laminar structure, with 60–70% face-to-face contacts in bottom layers, compared to silty clay’s (Figure 9) honeycomb-like cavities covering 25–35% of the surface area at 12.6 kN/m3. Notably, mucky soil shows 40% more face–edge/face–body contacts in upper layers, along with 2–3× more rounded particle edges with increasing height, while silty clay forms 2–5 μm aggregates at lower unit weights.
Pore structure contrasts (Figure 10) further distinguish the two soil types: mucky soil displays slit-like pores (average shape factor Fa = 0.32) with low connectivity, whereas silty clay contains more polygonal pores (Fa = 0.38) and moderate connectivity. Height-dependent evolution patterns also diverge significantly. Mucky soil porosity decreases linearly (0.5%/cm with depth), and pores become 15° more horizontally aligned in the bottom layers. In contrast, silty clay shows progressive cavity size reduction (2 μm/cm sedimentation depth) and a 20% increase in aggregate density at 60 cm versus 10 cm.
These microstructural differences have direct engineering implications. Mucky soil’s 3× higher face-to-face contact ratio enhances its structural stability, translating to 30% fewer required dredging interventions compared to silty clay. The latter’s honeycomb structure, while initially more compressible, necessitates deeper compaction and twice as many vertical drains for effective stabilization.

5. Discussion

5.1. Comparative Analysis with Prior Studies

The observed inverse correlation between initial unit weight and settling rate (Figure 5) differs from Zhang et al.’s [12] granular material model, which attributed sedimentation variability exclusively to particle size effects. While their study reported a 30–40% settling rate difference between 2 mm and 5 mm glass beads under identical unit weight conditions, cohesive silty clay in this study exhibited a comparable 40% rate variation across unit weights (11.5–12.6 kN/m3) for identical particle sizes (Figure 2). This discrepancy underscores the dominant role of clay–electrolyte interactions in real-world trench environments, a factor neglected in idealized granular models [12,16].
The microstructural transition from honeycomb to stacked configurations (Figure 9) aligns partially with Yang et al.’s [19] depth-dependent structural model for Tianjin dredged clay. However, their reported “granular mosaic” at depth differs from our observed face–edge flocculation (Figure 8b), likely due to differing mineralogy (kaolinite-dominated vs. Tianjin’s illite-rich clays). Notably, SEM-verified porosity (45–50%, Figure 10) matches Hu et al.’s [20] deep-sea sediments but with higher pore connectivity—a key difference for predicting back-silting permeability.

5.2. Mechanistic Interpretation

The stabilization of sedimentation rates at γ = 12.0 kN/m3 (Figure 6b) suggests the existence of a threshold flocculation density, beyond which particle aggregation balances gravitational settling. This phenomenon accounts for the moisture content rebound in 12.0 kN/m3 specimens (Figure 7b), where pore water redistribution occurs from intermediate-density flocs. PCAS-quantified pore anisotropy (Figure 11) further supports this, showing directional compaction (elliptical rose diagrams) only in γ ≥ 12.0 kN/m3 samples.
In contrast to Balaji et al.’s [17] tidal channel recommendations, data from this study suggest that dredging thresholds for inland waterways should prioritize unit weight over thickness (e.g., “remove if γ < 12.0 kN/m3 and thickness > 5 cm”). This adapts the Hong Kong–Zhuhai–Macao Bridge standard [30] to low-energy environments.

5.3. Limitations and Future Work

Experimental constraints: Laboratory tests omitted tidal currents and biological factors (e.g., biofilm effects). Future wave-tank experiments should replicate dynamic flows. Mineralogical considerations: While results are validated for kaolinite-rich clays, different behaviors may occur in illite—or montmorillonite-dominated sediments [19]. Field validation: The proposed 12.0 kN/m3 threshold requires monitoring during the Tanzhou Waterway’s post-dredging phase (planned 2026).

6. Conclusions

This study investigated the sedimentation dynamics and microstructural evolution of slurry under varying initial conditions through multi-scale characterization, using silty clay and mucky soil from the foundation trench of the Tanzhou Waterway Immersed Tunnel in Shunde as test materials. The main conclusions are as follows:
(1)
The settlement behavior of silty clay and mucky soil slurries can be categorized into two distinct types: consolidation settlement and hindered settlement. Consolidation settlement curves are characterized by an inverse “S” shape, while hindered settlement curves exhibit pronounced three-stage features (flocculation, sedimentation, and consolidation stages). Experimental results demonstrate that silty clay slurry primarily shows consolidation settlement at lower initial heights (10–20 cm) but transitions to hindered settlement behavior at greater initial heights (40–60 cm). In contrast, mucky soil slurry consistently displays hindered settlement characteristics across all tested initial conditions. The strong positive correlation between the duration of hindered settlement and initial slurry height confirms that settling distance is the primary determinant of settlement stage duration;
(2)
The settlement rate of silty clay slurry depends on both initial height and unit weight, with low-unit-weight (11.5 kN/m3) slurries at high initial heights (40 cm, 60 cm) showing significantly higher settlement rates compared to other conditions. In contrast, mucky soil slurry exhibits more consistent settlement behavior, with a clear decreasing trend with increasing initial height. However, when the unit weight reaches 12.0 kN/m3, the effect of initial height on settlement rate becomes less pronounced;
(3)
The water content evolution of silty clay sediments shows temporal stability, with low-unit-weight slurries (11.5 kN/m3) showing considerable data variability, whereas high-unit-weight specimens (12.6 kN/m3) display characteristic slow drainage behavior typical of compacted soils. In mucky soil sediments, low-unit-weight slurries display pronounced structural instability accompanied by frequent anomalous water content readings. Specimens with a 12.0 kN/m3 unit weight show rapid initial drainage rates during early sedimentation, followed by water content recovery in later stages caused by pore water redistribution phenomena;
(4)
The sediment particles of mucky soil are characterized by a laminar structure, transitioning gradually from face-to-face contact in the bottom layer to face-to-edge or face-to-body contact in the upper layer. The porosity increases with sedimentation height, ranging from 45% to 50%. The pore geometry evolves from regular to complex shapes, with a shape factor of 0.35 to 0.40 indicating pore anisotropy, which stabilizes over time with prolonged sedimentation. The probability entropy suggests a highly random initial pore distribution. The rose diagram exhibits an elliptical pattern, reflecting the compaction and structural reorganization of particle arrangement. In contrast, silty clay sediments display a honeycomb-like cavity structure that diminishes with decreasing initial density, accompanied by prominent particle aggregation.
This study provides a theoretical foundation for predicting back-silting in immersed tunnel foundation trenches and optimizing dredging criteria. The findings yield actionable guidelines for immersed tunnel construction: (1) implement dual-criteria control (height > 30 cm or unit weight < 12.0 kN/m3 triggers intervention), (2) schedule critical works outside the 21–28 d moisture rebound period, and (3) adopt portable rheometry for real-time quality control. And future work should (1) develop multi-scale models that couple short-term sedimentation dynamics (e.g., pore structure evolution) with long-term trench stability predictions, incorporating field monitoring data for validation, and (2) explore bio-stabilization techniques for eco-friendly soil improvement. These directions will bridge lab-to-field gaps while addressing sustainability challenges in coastal geotechnics.

Supplementary Materials

The following supporting information can be downloaded at https://www.mdpi.com/article/10.3390/eng6080200/s1.

Author Contributions

Investigation, S.Y.; validation, S.Y.; resources, S.Y.; conceptualization, D.C. and Q.H.; methodology, J.Z.; writing—original draft preparation, J.Z. and G.L.; writing—review and editing, S.Y. and D.C.; funding acquisition, X.L. All authors have read and agreed to the published version of the manuscript.

Funding

This work was supported by the National Natural Science Foundation of China (Grant Nos. 42071078 and 42171130).

Data Availability Statement

Due to project confidentiality agreements, raw field sampling data are available from the corresponding authors upon request and approval by the Foshan Shunde District Construction Project Center.

Conflicts of Interest

Author Qingfei Huang was employed by CCCC Highway Consultants Co., Ltd.; Xingbang Lu was employed by CCCC Highway Bridges National Engineering Research Centre Co., Ltd.; and Shuangwu Yu was employed by Foshan Shunde District Construction Project Center. The remaining authors declare that the research was conducted in the absence of any commercial or financial relationships that could be construed as a potential conflict of interest. While the authors received funding from the National Natural Science Foundation of China (Grant Nos. 42071078, 42171130) and collaborated with the Foshan Shunde District Construction Project Center, these entities had no role in the design of the study, data analysis, or interpretation of results.

References

  1. Wang, Y.; Zhou, H.; Min, X. Modelling the performance of immersed tunnel via considering variation of subsoil property. Ocean Eng. 2022, 266, 113114. [Google Scholar] [CrossRef]
  2. Yang, C.; Wang, Y.; Wei, L.; Chen, Y. Mechanical Characteristics of Variable Cross-Section Immersed Tunnels under Spatial Differential Settlement. Adv. Civ. Eng. 2022, 2022, 8357463. [Google Scholar] [CrossRef]
  3. Li, K.; Li, Q.; Fan, Z. Hong Kong—Zhuhai—Macau sea link project, China. In Marine Concrete Structures; Woodhead Publishing: Cambridge, UK, 2016; pp. 339–370. [Google Scholar]
  4. Chen, W.; Huang, L.; Wang, D.; Liu, C.; Xu, L.; Ding, Z. Effects of siltation and desiltation on the wave-induced stability of foundation trench of immersed tunnel. Soil Dyn. Earthq. Eng. 2022, 160, 107360. [Google Scholar] [CrossRef]
  5. Martellotta, A.M.N.; Levacher, D.; Gentile, F.; Piccinni, A.F. Estimation of Silting Evolution in the Camastra Reservoir and Proposals for Sediment Recovery. J. Mar. Sci. Eng. 2024, 12, 250. [Google Scholar] [CrossRef]
  6. Wu, T.; Sheng, Y.; Chen, D.; Qin, B. Synchronism of sediment erosion and deposition processes during high-turbidity events in a large shallow lake. J. Hydrol. 2023, 623, 129853. [Google Scholar] [CrossRef]
  7. Zhong, Y.; Du, J.; Wang, Y.; Li, P.; Xu, G.; Miu, H.; Gao, W. Modeling the Impacts of Land Reclamation on Sediment Dynamics in a Semi-Enclosed Bay. J. Mar. Sci. Eng. 2024, 12, 1633. [Google Scholar] [CrossRef]
  8. Chen, W.; Liu, C.; He, R.; Chen, G.; Jeng, D.; Duan, L. Stability of the foundation trench of the immersed tunnel subjected to combined wave and current loading. Appl. Ocean Res. 2021, 110, 102627. [Google Scholar] [CrossRef]
  9. Hussein, A.A.A.; Zhao, L.; Al-Masgari, A.A.S.A.; Handoyo, H. Shear strength characteristics of marine sediments: The influences of lithofacies and sedimentological environment. Mar. Geophys. Res. 2024, 45, 14. [Google Scholar] [CrossRef]
  10. Vakalas, I.; Zananiri, I. Net Transport Patterns of Surficial Marine Sediments in the North Aegean Sea, Greece. J. Mar. Sci. Eng. 2024, 12, 512. [Google Scholar] [CrossRef]
  11. Chondros, M.; Metallinos, A.; Papadimitriou, A.; Tsoukala, V. Sediment Transport Equivalent Waves for Estimating Annually Averaged Sedimentation and Erosion Trends in Sandy Coastal Areas. J. Mar. Sci. Eng. 2022, 10, 1726. [Google Scholar] [CrossRef]
  12. Zhang, S.; Tang, Y.; Zhao, Y.; Chen, Y. Experimental and numerical investigation of inverse-grading characteristics in the underwater granular deposition. Environ. Earth Sci. 2025, 84, 103. [Google Scholar] [CrossRef]
  13. Vasudevan, S.; Sajeev, R.; Ramakrishnan, R. Seasonal variations in textural characteristics and depositional environment of foreshore sediments along Kerala Coast, India. Mar. Georesour. Geotechnol. 2024, 42, 279–288. [Google Scholar] [CrossRef]
  14. Imai, G. Settling behavior of clay suspension. Soils Found. 1980, 20, 61–77. [Google Scholar] [CrossRef] [PubMed]
  15. Imai, G. Experimental studies on sedimentation mechanism and sediment formation of clay materials. Soils Found. 1981, 21, 7–20. [Google Scholar] [CrossRef]
  16. Toorman, E.A.; Berlamont, J.E. A hindered settling model for the prediction of settling and consolidation of cohesive sediment. Geo-Mar. Lett. 1991, 11, 179–183. [Google Scholar] [CrossRef]
  17. Ramakrishnan, B.; Gavali, M.; Jeyaraj, S. Comprehensive Analysis of Siltation Behavior in the Navigation Channel of Deendayal Port (India): Field Observations, Numerical Modeling, and Engineering Solutions. J. Coast. Res. 2024, 40, 138–149. [Google Scholar] [CrossRef]
  18. Gao, Y.F.; Zhang, Y.; Zhou, Y.; Li, D.Y. Effects of column diameter on setting behavior of dredged slurry in sedimentation experiments. Mar. Georesour. Geotechnol. 2016, 34, 431–439. [Google Scholar] [CrossRef]
  19. Yang, J.; Dai, J.W.; Wu, X.Q.; Tu, Y.; Dong, S.; Li, Q. Quantitative evaluation of the influence of siderite cements on middle-shallow reservoirs: A case study of the southern oil area in the Enping Sag, Pearl River Mouth Basin. Bull. Geol. Sci. Technol. 2023, 42, 127–136. [Google Scholar]
  20. Hu, S.; Yi, S.; Sun, M.; Chen, P.; Wei, C. Experimental study of compression behavior and its correlation with the microstructure of a deep-water sediment. Mar. Georesour. Geotechnol. 2025, 43, 635–645. [Google Scholar] [CrossRef]
  21. Oberhollenzer, S.; Hauser, L.; Baldermann, A.; Marte, R.; Tschuchnigg, F.; Schweiger, H.F.; Dietzel, M. Microstructure development in lacustrine, fine-grained sediments traced by in situ and laboratory testing. Int. J. Environ. Sci. Technol. 2024, 21, 6429–6444. [Google Scholar] [CrossRef]
  22. Cai, G.H.; Zhang, C.H.; Zhou, Y.F.; Li, J.S.; Poon, C.S. Mechanical behavior and microstructure mechanism of artificially stabilized marine sediment under high water content. Constr. Build. Mater. 2024, 420, 135484. [Google Scholar] [CrossRef]
  23. Yang, A.W.; Du, D.J.; Lu, L.Q. Study on sediment characteristics and micro-structure of soft dredger soilof Tianjin. Hydrogeol. Eng. Geol. 2010, 37, 83–87. [Google Scholar]
  24. Song, C.; Yang, B.; Zhang, C.M.; Zhu, B.Y.; Zhang, Z.S. Investigation of pore structure and permeability estimation models of Kongdian Formation glutenites in the Bozhong 19-6 Gasfield. Bull. Geol. Sci. Technol. 2023, 42, 274–285. [Google Scholar]
  25. GB/T 50123-2019; Standard for Geotechnical Testing Method. Ministry of Water Resources of the People’s Republic of China: Beijing, China, 2019.
  26. JTS 167-2-2009; Design and Construction Code for Gravity Quay. Ministry of Transport of the People’s Republic of China: Beijing, China, 2009.
  27. JTS 257-2008; Standard for Quality Inspection of Port and Waterway Engineering Construction. Ministry of Transport of the People’s Republic of China: Beijing, China, 2008.
  28. JTS 133-2013; Code for Geotechnical Investigationon Port and Waterway Engineering. Ministry of Transport of the People’s Republic of China: Beijing, China, 2013.
  29. Hu, Q.; Ma, D.Q. Research on foundation trench dredging of immersed tunnel in Shenzhen-Zhongshan Link. J. Waterw. Harbor 2023, 44, 300–304. [Google Scholar]
  30. SZTD D01-2019; Quality Inspection and Evaluation Standard for Island-Tunnel Engineering of Zhongshan-Shenzhen Corridor Project. Zhongshan-Shenzhen Corridor Management Center: Shenzhen, China, 2020.
  31. Yang, H.; Wang, R.K.; Han, X.J.; Xie, M.X. Overview of sedimentation research and innovative practice to the Hong Kong-Zhuhai-Macau Bridge Tunnel Trench. J. Waterw. Harbor 2018, 39, 125–132. [Google Scholar]
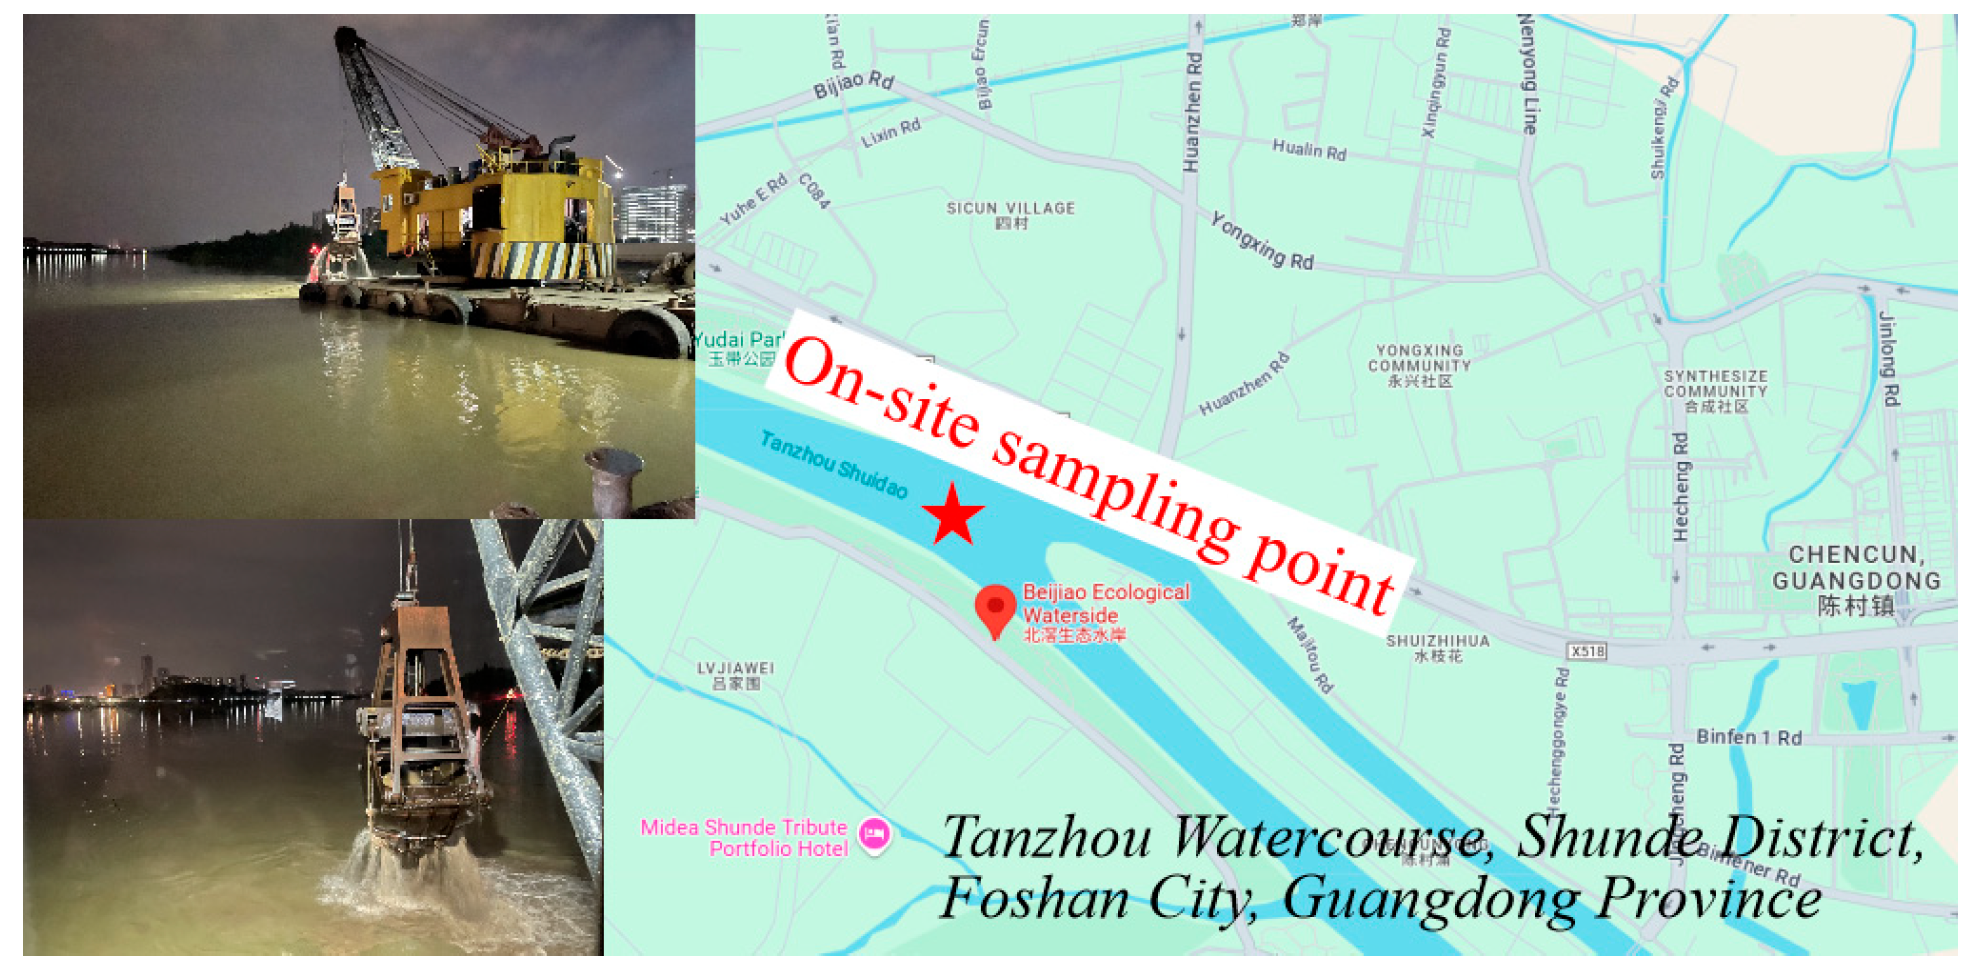
Figure 1. On-site collection of mucky soil and silty clay from foundation trenches (Tanzhou Waterway, Shunde District, Foshan City, Guangdong Province).
Eng 06 00200 g001
Figure 2. Particle size distribution curves of tested soils.
Eng 06 00200 g002
Figure 3. Experimental setup for sedimentation tests.
Eng 06 00200 g003
Figure 4. Layered sampling test for determining moisture content and analyzing microstructure process.
Eng 06 00200 g004
Figure 5. Settling curves of slurry. Silty clay slurries with different unit weights: (a) 11.5 kN/m3; (c) 12.0 kN/m3; (e) 12.6 kN/m3; Mucky soil slurries with different unit weights: (b) 11.5 kN/m3; (d) 12.0 kN/m3; (f) 12.6 kN/m3.
Eng 06 00200 g005
Figure 6. Variation of slurry sedimentation rate with unit weight at different initial heights: (a) silty clay slurries; (b) mucky soil slurries.
Eng 06 00200 g006
Figure 7. Variation of water content over time in different layers of slurry with varying unit weights: (a) silty clay slurries; (b) mucky soil slurries.
Eng 06 00200 g007
Figure 8. Microstructural characteristics of mucky soil slurry sediments under different conditions: (a) bottom layer (14 d, 5000× (a1), 2000× (a2), 1000× (a3)); (b) middle layer (14 d); (c) upper layer (14 d); (d) bottom layer (21 d).
Eng 06 00200 g008
Figure 9. Microstructural evolution of silty clay slurry sediments with varying unit weights and sedimentation times: (a) upper layer (12.6 kN/m3, 14 d); (b) bottom layer (12.6 kN/m3, 21 d); (c) bottom layer (12.6 kN/m3, 28 d); (d) middle layer (12.0 kN/m3, 14 d); (e) bottom layer (12.0 kN/m3, 28 d); (f) bottom layer (11.5 kN/m3, 21 d).
Eng 06 00200 g009
Figure 10. Variation of porosity, shape factor, and probability entropy in sediment pore structure: silty clay slurries: (a,c,e); mucky soil slurries: (b,d,f).
Eng 06 00200 g010
Figure 11. Rose diagram depicting the pore direction distribution in sediments of varying initial unit weight mucky soil slurries: (a) 11.5 kN/m3, 14 d; (b) 12.0 kN/m3, 7 d; (c) 12.6 kN/m3, 21 d; (d) 12.6 kN/m3, 28 d.
Eng 06 00200 g011
Table 1. Basic geotechnical properties of tested soils.
Soil TypeSpecific GravityPlastic Limit (%)Liquid Limit (%)Plasticity Index
Silty clay2.61530.79918.24212.557
Mucky soil2.61943.00224.12118.847
Disclaimer/Publisher’s Note: The statements, opinions and data contained in all publications are solely those of the individual author(s) and contributor(s) and not of MDPI and/or the editor(s). MDPI and/or the editor(s) disclaim responsibility for any injury to people or property resulting from any ideas, methods, instructions or products referred to in the content.