Article

Advanced and Robust Numerical Framework for Transient Electrohydrodynamic Discharges in Gas Insulation Systems

Institute of High Voltage Engineering, TU Dortmund University, Friedrich-Wöhler-Weg 4, 44227 Dortmund, Germany
*
Author to whom correspondence should be addressed.
These authors contributed equally to this work.
Eng 2025, 6(8), 194; https://doi.org/10.3390/eng6080194
Submission received: 27 June 2025 / Revised: 26 July 2025 / Accepted: 29 July 2025 / Published: 6 August 2025
(This article belongs to the Section Electrical and Electronic Engineering)

Abstract

For the precise description of gas physical processes in high-voltage direct current (HVDC) transmission, an advanced and robust numerical framework for the simulation of transient particle densities in the course of corona discharges is developed in this work. The aim is the scalable and consistent modeling of the space charge density under realistic conditions. The core component of the framework is a discontinuous Galerkin method that ensures the conservative properties of the underlying hyperbolic problem. The space charge density at the electrode surface is imposed as a dynamic boundary condition via Lagrange multipliers. To increase the numerical stability and convergence rate, a homotopy approach is also integrated. For the experimental validation, a measurement concept was realised that uses a subtraction method to specifically remove the displacement current component in the signal and thus enables an isolated recording of the transient ion current with superimposed voltage stresses. The experimental results on a small scale agree with the numerical predictions and prove the quality of the model. On this basis, the framework is transferred to hybrid HVDC overhead line systems with a bipolar design. In the event of a fault, significant transient space charge densities can be seen there, especially when superimposed with new types of voltage waveforms. The framework thus provides a reliable contribution to insulation coordination in complex HVDC systems and enables the realistic analysis of electrohydrodynamic coupling effects on an industrial scale.

1. Introduction

As part of the energy transition, Germany and the European Union are pursuing the goal of replacing fossil fuels with renewable sources and making the energy supply climate-neutral in the long term. The Energy Industry Act (EnWG) has created a legal environment for this. However, the transformation requires not only new energy sources, but also an efficient and flexible energy infrastructure [1]. The increasing proportion of decentralised, volatile energy—for example from wind, solar and biomass plants—creates new challenges for the electricity transmission grid [2]. High-voltage direct current (HVDC) transmission is a key technology for transporting large amounts of energy over long distances with reduced losses. However, the technical challenges also increase with the use of this technology. HVDC systems are subject to special operating conditions: They generate—particularly in the event of a fault in modular multilevel converter (MMC) network topologies—new types of voltages with pronounced DC and pulse components, the effect of which on equipment and, in particular, on insulating materials is not yet fully understood [3].
A central issue is the physical gas discharge processes in insulating media, which are influenced by new voltage modes. Their description, simulation and evaluation is essential in order to understand the behavior of insulating gases under realistic conditions. In this context, the first step is to analyze the current state of research, which has produced a large number of numerical and experimental approaches in recent years, in order to derive the knowledge gaps and research motivation for this work.

1.1. Status Quo

The Boltzmann equation provides the physical basis of the kinetic theory of gases and is a central element of non-equilibrium thermodynamics, as used in the modeling of corona discharges. Four common simulation methods exist for the numerical solution of this Equation [4]:
1.
Particle models
2.
Kinetic models
3.
Fluid models
4.
Hybrid models
Particle models solve the Boltzmann equation directly and provide a very accurate description of the plasma behavior. However, due to the high computational effort involved, they are practically unusable for large-scale HVDC applications such as overhead line systems or converter halls [4].
Kinetic models couple the Boltzmann equation to the Poisson equation and describe energy distributions in particular under different field conditions. They are useful for calculating transport parameters, for example for new insulating gases, but are limited to local problems. They reach their limits in HVDC systems with large field strength gradients, transient overvoltages or spatially extended geometries [4].
Fluid models are derived from moments of the Boltzmann equation and describe macroscopic variables such as density, current or temperature as a function of the electric field. These models are comparatively efficient and are suitable for applications with stationary and time-varying fields. However, they are based on local approximations such as the local field approximation (LFA) or the local energy approximation (LEA). However, the assumptions break down in the case of certain phenomena such as runaway electrons, which are accelerated by strong fields over large distances and have an effect outside the local field range. In addition, particle losses occur in the numerical solution using conventional finite element methods, which leads to incorrect space charge profiles and ion current densities [4].
Hybrid models combine particle and fluid approaches, for example by describing the discharge front using particle simulation and the remaining area using a fluid model. Such models offer a good compromise between accuracy and computing time. However, the coupling of the two methods is numerically demanding—especially for 3D systems with complex electrode topologies [4].
Significant progress was made in [5] by considering higher-order models, which included not only particle density but also energy transport through the use of the LEA. Such models lead mathematically to hyperbolic systems of equations, the solution is numerically demanding. In this context problems such as numerical diffusion or instabilities with steep gradients occurred [5,6,7].
A methodological improvement resulted from the development of flux-corrected transport (FCT) methods. The SHASTA algorithm by Boris and Book [8] and its multidimensional extension by Zalesak [9] were key contributions that were later transferred to finite element methods (FEM) [10,11]. The first application to gas discharges was made by Morrow, who transferred the FCT approach to the solution of the transport Equations [12]. Morrow also analyzed the effect of external circuits and found that diffusion effects have only a minor influence on the simulation result, but significantly affect the computing time [13,14,15]. The coupling of Boltzmann equation and Poisson equation for the direct derivation of transport equations was first carried out by Lin et al. in 1979 [16], further systematic overviews were provided by Kumar et al. [17].
Georghiou et al. were the first to combine FEM with FCT, significantly reducing the number of nodes [10,18]. Comparisons between model orders yielded inconsistent results: while Eichwald et al. [19] identified advantages of higher-order models, Markosyan et al. [4] argued that even first-order models sufficiently describe the discharge. Further hybrid approaches, such as those proposed by Li et al., combine Monte Carlo simulations in the discharge front with fluid models in the remaining domain [20].
In 1998, Medlin and Morrow [21] simulated a monopolar overhead line configuration under the influence of crosswinds and analyzed their numerical method with respect to the displacement of space charge density caused by this force effect. The study is limited by the monopolar setup and the assumption of a steady-state corona problem. A finite volume method is used for discretization. It is explicitly stated that numerical oscillations may occur if the stability condition is not satisfied.
Despite the advances in numerical methods for simulating electrical discharges described in the previous sections, the full-scale calculation of corona discharges in real HVDC systems still poses a major challenge. The non-linear relationship between electric field distribution, space charge and current density as well as the geometric complexity of the systems make the direct numerical solution of the underlying equation systems computationally intensive and unstable. In order to meet these challenges, various simplifying approaches have been developed.
An established method is the so-called Deutsch assumption, which assumes that the field distribution is not changed by space charge, but merely redistributed along existing field lines [22]. This allows an efficient calculation of the space charge density and current distribution, especially for cylindrically symmetrical configurations. However, the range of validity is limited, as the mutual coupling of electric field distribution and space charge is only insufficiently taken into account—particularly in the case of bipolar or asymmetrical conductor arrangements, as occur in modern HVDC systems.
The Kaptzow assumption, on the other hand, offers a practical approach to modeling the boundary conditions at the conductor surface. Here, it is assumed that the electric field strength at the conductor corresponds exactly to the corona field strength [23]. This procedure enables a robust and reproducible determination of the ion sources at the start of the discharge and is a frequently used input variable in numerical modeling, for example for initializing drift-diffusion models. In combination with field solvers, the Kaptzow assumption is used to iteratively obtain a consistent solution of the coupled Poisson and corona problem.
In 2002, Min and Lee [24] used the FEM method with flux correction to investigate the transient behavior until a stationary state is reached under pure direct voltage, i.e., in a monopolar system. They analyzed a coaxial arrangement of electron, negative ion and positive ion densities without applying the Kaptzow assumption. However, the space charge density at the edge of the conductor was only modeled using an approximate Gaussian distribution.
Using a hybrid particle-in-cell method, Arruda and Lima succeeded in 2015 in simulating a bipolar corona problem under turbulent wind conditions in order to extract the ion current density [25]. Although the scenario considered is limited to applied DC voltages, it should be emphasized that the Deutsch assumption was omitted, which contributes to a more precise model description.
An example of the numerical investigation of hybrid overhead line systems is provided by Straumann, who used the finite element method (FEM) to analyze a system in which the AC side was switched off [26]. The aim was to evaluate the coupling effects of the DC corona current on the neighboring three-phase line. This made it possible for the first time to quantify steady-state coupling currents and determine the electric field distribution under realistic boundary conditions—an important step towards assessing the operating and protection requirements of hybrid HVDC applications. In this approach, the unknown space charge density at the conductor boundary is approximated using an iterative method. As a result, it becomes difficult to achieve a fully time-resolved solution of the system, since the boundary space charge density must be computed iteratively at each time step.
In addition, semi-analytical methods, such as the Sarma method, are also used [27]. These methods use analytically approximated field distributions and allow a simplified calculation of the current distribution with simultaneously reduced numerical complexity. They are particularly suitable for idealized geometries and stationary conditions.
DIN 0210-9 also proposes approximating bipolar HVDC systems by the superposition of two unipolar systems [28]. This approach is computationally efficient, but neglects non-linear coupling effects in the space charge development, which leads to limitations in validity—particularly in the case of transient processes or asymmetrical design. This effect was numerically investigated in a previous study from 2020 [29]. A stationary bipolar overhead line system was analyzed and compared to a superimposed monopolar configuration. In this context, an initial method for optimizing the space charge density at the conductor boundary was introduced. The results indicate that the ion current is underestimated when a bipolar problem is approximated by two separate monopolar problems.
In 2021, Milan Ignjatović and Jovan Cvetić modeled corona discharge under a transient negative lightning impulse voltage without any superimposed DC component [30]. They applied a drift–diffusion–reaction model in coaxial geometry, solving continuity equations for charged species coupled with Poisson’s equation to capture the spatiotemporal dynamics. Their results showed that corona charge accumulates even as the voltage decreases, with detailed analysis of transient current and charge–voltage behavior during the impulse.
In 2024, Zogning et al. used a 2D finite-element plasma-fluid model to study corona discharges on polymer insulators [31]. While no new numerical methods were developed, an established modeling approach was applied specifically to the air gap along insulator surfaces. The study showed how space and surface charges influence the electric field distribution and confirmed that grading rings effectively reduce field peaks and suppress discharge activity. Notably, the simulations were performed under pure DC voltage conditions.

1.2. Research Gaps and Objectives

Despite the range of existing studies, key aspects of the physical modeling and numerical implementation remain unresolved. Based on the current state of research, several gaps can be identified, forming the foundation for the present work:
1.
Unknown space charge density at the conductor surface: This boundary condition acts as the starting point of corona discharge and typically requires iterative adjustment using conventional approaches (e.g., the Kaptzow assumption). This leads to high computational cost and complicates fully time-resolved modeling.
2.
Lack of numerical methods for accurately capturing transient voltage stresses: There is currently no robust and efficient method for modeling systems under rapidly changing voltage conditions or impulse excitations with sufficient stability and resolution.
3.
Insufficient modeling of superimposed voltage waveforms (DC + impulse/AC/DC coupling): Complex voltage excitations combining DC, AC, and overvoltage components are not adequately represented in existing simulation approaches.
4.
Absence of fully time-coupled modeling for bipolar AC/DC systems: There is a lack of consistent numerical frameworks for simulating systems with both positive and negative space charge densities under alternating field conditions in a fully time-dependent manner.
5.
Need for extended experimental validation for superimposed overvoltage waveforms: Existing measurement concepts must be enhanced to isolate the transient ion current. This requires separating and calibrating out the displacement current, which is typically measured simultaneously.
The primary objective of this work is the development of a time-resolved simulation and validation framework for bipolar corona discharge systems under complex, superimposed voltage conditions. In particular, the aim is to enable accurate and computationally efficient modeling of space charge dynamics, especially at the boundary of high-voltage electrodes, and to scale the validated method from laboratory conditions to large-scale high-voltage direct current (HVDC) applications.
To achieve this, the first moment of the Boltzmann equation is coupled with Poisson equation to describe the time-dependent advection problem governing charge transport. Due to the requirement of particle conservation, a discontinuous Galerkin (DG) method is employed, incorporating a Lax–Friedrichs numerical flux for stabilization and flux correction. A key novelty lies in the instantaneous enforcement of the unknown space charge density at the conductor boundary: instead of iterative adjustment, the boundary condition is formulated as a constrained optimization problem and solved using Lagrange multipliers.
The modeling framework is validated at small scale through laboratory experiments, where the transient ion current resulting from superimposed voltage waveforms (DC, impulse, AC/DC coupling) is measured and analyzed. Characteristic figures of merit are defined to quantify the ion current impulse behavior.
Following validation, the framework is scaled and synthesized for realistic HVDC geometries and dimensions. The final step involves an assessment of the method’s suitability and performance for large-scale applications.
This work contributes a novel numerical-experimental approach for corona discharge modeling by:
  • Introducing an optimization-based boundary condition treatment for space charge density,
  • Applying a conservative DG scheme to the coupled PDE system in a time-resolved manner,
  • Validating transient ion current behavior under mixed voltage stress, and
  • Bridging the gap between experimental-scale modeling and application-relevant HVDC system dimensions.
To address the outlined research objectives and close the identified gaps, an advanced and robust numerical framework for transient electrohydrodynamic discharges is developed in the following chapter. This includes the mathematical formulation of the governing equations, the chosen numerical discretization techniques, and the strategy for experimental validation. Each component is designed to ensure consistency between physical modeling, numerical stability, and practical applicability.
2. Materials and Methods

The framework begins with the development of the numerical model, which forms the core of the simulation approach. This includes the derivation and coupling of the governing equations, the choice of numerical discretization methods, and the treatment of boundary conditions—particularly the optimization-based approach for space charge density.
Following the numerical formulation, the second part of this section presents the test setup, which serves to validate the model under well-defined conditions. The combination of both elements enables a robust evaluation of the proposed approach.

2.1. Numerical Formulation and Discretization of Transient Electrohydrodynamic Equations

The mathematical model used in this work is based on an electrohydrodynamic approach (EHD model). Electrohydrodynamics describes physical phenomena in which electric fields generate flows in electrically charged fluids. Electrokinetics is a special case in this context [32]. The aim of the model is to calculate space charge densities and the resulting ion currents in the vicinity of high-voltage electrodes. In contrast to fully resolved streamer models, the complexity of the model used here is reduced by a central simplification: the ionization zone is not explicitly modeled. Instead, the conductor surface is considered to be the source of positive or negative ions [33]. This assumption is justified because the radius of the ionization zone is of the same order of magnitude as the conductor radius itself and is therefore negligible in relation to the total extent of the electric field. In addition, this model simplification enables an efficient numerical description of the corona discharge process using a coupled system of Poisson’s equation and continuity equation. The Poisson equation for calculating a bipolar corona is as follows [34]:
Δ ϕ = ρ + + ρ ϵ 0 ϵ r ,
where ρ + and ρ represent the positive and negative space charge densities. The current densities J in A m 2 are given by:
J ± = μ ± ρ ± E D ± grad ρ ± ,
where μ is the ion mobility in m 2 V 1   s 1 , ρ is the space charge density in C   m 3 and D is the diffusion coefficient in m 2   s 1 . The temporal evolution of the space charge densities is governed by the continuity equations with a recombination term:
ρ ± t + div J ± = β I ρ + ρ e ,
where β I denotes the ion-ion recombination coefficient in m 3   s 1 and e represents the elementary charge in C . Since the ionization zone is neglected, the high-voltage electrodes serve as the only source of ions [23,35].
The described space charge movement in the discharge volume results in a macroscopic current flow in the external circuit. The energy balance equation finally follows with div E La = 0 and Equation (2) (with D = 0 ):
U · I = e J · E La d V + ϵ E La t · E La d V ,
where the first term describes the current caused by the charge carrier movement and the second term describes the displacement current density due to the externally applied potential. E La describes the space-charge-free Laplace field [36].
When solving such advection and conservation equations in the context of conservative hyperbolic problems, the standard finite element method (FEM) faces numerical difficulties that can result in violations of fundamental conservation principles, such as mass or energy conservation. In high-voltage engineering, however, advection equations typically exhibit steep gradients or even discontinuities. These features are inadequately captured by the standard FEM, leading to numerical diffusion—an effect where sharp profiles are artificially smoothed [37]. As a result, nonphysical losses of mass or energy occur, which are not due to real processes but rather to the chosen numerical method. However, the exact numerical flux across element boundaries is crucial for accurately representing conserved quantities [4].
To ensure both physical accuracy and numerical stability in the modeling of particle densities, the discontinuous Galerkin method (DG) is introduced in the following. By employing locally discontinuous basis functions, it enables the precise treatment of steep gradients and systematically preserves the conservative nature of Equations [38,39,40].
Equation (3) under unipolar conditions (where the recombination term vanishes) and with D = 0 (no diffusion, as the advection term clearly dominates) is, analogous to the standard FEM, first multiplied by a test function φ V (where V is the function space of piecewise continuous polynomials) and integrated over the entire domain Ω [39]:
Ω ρ + t φ d x d y + Ω div J ( ρ + ) φ d x d y = 0 .
To obtain the weak form, the Gauss theorem is applied:
Ω ρ + t φ d x d y + Ω J ( ρ + ) · n ^ φ d s Ω J ( ρ + ) · φ d x d y = 0 .
Here, n ^ denotes the normal vector on the element boundary Ω .
The computational domain Ω is finally discretized into a triangular mesh with T k triangles [41]:
Ω = k T k .
In the context of a DG method, the test functions φ and the approximate solution functions ρ + , h are chosen from the same finite function space V [39,40]. For each triangular element T k , a function ρ + , h V is sought that satisfies
T k ρ + , h t φ d x d y + T k J ( ρ + , h ) · n ^ φ d s T k J ( ρ + , h ) · φ d x d y = 0 .
A composition of all these functions ρ + , h then yields the complete approximate solution over the domain Ω .
However, the boundary integral cannot be directly evaluated because the solution functions are discontinuous at the element boundaries due to the discontinuous function space. Therefore, a numerical flux ( J · n ^ ) k * is introduced, where the index k corresponds to the edge of the triangular element T k [39,40]. Thus, for each edge, there is a numerical flux that is composed of the value of ρ + , h from the element itself and the value of ρ + , h + from the neighboring element. The term J ( ρ + , h ) n ^ in Equation (8) is replaced by the numerical flux ( J · n ^ ) k * and the boundary integral over T k is expressed as a sum of individual integrals over all edges k of the element [39]:
T k ρ + , h t φ d x d y + k k ( J · n ^ ) k * φ d s T k J ( ρ + , h ) · φ d x d y = 0 .
Finally, the Lax–Friedrichs flux is used as the numerical flux function in the following [42]:
( J · n ^ ) k * = 1 2 J ( ρ + , h ) n ^ + J ( ρ + , h + ) n ^ λ ρ + , h + ρ + , h ,
where λ is the largest eigenvalue of the Jacobian matrix J ( n ) in the vicinity of the edge. This method does not suffer from numerical dispersion to the same extent as classical upwind fluxes [43].
For each triangular element in the discretization, the approximate solution ρ + , h and the test function φ are represented by a linear combination of the nodal basis functions l i ( x , y ) as
ρ + , h = i = 0 m ρ + , h i l i ( x , y )
and
φ = i = 0 m φ i l i ( x , y ) .
The weak formulation of the local Equation (9) is expressed by the element mass matrix M k and the local operator L k for the semi-discrete differential equation
M k d ρ + , h d t = L k .
The mass matrix for the k-th element is accordingly defined as
M i j k = k φ i φ j d x d y ,
and the local operator L k with the Lax–Friedrichs flux is given by
L k = k k 1 2 J ( ρ + , h ) · n ^ + J ( ρ + , h + ) · n ^ λ ρ + , h + ρ + , h φ i d s .
The global assembly sums the contributions of all elements and their edges T k to yield
M d ρ + , h d t = L ,
where M is the global mass matrix, assembled from the local mass matrices M k of each element, and L is the global operator, incorporating the spatial discretization and the fluxes at the element boundaries [39,40]. The resulting semi-discrete differential equation is solved in the time domain using an explicit Runge–Kutta method. For the stability of this time integration, the CFL condition must be strictly satisfied [44].

2.2. Optimization-Based Boundary Condition for Space Charge Emission

Equation (3) describes a first-order partial differential Equation (PDE). To obtain a unique solution to this PDE, a boundary condition in addition to the initial distribution is required.
For a self-consistent model, the advection equation must be coupled with the Poisson equation, as the particle density depends on the electric potential, while simultaneously influencing the potential field. The Poisson equation, being a second-order PDE, requires two boundary conditions for a unique solution.
In principle, three types of boundary conditions can be prescribed for the Poisson equation: First, the direct specification of the potential via a Dirichlet boundary condition—for example, setting the ground potential to 0 V and the high-voltage potential to U. Second, the specification of the potential gradient, corresponding to a Neumann boundary condition [45].
In the context of corona discharge modeling, the potential gradient at the electrode defines the corona onset gradient. This gradient marks the threshold beyond which space charge or particle densities are generated. As long as the corona onset gradient is not exceeded, existing space charge densities merely scale the electric potential field without inducing a net discharge.
For a newly developed method for determining the corona onset gradient for complex electrode structures, reference is made to previous work [46]. However, the specification of a suitable boundary condition for the advection Equation (3) remains problematic.
Following the model simplification, which places the ionization zone at the boundary of the high-voltage electrode, the space charge density at the boundary remains unknown. This value physically represents the amount of space charge density generated by ionization in the immediate vicinity of the electrode and must be determined numerically in the subsequent course of this work.
To overcome this issue, a method is presented that directly enforces the unknown space charge density at the conductor boundary via a variational formulation, thereby eliminating the need for a separate iterative process. For this purpose, the space charge density ρ is first decomposed into a spatially varying component and a constant component over the entire computational domain:
ρ = ρ 0 + d ρ
Within this framework, the constant component ρ 0 represents the unknown space charge density at the boundary of the high-voltage electrode and characterizes the space charge production due to the corona discharge. Meanwhile, the spatially varying component d ρ models the spatial distribution of the space charge density within the interior of the computational domain.
In the proposed approach, the constant value ρ 0 is treated as a Dirichlet boundary condition and is determined via a variational formulation employing the method of Lagrange multipliers [47]. For this purpose, the functional
J [ ρ 0 ] = Ω F ( x , ρ 0 , ρ 0 ) , d x
is minimized subject to the boundary condition
ρ 0 = g x Ω ,
where g denotes the prescribed value of the space charge density on the boundary. To implement the Dirichlet boundary condition using Lagrange multipliers, a Lagrangian functional L is introduced, which incorporates both the original functional J [ ρ 0 ] and the boundary condition [48]:
L [ ρ 0 , λ ] = J [ ρ 0 ] + Ω λ ( ρ 0 g ) d s
Here, λ is the Lagrange multiplier, and the integral over Ω ensures that the boundary condition ρ 0 = g is enforced. The corresponding Euler–Lagrange equations for L [ ρ 0 , λ ] are obtained by variation of ρ 0 in the interior of the domain Ω :
δ L δ ρ 0 = δ J δ ρ 0 + λ δ ( ρ 0 g ) = 0 ,
and by variation of λ on the boundary Ω :
δ L δ λ = ρ 0 g = 0 ,
which ensures that the Dirichlet boundary condition is satisfied [48].
The question that remains is how to define the constraint g. At the beginning of this chapter, three possible boundary conditions for the coupled partial differential equation system were discussed. If the ground potential and the onset gradient are employed as boundary conditions for solving the Poisson equation, the high-voltage potential U remains as the only constraint to be specified. At first glance, a dimensional inconsistency seems to arise, as the high-voltage potential U possesses a different physical unit than the space charge density. However, the unit of the Lagrange multiplier λ is chosen such that the product λ · g maintains dimensional consistency with the other terms in the functional [48]. This guarantees that both the functional and the resulting optimization problem are formulated in a physically sound manner.
Substituting Equation (2) into the advection Equation (3) and applying the product rule ( a b ) = a b + b a along with Gauss’s law · E = ρ / ϵ 0 ϵ r , yields the final form of the fully coupled, bipolar, transient and non-linear system of PDEs, which is solved using the discretization scheme described above.
Δ ϕ = ( ρ 0 , + + d ρ + ) + ( ρ 0 , + d ρ ) ϵ 0 ϵ r
β I ( ρ 0 , + + d ρ + ) ( ρ 0 , + d ρ ) e μ + = ( ρ 0 , + + d ρ + ) 2 ( ρ 0 , + + d ρ + ) ( ρ 0 , + d ρ ) ϵ 0 ϵ r
grad ϕ grad d ρ + + d ρ + t
δ L δ λ + = ρ 0 , + U + = 0
β I ( ρ 0 , + + d ρ + ) ( ρ 0 , + d ρ ) e μ = ( ρ 0 , + + d ρ + ) ( ρ 0 , + d ρ ) ( ρ 0 , + d ρ ) 2 ϵ 0 ϵ r grad ϕ grad d ρ + d ρ t
δ L δ λ = ρ 0 , U = 0
Since grad ρ 0 , + and grad ρ 0 , are constants, their gradients are zero. Consequently, in Equations (24) and (26), only the spatially varying components d ρ + and d ρ are computed (The numerical implementation was carried out using COMSOL Multiphysics 6.3, specifically leveraging the Mathematics Module to enable full control over the weak formulation and equation handling. A key feature of the implementation is the optimization-based treatment of the boundary condition for the unknown surface space charge density, formulated as a constrained minimization problem and solved using Lagrange multipliers. Furthermore, the advection-dominated transport equation was discretized using a Discontinuous Galerkin (DG) method with a Lax–Friedrichs numerical flux to ensure numerical stability and conservation of charge (see Figure A1)). For the boundary conditions of Equations (24) and (26), the spatially varying components are set to zero at the boundaries of the high-voltage electrodes, i.e., d ρ + = d ρ = 0 . The emission of space charge density is solely represented by the constant terms ρ 0 , + and ρ 0 , .

2.3. Numerical Strategies for Nonlinear Field–Space Charge Couplings

Due to the pronounced non-linearity of the model equations, the numerical solver must meet stringent requirements for both accuracy and stability. The space charge density appears quadratically in Equations (24) and (26) and, through its coupling with the electric potential, induces a complex and highly non-linear interaction. Consequently, improper choices of the error tolerance or damping factor may lead to convergence issues in the Newton–Raphson solver.
To improve the convergence rate, an optimized estimation of the initial distribution is recommended as a first step. The fundamental concept of the homotopy method involves introducing an artificial parameter κ H into the original strongly non-linear system of Equations (24) and (26), thereby generating a family of intermediate problems [49]. This approach facilitates a continuous transformation from an easily solvable initial problem to the complete non-linear formulation. By introducing the homotopy parameter κ H , Equation (24) becomes
β I ( ρ 0 , + + d ρ + ) ( ρ 0 , + d ρ ) e μ + = ( 1 κ H ) ( ρ 0 , + + d ρ + ) ( ρ 0 , + d ρ ) ϵ 0 ϵ r grad ϕ grad d ρ + + d ρ + t +   κ H ( ρ 0 , + + d ρ + ) 2 ( ρ 0 , + + d ρ + ) ( ρ 0 , + d ρ ) ϵ 0 ϵ r grad ϕ grad d ρ + + d ρ + t ,
and (26) becomes
β I ( ρ 0 , + + d ρ + ) ( ρ 0 , + d ρ ) e μ = ( 1 κ H ) ( ρ 0 , + + d ρ + ) ( ρ 0 , + d ρ ) ϵ 0 ϵ r grad ϕ grad d ρ + d ρ t +   κ H ( ρ 0 , + + d ρ + ) ( ρ 0 , + d ρ ) ( ρ 0 , + d ρ ) 2 ϵ 0 ϵ r grad ϕ grad d ρ + d ρ t .
For κ H = 0 , a purely linear problem results, which significantly simplifies the determination of a suitable initial distribution for the Newton–Raphson method. The solution computed in this way then serves as the starting value for a neighboring problem with a slightly increased κ H . By gradually increasing the homotopy parameter (ramping), the solution obtained in each step is iteratively used as the initial distribution for the next subproblem. For κ H = 1 , the modified Equations (28) and (29) finally merge into the complete non-linear original problem.
In Section 3, the numerically obtained solutions are validated with measurements when applying superimposed voltage stresses. For this purpose, an experimental method is developed to characterise the DC ion current and the transient ion current due to the overvoltage.

2.4. High-Resolution Transient Current Measurements for EHD Framework Analysis

The aim of the experimental methodology developed is the investigation of the transient development of space charge densities in gaseous insulating media in the context of HVDC applications. The results obtained serve both to validate the simulation data and to gain new insights into the transient behavior of ion currents. In the event of transient overvoltages, for example as a result of switching operations, a pulse component is superimposed on the steady-state DC voltage. The measurement data in Figure 1 shows that the resulting current consists of two components: a first peak caused by the displacement current density and a second peak that represents the superimposed ion current.
The latter is made up of the stationary DC corona current and a transient component amplified by the additional ionization due to the overvoltage.
An overhead line arrangement in conductor-earth geometry is selected for the experimental investigations in order to specifically analyze the coupling phenomena of overhead lines in a controlled laboratory environment. Since the overvoltage pulses under consideration typically occur in the fault-free pole of the DC transmission line, they are inevitably superimposed on the existing operating voltage. Accordingly, a superimposed voltage stress consisting of DC and impulse voltages is applied to the test device.
The investigations focus on the identification of relevant time parameters and other characterizing properties of the transient ion current pulses. The methodology is based on the work of [50,51,52] and is specifically extended and optimized to meet the specific requirements of this work.

2.4.1. Measurement Setup

The test device consists of an aluminum wire with a radius r i = 0.001 m, which is placed between two control electrodes to avoid distortion of the measurement results due to field peaks and partial discharges. A Wilson plate is placed vertically under the wire at a distance of h to record the generated space charges or ion currents. The Wilson plate consists of an inner measuring electrode with the dimensions 0.4 m × 0.4 m and an outer protective electrode with outer dimensions of 0.5 m × 0.5 m . Both electrodes are made of conductive copper and mounted on an insulating carrier layer.
A superimposed high voltage is applied to the test device via the high-voltage connection. In order to protect the voltage sources as well as the measurement technology and the quality of the voltage stress, the circuit is designed accordingly [3]. The corresponding equivalent circuit is shown in Figure 2.
The circuit is divided into a DC voltage and pulse circuit, which are superimposed on the capacitive device under test C DUT and the universal R / C voltage divider.
The DC voltage source (PNChp 60000-10 ump from Heinzinger electronic GmbH (Rosenheim, Germany)) supplies a maximum DC voltage of U max = 60 k V and charges the surge capacitor C 1 via the charging resistor R 1 . The charging voltage is measured using a high-impedance resistive voltage divider in parallel with C 1 , consisting of R 5 and R m . Discharging C 1 is carried out manually by igniting a spark gap F S using a light trigger pulse. The discharge is conducted to the intermediate storage capacitor C 0 via the damping resistor R 0 . The resistor R 0 serves to reduce possible oscillations, while C 0 ensures that the current flow is maintained during the discharge. This specifically extends the discharge process in order to reproduce novel VSFOs with slow time parameters.
The resulting pulse is finally transferred to the voltage divider, consisting of C 2 and the capacitive test device C DUT , via the discharge resistors R 2 and R 3 . The resistors R 2 and R 3 are used to model the pulse shape parameters and have to be selected according to the requirements for SI and VSFO according to Table 1 and Table 2.
On the opposite side of the circuit is the DC circuit, fed by another high-voltage source (PNChp 100000-20 ump from Heinzinger electronic GmbH) with a maximum rated voltage of U max = 100 kV. The voltage source is protected against the transient voltages of the surge voltage generator by an R / C low-pass filter consisting of R x and C 3 and a current-limiting resistor R 4 .
The capacitance C x is used to decouple both subcircuits and also protects the pulse source from the DC source. Due to the large number of capacitive elements in the circuit, voltage dividers are created at several points, which limit the maximum test device voltage and limit the achievable efficiency η . This circumstance determines the test planning and defines the maximum realizable voltages on the test device.
The voltage profile of the charging voltage at C 1 is recorded via coaxial measuring cables with a DMI (551 from HAEFELY AG (Basel, Switzerland)). The superimposed voltages on the test object are measured using an universal voltage divider (HVT 160 RCR from HILO-Test GmbH (Stutensee, Germany) and analyzed using a HIAS 744 from HAEFELY AG). A transimpedance amplifier (DHPCA-100 from FEMTO Messtechnik GmbH (Berlin, Germany)) is used to measure the current at the Wilson plate. The output signal is then read into a oscilloscope (PXIe-1071 from National Instruments (Austin, TX, USA)). In addition, temperature, humidity and air pressure are recorded during the measurement using a digital thermo-hygrometer (KlimaLogg Pro from TFA Dostmann GmbH & Co. KG (Wertheim-Reicholzheim, Germany)).

2.4.2. Design of Experiments

The measurement series are carried out as a function of conductor height, polarity and the superimposed voltage U DC in order to systematically evaluate the transient development of space charge densities and ion currents. A total of 16 measurement series are collected, the input parameters of which are summarized in Table 3.
A time-to-peak of T p = 5.446 ms and a time-to-half of T 2 = 71.545 ms are used for VSFO. To simulate a switching pulse, T p = 0.305661 ms and T 2 = 2.61 ms are used, corresponding to the selected discharge resistances. These time parameters deviate from the SI by 22.626 % for the front and by 4.4 % for the back, but are within the permissible validity range according to [53].
The impulse parameters τ 1 , τ 2 and the correction factor A are determined by solving the following system of equations according to [54]:
τ 1 = T 2 ln ( 2 A ) ,
A = 1 exp T p τ 1 exp T p τ 2 .
The calculated parameters are listed in Table 4.
In order to measure a superimposed ion current due to the DC offset, a corona discharge must already occur so that a stationary ion current is established in the absence of the overvoltage. Therefore, during the measurement, the DC voltage U D C is selected in each measurement series so that it is significantly higher than the corona inception voltage of the wire. For the present configuration, the ignition field strength is U c 45 kV. Consequently, series of measurements are carried out for a definite DC corona current with U D C = 50 kV and U D C = 60 kV. An essential aspect of the measurement setting is the defined delay time of 20 s after each trigger signal to ensure that steady-state conditions are restored. In addition, according to test measurements, a sampling rate of f a = 10 MHz has proven to be effective for the precise detection of transient ion currents.

3. Results

The numerical methods described above form the core of the solution approach. To validate the calculation results, a supplementary experiment was carried out under comparable conditions. The numerical and experimental results are presented and compared in the following section.

3.1. Measurement Results

To reduce statistical measurement deviations within a measurement series, the arithmetic mean value is calculated from up to ten individual measurements. The averaged cross-correlation ψ x y between the individual measurements of a measurement series and the mean value signal is 0.38701 in this example [55]. Some measurements have a lower cross-correlation to the mean value signal and deviate more from the average curve as a result. In order to improve the smoothing of the mean value, these measurements with too low a cross-correlation are excluded from the mean value calculation. Taking this optimized averaging into account, the characteristic current curves shown in Figure 1a result for the measurement series listed in Table 3. The graphs shown in Figure 1 show clear differences and similarities between the measurement series, which reveals a clear dependence of the current curves on the selected input parameters.
The current curves show that the type of pulse applied has a significant influence on the shape of the measurement curves. The most noticeable common feature is the general shape of the current measurements: all measurement series show two distinct current pulses along the time axis. For a precise evaluation of the ion current curves, it is first necessary to clarify which of the observed pulses is actually caused by ion movements.
The Wilson plate used for measuring the ion currents also shows a known sensitivity to displacement currents. During transient voltage stress, the electric field at the test device and in the discharge volume in front of the measuring electrode of the Wilson plate varies, whereby a transient displacement current is coupled into the measuring device. To test this hypothesis, a separate series of measurements is carried out in which the test device is stressed with a positive and negative VSFO. The currents measured on the Wilson plate (see Figure 1b) correlate clearly with the first peak of the superimposed measurements. This leads to the conclusion that the first current pulse is a displacement current caused by the transient electric field.
The registration of a displacement current during a transient overvoltage and the measurement of an ion current represent two temporally delayed processes. Since the defined aim of this work is to evaluate superimposed ion currents and their effect on the insulating gas, the challenge is to separate the displacement current component from the rest of the current signal in order to enable an isolated analysis of the temporal parameters.

Time Domain Method for Calibrating the Ion Current

To separate the displacement currents from the ion currents, a time domain approach is chosen in this work. In order to separate the signals as precisely as possible in the time domain, a curve approximation of the displacement current component is carried out for each measurement series. Based on this approximation, a difference signal is formed that contains only the ion current pulse. A non-linear Levenberg–Marquardt algorithm is used for the approximation, which minimizes the quadratic error between the measurement signal and the estimation function in an iterative process. In accordance with IEC 60600-1 [56], the displacement current pulses can be approximated by a double-exponential function of the form
I Dis ( t ) = I ^ exp t t 0 τ 1 exp t t 0 τ 2 .
The difference between the superimposed total current and the approximated displacement current finally yields the desired ion current according to [57]:
I Ion ( t ) = I Meas ( t ) I Dis ( t ) .
Analogous to the procedure used for the displacement current approximation, the calibrated ion currents are also approximated. In this case, the DC-induced corona current I Ion , DC is additionally taken into account. This value is determined as the mean of the current measurements prior to the onset of the displacement current component and is incorporated into the approximation as follows:
I Ion ( t ) = I ^ exp t t 0 τ 1 exp t t 0 τ 2 + I Ion , DC .
The parameters summarized in Table 5 describe the approximated pulse profiles of the isolated ion currents.
To validate the developed numerical methodology for describing transient superimposed ion currents, the following chapter presents a comparison with the measured and approximated ion current profiles I Ion ( t ) .

3.2. Validation

The input parameters listed in Table 6 provide the input for the simulations.
If the method is used to calibrate the ion current, the transient superimposed ion current curves shown in Figure 3 result, which are compared with the numerical simulation.
Characteristic parameters are used for the analysis and evaluation in Table 7. These include the DC ion current I Ion , D C and the time parameters of the transient process such as the time-to-peak T p and time-to-half T 2 . In addition, the amplitude I max is used and the converted charge Q Ion , i.e., the area of the transient ion current, is analyzed.
The analysis and validation of the numerical simulation is focused on positive DC and positive pulse, since the basic trends are similar and only the corona onset gradient and the ion mobility change due to the polarity effect, which explains the slightly different amplitudes in Figure 3 at the same conductor height.
The pulse-shaped curve of the ion current is characterized by the peak value I max and the time parameters T p and T 2 . These parameters are determined both for the measurement data and for the simulations based on the determination of the impulse parameters of impulse voltages in accordance with IEC 60060-1 [56].
It should be noted at this point that there are currently no standardized test methods for pulsed ion currents and VSFO in particular. Nevertheless, as shown below, the course of the ion currents can be described with very good agreement using the methodology for characterizing transient surge voltages. To determine the rise time T p , i.e., the time span from the start of the pulse to reaching the peak I max , the time points t 30 % and t 90 % are identified at which the pulse reaches 30% and 90% of the peak value, respectively. The rise time is determined by linear interpolation between these two points in time in accordance with
T p = K · T 30 % , 90 % ,
where K represents a dimensionless correction factor. On-site tests have shown that the assumption of a constant correction factor of K = 2.4 is appropriate.
In contrast to T p , T 2 is determined by the time at which the pulse back has fallen to 50% of I max . The peak value I max is conventionally identified via an extreme value search within the measurement and simulation data. As the peak value relates to the pulse component of the superimposed ion current, the determined extreme value is corrected by the DC component I Ion , DC .
A virtual zero point is introduced for the correct evaluation of superimposed current measurements, as the actual zero point is not directly visible due to the superimposition of DC and pulse voltage. The virtual zero point is determined by extending the straight line equation between the points t 30 % and t 90 % . The intersection of this straight line with the level of the DC component defines the virtual zero point. All time parameters in measurements and simulations refer to this virtual zero point.
The DC component I Ion , DC of the measurements is determined as the arithmetic mean of all data points before the start of the pulse:
I Ion , DC = 1 N i = 1 N 1 t 0 , i · f a k = 1 t 0 , i · f a I meas ( k ) ,
where N is the number of individual measurements in a measurement series and f a is the sampling rate.
The deposited charge Q Ion is finally determined by the integral
Q Ion = t 0 , Ion 0.2 s I Ion ( t ) I Ion , DC d t
The upper integration limit of 0.2 s is based on the temporal measurement interval and the simulation runtime, and must be adjusted accordingly for longer measurement or simulation series.

Analysis

Starting with the analysis of the recorded current measurements in Figure 1, it is evident that both the superimposed SI and the superimposed VSFO were measured over the same period of time. This ensures the comparability of the measurement series and the different effects on the insulating gas can be worked out specifically. It should be emphasized that due to the DC bias voltage above the corona ignition field strength, a constant DC ion current already exists before the fault occurs, which is measured and calculated in the simulation for the stationary case.
When an overvoltage occurs, a displacement current is initially generated [34]. The additional voltage ionizes the air around the conductor for the duration of the overvoltage and generates an additional space charge cloud that moves in the direction of the counter electrode (Wilson plate). This ion cloud arrives at the Wilson plate with a time delay and generates the measurable second transient current peak. The drift time of this ion cloud in the insulating gas determines the time interval between the first and second peak. A variation of the conductor height influences the arrival time of the ion cloud on the Wilson plate accordingly. This theoretical relationship is confirmed by the measurement results in Figure 1: As the conductor height increases, the second peak shifts backwards in time.
A comparison of the superimposed SI and the VSFO shows significantly that the slower time parameters of the VSFO lead to an increased energy supply during the overvoltage period. This results in a higher drift velocity of the ion cloud. Accordingly, the flight time is shortened and the second peak occurs earlier and more pronounced than with the superimposed SI.
When looking at the defined parameters in Table 7, it is noticeable that the DC offset varies slightly between the individual conductor heights. Although the same DC bias voltage and the identical laboratory setup are used for all tests, small deviations occur that can be attributed to superimposition effects between the electric fields on the pulse side and the air gap in the compact small-scale setup.
The maximum deviation of the current amplitudes between measurement and simulation is 24 % , the minimum 0.35 % . Of particular interest is the evaluation of the cumulative charge converted by the transient current. As expected, this is about an order of magnitude lower for the SI than for the VSFO, as the VSFO current decays much more slowly against the DC value. The simulation deviates from the measurements by a maximum of 34 % and a minimum of 20 % .
When comparing the time parameters, the simulated rise times show a faster development than the measured ones, although both remain in the same order of magnitude. The simulation follows the rise behavior of the applied voltage pulse more closely. In contrast, the time-to-half of the VSFO is very well matched in the simulation, with deviations between 20 % and 46 % . Overall, slower transient voltage pulses show an agreement between simulation and measurement (see Table 7).
A comparison between the measurements of the superimposed SI and the corresponding simulation shows that the measured transient ion current appears significantly wider and more diffuse, with a curve that corresponds more to a Gaussian distribution than a double exponential function. The simulated transient currents, on the other hand, show a curve that is closer to a double-exponential function, with overall faster time parameters. Amplitude and DC offset are nevertheless very well matched.

3.3. Interim Conclusions

The presented numerical method for the determination of particle densities in bipolar corona systems and for the simulation of transient particle densities under superimposed stresses is summarized as follows:
  • DG method—performance enhancement: The DG method provides more accurate results for hyperbolic problems such as the advection equation, minimizes numerical diffusion and, by complying with the CFL condition, enables a considerable reduction in computing time with low particle loss. This particle loss is problematic because the exact preservation of the space charge density is crucial when calculating the ionic current: if particles are lost numerically, the resulting current in the outer circuit is reduced and leads to an underestimation of the actual currents.
  • Method for determining the space charge density at the boundary of the electrode: The method for the immediate determination of the space charge density at the conductor using Lagrange multipliers replaces computationally intensive iterative procedures. This novel technique is successfully validated for time dependent and superimpose cases and increases the robustness and efficiency of the modeling.
  • Treatment of non-linearity—optimized solution methodology: The high degree of non-linearity in the bipolar corona system, caused by the quadratic dependence of the space charge density and the non-linear coupling to the electric potential, requires specialized numerical strategies. To optimize the convergence, a homotopy method is used in addition to a targeted adjustment of the error tolerances. This method represents a new type of extension in that the original non-linear model equations are continuously transferred from a linear initial problem to the actual non-linear problem step by step via an artificially introduced homotopy parameter. This significantly improves the convergence rate and enables robust solutions even for strongly non-linear field-space charge couplings.
  • Superimposed transient ion currents: This work is the first to numerically model and simulate the formation and development of transient ion currents under superimposed voltage stresses. In addition to the stationary DC ion current, an additional transient current component is formed, which is caused by the time-dependent voltage waveforms (SI and VSFO). The effects of these transient ion currents on the insulating medium air are systematically revealed. Comprehensive experimental validation shows a very good agreement between simulation and measurement with regard to the current amplitudes and the converted charge.
  • Scalability of the numerical method and limitations: The scalability of the presented framework from simplified small-scale laboratory setups to full-scale tower geometries is demonstrated in the following chapter. This was achieved without significant loss of numerical stability or computational feasibility. The key enabler is the optimization-based boundary condition, which directly determines the space charge density at the conductor surface without requiring iterative updates. In contrast to conventional iterative schemes—which typically involve repeated global solutions of the coupled PDE system—the optimization approach enables a fully coupled solution in a single solver loop, even for large domains. Nevertheless, several limitations of the current formulation should be acknowledged. The model employs an electrohydrodynamic (EHD) approximation in which the ionization zone is collapsed onto the conductor boundary. Detailed plasma processes—such as ionization, attachment, or recombination of individual charge species—are not explicitly resolved but are incorporated implicitly through the variational injection condition. The constant component of the boundary charge density ρ thus represents the net effect of plasma processes at the critical field threshold. Additionally, the method enforces a steady-state assumption at the boundary based on the Kaptsov hypothesis, meaning that rapid deviations during fast discharge phases are not captured. Finally, although the framework is applied to large tower geometries in this work in 2D, the 3D extension to more complex configurations was conducted in a separate study and is referenced here for completeness [58].
  • The presented framework intrinsically accounts for environmental influences such as humidity and temperature through their effect on ion mobility μ and the geometry-specific ignition electric field at the conductor boundary. Both parameters, which are essential for model accuracy, are known to vary with ambient conditions, while the simulations in this work use values consistent with laboratory settings, a prior study (cf. [58]) introduced a Monte Carlo-based method to compute humidity-dependent transport coefficients. These can be directly integrated into the current model. As a result, environmental dependencies are captured both in the ion transport behavior and in the boundary condition for the space charge density ρ , allowing the model to remain robust and predictive under varying atmospheric scenarios.
  • Geometric Sensitivity: Geometric factors such as electrode shape and surface roughness play a critical role in determining local field distributions and corona onset behavior. The presented framework inherently captures the influence of electrode geometry through its field-dependent boundary condition, which adapts to local curvature and field enhancement effects. For complex shapes, a dedicated method to compute the geometry-specific inception field was developed in prior work and forms the basis for accurate boundary modeling in this study [46], while surface roughness is not explicitly resolved at the microscale, its macroscopic effect on the inception field can be incorporated by adjusting the boundary condition accordingly. As a future extension, a randomized surface profile approach—developed in the author’s ongoing doctoral research—may enable the model to capture roughness-induced variations in a more physically realistic manner.

4. Discussion

For the extrapolation to large-scale geometries and performance of the numerical methodology, a hybrid overhead line system is used for the application. If the corona ignition gradient of the DC system is exceeded, charge carriers are generated by ionization processes according to the theory described above and drift through the electric field. In hybrid overhead line systems, the DC coupling currents that couple into the AC system are critical, as these lead to saturation effects in the transformers [59].
The AC side carries a normalized conductor voltage of U AC , RMS = 380 kV, whereby the conductor radius of each individual conductor is r i = 13.8 mm. The voltage curves of the AC phases are implemented according to [28] as ideally sinusoidal with a frequency of f = 50 Hz.
Due to the complexity of the hybrid corona problem, it is assumed, as in [26,60], that no corona discharge is generated by the AC side. This simplification is justified because the space charge densities generated by the AC neutralize each other on average over time.
The bipolar DC-side corona problem is modeled fully coupled. The stationary solution of the DC side serves as the initial condition for the time-dependent problem, as the space charge density is generated from this side and is transported by the fields of the DC and AC systems.
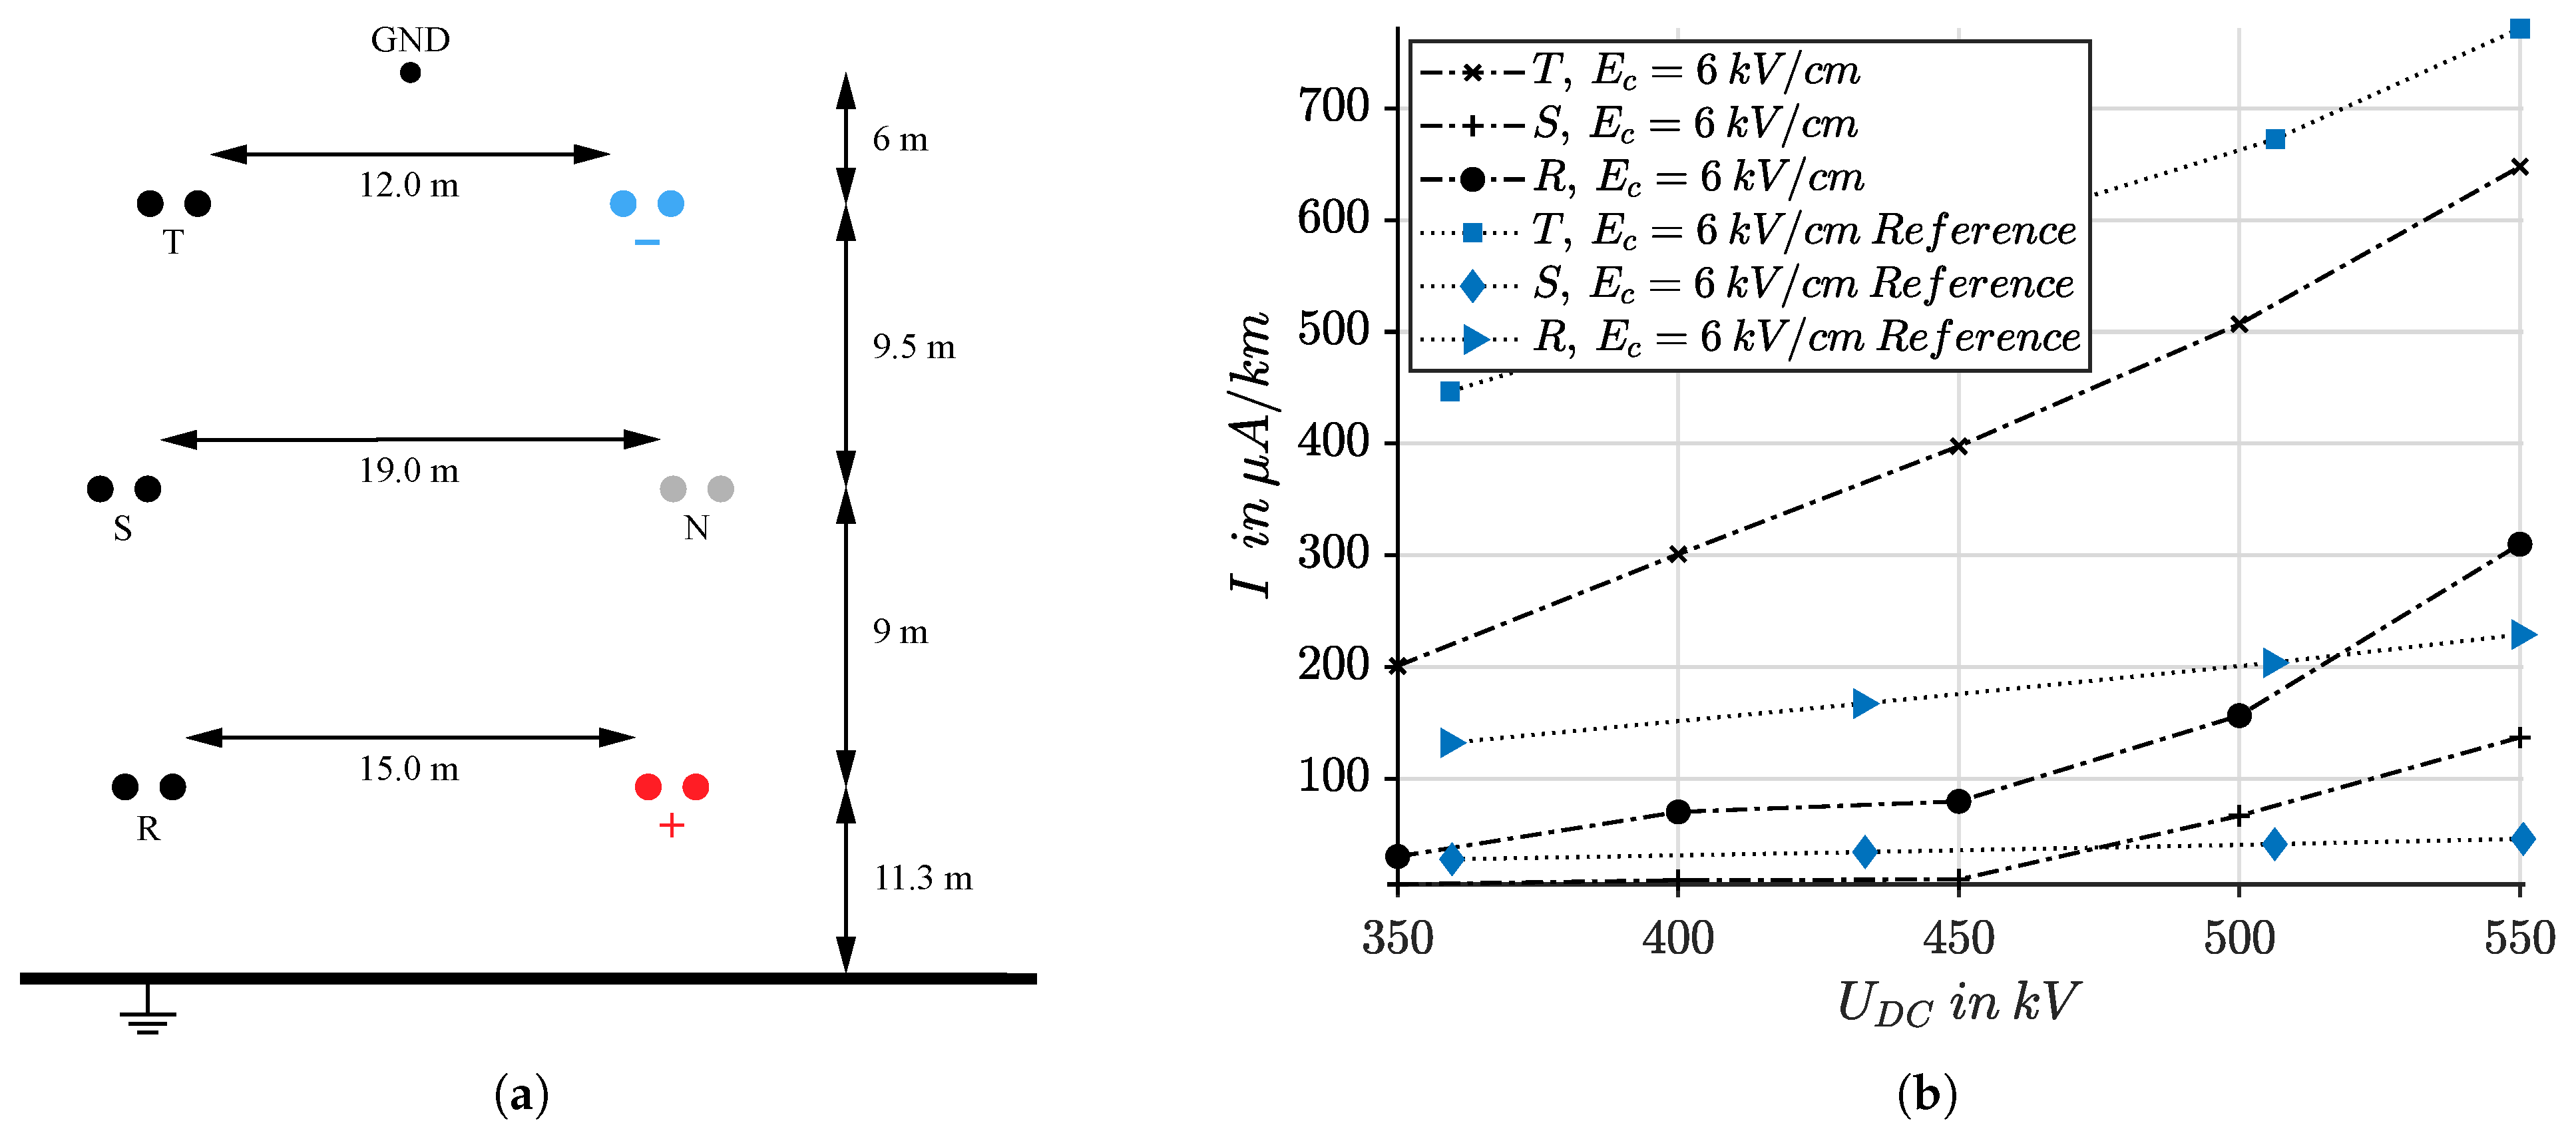
The AC conductors are arranged on the left-hand side of the mast as shown in Figure 4a and labeled with the phase identifiers T, S and R. The DC conductors are located on the right-hand side of the mast with the negative pole at the top and the positive pole at the bottom. The corona ignition gradient is varied in a specific way to precisely simulate the injected ion currents. The background to this is that the ignition gradient significantly determines the start and intensity of the corona discharge and therefore has a decisive influence on the strength of the coupling currents into the AC side. Particularly under unfavorable weather conditions, such as droplet formation or rain, the local deployment gradient changes, which must be correctly mapped numerically.
An ignition gradient of 6 k V   cm 1 is used for the present mast geometry. This value agrees with the literature data and forms the basis for the following analysis of the ion coupling currents. The ion currents coupling into the AC phases are shown in Figure 4b and are compared with the reference values from [60].
In Figure 4b it is noticeable that the coupling current in phase T is about four times higher than in phases S and R. This difference results from the shorter distance between phase T and the negative pole as well as the higher mobility of negative ions. During the positive half-wave, these ions are directed more strongly towards the phase T. When considering an overhead line section of 100 k m , this results in a coupling current of around 30 m A at U D C = 400 kV, a value that has already been identified as problematic for transformers in [60].
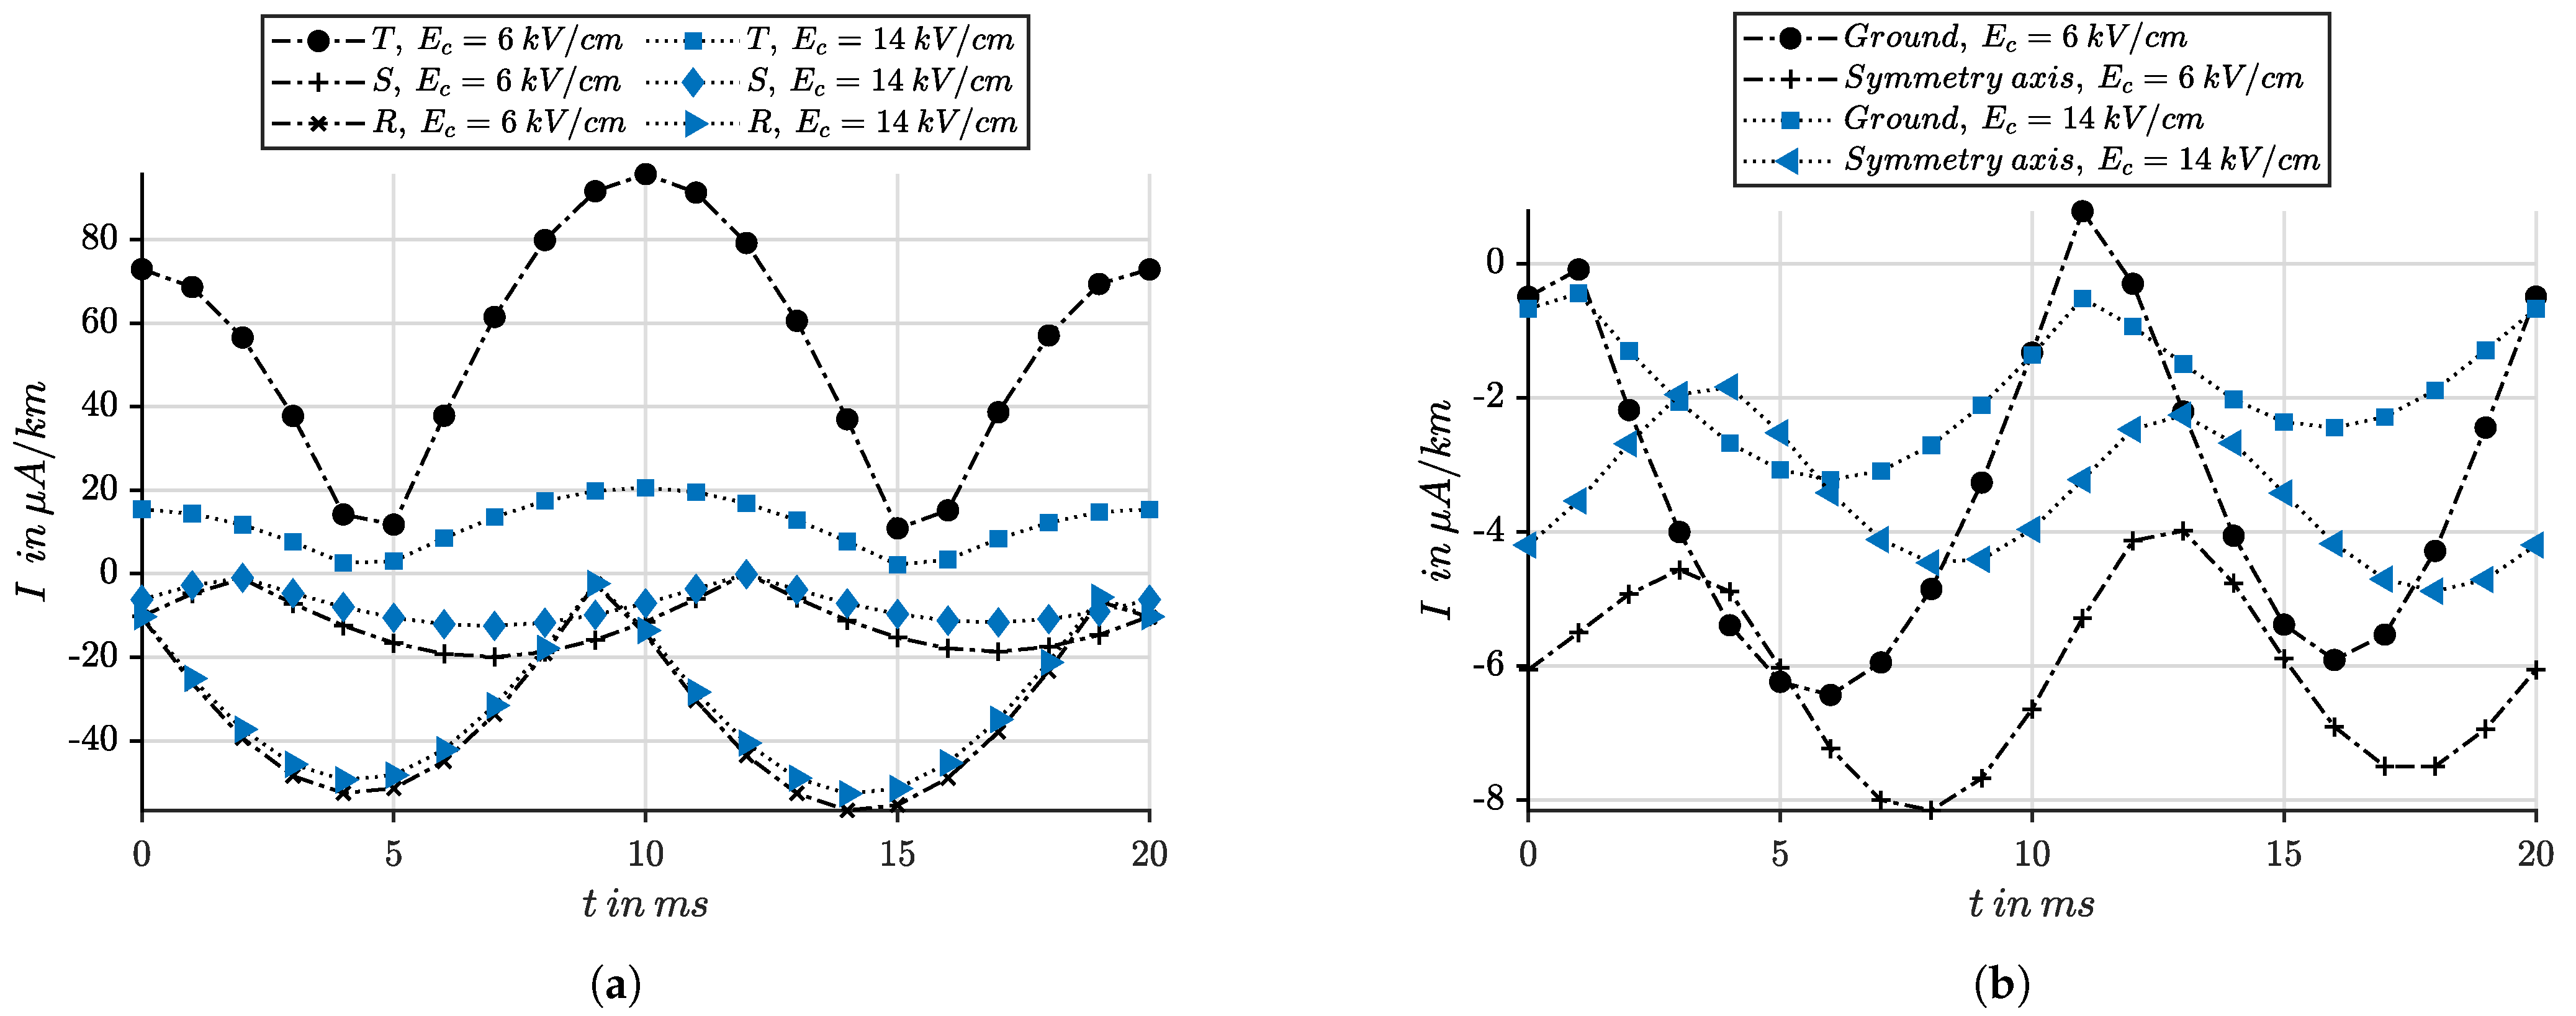
The observed deviations from the reference values are explained by the different numerical methodology: In [60], a modified flux tracing method based on stationary events is used. In contrast, the framework developed here solves the coupled pDGL system completely self-consistently and time-dependent. By taking into account the time-dependent interactions of AC and DC fields, the temporal curves of the coupling currents in the individual phases are also determined (see Figure 5).
The results show that the space charge densities are attracted or repelled depending on the polarity of the AC half-wave, which leads to reduced average coupling currents compared to the steady-state approach. The methodology presented here thus enables a more realistic, time-resolved evaluation of the coupling effects, while the method used in [60] remains limited to time-restricted stationary states.
Figure 5a shows the temporal development of the coupling currents in the AC phases. A shift in the coupling currents due to the 120 phase shift of the AC conductors is clearly recognizable. The ions generated by the DC conductors drift along the field lines, but experience an oscillating deflection in the area of influence of the AC fields. Fast ions follow their original drift movement more closely, while slower ions are influenced and deflected by the periodic field changes of the mains frequency. This mechanism leads to a significant increase in the coupling current in phase T, as fast negative ions in particular are attracted from the DC side.
As shown in Figure 5b, the coupling currents decrease with increasing corona ignition gradient. A higher ignition gradient reduces the formation of space charge, which means that fewer ions are released at a constant DC voltage level. In addition, local field distortions occur around the AC conductors and insulators, which favor corona activity.

Superimposed Fault Event

In the previous chapter, the applicability and validity of the developed numerical framework for the calculation of coupling and ion currents was demonstrated using real hybrid tower arrangements. Based on this, a specific fault scenario is analyzed in this section in order to test the fully coupled, time-resolved framework under transient fault conditions.
The analysis focuses on the influence of new types of VSFO according to [52], which are superimposed on the stationary DC voltage in the event of a fault. In the event of a pole-to-earth fault, the potential of the affected pole drops to earth potential, while the opposite pole experiences a transient overvoltage. The resulting scenario thus represents a unipolar, time-dependent corona problem.
The numerical challenge lies in the precise modeling of the additional transient ion currents that arise over the duration of the overvoltage and are superimposed on the already existing stationary DC-related currents. This leads to a temporary increase in the coupling currents in the AC phases and potentially to increased saturation effects, particularly in hybrid mast arrangements.
The validated pole geometry from Figure 4a is used for the analysis. A pole-to-earth fault is assumed at the negative DC pole, whereby the positive pole is stressed with DC + VSFO. The transient overvoltage has a maximum amplitude of 1.76 p.u. at a DC operating voltage of ± 380 kV, as used in the Ultranet. The underlying corona ignition gradient in the assumed worst case is E c = 6 kV cm 1 .
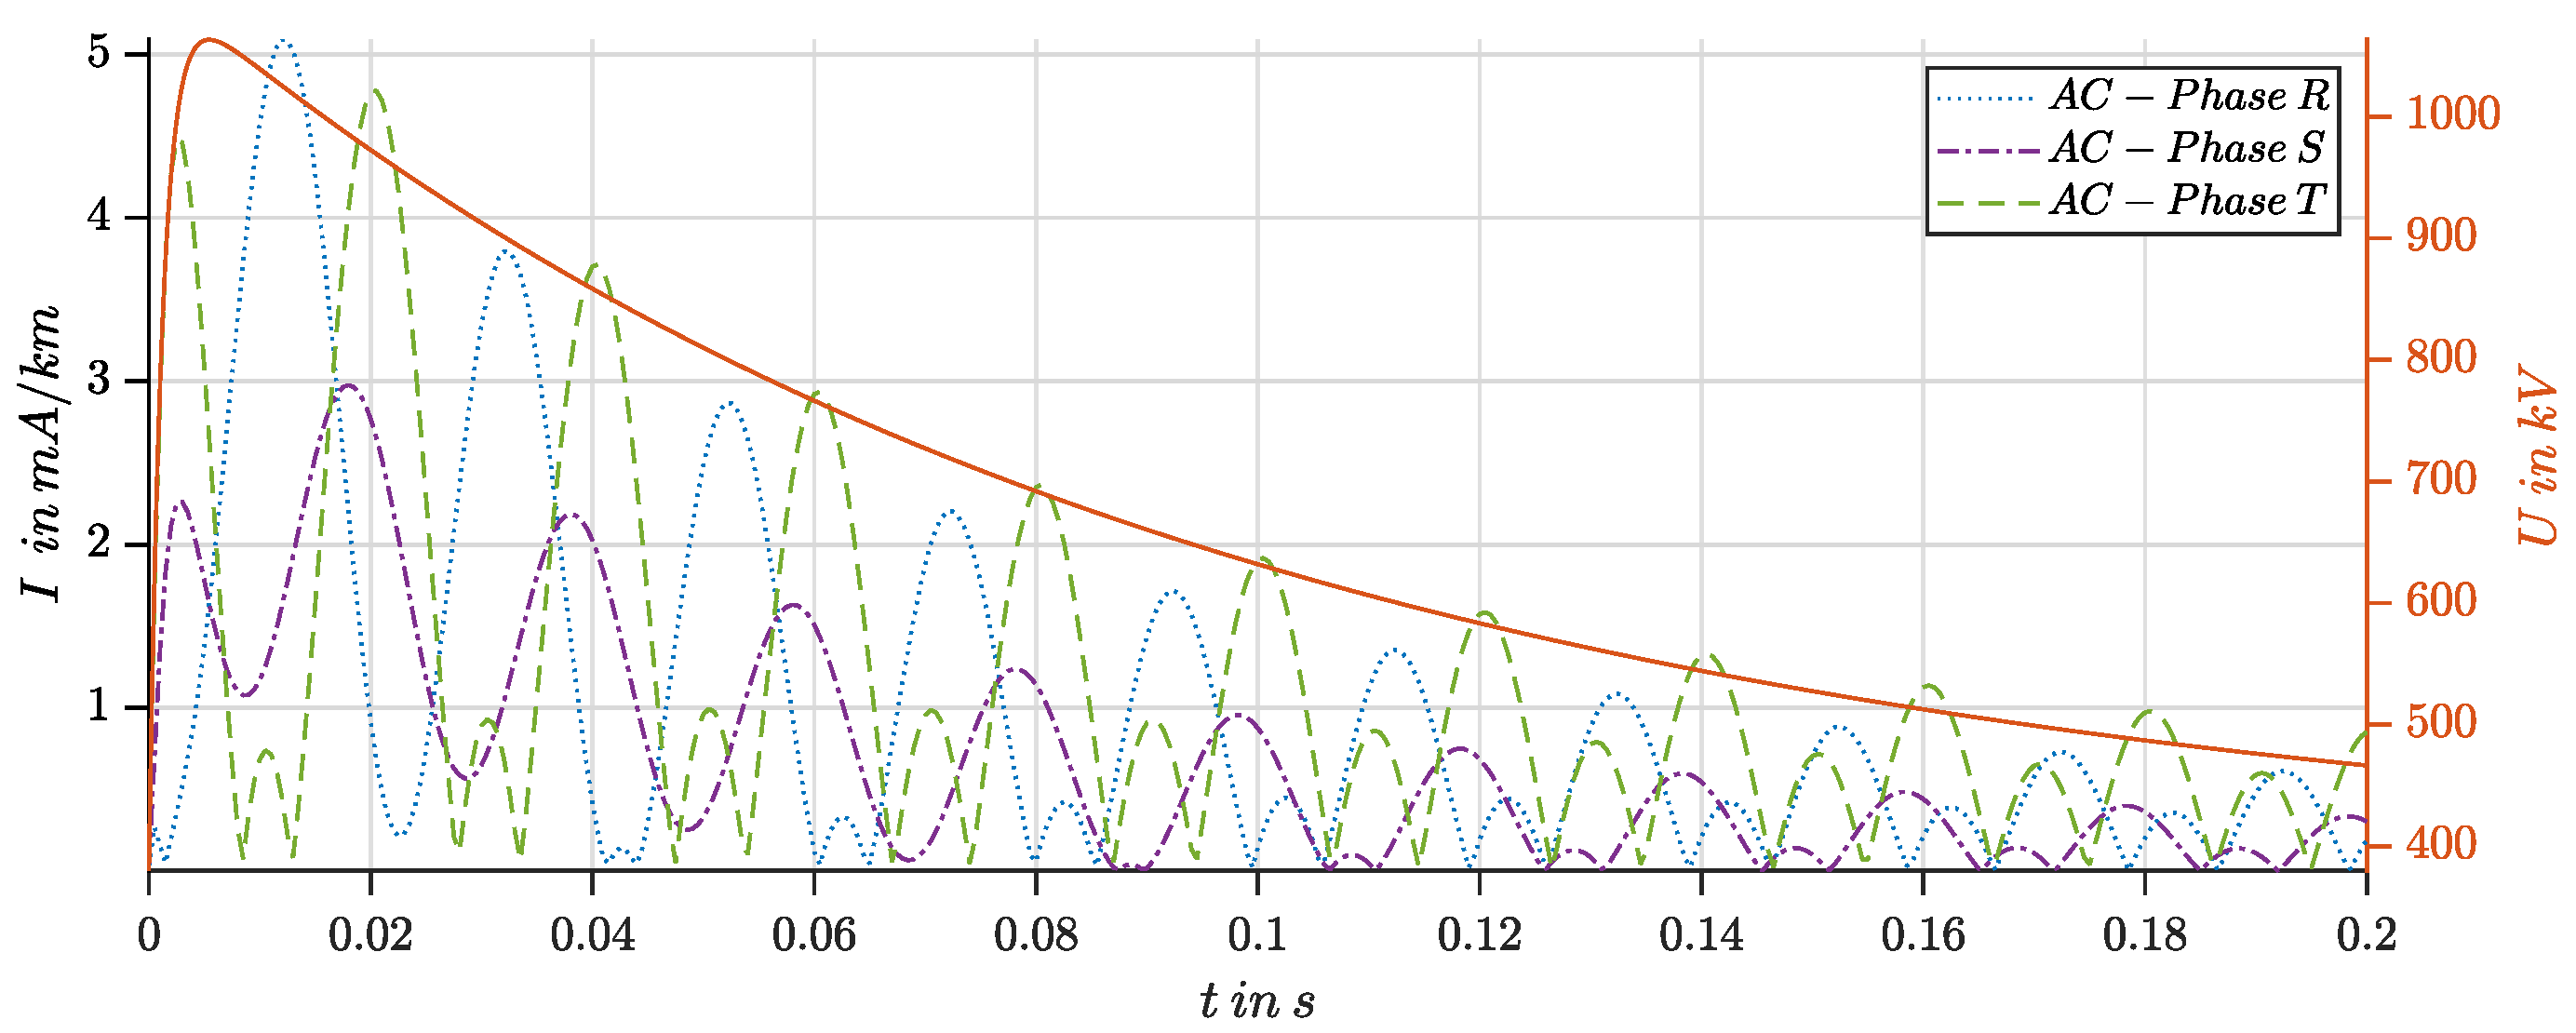
Figure 6 shows the time characteristics of the AC phases and the transient voltage superposition at the negative pole. It is clear that the VSFO lasts for at least ten voltage periods and thus has a relevant influence on the entire duration of the AC voltage cycles. This results in a simulation duration of 0.2 s. Due to the earth potential at the negative pole, the field characteristic changes significantly, which excludes a superposition of steady-state and transient effects.
The absence of the bipolar space charge zone means that there is no effective recombination mechanism, which leads to an asymmetrical space charge distribution and has a direct effect on the coupling currents in the AC phases.
This effect is most noticeable in the AC phase R, which is closest to the positively stressed DC pole. Here, the coupling current increases to a maximum amplitude of around 5 m A   km 1 . On average over the duration of the VSFO—based on a conductor length of 100 km—this results in an up to tenfold increase in the average coupling current compared to the case in Figure 4b.
Despite the presence of surge arresters, which limit the maximum voltage-time span on the AC system, the increased current is actually imposed on a part of the transmission line. The analysis therefore shows that increased saturation effects occur briefly on the AC side.
The time characteristic of the VSFO is transferred to the coupling current in the AC phases with a delay, as ions must first be generated before they drift through the field and couple into the AC conductors. As a result, the coupling current increases with the increasing overvoltage curve and reaches its maximum near the peak value of the transient pulse. The characteristic 120 phase shift of the AC voltages is also reflected in the course of the coupling currents. In addition, a decaying, oscillating curve can be seen, superimposed by an enveloping curve that describes the transition back to the steady state.
For the simulated mast, a peak coupling current in phase R of approximately 5 m A   km 1 is observed in the steady state at ± 380 kV, while phase S experiences significantly lower stress, with less than 3 m A   km 1 —agreement with the estimates provided in the standard [28].
Since the current is calculated from the magnitude of the electric field, the negative values of the current below zero are reflected as positive values in the representation.
In the transient fault case, however, the numerical analysis shows that these estimated values are exceeded in the worst-case scenario. This not only emphasizes the necessity of a dynamic evaluation, but also proves the efficiency of the developed framework for the quantitative prediction of such transient effects in large-scale hybrid HVDC overhead transmission line systems.

5. Conclusions

This work presents a comprehensive approach to the modeling and simulation of transient electrohydrodynamic discharges under complex voltage excitations, addressing key limitations in current numerical methods. By developing a fully time-resolved and conservative DG-based framework coupled with a novel boundary condition formulation via constrained optimization, the fundamental challenge of unknown surface space charge density is resolved without iterative assumptions.
The simulation model captures the dynamic behavior of corona discharges under hybrid voltage waveforms—including DC, impulse, and AC components—and accurately reproduces transient ion current responses validated against laboratory measurements. This enables, for the first time, a physically consistent and numerically stable simulation of space charge evolution in bipolar systems under time-dependent, superimposed field conditions.
A major advantage of the proposed method lies in its modular and scalable structure. The conservative discretization scheme and optimization-based boundary treatment can be extended to full three-dimensional domains with complex geometries and heterogeneous gas compositions. This makes the framework particularly suitable for large-scale applications such as dimensioning of air clearances in converter stations, assessing new eco-friendly insulating gases under realistic stress conditions, and evaluating the influence of slow-front transients in HVDC systems. By bridging the gap between laboratory-scale validation and real-world deployment, the presented methodology provides a numerically robust and validated foundation for advancing the design and analysis of gas-insulated high-voltage systems.

Author Contributions

Conceptualization, P.H.; methodology, P.H.; software, P.H.; validation, P.H.; formal analysis, P.H. and P.F.; investigation, P.H. and J.H.; resources, P.H.; data curation, P.H. and J.H.; writing—original draft preparation, P.H.; writing—review and editing, P.H. and J.H.; visualization, P.H.; supervision, F.J.; project administration, P.H.; funding acquisition, F.J. All authors have read and agreed to the published version of the manuscript.

Funding

This research received no external funding.

Institutional Review Board Statement

Not applicable.

Informed Consent Statement

Not applicable.

Data Availability Statement

The original contributions presented in this study are included in the article. Further inquiries can be directed to the corresponding author.

Conflicts of Interest

The authors declare no conflicts of interest.

Abbreviations

The following abbreviations are used in this manuscript:
CFLCourant-Friedrichs-Lewy
DGDiscontinuous-Galerkin
DMIDigital measuring instrument
EHDElectrohydrodynamics
EnWGEnergy Industry Act
FCTFlux-corrected transport
FEMFinite-element method
HVDCHigh-voltage direct current
LFALocal field approximation
LEALocal energy approximation
MMCModular multilevel converter
PDEPartial differential equation
SISwitching impulse
VSFOVery slow front overvoltage

Appendix A

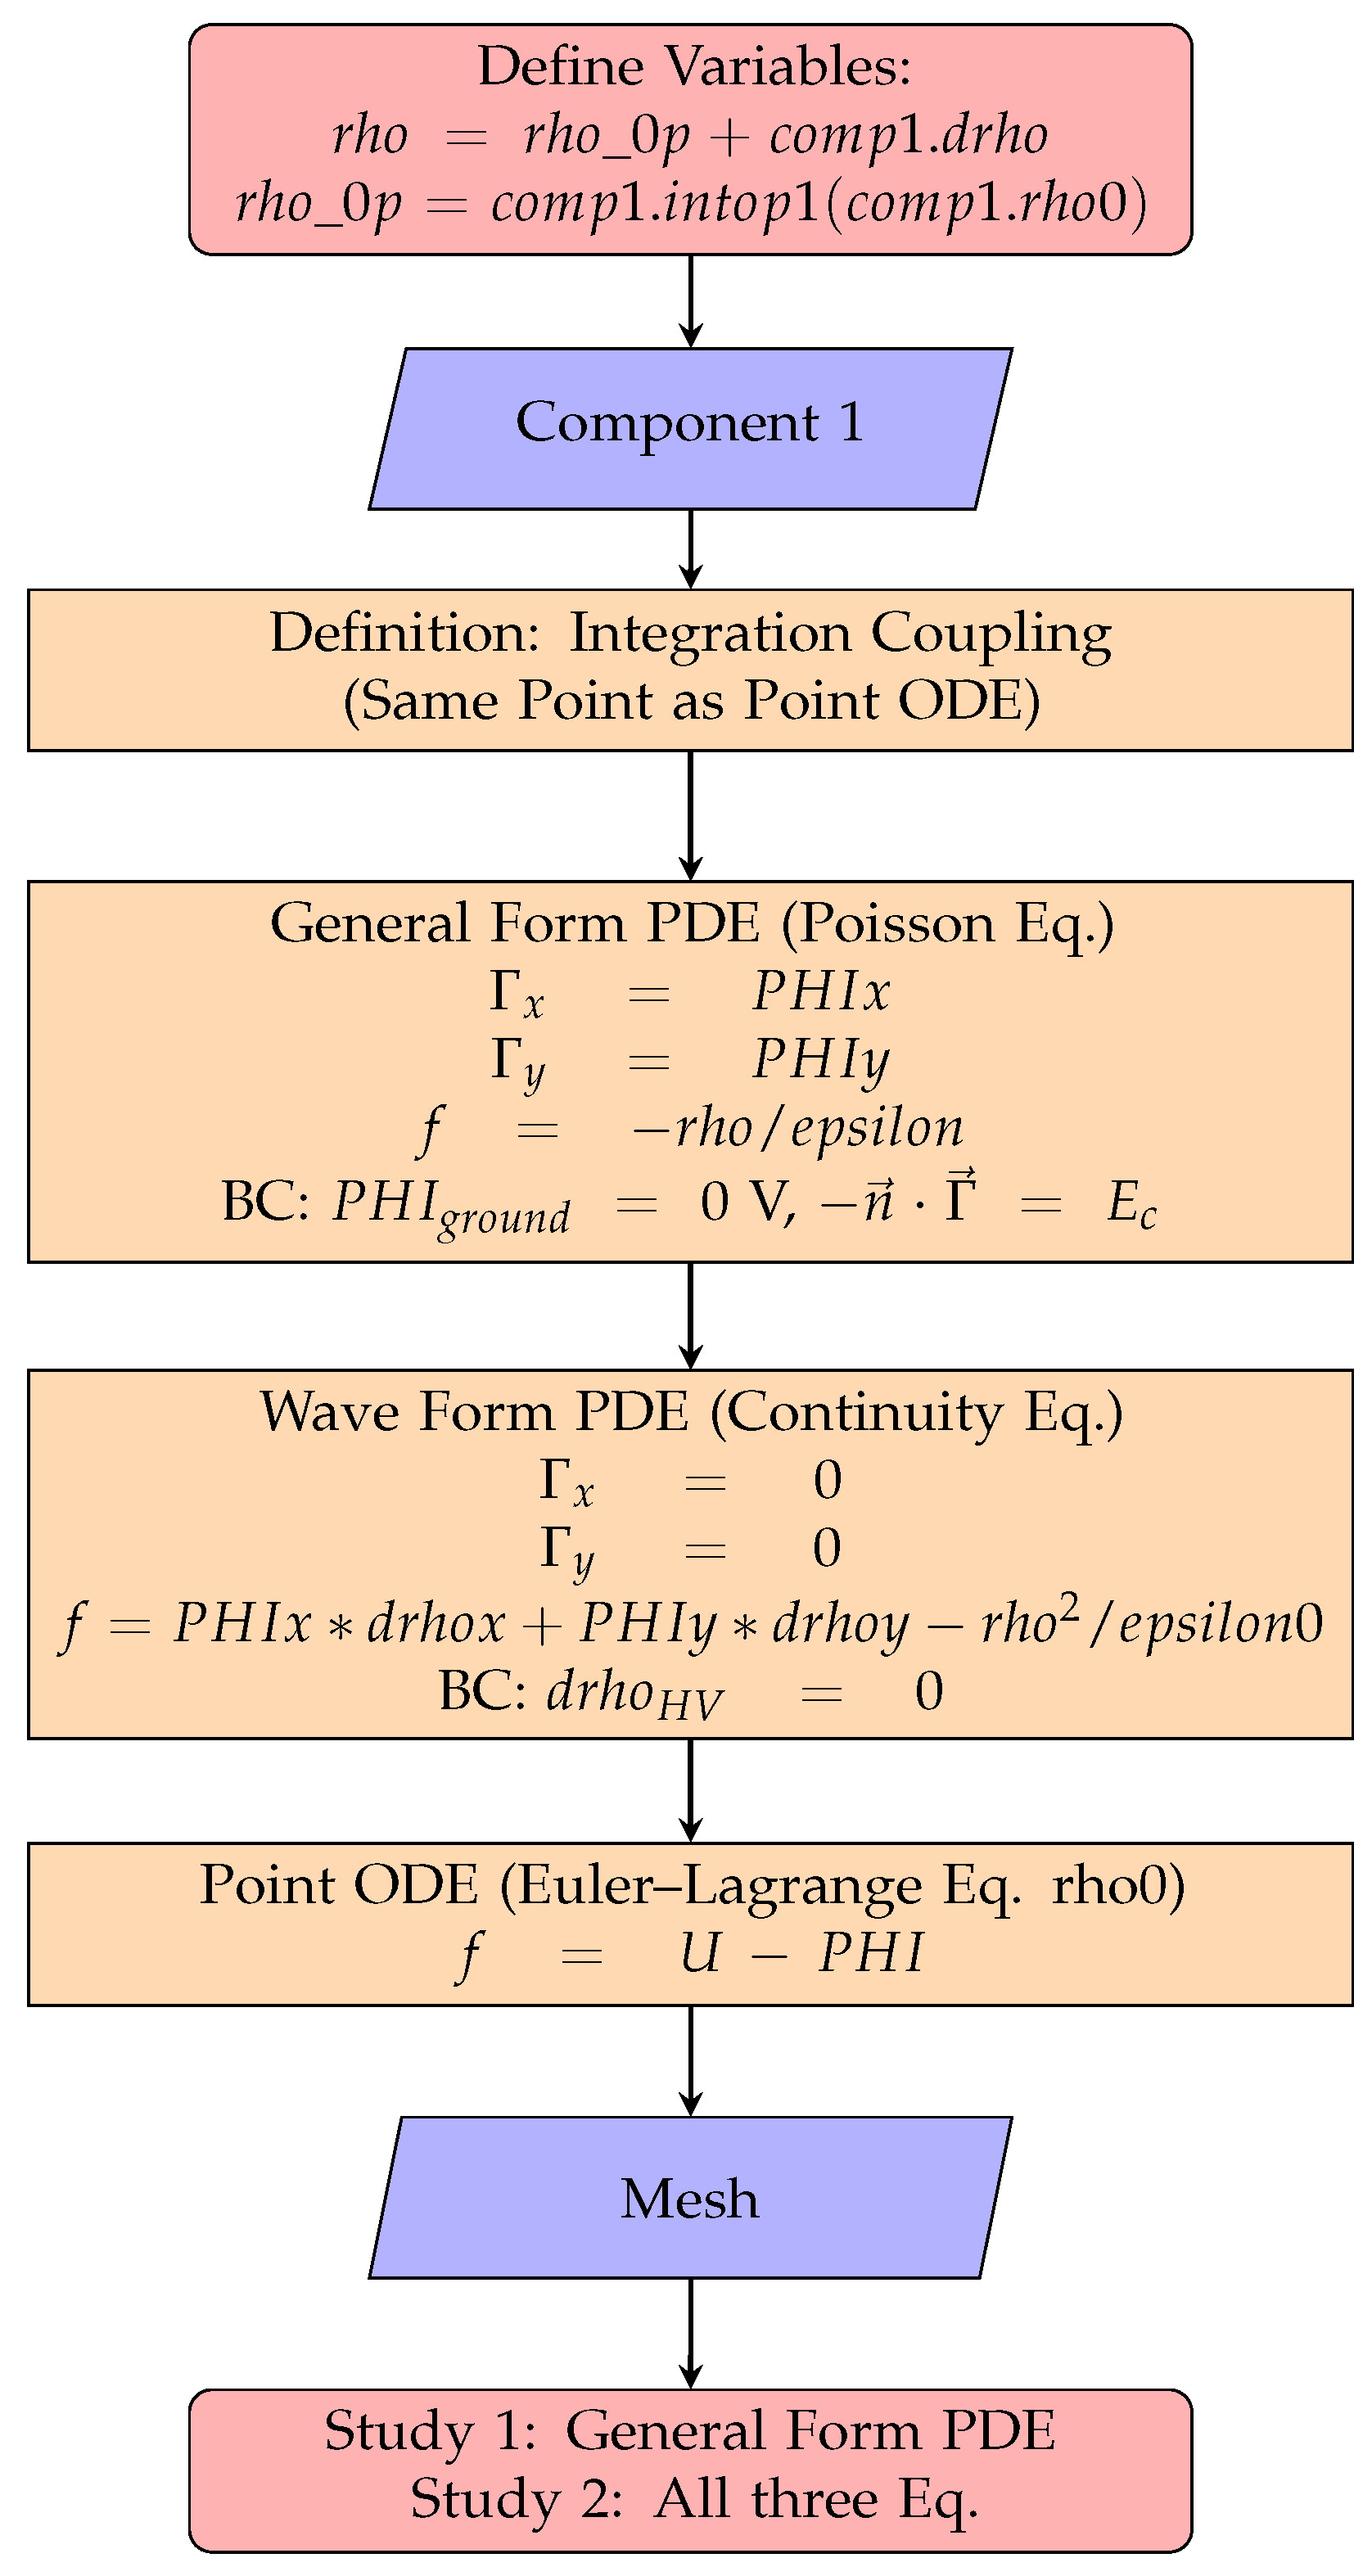
Figure A1 provides a high-level outline of the implementation of the stationary unipolar corona discharge problem in COMSOL, aimed at identifying the optimization-based boundary condition for the space charge density ρ at the conductor surface. The Mathematics Module is used for this purpose.
Figure A1. General implementation in COMSOL of the method for computing the space charge density at the conductor boundary and solving the corona discharge problem.
Eng 06 00194 g0a1

References

  1. Bundesrepublik Deutschland. Bundesgesetzblatt I; Energiewirtschaftsgesetz (EnWG): BMWK: Berlin, Germany, 2023; p. S. 1750. Available online: https://www.gesetze-im-internet.de/enwg_2005/ (accessed on 7 October 2024).
  2. Bundesministerium für Wirtschaft und Klimaschutz (BMWK). Netze und Netzausbau; BMWK: Berlin, Germany, 2024; Available online: https://www.bmwk.de/Redaktion/DE/Dossier/netze-und-netzausbau.html (accessed on 7 October 2024).
  3. Freye, C. Methoden und Aspekte zur Leitfähigkeitsanalyse von Isolationsmaterialien der Kabeltechnologie und zur Isolationskoordination für Systeme der Hochspannungsgleichstromübertragung (HGÜ). Ph.D. Thesis, Technische Universität Dortmund, Dortmund, Germany, 2020. Available online: https://eldorado.tu-dortmund.de/bitstream/2003/39217/1/C (accessed on 7 October 2024).
  4. Markosyan, A.H.; Teunissen, J.; Dujko, S.; Ebert, U. Comparing Plasma Fluid Models of Different Order for 1D Streamer Ionization Fronts. Plasma Sources Sci. Technol. 2015, 24, 065002. [Google Scholar] [CrossRef]
  5. Abbas, I.; Bayle, P. A Critical Analysis of Ionising Wave Propagation Mechanisms in Breakdown. J. Phys. D Appl. Phys. 1980, 13, 1055–1068. [Google Scholar] [CrossRef]
  6. Abbas, I.; Bayle, P. Non-Equilibrium Between Electrons and Field in a Gas Breakdown Ionising Wave. I. Macroscopic Model. J. Phys. D Appl. Phys. 1981, 14, 649–660. [Google Scholar] [CrossRef]
  7. Abbas, I.; Bayle, P. Non-Equilibrium Between Electrons and Field in a Gas Breakdown Ionising Wave. II. Structure of the Leading Edge. J. Phys. D Appl. Phys. 1981, 14, 661–674. [Google Scholar] [CrossRef]
  8. Boris, J.P.; Book, D.L. Flux-Corrected Transport. I. SHASTA, a Fluid Transport Algorithm That Works. J. Comput. Phys. 1973, 11, 38–69. [Google Scholar] [CrossRef]
  9. Zalesak, S.T. Fully Multidimensional Flux-Corrected Transport Algorithms for Fluids. J. Comput. Phys. 1979, 31, 335–362. [Google Scholar] [CrossRef]
  10. Georghiou, G.E.; Morrow, R.; Metaxas, A.C. Two-Dimensional Simulation of Streamers Using the FE-FCT Algorithm. J. Phys. D Appl. Phys. 2000, 33, L27–L32. [Google Scholar] [CrossRef]
  11. Kuzmin, D.; Möller, M.; Turek, S. Multidimensional FEM-FCT Schemes for Arbitrary Time Stepping. Int. J. Numer. Meth. Fluids 2003, 42, 265–295. [Google Scholar] [CrossRef]
  12. Morrow, R. Space-Charge Effects in High-Density Plasmas. J. Comput. Phys. 1982, 46, 454–461. [Google Scholar] [CrossRef]
  13. Morrow, R. Theory of Negative Corona in Oxygen. Phys. Rev. A 1985, 32, 1799–1809. [Google Scholar] [CrossRef]
  14. Morrow, R. Theory of Electrical Corona in SF6. Nucl. Instrum. Methods Phys. Res. A 1996, 382, 57–65. [Google Scholar] [CrossRef]
  15. Morrow, R.; Lowke, J.J. Streamer Propagation in Air. J. Phys. D Appl. Phys. 1997, 30, 614–627. [Google Scholar] [CrossRef]
  16. Lin, S.L.; Robson, R.E.; Mason, E.A. Moment Theory of Electron Drift and Diffusion in Neutral Gases in an Electrostatic Field. J. Chem. Phys. 1979, 71, 3483–3498. [Google Scholar] [CrossRef]
  17. Kumar, K.; Skullerud, H.R.; Robson, R.E. Kinetic Theory of Charged Particle Swarms in Neutral Gases. Aust. J. Phys. 1980, 33, 343–448. [Google Scholar] [CrossRef]
  18. Georghiou, G.E.; Morrow, R.; Metaxas, A.C. The Effect of Photoemission on the Streamer Development and Propagation in Short Uniform Gaps. J. Phys. D Appl. Phys. 2001, 34, 200–208. [Google Scholar] [CrossRef]
  19. Eichwald, O.; Ducasse, O.; Merbahi, N.; Yousfi, M.; Dubois, D. Effect of Order Fluid Models on Flue Gas Streamer Dynamics. J. Phys. D Appl. Phys. 2006, 39, 99–107. [Google Scholar] [CrossRef]
  20. Li, C.; Brok, W.J.M.; Ebert, U.; van der Mullen, J.J.A.M. Deviations from the Local Field Approximation in Negative Streamer Heads. J. Appl. Phys. 2007, 101, 123305. [Google Scholar] [CrossRef]
  21. Medlin, A.J. A Pseudotransient Approach to Steady State Solution of Electric Field–Space-Charge Coupled Problems. J. Electrostat. 1997, 43, 39–51. [Google Scholar] [CrossRef]
  22. Deutsch, W. Über die Dichteverteilung unipolarer Ionenströme. Ann. Phys. 1933, 408, 588–612. [Google Scholar] [CrossRef]
  23. Maruvada, P.S.; Bisnath, S. Corona in Transmission Systems: Theory, Design and Performance; Volume 7 of Eskom Power Series; Crown Publications: Johannesburg, South Africa, 2011; ISBN 978-0-620-49388-8. [Google Scholar]
  24. Min, X.; Lee, Z.W. Transient Analysis of Monopolar Space-Charge Systems Using FEM–FCT under DC Excitation. IEEE Trans. Plasma Sci. 2002, 30, 773–781. [Google Scholar] [CrossRef]
  25. Arruda, C.K.C.; Lima, A.C.S. Corona Modeling in HVDC Transmission Lines Based on a Modified Particle-in-Cell Approach. Electr. Power Syst. Res. 2015, 125, 91–99. [Google Scholar] [CrossRef]
  26. Straumann, U. Mechanism of the Tonal Emission from AC High Voltage Overhead Transmission Lines. J. Phys. D Appl. Phys. 2011, 44, 075501. [Google Scholar] [CrossRef]
  27. Maruvada, P.S.; Janischewskyj, W. Analysis of Corona Losses on DC Transmission Lines: I—Unipolar Lines. IEEE Trans. Power Appar. Syst. 1969, PAS-88, 1055–1064. [Google Scholar] [CrossRef]
  28. DIN VDE V 0210-9 (VDE V 0210-9); Technische Anforderungen an Elektrische Anlagen. Beuth Verlag GmbH: Berlin, Germany, 2023.
  29. Huber, P.; Kortenbrede, J.; Jenau, F. Ion Current Density for a Bipolar HVDC Transmission Line Analysed by Numerical Simulations. In Proceeding of the VDE High Voltage Technology 2020, ETG-Symposium, Online, 11 November 2020; pp. 1–5. [Google Scholar]
  30. Ignjatović, M.; Cvetić, J. Drift-diffusion model of corona discharge in coaxial geometry due to negative lightning impulse voltage. Electr. Power Syst. Res. 2021, 194, 107061. [Google Scholar] [CrossRef]
  31. Zogning, C.; Lobry, J.; Moiny, F. Numerical Simulation of Corona Discharge Plasma Affecting the Surface Behavior of Polymer Insulators. Energies 2024, 17, 4247. [Google Scholar] [CrossRef]
  32. Bandopadhyay, A.; Ghosh, U. Electrohydrodynamic Phenomena. J. Indian Inst. Sci. 2018, 98, 201–225. [Google Scholar] [CrossRef]
  33. Chang, J.-S.; Lawless, P.A.; Yamamoto, T. Corona Discharge Processes. IEEE Trans. Plasma Sci. 1991, 19, 1152–1166. [Google Scholar] [CrossRef]
  34. Mathis, W.; Reibiger, A. Küpfmüller Theoretische Elektrotechnik: Elektromagnetische Felder, Schaltungen und Elektronische Bauelemente, 20th ed.; Springer: Berlin/Heidelberg, Germany, 2017; ISBN 978-3-662-54837-0. [Google Scholar]
  35. Park, Y.; Jha, R.K.; Park, C.; Rhee, S.-B.; Lee, J.-H.; Park, C.-G.; Lee, S.-H. Fully Coupled Finite Element Analysis for Ion Flow Field Under HVDC Transmission Lines Employing Field Enhancement Factor. IEEE Trans. Power Deliv. 2018, 33, 2856–2863. [Google Scholar] [CrossRef]
  36. Morrow, R.; Sato, N. The Discharge Current Induced by the Motion of Charged Particles in Time-Dependent Electric Fields; Sato’s Equation Extended. J. Phys. D Appl. Phys. 1999, 32, L20–L22. [Google Scholar] [CrossRef]
  37. Geiser, J. Computational Engineering: Theorie und Praxis der Transportmodelle; Springer Vieweg: Wiesbaden, Germany, 2018; ISBN 978-3-658-18708-8. [Google Scholar]
  38. Hesthaven, J.S. Numerical Methods for Conservation Laws: From Analysis to Algorithms; Volume 18 of Computational Science and Engineering Series; SIAM: Philadelphia, PA, USA, 2018; ISBN 978-1-61197-509-3. [Google Scholar]
  39. Toulorge, T.; Desmet, W. CFL Conditions for Runge–Kutta Discontinuous Galerkin Methods on Triangular Grids. J. Comput. Phys. 2011, 230, 4657–4678. [Google Scholar] [CrossRef]
  40. Chalmers, N.; Krivodonova, L.; Qin, R. Relaxing the CFL Number of the Discontinuous Galerkin Method. SIAM J. Sci. Comput. 2014, 36, A2047–A2075. [Google Scholar] [CrossRef]
  41. Munz, C.-D.; Westermann, T. Numerische Behandlung Gewöhnlicher und Partieller Differenzialgleichungen: Ein Anwendungsorientiertes Lehrbuch für Ingenieure; Springer: Berlin/Heidelberg, Germany, 2019; ISBN 978-3-662-55886-7. [Google Scholar]
  42. Toro, E.F. Riemann Solvers and Numerical Methods for Fluid Dynamics: A Practical Introduction, 3rd ed.; Springer: Berlin/Heidelberg, Germany, 2009. [Google Scholar] [CrossRef]
  43. Cockburn, B.; Shu, C.-W. Runge–Kutta Discontinuous Galerkin Methods for Convection-Dominated Problems. J. Sci. Comput. 2001, 16, 173–261. [Google Scholar] [CrossRef]
  44. Zulehner, W. Numerische Mathematik: Eine Einführung Anhand von Differentialgleichungsproblemen Band 2: Instationäre Probleme; Springer: Basel, Switzerland, 2011; ISBN 978-3-7643-8428-9. [Google Scholar]
  45. Scherer, P.O.J. Computational Physics: Simulation of Classical and Quantum Systems, 3rd ed.; Graduate Texts in Physics; Springer: Cham, Switzerland, 2017; ISBN 978-3-319-61087-0. [Google Scholar]
  46. Huber, P.; Mohanty, P.; Jenau, F. Innovative Numerical Method for the Determination of the Corona Onset Gradient on HVDC Overhead Transmission Lines. In Proceedings of the 2023 IEEE Electrical Insulation Conference (EIC), Quebec City, QC, Canada, 18 June 2023; pp. 1–4. [Google Scholar] [CrossRef]
  47. Burman, E.; Hansbo, P.; Larson, M.G. Dirichlet Boundary Value Correction using Lagrange Multipliers. arXiv 2019. [Google Scholar] [CrossRef]
  48. Santra, R. Einführung in den Lagrange- und Hamilton-Formalismus: Kanonische Theorie klassischer Teilchen und Felder; Springer: Berlin/Heidelberg, Germany, 2022; ISBN 978-3-662-65358-6. [Google Scholar]
  49. Dahmen, W.; Reusken, A. Numerik für Ingenieure und Naturwissenschaftler; Springer: Berlin/Heidelberg, Germany, 2008; ISBN 978-3-540-76492-2. [Google Scholar]
  50. Kortenbrede, J. Methode zur Einflussbewertung des Luftdrucks auf den Ionenstrom an einer Gleichspannungsleitung. Ph.D. Thesis, Technische Universität Dortmund, Düren, Germany, 2021. [Google Scholar]
  51. Freye, C.; Kortenbrede, J.; Vogelsang, L.; Jenau, F. Synthetic laboratory imitation of transient voltage stresses of MMC-HVDC links. IEEE Trans. Power Deliv. 2018, 33, 1–6. [Google Scholar] [CrossRef]
  52. Görtz, M.H. Elektromagnetische transiente Ausgleichsvorgänge in HGÜ-Systemen und deren Auswirkung auf die Isolationskoordination von Kabelanlagen. Ph.D. Thesis, Karlsruher Institut für Technologie (KIT), Karlsruhe, Germany, 2021. [Google Scholar]
  53. DIN EN IEC 60071-1 (VDE 0111-1); Insulationskoordination—Teil 1: Grundlagen. Beuth Verlag GmbH: Berlin, Germany, 2022.
  54. Schon, K. Hochspannungsmesstechnik: Grundlagen—Messgeräte—Messverfahren; Springer Fachmedien Wiesbaden GmbH: Wiesbaden, Germany, 2016; ISBN 978-3-658-15178-2. [Google Scholar]
  55. Hoffmann, R.; Wolff, M. Intelligente Signalverarbeitung 1; Springer: Berlin/Heidelberg, Germany, 2014; ISBN 978-3-662-45322-3. [Google Scholar]
  56. DIN EN 60060-1 (VDE 0432-1):2011-10; Hochspannungs-Prüftechnik: Teil 1: Allgemeine Begriffe und Prüfbedingungen (IEC 60060-1). Beuth Verlag GmbH: Berlin, Germany, 2011.
  57. Proakis, G.J.; Manolakis, G.D. Digital Signal Processing. 4th ed, Pearson Education Limited Harlow, Pearson New International Edition: Harlow, UK, 2014; ISBN 978-1-292-02573-5. [Google Scholar]
  58. Huber, P.; Jenau, F. Innovative Numerical Method for Determining the Critical Space Charge Characteristic and the Ion Current due to Superimposed Voltage Stresses. In Proceedings of the VDE Hochspannungstechnik 2024, Berlin, Germany, 12–13 November 2024. [Google Scholar]
  59. Pfeiffer, M. Ion-Flow Environment of HVDC and Hybrid AC/DC Overhead Lines. Ph.D. Thesis, ETH Zurich, Zurich, Switzerland, 2017. [Google Scholar]
  60. Guillod, T.; Pfeiffer, M.; Franck, C.M. Improved Coupled Ion-Flow Field Calculation Method for AC/DC Hybrid Overhead Power Lines. IEEE Trans. Power Deliv. 2014, 29, 2493–2501. [Google Scholar] [CrossRef]
Figure 1. Measured and within the measurement series averaged superimposed current measurement signals on the Wilson plate for U ( t ) = U D C U c ( t ) and U ( t ) = U D C + U c ( t ) with SI and VSFO. (a) Average signals for DC with SI superimposed. (b) Average value signals for DC superimposed with VSFO.
Eng 06 00194 g001
Figure 2. Electrical equivalent circuit for generating superimposed pulse stresses for experimental investigations in a laboratory environment [3].
Eng 06 00194 g002
Figure 3. Calibrated approximated and transient ion current signals for U ( t ) = U D C U c ( t ) and U ( t ) = U D C + U c ( t ) . For validation purposes, the numerical results of the respective measurement series are also shown. (a) Superimposed ion current for DC with SI. (b) Superimposed ion current for DC with VSFO.
Eng 06 00194 g003
Figure 4. Numerical simulation of the coupling currents in the AC phases as a function of the applied DC voltage. The phases of AC loads are represented by the letters R, S, and T. In blue are the reference values from [60]. (a) Hybrid full-scale mast geometry according to [60]. (b) Coupling currents in the AC phases.
Eng 06 00194 g004
Figure 5. Numerical results and benchmark of coupling currents for large-scale arrangements with three-phase system for different corona insertion gradients. (a) Time-resolved coupling currents in the AC phases. (b) Time-resolved coupling currents on the ground and the symmetry axis.
Eng 06 00194 g005
Figure 6. Superimposed coupling current in the AC phases starting from the faultless DC pole at pole-to-earth short circuit with 1.76 p.u. and time parameter of the VSFO [52].
Eng 06 00194 g006
Table 1. Resistance values for SI and VSFO laboratory realization.
R 0 R 1 R 2 R 3 R x R 5 R 4 R m R M
SI375 Ω 10 M Ω 282 k Ω 55 k Ω 140 M Ω 280 M Ω 375 Ω 14.95 k Ω 240 M Ω
VSFO375 Ω 10 M Ω 10 M Ω 1 M Ω 140 M Ω 280 M Ω 375 Ω 14.95 k Ω 240 M Ω
Table 2. Capacitance values for SI and VSFO laboratory realization.
C 0 C 1 C x C 3 C 2 C DUT C M
SI10 n F 25 n F 25 n F 25 n F 1.2 n F 7.9 p F 140 p F
VSFO10 n F 25 n F 25 n F 25 n F 1.2 n F 7.9 p F 140 p F
Table 3. Input parameters of the test series for ion current measurement with superimposed voltages from DC and pulse.
MRh in mT in °C h r in %Pol. U DC in kV U ^ in kV T p in ms T 2 in ms f a in MHz
50.6421.752pos50340.3056612.6110
60.5421.446pos50340.3056612.6110
70.5421.446neg−50−340.3056612.6110
80.6421.243neg−50−340.3056612.6110
150.5420.756neg−60−340.3056612.6110
160.7420.756neg−60−340.3056612.6110
170.7420.756pos60340.3056612.6110
180.5420.756pos60340.3056612.6110
30.5421.752pos50345.44671.5451
40.6421.752pos50345.44671.5451
90.5421.243neg−50−345.44671.54510
100.5421.243neg−50−345.44671.54510
110.5420.756pos60345.44671.54510
120.7420.756pos60345.44671.54510
130.7420.756neg−60−345.44671.54510
140.5420.756neg−60−345.44671.54510
Table 4. Parameters of the pulse input voltages on the test device.
U ^ in kV T p in ms T 2 in msA τ 1 in ms τ 2 in ms
SI340.3056612.611.12853.2061030.080996
VSFO345.44671.5451.074293.5541.243775
Table 5. Parameters from the curve approximation of the ion currents according to Equation (34).
MR A · I ^ Ion in μ A τ 1 , Ion in ms τ 2 , Ion in ms I Ion , DC in nA R 2
SI5 2.2830 23.9032 23.8780 1.0983 0.674
6 2.4970 20.9024 20.8709 0.8198 0.807
7 4.8254 17.7892 17.7724 225.6377 0.846
8 2.3880 27.0188 26.9888 37.1079 0.680
15 6.7002 11.3857 11.3714 138.1962 0.822
16 64.4664 19.8261 19.8249 65.4189 0.993
17 0.9999 × 10 3 38.4691 38.4691 20.6020 0.871
18 5.2372 13.9968 13.9783 48.7449 0.767
VSFO3 0.4203 19.0499 18.4650 8.8094 0.996
4 1.0000 × 10 3 17.2335 17.2333 7.9451 0.999
9 0.0249 30.0613 21.6718 39.0353 0.942
10 0.7296 18.8561 18.5379 41.1427 0.999
11 1.0000 × 10 3 32.7230 32.7229 9.2751 0.930
12 4.4596 27.3170 27.2569 78.9701 0.965
13 2.1800 34.3488 34.2580 135.9902 0.988
14 0.0106 80.8405 7.7541 283.4031 0.998
Table 6. Input parameters of the numerical simulation to simulate transient ion currents with superimposed voltages.
SimMRh in mPol. U DC in kV U ^ in kV τ 1 in ms τ 2 in ms μ in m2 V 1 s 1
SI1180.54pos.6034 3.206 0.0809 1.5 × 10 4
215 0.54 neg. 60 34 3.206 0.0809 1.8 × 10 4
317 0.74 pos.6034 3.206 0.0809 1.5 × 10 4
416 0.74 neg. 60 34 3.206 0.0809 1.8 × 10 4
VSFO511 0.54 pos.6034 93.554 1.2437 1.5 × 10 4
614 0.54 neg. 60 34 93.554 1.2437 1.8 × 10 4
712 0.74 pos.6034 93.554 1.2437 1.5 × 10 4
813 0.74 neg. 60 34 93.554 1.2437 1.8 × 10 4
Table 7. Validation of the simulated transient ion current for U ( t ) = U D C + U c ( t ) .
SIVSFO
h = 0 . 54 m h = 0 . 74 m h = 0 . 54 m h = 0 . 74 m
Measurement I Ion , D C 48.745   n A 20.603   n A 9.275   n A 78.970   n A
T p 16.32   m s 45.375   m s 38.318   m s 31.877   m s
T 2 37.894   m s 106.278   m s 88.509   m s 74.043   m s
I max 2.545   μ A 0.397   μ A 8.470   μ A 3.612   μ A
Q Ion 96.77   n C 38.7539   n C 741.906   n C 265.257   n C
Simulation I Ion , D C 72 n A 24 n A 460.7   n A 255 n A
T p 4.88   m s 4.82   m s 5.5   m s 4.5   m s
T 2 14.14   m s 13.3   m s 47 m s 59 m s
I max 2.554   μ A 0.8487   μ A 8.241   μ A 4.488   μ A
Q Ion 32.2566   n C 11.0725   n C 487.081   n C 318.308   n C
Deviation I Ion , D C 47.7 % 16.49 % 50 % 24.96 %
T p 70 % 89.37 % 85 % 85 %
T 2 62.68 % 87.48 % 46 % 20 %
I max 0.35 % 13.77 % 2.7 % 24 %
Q Ion 66 % 71 % 34 % 20 %
Disclaimer/Publisher’s Note: The statements, opinions and data contained in all publications are solely those of the individual author(s) and contributor(s) and not of MDPI and/or the editor(s). MDPI and/or the editor(s) disclaim responsibility for any injury to people or property resulting from any ideas, methods, instructions or products referred to in the content.