Article

Characterization of Matrix Pore Structure of a Deep Coal-Rock Gas Reservoir in the Benxi Formation, NQ Block, ED Basin

1
Engineering Research Center of Gas Resource Development and Utilization of Ministry of Education, China University of Petroleum (Beijing), Beijing 102249, China
2
Yumen Oilfield Company, PetroChina, Jiuquan 735000, China
3
Energy Systems Engineering, Faculty of Engineering and Applied Science, University of Regina, Regina, SK S4S 0A2, Canada
*
Authors to whom correspondence should be addressed.
Eng 2025, 6(7), 142; https://doi.org/10.3390/eng6070142
Submission received: 29 May 2025 / Revised: 22 June 2025 / Accepted: 23 June 2025 / Published: 30 June 2025
(This article belongs to the Section Chemical, Civil and Environmental Engineering)

Abstract

In this study, a comprehensive experimental framework was developed to quantitatively characterize the pore structure of a deep coal-rock (DCR; reservoirs below [3000 m]) gas reservoir. Experimentally, petrological and mineral characteristics were determined by performing proximate analysis and scanning electron microscopy (SEM) as well as by measuring vitrinite reflectance and maceral components. Additionally, physisorption and high-pressure mercury injection (HPMI) tests were conducted to quantitatively characterize the nano- to micron-scale pores in the DCR gas reservoir at multiple scales. The DCR in the NQ Block is predominantly composed of vitrinite, accounting for approximately 77.75%, followed by inertinite. The pore space is predominantly characterized by cellular pores, but porosity development is relatively limited as most of such pores are extensively filled with clay minerals. The isothermal adsorption curves of CO2 and N2 in the NQ Block and the DJ Block exhibit very similar variation patterns. The pore types and morphologies of the DCR reservoir are relatively consistent, with a significant development of nanoscale pores in both blocks. Notably, micropore metrics per unit mass (pore volume (PV): 0.0242 cm3/g; and specific surface area (SSA): 77.7545 m2/g) indicate 50% lower gas adsorption potential in the DJ Block. In contrast, the PV and SSA of the mesopores per unit mass in the NQ Block are relatively consistent with those in the DJ and SF Blocks. Additionally, the peak mercury intake in the NQ Block occurs within the pore diameter < 20 nm, with nearly 60% of the mercury beginning to enter in large quantities only when the pore size exceeds 20 nm. This indicates that nanoscale pores are predominantly developed in the DCR of the NQ block, which aligns with the findings from physical adsorption experiments and SEM analyses. Overall, the development characteristics of multi-scale pores in the DCR formations of the NQ Block and the eastern part of the Basin are relatively similar, with both total PV and total SSA showing an L-shaped distribution. Due to the disparity in micropore SSA, however, the total SSA of the DJ Block is approximately twice that of the NQ Block. This discovery has established a robust foundation for the subsequent exploitation of natural gas resources in DCR formations within the NQ Block.

1. Introduction

With the gradual depletion of shallow coal-rock gas resources, as evidenced by the declining storage-to-production ratio, DCR gas reservoirs are expected to become a critical substitute for future coal-rock gas exploitation focus [1,2]. The Ordos Basin exhibits distinct sedimentary environments with the eastern part characterized by coastal plain settings featuring wetland forest swamps and overlying forest swamps, while the western portion is dominated by tidal flat and lagoon deposits with extensively developed vegetated swamps [3]. The pore structure of coal rock in the Ordos Basin exhibits significant regional differences between its western and eastern parts due to the contrasted sedimentary–tectonic controls; yet the existing research has predominantly focused on the eastern part, leaving the western Basin relatively understudied [4,5]. The pore structure of DCR displays significant complexity with pores at varying scales exerting markedly distinct influences on the adsorption, desorption, diffusion, and seepage processes of coal-rock gas [6,7]. Therefore, conducting a thorough investigation into the pore structure of DCR in the western Ordos Basin is of significant importance for its field-scale evaluation and exploitation.
Physically, coal constitutes a complex porous medium featuring a multi-scale pore with a microstructure spanning nanometers to micrometers, where structural heterogeneity governs the distinct adsorption behavior and occurrence states of coal-rock gas [8]. DCR gas predominantly occurs in the nanoscale pore network of coal, existing in dual states of adsorption and free gas, with the adsorbed gas being the dominant phase due to its extensive coverage of the coal surface area [9,10,11]. Generally, micropores and mesopores predominantly contribute to the SSA for the adsorbed gas, whereas macropores and microcracks predominantly function as seepage channels for gas transport [12]. Such a microstructure governs the processes of gas adsorption, diffusion, and seepage, thereby influencing the storage, development, and migration mechanisms of coal-rock gas [13,14].
Currently, extensive attempts have been made to characterize DCR pore structures, resulting in the development of two primary measurement methodologies focused on image analysis and fluid injection [15,16]. The former includes X-ray diffraction, scanning electron microscopy, and micro-CT imaging, enabling direct visualization of coal pore morphology, structure, and connectivity; however, such pore distribution data lack statistical representativeness and are insufficient for precise quantitative analysis [17,18]. The latter employs gas adsorption and/or mercury intrusion porosimetry for such a purpose, but their detectable pore size shows varying significant ranges from different tests due to inherent methodological constraints [19]. Consequently, these techniques are limited to characterizing pore distributions at specific scales and face challenges in comprehensively reflecting the entire spectrum of pore structure characteristics in coal rock [11]. As a critical coal-rock gas development region in China, the Ordos Basin has drawn substantial research attention. Although there are vitrinite-controlled micropores in the east [4], no attempts have been made in the western part of the Basin, in which limited exploration and development activities have been performed, resulting in a lack of systematic research on the pore characteristics of DCR as well as insufficient cross-scale quantitative characterization and analysis.
In this study, a cross-scale systematic approach was employed to qualitatively identify and quantitatively characterize nano-micron pores in deep coal rocks. Proximate analysis, vitrinite reflectance measurement, and maceral composition determination were conducted on four coal samples from the NQ Block in the ED Basin to elucidate the petrological characteristics of DCR. Additionally, we conducted a comprehensive and multi-scale quantitative assessment of nano- to micro-microstructures in DCR using physisorption techniques and HPMI tests, thereby providing a thorough evaluation of the pore structure characteristics across different scales. Finally, through a comparative analysis of the microscopic pore structure characteristics of coal rock in the NQ Block and the deep layer in the eastern part of the Basin, the developmental features of the DCR matrix in the NQ Block were systematically elucidated so as to provide a robust and solid foundation for the subsequent exploitation of such gas resources in the NQ Block.

2. Experimental

2.1. Materials

Four coal samples from the NQ Block of the ED Basin were selected for the relevant experiments. The samples covered distinct lithofacies (e.g., clay-rich vs. vitrinite-dominant zones) to capture reservoir heterogeneity. Table 1 summarizes the fundamental physical properties of these samples, including dimensions, porosity, permeability, and gas content. Notably, in this study, high-purity liquid nitrogen and carbon dioxide were employed as the adsorption medium to perform physical adsorption experiments on the coal samples.
To minimize the influence of coal heterogeneity as much as possible, the core samples were initially machined into cylindrical coal specimens with a diameter of 25.0 mm and a length of 50.0 mm. Subsequently, these specimens were further processed into smaller cylinders with dimensions of 10.0 mm in radius and 15.0 mm in length for the HPMI tests. Finally, the remaining cylindrical specimens were sectioned and pulverized for additional analytical procedures, including determination of maximum vitrinite reflectance ( R o , max ), maceral composition analysis, proximate analysis, SEM observation, and physical adsorption measurements (combining low-temperature N2 adsorption and CO2 adsorption), as listed in Figure 1.

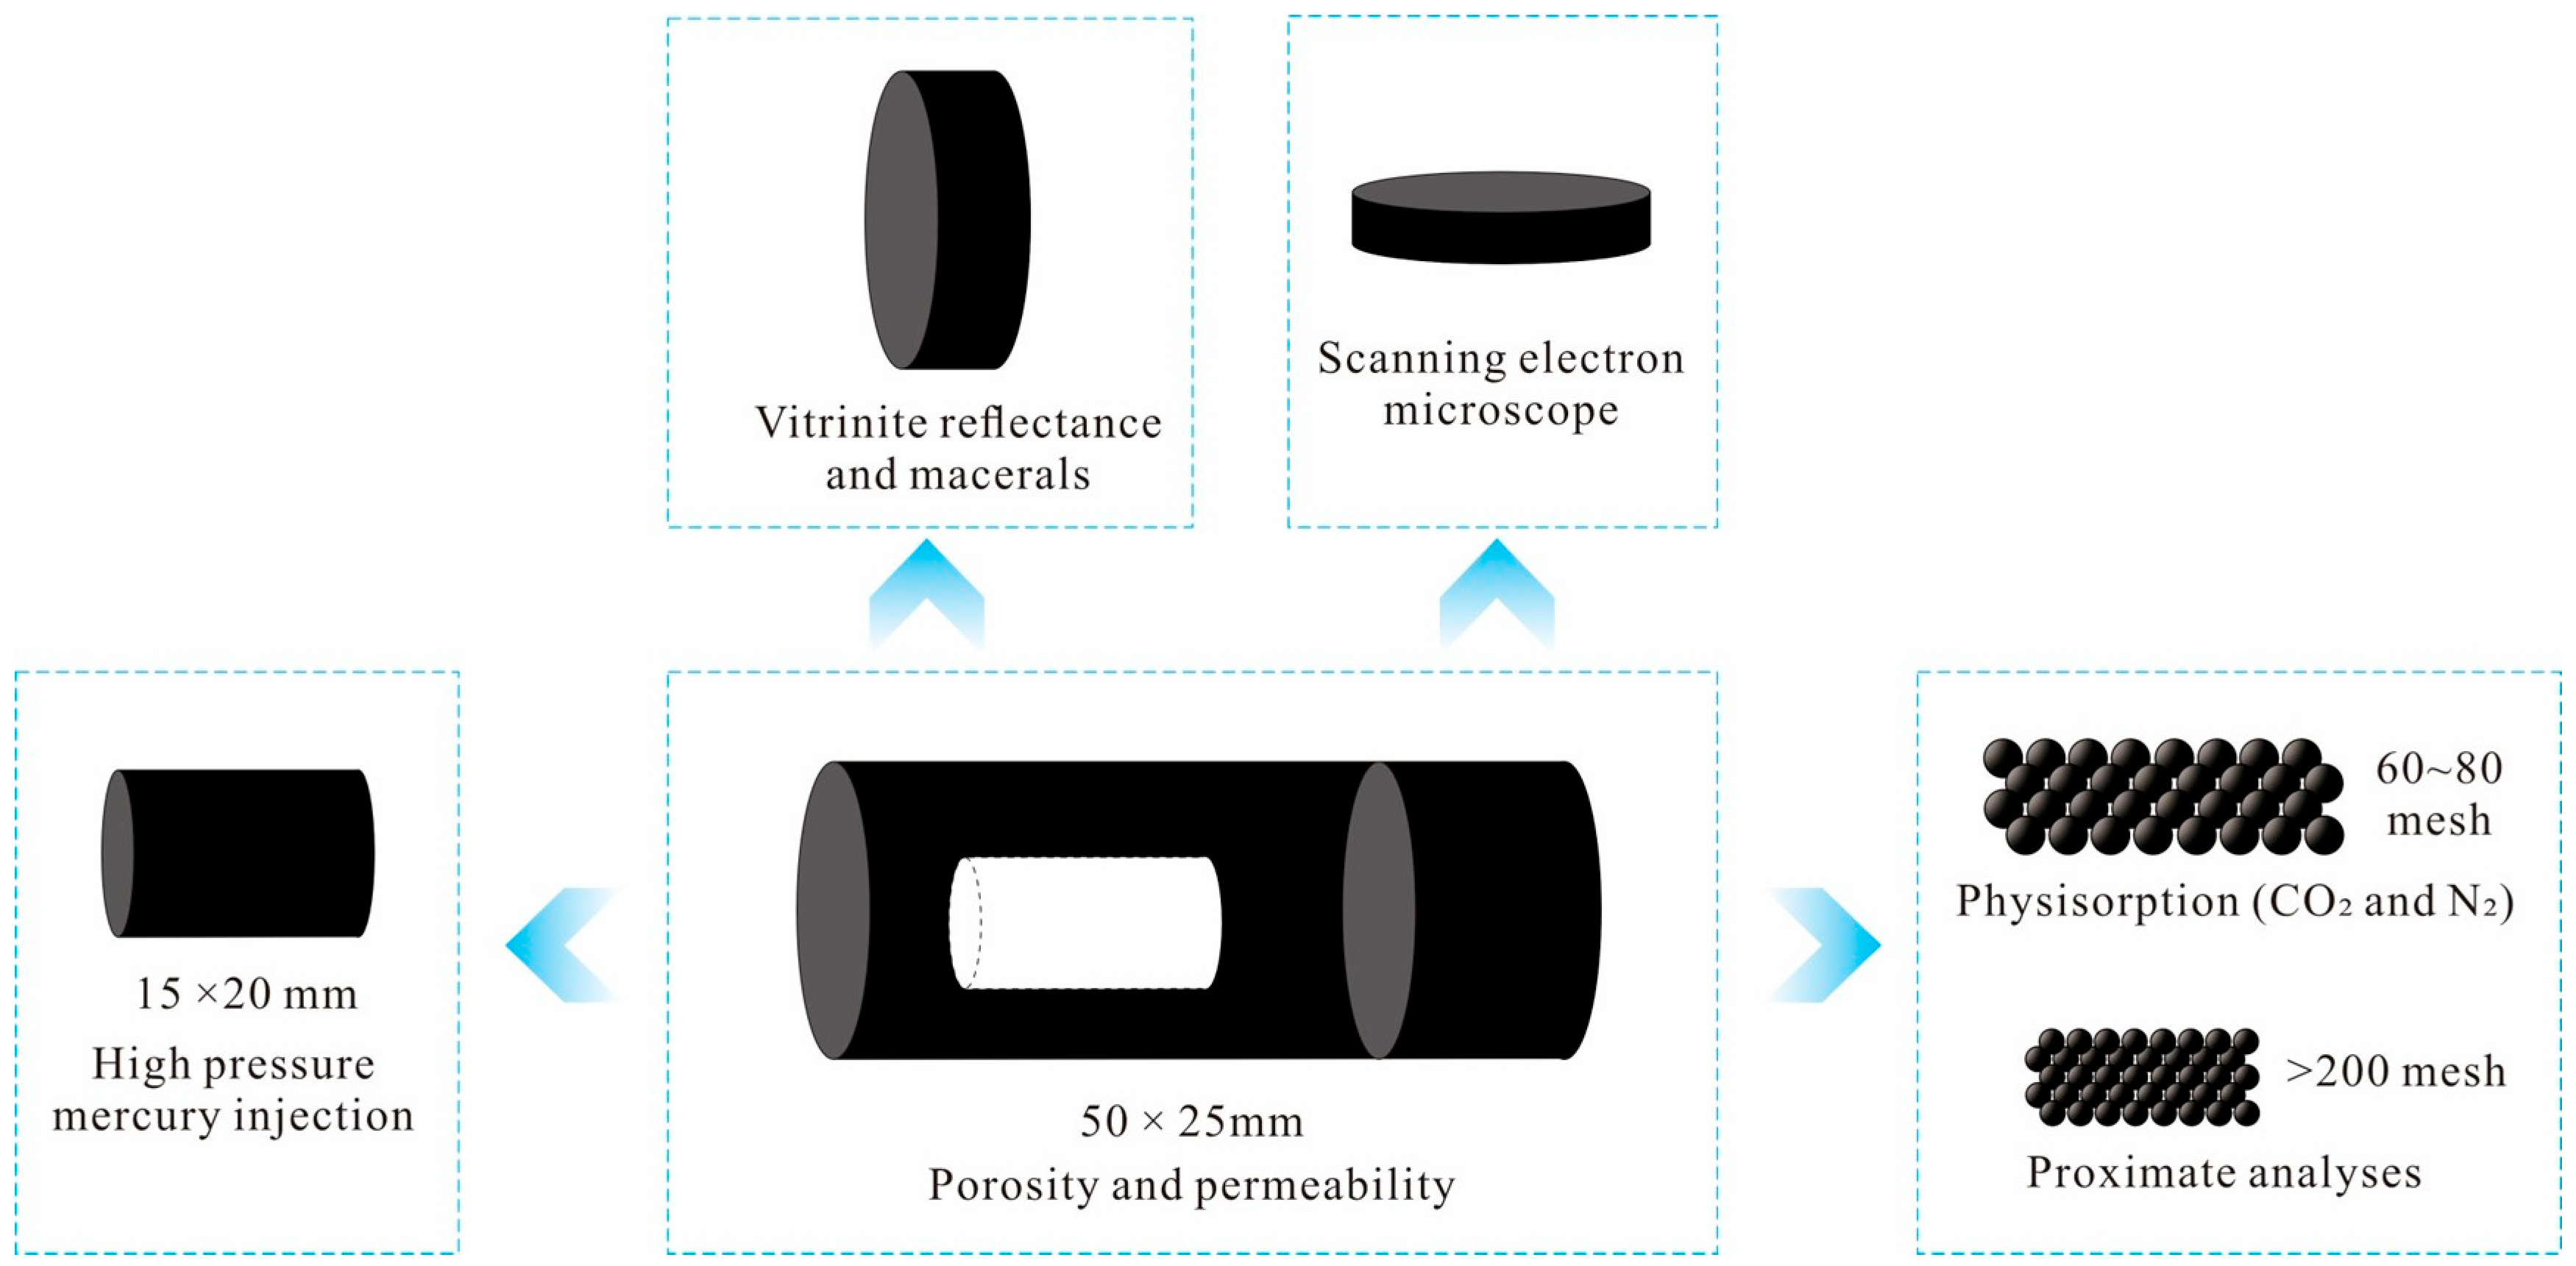
2.2. Experimental Setup

The SDTGA5000 industrial analyzer (Hunan SanDe Technology Co., Ltd., Changsha, Hunan, China) was utilized to perform proximate analysis. A polarizing microscope (Leica DM4P, Wetzlar, Germany) was employed to determine the maximum vitrinite reflectance ( R o , max ) and conduct maceral analysis. These three analytical techniques were combined to comprehensively evaluate the quality parameters of the coal samples.
The Quanta FEG field-emission scanning electron microscope (FEI Company, Hillsboro, OR, USA) was employed for SEM analysis to systematically characterize the pore morphology, classify pore types, and investigate the occurrence and spatial distribution of clay minerals in freshly shattered coal samples.
A fully automated physisorption analyzer (Autosorb-iQ-MP-C, Quantachrome Instruments, Boynton Beach, FL, USA) was employed for gas adsorption measurements. Specifically, CO2 adsorption at 273 K was utilized to characterize micropores (<2 nm in diameter), while N2 adsorption at 77 K was applied to determine mesopore size distribution (2–50 nm in diameter).
The AutoPore 9505 mercury injection porosimeter (Quantachrome Instruments, Norcross, GA, USA) was employed to conduct high-pressure mercury intrusion experiments. The pore size distribution was analyzed using the capillary pressure curves obtained from the HPMI tests. In this process, mercury, acting as a non-wetting phase, was intruded into the rock pores, and the injected mercury volume corresponded to the pore throat sizes within the porous medium.

2.3. Experimental Procedures

2.3.1. Proximate Analysis

In strict accordance with GB/T 30732-2014 [20], the moisture content, ash content, volatile matter content, and fixed carbon content of Samples 2, 3, and 4 were measured using an automated proximate analyzer.

2.3.2. Vitrinite Reflectance Analysis

Following the GB/T 6948-2008 standard [21], thin coal sections were prepared, and the maximum vitrinite reflectance ( R o , max ) was measured using oil-immersion microscopy.

2.3.3. Maceral Composition Analysis

For reflectance microscopy, the coal sample was prepared as a polished thin section on which an oil-immersed liquid was applied, and then subsequently placed on the microscope stage. A total of 500 effective measurement points were made and evaluated. The contents of vitrinite, inertinite, and other maceral components were statistically analyzed. The entire experimental process was strictly conducted in accordance with the GB/T 8899-2013 standard [22].

2.3.4. SEM Analysis

Core samples were mechanically fractured to produce fresh, flat fragments suitable for gold sputtering, which was followed by secondary electron imaging and energy-dispersive X-ray spectroscopy (EDS) analysis. SEM characterization not only reveals the pore morphology and pore type classification but also elucidates the occurrence and distribution of clay minerals in the freshly fractured surfaces of Samples #2, #3, and #4 [23].

2.3.5. Physisorption Experiments

The physisorption measurements included low-temperature N2 adsorption and CO2 adsorption experiments. Prior to N2 adsorption analysis, the samples were subjected to degassing under vacuum at 105 °C (378 K) for 12 h to eliminate moisture and volatile contaminants. Subsequently, the degassed samples were transferred to the analysis station, where high purity N2 was used as the adsorbate for conducting an adsorption–desorption test at −196 °C (77 K). After the test, the pore structure parameters, including PV, SSA, and pore size distribution, were quantitatively characterized using the Barrett–Joyner–Halenda (BJH) theory [24].
For the CO2 adsorption experiments, the sample pretreatment followed procedures similar to those used in N2 adsorption analysis. Specifically, 1–2 g of the samples with 60–80 mesh were degassed under vacuum for 16 h prior to measurement. High-purity CO2 was employed as the adsorbate under isothermal conditions at 0 °C (273 K). Pore structural parameters, such as total PV, SSA, and pore size distribution, were determined using the Dubinin–Radushkevich (DR) and Dubinin–Astakhov (DA) equations [25].

2.3.6. HPMI Tests

Prior to testing, the coal samples were machined into cylindrical specimens with a diameter of 10 mm and a length of 25 mm. A maximum mercury intrusion pressure of 206.0 MPa was applied, corresponding to a pore/throat radius threshold of 3.5 nm. Due to the low permeability (<0.5 mD), an equilibration time of 90 s was maintained at each pressure step [26]. After reaching the peak pressure, pressure was gradually reduced to facilitate the extrusion of mercury from the sample matrix. Upon full depressurization, mercury intrusion–extrusion hysteresis curves were obtained.

3. Results and Discussion

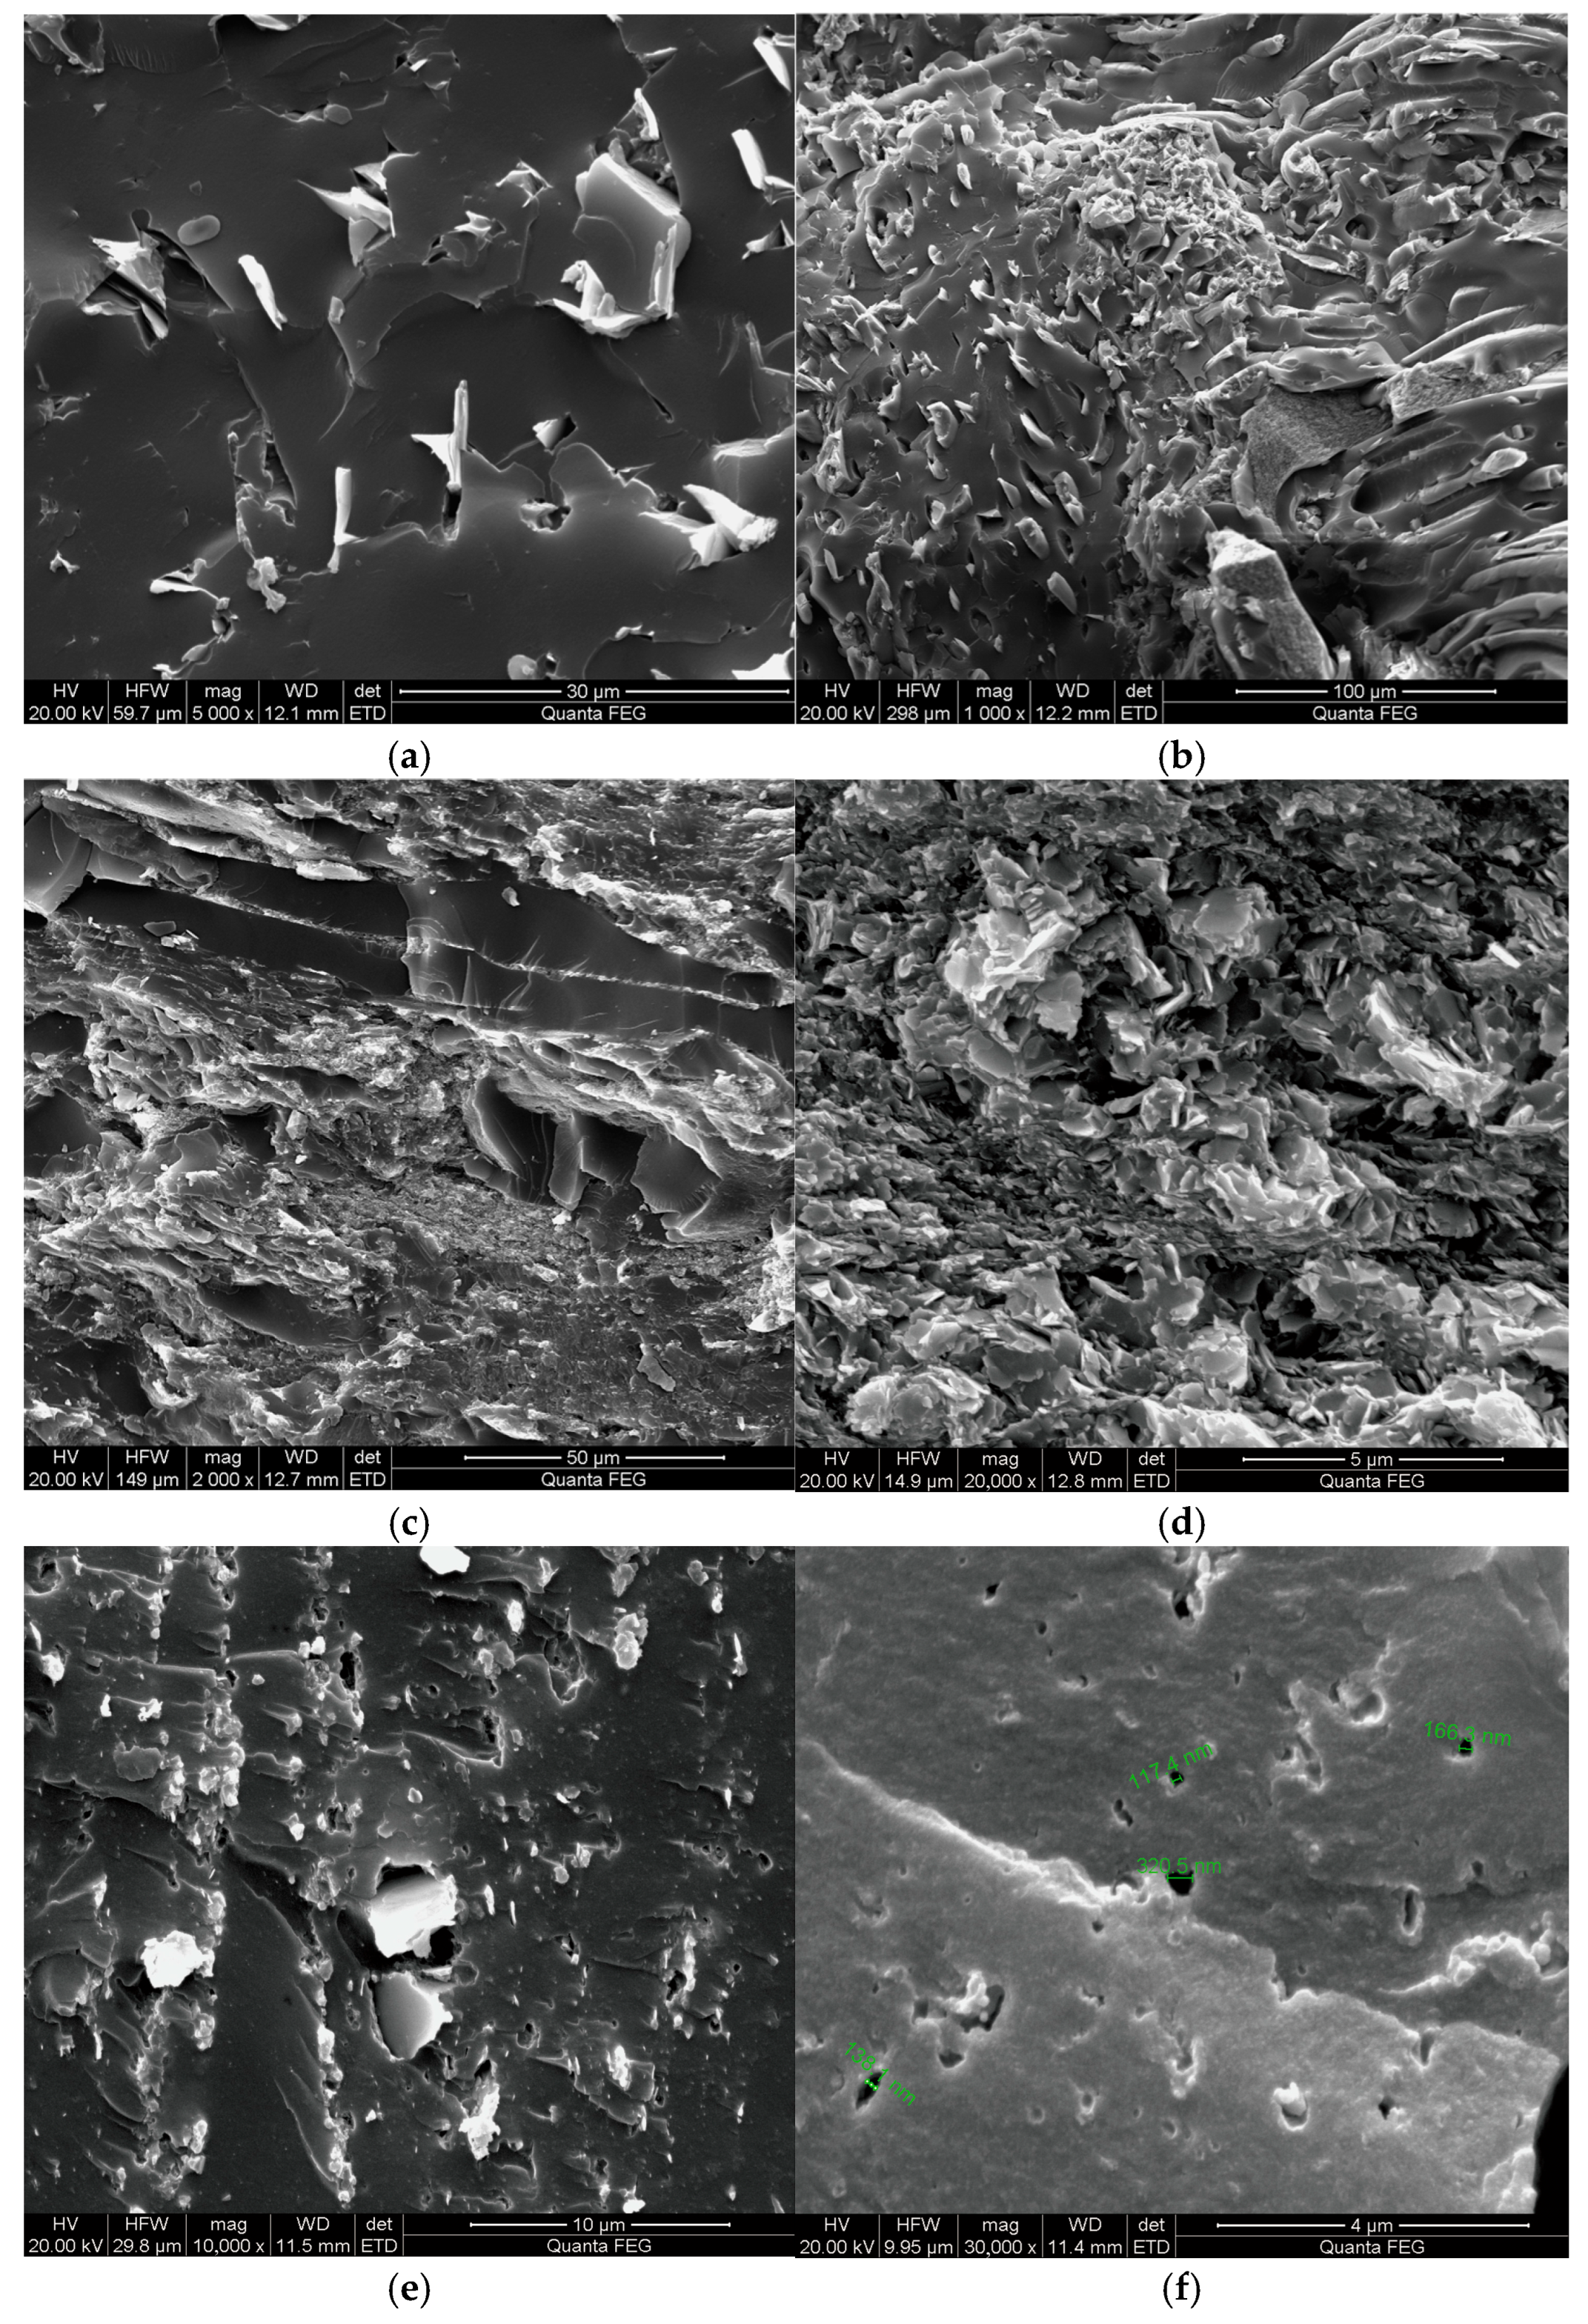
3.1. Mineral Characteristics and Coal Morphology

Based on the proximate analysis, vitrinite reflectance measurements, and maceral determination experiments, a statistical analysis of the physical properties of three DCR core samples was conducted, as detailed in Table 2. As can be seen from Table 2, the maximum vitrinite reflectance ( R o , max ) is measured to be 1.87%, and the organic matter maturity exhibits a high degree and significant hydrocarbon generation potential, classifying it as medium-rank coal [27]. The proximate analysis parameters of three coal samples indicates that the moisture (Mad) content ranges from 0.54 to 0.64% with an average of 0.60%; ash (Aad) content ranges from 22.45 to 38.11% with an average of 28.80%; volatile matter (Vad) content ranges from 10.75 to 12.02% with an average of 16.08%; and fixed carbon (FCad) content ranges from 49.33 to 66.12% with an average of 59.40%. The DCRs in the eastern part of the Basin exhibit characteristics of low Mad, low Aad, and high FCad. Specifically, the Aad content is less than 20%, while the FCad content exceeds 70% [5,28,29]. Compared to the eastern part of the Basin, the NQ Block is characterized by a higher Aad content, which poses challenges for the generation of DCR gas. Maceral analysis reveals that the DCR samples within the NQ Block are predominantly composed of the vitrinite with an average content of 77.2%, followed by the inertinite at 19.67%. The mineral matter exhibits the lowest contents, accounting for only 2.93%.
Utilizing SEM to analyze the microstructural morphology of DCR pore structures enables both intuitive identification and comprehensive characterization of pore structures, thereby offering deeper insights into their intrinsic pore properties [30]. Microscopic images of the DCR samples are presented in Figure 2. The maceral components of Samples #2, #3, and #4 were predominantly vitrinite with minor contributions from inertinite and other components. Notably, textural folds in fusinite were identified in Sample #2. As can be seen from Figure 2a–d, the pore spaces of Sample #2 and Sample #3 are mainly composed of cellular pores along with a small amount of intercrystalline pores and dissolution pores; however, most of these pore spaces are infilled with clay minerals. Cellular pores, representing syngenetic pore structures formed during coal deposition, originate from the preserved cellular architecture of coal-forming plant tissues and were predominantly observed in telovitrinite and inertinite macerals, exhibiting poor spatial connectivity. Sample #4 exhibits frequent occurrences of molded pores with nanoscale diameters (see Figure 2e,f), and these pores predominantly display a circular morphology and follow a discrete distribution pattern.
The degree of pore development in the DCR samples is relatively low, indicating a more compact coal reservoir with pronounced heterogeneity. As shown in Figure 2, the clay minerals in the DCR samples are mainly kaolinite and are widely distributed. The formation of kaolinite significantly reduces the complexity of the PV and simultaneously enhances the irregularity of the pore geometry [13]. Sample #2 exhibits microstructural characteristics predominantly influenced by the folds of inertinite. These irregularly curved surfaces substantially enhance the SSA of coal, thus providing an increased number of adsorption sites for gas molecules. This indicates that the crystalline components within the matrix of DCR reservoirs play a critical role in modulating gas adsorption capacity. Specifically, the geometrically complex pore structure contributes to the irregular morphology of DCR pores, ultimately augmenting the adsorption capacity of coal rock.

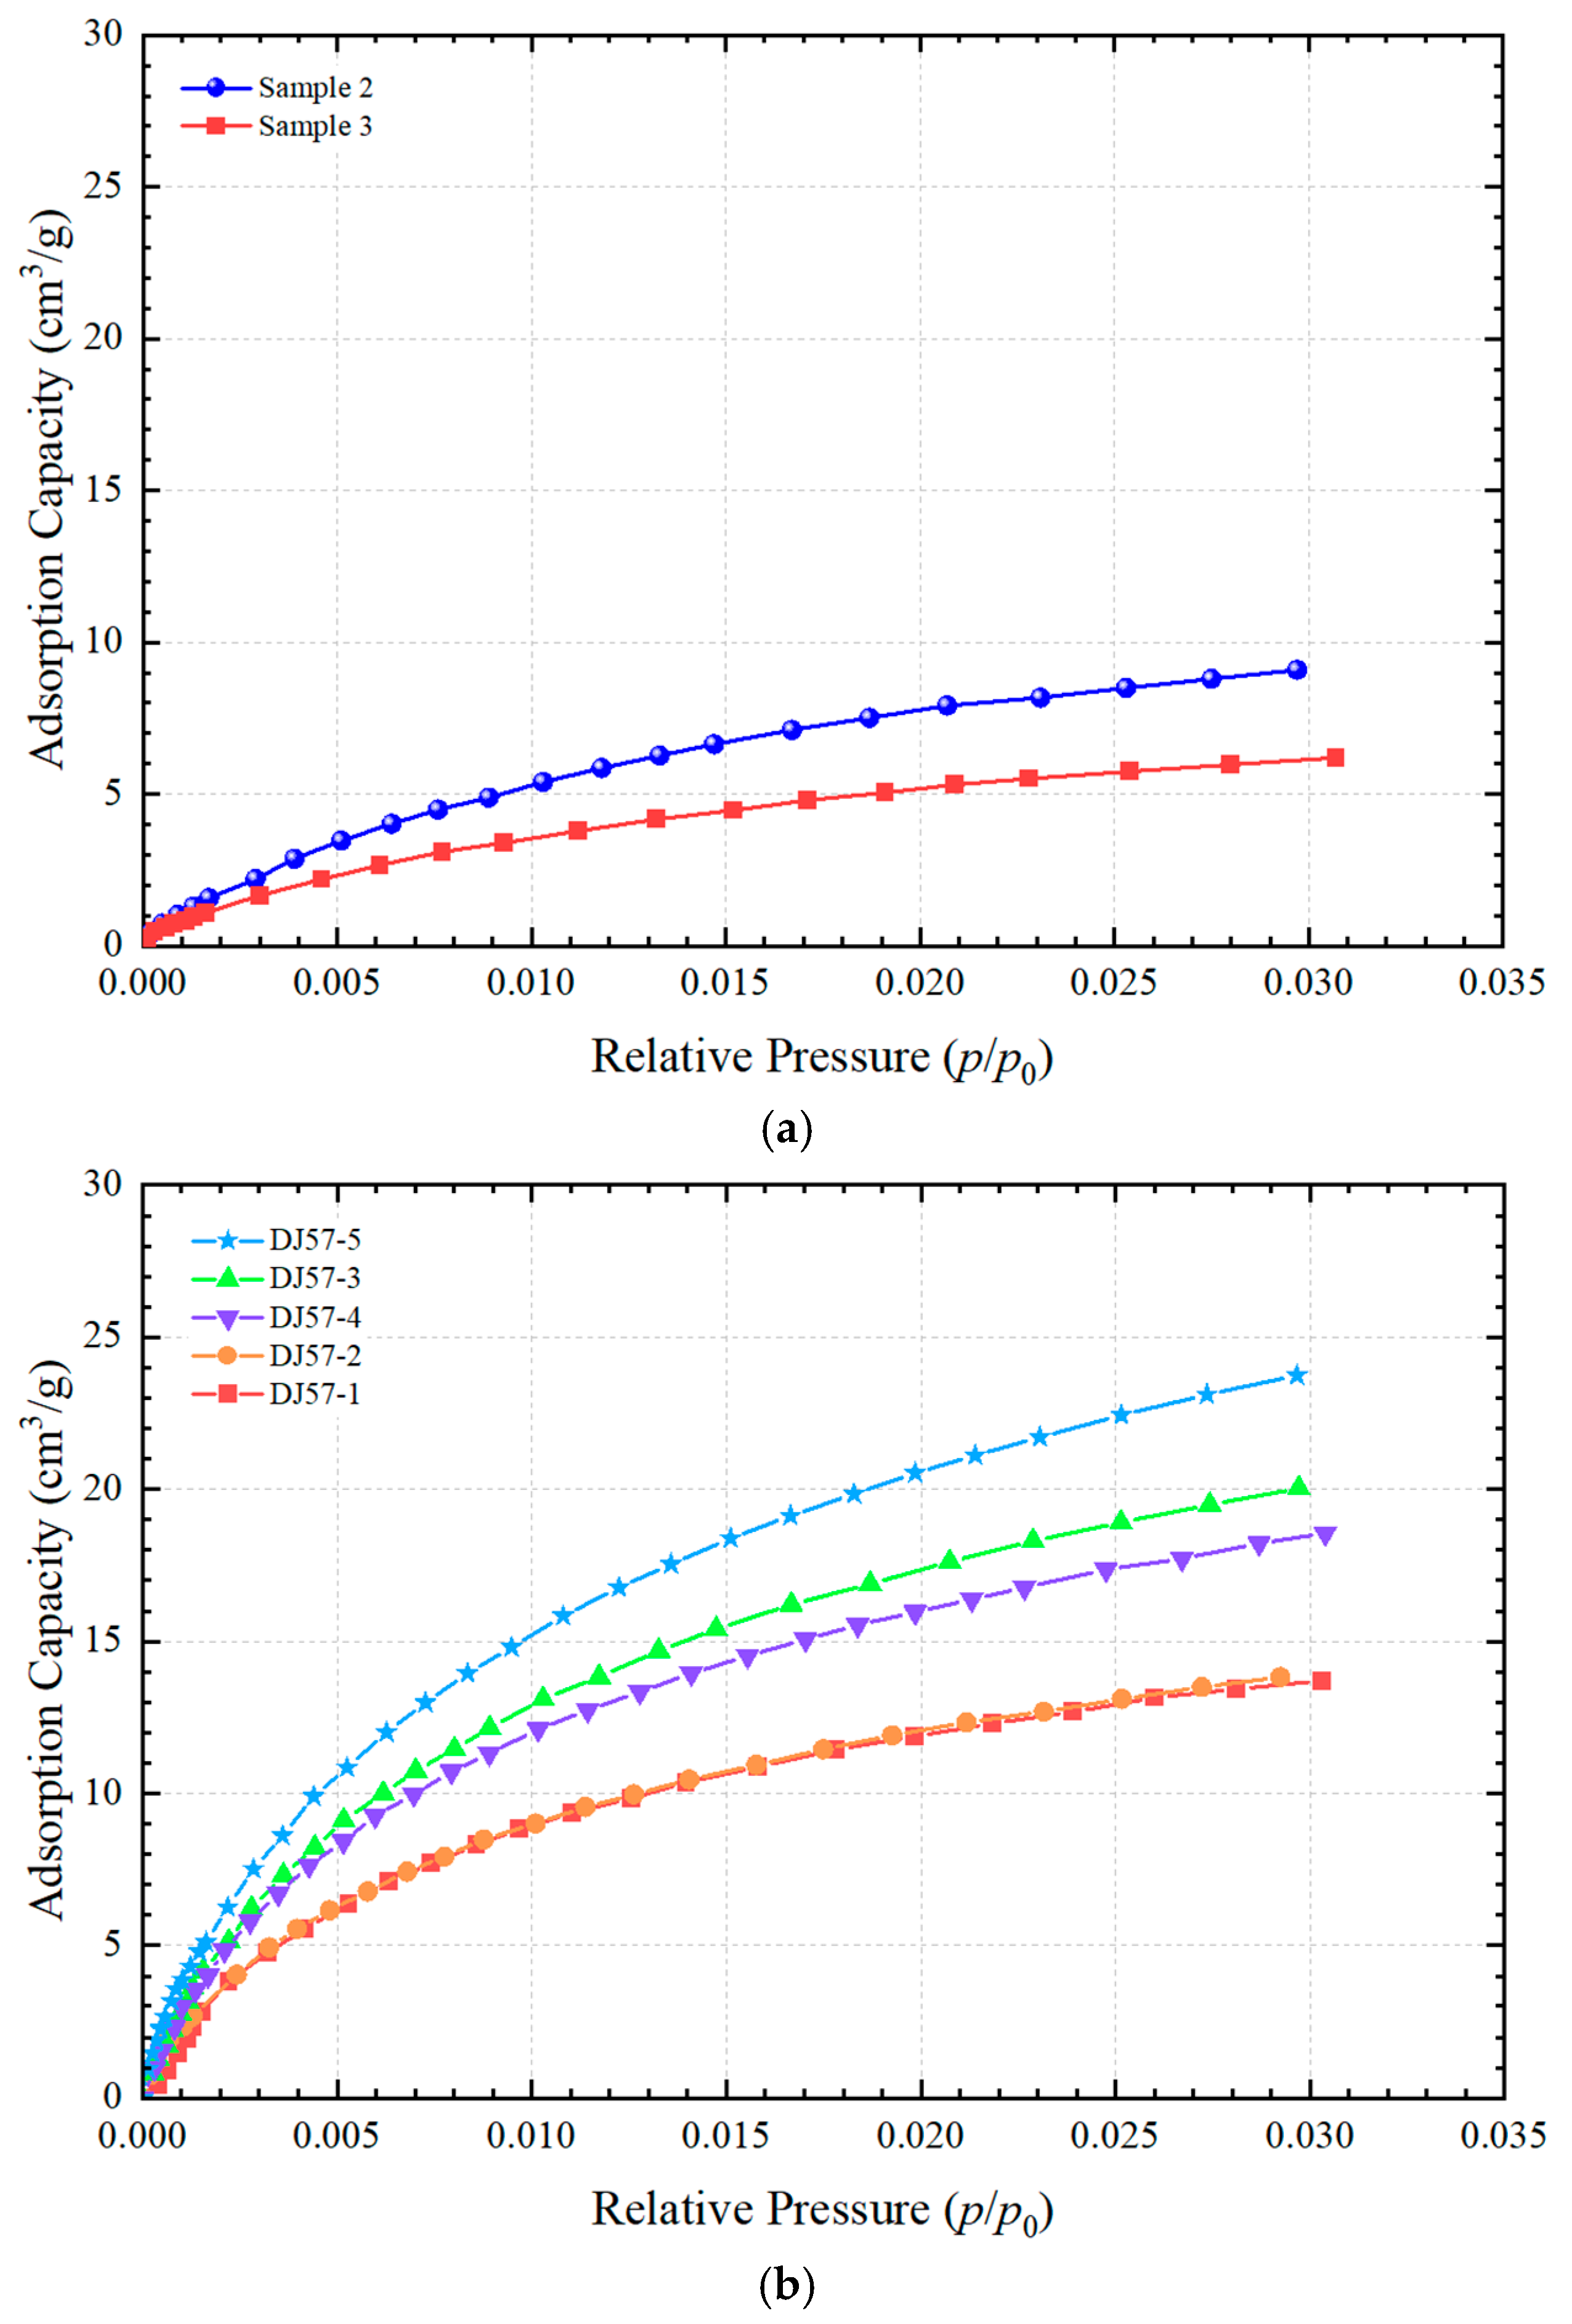
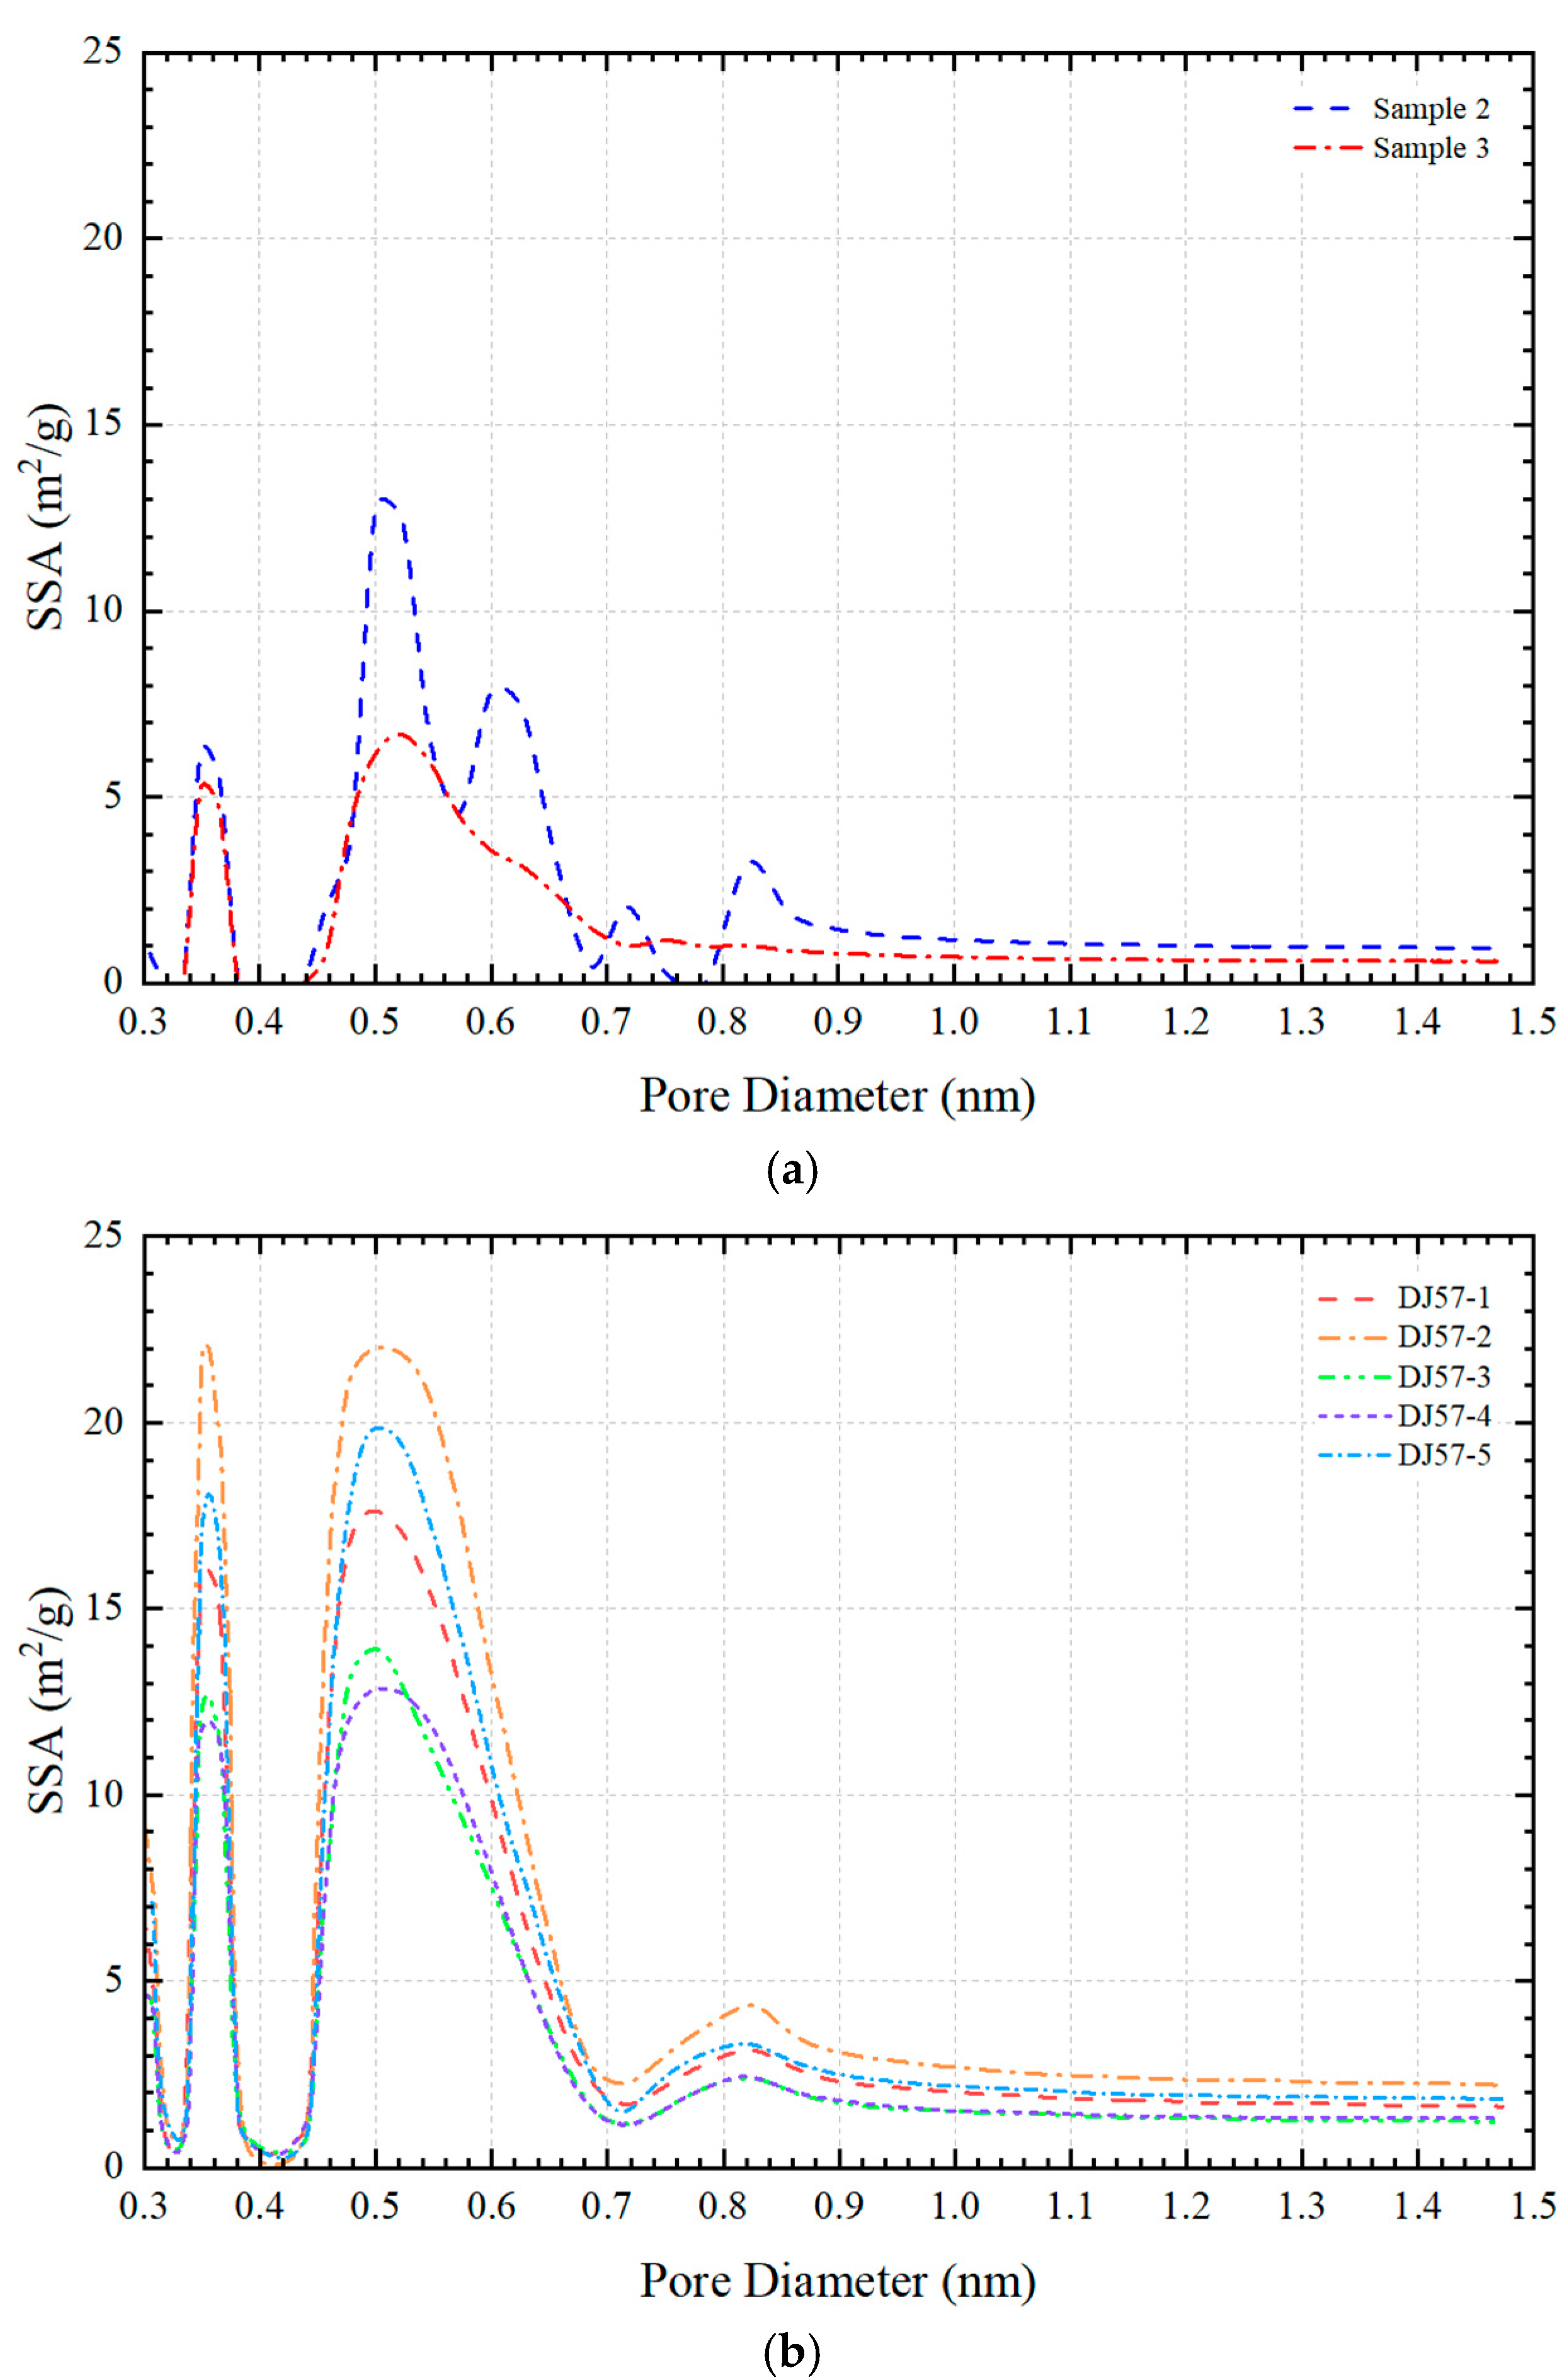
3.2. Micropore Distribution Characteristics

CO2 is an ideal agent for micropore characterization, and at a temperature of 0 °C (273 K), its kinetic molecular diameter is merely 0.33 nm, enabling a highly accurate assessment of micropore distribution in DCR [31]. Figure 3a illustrates the isothermal adsorption curve for the CO2 of the DCR samples, where the ratio of experimental pressure to saturated vapor pressure (p/p0) represents the required relative pressure. It can be observed from Figure 3 that, under standard conditions, as the relative pressure increases, the adsorption capacity of the DCR samples gradually rises, and then gradually reaches its maximum. According to the classification established by the International Union of Pure and Applied Chemistry (IUPAC), the CO2 adsorption curve of the DCR samples in the NQ Block can be categorized as a Type I isotherm. Such a classification indicates that the samples exhibit characteristics similar to those of the DCR samples in the DJ Block located in the eastern part of the Basin (see Figure 3a,b) [7,32]. The maximum adsorption capacity of Sample #2 is 9.09 cm3/g, whereas that of Sample #3 is only 6.20 cm3/g, indicating that the micropore development of Sample #2 is more pronounced compared to Sample #3.
The PV and SSA of the DCR samples exhibit a bimodal distribution, with relatively similar peak pore diameters. Figure 4a and Figure 5a illustrate the pore distribution characteristics of the DCR samples as determined by CO2 adsorption for micropore analysis, respectively. It is evident from these two figures that both the micropore PV and SSA in the DCR samples exhibit a bimodal distribution. In Sample #2, the micropore PV per unit mass of DCR is distributed within the range of 0.0001–0.0033 cm3/g with a total PV of 0.029 cm3/g, and two primary peaks concentrated in the ranges of 0.33–0.38 nm and 0.45–0.79 nm, respectively. The SSA per unit mass of DCR is distributed within the range of 0.791 to 12.839 m2/g with a total SSA of 93.868 m2/g, and two primary peaks concentrated in the ranges of 0.33–0.38 nm and 0.46–0.68 nm, respectively. The PV of micropores per unit mass of DCR in Sample #3 is distributed within 0.0001–0.0018 cm3/g with a total PV of 0.019 cm3/g, and the two main peaks concentrated in the ranges of 0.32–0.40 nm and 0.46–0.72 nm, respectively. The SSA per unit mass of DCR is distributed within 0.061–6.668 m2/g with a total SSA of 61.641 m2/g, and the ranges of the two main peaks are in a good agreement with the PV distribution.
Figure 4b and Figure 5b illustrate the distribution curves of the PV and SSA of the micropores per unit mass of the DCR samples in the DJ Block located in the eastern part of the Basin, and Table 3 provides a detailed comparison of the SSA and total PV of the micropores between the NQ Block and the eastern part of the Basin. As shown in Figure 4b and Figure 5b, the PV and SSA of the micropores in the DJ Block exhibit a multi-peak distribution characteristic with their peaks primarily concentrated at 0.33–0.40 nm and 0.44–0.71 nm, which are aligned closely with the micropore distribution characteristics observed in the NQ Block. Nevertheless, there exist significant differences in the SSA and PV between the NQ Block and the eastern part of the Basin. According to Table 3, the SSA and PV of the micropores per unit mass of the NQ Block are 77.754 m2/g and 0.024 cm3/g, respectively, which are relatively comparable to those of the SF Block in the eastern part of the Basin. In contrast, the SSA and PV of the micropores per unit mass of the DJ Block in the eastern part of the Basin are 186.045 m2/g and 0.055 cm3/g, approximately double those of the NQ Block. This suggests that the development degree of micropores in the DCR reservoir within the NQ Block is relatively similar to that of the SF Block but exhibits a substantial discrepancy compared to the development degree of micropores in the DJ Block, which is potentially attributable to variations in the DCR pore structure [33,34,35].

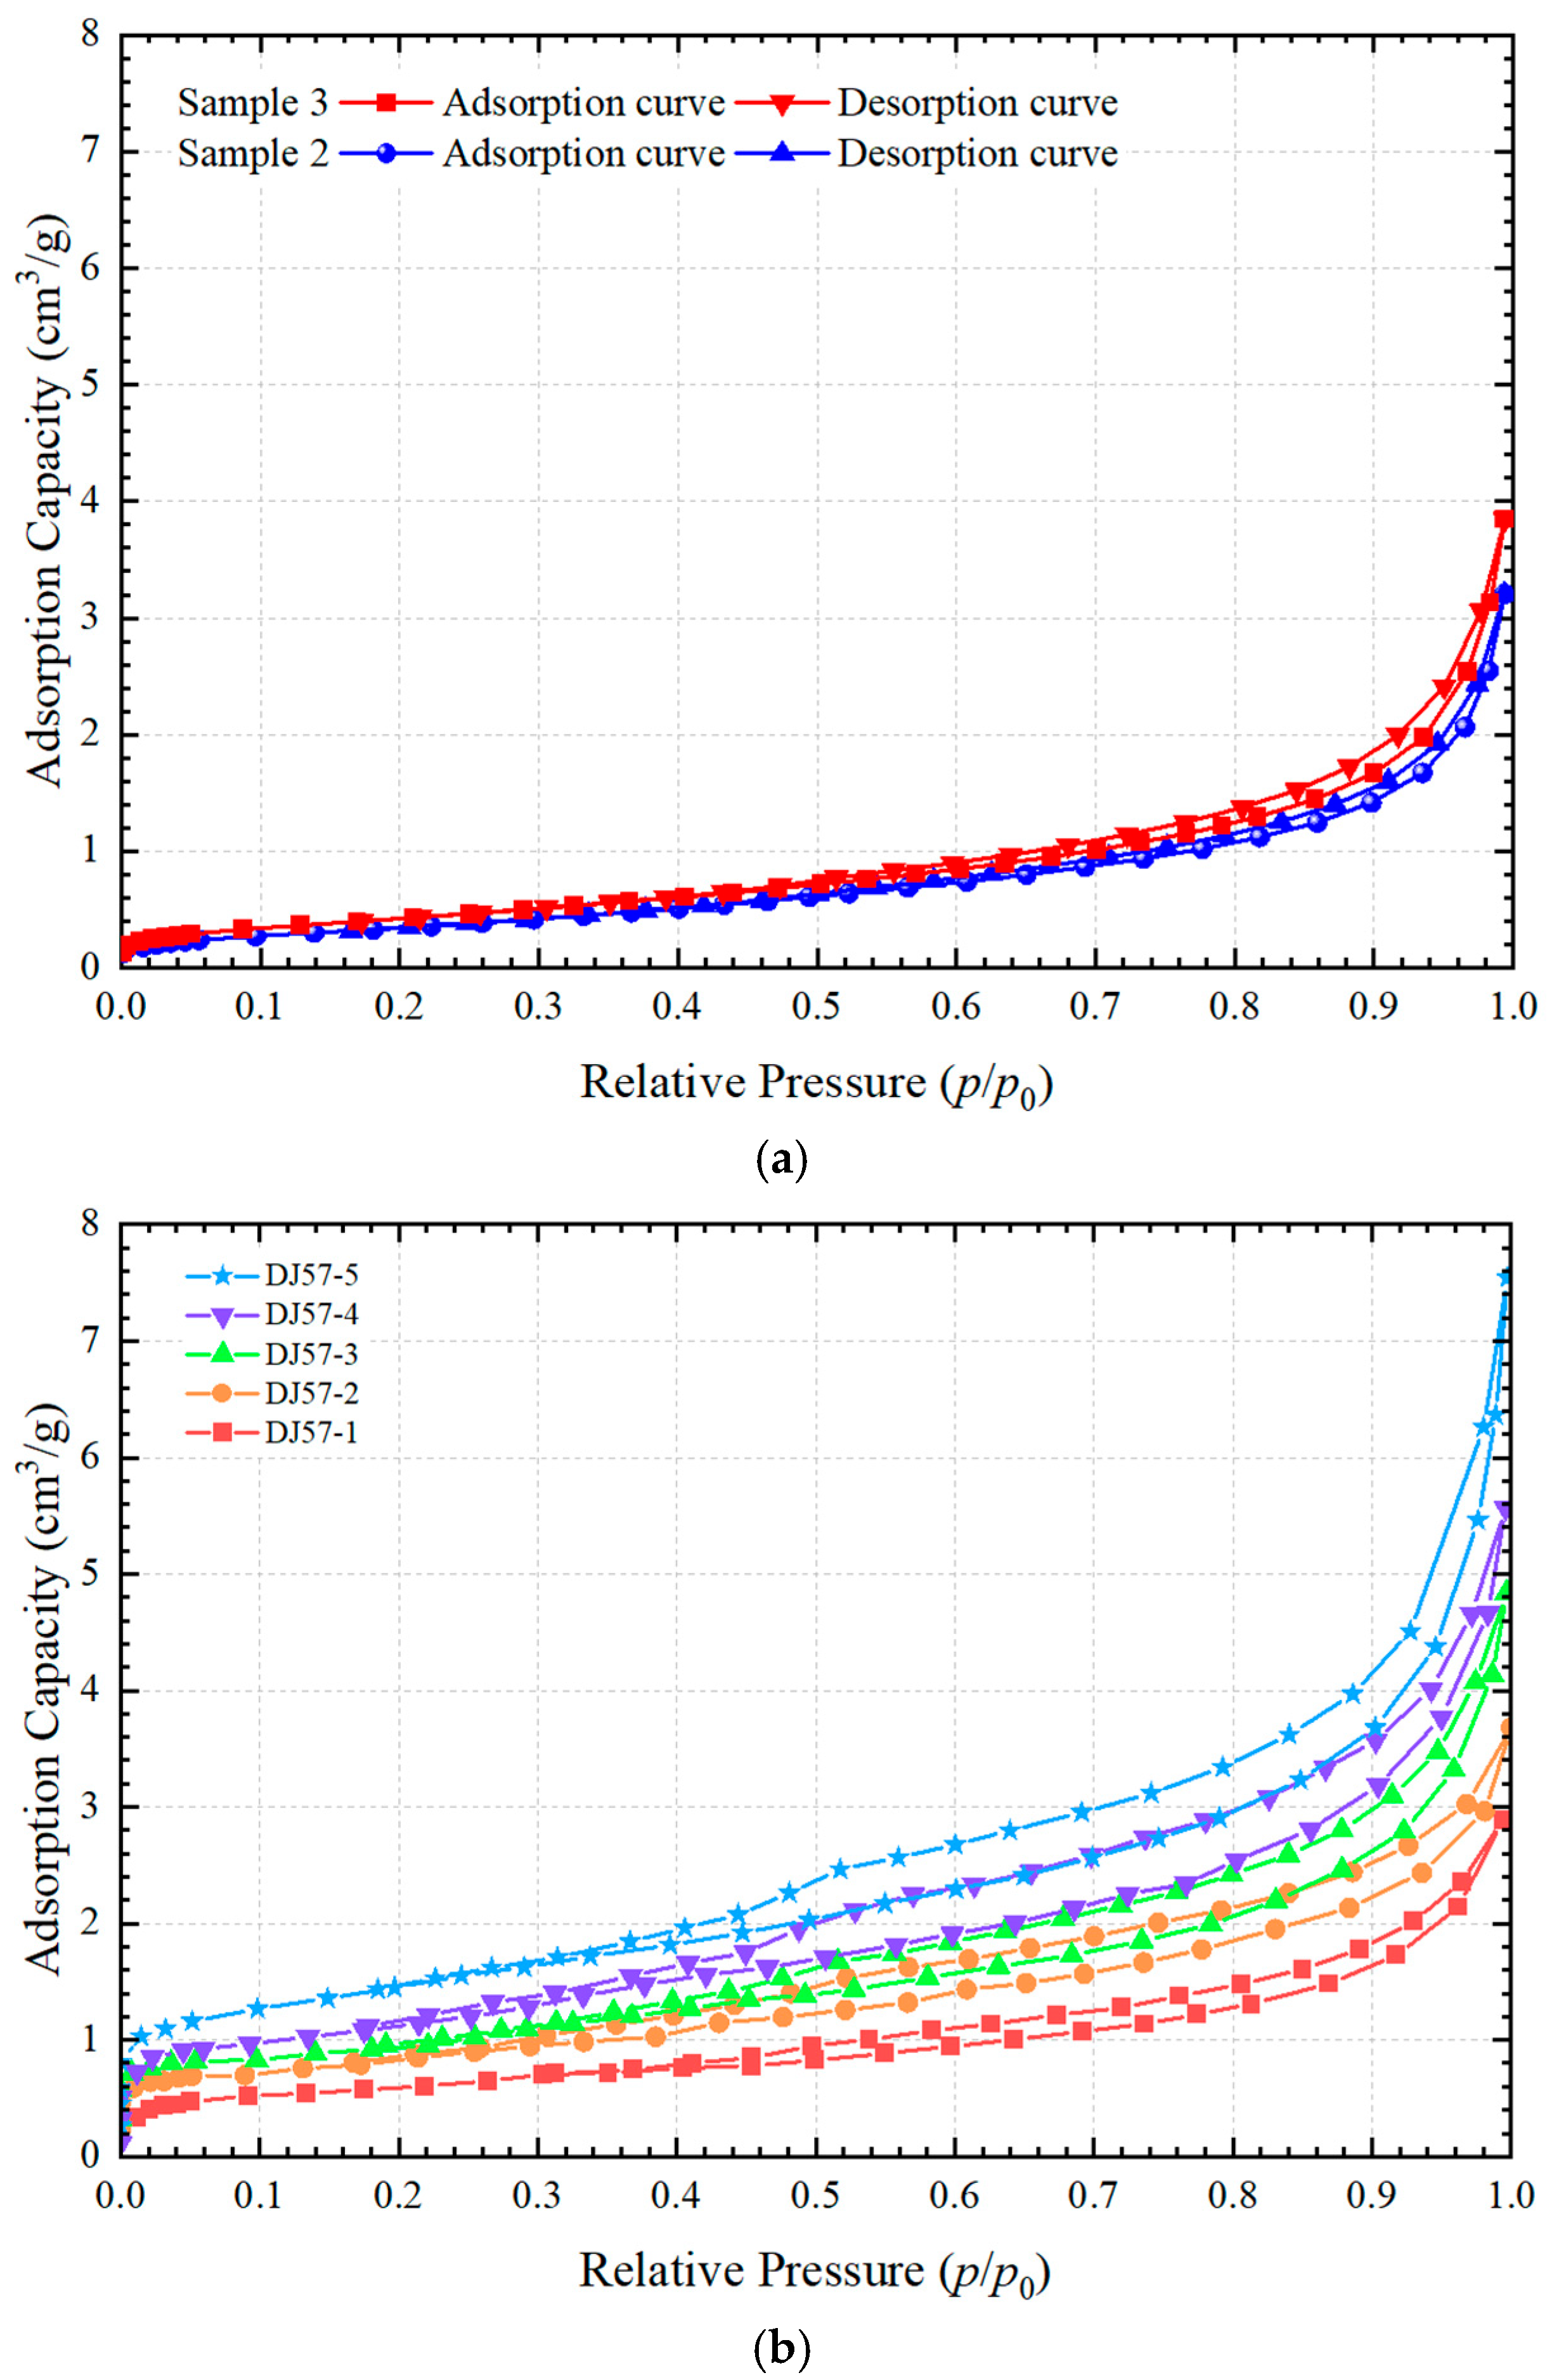
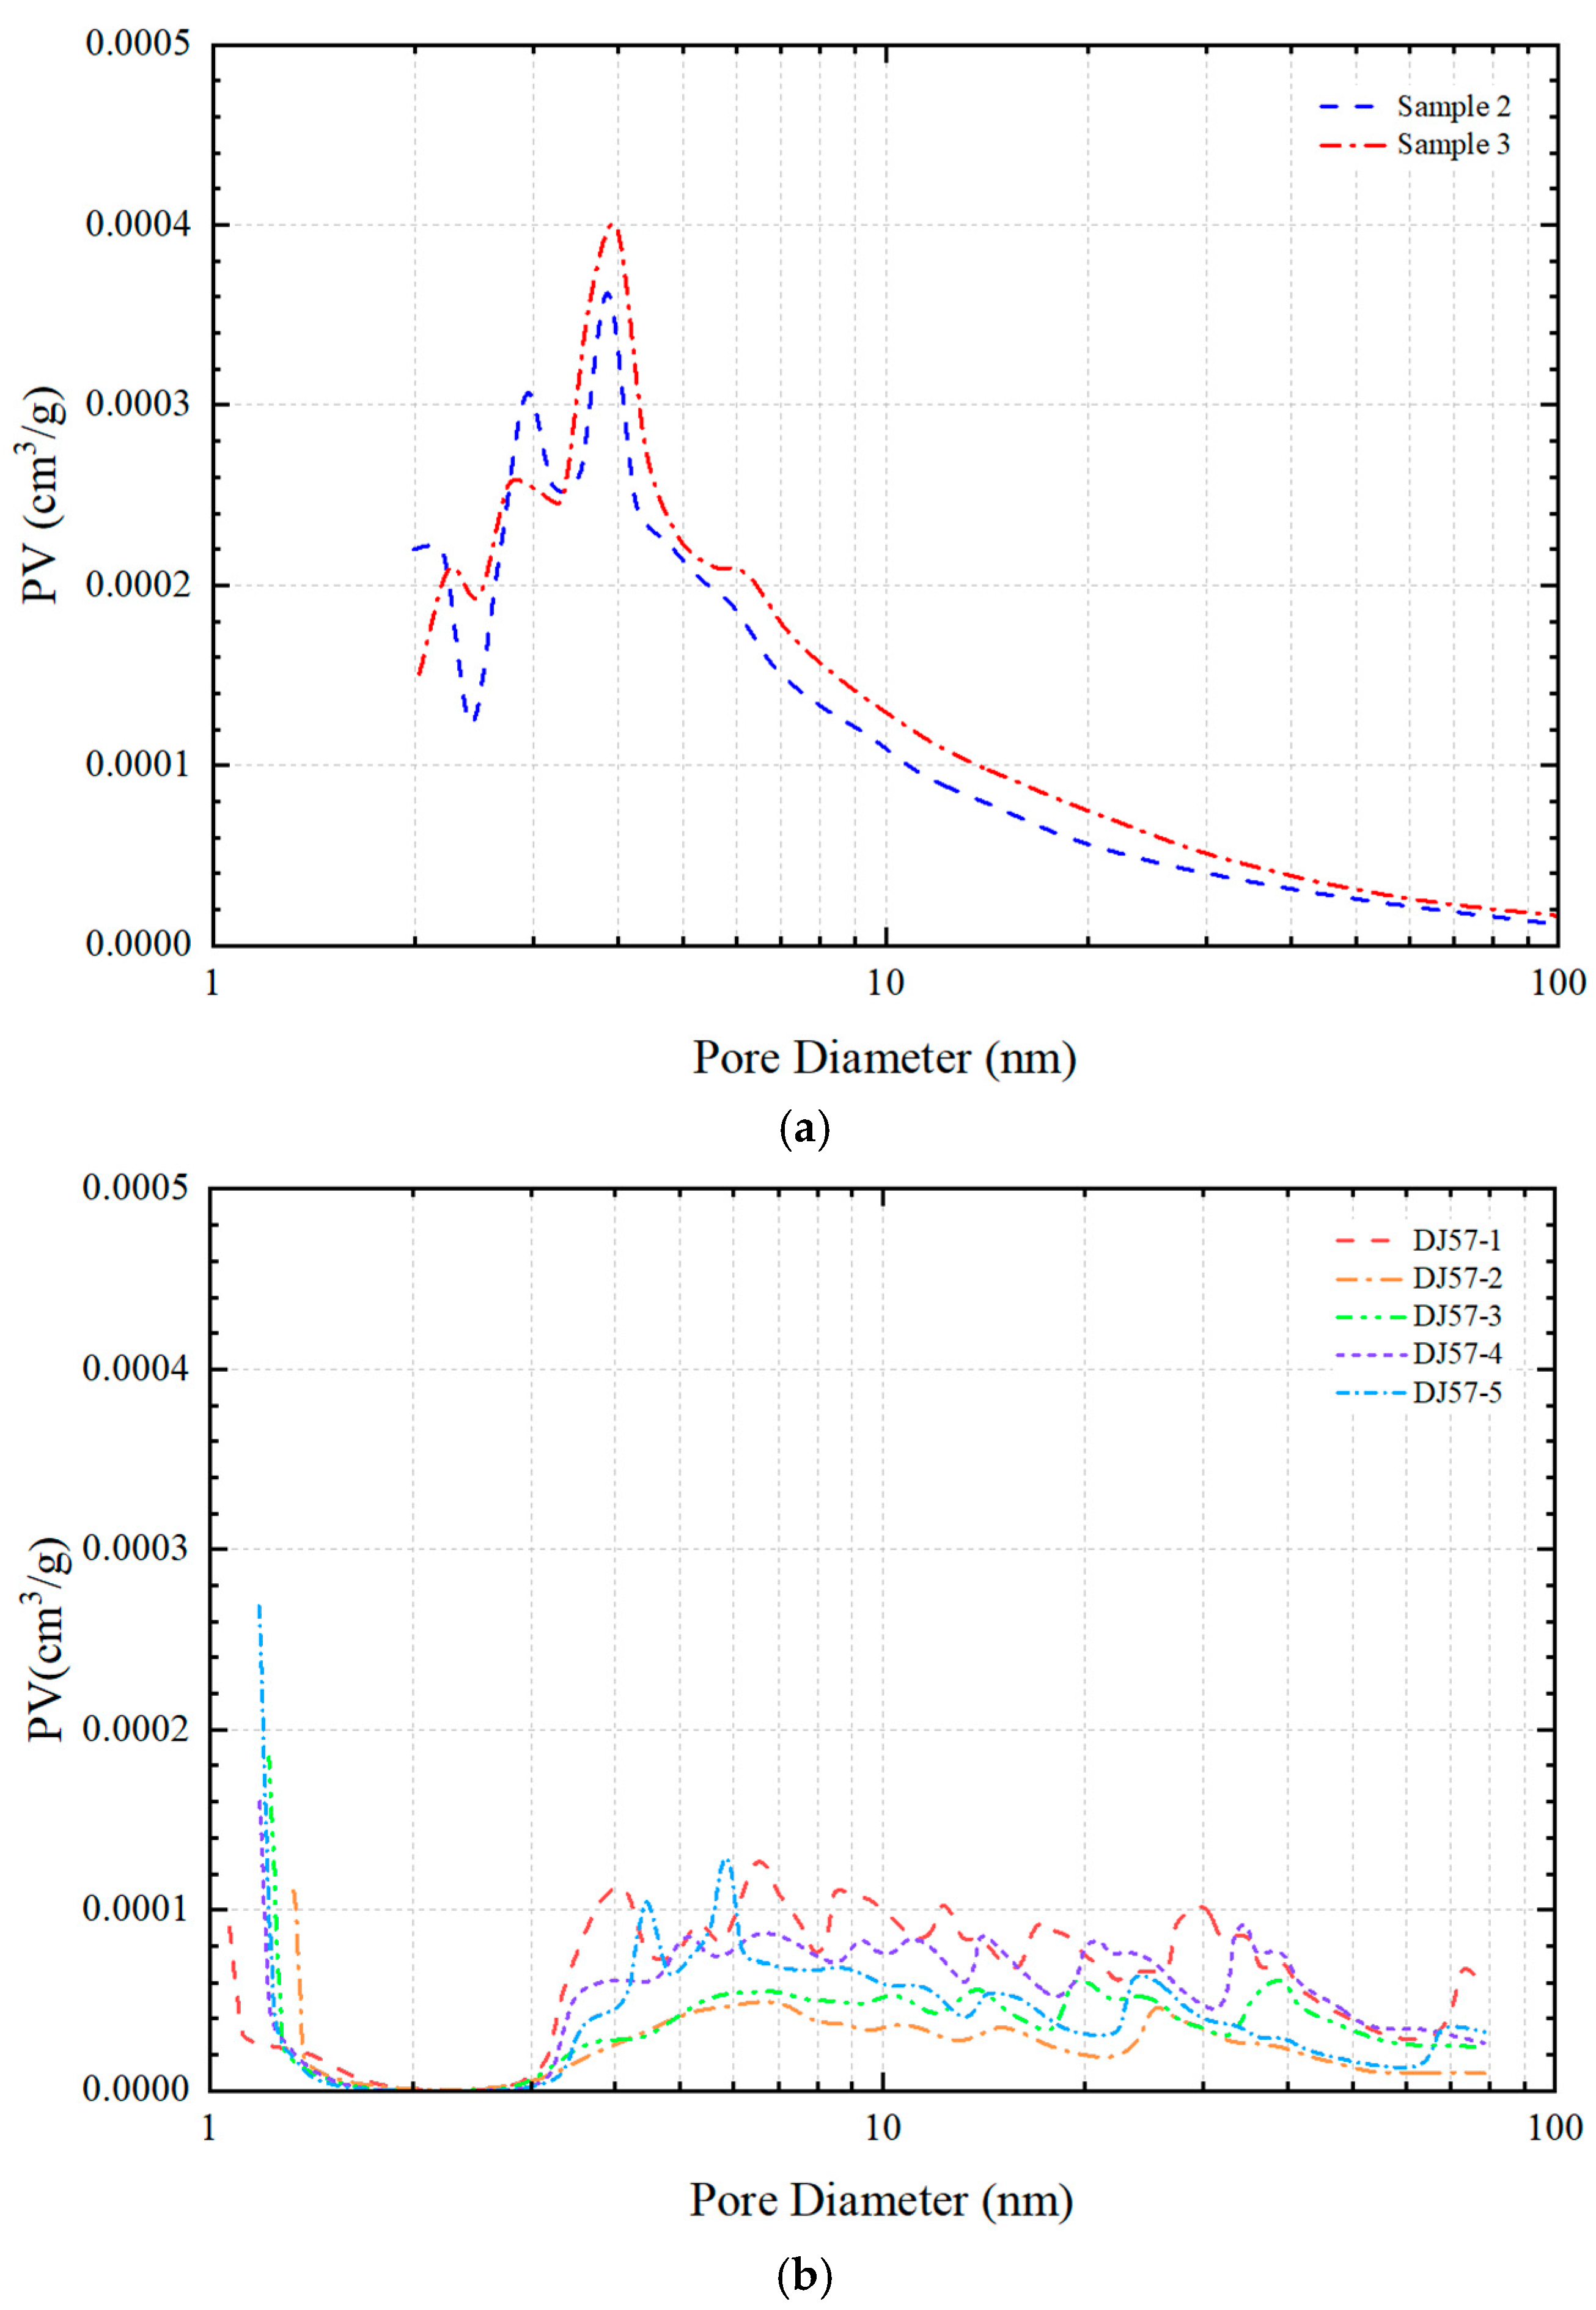
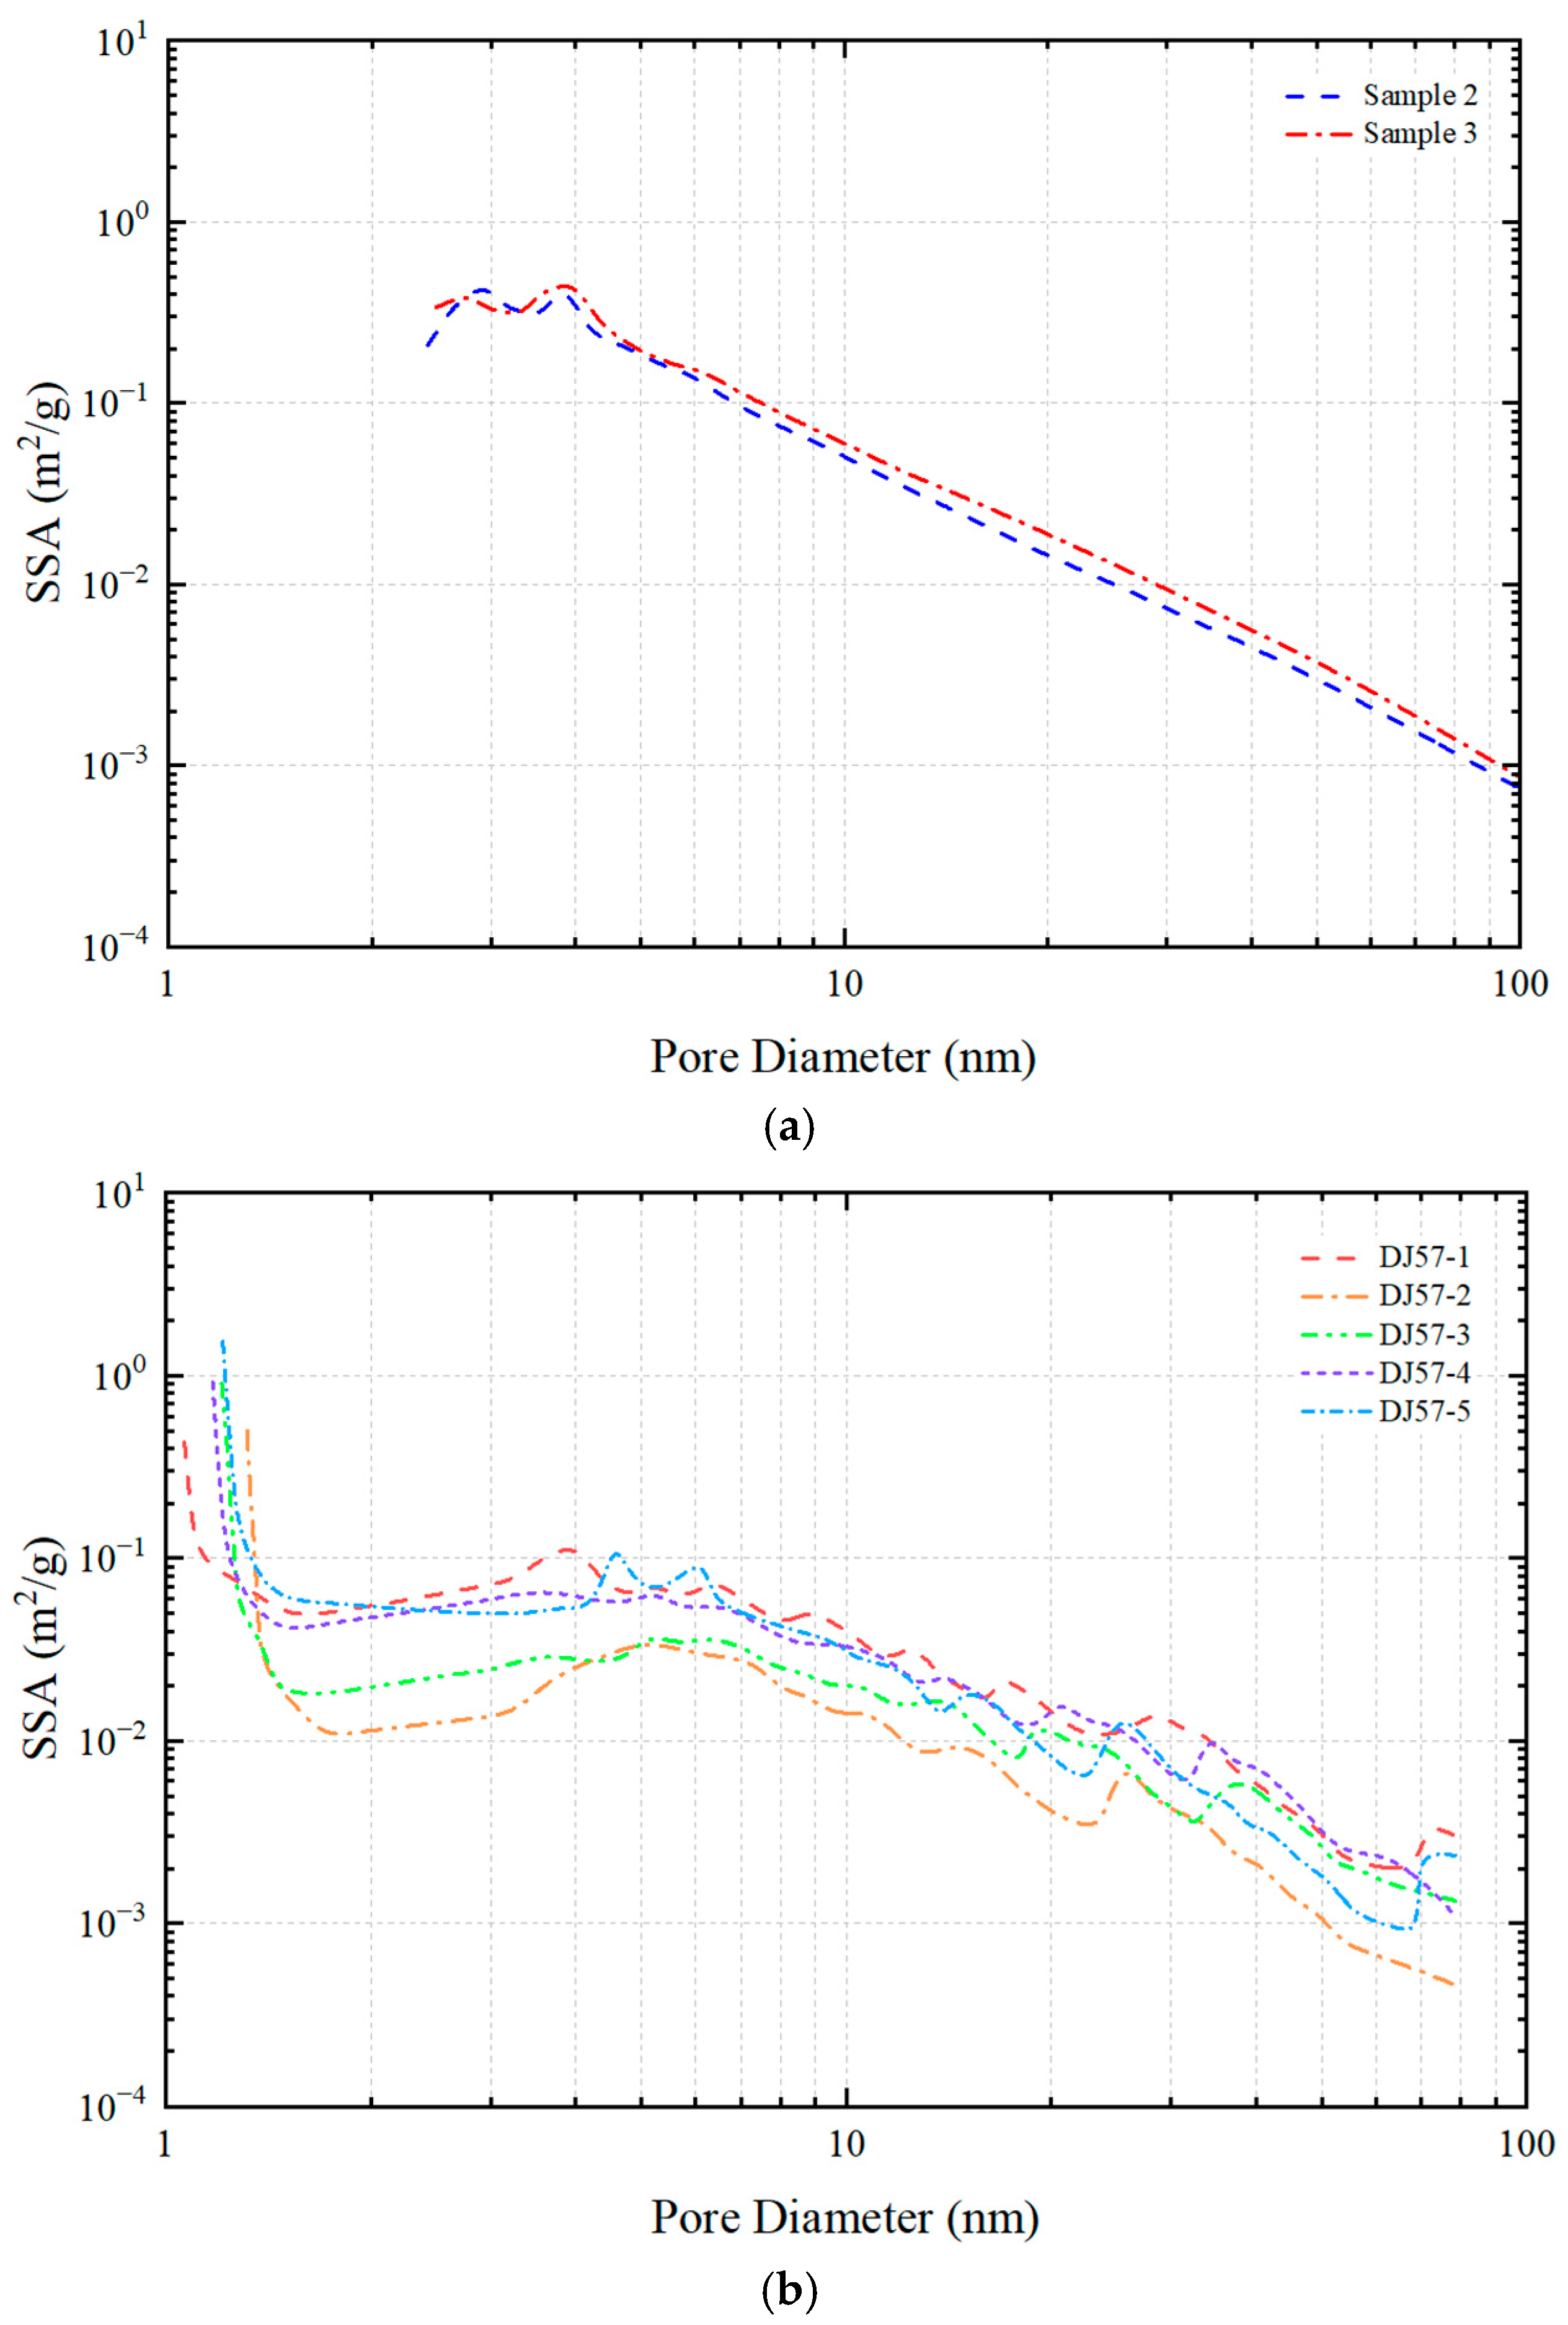
3.3. Mesopore Distribution Characteristics

For the DCR mesopore distribution, the larger the pore size filled by nitrogen during the N2 adsorption test at −196 °C (77 K), the closer the required relative pressure (p/p0) approaches unity. Figure 6a illustrates the isotherms of the adsorption–desorption curves for low-temperature N2 of the DCR samples. As can be seen from Figure 6a, the isotherm of the adsorption curve of the DCR sample exhibits a reverse S shape. In the low-pressure region (0 < p/p0 < 0.2), the increase in adsorption capacity is relatively gradual with the curve slightly convex upward, corresponding to the monolayer adsorption stage of liquid nitrogen on the DCR sample surface. During this phase, the adsorption capacity is predominantly attributed to micropores with a relatively minor contribution from mesopores. In the intermediate pressure region (0.2 < p/p0 < 0.7), the adsorption capacity gradually increases, albeit at a slower rate, indicating that the monolayer adsorption process has been largely completed. The adsorption capacity at this stage is primarily contributed by mesopores with smaller diameters, which corresponds to the multi-layer adsorption stage. In the high-pressure region (0.7 < p/p0 < 1.0), as the pressure increases, the adsorption capacity rises sharply until the relative pressure approaches unity without reaching adsorption saturation, corresponding to the adsorption stage of mesopores with larger diameters.
Notably, the adsorption and desorption curves of each sample do not fully overlap, exhibiting a hysteresis and forming an adsorption loop whose morphology effectively reflects the morphological characteristics of the pores [36]. According to the classification of adsorption loops by the IUPAC [26,33,37], the adsorption loop of the studied samples most closely resembles Type H3 but does not perfectly match it, instead demonstrating characteristics of multiple types of adsorption loops. This suggests that the conical pores in the DCR sample are well-developed and include cylindrical and ink bottle-shaped pores as well, indicating relatively complex pore morphology characteristics, consistent with the results obtained via the SEM observations.
Figure 7a and Figure 8a illustrate the pore distribution characteristics of the DCR samples as determined by N2 adsorption for mesopore analysis. It is evident from Figure 7a and Figure 8a that both Sample #2 and Sample #3 exhibit a unimodal distribution in terms of mesopore PV and SSA, with similar distribution characteristics. The SSA of Sample #2 ranges from 0.0073 to 0.4188 m2/g with a total PV of 0.004 cm3/g and an SSA of 3.337 m2/g, and the main peak range is distributed between 2.42 and 9.39 nm. For Sample #3, the SSA ranges from 0.0080 to 0.4235 m2/g with a total PV of 0.004 cm3/g and an SSA of 3.553 m2/g, and the main peak range is distributed between 2.03 and 9.97 nm. It is worth noting that both the PV and SSA of the mesopores are smaller than those of the micropores, indicating that the development of the mesopores is significantly less advanced compared to that of the micropores.
Figure 6b plots the isotherms of the adsorption–desorption curves for the low-temperature N2 of the DCR samples from the DJ Block in the eastern part of the Basin. It can be observed from Figure 6b that, when p/p0 > 0.5, the adsorption and desorption branches of N2 do not overlap, resulting in a hysteresis loop. The adsorption and desorption curves of the coal samples in the DJ Block become significantly steep as p/p0 approaches 1. When p/p0 < 0.5, the desorption and adsorption branches tend to coincide, leading to a relatively narrow hysteresis loop between them. This type of curve resembles Type H3 proposed by the IUPAC and also exhibits characteristics of Type H4 [36]. These features are highly similar to those presented by the N2 adsorption–desorption isotherms of coal samples in the NQ Block, suggesting a relatively high development level of nanoscale pores in the DCR samples.
Figure 7b and Figure 8b depict the distribution curves of the PV and SSA for the mesopores per unit mass in the DCR samples from the DJ Block in the eastern part of the Basin, while Table 3 details the SSA and total PV of the mesopores in both the NQ Block and the eastern part. As depicted in Figure 7b and Figure 8b, with an increase in pore diameter, its mesopore volume remains relatively stable, indicating a limited number of pores with large diameters. When the pore diameter ranges between 2 and 10 nm, the SSA exhibits a stable trend; however, when the pore diameter exceeds 10 nm, the SSA demonstrates a pronounced downward trend, consistent with the behavior observed in the NQ Block. From Table 3, it is evident that the SSA and PV of the mesopores per unit mass of DCR in the NQ Block are 3.445 m2/g and 0.004 cm3/g, respectively. These values align closely with those of the SF Block and DJ Block in the eastern part of the Basin in terms of PV. Nevertheless, the SSA of the mesopores per unit mass of coal in the SF Block and DJ Block are measured to be 0.596 m2/g and 1.869 m2/g, respectively, which differ significantly from that of the mesopores in the NQ Block. Although the PVs per unit mass in the NQ Block and the eastern blocks of the Basin are comparable, a significant disparity in SSA is observed, i.e., a higher SSA suggests a rougher mesopore surface (Figure 8a), thereby impeding gas flow.

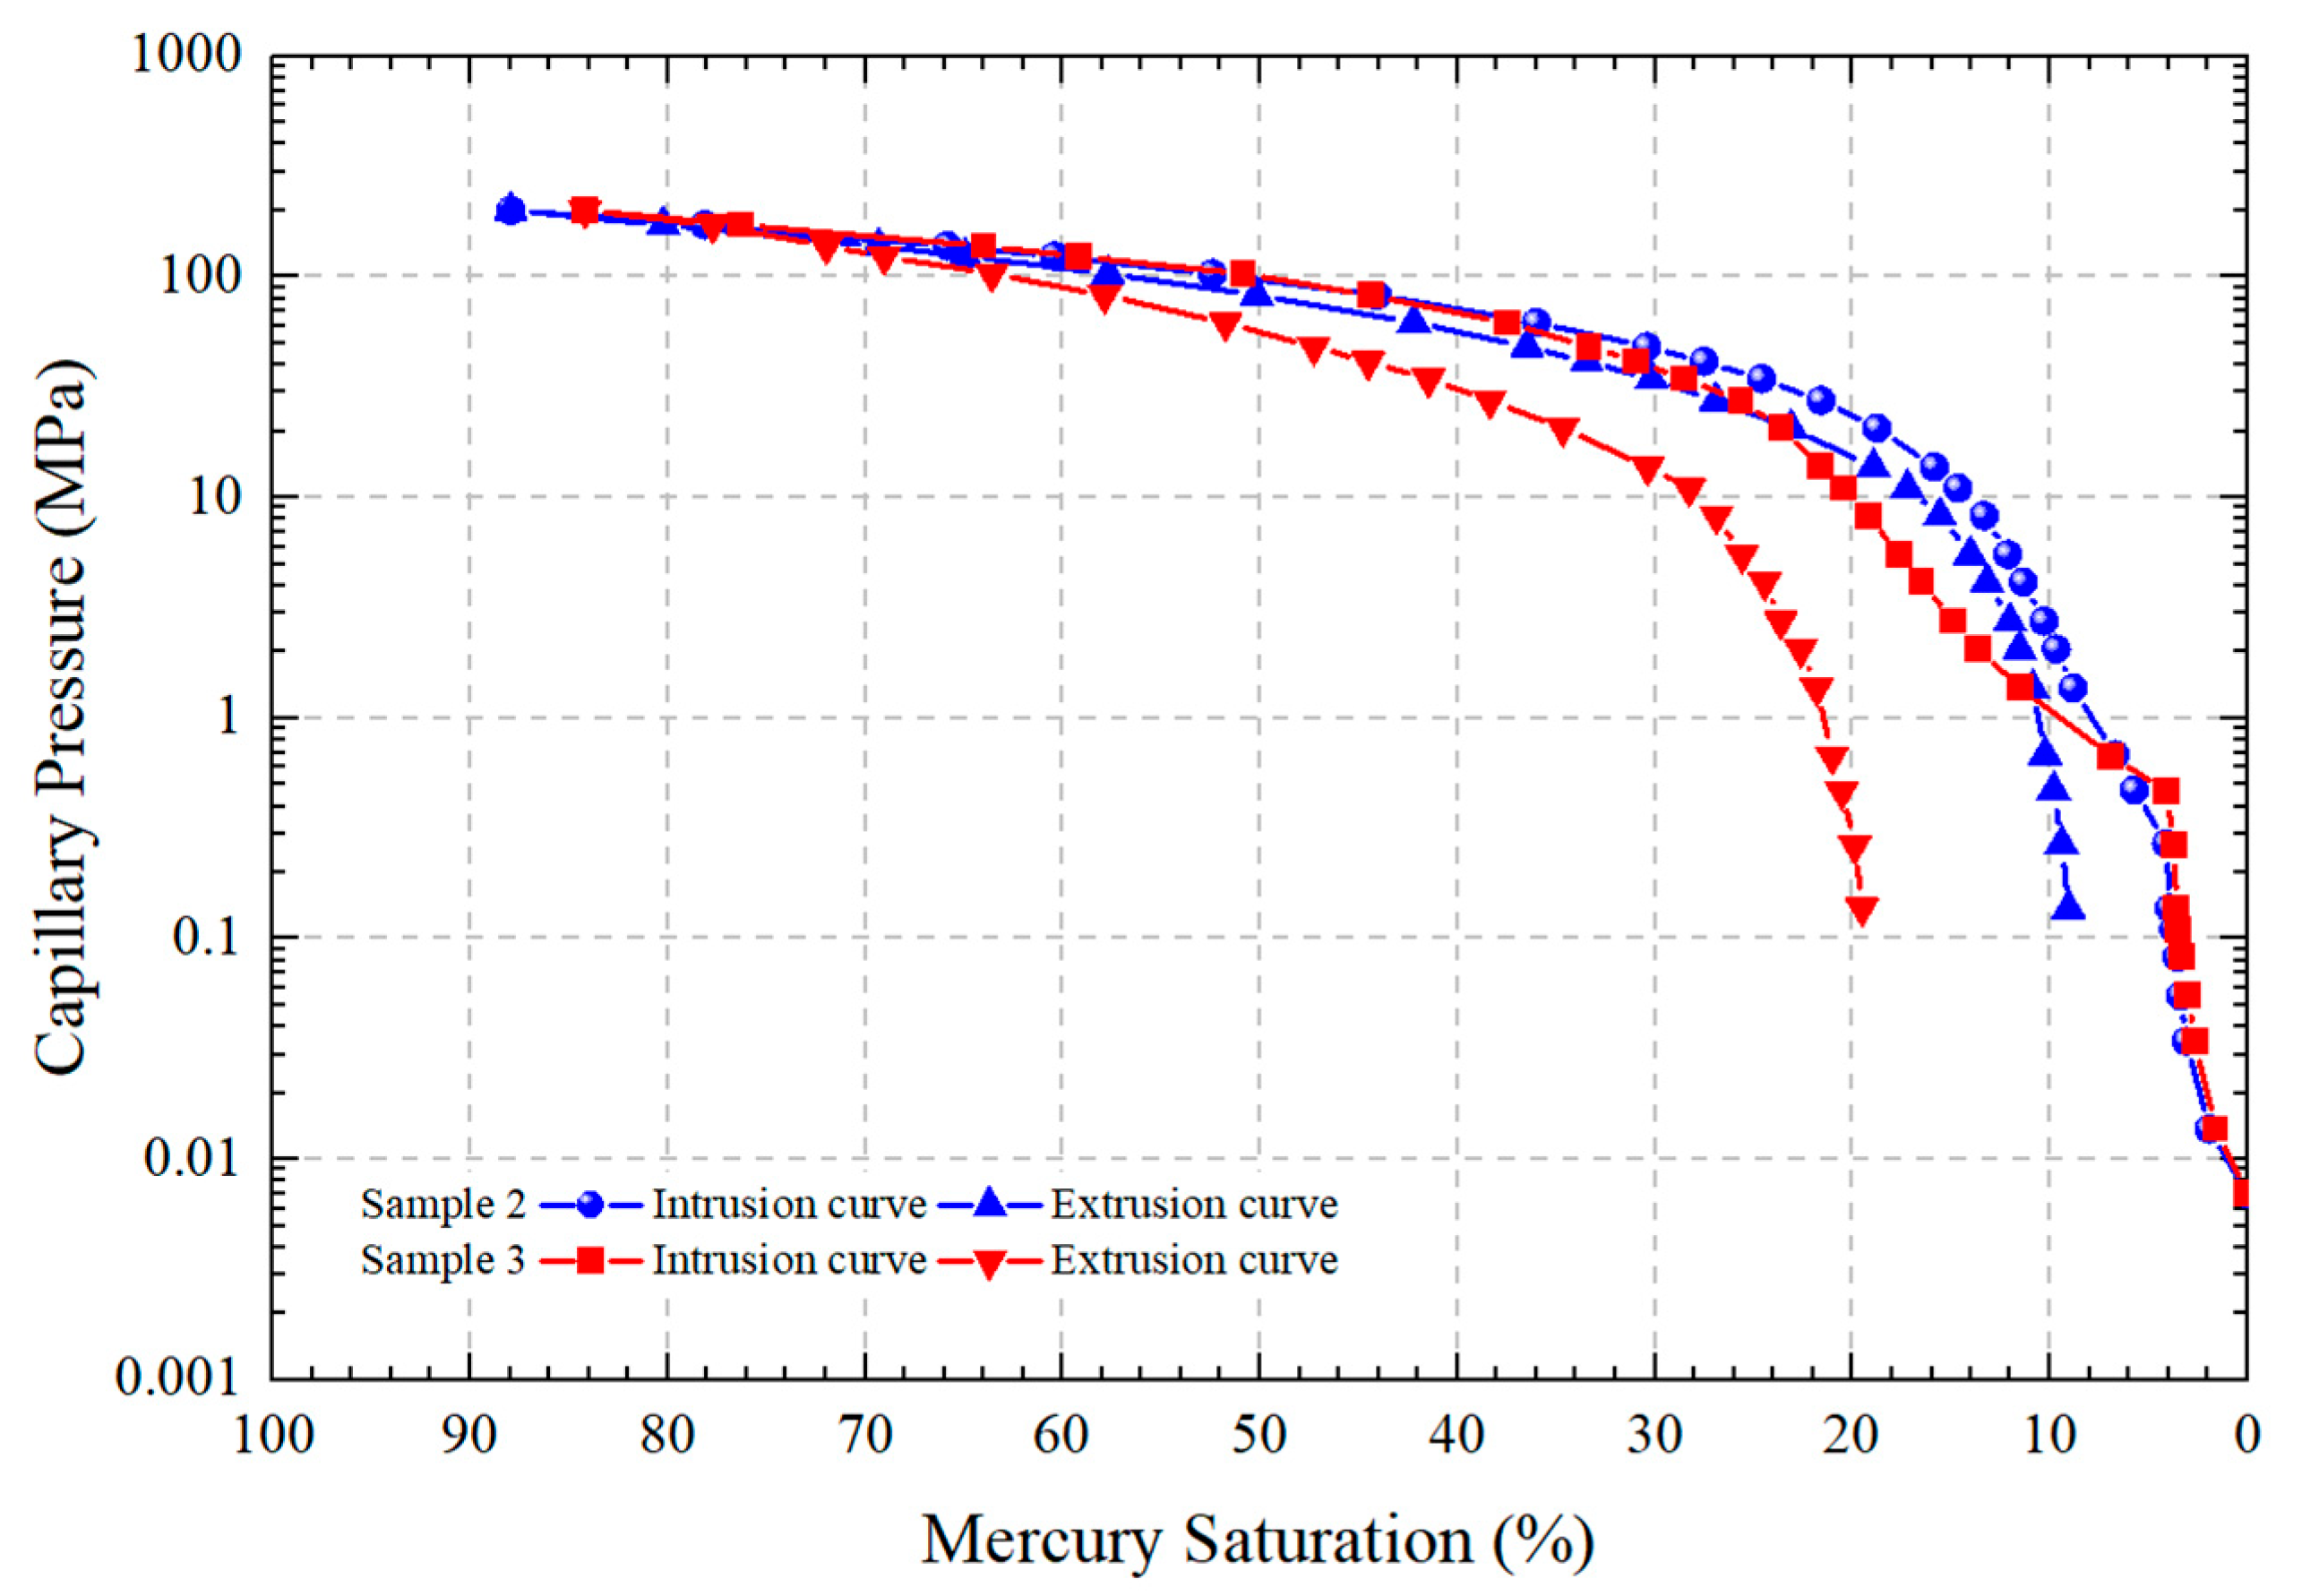
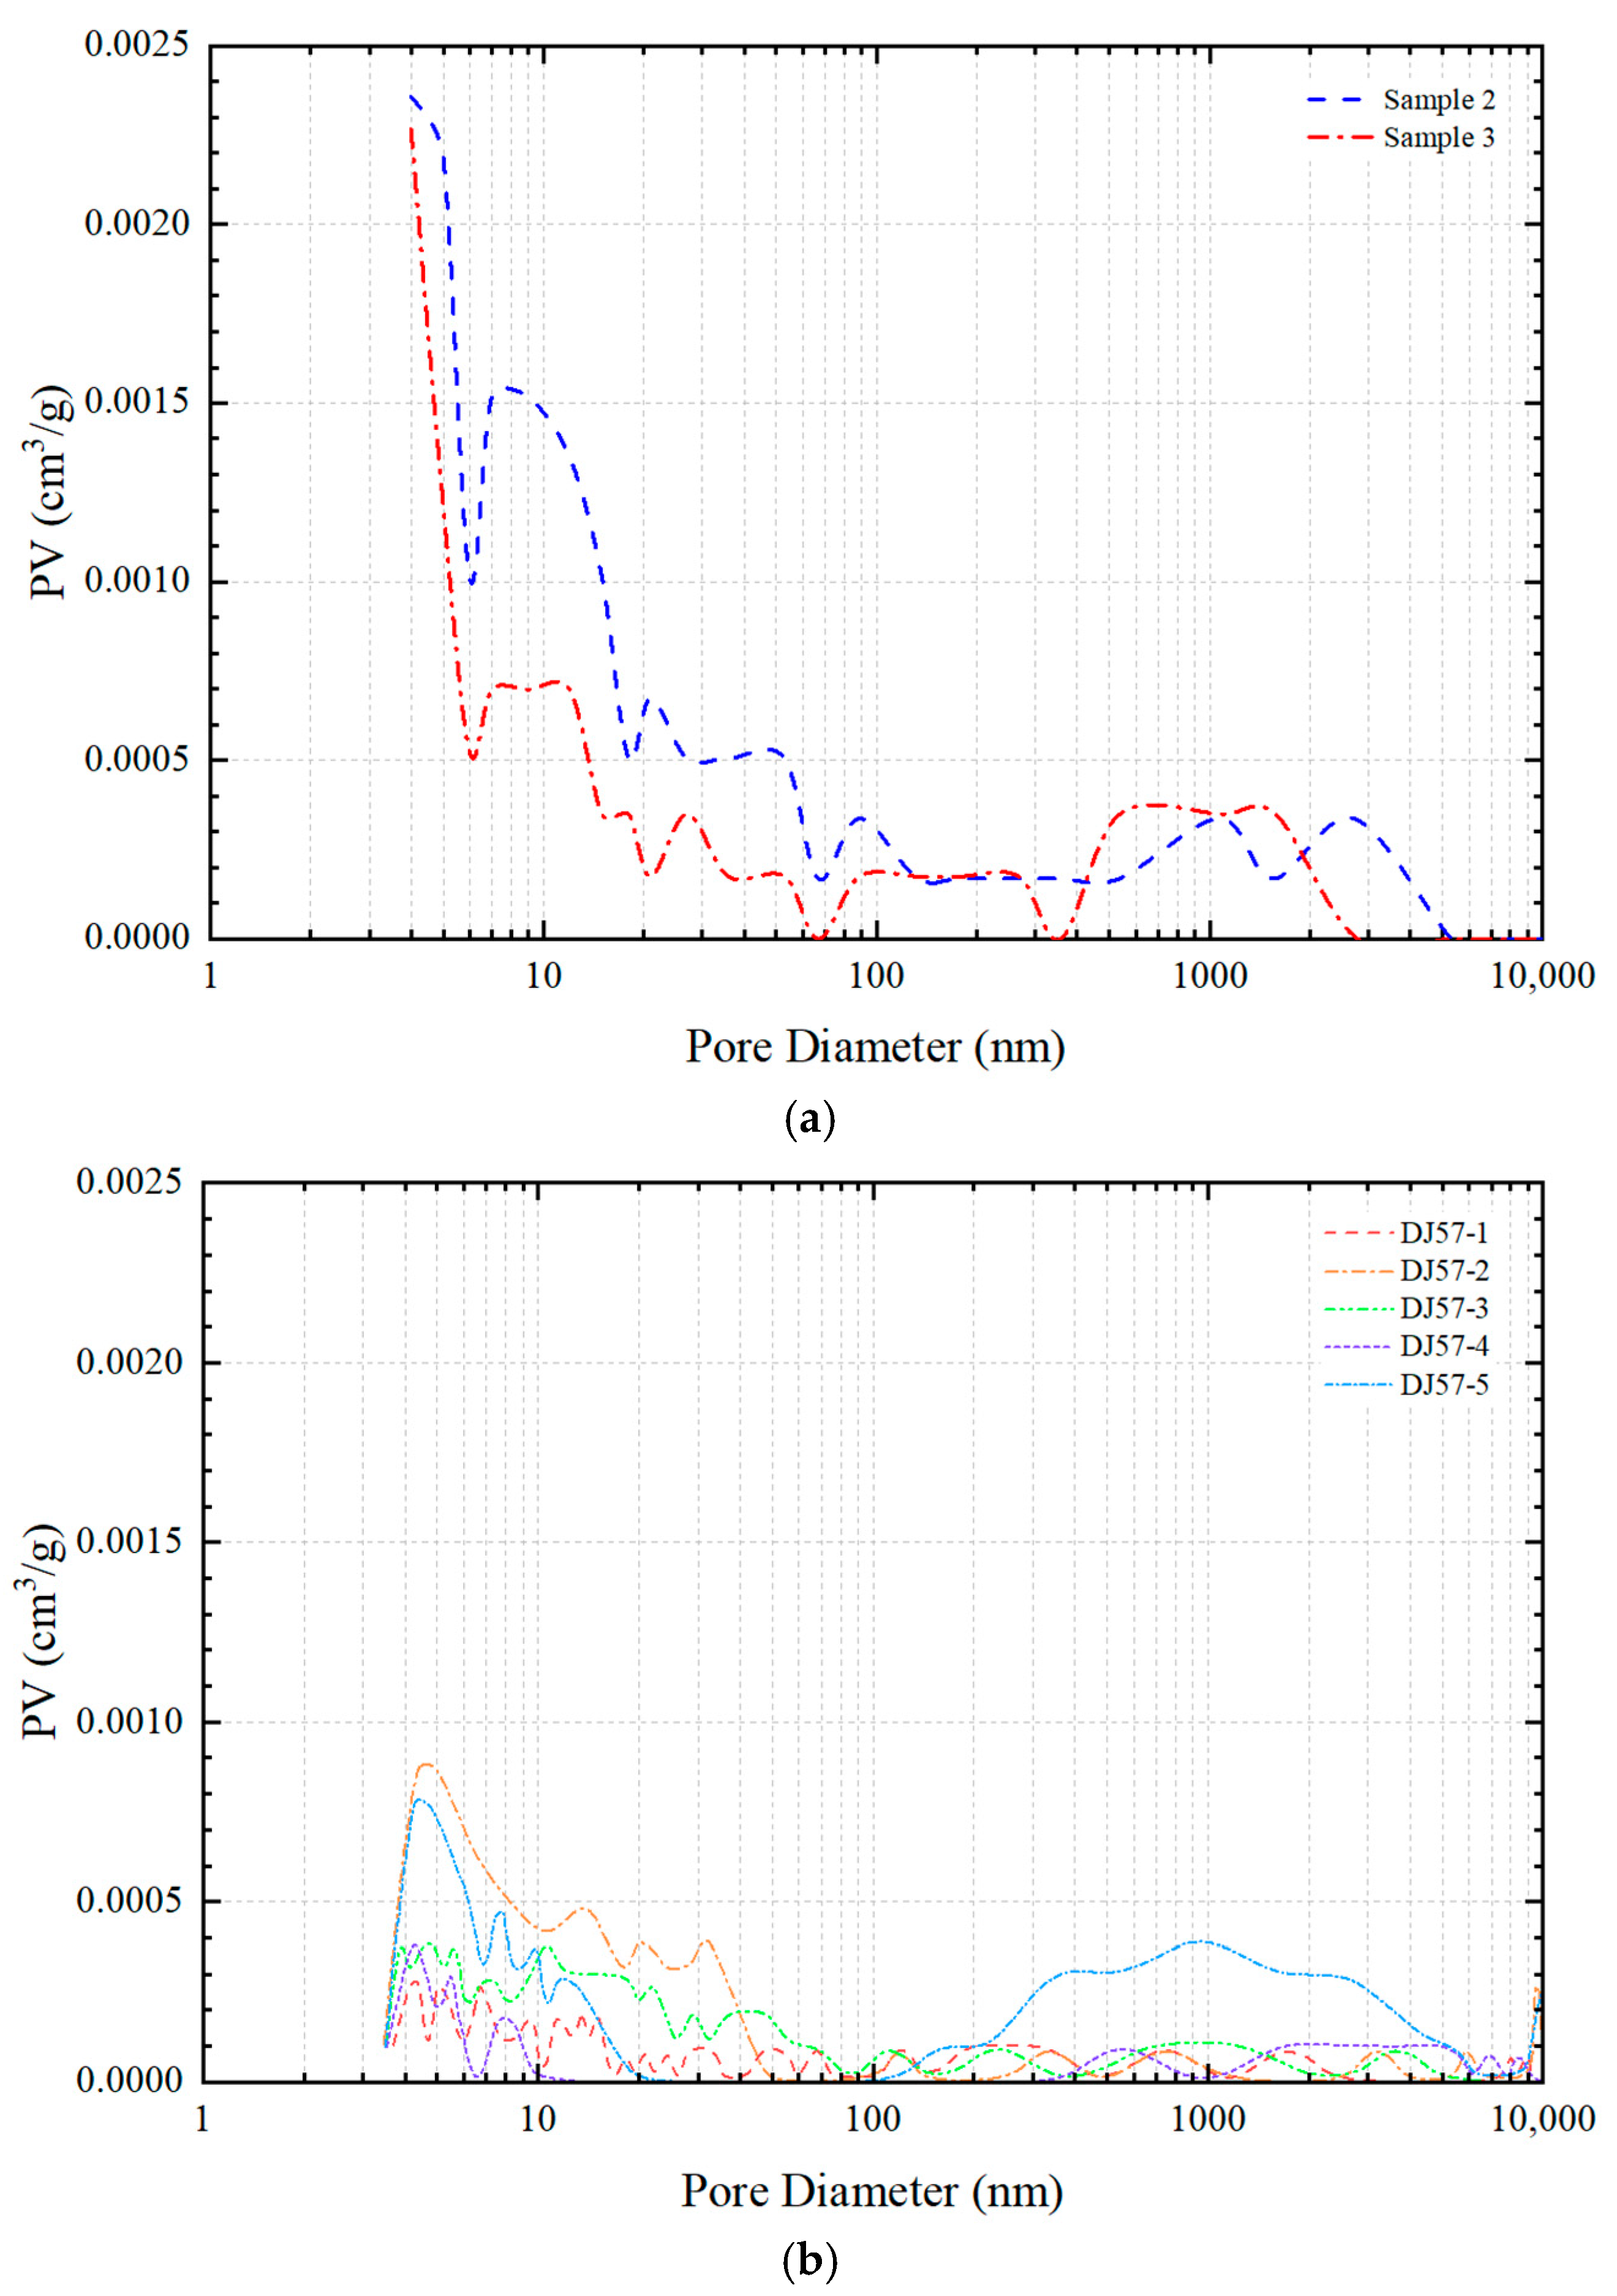
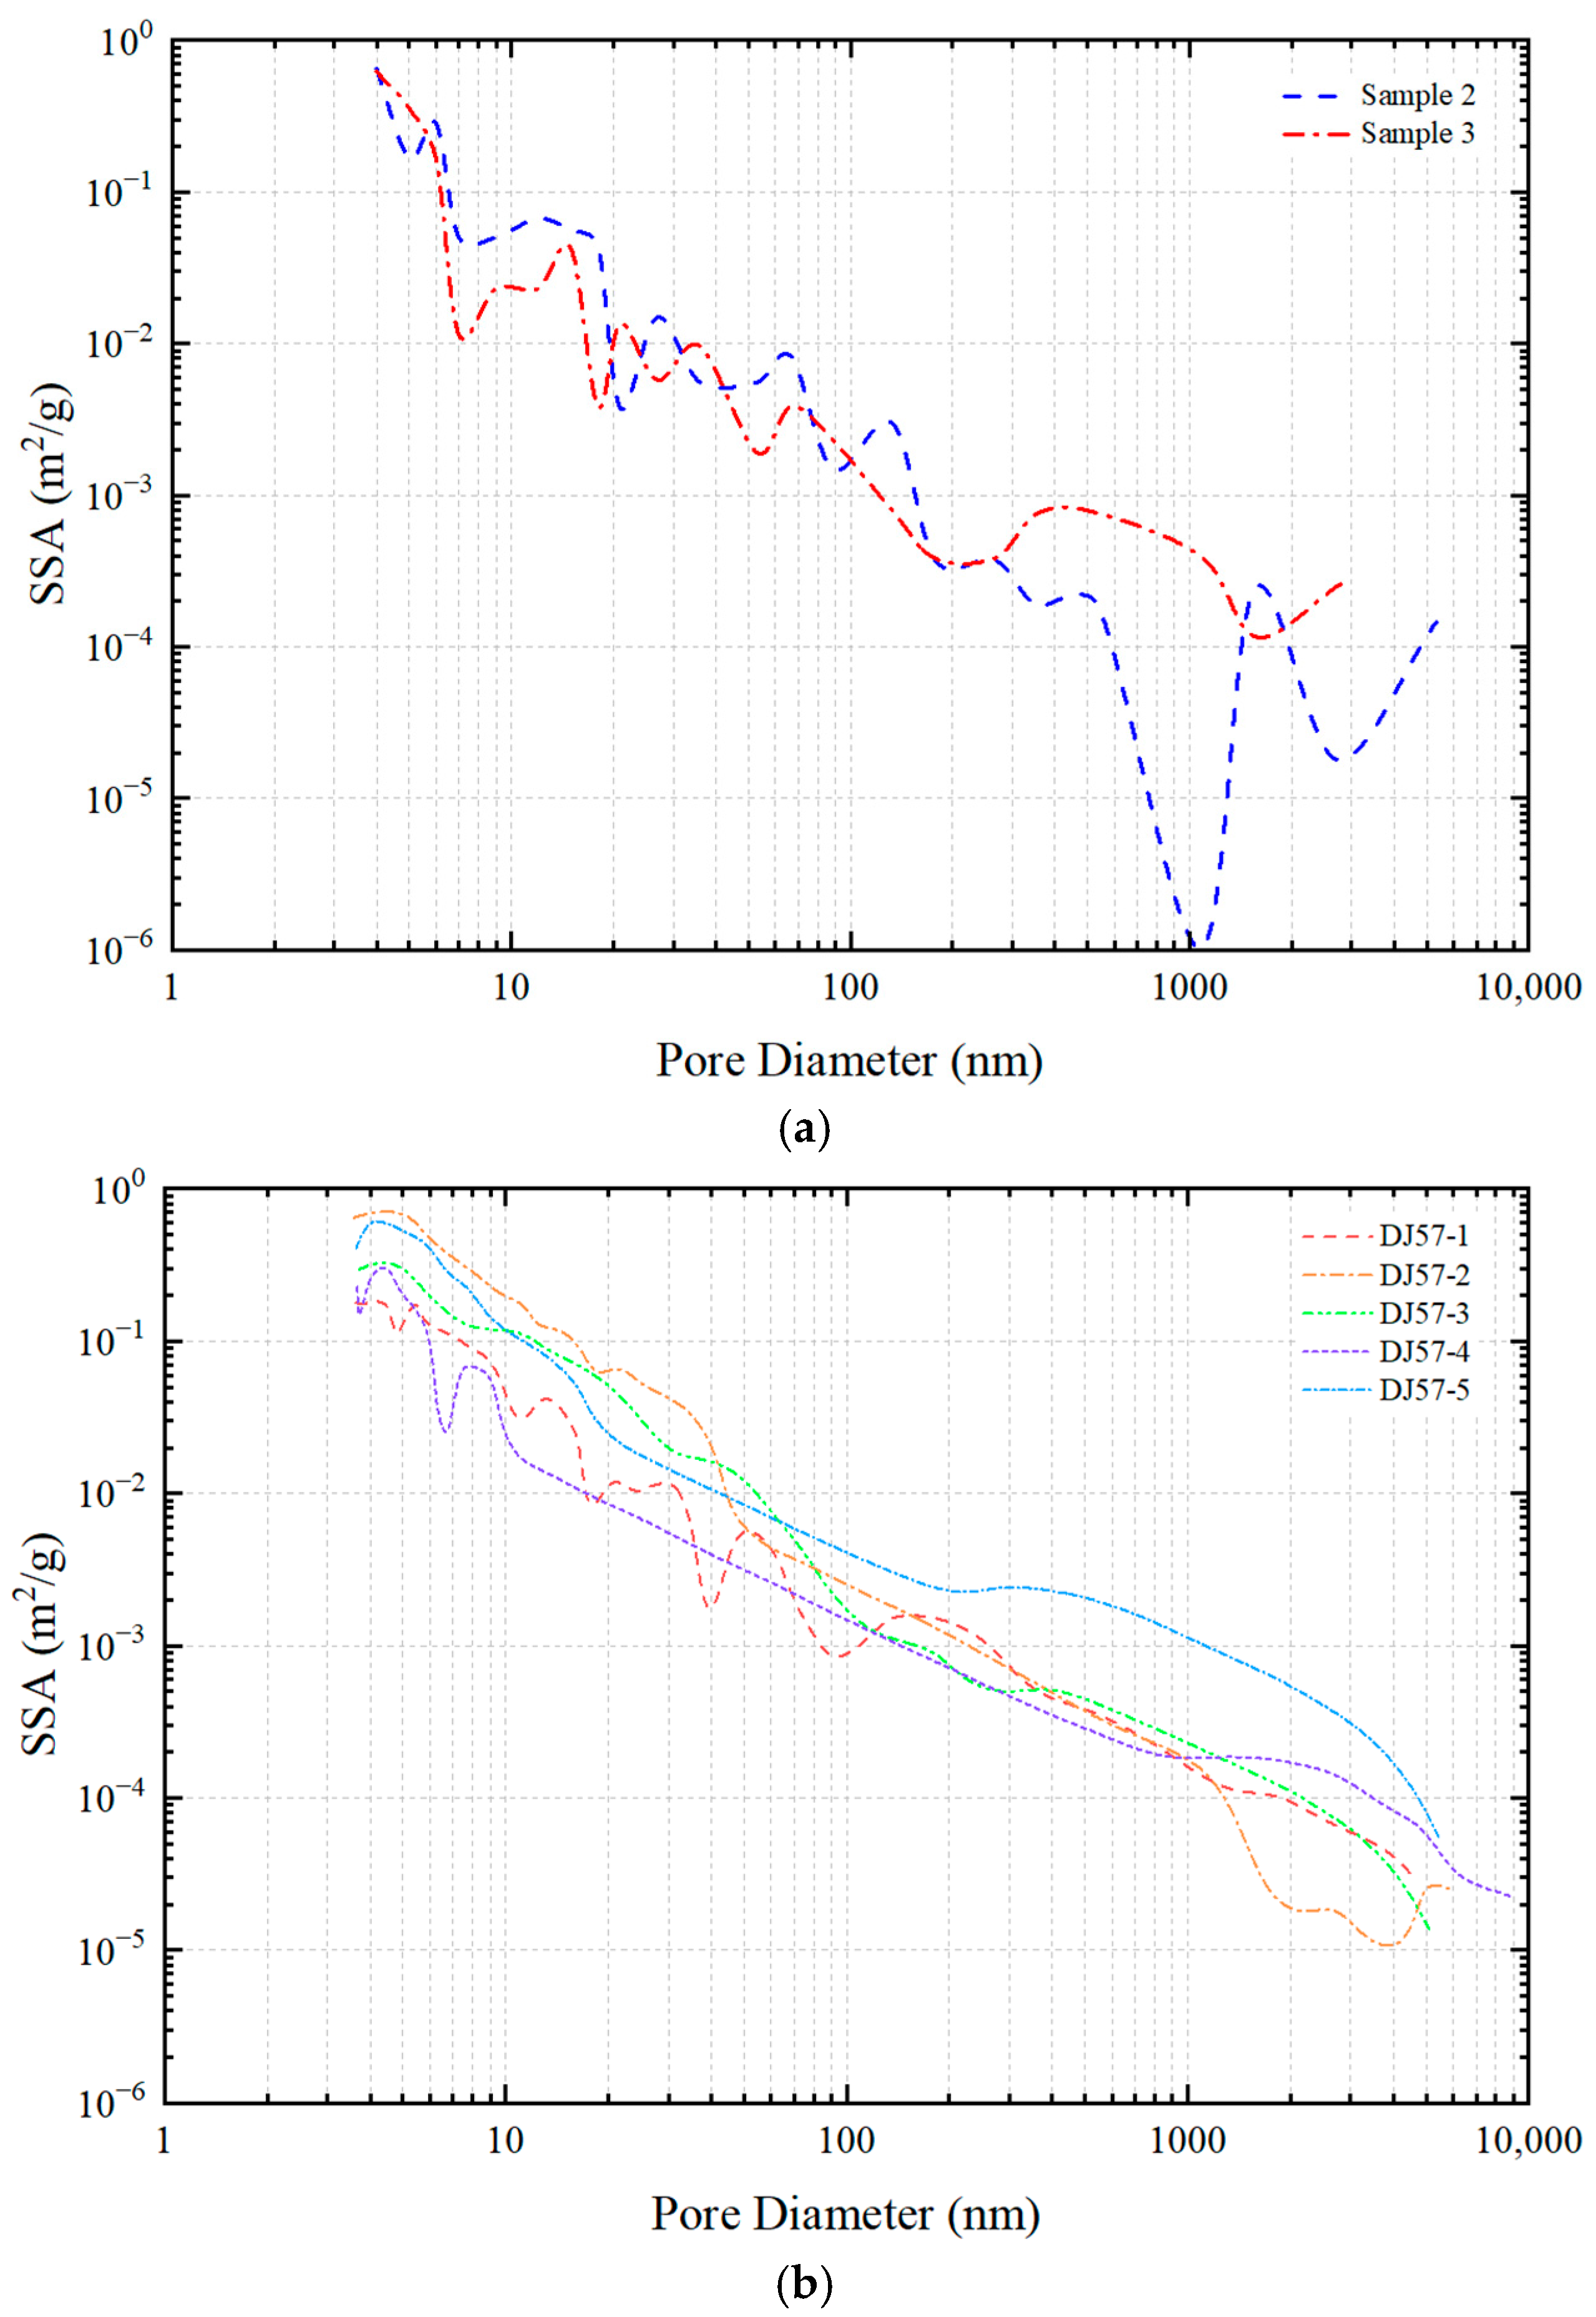
3.4. Macropore Distribution Characteristics

Capillary pressure curves, including intrusion and extrusion curves for two DCR samples during the HPMI experiments, are plotted in Figure 9, with the corresponding petrophysical parameters enumerated in Table 4. As can be seen from Figure 9, significant variations in capillary pressure curves are observed among different coal samples. The threshold pressures (i.e., the pressure at which mercury initially infiltrates the samples) for Sample #2 and Sample #3 are found to be 0.27 MPa and 0.47 MPa, respectively, suggesting that the macropore distributions of these two samples are relatively similar. As capillary pressure increases, the mercury saturation in the samples progressively rises. When the injection pressure reaches 200.32 MPa, the maximum mercury injection saturations for Sample #2 and Sample #3 are determined to be 87.9% and 84.2%, respectively. The mercury extrusion efficiencies for the two samples are 89.7% and 76.8%, respectively, indicating a notable disparity. Such a significant difference in mercury extrusion efficiency implies that the pore–throat structure is complex and heterogeneous [38].
The sample sorting coefficient (Sp) and the homogeneity coefficient (α) serve as effective indicators for characterizing the pore structure features of the samples, and a value closer to 1.0 signifies superior sorting of pores/throats and a higher uniformity [26]. As shown in Table 4, the sorting coefficients for Sample #2 and Sample #3 are 2.245 and 2.674, respectively, while their corresponding homogeneity coefficients are 0.095 and 0.156. The relatively high sorting coefficients and low homogeneity coefficients collectively indicate a poor sorting efficiency and pronounced structural heterogeneity, thus confirming the complex pore structures within the studied samples.
Figure 10a and Figure 11a show the pore distribution characteristics of the DCR samples as determined by HPMI experiments for macropores analysis. As shown in Figure 11a and Figure 10a, the SSA and PV per unit mass of Sample #2 are distributed within the ranges of 0.0002–0.0082 m2/g and 0.0002–0.0005 cm3/g, respectively, with their total SSA and PV of 0.020 m2/g and 0.003 cm3/g, respectively. The SSA and PV per unit mass of Sample #3 are distributed within the ranges of 0.0001–0.0038 m2/g and 0.0014–0.0220 cm3/g, respectively, with their total SSA and PV of 0.012 m2/g and 0.001 cm3/g, respectively. Furthermore, when the pore diameter exceeds 20 nm, approximately 60% of the mercury saturation begins to exhibit significant permeation. As the pore diameter decreases, the mercury injection saturation increases gradually, with a peak in mercury injection volume observed within the range of pore diameters less than 20 nm. This indicates that nanoscale pores are predominantly developed in the coal rock within the NQ Block.
Figure 10b and Figure 11b present the distribution curves of the PV and SSA for the macropores per unit mass of the DCR samples from the DJ Block in the eastern part of the Basin, while Table 3 tabulates the SSA and total PV of the macropores in both the NQ Block and the eastern part. As can be seen from Figure 10b and Figure 11b, the PV change trend of the macropores in the DJ Block located in the eastern part of the Basin exhibits relative stability. Meanwhile, the SSA gradually decreases as the pore diameter increases. When the pore diameter exceeds 30 nm, approximately 80% of the mercury saturation begins to increase significantly. With a decrease in pore diameter, mercury injection saturation progressively increases, reaching a peak within the pore diameter range of less than 30 nm. As shown in Table 3, the SSA and PV of the macropores per unit mass of the DCR samples in the NQ Block are 0.016 m2/g and 0.002 cm3/g, respectively. In contrast, the SSA and PV of the macropores per unit mass of the DCR samples in the DJ Block are 0.012 m2/g and 0.001 cm3/g, respectively, which align closely with the distribution characteristics of the macropores in the NQ Block.

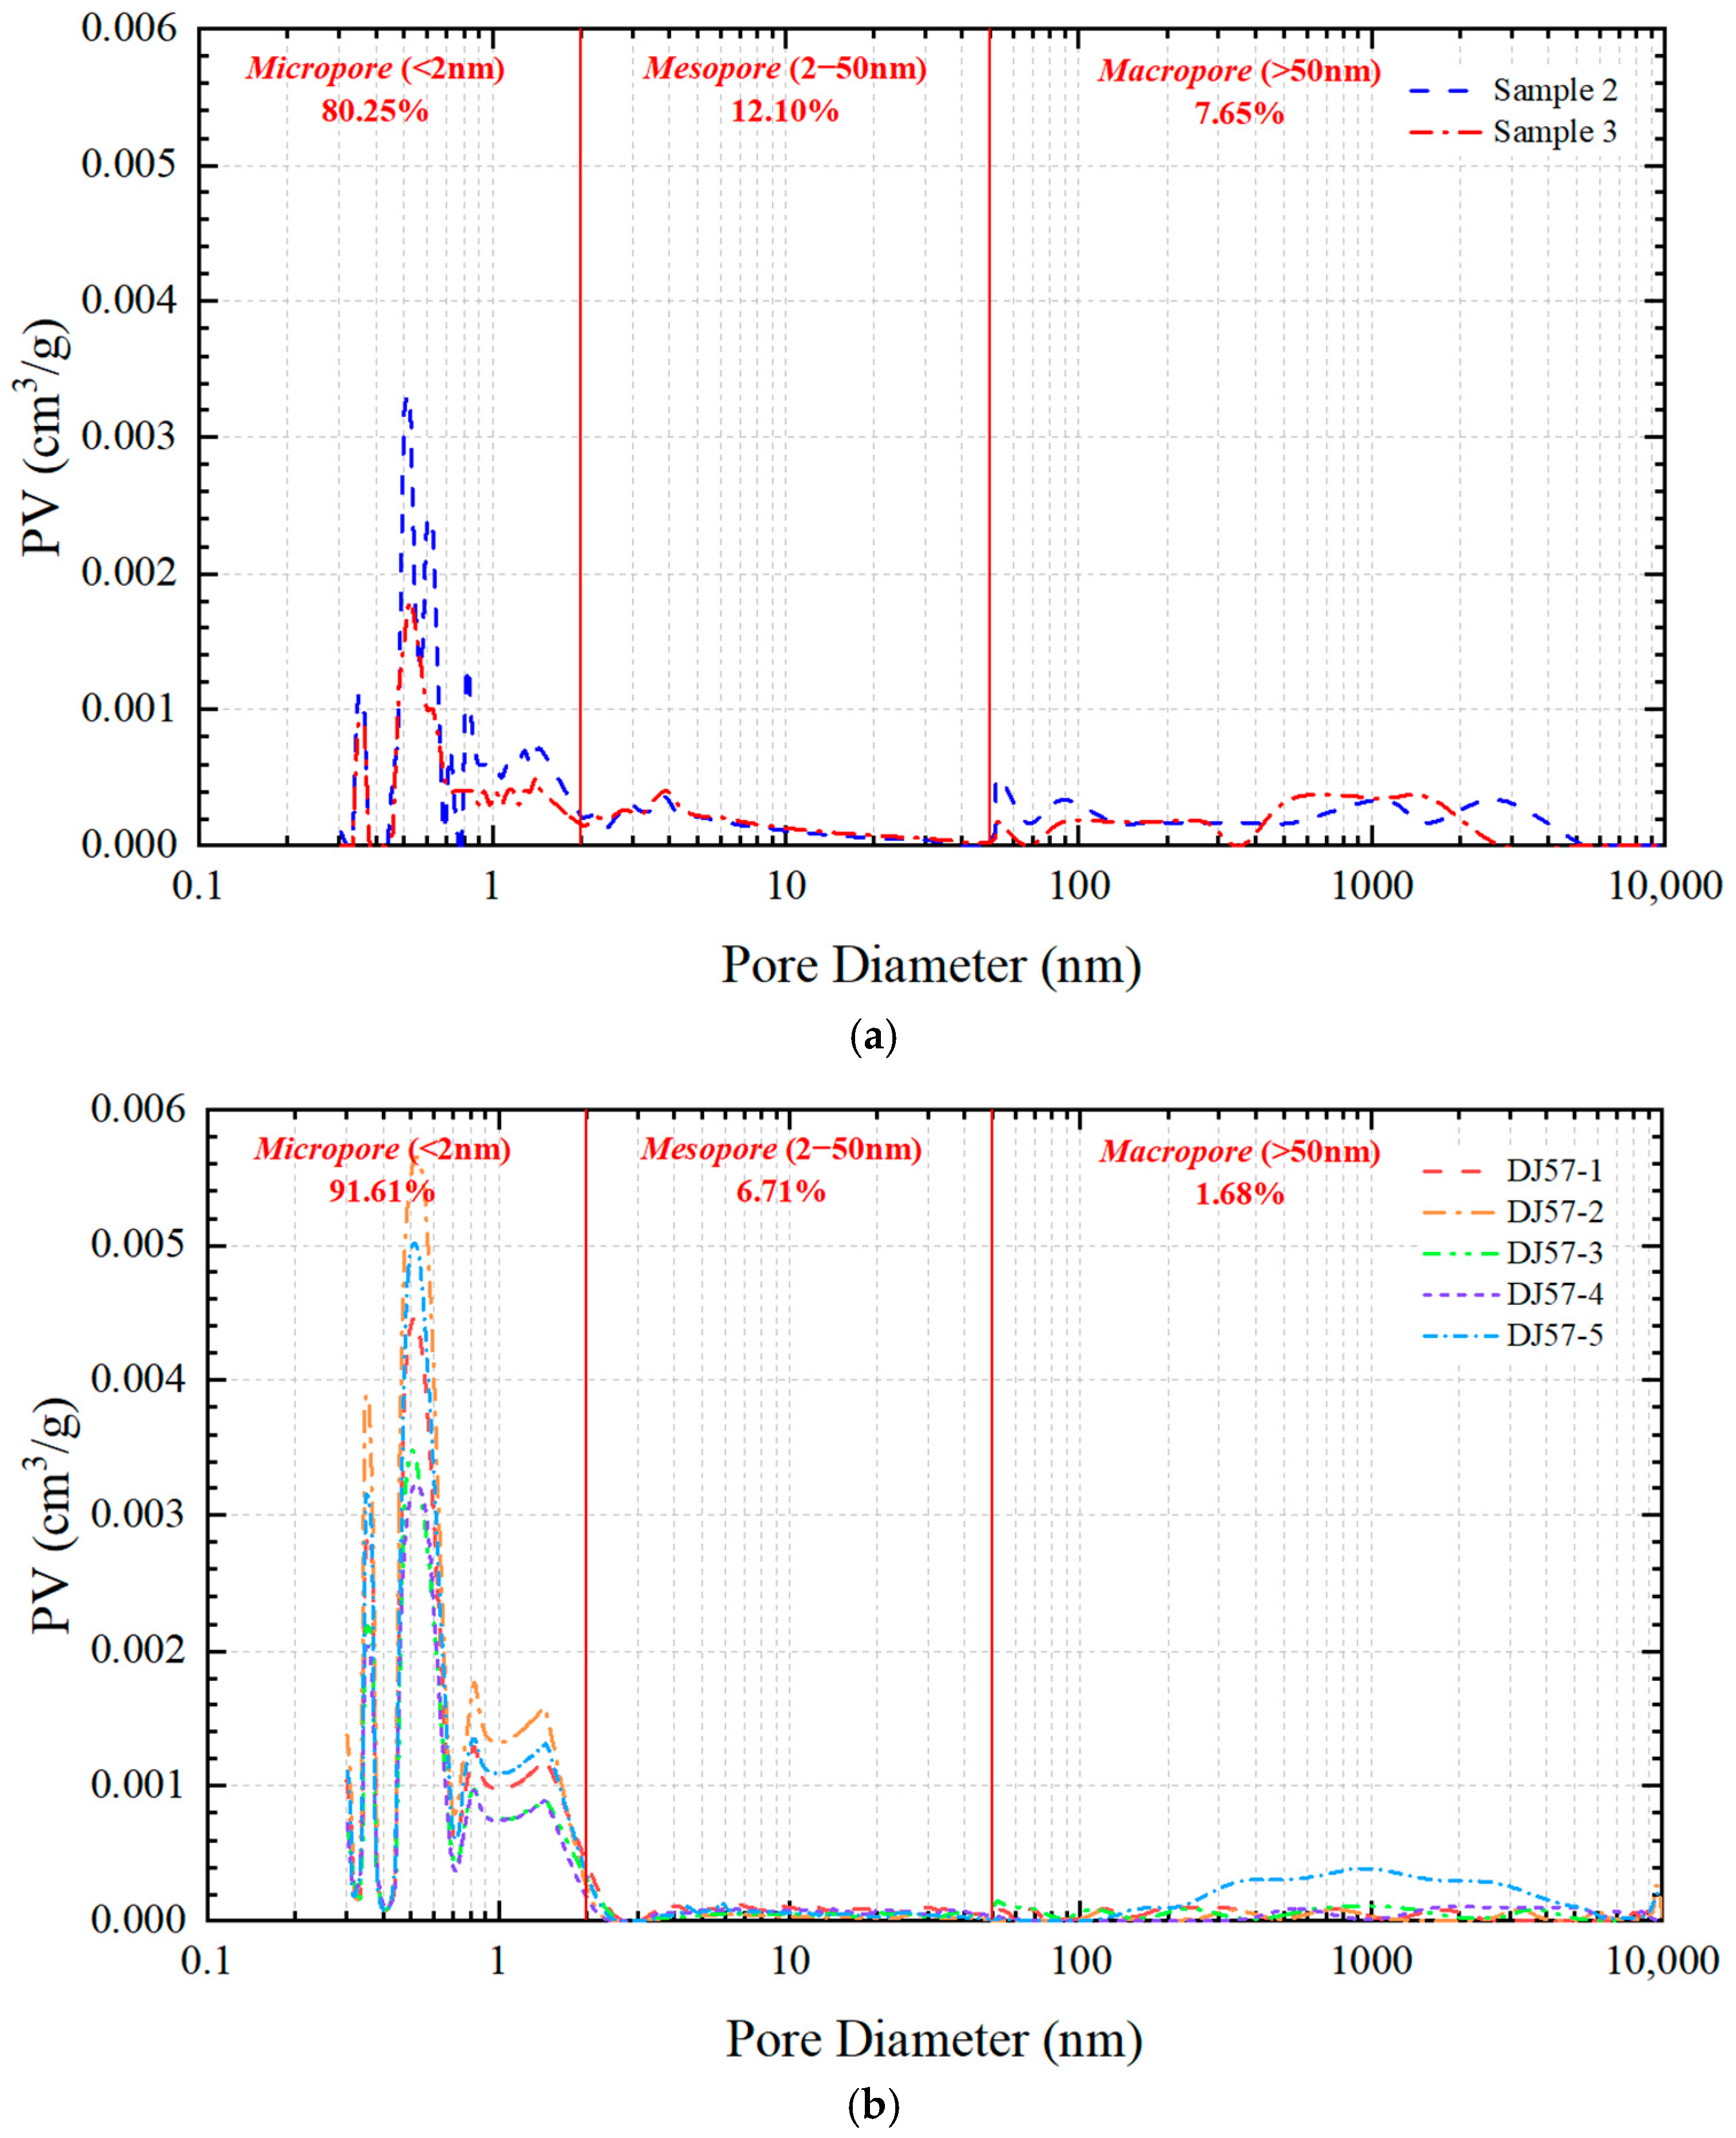
3.5. Multi-Scale Pore Distribution Characteristics

In the studied DCR reservoir, its pore structure exhibits considerable complexity and can be primarily categorized into macropores (>50 nm), mesopores (2–50 nm), and micropores (<2 nm). Theoretically, the HPMI method is capable of measuring pore diameters ranging from 3.6 nm to 100 μm, encompassing portions of both mesopore and macropore distributions. Due to the compressibility of DCR, when the mercury injection pressure exceeds 30 MPa (corresponding to a pore diameter of approximately 50 nm), DCR may undergo compressive deformation, potentially leading to the destruction of large pores [16,31], necessitating micro-CT validation for pores > 50 nm. The physisorption method is then employed to characterize pore size distributions for diameters less than 50 nm. Notably, the CO2 adsorption method and the N2 adsorption method demonstrate high consistency and reliability and accuracy in characterizing micropores (<2 nm) and mesopores (2–50 nm), respectively [39]. Consequently, in this study, the CO2 adsorption method is utilized to quantify pores smaller than 2 nm in DCR samples, the N2 adsorption method is applied to characterize the pore size distribution within the range of 2–50 nm, and the HPMI method is employed to characterize pore sizes exceeding 50 nm, leveraging their complementary detection ranges to achieve comprehensive characterization of cross-scale pore systems. To comprehensively characterize the multi-scale pore structure of the DCR samples, Table 5 summarizes the SSA and total PV for micropores (<2 nm), mesopores (2–50 nm), and macropores (>50 nm) per unit mass of DCR samples in both the NQ Block and DJ Block, while Figure 12a,b and Figure 13a,b demonstrate the variations in PV and SSA per unit mass of DCR samples as a function of pore diameter, respectively.
As shown in Table 5, the total PV and SSA per unit mass of the DCR samples of Sample #2 are measured to be 0.036 cm3/g and 97.225 m2/g, respectively, whereas those of Sample #3 are 0.024 cm3/g and 65.206 m2/g, respectively. As can be seen from Figure 12a, the PV distribution per unit mass of the DCR samples follows an L-shape distribution with micropores being the predominant pore type and the micropores of Sample #2 and Sample #3 contributing 82.59% and 76.93% to the total PV, respectively. For these two samples, mesopores contribute 9.83% and 15.38%, and macropores contribute 7.58% and 7.69%, respectively. The proportions of PV at different scales exhibit significant variations. Micropores constitute the predominant fraction of the PV in the DCR samples, accounting for an average of 80.25%. In contrast, mesopores and macropores contribute on average 12.10% and 7.65% to the total PV, respectively, suggesting that the micropores in the DCR samples are well developed. Despite the presence of a certain number of macropores, micropores remain the dominant pore type, providing a significant proportion of the pore space.
As can be seen from Figure 13a, the SSA distribution per unit mass of DCR samples also follows an L-shape distribution with micropores being the predominant pore type and the micropores of Sample #2 and Sample #3 contributing 96.55% and 94.53% to the SSA, respectively. Mesopores contribute 3.43% and 5.45%, and macropores contribute 0.02% and 0.02%, respectively. Also, the proportions of SSA at different scales exhibit significant variations. Micropores constitute the predominant fraction of the SSA in the DCR samples, accounting for an average of 95.74%. Although the DCR samples contain some mesopores and macropores, their contribution to the SSA is negligible. Consequently, the magnitude of the SSA primarily depends on the degree of micropore development, and the more developed the micropores, the greater the SSA of the coal sample.
In the eastern part of the Basin, the PV distribution per unit mass in the DJ Block predominantly exhibits a U-shape pattern, characterized by the coexistence of micropores and microcracks, and these features are primarily concentrated within the ranges of 0.3–1.5 nm and >10 μm [7]. Under the same pore size scale of 0.3 nm–10 μm, however, the PV in the DJ Block predominantly follows an overall L-shape distribution. As illustrated in Figure 12b, there are significant differences in PV across various pore scales. The average contribution ratio of micropores to the total PV is 91.61%, while those of the mesopores and macropores are 6.71% and 1.68%, respectively. Similarly, under the same pore size scale, the SSA per unit mass of DCR samples in the DJ Block mainly displays an L-shape distribution, exhibiting a unimodal state dominated by micropores with its peak primarily concentrated in the range of 0.3–1.5 nm (see Figure 13b). Among these, micropores contribute 98.99% of the SSA, while the contributions of mesopores and macropores to the SSA are negligible.
It can be seen from Table 3 that the total SSA and PV per unit mass of DCR in the NQ Block are 81.215 m2/g and 0.030 cm3/g, respectively, whereas those of the DJ Block are 187.926 m2/g and 0.060 cm3/g, respectively. Although the PV of the two Blocks are relatively comparable, there is a pronounced disparity in their SSAs. The SSA of the DJ Block is approximately twice that of the NQ Block, which is primarily attributed to the difference in the SSAs of the micropores, reflecting the degree of micropore development. Since micropores represent the predominant pore type within the DCR matrix and possess a considerably high SSA, they offer abundant sites for gas adsorption. Overall, the DJ Block demonstrates the highest level of micropore development, followed by the SF Block, with the NQ Block exhibiting the lowest degree of micropore development. In contrast, the development levels of mesopores and macropores are relatively consistent across the three blocks.

4. Conclusions

In this paper, an experimental framework was integrated to comprehensively investigate the petrological characteristics of deep coal seams by means of industrial analysis, vitrinite reflectance measurement, and maceral analysis. Additionally, through the integration of SEM observations, physical adsorption experiments, and HPMI experiments, the nano- to micron-scale pore structures within the DCR matrix of the NQ Block were systematically and quantitatively characterized across multiple scales. On this basis, a comparative analysis was conducted on the pore structure characteristics of DCRs in the DJ and SF Blocks located in the eastern part of the Basin. This analysis not only clarifies the development features of the DCR matrix in the NQ Block but also provides a robust foundation for the subsequent exploitation of DCR gas resources in the NQ Block. The detailed findings are summarized as follows:
(1)
The DCR in the NQ Block is predominantly composed of vitrinite, accounting for approximately 77.75%, followed by inertinite. The pore space is predominantly characterized by cellular pores with minor contributions from intercrystalline and dissolution pores, but porosity development is relatively limited as most of these pores are extensively filled with clay minerals.
(2)
The PV and SSA of micropores in the NQ Block and the eastern part of the Basin exhibit multi-peak distribution characteristics. Notably, there are substantial differences in SSA and PV between the NQ Block and the eastern part of the Basin. In the DJ Block located in the eastern part of the Basin, the SSA and PV for the micropores per unit mass of DCR are 186.045 m2/g and 0.055 cm3/g, respectively, while t-tests confirm that the micropore SSA of the DJ Block is 2.4 times higher (p < 0.01). The degree of micropore development in the NQ Block is relatively comparable to that of the SF Block but significantly differs from that of the DJ Block, which is potentially attributable to variations in the DCR pore structure.
(3)
The PV of the mesopores per unit mass of DCR in the NQ Block is 0.004 cm3/g, which is comparable to that of the SF Block and the DJ Block located in the eastern part of the Basin; however, the SSA of the mesopores per unit mass of DCR in the NQ Block is significantly higher at 3.445 m2/g compared to 0.596 m2/g and 1.869 m2/g for the SF Block and the DJ Block, respectively, indicating a marked disparity in the SSA of the mesopores among these blocks. For macropores, the distribution of macropores in the NQ Block shows relatively close resemblance to that of the DJ Block in the eastern part of the Basin.
(4)
The SSA and PV per unit mass of DCR of the NQ Block and the DJ Block exhibit an L-shape distribution characteristic. Micropores dominate as the primary pore type, contributing significantly to both the SSA and PV. The NQ Block has a total SSA per unit mass of DCR of 81.215 m2/g and a PV of 0.030 cm3/g, whereas the DJ Block exhibits a total SSA per unit mass of DCR of 187.926 m2/g and a PV of 0.060 cm3/g. Notably, the SSA of the DJ Block was 2.3 times greater than that of the NQ Block; this was primarily due to differences in the SSA of micropores.
(5)
For the coal seams targeted for development, particularly in regions where the clay content is <20% (Table 2) and the vitrinite content >60%, large-scale hydraulic fracturing should be implemented to improve the accessibility of micropores and enhance the gas production rate.

Author Contributions

Conceptualization, G.L., X.P., Q.Z. and D.Y.; Methodology, G.L., D.W., X.P., Q.Z., B.L., Z.L., Z.Z. and D.Y.; Validation, G.L. and B.L.; Formal analysis, G.L., D.W., X.P., Q.Z., B.L., Z.L., Z.Z. and D.Y.; Investigation, G.L., D.W., X.P., B.L., Z.L., Z.Z. and D.Y.; Resources, G.L. and Q.Z.; Data curation, D.W., Z.L. and Z.Z.; Writing—original draft, G.L.; Writing—review & editing, D.Y.; Supervision, D.Y.; Project administration, G.L.; Funding acquisition, G.L. and D.Y. All authors have read and agreed to the published version of the manuscript.

Funding

The authors would like to thank the National Natural Science Foundation of China (Grant No.: U24B2015 and 52274049) and the Science Foundation of China University of Petroleum, Beijing (Grant No.: 2462024PTJS010) for the financial support. Also, the authors acknowledge a Discovery Grant and a Collaborative Research and Development (CRD) Grant from the Natural Sciences and Engineering Research Council (NSERC) of Canada to D. Yang.

Institutional Review Board Statement

Not applicable.

Informed Consent Statement

Not applicable.

Data Availability Statement

The original contributions presented in this study are included in the article. Further inquiries can be directed to the corresponding author(s).

Acknowledgments

The authors gratefully acknowledge the administrative and technical support as well as core samples, field data, and related materials provided by the Yumen Oilfield Branch of China National Petroleum Corporation.

Conflicts of Interest

Author Xiang Peng, Qingjiu Zhang, and Bofeng Liu were employed by the PetroChina Yumen Oilfield Company. The remaining authors declare that the research was conducted in the absence of any commercial or financial relationships that could be construed as a potential conflict of interest.

References

  1. Zhou, D.; Chen, G.; Chen, Z.; Liu, Z. Exploration and development progress, key evaluation parameters and prospect of deep CBM in China. Nat. Gas Ind. 2022, 42, 43–51. [Google Scholar]
  2. Xu, F.; Xiao, Z.; Chen, D.; Yan, X.; Wu, N.; Li, X.; Miao, Y. Current status and development direction of coalbed methane exploration technology in China. Coal Sci. Technol. 2019, 47, 205–215. [Google Scholar]
  3. Li, S.; Tang, D.; Pan, Z.; Xu, H.; Tao, S.; Liu, Y.; Ren, P. Geological conditions of deep coalbed methane in the eastern margin of the Ordos Basin, China: Implications for coalbed methane development. J. Nat. Gas Sci. Eng. 2018, 53, 394–402. [Google Scholar] [CrossRef]
  4. Zhang, L.; Bian, L.; Hou, W.; Li, Y.; Li, Y.; Wu, P.; Li, W.; Li, X.; Li, C. Pore structure characteristics and exploration significance of deep coal reservoirs: A case study of Daning-Jixian block in the eastern margin of Ordos Basin. Acta Pet. Sin. 2023, 44, 1867–1878. [Google Scholar]
  5. Guo, X.; Wang, L.; Yao, X.; Li, X.; Zhang, L.; Wang, X. Geological characteristics of deep coal rock and main geological factors controlling coalbed methane enrichment: A case study of the M area in the eastern Ordos Basin. Pet. Geol. Exp. 2025, 47, 17–26. [Google Scholar]
  6. Tang, S.; Tang, D.; Yang, J.; Deng, Z.; Li, S.; Chen, S.; Feng, P.; Huang, C.; Li, Z. Pore structure characteristics and gas storage potential of deep coal reservoirs in Daning-Jixian Block of Ordos Basin. Acta Pet. Sin. 2023, 44, 1854–1866+1902. [Google Scholar]
  7. Deng, Z.; Wang, H.; Jiang, Z.; Ding, R.; Li, Y.; Wang, T. Influence of deep coal pore and fracture structure on occurrence of coalbed methane: A case study of Daning-Jixian Block in eastern margin of Ordos Basin. Coal Sci. Technol. 2024, 52, 106–123. [Google Scholar]
  8. Bustin, A.M.M.; Bustin, R.M. Coal reservoir saturation: Impact of temperature and pressure. AAPG Bull. 2008, 92, 77–86. [Google Scholar] [CrossRef]
  9. Wang, Y.; Tao, C.; Ni, X.; Gao, X.; He, Y. Amount of adsorbed gas in deep coal reservoir based on adsorption potential theory. J. China Coal Soc. 2018, 43, 1547–1552. [Google Scholar]
  10. Liu, D.; Liu, Z.; Cai, Y. Research progress on accumulation mechanism and formation geological conditions of coalbed methane. Coal Sci. Technol. 2020, 48, 1–16. [Google Scholar]
  11. Zhao, W.; Liu, H.; Wang, H.; Liu, D.; Li, X. Microscopic pore characteristics of coal seam and the controlling effect of sedimentary environment on pore structure in No.8 coalseam of the Ordos Basin. Coal Sci. Technol. 2024, 52, 142–154. [Google Scholar]
  12. Yang, X.; Song, B.; Chen, G.; He, R.; Zhao, H.; Yang, X. Characteristics of multi-scale pore-fracture structure of deep coal rocks in the Daning-Jixian Block. Spec. Oil Gas Reserv. 2022, 29, 94–100. [Google Scholar]
  13. Du, Q.; Liu, X.; Wang, E.; Zuo, J.; Wang, W.; Zhu, Y. Effects of CO2–water interaction with coal on mineral content and pore characteristics. J. Rock Mech. Geotech. Eng. 2020, 12, 326–337. [Google Scholar] [CrossRef]
  14. Qin, L.; Ma, C.; Li, S.; Lin, H.; Wang, P.; Long, H.; Yan, D. Mechanical damage mechanism of frozen coal subjected to liquid nitrogen freezing. Fuel 2022, 309, 122124. [Google Scholar] [CrossRef]
  15. Zhang, X.; Zhang, X.; Liu, J.; Pang, S.; Zhu, K.; Zheng, Z. Multi-scale quantitative characterization of three-dimensional pores and fissures in deep coal and study of the evolution laws. Constr. Build. Mater. 2024, 449, 138449. [Google Scholar] [CrossRef]
  16. Li, Y.; Zhang, Y.; Zhang, L.; Hou, J. Characterization on pore structure of tectonic coals based on the method of mercury intrusion, carbon dioxide adsorption and nitrogen adsorption. J. China Coal Soc. 2019, 44, 1188–1196. [Google Scholar]
  17. Clarkson, C.; Haghshenas, B.; Ghanizadeh, A.; Qanbari, F.; Williams-Kovacs, J.; Riazi, N.; Debuhr, C.; Deglint, H. Nanopores to megafractures: Current challenges and methods for shale gas reservoir and hydraulic fracture characterization. J. Nat. Gas Sci. Eng. 2016, 31, 612–657. [Google Scholar] [CrossRef]
  18. Zhu, Y.; Wang, Y.; Chen, S.; Zhang, H.; Fu, C. Qualitative-quantitative multiscale characterization of pore structures in shale reservoirs: A case study of Longmaxi Formation in the Upper Yangtze area. Earth Sci. Front. 2016, 23, 154–163. [Google Scholar]
  19. Chen, Y.; Zou, C.; Maria, M.; Zhu, R.; Bai, B.; Yang, Z. Porosity and fractal characteristics of shale across a maturation gradient. Nat. Gas Geosci. 2015, 26, 1646–1656. [Google Scholar]
  20. GB/T 30732-2014; National Technical Committee on Coal Standardization of Standardization Administration of China (SAC/TC 42). Proximate Analysis of Coal—Instrumental Method. China Standards Press: Beijing, China, 2014; Volume 16.
  21. GB/T 6948-2008; National Technical Committee on Coal Standardization of Standardization Administration of China (SAC/TC 42). Method of Determining Microscopically the Reflectance of Vitrinite in Coal. China Standards Press: Beijing, China, 2008; Volume 16.
  22. GB/T 8899-2013; National Technical Committee on Coal Standardization of Standardization Administration of China (SAC/TC 42). Determination of Maceral Group Composition and Minerals in Coal. China Standards Press: Beijing, China, 2013; Volume 12.
  23. Liu, G.; Bai, Y.; Gu, D.; Lu, Y.; Yang, D. Determination of static and dynamic characteristics of microscopic pore-throat structure in a tight oil-bearing sandstone formation. AAPG Bull. 2018, 102, 1867–1892. [Google Scholar] [CrossRef]
  24. Li, Q.; Zhang, R.; Cai, Y.; Yin, T.; Qiu, F.; Xu, S. CH4 adsorption capacity of coalbed methane reservoirs induced by microscopic differences in pore structure. Unconv. Resour. 2024, 4, 100097. [Google Scholar] [CrossRef]
  25. Woodd, D. Complex interactions between coal maceral fractions, thermal maturity, reaction kinetics, fractal dimensions and pore-size distributions: Implications for gas storage. Int. J. Coal Geol. 2025, 305, 104788. [Google Scholar] [CrossRef]
  26. Liu, G.; Yin, H.; Lan, Y.; Fei, S.; Yang, D. Experimental determination of dynamic pore-throat structure characteristics in a tight gas sandstone formation with consideration of effective stress. Mar. Pet. Geol. 2020, 113, 104170. [Google Scholar] [CrossRef]
  27. Li, G.; Zhang, S.; He, H.; He, X.; Zhao, Z.; Niu, X.; Xiong, X.; Zhao, Q.; Guo, X.; Hou, Y.; et al. Coal-rock gas: Concept, connotation and classification criteria. Pet. Explor. Dev. 2024, 51, 897–911. [Google Scholar] [CrossRef]
  28. Li, G.; Yao, Y.; Wang, H.; Meng, L.; Li, P.; Zhang, Y.; Wang, J.; Ma, L. Deep coalbed methane resources in the Shenmu-Jiaxian block, Ordos Basin, China: Geological characteristics and potential for exploration and exploitation. Coal Geol. Explor. 2024, 52, 70–80. [Google Scholar]
  29. Liu, X.; Huang, D.; Hu, J.; Zhou, G.; Du, X.; Dai, X. Reservoir characteristics of Carboniferous Benxi Formation coal-rock gas in the central and eastern Ordos Basin. Nat. Gas Ind. 2024, 44, 51–62. [Google Scholar]
  30. Huo, Z.; Xi, Z.; Guo, J.; Wang, D. Pore characteristics of tectonic coal based on nitrogen adsorption and SEM. Coal Eng. 2024, 56, 149–156. [Google Scholar]
  31. Zhao, D.; Guo, Y.; Mao, X.; Lu, C.; Li, M.; Qian, F. Characteristics of macro-nanopores in anthracite coal based on mercury injection, nitrogen adsorption and FE-SEM. J. China Coal Soc. 2017, 42, 1517–1526. [Google Scholar]
  32. Wang, T.; Tian, F.; Deng, Z.; Hu, H. The characteristic development of micropores in deep coal and its relationship with adsorption capacity on the eastern margin of the Ordos Basin, China. Minerals 2023, 13, 302. [Google Scholar] [CrossRef]
  33. Li, B.; Guo, Y.; Hu, X.; Wang, T.; Wang, R.; Chen, X.; Fan, W.; Deng, Z. Pore structure and heterogeneity characteristics of deep coal reservoirs: A case study of the Daning–Jixian Block on the southeastern margin of the Ordos Basin. Minerals 2025, 15, 116. [Google Scholar] [CrossRef]
  34. Wang, K.; Qiao, P.; Wang, Z.; Liu, X.; Li, Y. Multiple scale pore size characterization of coal based on carbon dioxide and liquid nitrogen adsorption, high-pressure mercury intrusion and low field nuclear magnetic resonance. China Min. Mag. 2017, 26, 146–152. [Google Scholar]
  35. Ma, L.; Wu, P.; Yang, J.; Hu, W.; Huang, Y.; Liu, C.; Niu, Y.; Wang, Z.; Ren, D. Microscopic pore structure characteristics and implications of deep coal measure reservoirs in eastern Ordos Basin. Pet. Reserv. Eval. Dev. 2025, 15, 217–226. [Google Scholar]
  36. Chen, S.; Zhu, Y.; Wang, H.; Liu h Wei w Fang, J. Structure characteristics and accumulation significance of nanopores in Longmaxi shale gas reservoir in the southern Sichuan Basin. J. China Coal Soc. 2012, 37, 438–444. [Google Scholar]
  37. Xu, F.; Wang, C.; Xiong, X.; Li, S.; Wang, Y.; Guo, G.; Yan, X.; Chen, G.; Yang, Y.; Wang, H.; et al. Deep (layer) coalbed methane reservoir forming modes and key technical countermeasures: Taking the eastern margin of Ordos Basin as an example. China Offshore Oil Gas 2022, 34, 30–42+262. [Google Scholar]
  38. Jiang, J.; Yang, W.; Cheng, Y.; Zhao, K.; Zheng, S. Pore structure characterization of coal particles via MIP, N2 and CO2 adsorption: Effect of coalification on nanopores evolution. Powder Technol. 2019, 354, 136–148. [Google Scholar] [CrossRef]
  39. Thommes, M.; Kaneko, K.; Neimark, A.; Olivier, J.; Rodriguez-Reinoso, F.; Rouquerol, J.; Sing, K.S.W. Physisorption of gases, with special reference to the evaluation of surface area and pore size distribution (IUPAC Technical Report). Pure Appl. Chem. 2015, 87, 1051–1069. [Google Scholar] [CrossRef]
Figure 1. Schematic of the procedures for preparing core samples.
Eng 06 00142 g001
Figure 2. Photomicrographs showing pore structure and diagenetic minerals in the studied DCR samples: (a) An SEM image of Sample #2 showing telovitrinite with syngenetic mineral inclusions predominantly composed of kaolinite-group clay minerals; (b) an SEM image of Sample #2 showing telovitrinite with cellular pore infillings composed of kaolinite-dominated clay minerals; (c) an SEM image of Sample #3 showing desmocollinite exhibits distinct banded telocollinite interbedded with kaolinite-dominated clay assemblages; (d) an SEM image of Sample #3 showing kaolinite with intercrystalline pores; (e) an SEM image of Sample #4 showing clay-dominated mineral constituents; and (f) an SEM image of Sample #4 showing nanoscale pores.
Eng 06 00142 g002
Figure 3. Isothermal adsorption curve for CO2 of DCR samples for (a) NQ Block and (b) DJ Block (revised from reference [7]).
Eng 06 00142 g003
Figure 4. PV distribution for micropores per unit mass of DCR samples during CO2 adsorption: (a) NQ Block and (b) DJ Block (revised from reference [7]).
Eng 06 00142 g004
Figure 5. SSA distribution for micropores per unit mass of DCR samples during CO2 adsorption: (a) NQ Block and (b) DJ Block (revised from reference [7]).
Eng 06 00142 g005
Figure 6. Isothermal adsorption–desorption curve for low-temperature N2 of the DCR samples for (a) NQ Block and (b) DJ Block (revised from reference [7]).
Eng 06 00142 g006
Figure 7. PV distribution for mesopores per unit mass of DCR samples during N2 adsorption: (a) NQ Block and (b) DJ Block (revised from reference [7]).
Eng 06 00142 g007
Figure 8. SSA distribution for mesopores per unit mass of DCR samples during N2 adsorption: (a) NQ Block and (b) DJ Block (revised from reference [7]).
Eng 06 00142 g008
Figure 9. Capillary pressure curve of the DCR samples.
Eng 06 00142 g009
Figure 10. PV distribution for macropores per unit mass of DCR samples during HPMI tests: (a) NQ Block and (b) DJ Block (revised from reference [7]).
Eng 06 00142 g010
Figure 11. SSA distribution for macropores per unit mass of DCR samples during HPMI tests: (a) NQ Block and (b) DJ Block (revised from reference [7]).
Eng 06 00142 g011
Figure 12. PV distribution per unit mass of the DCR samples using the physisorption method and HPMI tests: (a) NQ Block and (b) DJ Block (revised from reference [7]).
Eng 06 00142 g012
Figure 13. SSA distribution per unit mass of DCR samples using the physisorption method and HPMI tests: (a) NQ Block and (b) DJ Block (revised from reference [7]).
Eng 06 00142 g013
Table 1. Summary of physical properties of the DCR samples.
Coal Samples Porosity (%)Permeability (mD)Qt-Ar (cm3/g)
13.400.196.69
26.600.337.76
34.400.286.47
45.200.128.44
Note: Qt-Ar represents the total gas content of the sample per unit mass obtained under the pressurized coring conditions.
Table 2. Petrographic parameters of DCR samples in the NQ Block.
Coal Samples Mad
(%)
Aad
(%)
Vad
(%)
FCad
(%)
Ro,max
(%)
Maceral (%)
VitriniteInertiniteOther
20.6425.8510.7562.761.8676.2020.203.60
305438.1112.0249.331.8778.2019.402.40
40.6322.4510.8066.121.8777.2019.402.80
Note: Mad represents the moisture content (air-dried basis), Aad represents the ash content (air-dried basis), Vad represents the volatile matter content (air-dried basis), FCad represents the fixed carbon content (air-dried basis), and Ro,max represents the maximum vitrinite reflectance.
Table 3. SSA and total PV of micropores, mesopores, and macropores per unit mass of the DCR samples from the NQ Block and eastern part of the Basin [7].
ParameterPore TypeWestern ED BasinEastern ED Basin
NQ Block (n = 2)DJ Block (n = 5)SF Block (n = 4)
SSA (m2/g)Micropore77.754 ± 16.1140186.045 ± 19.885891.519 ± 8.8930
Mesopore3.445 ± 0.10801.869 ± 0.32200.596 ± 0.0153
Macropore0.016 ± 0.00400.012 ± 0.0050N/A
Total PV (cm3/g)Micropore0.024 ± 0.00500.055 ± 0.00600.036 ± 0.0030
Mesopore0.004 ± 0.00010.004 ± 0.00070.003 ± 0.0010
Macropore0.002 ± 0.00100.001 ± 0.0003N/A
Table 4. Measured parameters of the HPMI experiments.
Coal Samples MMS (%)MEE (%)Pt (MPa)P50 (MPa)αSp
287.989.70.270100.70.0952.245
384.276.80.46597.40.1562.674
Note: MMS represents the maximum mercury saturation, MEE represents the mercury extrusion efficiency, Pt represents the threshold pressure, P50 represents the median capillary pressure, α represents the homogeneity coefficient, and Sp represents the sorting coefficient.
Table 5. Total PV and SSA per unit mass of the DCR samples [7].
ED BasinCoal SamplesMeasured Micropores with CO2 AdsorptionMeasured Mesopores with N2 AdsorptionMeasured Macropores with HPMI Tests
Total PV (cm3/g)SSA
(m2/g)
Total PV (cm3/g)SSA
(m2/g)
Total PV (cm3/g)SSA
(m2/g)
NQ Block20.02993.8680.0043.3370.0030.020
30.01961.6410.0043.5530.0010.012
Mean (n = 2)0.024
± 0.0050
77.754
± 16.1140
0.004
± 0.0001
3.445
± 0.1080
0.002
± 0.0010
0.016
± 0.0040
DJ BlockDJ57-10.056190.4330.0062.8650.0010.028
DJ57-20.073246.8190.0021.0440.0000.003
DJ57-30.042143.6640.0031.3350.0010.018
DJ57-40.041141.9400.0052.2080.0010.001
DJ57-50.061207.3700.0041.8920.0020.010
Mean (n = 5)0.055
± 0.0060
186.045
± 19.8858
0.004
± 0.0007
1.869
± 0.3220
0.001
± 0.0003
0.012
± 0.0050
Disclaimer/Publisher’s Note: The statements, opinions and data contained in all publications are solely those of the individual author(s) and contributor(s) and not of MDPI and/or the editor(s). MDPI and/or the editor(s) disclaim responsibility for any injury to people or property resulting from any ideas, methods, instructions or products referred to in the content.

