Communication

Process Simulation of a Commercial Pervaporation Unit for Ethanol–Water Separation

by
Yousef Alqaheem
* and
Sharifah H. Alkandari
Petroleum Research Center, Kuwait Institute for Scientific Research, Safat 13109, Kuwait
*
Author to whom correspondence should be addressed.
Eng 2025, 6(7), 136; https://doi.org/10.3390/eng6070136
Submission received: 28 May 2025 / Revised: 18 June 2025 / Accepted: 20 June 2025 / Published: 23 June 2025

Abstract

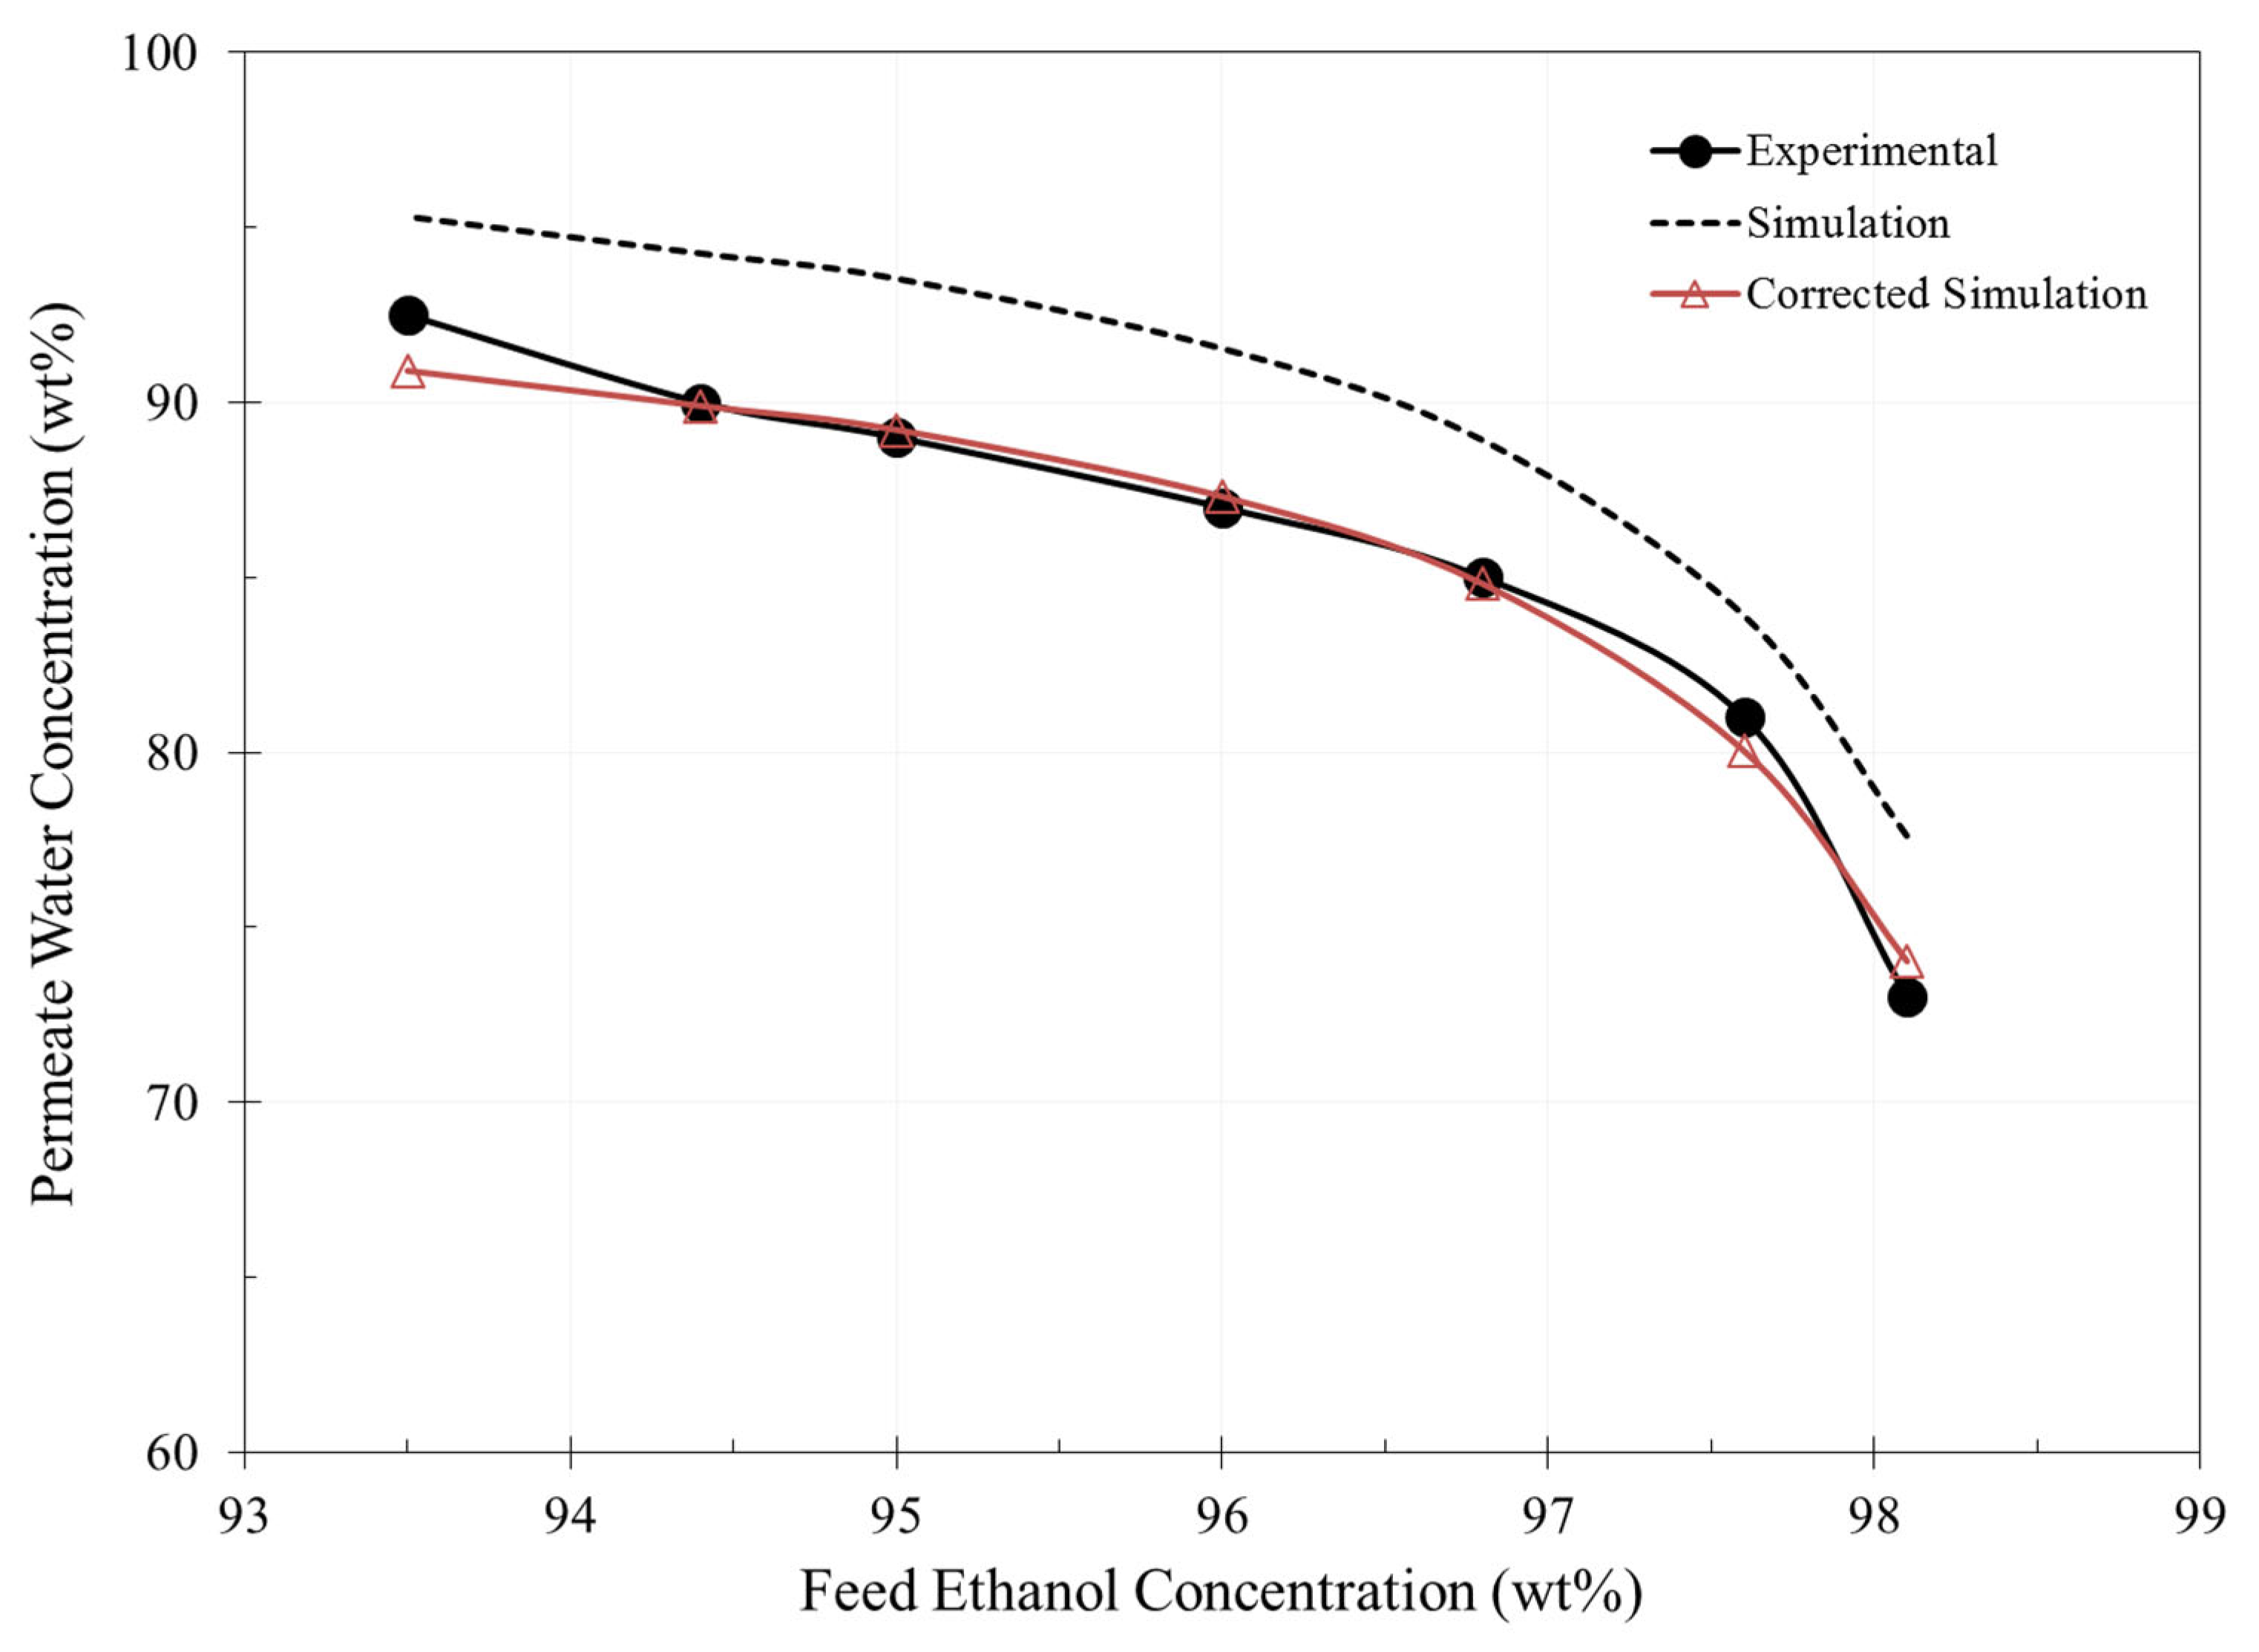
Pervaporation is a proven technology that overcomes distillation to produce high-quality ethanol. The process is modeled and simulated in the literature, but the model’s accuracy with industrial data is rarely discussed. In this work, a commercial pervaporation membrane was modeled and simulated in UniSIM® (R490) to purify ethanol from water after the azeotrope point of distillation. The pervaporation system was developed manually using a component splitter, adjust functions, and a spreadsheet. Results show that the simulation calculations were acceptable and differed from pilot-plant data by 4.6%. A correction factor was used to reduce the error further to 0.7%.

1. Introduction

Ethanol is a type of alcohol with a chemical formula of C2H5OH. It is produced biologically by the fermentation of sugars or chemically by the catalytic hydration of ethylene [1]. Ethanol is widely used in antiseptic products, medicines, cosmetics, and pesticides [2]. Ethanol is also considered a solvent for paints and inks [3]. Many countries are now using ethanol as fuel for vehicle engines [4]. Furthermore, gasoline engines can be blended with ethanol (up to 10 vol%) without the need for engine modification [5].
Production of ethanol from biomass or catalytic hydration results in the presence of water which needs to be removed [6]. For ethanol–water separation, distillation is commonly used due to its continuous operation and high product recovery [7]. However, the maximum achievable ethanol purity is 95 wt% due to azeotrope phenomena [8]. At azeotrope point, the liquid and vapor compositions of the ethanol–water mixture are the same and, therefore, cannot be separated.
A pervaporation membrane is used for further ethanol purification. Unlike distillation, where the separation is based on the difference in boiling points, the membrane uses a dense layer where only water passes due to the difference in solubility and diffusion between ethanol and water molecules [9]. In addition, the pressure difference across the membrane acts as the driving force for mass transport. However, the membrane has a lower production rate compared to that of distillation, and that is why it is usually integrated with distillation.
The commercial membrane is composed of a dense, selective layer usually made from polyvinyl alcohol (PVA) and a porous structure made of poly-acrylonitrile (PAN) to give the material better mechanical properties [10]. The hydrophilic PVA layer allows water molecules to pass while rejecting ethanol. The membrane is capable of treating a feed containing up to 50 wt% water with a maximum operating temperature of 105 °C [11]. The expected membrane life is around 2.5 years [12]. Figure 1 shows the structure of the commercial spiral-wound membrane.
It is reported that the membrane performance in terms of ethanol product purity and quantity depends on the feed composition and the operating conditions. For example, higher ethanol content in the feed resulted in higher product purity but lower quantity [11]. Therefore, process modeling and simulation are needed for better optimization and a reduction in the amount of experimental work.
Pervaporation membranes have been modeled and simulated in the literature, but the accuracy of the results with industrial units is rarely discussed. In this work, the performance data of a commercial membrane were used to develop a membrane unit in the process simulator, UniSIM®. Unfortunately, the simulator does not have a ready-to-use unit, so the membrane was built manually using built-in functions. The simulation results were compared with the pilot-plant data of the commercial system. The error was estimated, and a correction factor was used to enhance the accuracy of simulation calculations.

2. Methodology

The pervaporation membrane was based on a model developed in UniSIM® by Davis [14]. The model uses mole balance across the membrane, assuming no accumulation or reaction. The membrane design has a cross-flow structure with a plug flow model with no back mixing. Therefore, the mole balance across the membrane can be given by
x F e n F = y P e n P + x R e n R
where n F is the feed flow rate in kmol h−1, while n P and n R are the flow rates of the permeate and retentate, respectively. x F e is the mole fraction of ethanol in the feed, while x R e is the mole fraction of ethanol in the retentate. y P e is the mole fraction of ethanol in the permeate. The permeate flow rate ( n P ) is the sum of the ethanol and water permeate flow rates:
n P = n P e + n P w
The ethanol permeate flow rate ( n P e ) can be calculated based on the permeance data as follows:
n P e = x P e n P = Q e A x F e P F y P e P P ¯
where Q e is ethanol permeance (kmol m−2 h−1 kPa−1), A is the membrane area (m2), and x F e P F y P e P P ¯ is the average partial pressure difference across the membrane (kPa). This term can be simplified using the logarithmic-mean difference with Chen approximation for faster calculations [14]:
x F e P F y P e P P ¯ x F e x R e x F e + x R e 2 1 / 3 P F y P e P P
It is also known that the sum of the ethanol and water fractions is unity for each stream:
i = 1 n x F = 1 ;   i = 1 n x R = 1 ;   i = 1 n y P = 1
The above equations are solved numerically in UniSIM® using adjust functions. However, initial values are needed, which are based on guessed permeate cuts of ethanol ( θ g e ) and water ( θ g w ) :
θ g e = y P e n P x F e n F
The solver will stop when the iterated values are close to the calculated values θ c . This can be defined using an error function:
Error   Function = θ g θ c 2
The error functions of ethanol and water should be less than 10−5 for better accuracy. This means that the difference between the guessed and calculated values is less than 0.3 mol%.
In UniSIM®, the feed stream was first added using data on pressure, temperature, composition, and flow rate. The selected thermodynamic package is the non-random two-liquid (NRTL) package because it is widely used for non-ideal mixtures such as water and alcohols [15]. After that, the above equations were entered manually using an integrated spreadsheet. A component splitter was selected as the pervaporation unit. The component splitter needs permeate cuts of ethanol and water to solve. To do so, adjust functions for ethanol and water were added to solve the material balance of Equation (1) in the spreadsheet. The adjust functions use numerical methods and, therefore, the permeate cuts need to be guessed. After finding the solution, the permeate cuts are linked to the component splitter to determine permeate purity. Figure 2 shows the steps for constructing and solving the pervaporation unit in UniSIM®.
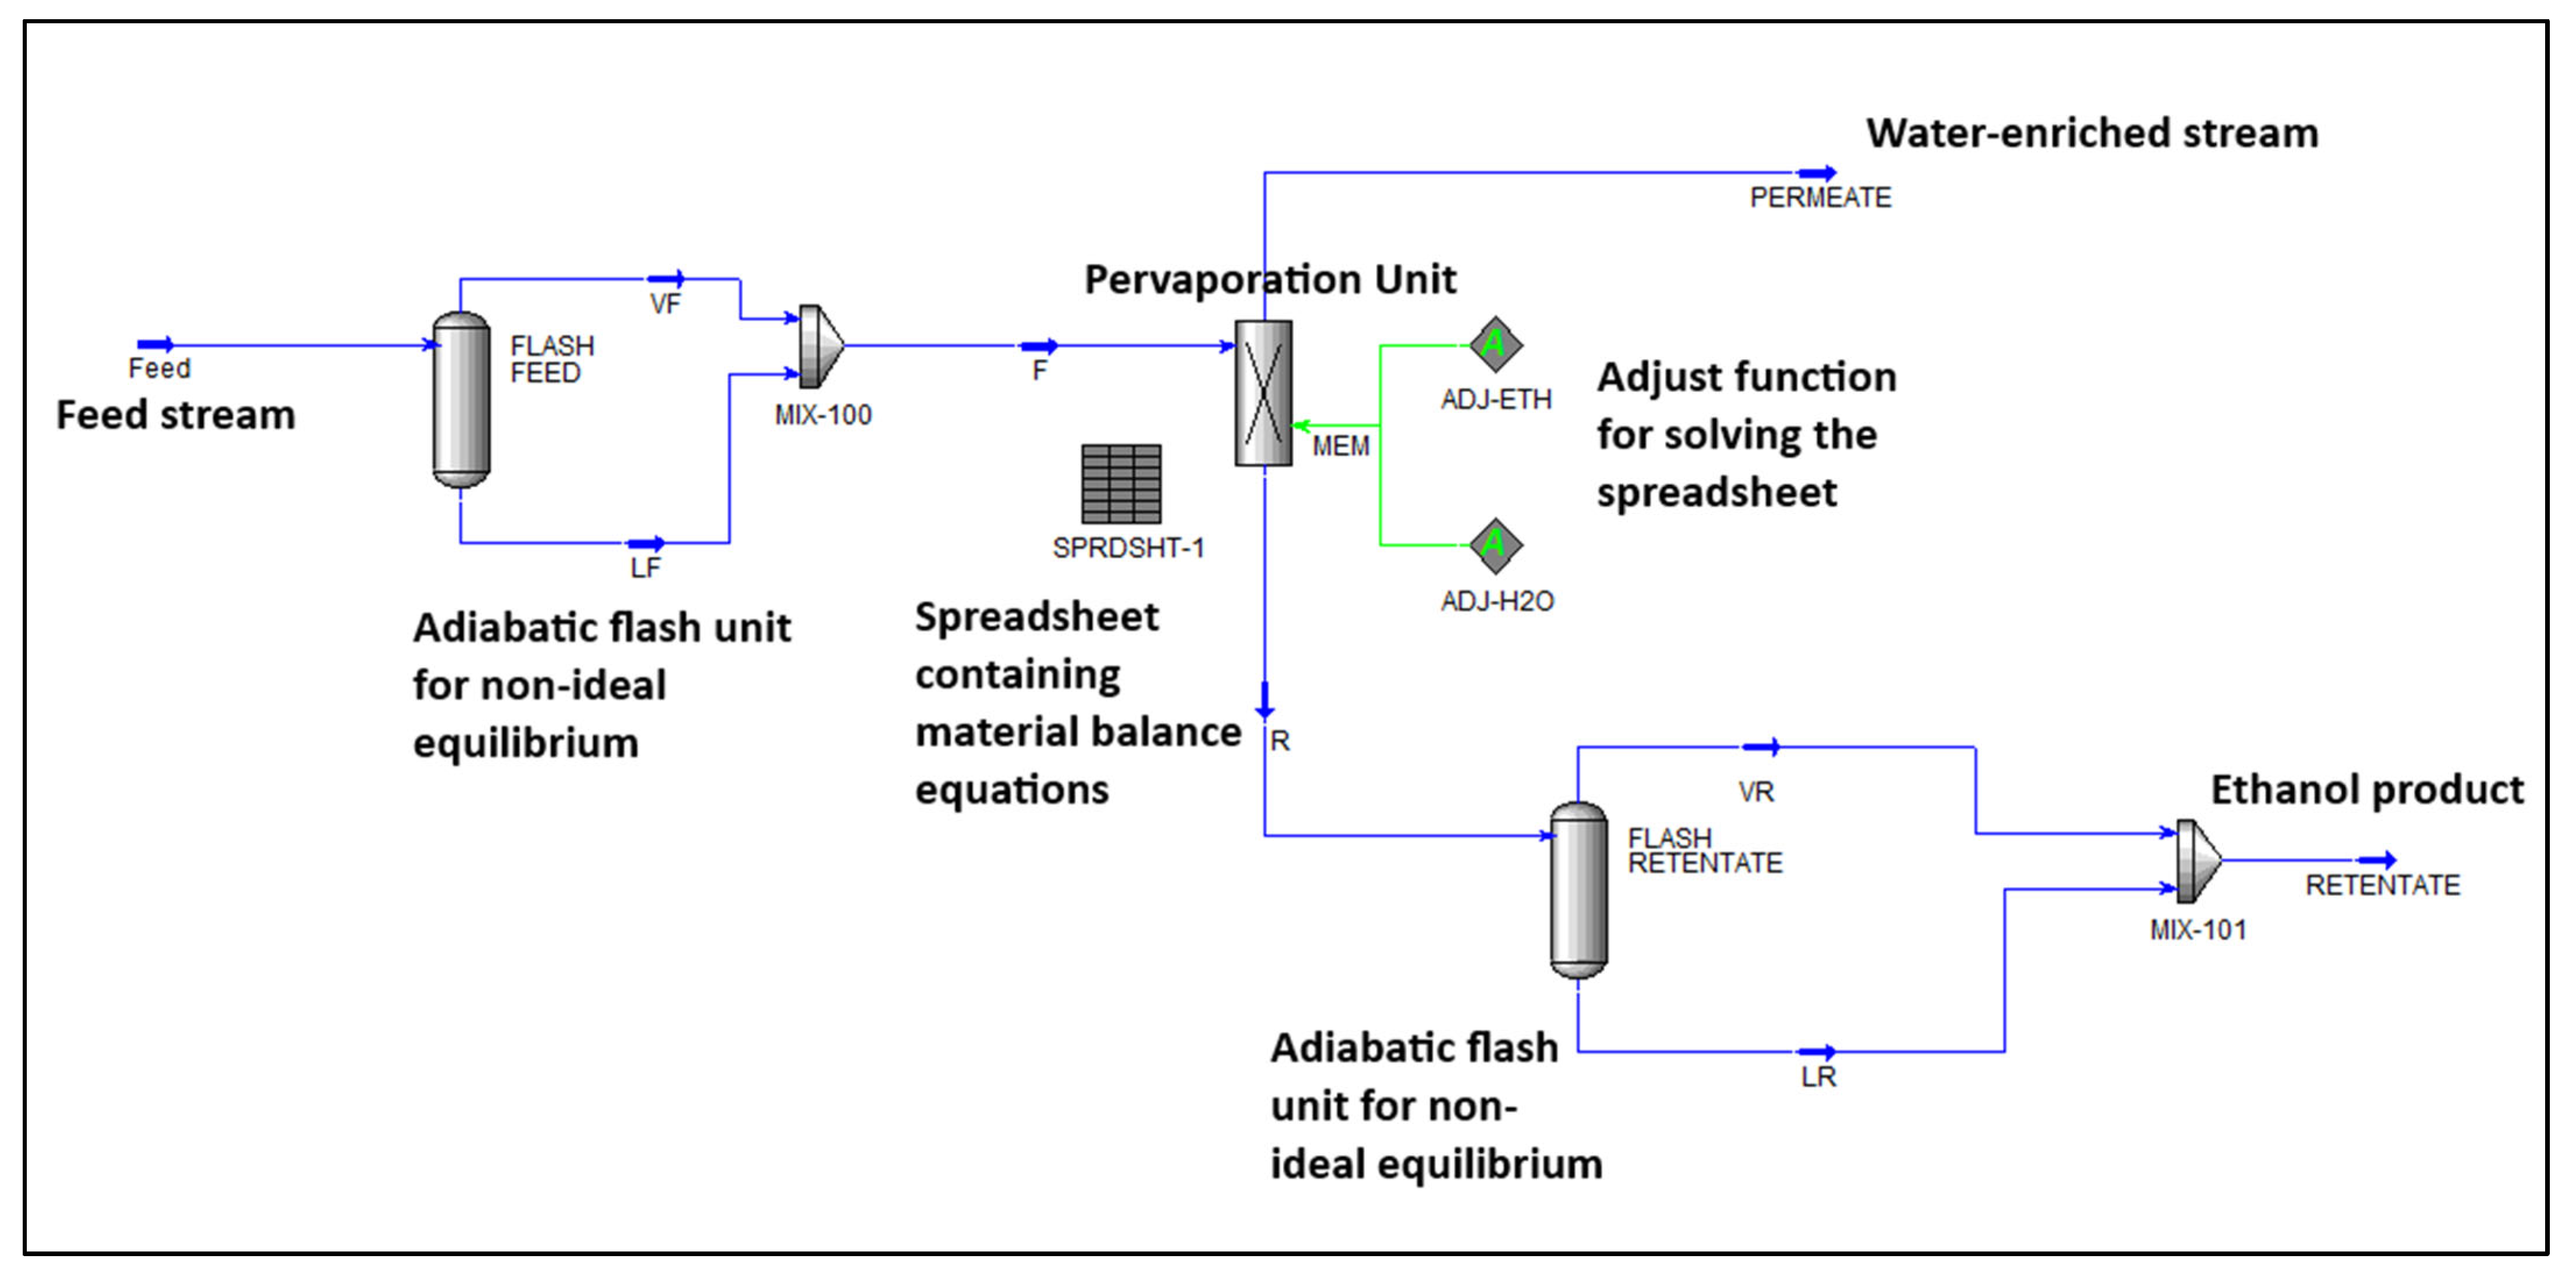
To take into consideration the non-ideal vapor/liquid equilibrium, the compositions of the feed and retentate were calculated from the vapor stream after passing through an adiabatic flash unit [14]. The developed process flow diagram of the pervaporation system in UniSim® is given in Figure 3. So, to obtain more accurate equilibrium data, the mole fraction of the feed stream (F) was based on the stream (VF), while the mole fraction of retentate was based on the VR stream. The mole composition of the permeate stream does not need correction because it is already in the vapor phase.
The above step was suggested by Davis [14] and it was investigated in this study by using a membrane module without the adiabatic flash separator. It was found that the maximum calculated error was only 1%, but it is still suggested to use that step for the best accuracy.
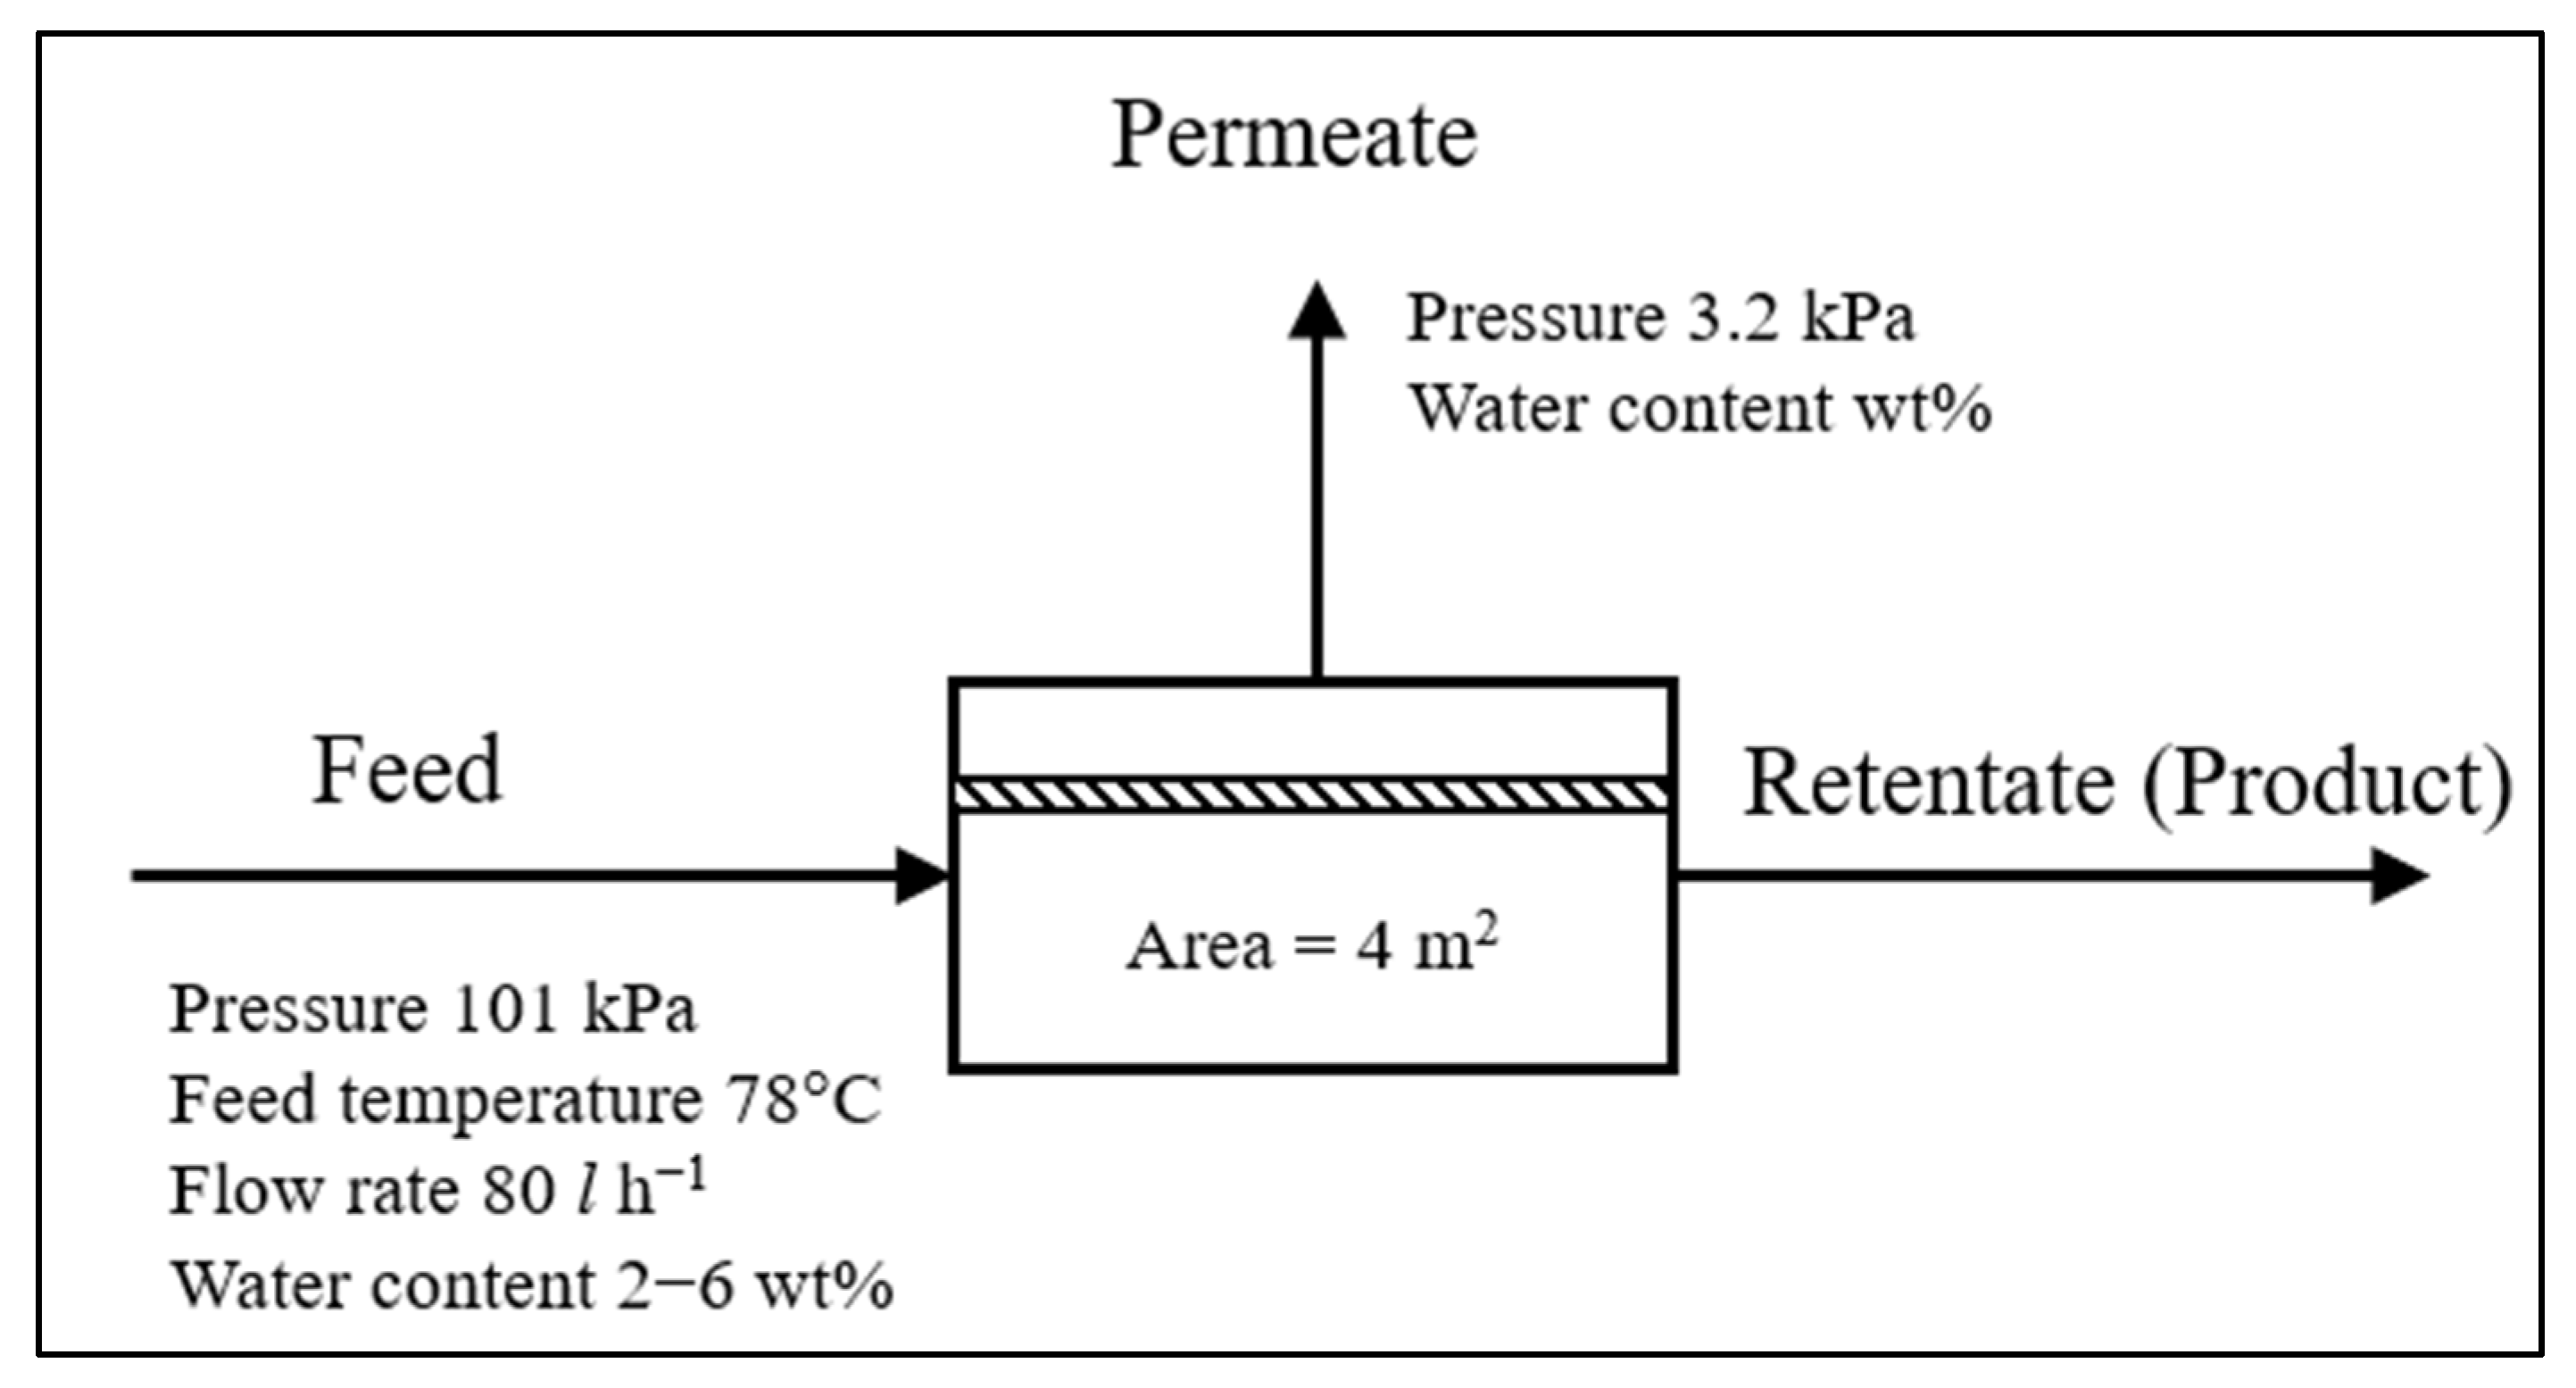
The commercial pervaporation membrane used in this study is based on a pilot-plant model with an area of 4 m2 [16]. It is made from a selective PVA layer. The feed has a water content ranging from 2 to 6 wt%. The feed temperature and pressure are 78 °C and 101 kPa. The feed flow rate is 80 L h−1 with a permeate pressure of 3.2 kPa. Water content was monitored on the permeate side, and the data were used as a reference for the comparison. The operation conditions of the commercial pervaporation membrane is given in Figure 4.
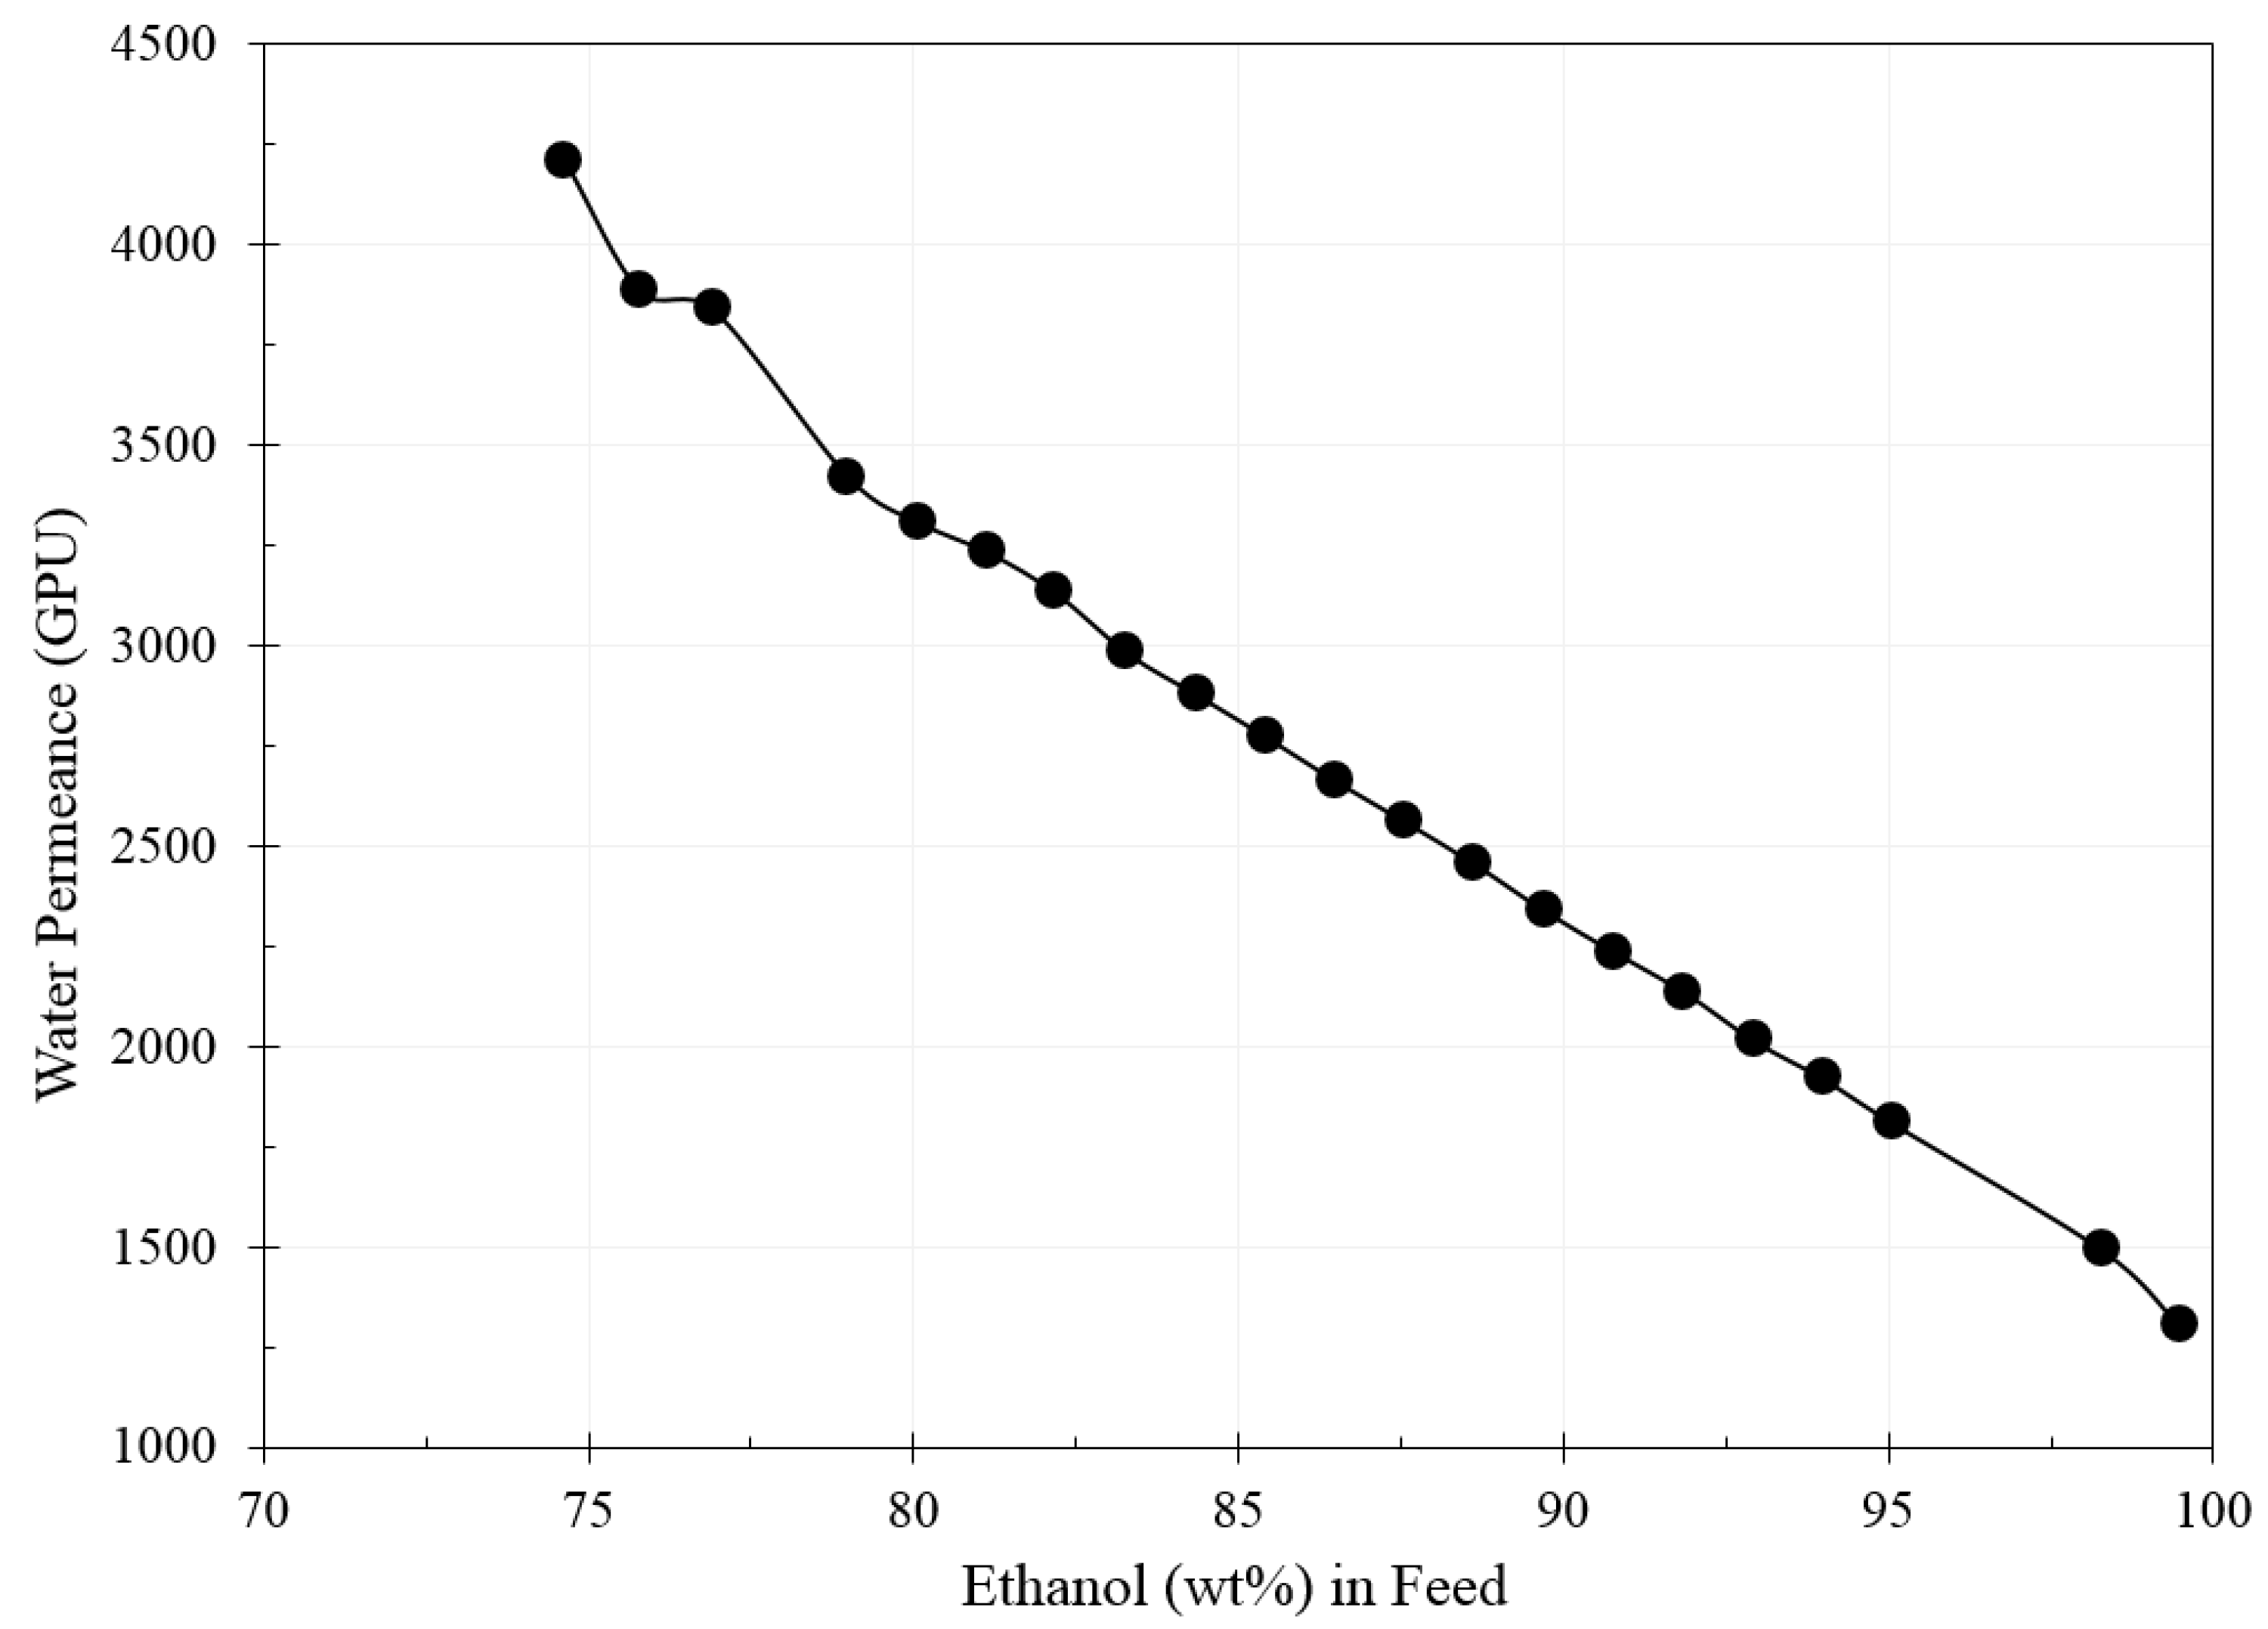
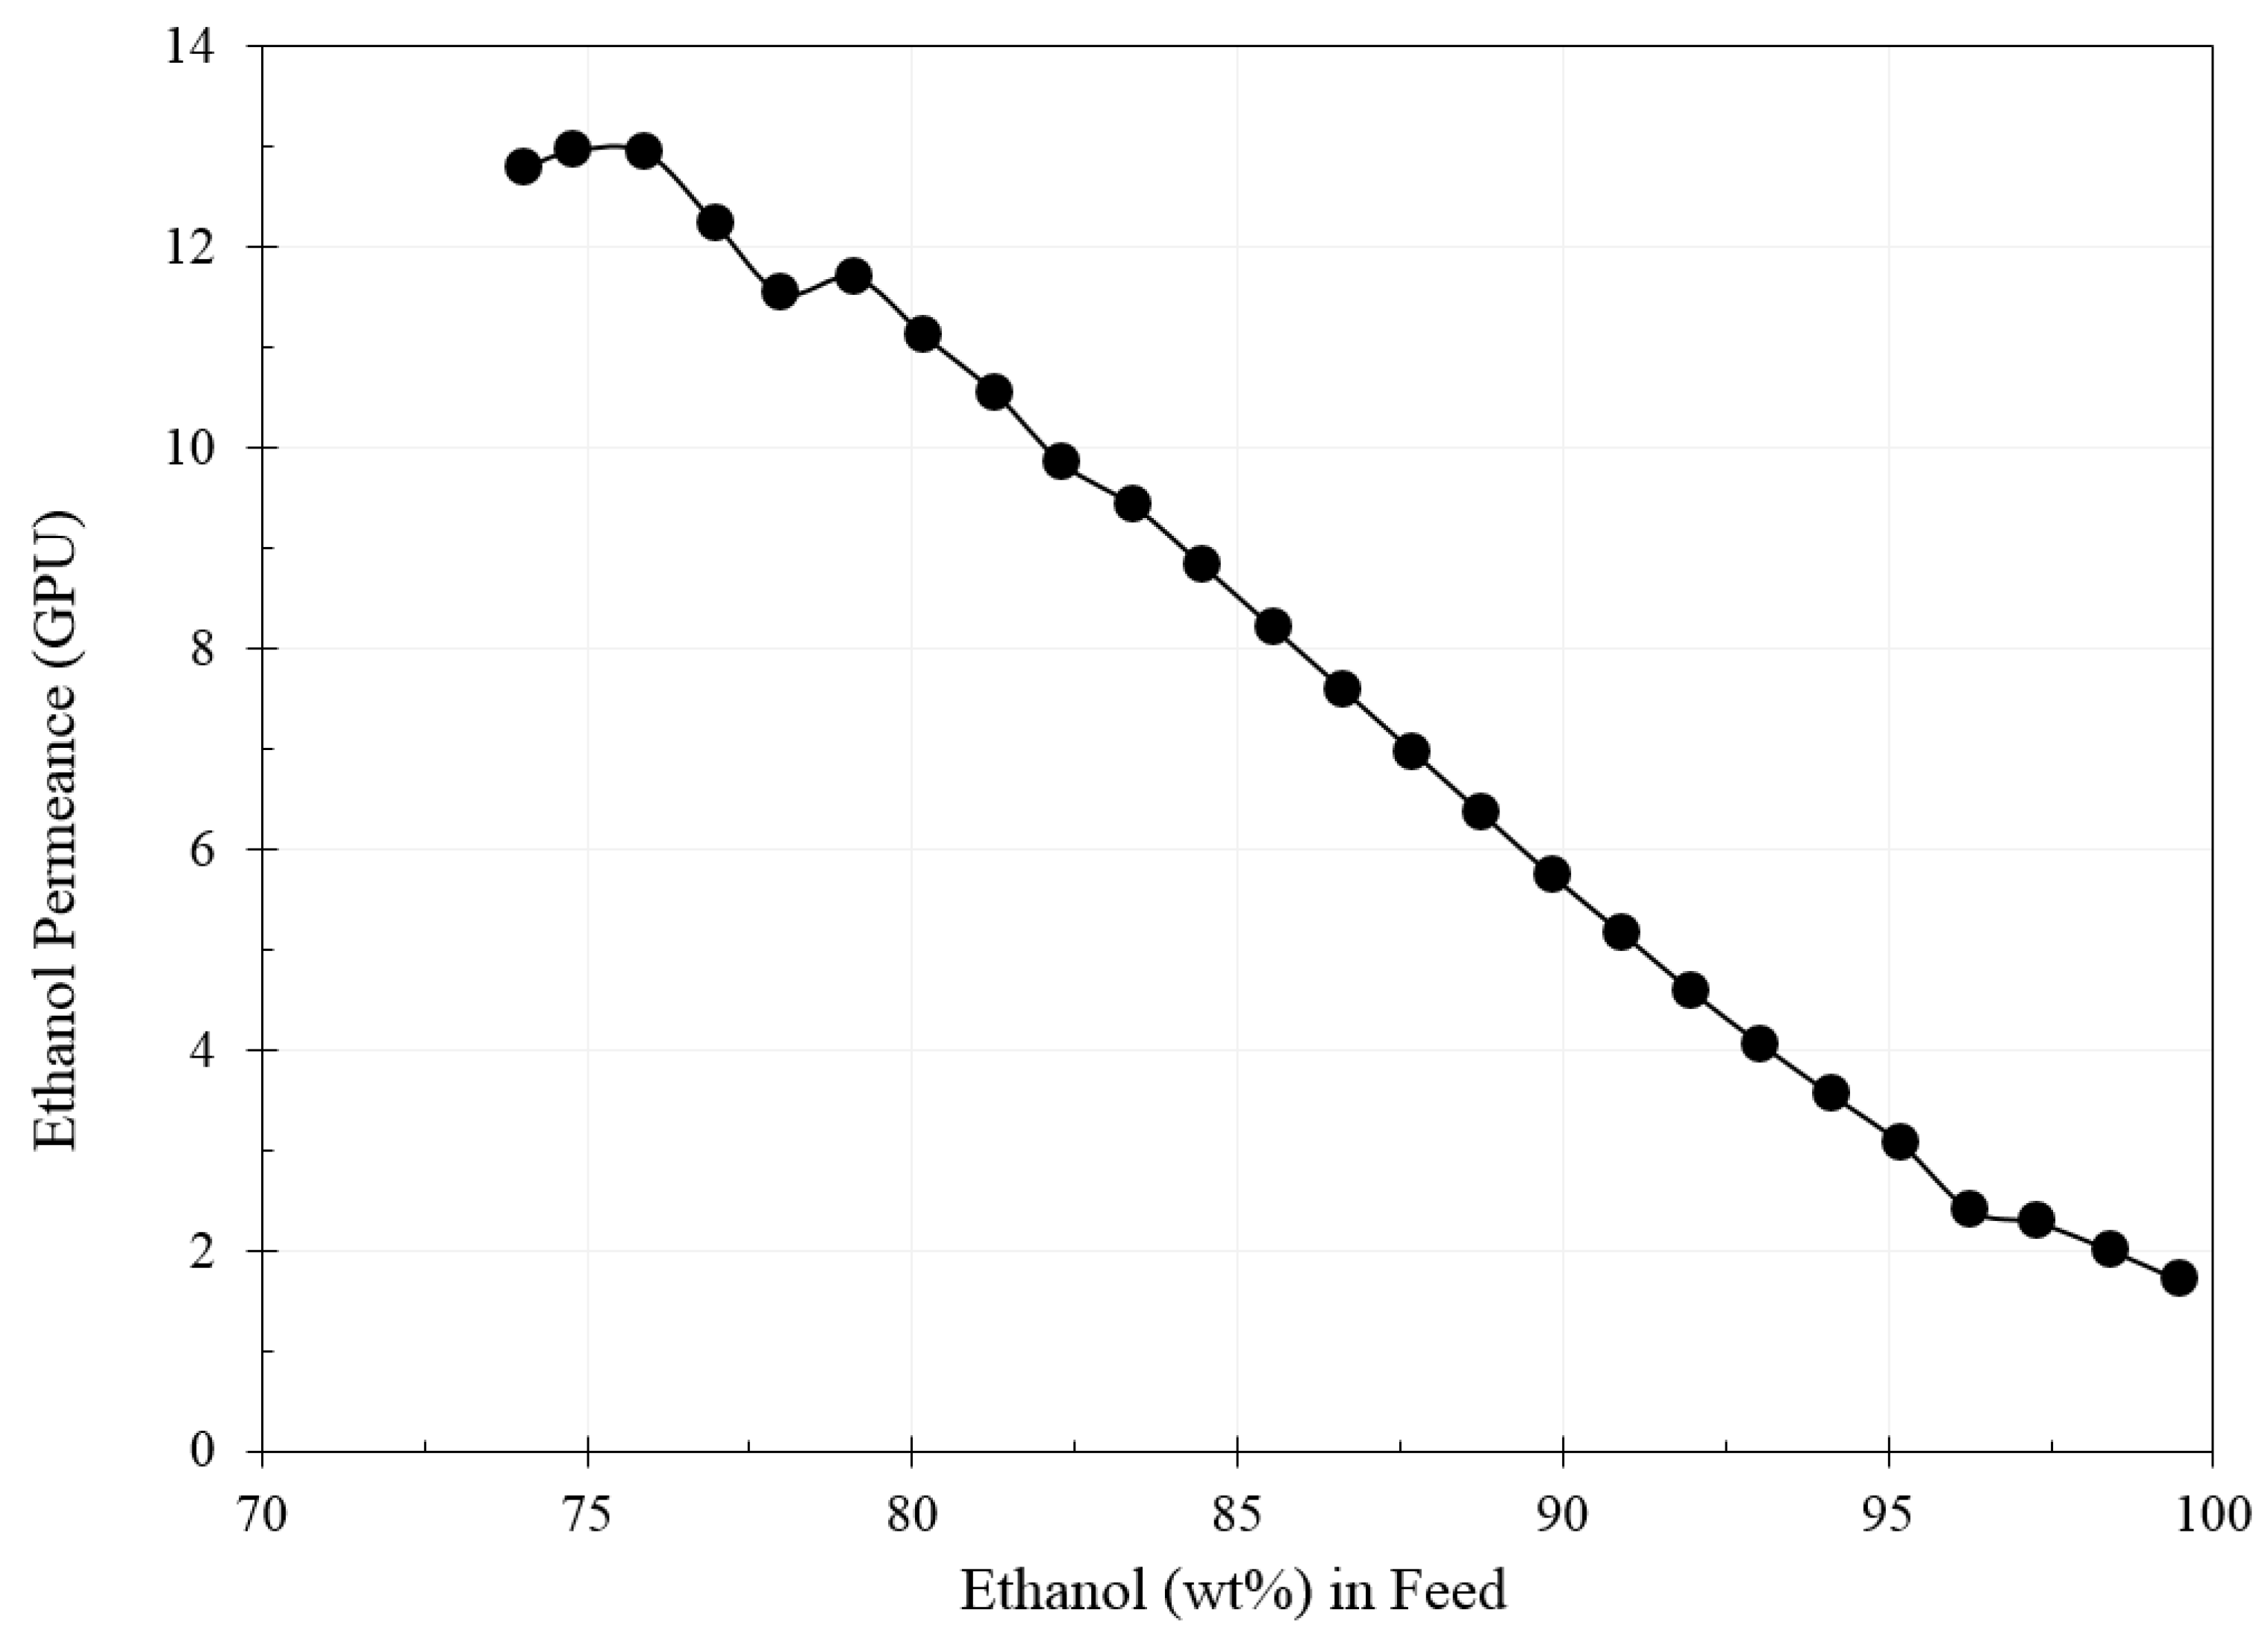
The performance data of the commercial pervaporation membrane are given in Figure 5 and Figure 6. The data are based on ethanol and water permeance as a function of ethanol concentration in the feed. The membrane is hydrophilic, allowing more water molecules to pass through than ethanol. Microsoft Excel® was used to fit permeance data and determine the curve equation. After that, the permeance values were entered into the simulation spreadsheet. After running the simulation, the calculated water content of the permeate was compared to the reported pilot-pant data. The error was defined as
Error   % = Calculated   Value Reported   Value Reported   Value × 100

3. Results and Discussion

The water and ethanol permeance data of Figure 3 and Figure 4 were fitted using a power function, and the following correlations were developed:
Q Water   ( kmol   h 1   m 2   kPa 1 ) = 0.0017 x F e 1.73
Q Ethanol   ( kmol   h 1   m 2   kPa 1 ) = 3 × 10 6 x F e 3.25
Q W a t e r Q E t h a n o l = 567 x 1.52
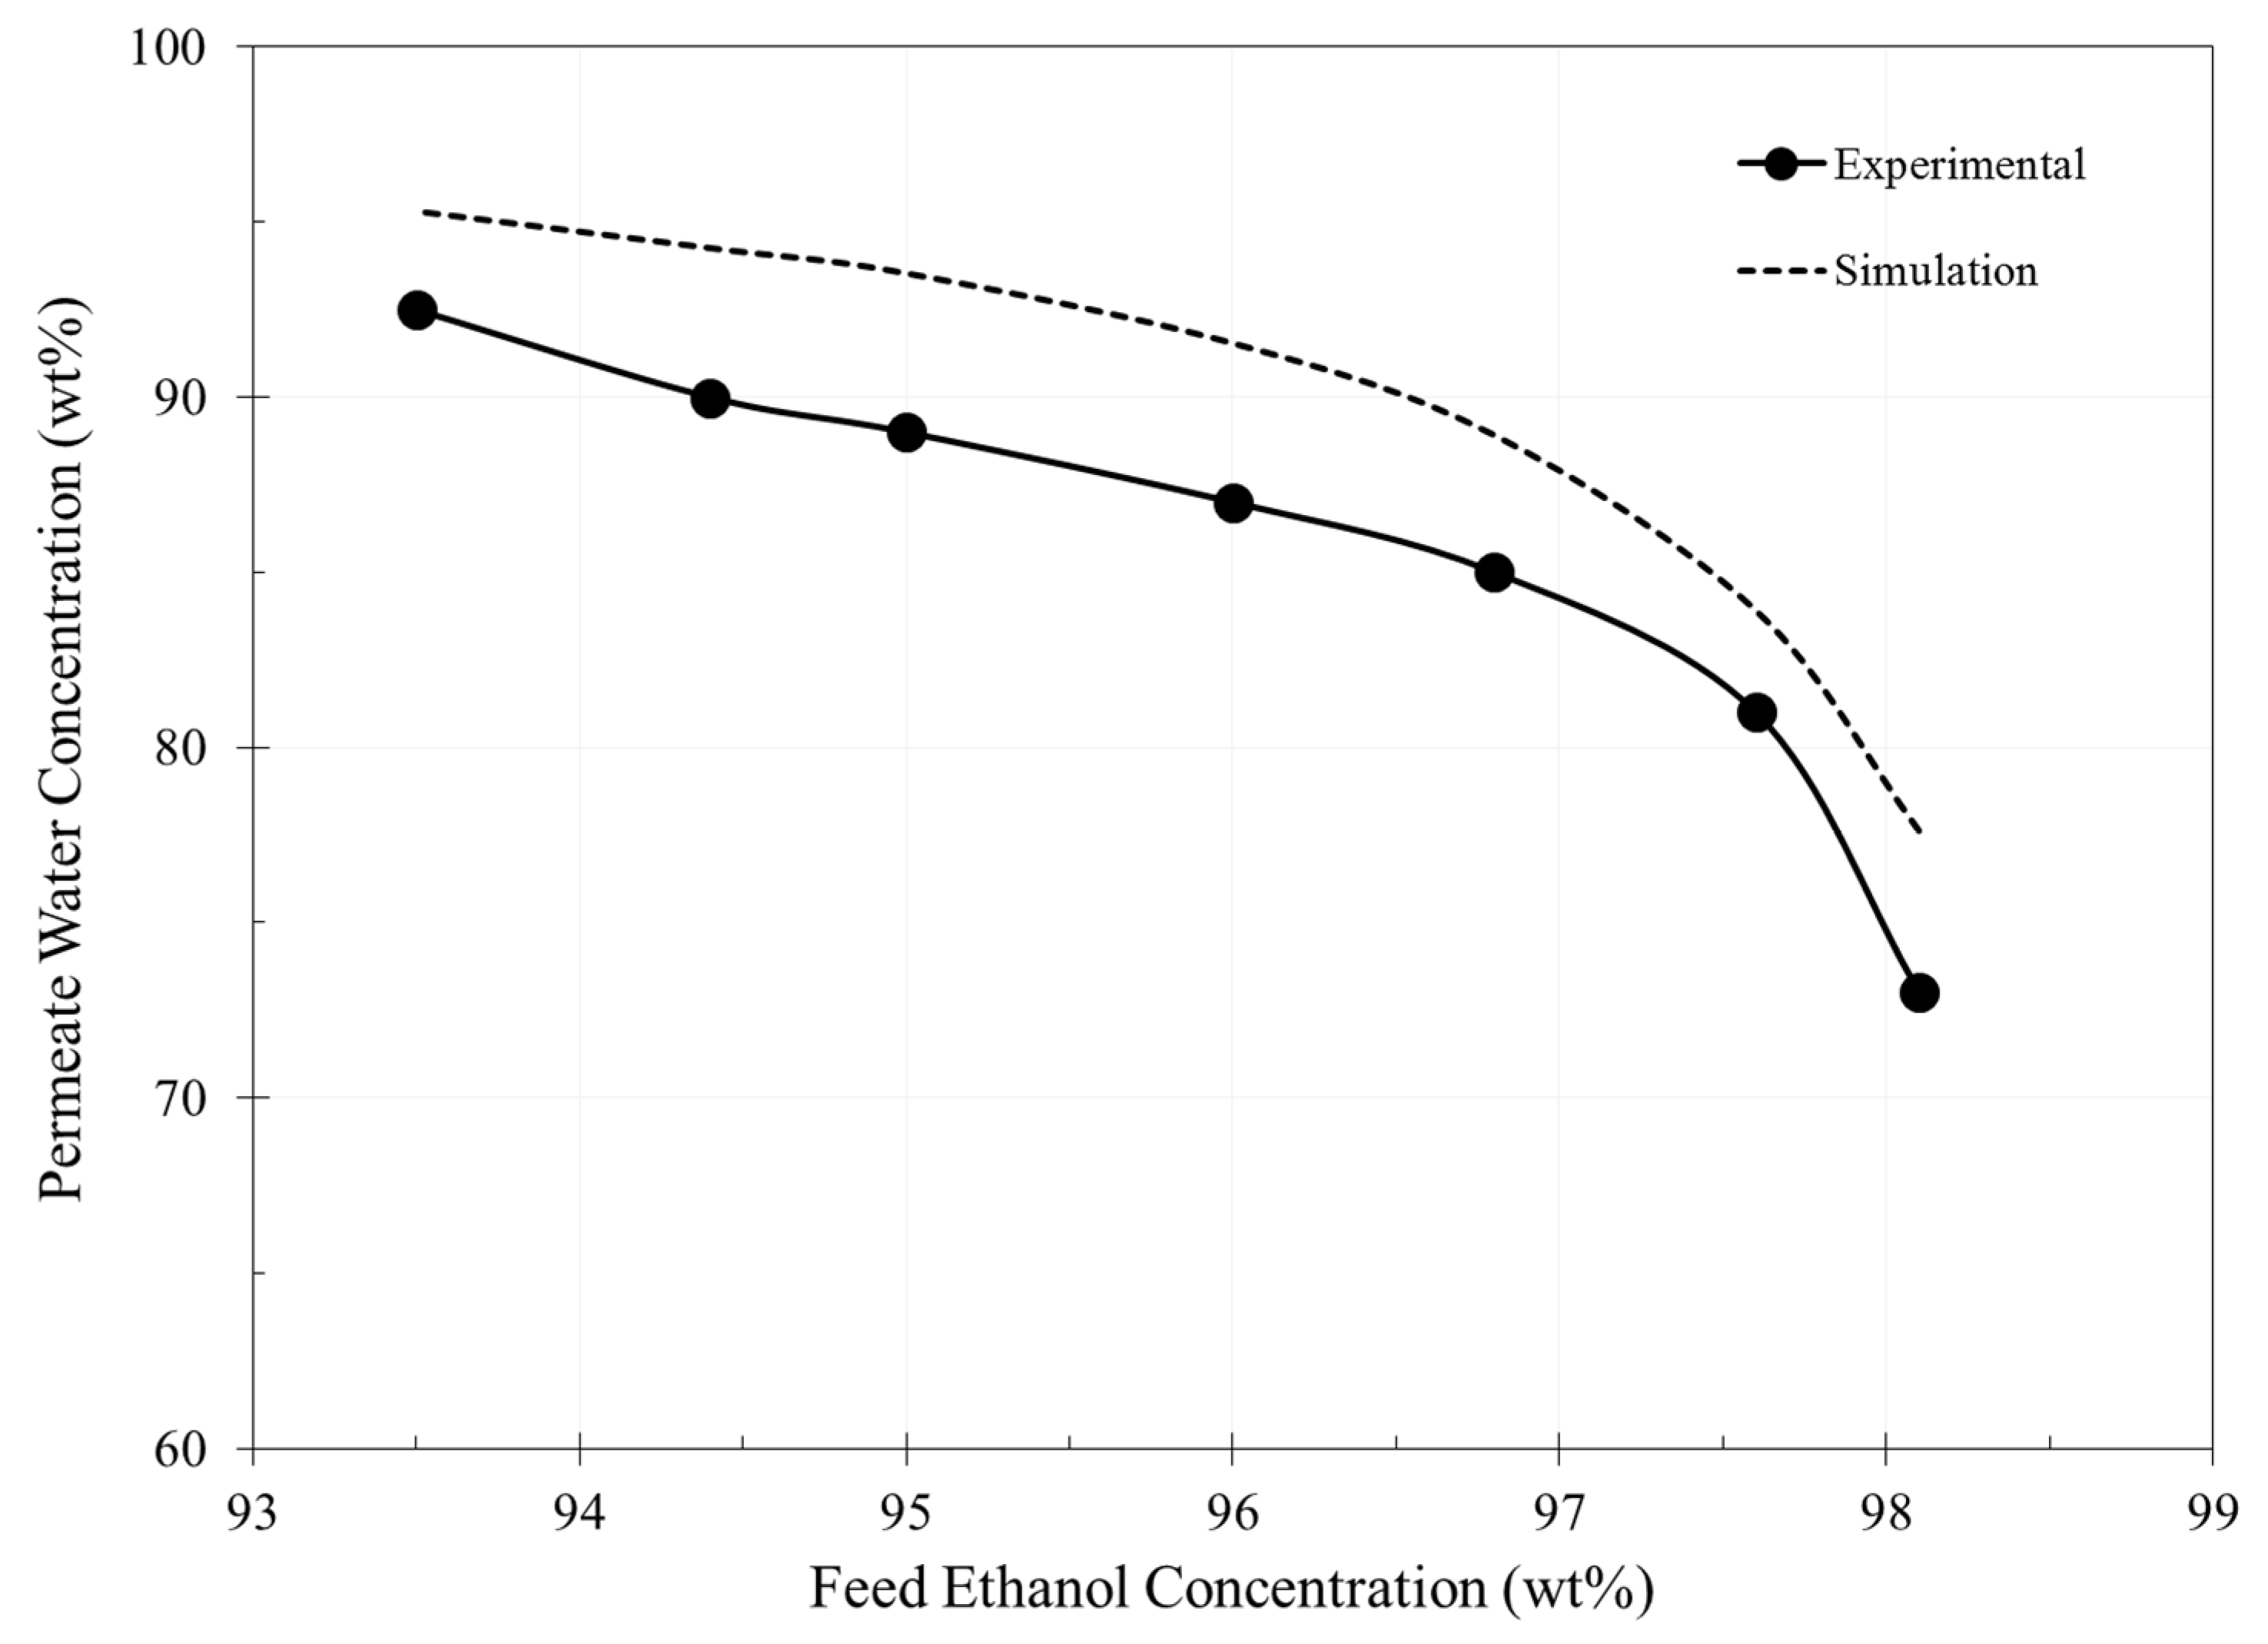
where x F e is the mole fraction of ethanol in the feed. The fitting accuracy was 96% based on the R-squared model. The above permeance data were entered in the spreadsheet, and seven simulation cases were run at different ethanol feed concentrations ranging from 93 to 98 wt%. The results are shown in Figure 7, and the predicted data differ by 4.6% from the simulation, which is acceptable. The error could be related to the accuracy of the developed permeance power functions (Equations (9) and (10)). Moreover, the use of the logarithmic-mean pressure difference (Equation (4)) also introduced an error.
To reduce the calculated error, it is suggested that a correction factor be used by multiplying the estimated water content data by a decimal number. It was found that using a correction factor of 0.954 reduced the error significantly from 4.6 to 0.7% as shown in Figure 8. At this stage, it is concluded that the UniSIM® simulation results are reliable for modeling a commercial pervaporation unit for ethanol–water separation. Nevertheless, the developed correction factor can only be used for ethanol feed ranging from 93 to 98 wt% within the same operating temperature and pressure.

4. Conclusions

Pervaporation membranes can produce high-quality ethanol, whereas the distillation is limited by the azeotrope. The membranes were simulated in the literature, but the reliability of the predicted data is hardly discussed. This work simulated a commercial pervaporation unit in UniSIM® to purify ethanol from water after the azeotrope point. The model was not readily available in UniSIM®, but it was manually constructed using a component splitter, a spreadsheet, and adjustment functions. The model was solved numerically, and the results show that the simulation calculations differ by an acceptable error of 4.6% from pilot-plant data. The error was further reduced to 0.7% by using a correction factor. This study confirmed that the current simulation model is reliable for estimating the performance of the pervaporation membrane for ethanol purification.

Author Contributions

Conceptualization, methodology, and writing—original draft preparation, Y.A.; validation, and formal analysis, S.H.A. All authors have read and agreed to the published version of the manuscript.

Funding

This research received no external funding.

Data Availability Statement

The original contributions presented in this study are included in the article. Further inquiries can be directed to the corresponding author.

Conflicts of Interest

The author declares no conflicts of interest.

References

  1. Latif, M.; Wan Isahak, W.; Samsuri, A.; Hasan, S.; Manan, W.; Yaakob, Z. Recent advances in the technologies and catalytic processes of ethanol production. Catalysts 2023, 13, 1093. [Google Scholar] [CrossRef]
  2. Lachenmeier, D. Safety evaluation of topical applications of ethanol on the skin and inside the oral cavity. J. Occup. Med. Toxicol. 2008, 3, 26. [Google Scholar] [CrossRef] [PubMed]
  3. Freitag, W.; Stoye, D. Paints, Coatings and Solvents; Wiley: Hoboken, NJ, USA, 2008. [Google Scholar]
  4. Cardinali, V.; de Souza, T.; da Costa, R.; Pinto, G.; Roque, L.; Vidigal, L.; Frez, G.; Pérez-Rangel, N.; Coronado, C. Exploring possible pathways for green hydrogen-based transportation in Brazil: Fuel cells, hydrogen engines and dual-fuel combustion. Int. J. Hydrogen Energy 2025, 120, 238–253. [Google Scholar] [CrossRef]
  5. Kunwer, R.; Pasupuleti, S.R.; Bhurat, S.S.; Gugulothu, S.K.; Rathore, N. Blending of ethanol with gasoline and diesel fuel—A review. Mater. Today Proc. 2022, 69, 560–563. [Google Scholar] [CrossRef]
  6. Zentou, H.; Abidin, Z.; Yunus, R.; Awang Biak, D.; Korelskiy, D. Overview of alternative ethanol removal techniques for enhancing bioethanol recovery from fermentation broth. Processes 2019, 7, 458. [Google Scholar] [CrossRef]
  7. Zheng, L.; Wu, H.; Zhou, Z.; Fan, X. Distillation-pervaporation hybrid process for ethanol dehydration: Process optimization and economic evaluation. Chem. Ing. Tech. 2025, 97, 311–323. [Google Scholar] [CrossRef]
  8. Kang, Q.; Huybrechts, J.; Van der Bruggen, B.; Baeyens, J.; Tan, T.; Dewil, R. Hydrophilic membranes to replace molecular sieves in dewatering the bio-ethanol/water azeotropic mixture. Sep. Purif. Technol. 2014, 136, 144–149. [Google Scholar] [CrossRef]
  9. Ong, Y.; Tan, S. Pervaporation separation of a ternary azeotrope containing ethyl acetate, ethanol and water using a buckypaper supported ionic liquid membrane. Chem. Eng. Res. Des. 2016, 109, 116–126. [Google Scholar] [CrossRef]
  10. Yuan, H.-K.; Ren, J.; Ma, X.-H.; Xu, Z.-L. Dehydration of ethyl acetate aqueous solution by pervaporation using PVA/PAN hollow fiber composite membrane. Desalination 2011, 280, 252–258. [Google Scholar] [CrossRef]
  11. Yave, W. Separation performance of improved PERVAP™ membrane and its dependence on operating conditions. J. Membr. Sci. Res. 2019, 5, 216–221. [Google Scholar] [CrossRef]
  12. Koczka, K.; Mizsey, P.; Fonyo, Z. Rigorous modelling and optimization of hybrid separation processes based on pervaporation. Cent. Eur. J. Chem. 2007, 5, 1124–1147. [Google Scholar] [CrossRef]
  13. Basile, A.; Favvas, E. Current Trends and Future Developments on (Bio-) Membranes; Elsevier: Amsterdam, The Netherlands, 2018. [Google Scholar]
  14. Davis, R. Simple gas permeation and pervaporation membrane unit operation models for process simulators. Chem. Eng. Technol. 2002, 25, 717–722. [Google Scholar] [CrossRef]
  15. Schwarz, C. Effect of variation between different experimental VLE data sets on thermodynamic model and separation predictions: NRTL correlation of the ethanol + water system. Ind. Eng. Chem. Res. 2024, 63, 10721–10734. [Google Scholar] [CrossRef]
  16. Chang, J.; Yoo, J.; Ahn, S.; Lee, K.; Ko, S. Simulation of pervaporation process for ethanol dehydration by using pilot test results. Korean J. Chem. Eng. 1998, 15, 28–36. [Google Scholar] [CrossRef]
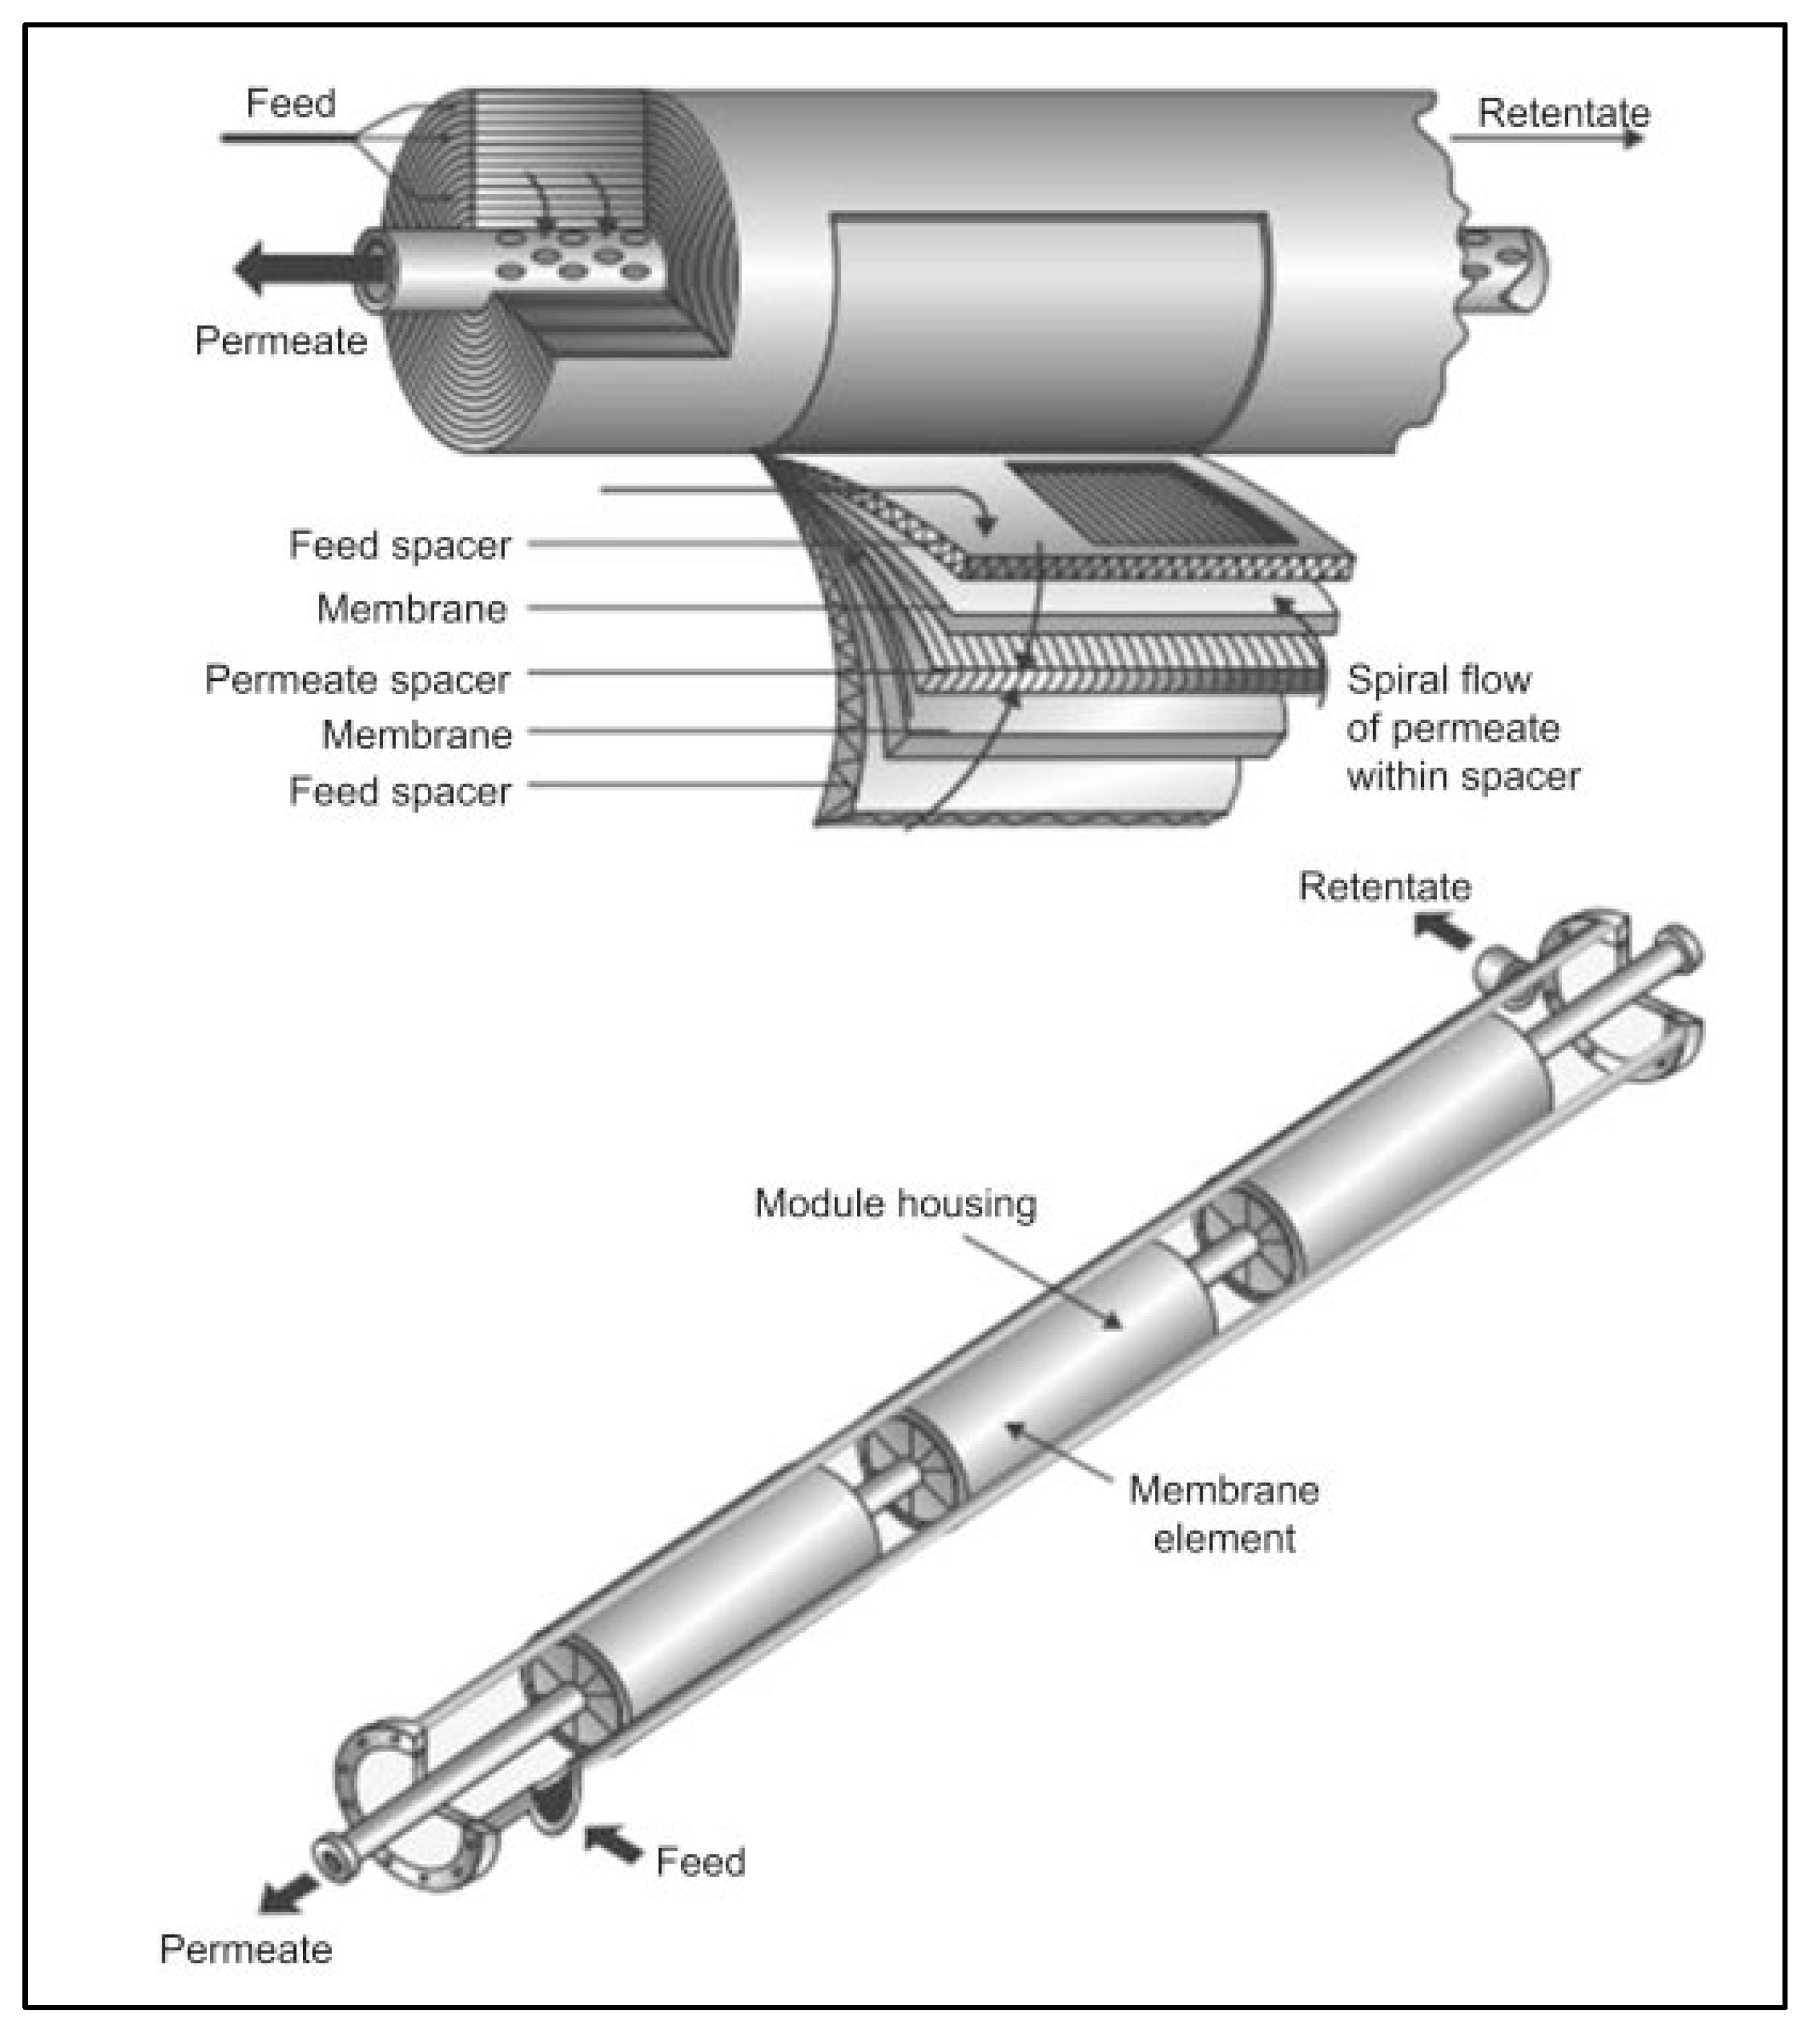
Figure 1. Commercial pervaporation membrane with a spiral-wound module. Reproduced with permission from [13].
Eng 06 00136 g001
Figure 2. Procedure for building and solving the pervaporation unit in UniSIM®.
Eng 06 00136 g002
Figure 3. Process flow diagram of the developed commercial pervaporation unit in UniSIM®.
Eng 06 00136 g003
Figure 4. Operating conditions of the pilot-plant pervaporation membrane for ethanol–water separation.
Eng 06 00136 g004
Figure 5. Water permeance of the commercial pervaporation membrane for ethanol–water separation as a function of ethanol concentration in the feed (data generated from [11]).
Eng 06 00136 g005
Figure 6. Ethanol permeance of the commercial membrane for ethanol–water separation as a function of ethanol concentration in the feed (data generated from [11]).
Eng 06 00136 g006
Figure 7. Comparison between pilot-plant and predicted data of water content at the permeate using a commercial pervaporation unit.
Eng 06 00136 g007
Figure 8. Correction of the simulation results for better estimation of water content at the permeate side of the commercial pervaporation unit.
Eng 06 00136 g008
Disclaimer/Publisher’s Note: The statements, opinions and data contained in all publications are solely those of the individual author(s) and contributor(s) and not of MDPI and/or the editor(s). MDPI and/or the editor(s) disclaim responsibility for any injury to people or property resulting from any ideas, methods, instructions or products referred to in the content.