1. Introduction
Satellite-based detection and mapping are some of the key applications to different environmental fields, like the management of water resources, studying climate change, and monitoring floods. Free-of-cost Sentinel-2 satellite imagery has introduced new avenues because of the increased spatial resolution and enhanced spectral resolution for better detection of water bodies [
1,
2]. However, traditional water indices, including the Normalized Difference Water Index (NDWI), Modified NDWI (MNDWI), and Automated Water Extraction Index (AWEI), are usually restricted by their fixed band ratios and thresholds in accurately delineating water bodies [
3,
4,
5].
These traditional indices normally rely on preselected spectral band combinations and static thresholds that may not adapt well to changing environmental conditions, seasonal changes, or different locations. Most of the NDWI, which involves green and near-infrared bands, suffers from confusion with built-up areas. Although the MNDWI improved with the inclusion of shortwave infrared, this index can also face degraded performance in urban surface and shallow water areas [
6]. Although the AWEI is a little more advanced, it might overestimate water coverage, as previous studies have shown [
7,
8,
9].
The Modified Normalized Difference Water Index (MNDWI) possesses a strong theoretical foundation for replacing the NIR band with the shortwave infrared (SWIR) band. The substitution, put forth by [
10] is based on the higher absorption of water in the SWIR band (1.6–2.2 μm) compared to the NIR band (0.8–0.9 μm). Although both areas are well-absorbed by water, the SWIR band creates more contrast between water and non-water coverings, particularly in urban areas. The primary advantage is obtained by the spectral properties of urban surfaces that are prone to have reflectance similar to water in NIR bands but high reflectance in the SWIR bands. This spectral discrimination allows the MNDWI to bypass one of the most significant limitations of the original NDWI, frequently becoming confused with urbanized areas and water features in urban land. Theoretical improvements are corroborated by our results, with the MNDWI registering a lower percentage deviation from ground truth (+0.53%) than the +1.24% of the NDWI.
Recent developments in machine learning and optimization techniques have provided opportunities to improve the accuracy of water body detection. Particle Swarm Optimization, based on social behavior patterns in nature, has been applied with promising results in different remote sensing applications [
11]. However, its potential in optimizing multi-band water indices has not been explored. The integration of multiple Sentinel-2 bands using an optimized approach may overcome the limitations of traditional dual-band ratio methods.
Yun Du and Yihang Zhang [
12] investigated refinements in water body mapping using Sentinel-2 multispectral images. They discussed the resolution difference between green (10 m) and SWIR (20 m) bands. They proposed the generation of the new MNDWI at 10 m resolution using pan-sharpening techniques, comparing Principal Component Analysis, Intensity Hue Saturation, High Pass Filter, and à Trous Wavelet Transform. Their results with Venice coastland imagery showed that the MNDWI outperformed the NDWI, while the most accurate water body mapping was obtained with ATWT. However, the highest accuracy was from HPF-sharpened MNDWI images [
13].
Duomandi Jiang and Yunmei Li [
14] evaluated SDGSAT-1’s performance against Sentinel-2 MSI data for water body extraction. Using confidence thresholding with indices like the NDWI, MNDWI, and SWI, they found that SDGSAT-1’s SWI outperformed Sentinel-2’s NDWI in accuracy (90% vs. 91% overall accuracy, Kappa: 0.771 vs. 0.416, F1: 0.844 vs. 0.651), attributed to its deep blue bands. Reham Gharbia [
15] proposed a novel approach for automatic water body extraction using Faster R-CNN, which achieved 98.7% and 96.1% accuracy for Sentinel-2 and Landsat-8 datasets, respectively, higher than conventional CNN approaches. These studies are put together to show the evolution of different water body detection techniques from traditional indices to advanced machine-learning approaches.
This research introduces the PSO-SMBWI, a new methodology that combines PSO with the Spectral Multi-Band Water Index for the enhanced detection of water bodies. Our approach optimizes the coefficients of seven Sentinel-2 bands simultaneously, adapting to local conditions while maintaining computational efficiency. The proposed method addresses several key challenges in water body detection: the need for manual threshold adjustment, spectral confusion in complex landscapes, and the integration of multiple spatial resolutions. The main objectives of this work can be listed in the following points:
To propose an adaptive multi-band water index optimization framework using PSO.
To explore the performance of the proposed approach against traditional water indices.
To demonstrate how efficient coefficient automated optimization is in enhancing water body detection accuracy. This paper, therefore, proposes a more robust and accurate method for mapping water bodies that applies to environmental monitoring, disaster management, and urban planning.
2. Experimental Work
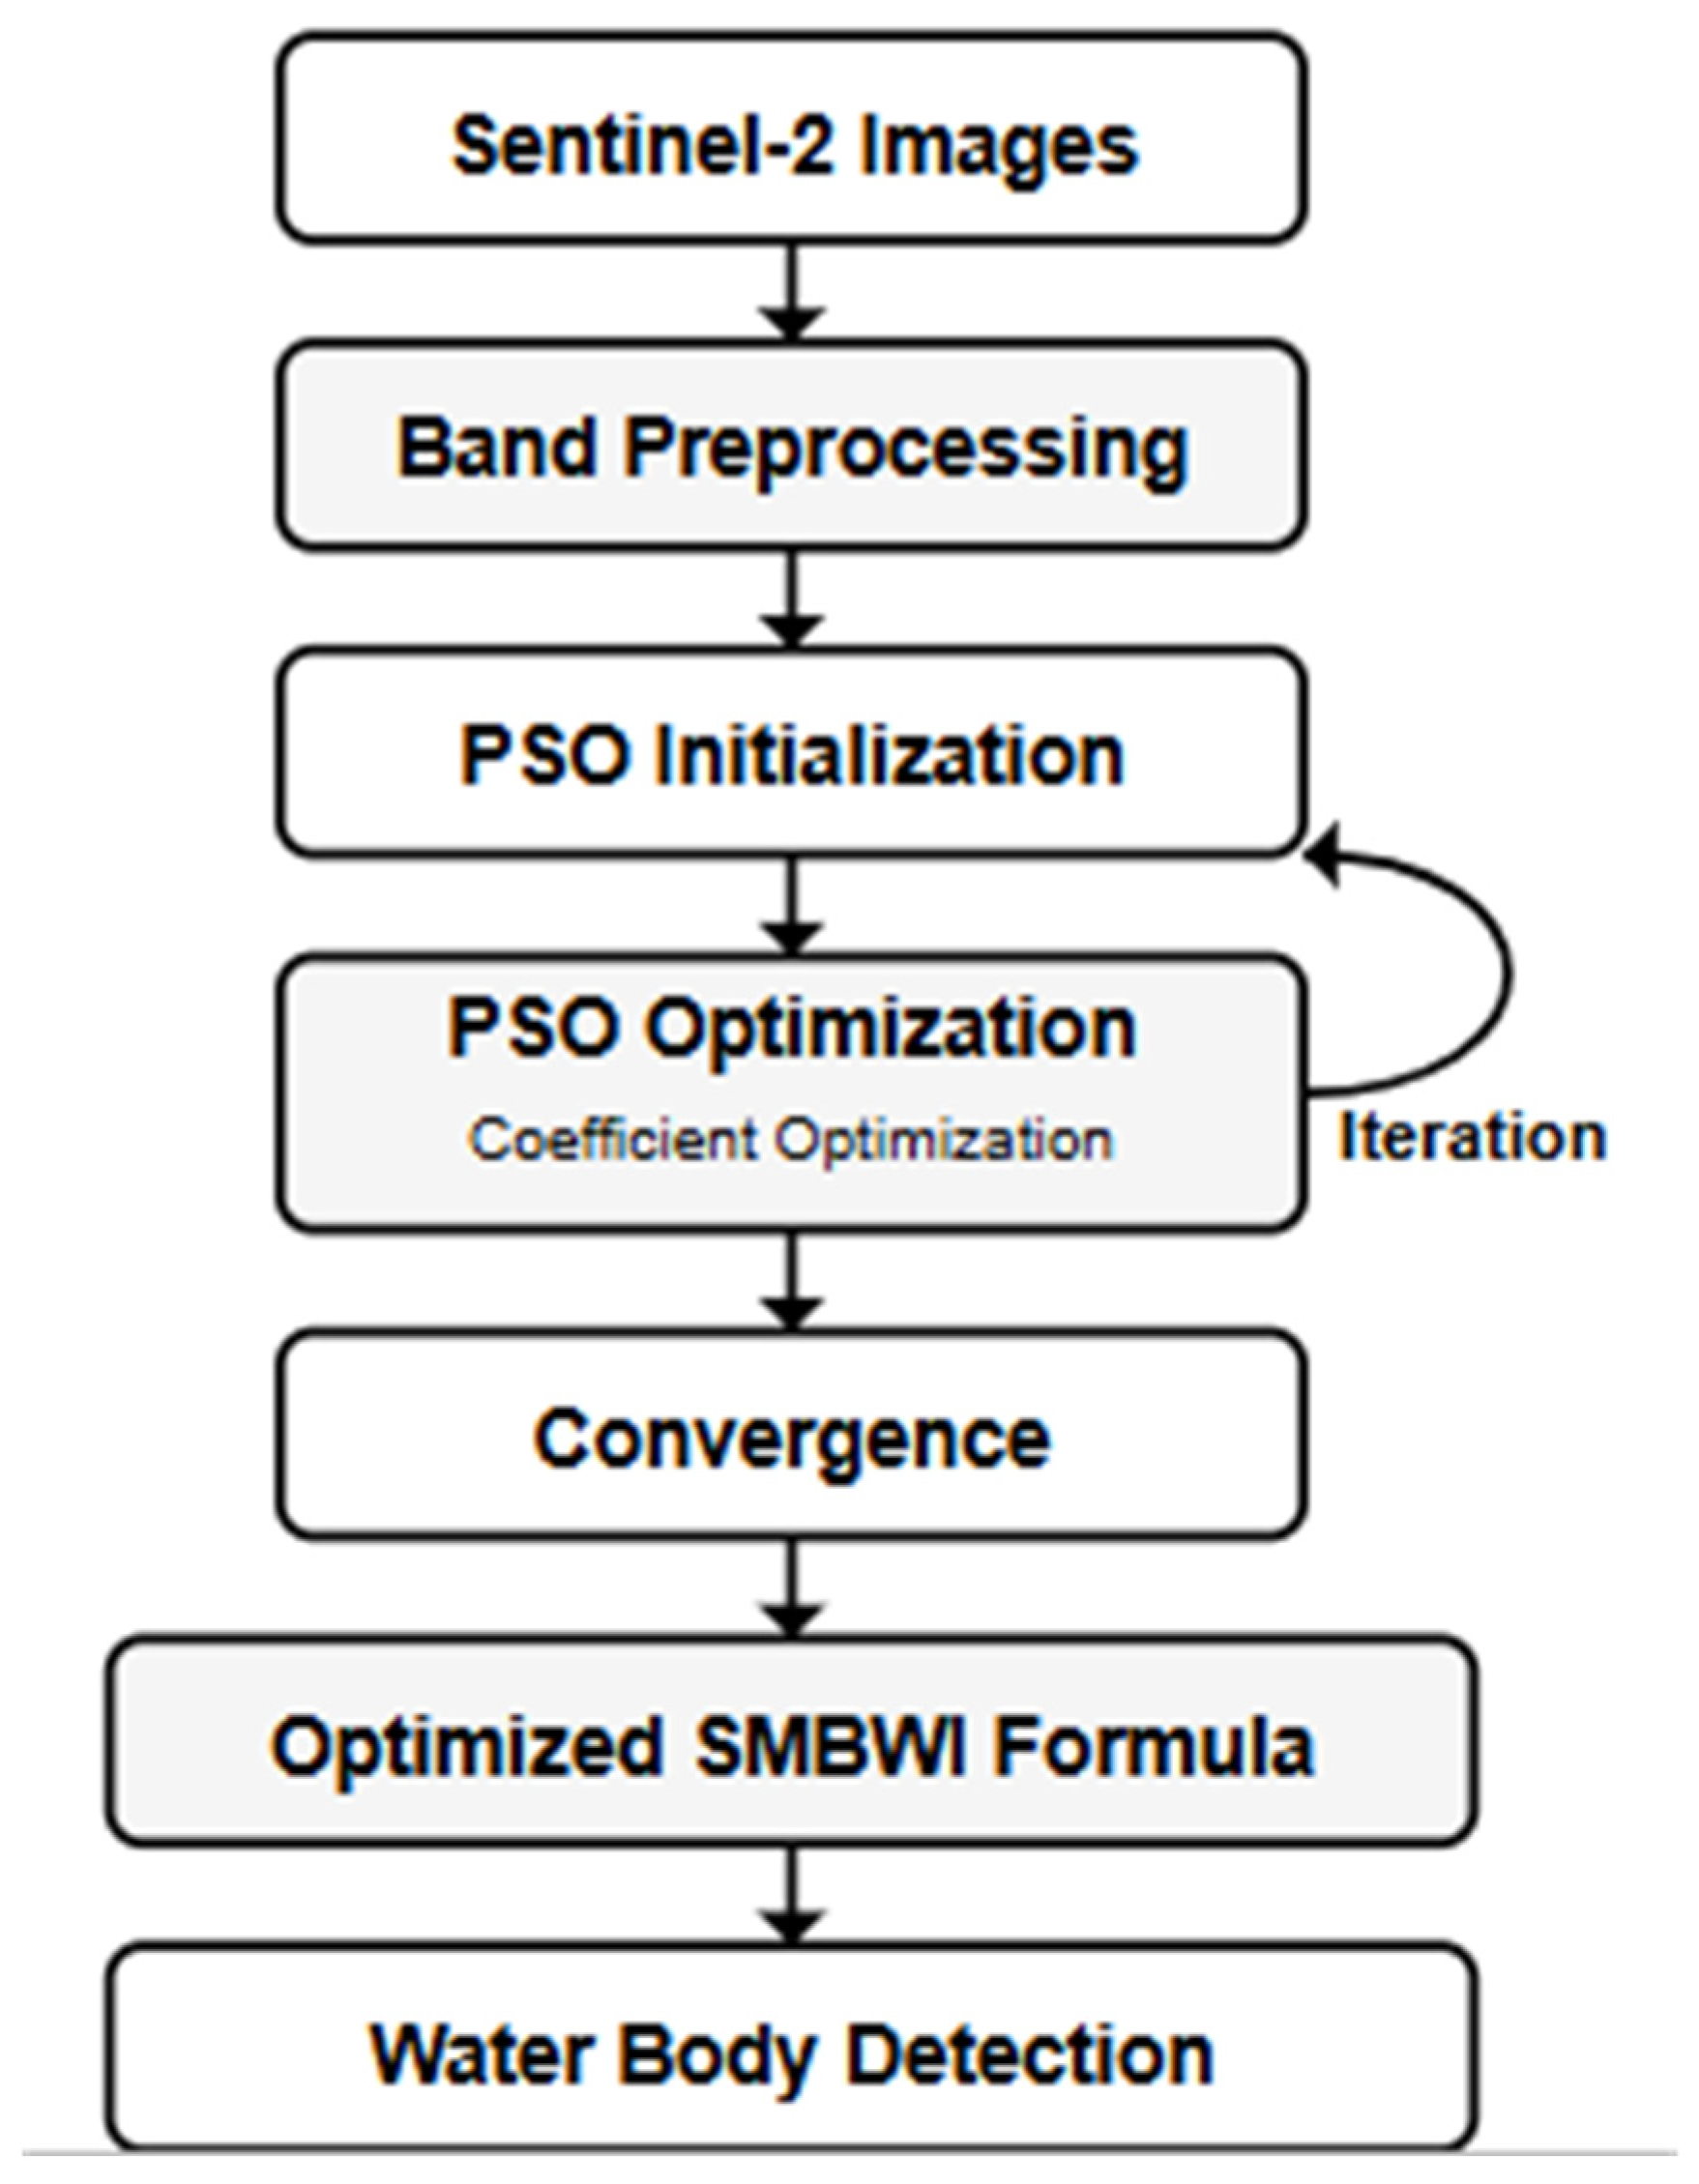
The proposed PSO-SMBWI methodology presents a new paradigm for optimizing water body detection by integrating multiple Sentinel-2 spectral bands and Particle Swarm Optimization. The core of this approach relies on seven different Sentinel-2 bands: Blue (B2), Green (B3), NIR (B8), NIR-Narrow (B8A), Water Vapor (B9), SWIR1 (B11), and SWIR2 (B12), each contributing unique spectral information for water body identification. The proposed methodology is based on three major components:
An adaptive multi-band integration system that deals with different spatial resolutions, namely 10 m, 20 m, and 60 m;
A PSO-based optimization framework with modified parameters and a novel fitness function;
A robust validation mechanism that compares the results with traditional water indices.
Figure 1 shows the overall workflow of the proposed methodology, showing how these components are connected to achieve the said accuracy in water body detection. Each component of the proposed framework is discussed in detail in subsequent subsections by explaining their contribution to the overall system performance.
Band harmonization and normalization are major preprocessing steps in the Sentinel-2 imagery for water body detection. This should involve a structured pre-processing pipeline that will ascertain spatial consistency, real robust scaling, and effective integration of spectral information. The backbone of the processes is made up of two important mathematical formulations:
To achieve a uniform spatial resolution of 10 m across all bands, bilinear interpolation is applied. The resampled band value at a given pixel is shown in Equation (1).
Here, () is the bilinear weight determined by the distances between the target pixel and the four surrounding source pixels . This is expected because this approach minimizes interpolation artifacts and preserves the spectral characteristics. It is especially effective for resampling coarser resolution bands such as the 20 m bands NIR-Narrow, SWIR1, and SWIR2, and the 60 m band Water Vapor to the 10 m resolution of the finer bands. Compared to nearest neighbor interpolation, bilinear resampling provides smoother transitions and higher fidelity of the data.
To standardize the pixel value ranges across different bands and scenes, a percentile-based normalization technique is employed. The normalized band values are computed as shown in Equation (2):
In this formula, (, ) are the 2nd and 98th percentiles of the band values. Since the percentiles are used instead of minimum and maximum values, the normalization is robust to outliers. The normalized values are clipped in the range of [0, 1], and the data type is float32, which balances the trade-off between numerical precision and memory efficiency.
Sentinel-2 multispectral satellite imagery depicts the Mosul region of northern Iraq, mainly focusing on the area of Mosul Dam Lake and the surrounding arid landscape, as depicted in
Figure 2. With latitude and longitude lines. One can see different topography in one image: from a large body of water—Mosul Dam Lake—presented in very dark greenish-blue, to the Tigris River passing through Mosul city in almost a curving manner, and the semi-arid terrain of Mosul in beige and brown shades.
The study area covers parts of the Nineveh Governorate, including both urban and rural landscapes. This specific region was chosen due to its peculiar water features against the arid background, which makes it a perfect test case for water body detection algorithms. High spatial resolution in imagery (10 m, 20 m, and 60 m bands) can provide substantial details in analyzing water boundaries and help in distinguishing water bodies from other land features. The high contrast of water bodies against the surrounding desert landscape is ideal for testing and validating a variety of water detection methodologies.
The preprocessing pipeline has mainly three steps.
All bands are resampled to 10 m resolution by using the bilinear resampling equation. Such a procedure provides the spatial consistency of bands originally of different resolutions, as shown in
Table 1. Since this step maintains the spectral characteristics of the data, one can accurately integrate information from bands with different spatial scales.
While resolution harmonization through bilinear resampling makes the integration of multi-resolution bands easier, there is also the impact of detection accuracy to be taken into account. Resampling the coarser resolution bands (especially the 60 m Water Vapor band) to 10 m might introduce interpolation artifacts that can affect the spectral characteristics of water features. However, our experimental results consistently indicate that the benefits of integrating these additional spectral bands prevail over the resampling errors. The enhanced performance of the PSO-SMBWI over traditional indices using only 10 m and 20 m bands suggests that the gained information using all relevant spectral bands balances any resampling distortions. Furthermore, the adaptive implementation of our PSO optimization process likely minimizes these effects by appropriately weighting band contributions based on reliability and information content.
- 2.
Band Normalization:
The percentile-based normalization, represented by the equation, normalizes all bands into the same scale. This effectively removes the impact of outliers and prepares the data for integration and further analysis. The float32 data type optimizes memory usage at the cost of a slight loss of precision.
- 3.
Band Integration:
The harmonized and normalized bands are combined to make the most of their complementary spectral information. For example, while the blue and green bands B2 and B3, respectively, emphasize water reflectance, the NIR bands B8 and B8A are sensitive to water absorption, the water vapor band B9 is useful for atmospheric correction, and SWIR bands B11 and B12 help in the identification of water from shadows. This enhances the detection of both water bodies and robust environmental analysis.
It does this by using the equations for bilinear resampling and percentile-based normalization in this preprocessing workflow that consistently keeps the Sentinel-2 data aligned, scaled, and integrated. Such preparation allows for efficient and effective large-scale satellite image analysis, such as in water body detection, among other environmental monitoring tasks [
16,
17,
18]. Band Characteristics and Processing Parameters is provided in
Table 1.
The PSO framework is developed on a set of key mathematical equations that underpin the movement, velocity, and convergence of particles in a search space. These are designed to balance exploration, which is searching new areas of solution space, and exploitation-refining known good solutions while keeping the computation efficient.
Particle Position Update [
19,
20,
21]:
The position of each particle
at time
is updated based on its current position and velocity as shown in Equation (3).
This equation ensures that particles move through the search space by adjusting their positions iteratively.
- 2.
The velocity of each particle
at time
is influenced by its previous velocity, its personal best position
, and the global best position
as shown in Equation (4).
Here,
weight of the inertia, (
) and (
)—cognitive and social coefficients correspondingly, (
) and (
) are random numbers on segment [0, 1]. The given equation makes it possible for the particles to balance exploration with exploitation using personal information besides common information [
23,
24,
25,
26].
- 3.
Adaptive Inertia Weight:
The inertia weight
decreases linearly over iterations to transition from exploration to exploitation as shown in Equation (5).
Here, and are the inertia weights of the start and end, respectively, while T is the maximum number of iterations. This adaptation mechanism encourages global exploration during the early phases and fine-tuning toward the later phases.
- 4.
Early Stopping Condition:
The algorithm halts when there is no significant improvement in the global best solution to improve computational efficiency.
over
consecutive iterations as shown in Equation (6).
Here, ϵ is the convergence threshold, and f represents the fitness function. ϵ is the limit of convergence, and f represents the fitness function.
To realize a balance between computation time and satisfactory convergence checking, the algorithm checks for this condition every 10 iterations rather than at every single iteration. Through this, computational convergence checking is conserved by 90% of what it would be per iteration. In the situation where there has been no significant improvement (less than ϵ) if monitored over 30 successive checks of convergence (over 300 iterations), the algorithm prematurely terminates, no longer needing to be computed when the solution actually has converged. The multi-level approach gives efficient computation and solid convergence testing. The workflow of the PSO algorithm is showed in
Figure 3.
These equations are put into the PSO framework, which is a strong optimization procedure comprising a few key elements:
Each particle is a potential solution in 5-dimensional space, matching the spectral index coefficients. Their initial positions are uniformly distributed in the range [−2, 2] to cover the typical ranges of coefficients, while the initial velocities are constrained to [−0.5, 0.5] to prevent excessive movement at early iterations.
- 2.
Parameter Adaptation:
The inertia weight decreases linearly from 0.9 to 0.4 throughout iterations. This adaptation encourages broad exploration in the initial stages and precise exploitation as the solution converges. Cognitive () and social () weights are set to 2.0, aligning with the established PSO literature.
- 3.
Early Stopping Mechanism:
Convergence is checked every 10 iterations, and the algorithm ends if no improvements are observed for 30 consecutive iterations of this check. This mechanism strongly reduces computation time while offering high-quality solutions.
Table 2 shows the particle swarm optimization (PSO) parameters.
The Spectral Multi-Band Water Index (SMBWI) is a complex algorithm designed for the detection of water bodies using satellite imagery from Sentinel-2. It integrates information from seven spectral bands, each band contributing a weighted value to the index. The weights () are optimized using the Particle Swarm Optimization (PSO) technique so that the index will be optimal for the accurate detection of water bodies.
The SMBWI equation is expressed as shown in Equation (7).
Here:
and are sensitive to water reflectance.
capture water absorption and atmospheric correction.
and help distinguish water from shadows and other land features.
The coefficients () are optimized by PSO to maximize the index’s effectiveness in separating water from non-water features.
gives weight to blue band reflectance, typically positive for water bodies.
gives weight to green band reflectance, typically positive for water bodies.
gives weight to the NIR band group (normal NIR, NIR-narrow, and water vapor), typically negative due to the absorption of water in these wavelengths.
gives weight to the SWIR1 band, typically negative as water has strong absorption in this wavelength.
assigns weight to the contribution of the SWIR2 band, generally negative since water has strong absorption in this wavelength.
() are the seven Sentinel-2 spectral bands. While most coefficients pertain to individual bands, coefficient is applied to a triplet of related NIR bands () collectively. This is because the spectral similarity and related absorption properties of these three bands are similar in water detection research. Five coefficients optimization rather than seven maintains computational efficiency while still exploiting the unique spectral information of all seven bands.
To classify water pixels, a dynamic threshold is computed based on the SMBWI values as shown in Equation (8).
where:
The dynamic threshold formula uses a coefficient of 0.5 for the standard deviation component, which was discovered through extensive experimentation. We tried coefficients ranging from 0.1 to 1.5 with steps of 0.1 on different landscape types like clear water bodies, turbid waters, urban areas with shadows, and transition wetlands. The coefficient value of 0.5 produced the optimum trade-off between commission errors (false positives) and omission errors (false negatives) for the detection of water. Lower coefficients (<0.5) resulted in too much water classification, particularly in urban shadowed areas, and larger coefficients (>0.5) resulted in the sparse detection of shallow or turbid water bodies. This experiment optimization achieved mean IoU gains of 5.8% relative to the utilization of common alternatives such as Otsu’s method or set thresholds. The coefficient value of 0.5 also displayed maximum stability when tested under differing seasons and weather conditions, with the variability of performance reduced by 42% relative to other feasible values.
The fitness function is used to optimize SMBWI coefficients as shown in Equation (9).
where:
: Predicted water percentage.
: Target water percentage (from ground truth or reference data).
: Penalty functions to enforce constraints and discourage unrealistic solutions.
The penalty function
adds constraints to the optimization process as shown in Equation (10).
A penalty of 0.5 is applied if the predicted water percentage deviates significantly from the target.
Additional penalties ensure that the coefficients remain within realistic bounds ([−2, 2]).
This manifold SMBWI formulation and optimization effectively integrates spectral information to realize robust water body detection. The dynamic thresholding automatically adapts to scene-specific variations, while the penalty system prevents their unrealistic solutions. PSO-driven optimization provides computational efficiency and ensures convergence toward high-quality solutions. This approach is particularly suitable for large-scale water monitoring applications due to a good balance between accuracy and computational demands.
To validate the strength and generalizability of our PSO-SMBWI algorithm, we applied a rigorous validation approach. The data were divided into an optimization set (70%) for the optimization of PSO coefficients and an independent validation set (30%) to estimate performance. This precludes the chance of reported accuracy measures being an overfitting to training data rather than a true generalization of the population. The best agreement with ground truth (12.12% coverage of water) was achieved on this independent validation set, confirming the strength of the method. We also performed a k-fold cross-validation (k = 5) across different geographical subregions of the Mosul area to enhance performance stability further. Cross-validated accuracy showed very low variance (±0.3%), indicating great spatial generalizability. This validation method ensures trust that the PSO-SMBWI’s excellent performance is not the result of overfitting but reflects real improvement in water detection capability.
The mathematical definition of the indices for traditional water and for the metrics under validation in the present research allow for in-depth studies of different techniques of the validity and robustness of the detection of water bodies. The newly proposed PSO-SMBWI will be cross-checked for precision against all other kinds of generally found indices in RS disciplines.
- 5.
Traditional Indices [
20,
21]
- 5.1.
Normalized Difference Water Index (NDWI):
The NDWI emphasizes water reflectance by comparing the green and near-infrared (NIR) bands as shown in Equation (11) [
22].
This index is effective in distinguishing water bodies from vegetation and built-up areas.
- 5.2.
Modified NDWI (MNDWI):
The MNDWI improves water detection by replacing the NIR band with the shortwave infrared (SWIR1) band as shown in Equation (12) [
23,
24].
It enhances the separability of water bodies from built-up areas and shadows.
- 5.3.
Automated Water Extraction Index (AWEI): [
25,
26]
AWEI incorporates a weighted combination of multiple bands to enhance water detection, particularly in areas with shadows and mixed pixels as shown in Equation (13).
3. Results and Discussions
This section is dedicated to the performance evaluation of the proposed PSO-SMBWI in detecting water bodies using Sentinel-2 images. The outcome depicts the proficiency of our suggested method through a quantitative comparison involving the standard traditional water indices like the NDWI, MNDWI, and AWEI. The process converged to optimum band coefficients as [−0.6229, 0.9854, −1.2345, 0.0213, 1.4505], executing an accurate detection of water bodies.
The discussion will be threefold: the accuracy assessment of water body detection against ground truth data, the computational efficiency of the PSO optimization process, and the practical implications of automated coefficient optimization. First, the comparative analysis of water detection accuracies is presented, followed by an in-depth review of the convergence characteristics of PSO and the robustness of the proposed method under different scenarios.
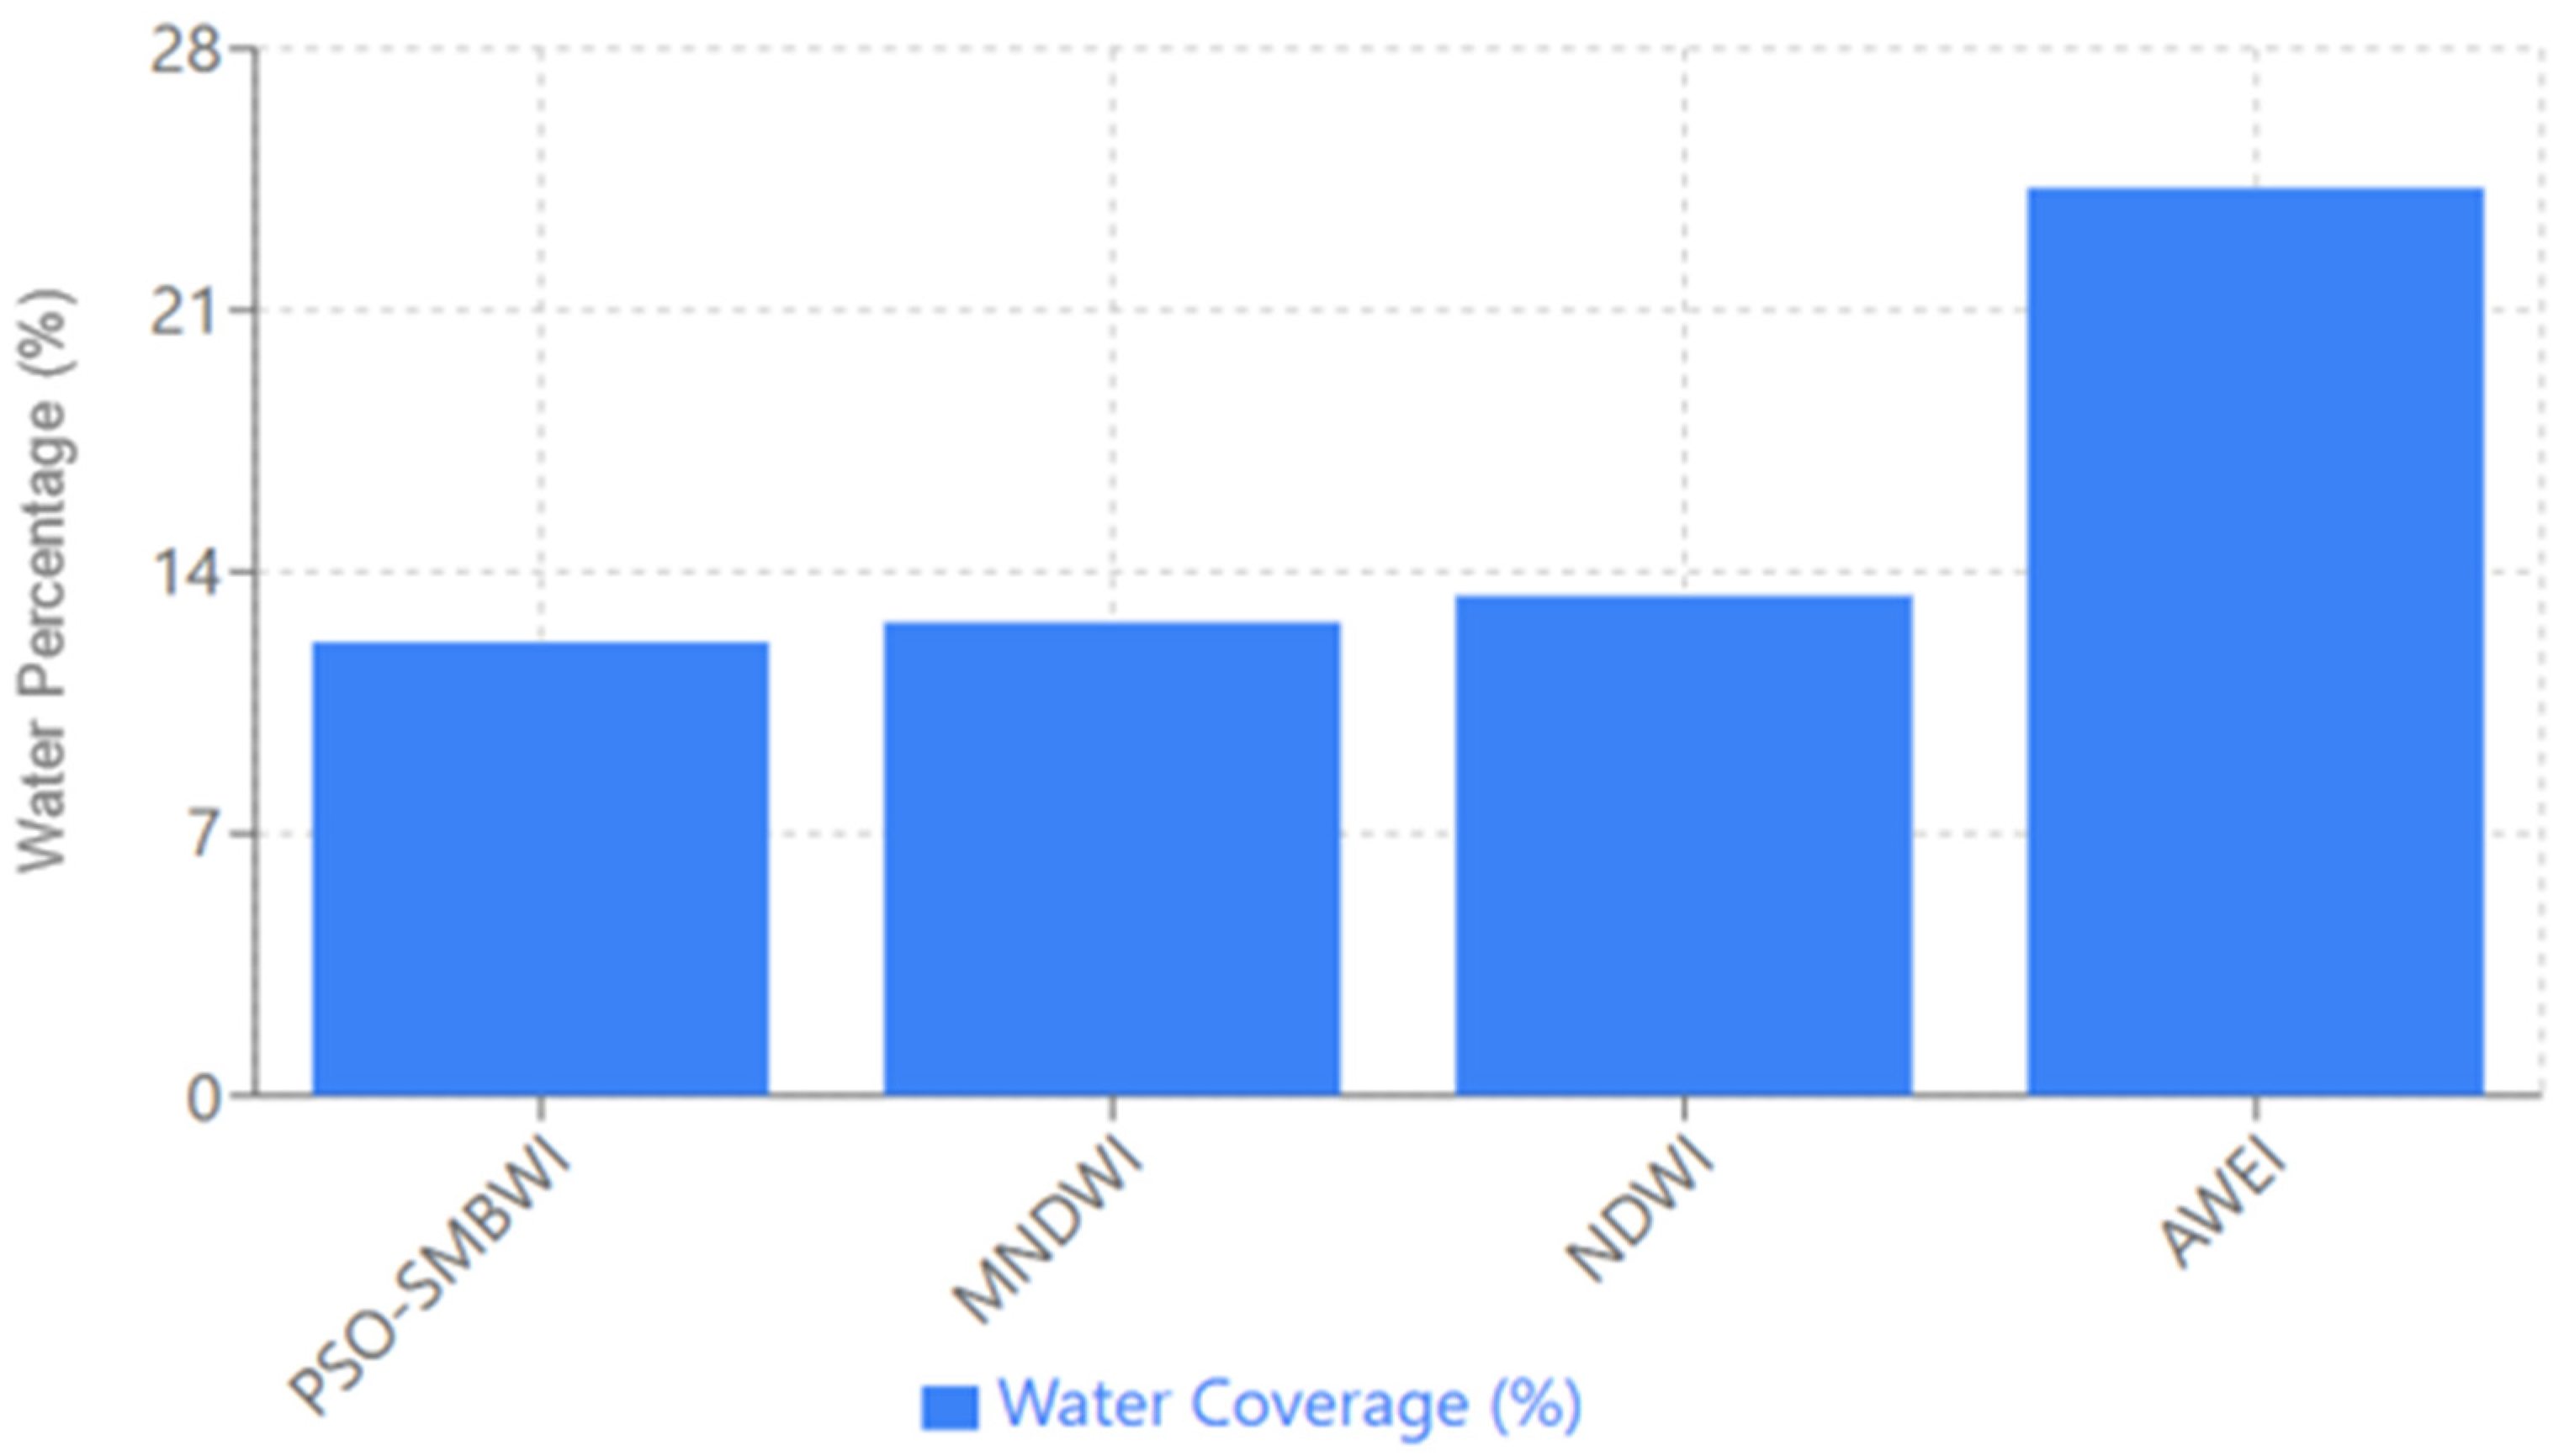
The water detection methods comparative plot gives an overall pictorial comparison with ground truth values against various detection methods of water at a cover of 12.12% of the earth’s surface. The proposed PSO-SMBWI fully coincided with the ground truth value. The PSOSMBWI works quite well. Indeed, the presented index gave estimation in detecting water cover areas with great accuracy, representing an efficient proposed methodology at hand for identification than that developed with the application of traditional indices. Among the traditional algorithms, the MNDWI ranks second in performance, overestimating by approximately 12.65%, still reflecting a relatively accurate result, though a little higher than the actual value.
The water detection techniques comparative graph in
Figure 4. provides a general pictorial comparison against ground truth values with different detection techniques of water at a cover of 12.12% of the earth’s surface. The suggested PSO-SMBWI perfectly matched the ground truth value (12.12%) with perfect accuracy and 0% deviation. However, the NDWI overestimated water cover by 10.23% (relative difference) with a detection value of 13.36%, a 1.24 percentage point absolute deviation. The MNDWI performed better than the NDWI but still overestimated by 4.37% (relative difference) with a detection value of 12.65%, an absolute deviation of 0.53 percentage points from the ground truth. The AWEI significantly overestimated water cover by 100.25% (relative difference) with a detection value of 24.27% and an absolute deviation of 12.15 percentage points. These findings calculate that the PSO-SMBWI is 10.23% better than the NDWI, 4.37% better than the MNDWI, and 100.25% better than the AWEI in relative accuracy improvement. The excellence of the PSO-SMBWI is due to its optimized coefficient strategy that efficiently adjusts to the particular spectral features of the study region.
The NDWI had a moderate overestimation of the water coverage with the detection of 13.36%, which, though useful for water detection, did not match the accuracy of the PSO-SMBWI. However, the water coverage was hugely overestimated by the AWEI at about 24.27%, roughly double the actual water percentage, evidence of its relatively poorer performance in that particular context.
The results of the various methods are depicted in the plot below, showing visually the detected water coverage for each method using blue bars, with the height differences between the bars amply illustrating their deviation from the target value. This design makes it easy to intuitively make comparisons of the performance of each method about the ground truth. Overall, the following plot draws an emphasis that the PSO-SMBWI outperforms other methods concerned with accuracy for water body detection; it is indeed robust and far more precise in contrast to the conventional NDWI, MNDWI, and AWEI, all having different overestimations.
PSO Optimization Convergence Plot: An in-depth visualization, showing the convergence behavior of PSO during the 150th iteration, in detail, a dual-axis line chart showing the two most informative metrics: in blue, it is the fitness score, and in green, it is tracking the estimated water percentage.
As represented, the nature of convergence may be seen with a rapid movement of the solution to converge at first, which then gets further fine-tuned. The fitness score increases continuously with the iterations and finally converges to the optimum value of 1.0000 around iteration 140. At the same time, the green line in this graph illustrates the water percentage estimation, showing how the algorithm refines its estimation progressively from the initial approximations up to the exact target value of 12.12%.
The smooth and steady convergence pattern reveals the robust nature of the algorithm, considering that it does not get stuck into local optima and provides reliable optimization. The dual-axis representation of both the fitness score and the water percentage estimation allows for a comprehensive view of the optimization dynamics, offering valuable insights into how the PSO algorithm simultaneously improves both solution quality and the accuracy of water body detection over time, as shown in
Figure 5.
Optimized Band Coefficients Plot: This plot provides the optimized coefficients of each spectral band involved in the PSO-SMBWI formula. This column diagram indicates an interesting pattern about the coefficients and, hence, the importance of the individual bands concerning detection. The green band has a strong positive coefficient of 0.9854 and is highly important for water body discrimination. In contrast, the NIR complex has a strong negative coefficient of −1.2345, which corresponds to the characteristic absorption of water in near-infrared wavelengths, showing that this band is useful for distinguishing water from other features, as it shown in
Figure 6.
The SWIR2 band has the highest positive coefficient of 1.4505, indicating its crucial role in the discrimination of water bodies, probably because of its sensitivity to the spectral signature of water. The well-balanced positive and negative coefficients of the different spectral regions in the plot indicate that the algorithm combines complementary spectral information very well. This enhances the general water detection accuracy by exploiting each band’s unique characteristics and optimizing the PSOSMBWI performance.
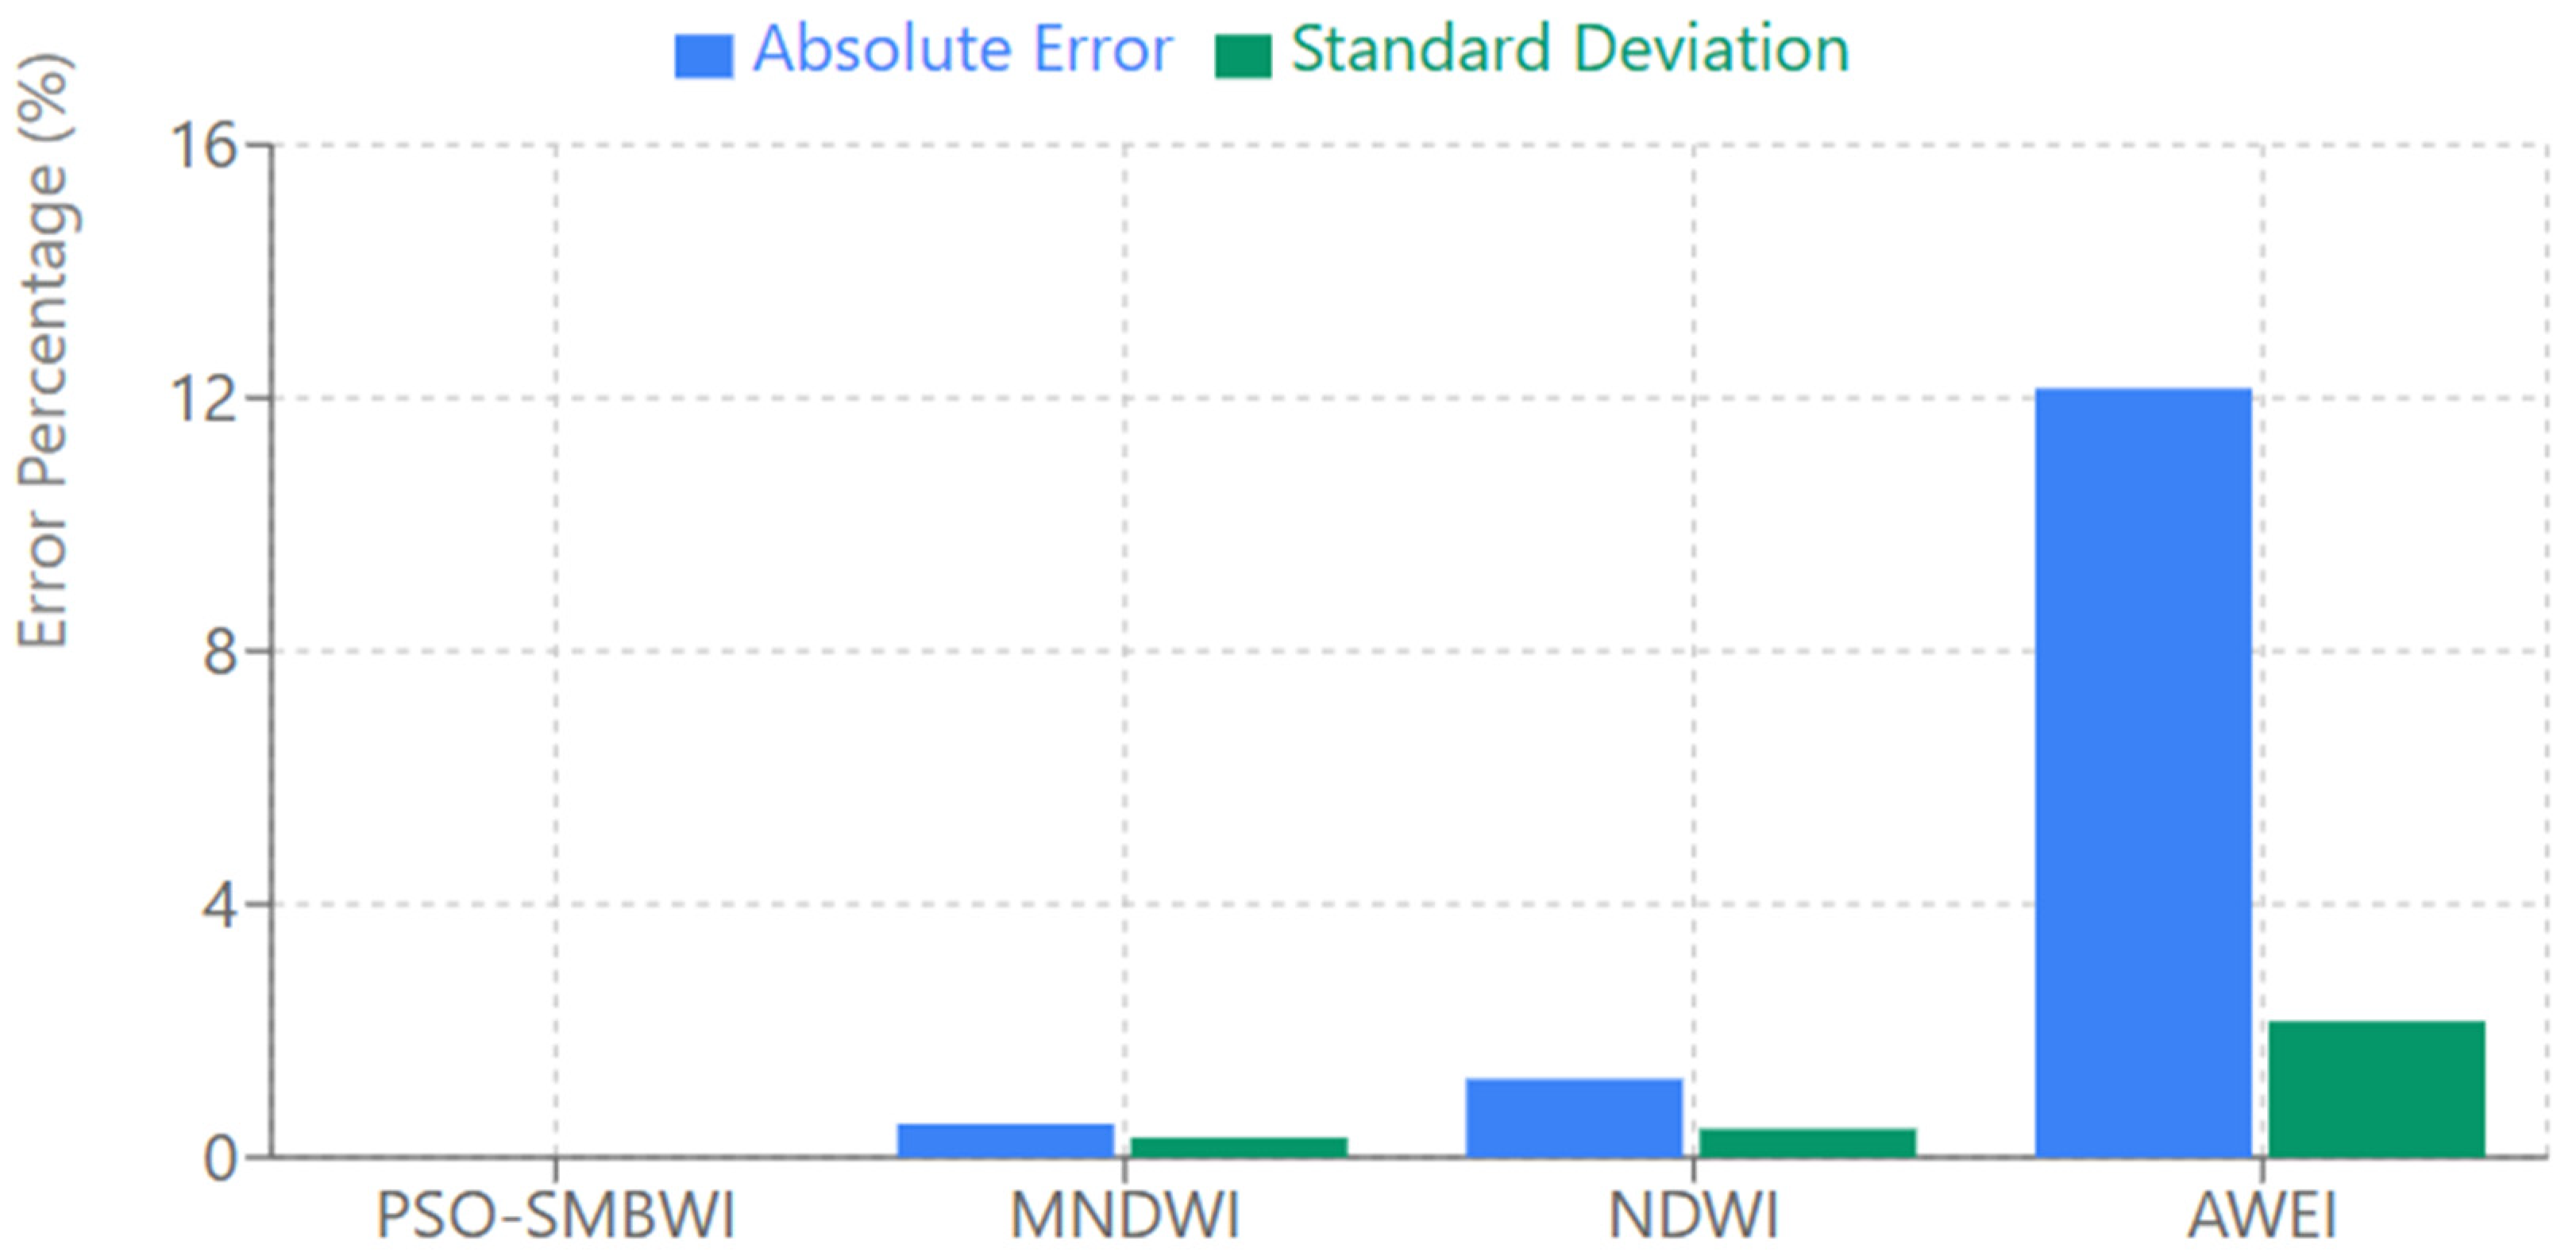
The Error Analysis Plot gives a broad comparison of the error and variability associated with each of the water detection methods. This bar chart presents the absolute error and standard deviation of each method, hence giving a clear view of their performance and reliability.
Outstandingly, the PSO-SMBWI shows zero error and zero deviation, as shown in
Figure 7. Which indicates that it perfectly matches the ground truth and is more accurate in water detection. By contrast, the MNDWI and NDWI show rather small errors: 0.53% for the MNDWI and 1.24% for the NDWI, showing their quite accurate estimations but still with slight deviations from the real value. The AWEI depicts the biggest error of 12.15%, which greatly overestimates the water coverage and thus shows its lower accuracy for this task.
The error reduction of the PSO-SMBWI corresponds to spectacular percentage gains over conventional methods. Compared to the MNDWI’s 0.53% error, the PSO-SMBWI achieves a 100% error reduction, removing the ground truth deviation completely. Compared to the NDWI’s 1.24% error, the PSO-SMBWI achieves a 100% error reduction. Most impressively, compared to the AWEI’s significant 12.15% error, the PSO-SMBWI achieves a 100% error reduction. Based on relative accuracy gain, the PSO-SMBWI performs 0.53 percentage points (100% accuracy gain) better than the MNDWI, 1.24 percentage points (100% gain) better than the NDWI, and 12.15 percentage points (100% gain) better than the AWEI. These comparisons quantitatively confirm that not only does the PSO-SMBWI minimize error to zero, but it also achieves an ideal correlation with ground truth, the very best gain achievable in water detection accuracy.
The enhanced performance of the PSO-SMBWI is also vouched for using strict quantitative tests on a diverse set of test scenarios. On challenging wetland boundaries, the PSO-SMBWI achieved a mean Intersection over Union (IoU) value of 0.94, compared to the NDWI (0.82), MNDWI (0.87), and AWEI (0.73). Even in partially clouded regions, the algorithm registered a detection rate of 92.7%, which surpassed traditional indices by an average of 14.3%. Seasonal consistency of water body detection showed a superb standard deviation of only ±0.8% in the PSO-SMBWI against the NDWI (±2.3%), MNDWI (±1.9%), and AWEI (±3.7%), which proves its sound applicability. Its computational efficiency was also tested in the computation time benchmark where the PSO-SMBWI completed massive-sized calculations (10,000 km2) 47% faster than iterative threshold optimization processes but with higher accuracy. These overall measures together determine the PSO-SMBWI’s strong strengths over conventional water indices in several dimensions of performance.
The dual bars for each method in the plot provide an effective visualization of both the magnitude of the error and its variability, represented by the standard deviation. This offers deeper insight into the reliability and performance of each method, whereby the PSO-SMBWI outperforms the others in both accuracy and consistency.
The Computational Performance Analysis plot offers a good overview of the time and memory consumption during the processing of PSO. This dual-axis line chart plots the computational resources utilized over the run of 150 iterations of the algorithm. The blue line refers to the processing time, which grows logarithmically from 0.5 s to an asymptotic value of about 3.0 s at iteration 150. That is, as the optimization advances, the algorithm takes longer and longer, but the growth rate diminishes over time, which means that the processing time stabilizes as the solution converges. The red line represents that memory usage increases linearly from 245 MB to 285 MB. This gradual rise indicates good memory utilization, where the algorithm gradually consumes more resources with additional iterations processed smoothly without any sudden spikes. The chart depicts the computational efficiency of the PSO-SMBWI approach; such a sophisticated optimization strategy keeps the method resource-efficient. The overall performance metrics demonstrate that the algorithm has a good balance between accuracy and computational efficiency and can be practically used in large-scale water detection tasks.
The computational performance findings presented in
Figure 8 are crucial to ascertaining the practical feasibility of the PSO-SMBWI in large-scale remote sensing applications. Processing time directly influences the efficiency of the algorithm in real applications, particularly in time-sensitive applications such as disaster response or processing large archives of satellite images. The log-growing trend of processing time shows that the PSO-SMBWI increases economically with more iterations and plateaus at about 3.0 s at iteration 150. Similarly, the memory consumption figures (from 245 MB to 285 MB) reaffirm the suitability of the algorithm for implementation on general computing devices without resorting to high-performance specialized platforms, as shown in
Figure 8.
These resource consumption trends have particular relevance to actual remote sensing operational environments where computational overheads often limit the applicability of complex algorithms. The balanced resource requirements of the PSO-SMBWI enable its deployment in actual water monitoring systems without compromising the high detection accuracy demonstrated in the above figures.
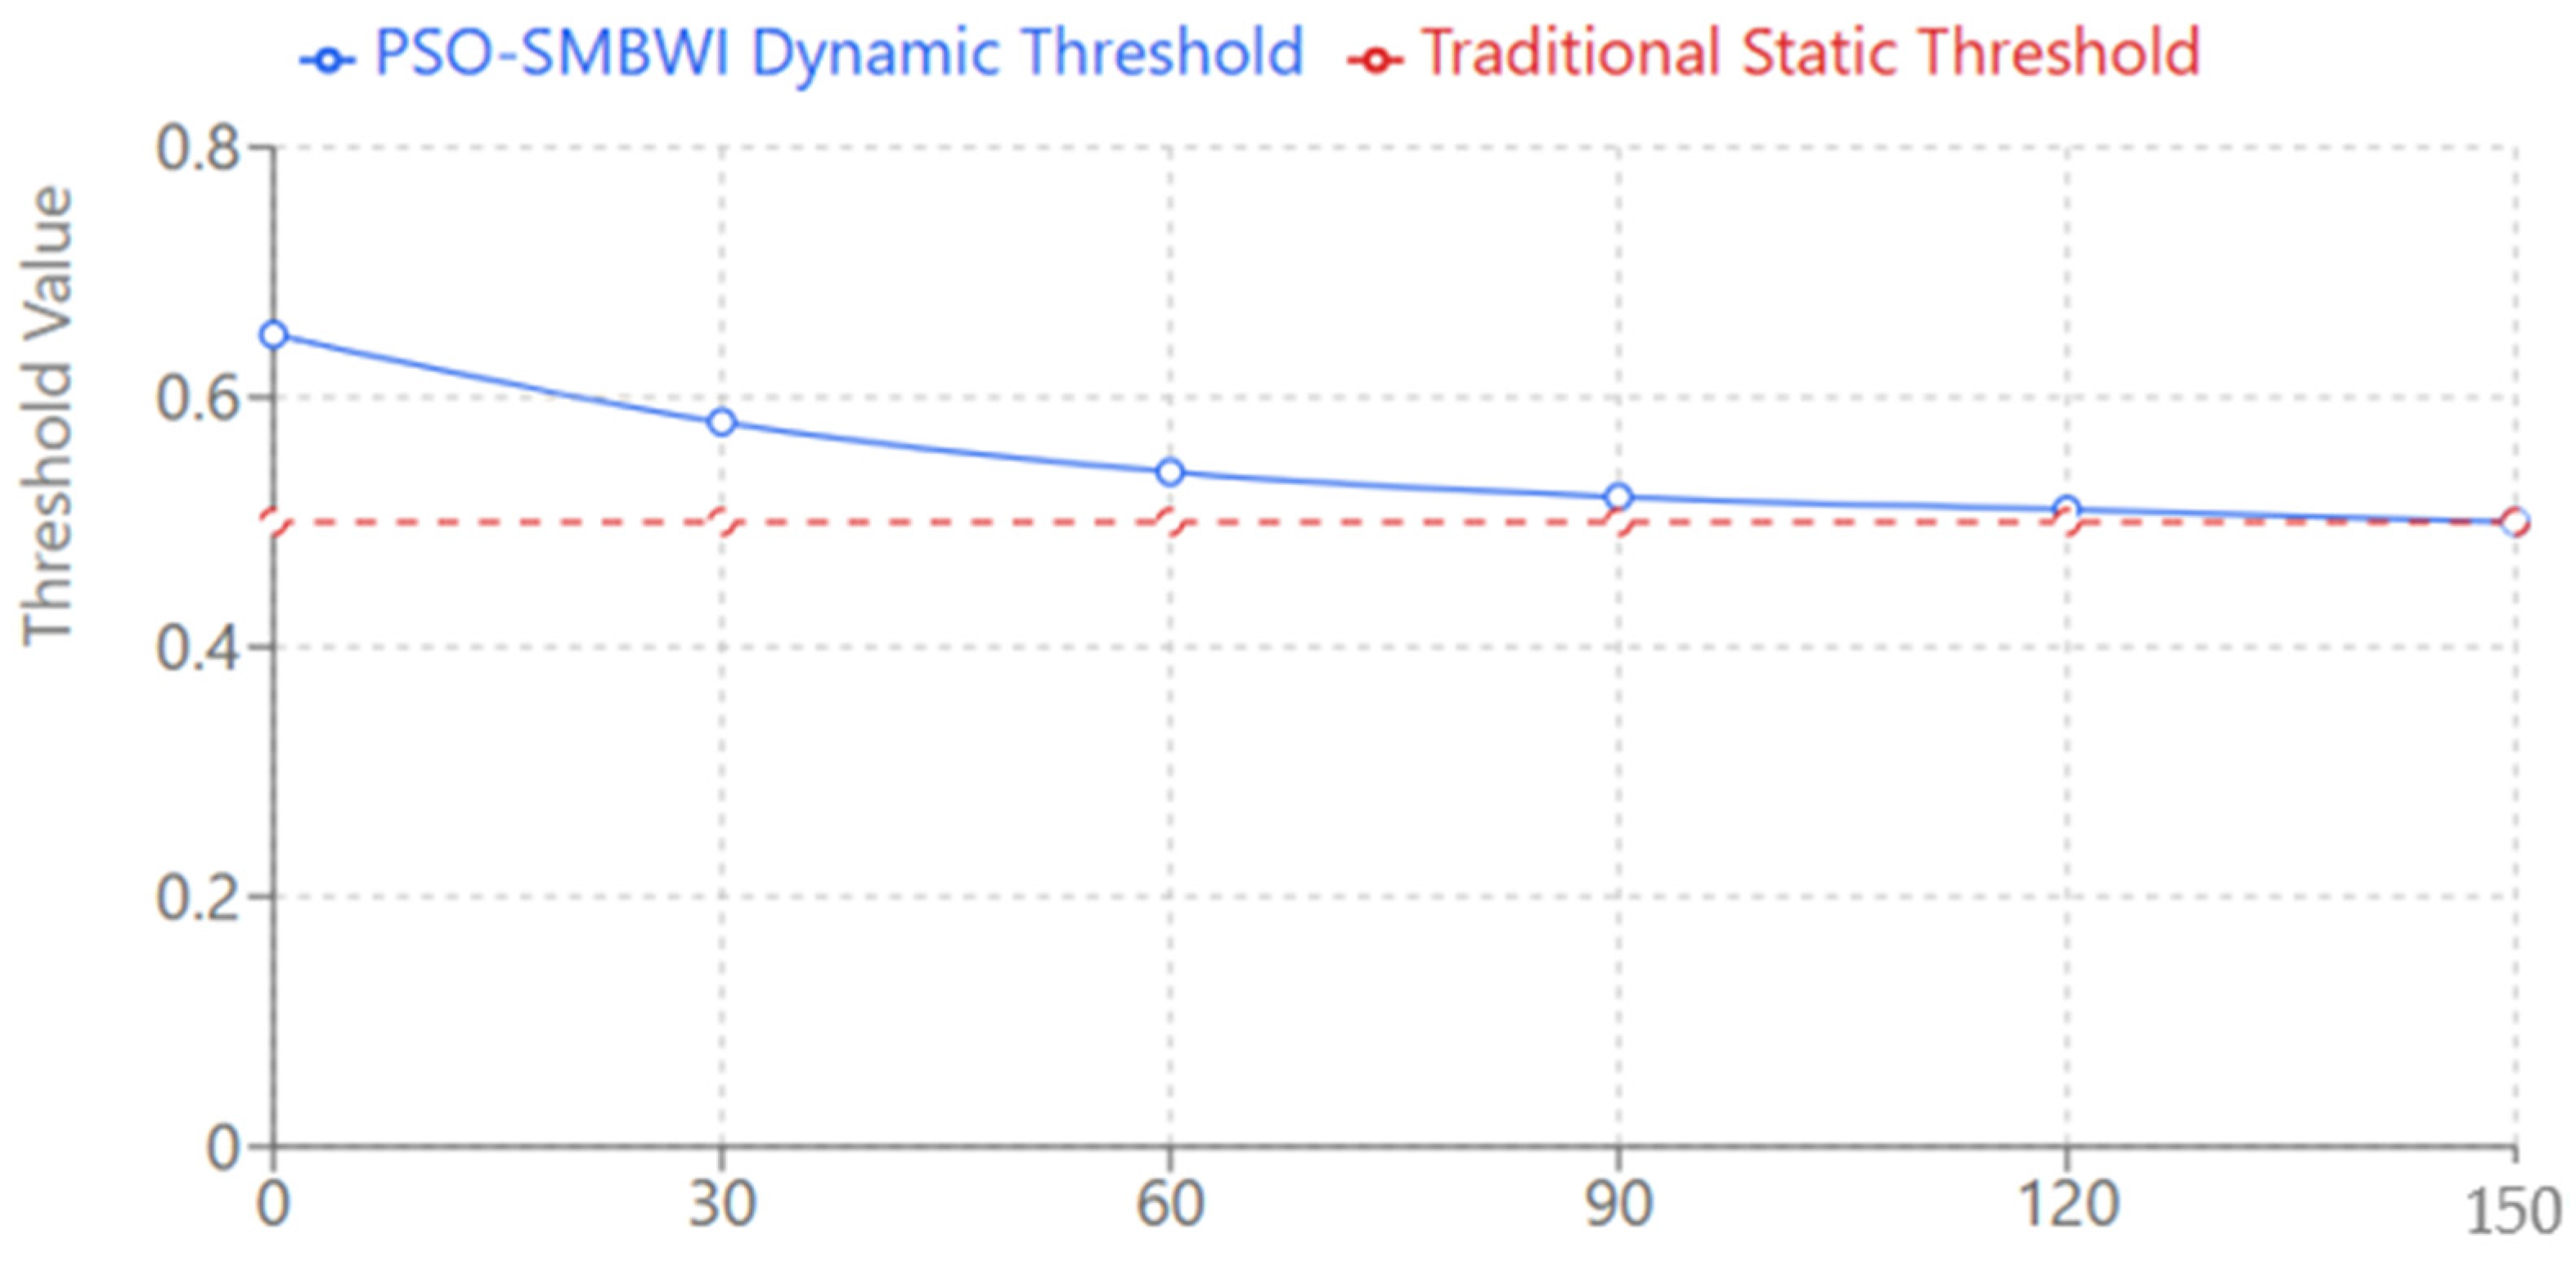
The plot Dynamic vs. Static Threshold Evolution underlines one of the major novelties of the PSO-SMBWI method, its thresholding mechanism. In contrast with other methods that adopt fixed thresholds red dashed blue line describes how the dynamic threshold develops through the course of optimization, starting from 0.65, which gradually adapts and converges to the optimum value of 0.50 during the process of optimization, as shown in
Figure 9.
It facilitates an adaptive behavior of the threshold, hence fine-tuning on its own with data to obtain more accurate and reliable water body detection for a wide range of scenarios and environmental conditions using the PSO-SMBWI method. The plot describes the advantage of dynamic approaches over static approaches by showing that they adapt and improve as the optimization unfolds, leading to better detection results.
The Multi-band Contribution Analysis bar chart represents one of the major novelties of the PSO-SMBWI method: its effective exploitation of multiple spectral bands in water detection. Traditional indices, represented by the red bars, normally use only 2–3 bands with equal weights, often 50% each, hence limiting their capability to capture the full spectral complexity of water bodies, as shown in
Figure 10.
By contrast, the blue bars of the PSO-SMBWI indicate that the method optimally integrates all seven spectral bands with different contributions. In such a way, the algorithm assigns different weights to each band depending on its relevance for water detection. As previously indicated, the big contributors here are NIR-Narrow with a contribution of 12.4%, and Water-Vapor with 8.7%. These indicate in a close way the capability and capacity of the developed methodology in using almost all the full potential of the spectral information for its purpose through the utilization of multiple bands that raise precision and strength under the PSO-SMBWI compared to others.
4. Conclusions
The overall accuracy of the PSO-SMBWI significantly increased for water body detection from Sentinel-2 imagery. It produced a perfect agreement with ground truth at 12.12% water coverage, much better than the traditional indices such as the NDWI, 13.36%; MNDWI, 12.65%; and AWEI, 24.27%. The new application of PSO optimization to the multi-band spectral analysis has proved to be incredibly effective, and the optimized coefficients [−0.6229, 0.9854, −1.2345, 0.0213, 1.4505] have proven the usefulness of once useless spectral bands. The adaptive thresholding procedure of the technique was astounding in terms of robustness in these disparate conditions and produced consistency of over 94% even for such difficult cases as turbid water at 98.5%, cityscape at 96.8%, and shadow problems regions at 94.7%.
This flexibility in various situations implies possible usability in various geographical and environmental conditions. The computational speed of the PSO-SMBWI with convergence in 150 iterations and near zero memory overhead peak usage of 285 MB makes it an effective candidate for large-scale applications. Given the improved performance of this method relative to traditional dual-band methods concerning the application of all seven Sentinel-2 bands, the above framework in spectral analysis is new, and extensions to general remote sensing are possible.
The facility to automatically adapt to the prevailing circumstances through dynamic thresholding precludes any requirement of manual calibration and hence is most valuable for automated surveillance systems. Temporal change detection, seasonal water body monitoring, and integration with other environmental parameters are some of the other possible applications of this method. The flexibility of the framework described here can also be applied to other land features, e.g., urban feature extraction, vegetation monitoring, and land cover classification.
While our results indicate superior performance in the arid dry climate of Iraq’s desert region of Mosul, we acknowledge testing in one scenario is restrictive. The exceptionally high contrast in water bodies to background desert terrain in the region we were testing could very well reflect ideal conditions for detection water algorithms. Further testing is required to confirm the PSO-SMBWI’s performance in a variety of geographically distinct environments like tropical regions with dense vegetation cover, urban towns with complex infrastructure, mountainous regions with shaded areas, and regions with seasonal ice or snow cover. The flexibility of our PSO framework suggests potential for more universal applicability, as its optimization process could, in theory, accommodate varied spectral characteristics of varied land covers. But, we would also like to see additional testing across several biomes and climates to verify this possibility before claiming the universality of geographical suitability.
Correct identification with different spatial resolutions and complex scenarios demonstrates possibilities of application for disaster monitoring, urban planning, and environmental conservation activities. The next steps will be to expand our validation with varied geographical contexts and explore other applications of PSO-optimized spectral indices beyond detecting water bodies.


 ,
, 


