1. Introduction
Monitoring buildings’ state of health (SOH) is a crucial issue in civil engineering, particularly due to the needs to ensure occupant safety and extend structure lifespan [
1], as well as to provide data for energy management systems.
The emergence of energy-autonomous sensor nodes presents an innovative solution for continuous monitoring without the need for battery replacement, thereby reducing maintenance requirements. An increasing number of studies have focused on environmentally friendly solutions that use surrounding resources, such as sunlight (thermal gradients [
2,
3], light waves [
4,
5]), vibrations [
6,
7,
8], and even radio-frequency (RF) waves [
9,
10].
In the context of building monitoring, the sensor node must often be buried within structural elements, such as walls, floors, or roofs, to access critical physical data. This embedded configuration imposes strict constraints on both energy supply and communication reliability. Therefore, a suitable communication technology must guarantee robust long-range connectivity despite signal attenuation, interference, and environmental obstructions.
LoRa (Long Range) technology, with its low power consumption and long-range capability, has demonstrated strong potential for such use cases. Several studies have shown that LoRa enables reliable and energy-efficient communication, even when sensor nodes are buried in constrained environments [
11,
12,
13].
Additionally, RF energy is continuously emitted by ubiquitous sources such as cellular relays, Wi-Fi access points, and radio transceivers [
14]. Although this ambient RF energy is typically unexploited, it represents a promising source for powering low-power electronic systems. However, the amount of ambient RF energy that can be harvested remains very limited, especially in indoor or shielded environments, making energy efficiency a critical design constraint. In the Internet of Things (IoT), where devices communicate using RF signals, harvesting energy from the same medium used for communication nonetheless opens up opportunities for wireless energy autonomy [
15].
In this work, we propose a fully autonomous sensor node designed for structural health monitoring applications. The node is buried within building materials and exclusively powered by radio-frequency energy transfer (RFET), while communication is supported by the LoRa protocol. The system architecture, the choice of communication protocol, and the design of the RF power harvesting circuit are detailed in
Section 2.1.
A major design challenge lies in the limited space available within structural elements such as plasterboard, which can support standing-wave patterns arising from internal reflections and thereby provide favorable locations for embedding RF-powered devices [
16]. To evaluate the feasibility of such integrations, we designed and characterized a single rectenna operating at 868 MHz, specifically adapted to the space constraints of this material. This first prototype enables us to assess the harvestable power collected and its suitability for supplying an autonomous node. The design and implementation of the rectenna are detailed in
Section 2.2.
A wireless sensor network is typically composed of a base station connected to several nodes. The nodes collect physical data, such as temperature, sound, vibrations, pressure, movement, and pollutant levels, and transmit this information in real time to the base station via radio-frequency modulation. The base station processes the data collected from the nodes and acts as a network gateway.
In many studies involving RF-powered autonomous nodes, an additional element is introduced to serve as the RF power source. This is often either another communicating node [
9] or a dedicated RF generator [
17]. However, in this work, the base station itself is configured to operate bidirectionally, serving both as a communication hub and as the RF energy source for the nodes. This eliminates the need for an additional transmitter and simplifies the network architecture.
In Europe, LoRa technology operates in the 863–870 MHz frequency band, with a typical center frequency of 868 MHz. In our study, the same frequency band is used for both data transmission and wireless energy transfer. However, European regulations (ETSI EN300.220 [
18]) impose strict limits on the maximum equivalent isotropic radiated power (EIRP) allowed for such transmissions. Specifically, devices are limited to +14 dBm (25 mW) in most of the 863–870 MHz band, with the exception of the 869.4–869.65 MHz sub-band, where up to +27 dBm (500 mW) is allowed [
18], particularly for uplink communications. These regulatory constraints directly impact the maximum power that our base station can emit, and therefore the amount of RF energy that can be harvested by the node. In this study, we evaluate different transmission powers within these legal limits. Details of the BS configuration are provided in
Section 2.3.
Although RF energy is ubiquitous, the amount that can be harvested in practice remains very limited. This constraint is especially critical for nodes buried far from their energy source or shielded by materials that attenuate RF propagation. As such, optimizing both the rectenna design and the energy management strategy is essential to ensure that sufficient power can be harvested to support a complete operational cycle of the sensor node.
The main contribution of this work lies in the system-level integration and experimental evaluation of an RF-powered LoRa sensor node designed to operate while embedded within building materials. Unlike most studies that separately address communication or energy-harvesting aspects, this work proposes a fully autonomous node powered exclusively by RFET from its own base station. The originality of this approach lies in the dual use of the LoRa base station, both as a communication gateway and as a controlled RF power source, within the regulatory power limits of the 868 MHz ISM band. This dual functionality simplifies the network architecture and eliminates the need for additional RF transmitters. The practical relevance of this study lies in providing experimental validation of the feasibility of RF-powered embedded sensor nodes for structural health monitoring applications, thereby highlighting the potential of such systems for long-term, maintenance-free monitoring in buildings.
2. Materials and Methods
To achieve the autonomous sensor node described in the previous section, it is essential to perform an energy balance analysis for each component of the system. In the following subsections, we first present the selected node and assess its fixed energy requirements. We then describe the characteristics of the RF energy-harvesting system, followed by the configuration of the RF energy source.
2.1. Node Power Consumption Evaluation
2.1.1. The Node Configuration
For this study, we select an STM32WLE5JC microcontroller with a Semtech LoRa SX126X radio front-end encapsulated in a compact Wio-E5 Mini module [
19]. This choice is based on several key criteria, including its low power consumption, affordable cost, and transmission stability. Moreover, a study by S. Ould et al. [
20] demonstrated that the energy consumption variability between consecutive message transmissions with a Wio-E5 Mini is remarkably low, with a standard deviation of 0.002 J, representing approximately 0.09% of the average energy consumed per transmission, a significantly more stable behavior compared to other modules. This characteristic is essential for ensuring accurate energy budgeting.
It is worth noting that the total energy consumed to transmit a LoRaWAN frame (including the join sequence and the message transmission) is about 3.3 to 4.1 times higher than that required for sending a raw LoRa frame, depending on the spreading factor (SF), as shown in
Table 1. This difference, as explained by the protocol overhead specific to LoRaWAN, confirms the relevance of choosing raw LoRa mode when low energy consumption is a primary requirement.
The selection of communication parameters, such as SF, payload size, and transmission power, has a direct impact on the node’s energy consumption, as shown in
Figure 1, and also affects the packet delivery rate [
21,
22,
23]. The 3D surface plot in
Figure 1 illustrates the joint impact of payload size and spreading factor on energy consumption at different transmission power levels (0, 7, and 14 dBm). As expected, energy consumption increases with both larger payloads and higher spreading factors due to the longer time on air. Additionally, higher transmission power levels drive an overall increase in energy use. This visualization clearly highlights the trade-offs involved: to minimize energy consumption, smaller payloads and lower spreading factors are preferable.
Optimizing these parameters is, thus, a key part of improving node efficiency. The final configuration was selected based on this analysis, thus balancing energy use and data reliability. The parameters used in this configuration are summarized in
Table 2.
The message sent contains only the node identifier (1 byte) and the temperature measurement (2 bytes).
2.1.2. Power Consumption Evaluation
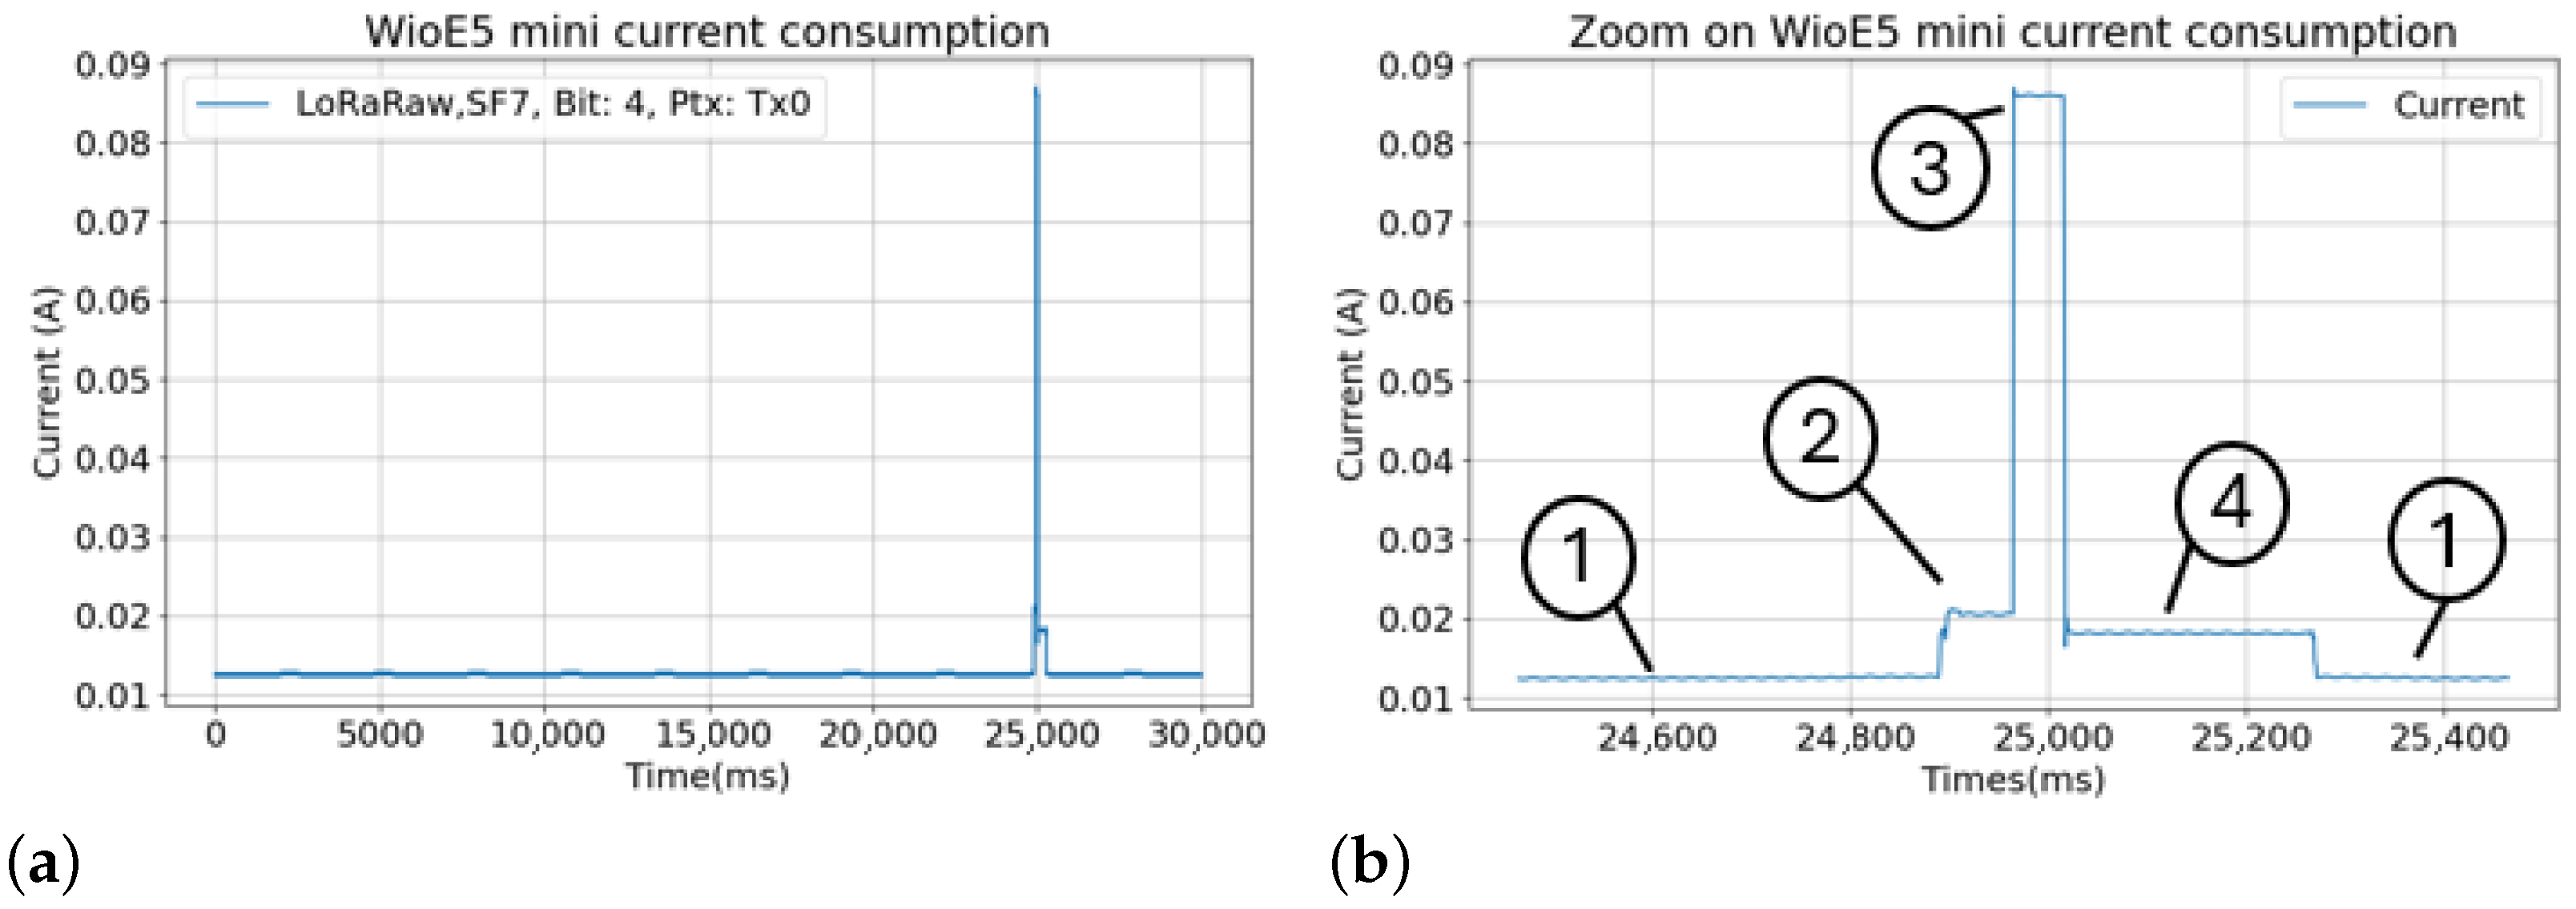
To assess the energy required to power our system, the consumption of a LoRa-programmed node was measured. For these measurements, the node was powered at its minimum operating voltage of 3.3 V to minimize power consumption. The Wio-E5 Mini node exhibits the current profile shown in
Figure 2, which represents a message transmission cycle repeated every 30 s. The communication parameters used are detailed in
Table 2.
Figure 2a shows that, over the entire data transmission cycle, the instruction wait phase lasts significantly longer than the actual transmission phase. However, the current drawn during transmission is much higher than the current consumed during instruction waiting.
Figure 2b provides a detailed view of the peak current consumption associated with message transmission. Four distinct phases can be observed:
These phases are followed by a return to the instruction wait state. The duration and energy consumption of each mode are summarized in
Table 3.
Among all the observed phases, only the wake-up and channel free assessment phase and the message transmission phase are strictly necessary for the node to function correctly and transmit data. By summing the energy consumed during these two phases, we obtain the minimum energy required to ensure a successful transmission, as shown in Equation (
1).
To enable RFET to supply our system, an energy management circuit (EMC) is essential. Several models are available on the market, each with different input power requirements [
9]. In this work, we selected an AEM30330 EVK developed by the Belgian company Epeas (Louvain-la-Neuve, Belgian) [
24]. This integrated circuit is specifically designed for RF energy harvesting and converts a variable harvested input power into a regulated DC output suitable for powering a load and charging an energy storage component.
A key feature of the AEM30330 is its cold-start capability from extremely low power levels. According to G. Loubet et al. [
9], who conducted a comparative analysis of various EMC technologies, the AEM30330 exhibits the lowest cold-start power among the tested models, requiring only 3 μW at 275 mV. Given the very low power levels typically harvested via RF, selecting an EMC with such minimal startup requirements was a decisive factor in our choice.
Using the AEM30330 energy management circuit, the harvested energy can be stored in a supercapacitor to power the node. To determine the required capacitance of this supercapacitor, we use the following equation:
where
C is the capacitance in farads,
E is the energy to be stored in joules, and
V is the maximum charging voltage of the supercapacitor. The minimum energy required for one transmission cycle is approximately 10 mJ, as calculated previously. The maximum charging voltage supported by the AEM30330 is 2 V, which we use for
V. Substituting these values gives 5 mF (Equation (
3)).
In practice, we chose to use a supercapacitor with a capacitance of 330 mF to ensure sufficient energy storage capacity beyond the theoretical minimum. This choice, while increasing the energy reserve, also results in a longer charging time for the supercapacitor, which is a trade-off accepted for improved operational reliability.
2.2. 868 MHz Rectenna for Wireless Power Transfer
A rectenna converts RF waves into direct current electricity through a receiving antenna and a rectifying circuit composed of an impedance matching network, a diode, and a notch filter, as shown in
Figure 3. In this work, we focus on designing a rectenna operating in the 868 MHz ISM band, which corresponds to the frequency used for LoRa communication. The objective is to present a planar antenna with appropriate gain (≤2 dBi) and proper impedance matching at 868 MHz, which is suitable for RF energy harvesting to power a buried sensor node.
2.2.1. Design of an 868 MHz Antenna
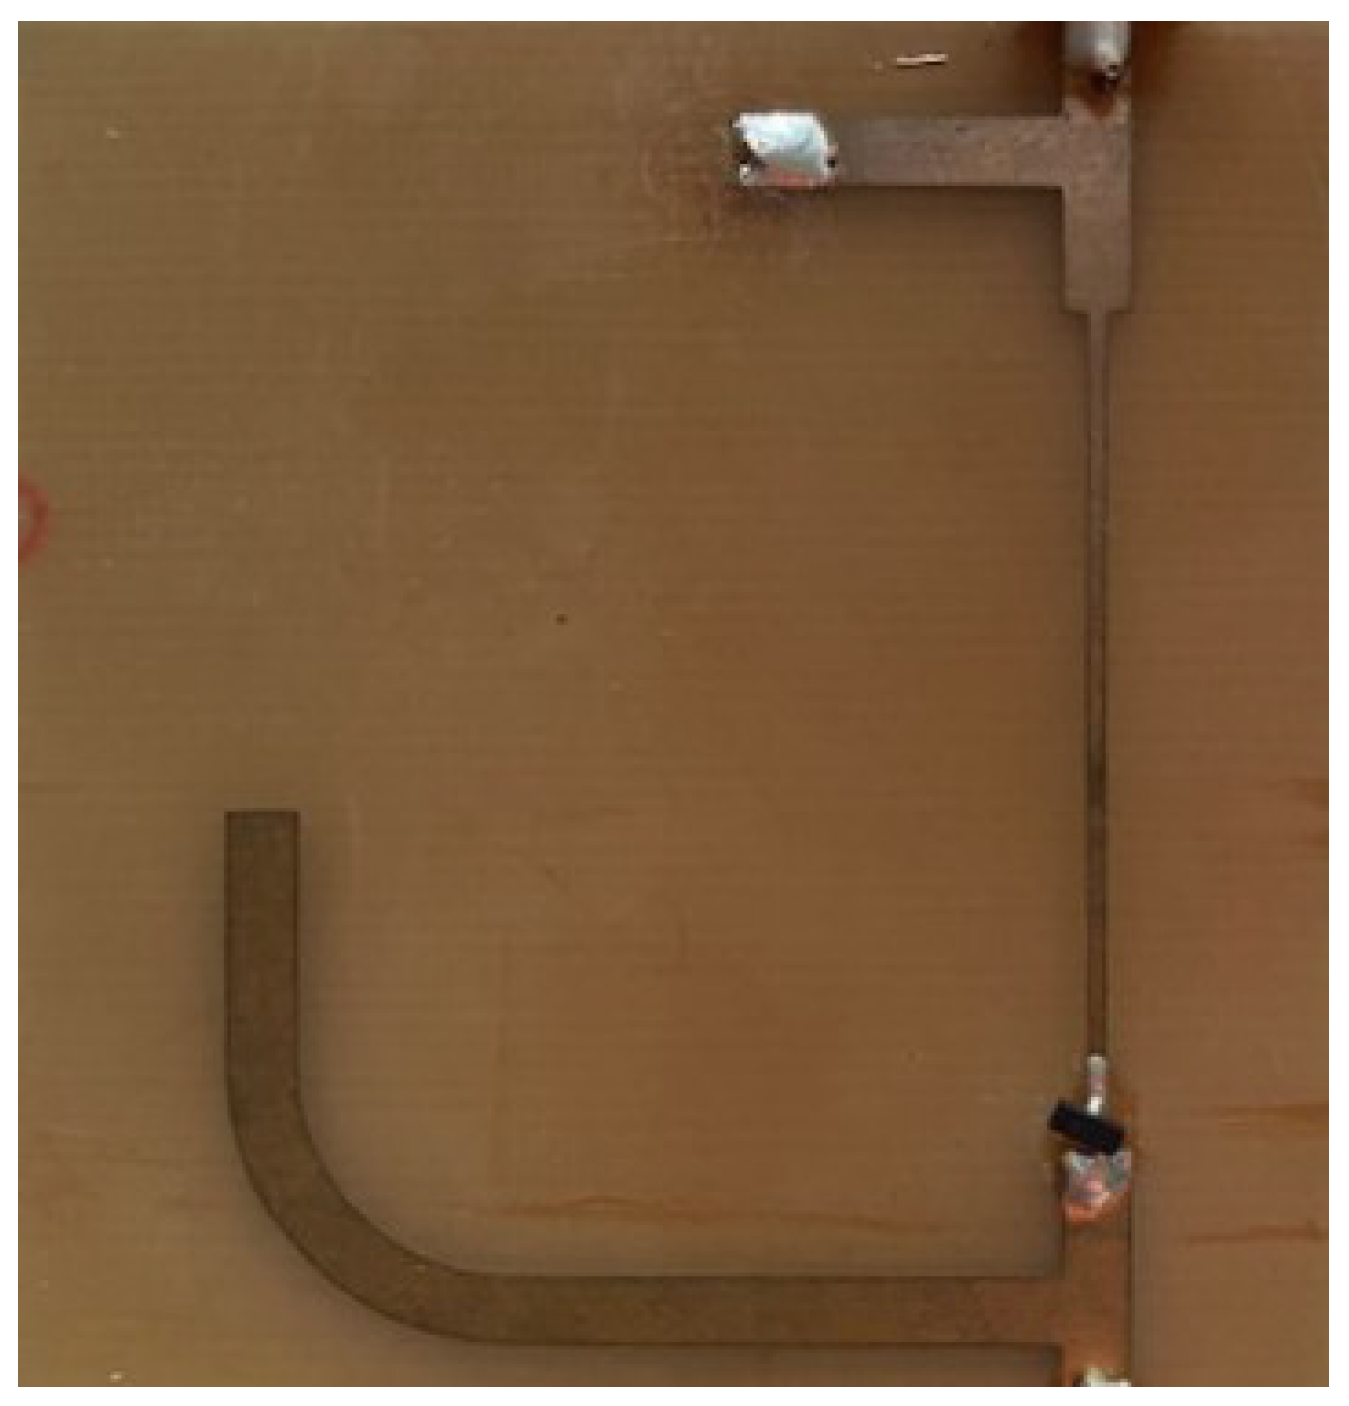
The antenna designed is a dipole resonant at 868 MHz. A full-wave antenna simulation was performed to determine the optimal dimensions, which were then fabricated using chemical etching.
Figure 4 shows the antenna that was designed, with (a) the front side and (b) the back side. A ground plane was added beneath the antenna, as it was intended to be connected to a rectifying circuit that included its own ground plane. The antenna was, therefore, built and characterized in a configuration that replicates its final usage conditions.
The dimensions of the dipole antenna are listed in
Table 4.
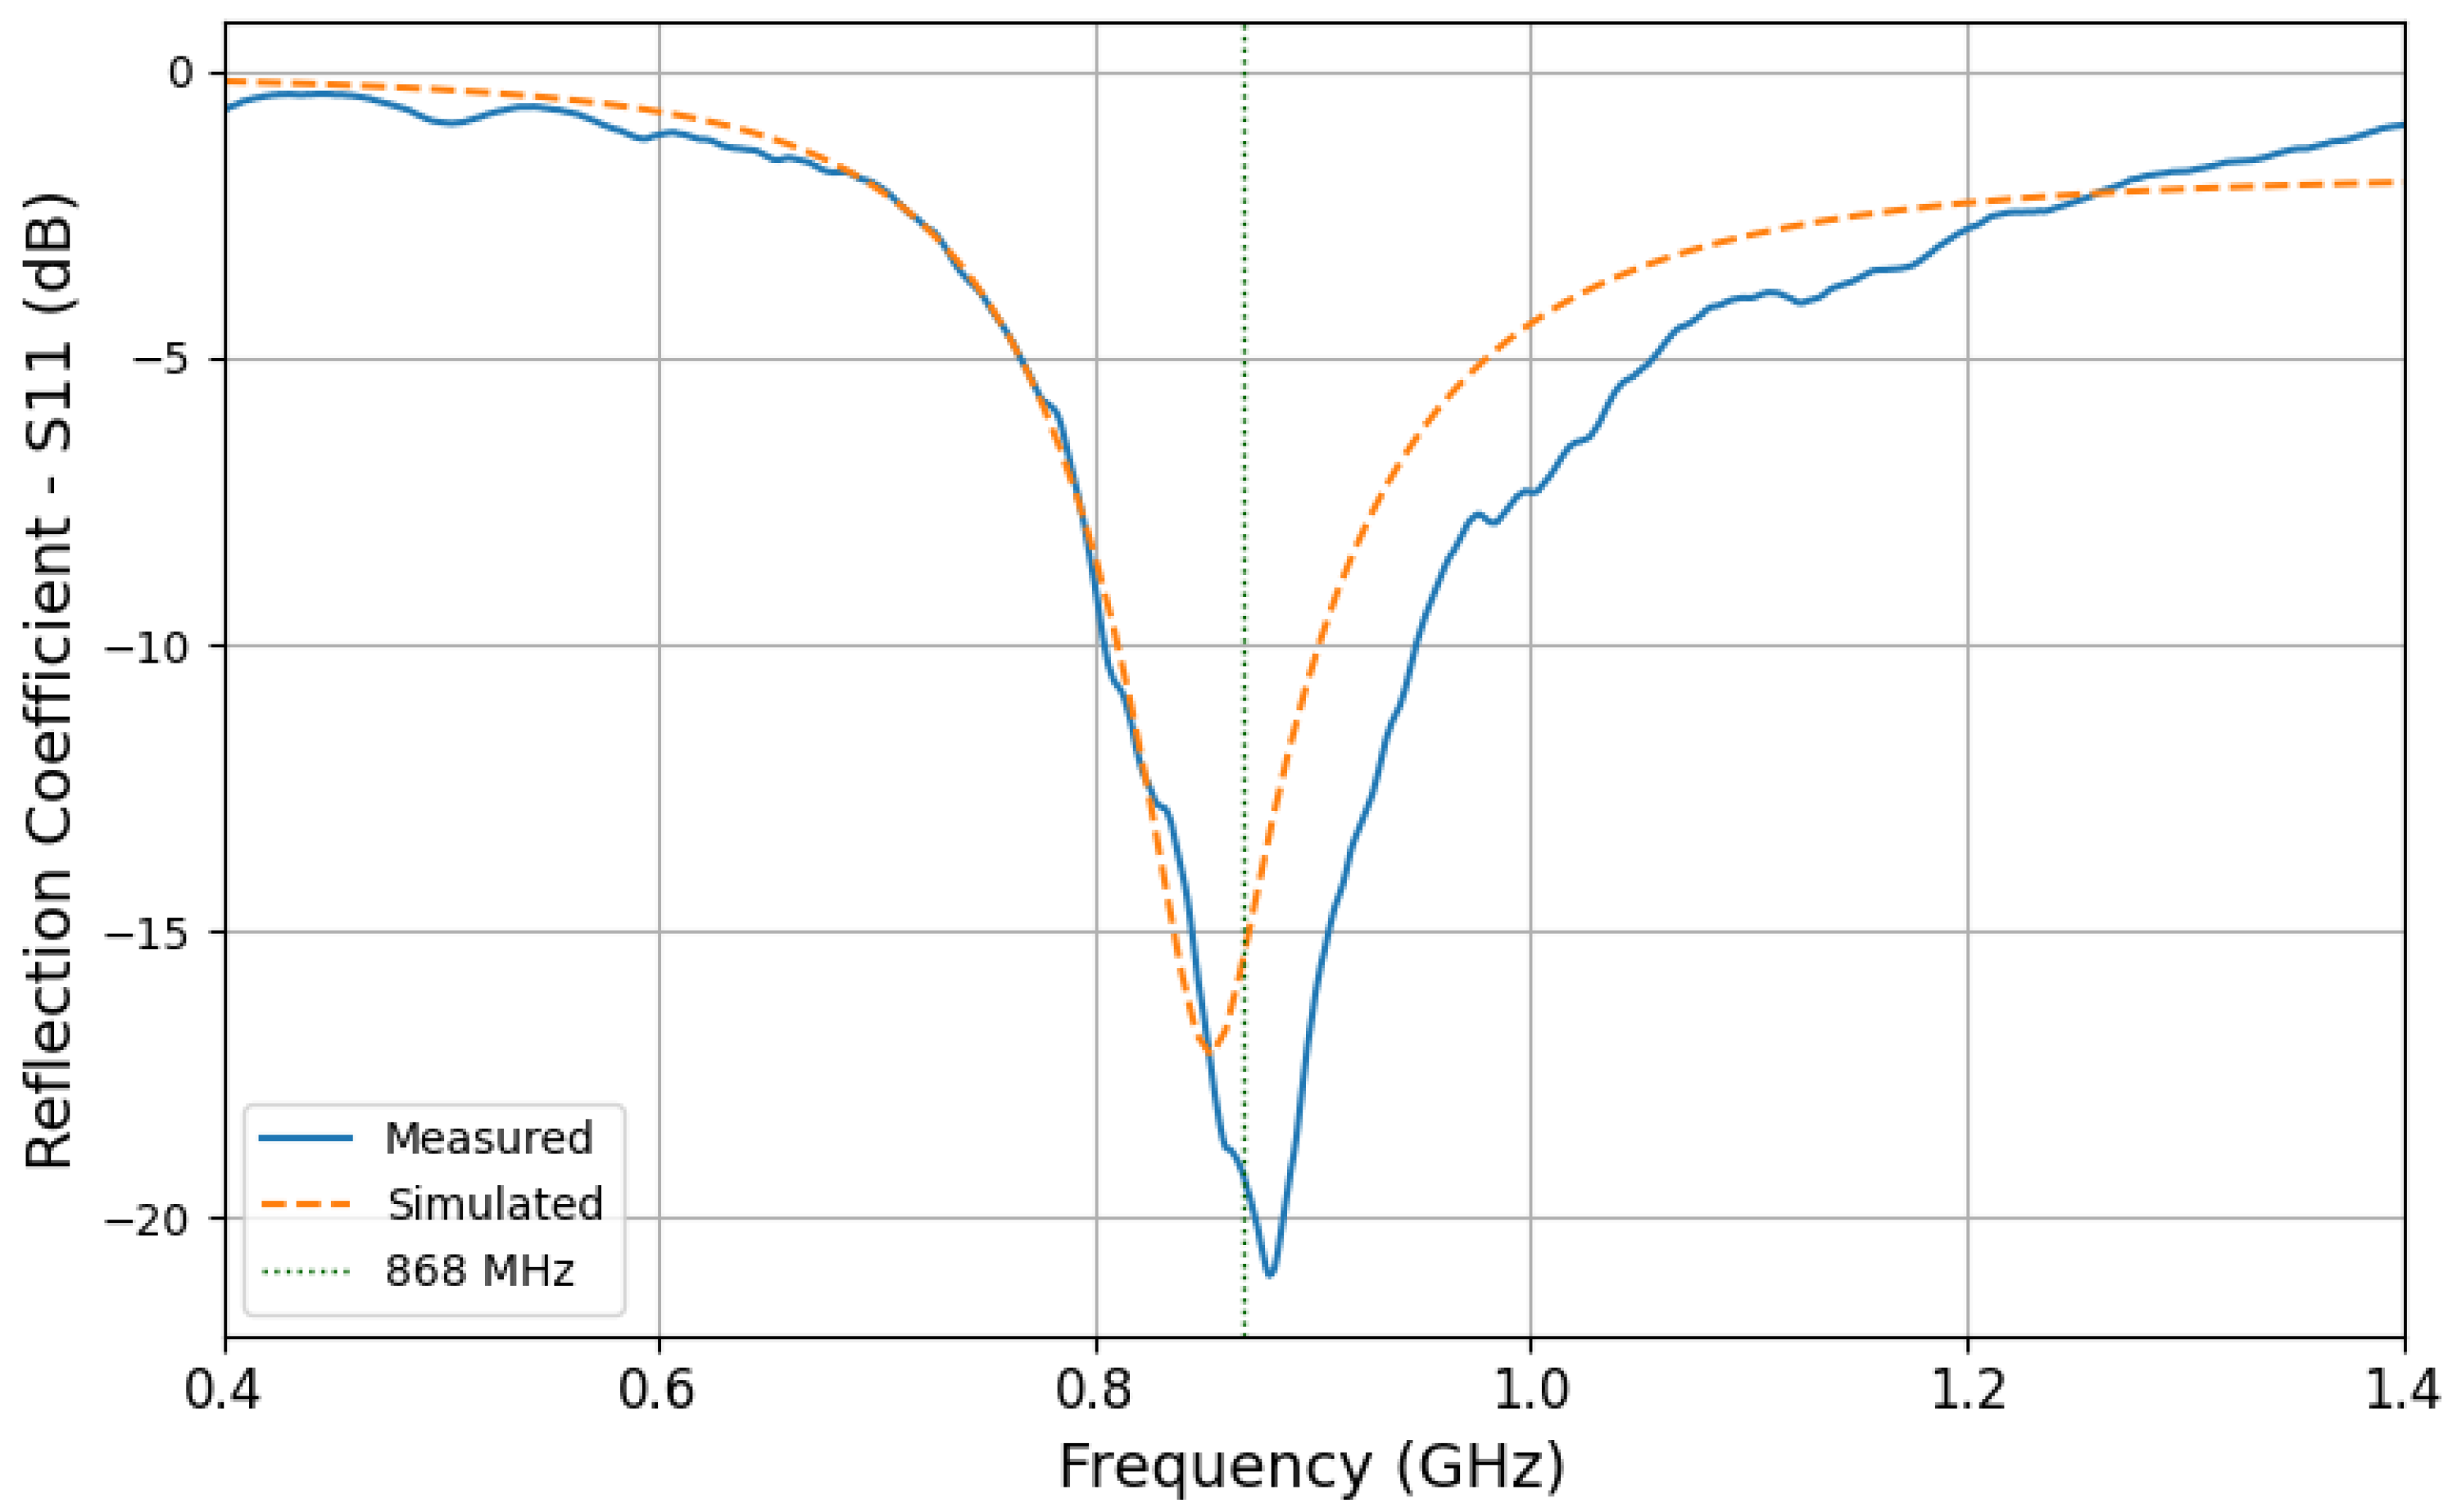
Figure 5 presents the simulated and measured reflection coefficient (
) of the antenna. The
characterization of the antennas was performed using a National Instruments (Austin, TX, USA) PXIe-5630 vector network analyzer (10 MHz–6 GHz), whose high dynamic range (>100 dB), kit-based calibration, and SMA 50
connectors ensure precise, sensitive, and repeatable reflection and transmission measurements [
25].
The measurement results confirm that the dipole is resonant at 868 MHz with a reflection coefficient of −19 dB and a bandwidth of approximately 100 MHz (defined for −10 dB). The simulated maximal gain is near 2.15 dBi.
2.2.2. Optimization of the Rectifier Circuit
The rectifier was optimized to operate at 868 MHz with a low input power level of
dBm. It was composed of a Schottky diode (SMS7630) connected in series with a matching circuit and followed by a DC filter. The entire structure was implemented using microstrip technology on an FR4 epoxy substrate, as shown in
Figure 6.
To properly design the matching circuit, it was necessary to determine the input impedance of the rectifier under realistic operating conditions. For this purpose, the diode was connected to a low-pass filter and a 1600 resistive load, which represents the optimal load for achieving maximum conversion efficiency from RF to DC. The input design of this complete assembly impedance (diode, filter, and load) was then characterized using a vector network analyzer.
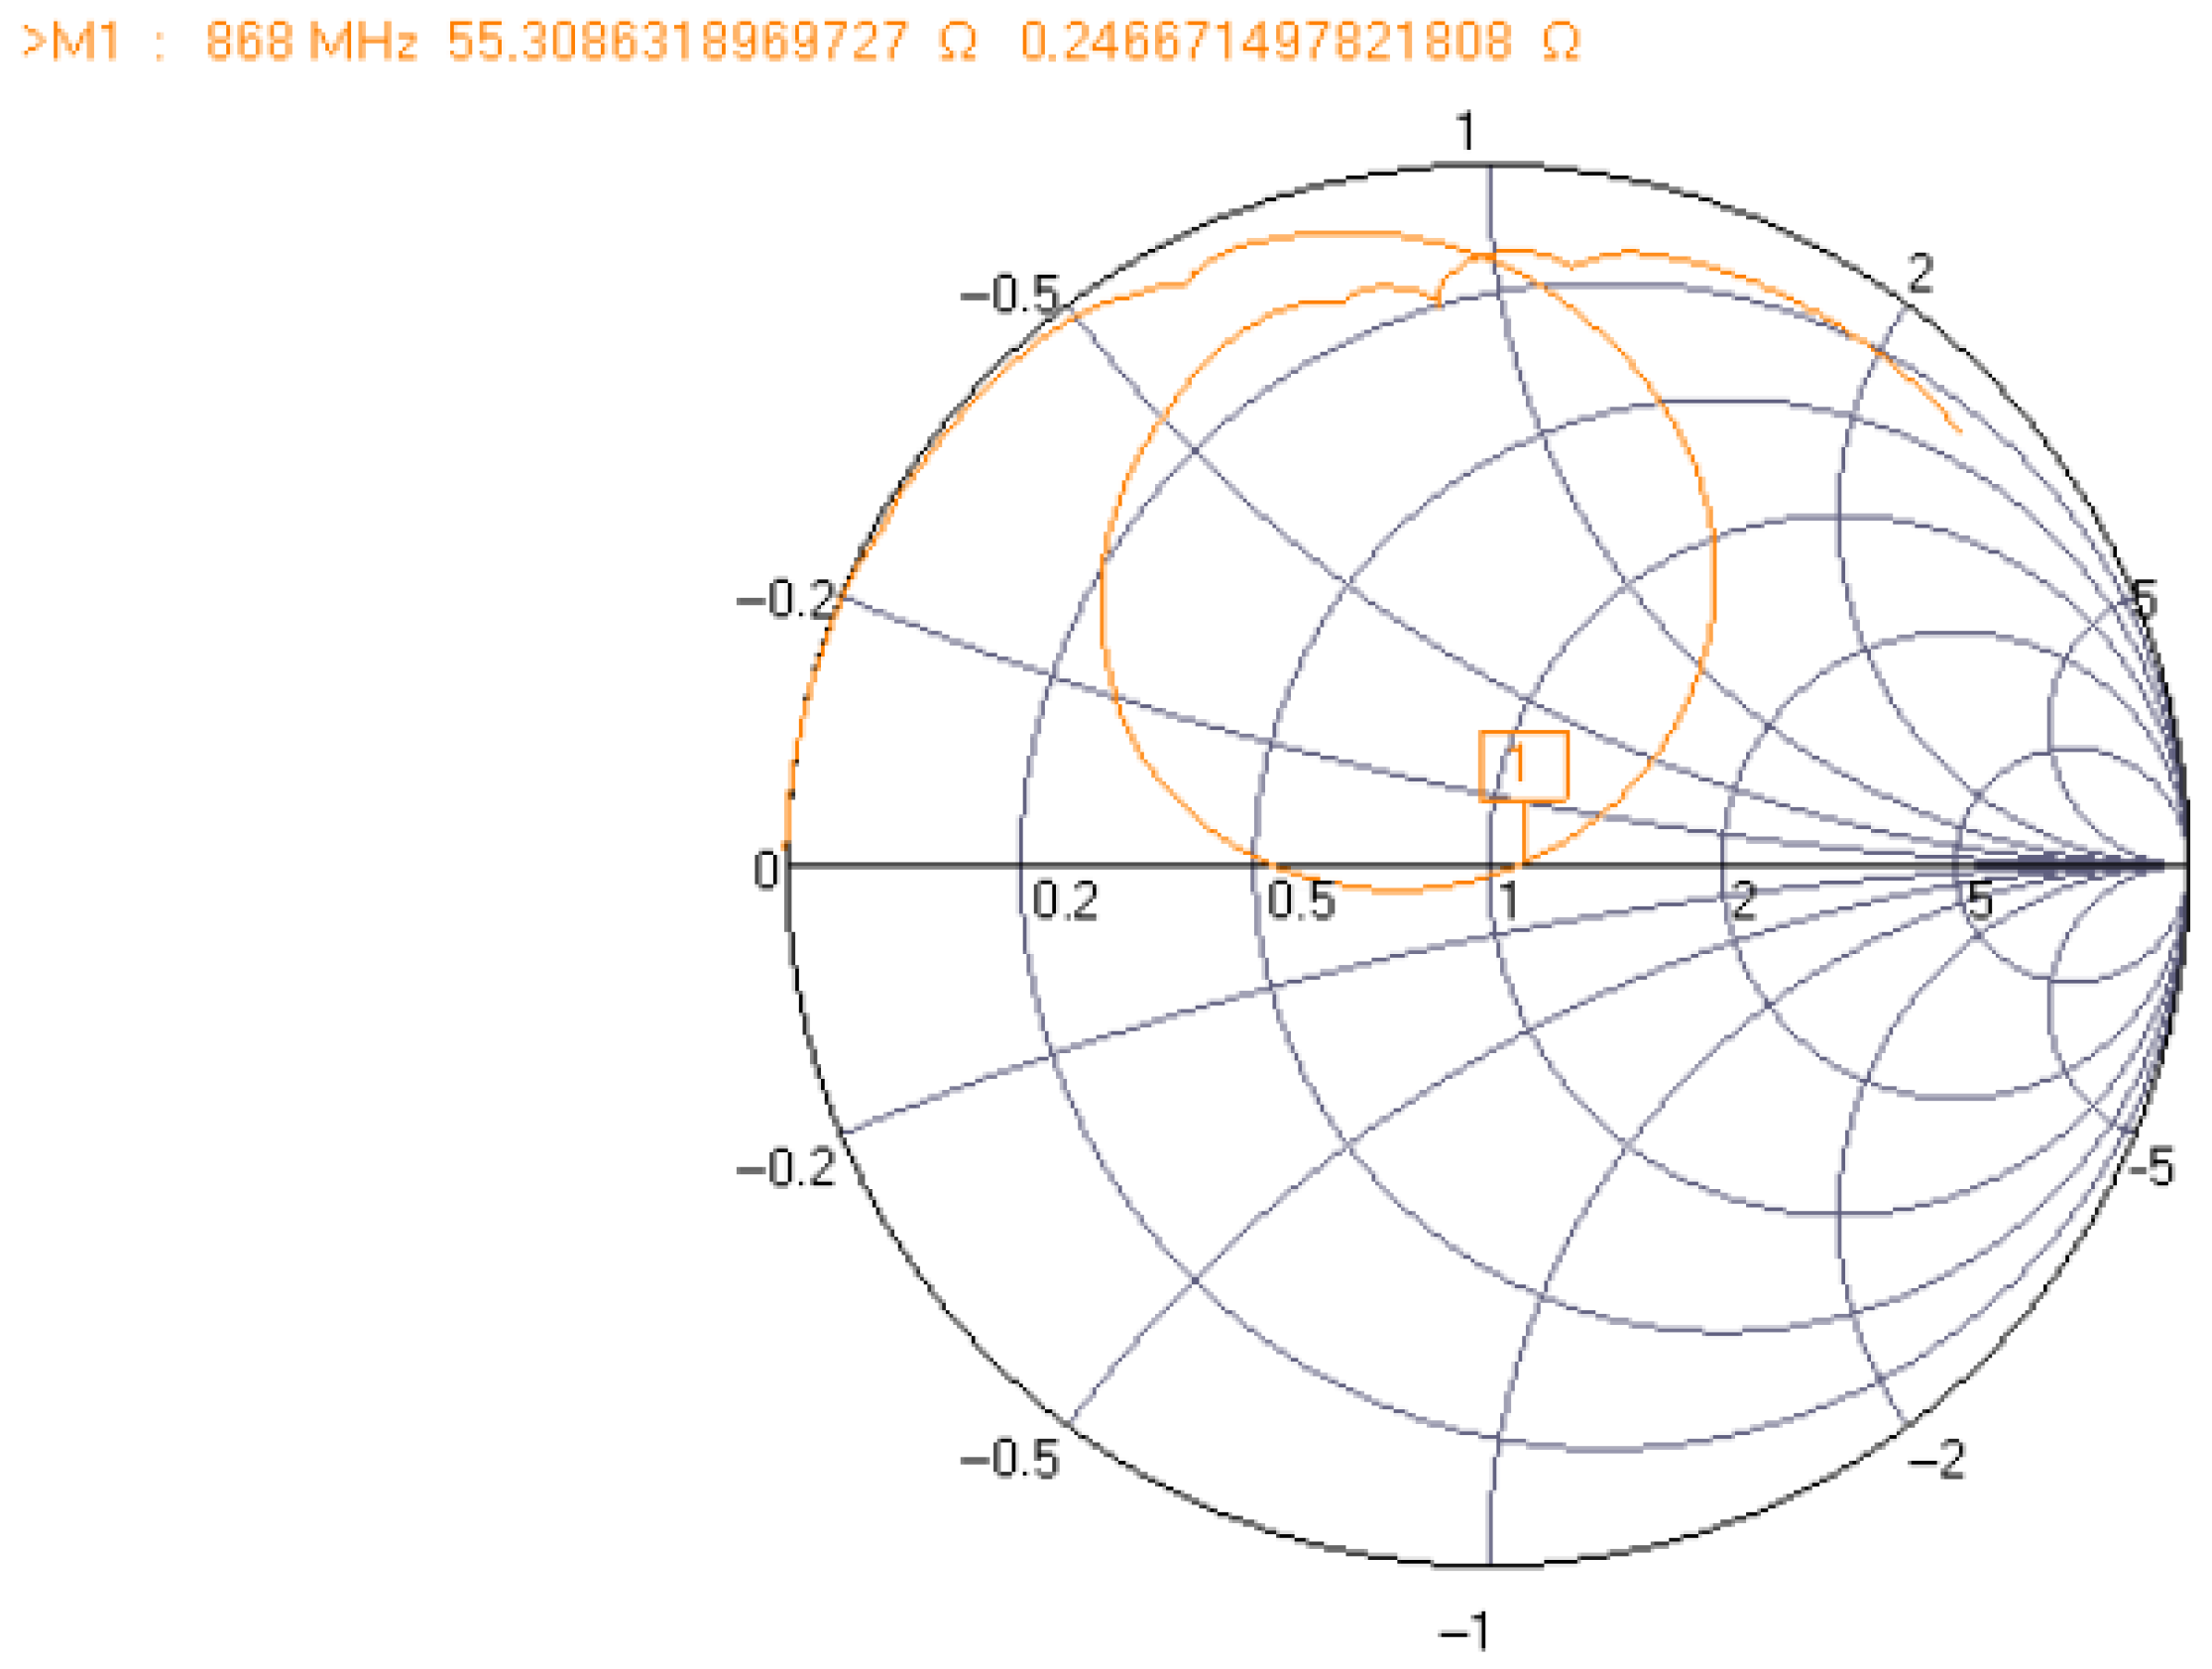
Based on measured complex impedance, a closed-stub matching network was designed and simulated in ADS to match with target operating conditions (868 MHz, 0 dBm input power). The resulting input impedance was successfully matched to 50
, as shown in the Smith chart in
Figure 7, where the final measured impedance was
.
2.2.3. Characterization of the Rectenna
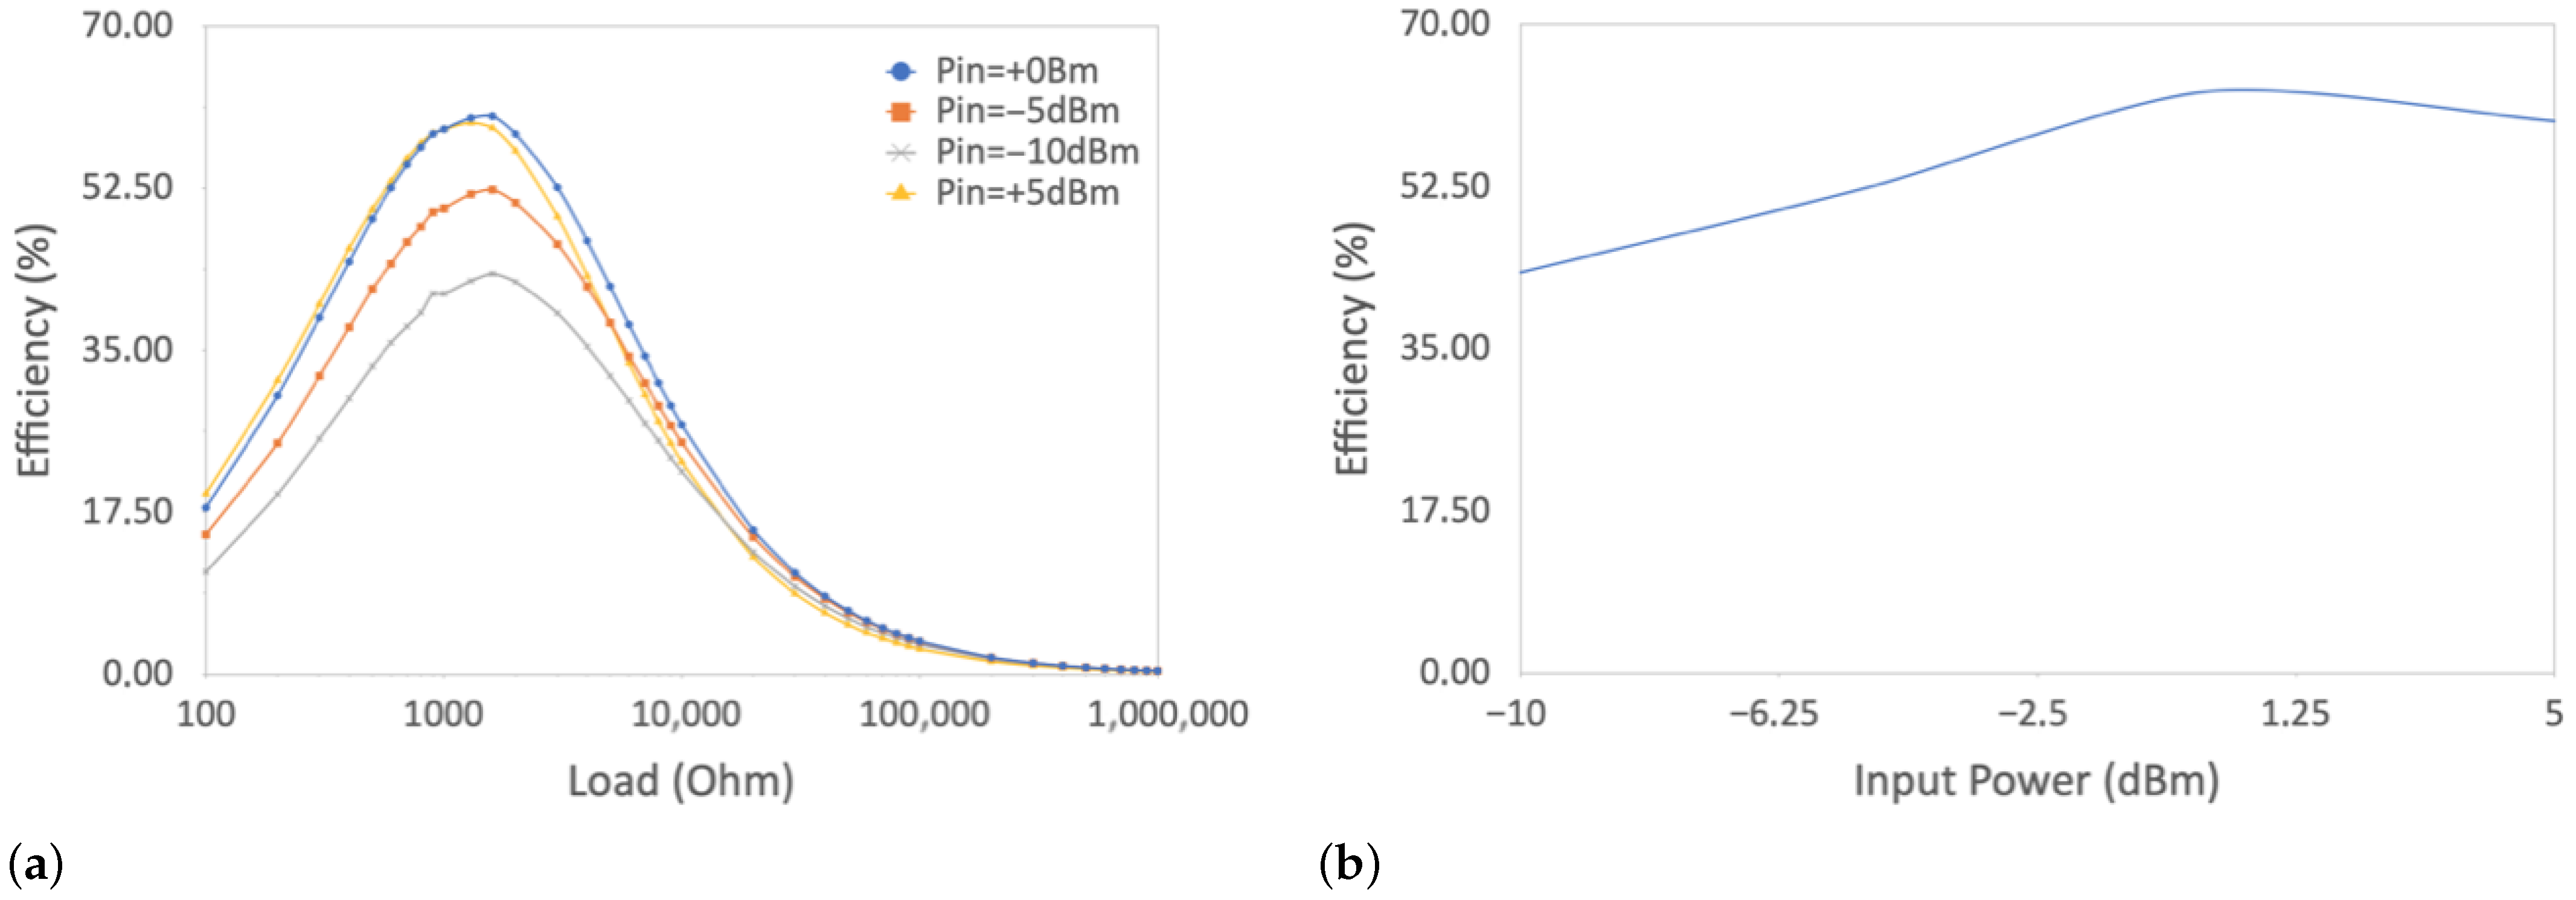
The rectifier efficiency was evaluated under varying load conditions and different input power levels. The experimental results are shown in
Figure 8: (a) the efficiency as a function of load resistance, and (b) the maximum efficiency achieved as a function of input power. A peak efficiency of 62.81% was obtained at an input power of 0 dBm and a load resistance of 1600
, which conforms to the operating point chosen for the impedance matching design.
2.3. The Source
Where gateways are traditionally used solely for data reception, this work demonstrates how the same infrastructure can also serve as an RF power transmitter for the sensors. Both the base station and the sensor node are based on the same hardware platform: the Wio-E5 Mini module (STM32W), which supports LoRa transmission powers of up to +20.8 dBm, in 2 dBm increments.
However, on the 868 MHz ISM band, regulatory power is limited to +14 dBm, and higher powers (up to +27 dBm) are allowed only under specific conditions [
18]. In our case, since the BS hardware with an STM32W is limited to a transmission power range of +20.8 dBm, the experiments on super capacitor charging were carried out over a transmission power range of +14 dBm to +20 dBm.
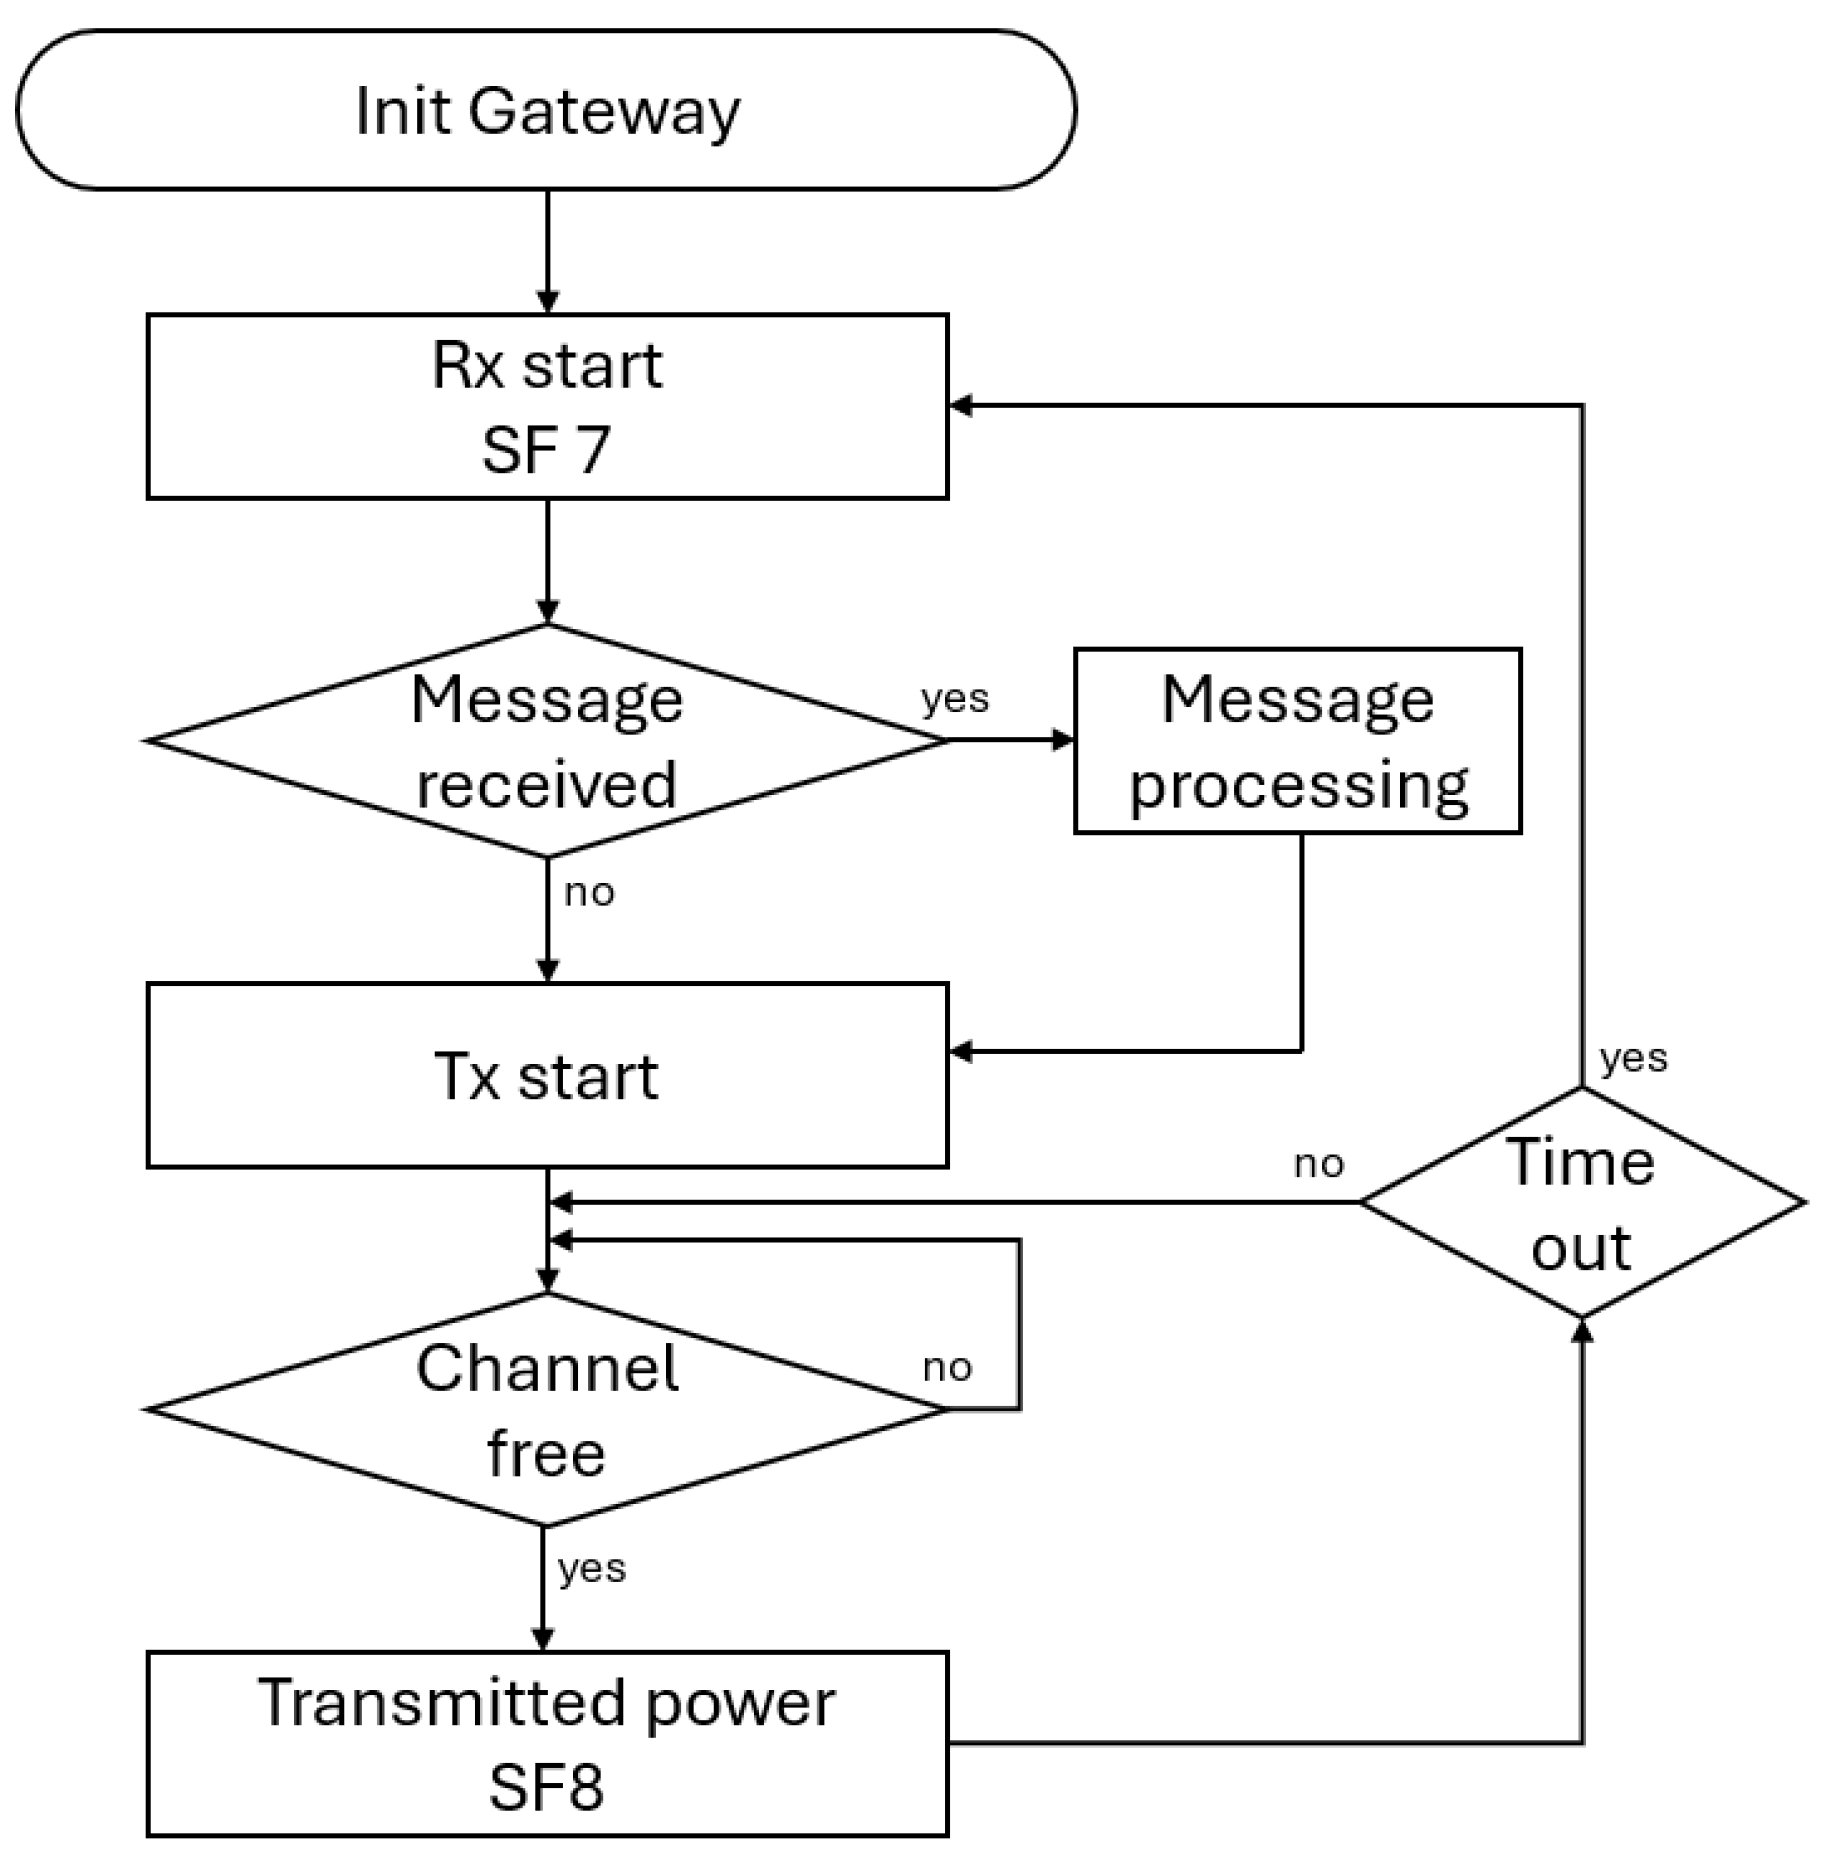
Before each RF energy transmission, the gateway checks that the channel is free, as illustrated in
Figure 9, ensuring that energy bursts do not interfere with incoming transmission node communication. Similarly, the node verifies that the channel with the dedicated spreading factor is free before sending its message. This approach reduces the risk of packet loss.
To minimize interference between transmitted and received signals, two different spreading factors (SFs) were used [
26,
27]: one for node transmission and gateway reception and the other for RFET. SF7 is employed for data communication, as it offers the lowest energy consumption. Conversely, SF8 is used for RF power transmission from the gateway. Lower spreading factors concentrate the transmitted energy over a shorter duration, resulting in higher instantaneous power, a key parameter for efficient RFET.
2.4. Complete System and Energy Balance
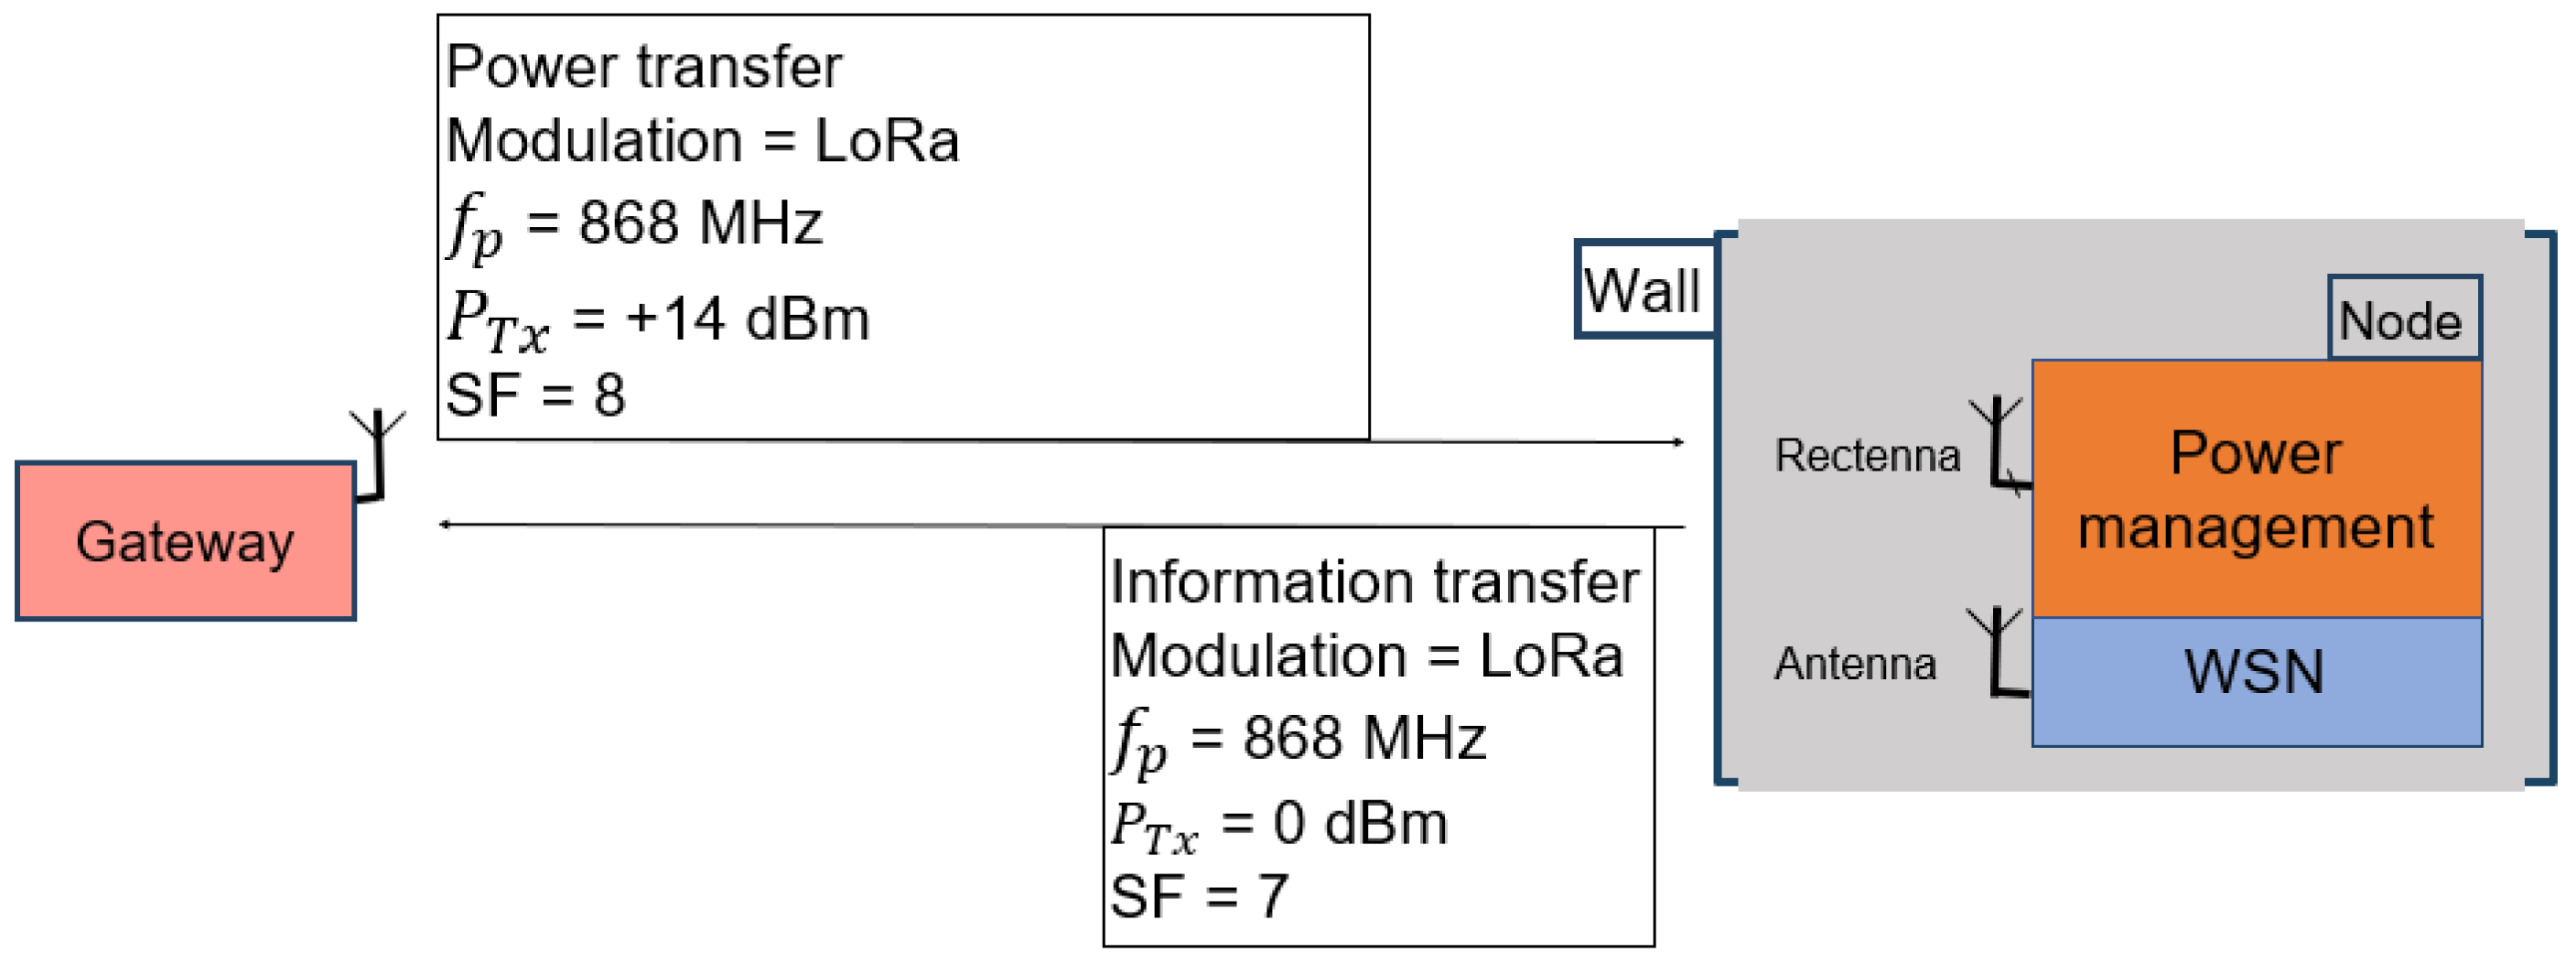
Figure 10 presents the complete setup, which includes the LoRa gateway and the buried sensor node. The node is powered by its energy-harvesting management system, which integrates a 330 mF supercapacitor and a rectenna operating at 868 MHz. This configuration illustrates how the system operates autonomously, with the gateway acting as both a communication hub and a wireless power source.
Table 5 presents the theoretical energy budget of the complete RF energy-harvesting chain, calculated step by step using ideal parameters for each conversion and transmission stage. The results reflect only the losses and conversion efficiencies modeled under an operating scenario representative of indoor IoT deployments (0.4 m, 868 MHz, 2 dBi transmitting antenna). No empirical correction or real-environment measurement was applied; each stage was calculated according to established equations and datasheet efficiencies. To complement this theoretical analysis, an experimental validation was performed using the approach described in [
16], with a different frequency and the rectenna developed in this study. The results show that, when the distance between the plasterboard and the rectenna is set to 3 cm, the harvested power increases by approximately 1% compared to the value measured in free space, likely due to constructive interference from reflections within the plasterboard.
Table 5 highlights, in a theoretical context, where the main losses occur within the RF-to-DC conversion chain. Starting with 158 mW of transmitted EIRP (22 dBm, 2 dBi emitter), the free-space path loss (FSPL, as defined in Equation (
4)) over a 40 cm distance attenuates the signal by 23.25 dB. As a result, only 728 µW reaches the receiver input, corresponding to a transmission efficiency of merely 0.46%. The primary subsequent reduction arises from the efficiency of the RF/DC converter, experimentally measured at 62% (see
Figure 8). The antenna, characterized by an S
11 of –17 dB at 868 MHz, reflects only about 2% of the incident power, meaning that approximately 98% is effectively accepted at its input. This results in a DC output power of 460 µW and an overall theoretical harvesting efficiency of 0.29%.
where:
In absolute terms, more than 99.7% of the initially transmitted power is lost before reaching the usable DC output, even under ideal conditions. The main limiting factors are therefore the combined effects of propagation losses and the intrinsic non-idealities of microwave-to-DC conversion, rather than wall effects or other marginal losses. Consequently, future improvements should focus on reducing propagation distance, optimizing antenna design, adding a reflector, and enhancing RF/DC conversion performance. The table also indicates that, while the EMS stages can be relatively efficient individually (50–90% for storage, 80% for output), their cumulative effect further decreases the already limited harvested power available for node operation.
3. Experimental Results
3.1. Evaluation of Supercapacitor Charging Time
This section evaluates the performance of the RF energy-harvesting system for powering an autonomous sensor node. The experimental setup comprises a LoRa gateway transmitting RF energy at various power levels, an 868 MHz rectenna positioned 1.3 m away, and an energy management system. The energy management system transfers the energy harvested in a 10 µF supercapacitor thanks to an efficient charge pump.
To emulate a realistic operating scenario, the system was then left running autonomously (the supercapacitor was initially precharged to 1.5 V to reduce the first step time). The voltage across the capacitor was logged continuously for a 2-h period. During this period, the sensor node becomes active periodically when it has sufficient energy to send messages. When the node sends a message, drawing energy, it discharges the capacitor. After the sending message period, the recharging period begins again, thanks to RF energy recovery.
To quantify the recharge time period, we developed a Python (3.13.1) script to automatically detect any discharge peaks (sharp drops in voltage) and identify the corresponding minimum and maximum voltages for each event. The recharge time is defined as the average duration it takes for the capacitor voltage to rise from its minimum value after the capacitor discharge event to its next maximum level before the next discharge.
Figure 11 illustrates the typical voltage curve time analysis recorded during this experiment, showing discharge and recharge periods.
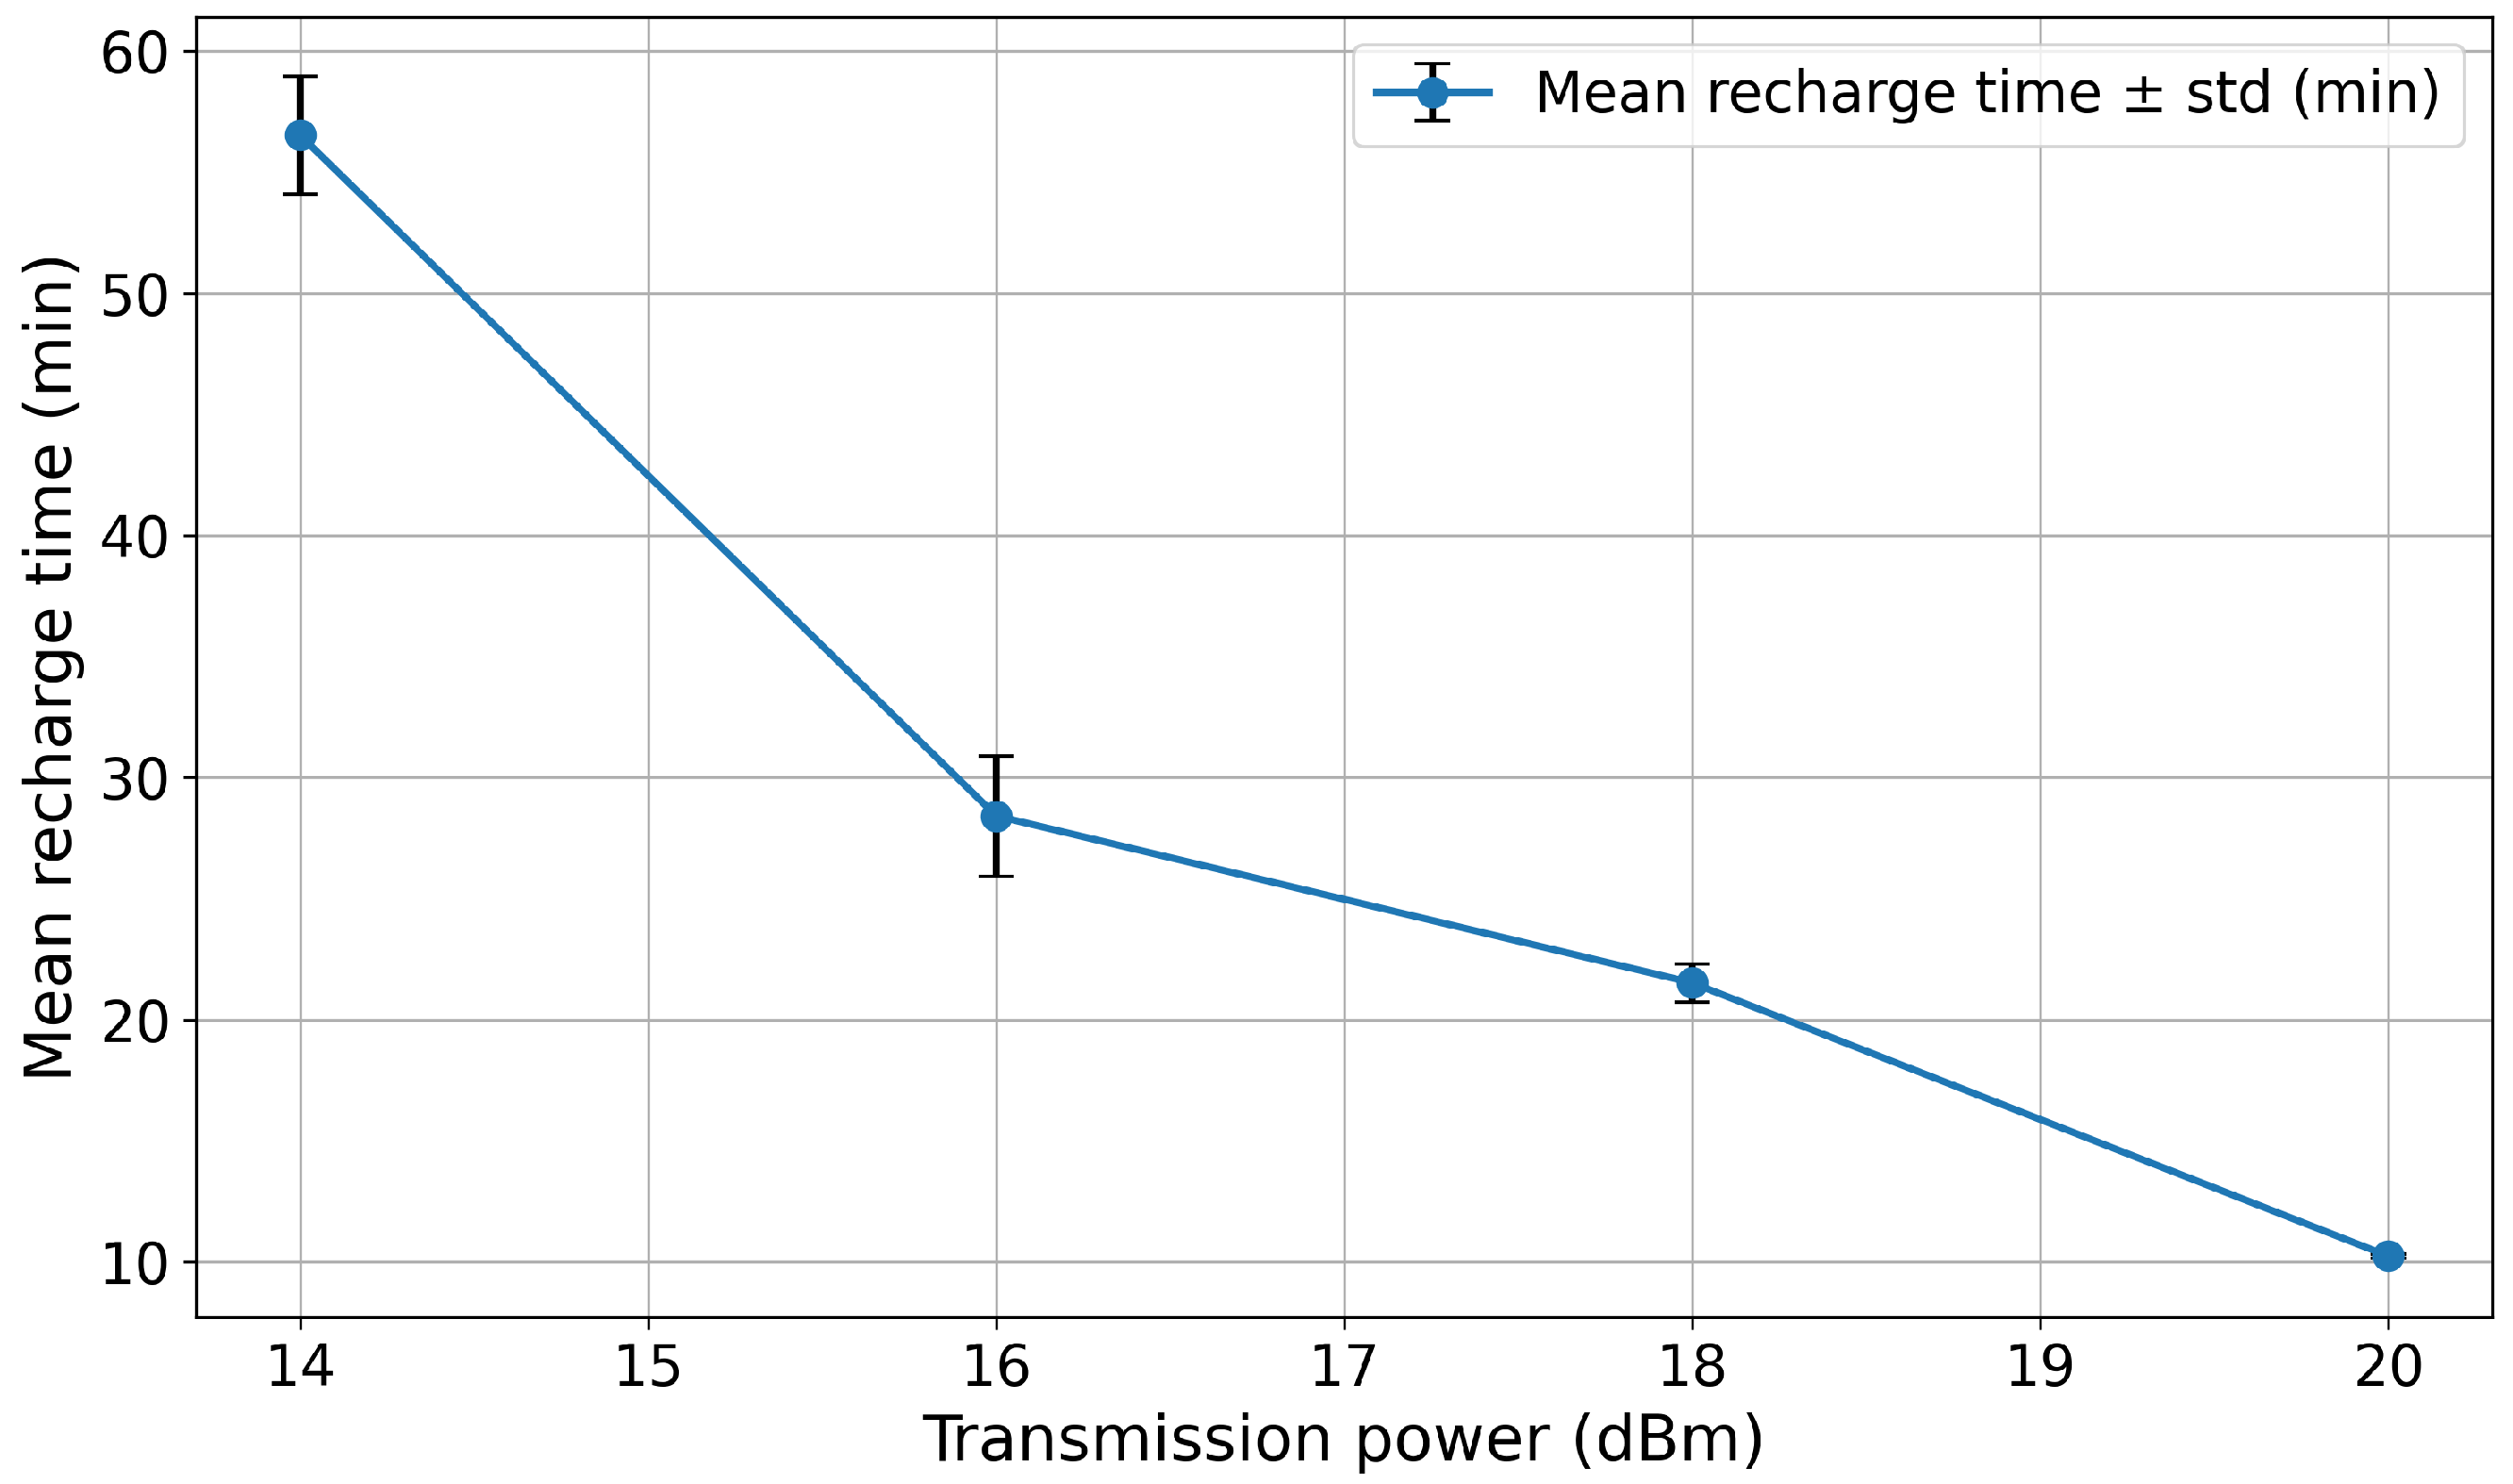
Figure 12 summarizes the average recharge time for different transmission power levels.
Longer measured recharge times are also presented in
Table 6.
These results highlight the impact of transmitted power on the supercapacitor charging time. With a transmission power of +20 dBm, the energy storage can be replenished in approximately 10 min, allowing for a 10-min transmission interval. However, the experimental setup does not fully comply with the gateway-level regulatory duty cycle limits due to the high transmission request defined for system characterization. The sensor node itself respects the regulatory constraints in its transmission behavior. These first measurements were conducted in a research context to evaluate the system’s energy-harvesting performance.
3.2. Maximum Range and Rectenna Network Performance
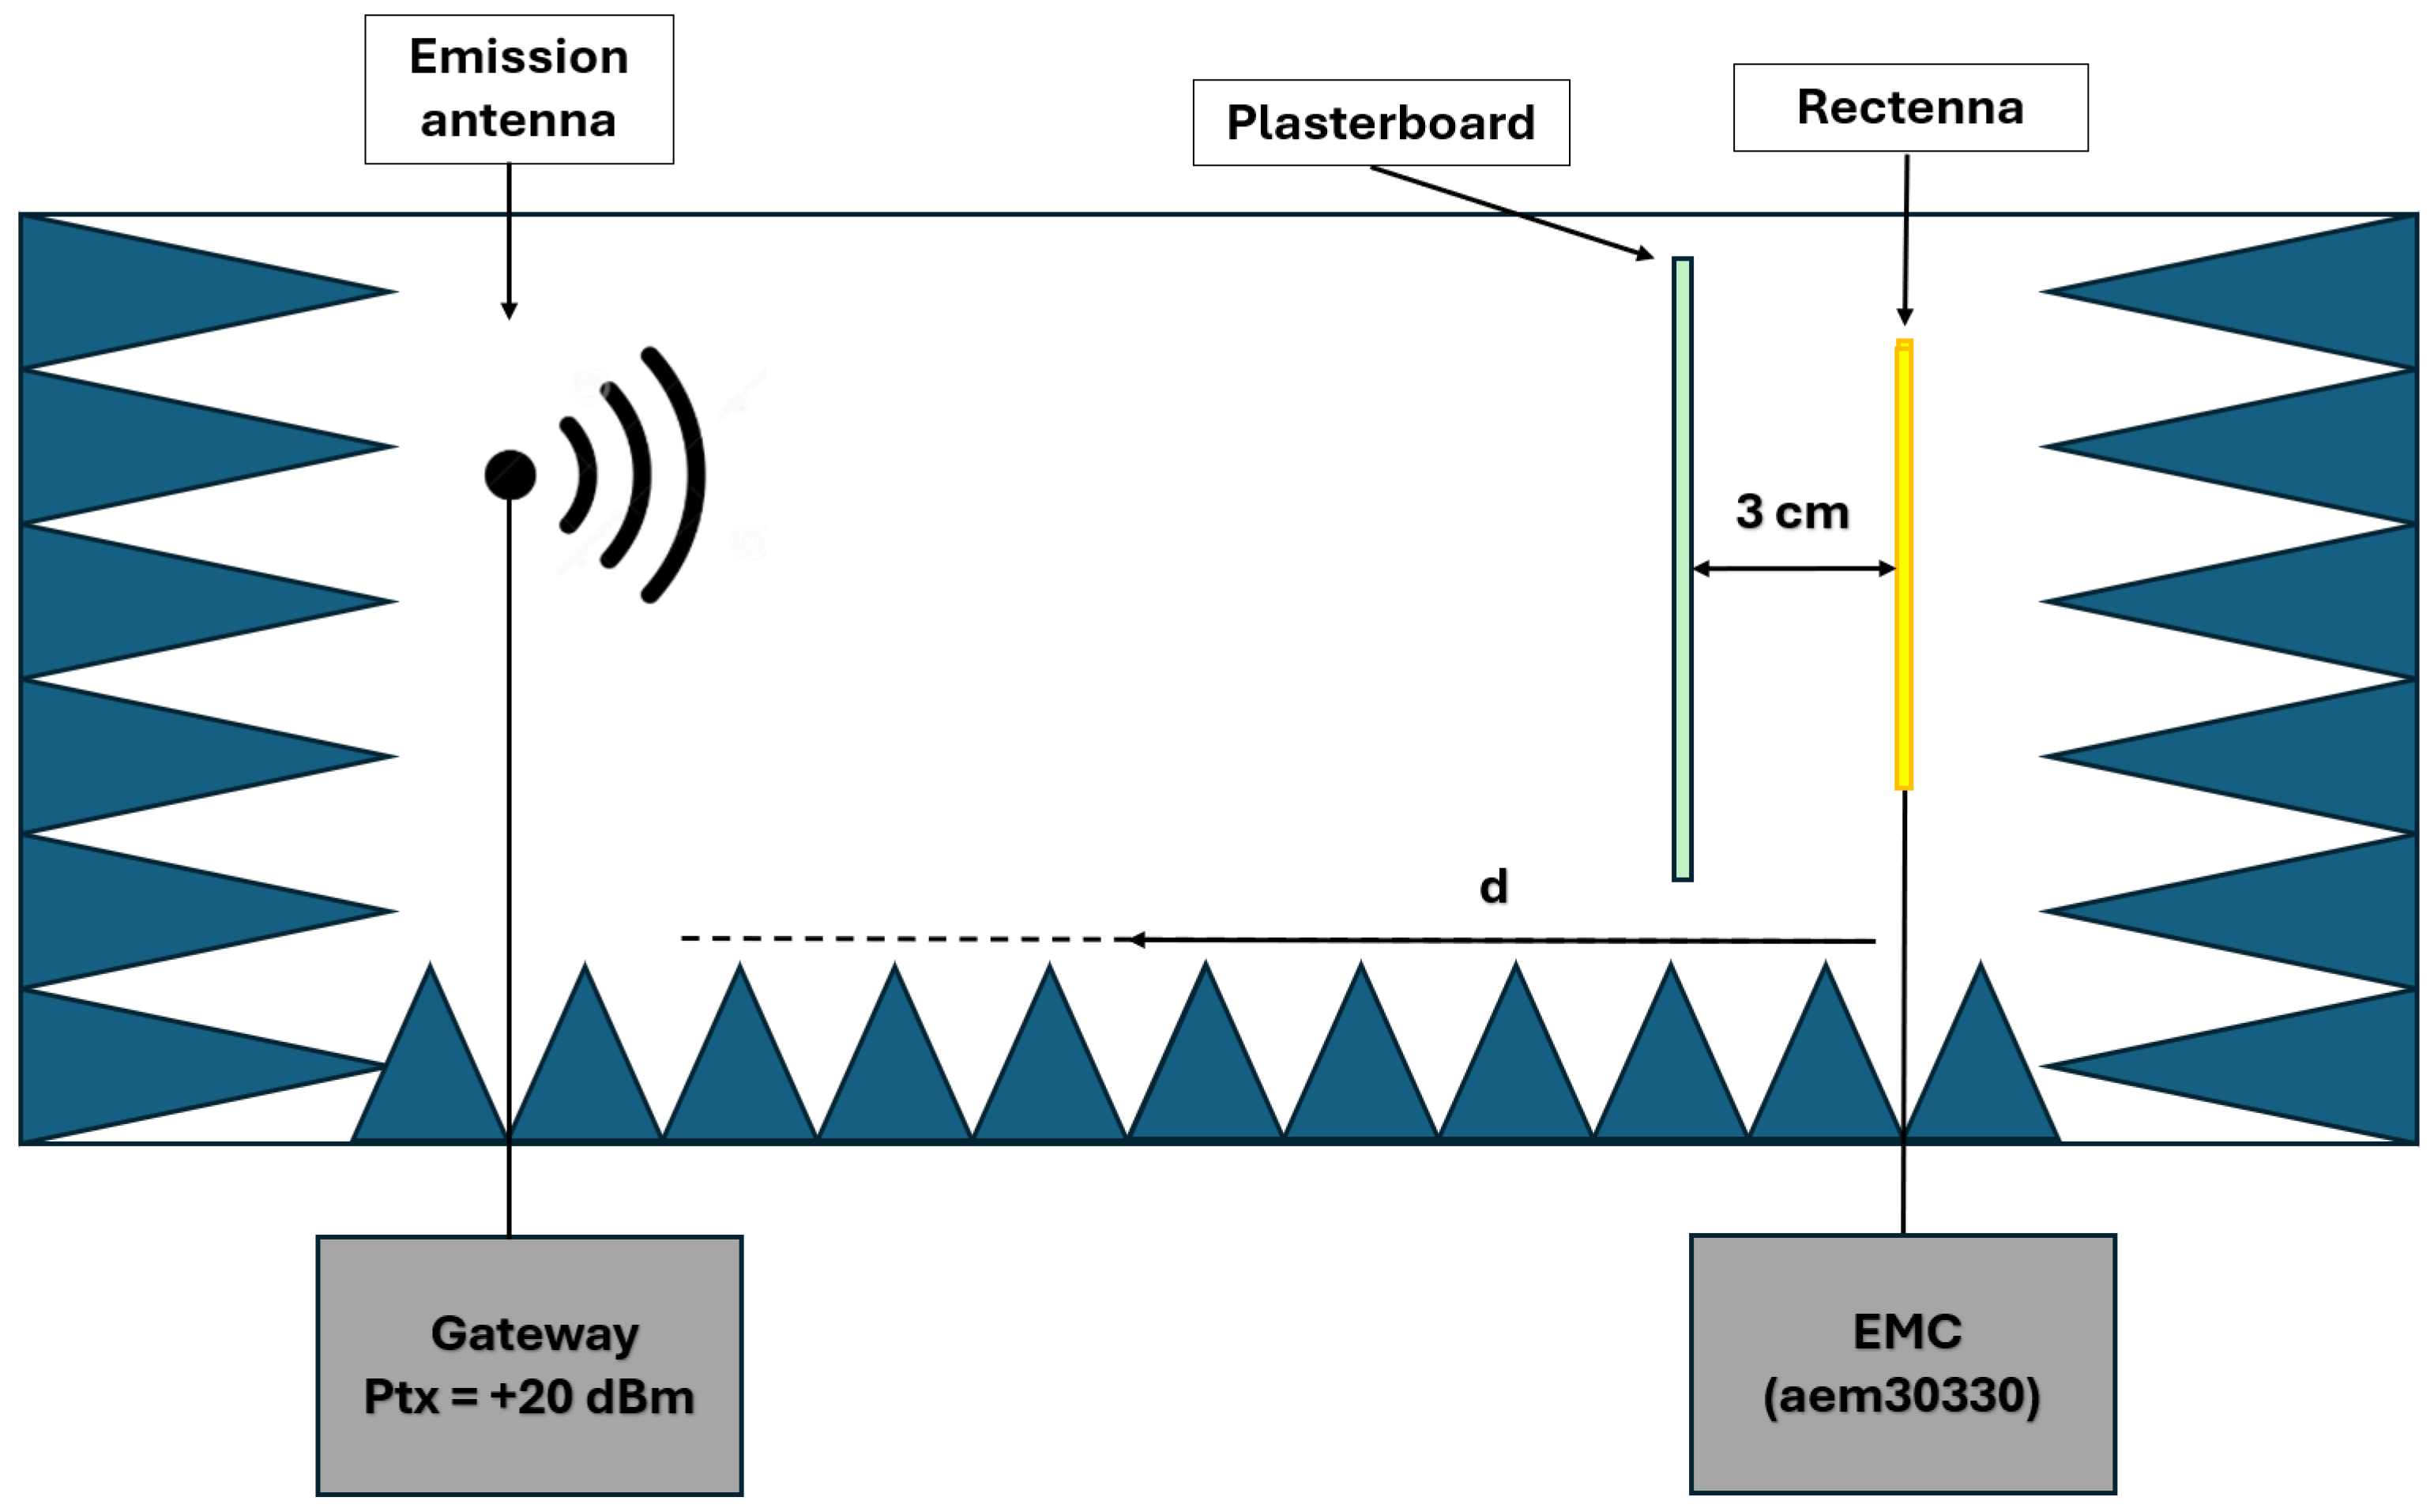
This subsection presents the measured maximum power harvesting distances obtained using a single rectenna, a rectenna equipped with a reflective plane, and, finally, a four-rectenna array. The following results allow a direct comparison between these architectures and clarify their performance limits under identical experimental conditions. For these experiments, a more efficient transmitting antenna with a +5 dBi gain was used [
28], and the overall experimental setup is detailed in
Figure 13. As established in previous sections, the gap between the plasterboard and the rectenna was fixed at 3 cm, a distance at which constructive interference from reflections within the plasterboard increases the harvested power behind the wall.
The measurements reported here were performed at the maximum gateway transmit power of +20 dBm to characterize the DC voltage produced by a rectenna as a function of the distance from the transmitting antenna. For each configuration, the rectenna output voltage was continuously recorded for one minute, with values logged at a fixed sampling interval of one point per second and stored as CSV files. The voltage measurements were performed using a Keysight 34465A 6½ digit digital multimeter, offering 30 ppm basic DC accuracy, high resolution, and advanced data logging capabilities for confident low-level signal analysis [
29].
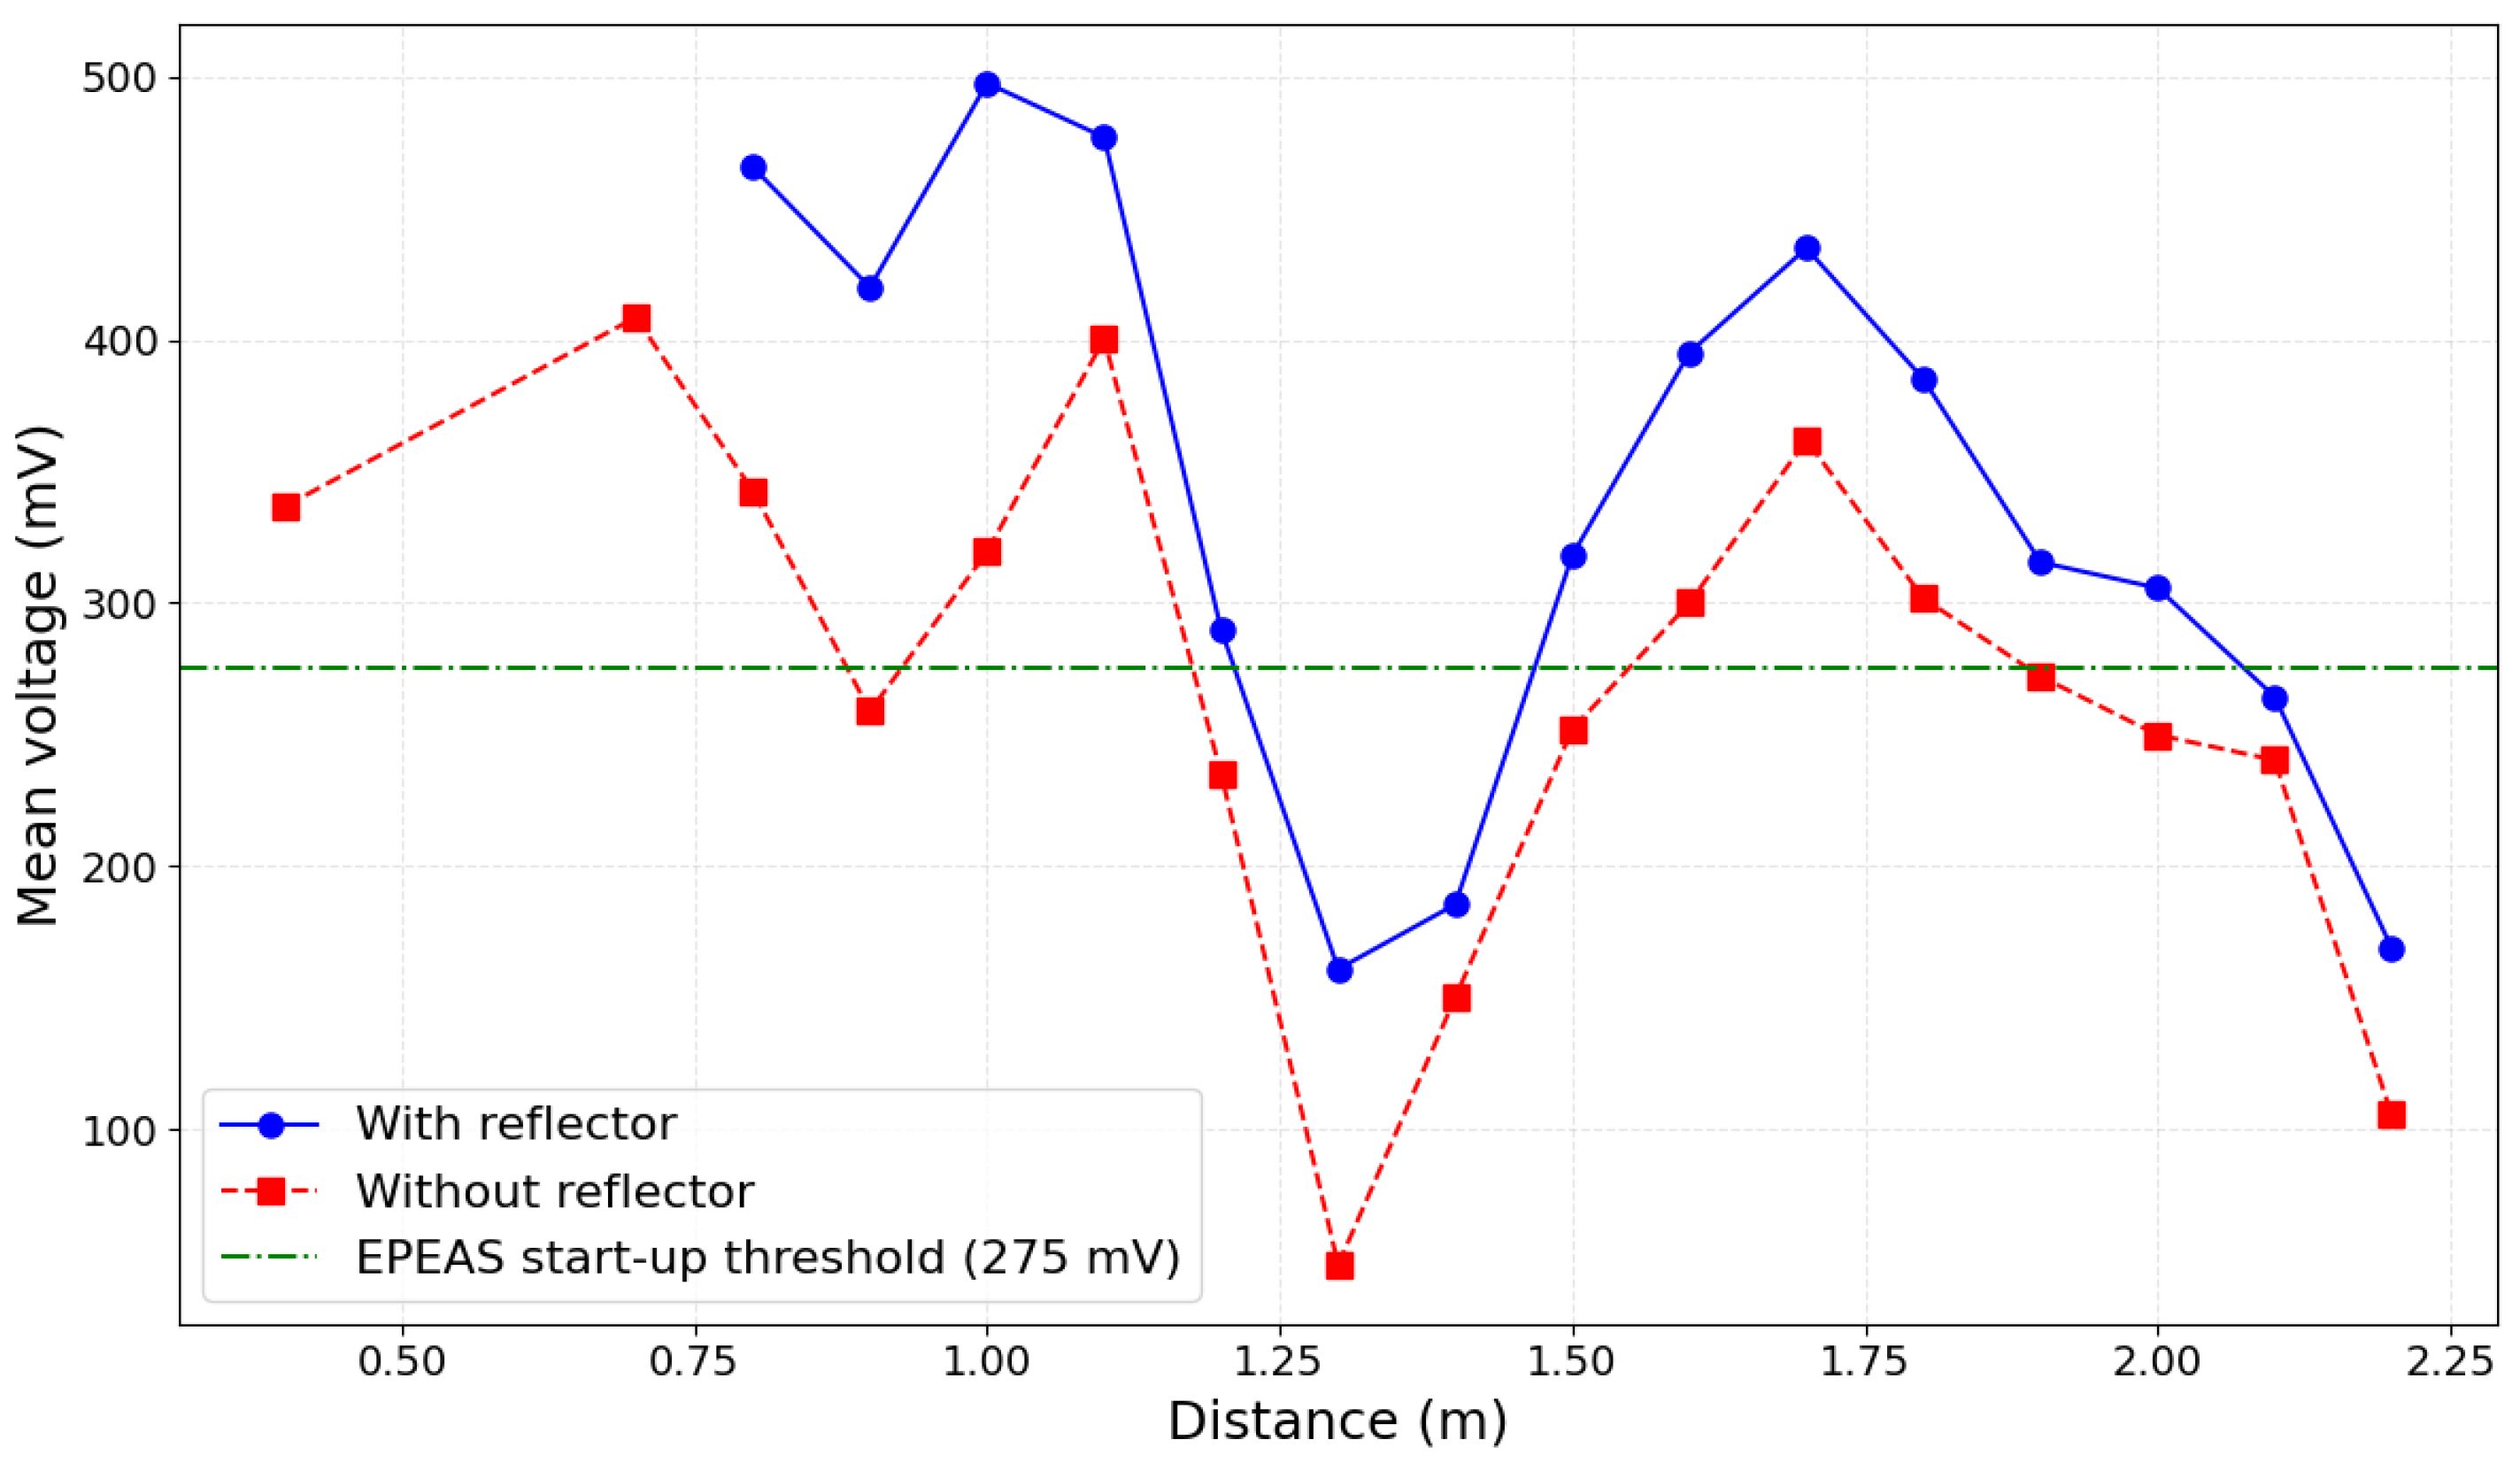
Figure 14 shows the mean DC output voltage of the rectenna as a function of the distance from the transmitting antenna.
In
Figure 14, a horizontal green dashed line at 275 mV marks the EPEAS energy harvester start-up threshold; this reference enables direct assessment of whether the rectenna’s mean DC output under each configuration is sufficient to reliably power the target energy management circuit (EMC). The red dashed line with square markers corresponds to measurements without a reflector, while the blue solid line with circular markers corresponds to measurements with a reflector.
At a transmit power of +20 dBm, the mean DC output voltage of the rectenna exceeds the EPEAS start-up threshold (275 mV) up to about 1.8 m without a reflector, and up to about 2.0 m when a reflector is added. Thus, at maximum gateway power, the addition of a reflector increases the effective harvesting range from 40 cm (at +14 dBm) to approximately 2 m. A closer examination of the output voltage reveals oscillations that depend on the distance, with local maxima occurring near 1.0 m and 1.60 m. These distance-dependent peaks align with the interference effects reported in [
16] and can be attributed to constructive and destructive interferences caused by the plasterboard partition and the multipath environment.
Across the tested configurations, the mean rectenna voltage with a reflector was 338 mV, compared to 269 mV without a reflector, corresponding to an average absolute increase of 69 mV (26% relative gain). On a per-distance basis, the reflector produced an average increase of 83 mV, indicating that a nearby metallic reflector systematically raises the DC voltage available to the harvester and, thus, extends the distance over which the EPEAS start-up threshold (275 mV) is reached.
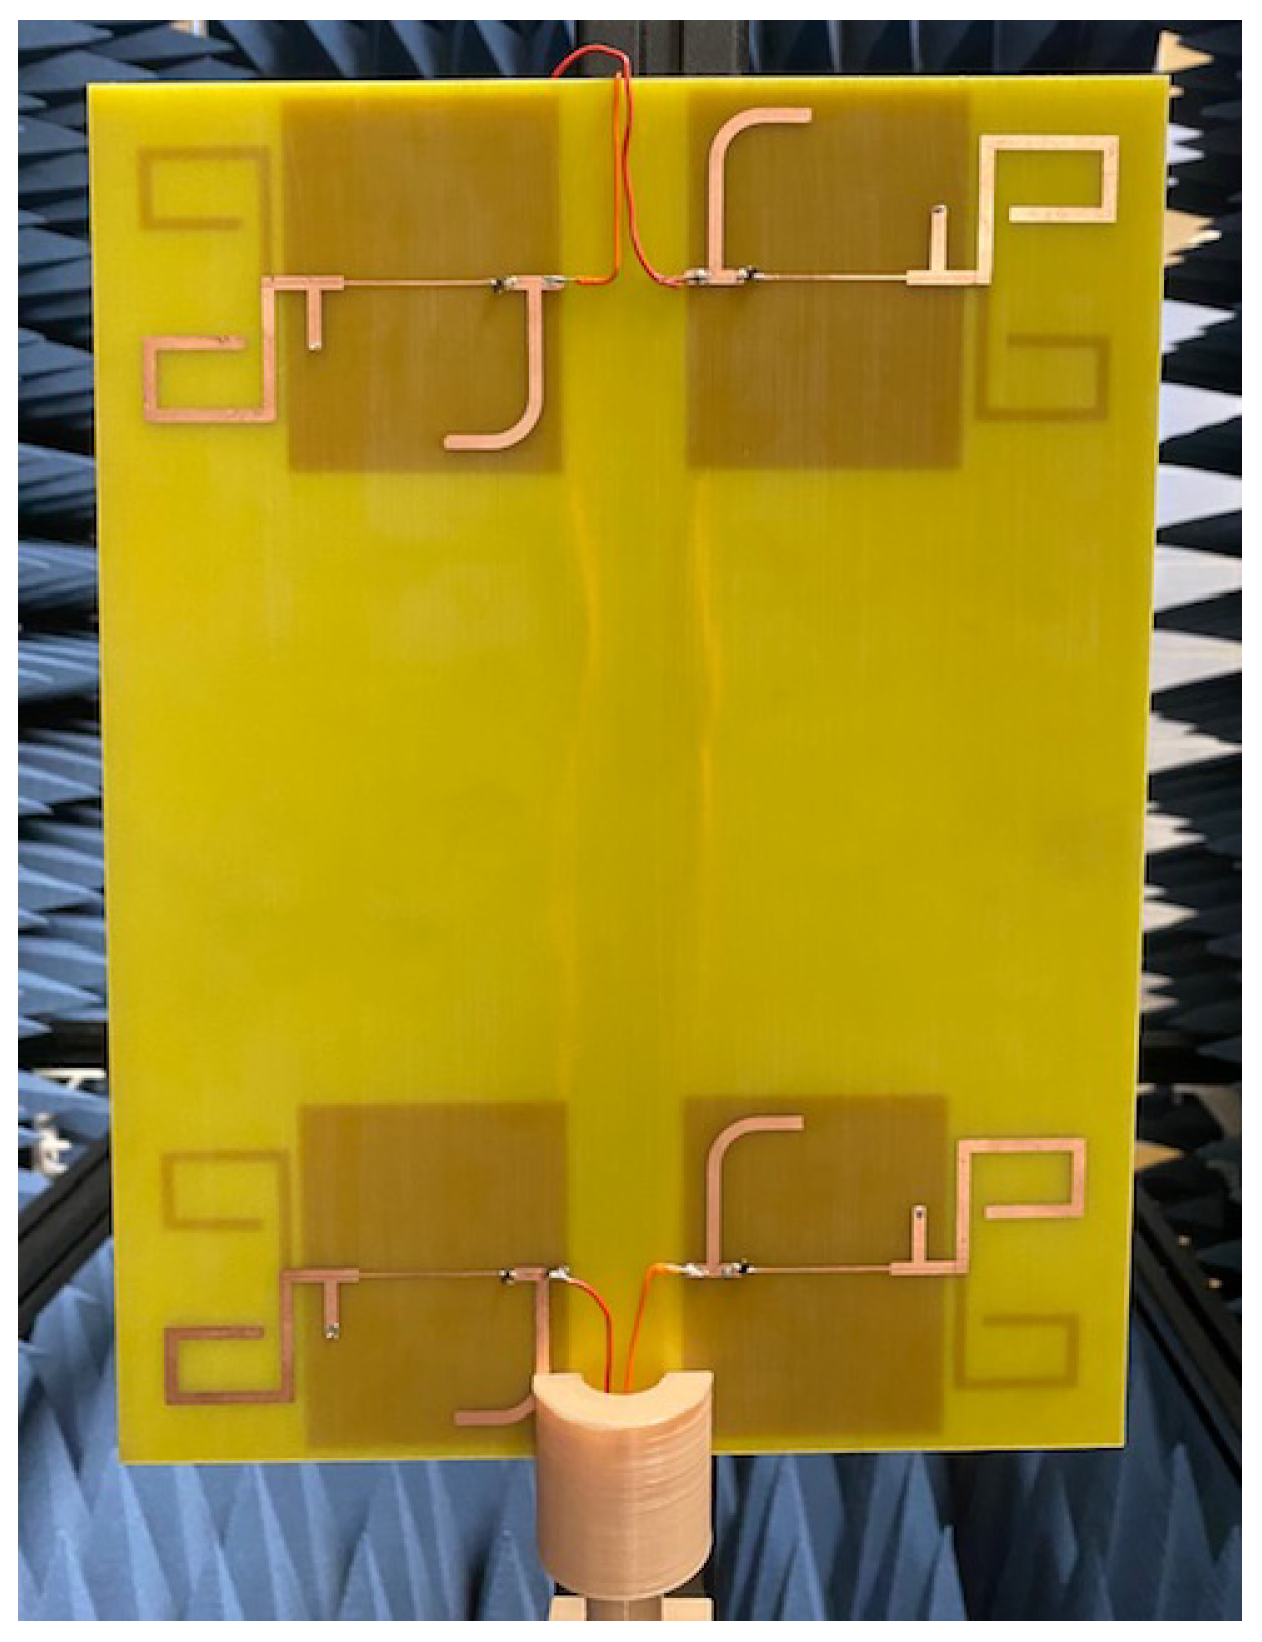
To further increase the operating range, a four-rectenna array was developed, as shown in
Figure 15. The dipole arms of each antenna were symmetrically folded to halve the array’s overall footprint while maintaining resonance at the target frequency, with only a modest decrease in individual rectenna efficiency. All rectennas were connected in series to maximize the cumulative DC output. The spacing between rectennas was determined experimentally to minimize mutual coupling effects, ensuring optimal overall performance. Experimental results revealed that, compared to a single rectenna, the series-connected array provided a 550% increase in harvested DC power.
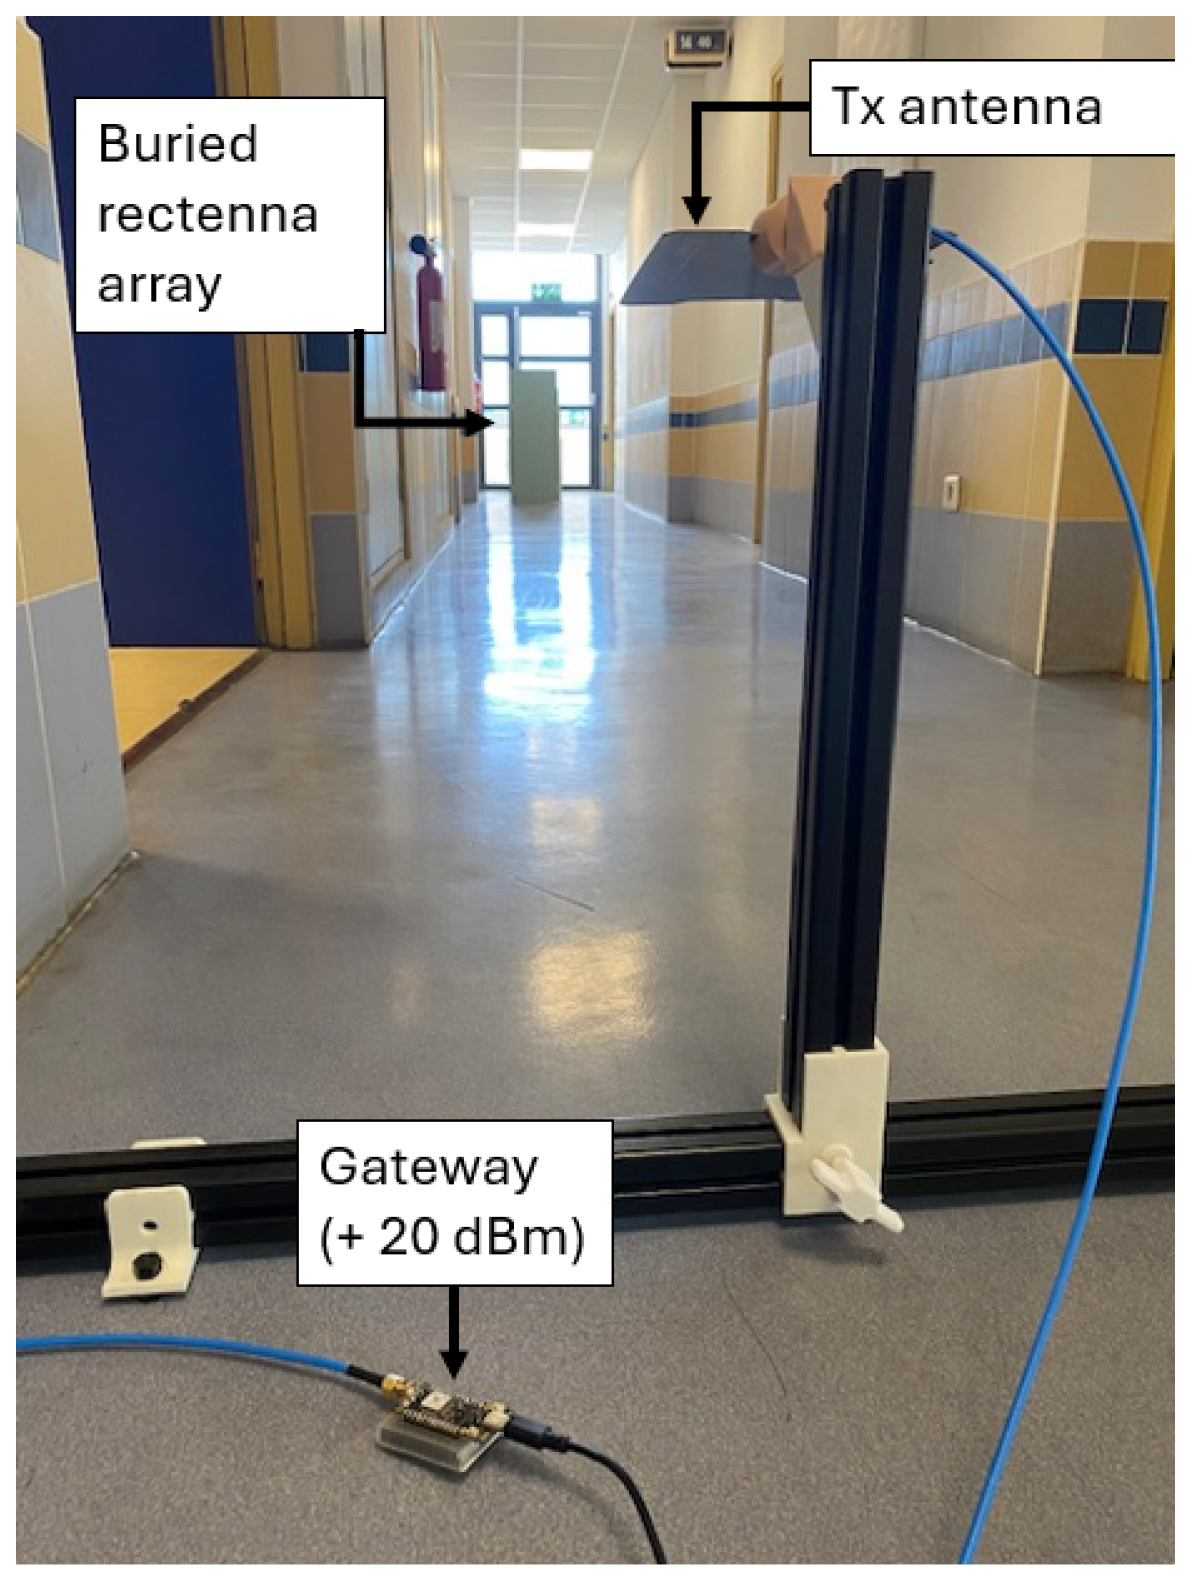
The transmitting power was maintained at +20 dBm for all long-distance tests. Measurements were performed in the environment shown in
Figure 16.
The node and its rectenna array were placed inside a plasterboard enclosure, with the rectennas positioned at the optimal distance from the material. The separation between the transmitting antenna and the rectenna array was progressively increased until the operational limit was reached. For these measurements, the same transmitting antenna with a 5 dBi gain at 868 MHz was used [
28]. This setup enabled reaching the 275 mV threshold at the input of the EMC at distances greater than 10 m, demonstrating the feasibility of long-range RFET in a buried environment.
With a single rectenna, the maximum operational range, defined by the voltage threshold of the energy management circuit, was 1.80 m; using the four-element array, the range was extended to 10.80 m. This constitutes a 500% gain in usable transmission distance, demonstrating that mutual coupling control and array scaling can dramatically improve medium-range wireless energy harvesting.
4. Discussion
The results obtained in this study demonstrate the feasibility of a buried, battery-free sensor system powered solely by radio-frequency (RF) energy harvesting via a LoRa gateway. Although this power supply method is constrained by European regulations (ETSI EN300.220), it achieves a demonstrator that proposes fully autonomous nodes supporting a widely used transmission protocol.
Building on these feasibility results, the system design reveals another decisive advantage. Using a gateway that can receive data while transmitting RF power is a key factor in simplifying the system. Unlike other studies that require a dedicated RF source or intermediate node, our approach natively integrates power distribution into the existing communication infrastructure, thereby reducing sensor network deployment costs and complexity.
Another significant perspective for this study is the design of an extended rectenna network embedded within building walls. By increasing the harvesting surface area, this network will capture more RF energy, which can significantly increase the gateway distance. This strategy will be particularly suitable for sensors buried in construction materials, such as plasterboard or OSB, where larger available volumes allow for the optimized integration of receiving antennas, unlike in small IoT devices.
Furthermore, the overall energy-harvesting-chain efficiency could be improved through antenna gain optimization, impedance matching, or the use of a rectenna network. All of these improvements should enable a reduction in the RF power gateway transmission duty cycle to comply with European standards. Adding an RF circulator could also allow the node to share the same antenna for communication and energy harvesting, thereby simplifying the hardware design.
The experimental results clarify the substantial impact of integrating advanced rectenna networks in medium-range RF energy-harvesting scenarios involving buried nodes. When spatial constraints limit array deployment, the addition of a passive reflector proved particularly beneficial, yielding a 26% increase in harvested power even in highly compact setups. Moreover, the parametric adjustment of array geometry and the minimization of mutual coupling enabled a cumulative harvested power increase by a factor of 5.5 with the networked array, while operational range, defined by the EMC threshold, was extended from 1.8 m (single rectenna) to 10.8 m (array), corresponding to a six-fold improvement. These measurements collectively highlight the critical roles of both local field engineering and system-level network scaling strategies for overcoming propagation and conversion losses. The results demonstrate that combining a reflector and array optimization enables robust, long-range, battery-free sensor operation in challenging environments, motivating further development of scalable rectenna network solutions.
To contextualize these results, it is essential to compare them with existing approaches. Therefore, we compare the main characteristics of our proposed system with other recent approaches found in the literature.
Table 7 summarizes the essential specifications of three battery-free wireless sensing nodes, highlighting their respective communication protocol, energy-harvesting management, and experimental performance.
In comparison with these works, our approach demonstrates that a non-continuous and substantially lower transmit power, originating directly from a LoRa gateway rather than a dedicated RF power transmitter, can still sustain the operation of the sensing node over comparable distances. Nevertheless, a key distinction concerns the energy storage stage. The supercapacitor used in our prototype (330 mF) is significantly larger than those employed in the referenced studies, which lengthens the charging time and leads to a conservative duty cycle. This indicates that further optimization is possible. Reducing the storage capacitance, while ensuring that the energy required by the node remains available, would shorten the recharge interval and increase the reporting frequency. Moreover, adding a reflector plane behind the rectenna array could further enhance the harvested power by increasing the effective gain of the receiving structure. This improvement would not only increase the node’s energy margin but also extend the operational distance beyond what is currently achieved. Such developments would further strengthen the relevance of RF-powered sensing architectures that rely solely on infrastructure-compatible emitters such as LoRa gateways.
5. Conclusions
This work demonstrates that a fully batteryless sensor node can be practically implemented for structural health monitoring, powered solely by RF energy harvested from a LoRa gateway. In this study, the harvested energy was stored in a 330 mF supercapacitor, which is sufficient to power a complete transmission cycle. Under these conditions, the node successfully transmitted one message approximately every hour when the gateway emitted at +14 dBm, and every ten minutes at +20 dBm. These results underscore the direct influence of available RF power on monitoring frequency and highlight the importance of optimizing energy management strategies under realistic deployment scenarios.
Experimental findings further revealed that the introduction of a passive reflector increased harvested power by 26% in environments with spatial constraints that limited antenna placement. Scaling up to a four-element rectenna array enhanced total harvested DC power by 550% and enabled node operation at distances exceeding 10 m from the gateway, representing a five-fold increase in operational range compared to a single rectenna. These advances emphasize the critical role of network design and local field optimization in maximizing energy harvesting for deeply embedded, maintenance-free sensor networks.
Future work may focus on several enhancements, including increasing transmission power within regulatory limits and deploying rectenna arrays within building structures to further boost harvested energy. Such improvements could reduce recharge times and extend communication range, making the system more adaptable to diverse building configurations and real-world monitoring applications.
Author Contributions
Conceptualization, J.S. and T.F.; methodology, J.S.; software, J.S.; validation, J.S., P.-O.L.d.P., T.F. and D.G.-C.; formal analysis, J.S.; investigation, J.S.; resources, J.S.; data curation, J.S., T.F. and A.D.; writing—original draft preparation, J.S.; writing—review and editing, J.S.; visualization, J.S.; supervision, P.-O.L.d.P., D.G.-C. and J.-P.C.; project administration, J.-P.C.; funding acquisition, J.S. and A.D. All authors have read and agreed to the published version of the manuscript.
Funding
This research was supported by the Région Réunion and the European Regional Development Fund (ERDF; grant number: DIRED.20210168).
Institutional Review Board Statement
Not applicable.
Informed Consent Statement
Not applicable.
Data Availability Statement
The data supporting the findings of this study are available from the corresponding author upon reasonable request.
Acknowledgments
The authors thank the Energy-LAB Laboratory PhD students and staff from Réunion University for their support and precious collaborations. Special thanks to the LCIS laboratory (University Grenoble Alpes) for providing technical expertise.
Conflicts of Interest
The authors declare no conflicts of interest.
Abbreviations
The following abbreviations are used in this manuscript:
| ADS | Advanced design system (simulation software for RF design) |
| BS | Base station |
| dBm | Decibel-milliwatt |
| EIRP | Equivalent isotropically radiated power |
| EVK | Evaluation kit |
| FR4 | Flame retardant 4 (a type of epoxy substrate used in PCB) |
| FSPL | Free-space path loss |
| IoT | Internet of things |
| LoRa | Long range |
| mF | Millifarad |
| MHz | Megahertz |
| mJ | Millijoule |
| µW | Microwatt |
| RF | Radio frequency |
| SF | Spreading factor |
| TERF | Transfert d’Énergie par Radiofréquences |
References
- Zinno, R.; OBrien, E.J. State-of-the-Art Structural Health Monitoring in Civil Engineering. Appl. Sci. 2023, 13, 11609. [Google Scholar] [CrossRef]
- Grossi, M. Energy Harvesting Strategies for Wireless Sensor Networks and Mobile Devices: A Review. Electronics 2021, 10, 661. [Google Scholar] [CrossRef]
- Sardini, E.; Serpelloni, M. Self-Powered Wireless Sensor for Air Temperature and Velocity Measurements with Energy Harvesting Capability. IEEE Trans. Instrum. Meas. 2011, 60, 1838–1844. [Google Scholar] [CrossRef]
- Meli, M.L.; Favre, S.; Maij, B.; Stajic, S.; Boebel, M.; Poole, P.J.; Schellenberg, M.; Kouzinopoulos, C.S. Energy Autonomous Wireless Sensing Node Working at 5 Lux from a 4 cm2 Solar Cell. J. Low Power Electron. Appl. 2023, 13, 12. [Google Scholar] [CrossRef]
- Sharma, H.; Haque, A.; Jaffery, Z.A. Solar energy harvesting wireless sensor network nodes: A survey. J. Renew. Sustain. Energy 2018, 10, 023704. [Google Scholar] [CrossRef]
- Li, J.; Ouro-Koura, H.; Arnow, H.; Nowbahari, A.; Galarza, M.; Obispo, M.; Tong, X.; Azadmehr, M.; Halvorsen, E.; Hella, M.M.; et al. Broadband Vibration-Based Energy Harvesting for Wireless Sensor Applications Using Frequency Upconversion. Sensors 2023, 23, 5296. [Google Scholar] [CrossRef] [PubMed]
- Zanelli, F.; Mauri, M.; Castelli-Dezza, F.; Sabbioni, E.; Tarsitano, D.; Debattisti, N. Energy Autonomous Wireless Sensor Nodes for Freight Train Braking Systems Monitoring. Sensors 2022, 22, 1876. [Google Scholar] [CrossRef] [PubMed]
- Yao, M.; Liu, P.; Ma, L.; Wang, H.; Zhang, W. Experimental study on broadband bistable energy harvester with L-shaped piezoelectric cantilever beam. Acta Mech. Sin. 2020, 36, 557–577. [Google Scholar] [CrossRef]
- Loubet, G.; Sidibe, A.; Herail, P.; Takacs, A.; Dragomirescu, D. Autonomous Industrial IoT for Civil Engineering Structural Health Monitoring. IEEE Internet Things J. 2024, 11, 8921–8944. [Google Scholar] [CrossRef]
- Sherazi, H.H.R.; Zorbas, D.; O’Flynn, B. A Comprehensive Survey on RF Energy Harvesting: Applications and Performance Determinants. Sensors 2022, 22, 2990. [Google Scholar] [CrossRef] [PubMed]
- Jiang, Y.; Peng, L.; Hu, A.; Wang, S.; Huang, Y.; Zhang, L. Physical layer identification of LoRa devices using constellation trace figure. EURASIP J. Wirel. Commun. Netw. 2019, 2019, 223. [Google Scholar] [CrossRef]
- Mistry, R.; Neves, M.; Goswami, B. A Systematic Study on LoRa Communication in IoT: Implementation Challenges and Research Solutions. In Proceedings of the Information, Communication and Computing Technology, Bikaner, India, 17–18 December 2022; Badica, C., Paprzycki, M., Kharb, L., Chahal, D., Eds.; Springer: Cham, Switzerland, 2022; pp. 16–29. [Google Scholar]
- Cariou, C.; Moiroux-Arvis, L.; Pinet, F.; Chanet, J.P. Data Collection from Buried Sensor Nodes by Means of an Unmanned Aerial Vehicle. Sensors 2022, 22, 5926. [Google Scholar] [CrossRef] [PubMed]
- Luo, Y.; Pu, L.; Wang, G.; Zhao, Y. RF Energy Harvesting Wireless Communications: RF Environment, Device Hardware and Practical Issues. Sensors 2019, 19, 3010. [Google Scholar] [CrossRef] [PubMed]
- Lu, X.; Wang, P.; Niyato, D.; Kim, D.I.; Han, Z. Wireless Networks with RF Energy Harvesting: A Contemporary Survey. arXiv 2014, arXiv:1406.6470. [Google Scholar] [CrossRef]
- Sibille, J.; Fougeroux, T.; Lucas de Peslouan, P.O.; Douyère, A.; Gonfo, D.; Genon-Catalot, D.; Chabriat, J.P. Caractérisation de la récolte d’énergie RF à travers des matériaux pour des capteurs enfouis. 18 édition des Journées de Caractérisation Microondes et Matériaux. 2025. Poster. Available online: https://hal.science/hal-05154459v1/file/JCMM_SIBILLE.pdf (accessed on 20 November 2025).
- Liu, X.; Li, M.; Zhang, Y.; Zhu, X.; Guan, Y. Self-Powered wireless sensor node based on RF energy harvesting and management combined design. Energy Convers. Manag. 2023, 292, 117393. [Google Scholar] [CrossRef]
- Short Range Devices (SRD) Operating in the Frequency Range 25 MHz to 1000 MHz. 2018. Available online: https://www.etsi.org/deliver/etsi_en/300200_300299/30022002/03.02.01_60/en_30022002v030201p.pdf (accessed on 3 March 2025).
- Wio-E5 Mini. 2023. Available online: https://wiki.seeedstudio.com/LoRa_E5_mini/ (accessed on 24 July 2024).
- Ould, S.; Bennett, N.S. Energy Performance Analysis and Modelling of LoRa Prototyping Boards. Sensors 2021, 21, 7992. [Google Scholar] [CrossRef] [PubMed]
- Premsankar, G.; Ghaddar, B.; Słabicki, M.; Francesco, M.D. Optimal Configuration of LoRa Networks in Smart Cities. IEEE Trans. Ind. Inform. 2020, 16, 7243–7254. [Google Scholar] [CrossRef]
- Filho, M.N.C.; Campista, M.E.M. Intelligent Configuration of PHY-Layer Parameters to Reduce Energy Consumption in LoRa. In Proceedings of the 2022 IEEE Latin-American Conference on Communications (LATINCOM), Rio de Janeiro, Brazil, 30 November–2 December 2022; pp. 1–6. [Google Scholar] [CrossRef]
- Benatti, R.S.; de Souza, C.P.; Baiocchi, O. An Optimization Method based on LoRa Parameters for Energy Consumption Reduction. In Proceedings of the 2021 5th International Symposium on Instrumentation Systems, Circuits and Transducers (INSCIT), Campinas, Brazil, 23–27 August 2021; pp. 1–5. [Google Scholar] [CrossRef]
- AEM30330 Integrated Energy Management Circuit. 2023. Available online: https://e-peas.com/product/aem30330/ (accessed on 25 July 2024).
- National Instruments. PXIe-5630 Vector Network Analyzer Specifications; 10 MHz–6 GHz, dynamic range > 100 dB, SMA 50 ohm; National Instruments Corporation: Austin, TX, USA, 2010. [Google Scholar]
- Narieda, S.; Fujii, T.; Umebayashi, K. Energy Constrained Optimization for Spreading Factor Allocation in LoRaWAN. Sensors 2020, 20, 4417. [Google Scholar] [CrossRef] [PubMed]
- Maurya, P.; Singh, A.; Kherani, A.A. A review: Spreading factor allocation schemes for LoRaWAN. Telecommun. Syst. 2022, 80, 449–468. [Google Scholar] [CrossRef]
- DeepAce. R101C 730 MHz–6.5 GHz Wideband Directional Antenna. Available online: https://deepace.net/product/r101c-730mhz-6-5ghz-wideband-directional-antenna/ (accessed on 29 October 2025).
- Technologies, Keysight Keysight 34465A 6.5 Digit Digital Multimeter Specifications; 6½ Digit Truevolt DMM, 30 ppm DC Accuracy, Advanced Data Logging. 2021. Available online: https://www.keysight.com/us/en/assets/7018-03846/data-sheets/5991-1983.pdf (accessed on 20 November 2025).
Figure 1.
Energy consumption versus packet size and spreading factor under various transmission power levels.
Figure 1.
Energy consumption versus packet size and spreading factor under various transmission power levels.
Figure 2.
(a) Node current consumption profile over time during a 30-s data transmission cycle. (b) Detailed view of the peak current consumption during message transmission.
Figure 2.
(a) Node current consumption profile over time during a 30-s data transmission cycle. (b) Detailed view of the peak current consumption during message transmission.
Figure 3.
Typical block diagram of a rectenna.
Figure 3.
Typical block diagram of a rectenna.
Figure 4.
The 868 MHz dipole antenna: (a) front side, (b) back side with ground plane.
Figure 4.
The 868 MHz dipole antenna: (a) front side, (b) back side with ground plane.
Figure 5.
Simulated and measured reflection coefficient () of the 868 MHz dipole.
Figure 5.
Simulated and measured reflection coefficient () of the 868 MHz dipole.
Figure 6.
Complete view of the fabricated 868 MHz rectifier prototype on FR4.
Figure 6.
Complete view of the fabricated 868 MHz rectifier prototype on FR4.
Figure 7.
Rectifier input impedance Smith chart including low-pass filter and 1600 load.
Figure 7.
Rectifier input impedance Smith chart including low-pass filter and 1600 load.
Figure 8.
Rectifier efficiency measured: (a) as a function of the load resistance, (b) maximum efficiency as a function of the input power.
Figure 8.
Rectifier efficiency measured: (a) as a function of the load resistance, (b) maximum efficiency as a function of the input power.
Figure 9.
Functional algorithm of the gateway.
Figure 9.
Functional algorithm of the gateway.
Figure 10.
Complete system overview: the LoRa gateway and the buried node with its RF Power energy-harvesting management module.
Figure 10.
Complete system overview: the LoRa gateway and the buried node with its RF Power energy-harvesting management module.
Figure 11.
Measured voltage across the supercapacitor over time, showing discharge and recharge cycles. The recharge time is measured between the lowest and highest points between two events.
Figure 11.
Measured voltage across the supercapacitor over time, showing discharge and recharge cycles. The recharge time is measured between the lowest and highest points between two events.
Figure 12.
Average supercapacitor recharge time as a function of the gateway’s transmission power.
Figure 12.
Average supercapacitor recharge time as a function of the gateway’s transmission power.
Figure 13.
Measurement setup diagram with the distance (d) varying between the rectenna and the emission antenna.
Figure 13.
Measurement setup diagram with the distance (d) varying between the rectenna and the emission antenna.
Figure 14.
Mean DC output of rectenna vs. distance: with and without reflector (20 dBm).
Figure 14.
Mean DC output of rectenna vs. distance: with and without reflector (20 dBm).
Figure 15.
Four-rectenna array at 868 MHz.
Figure 15.
Four-rectenna array at 868 MHz.
Figure 16.
Distance maximal setup measurement.
Figure 16.
Distance maximal setup measurement.
Table 1.
Energy cost comparison between LoRaWAN (join + message) and Raw LoRa.
Table 1.
Energy cost comparison between LoRaWAN (join + message) and Raw LoRa.
| Spreading Factor | Join Phase (mJ) | LoRaWAN Message (mJ) | Raw LoRa (mJ) | Extra Cost (mJ) | Increase (%) |
|---|
| SF7 | 943.97 | 626.61 | 366.62 | 1203.96 | 328.4 |
| SF8 | 957.66 | 645.64 | 373.44 | 1229.86 | 329.3 |
| SF9 | 987.71 | 672.33 | 377.72 | 1282.32 | 339.5 |
| SF10 | 1038.95 | 727.14 | 391.73 | 1374.36 | 350.8 |
| SF11 | 1179.74 | 872.17 | 424.83 | 1627.08 | 383.0 |
| SF12 | 1387.32 | 1097.05 | 483.45 | 2000.92 | 414.0 |
Table 2.
Summary of node configuration parameters.
Table 2.
Summary of node configuration parameters.
| Parameter | Values |
|---|
| Frequency | 868 MHz |
| Bandwidth | 125 kHz |
| Duty cycle | 30 s |
| SF | 7 |
| Tx | 0 dBm |
| Message size | 3 byte |
Table 3.
Duration and energy required for each phase of the node.
Table 3.
Duration and energy required for each phase of the node.
| Phases | Instruction | Time (ms) | Energy (mJ) |
|---|
| 1 | Wait | 27,900 | 1226.5 |
| 2 | Wake-up and channel free | 15 | 0.9 |
| 3 | Sending message | 85 | 7.9 |
| 4 | Listening window | 2000 | 126.7 |
| | Total | 30,000 | 1.90 |
Table 4.
Dipole antenna dimensions.
Table 4.
Dipole antenna dimensions.
| Parameter | Dimension (mm) |
|---|
| 1 | 16.7 |
| 2 | 60 |
| 3 | 45 |
| 4 | 20 |
| 5 | 80 |
| 6 | 25 |
| Width of line | 2.7 |
Table 5.
Energy balance for an RF energy-harvesting chain with one rectenna (0.4 m, 868 MHz, through plasterboard, emitter gain 2 dBi).
Table 5.
Energy balance for an RF energy-harvesting chain with one rectenna (0.4 m, 868 MHz, through plasterboard, emitter gain 2 dBi).
| System Stage | Main Parameters | Result | Efficiency (%) |
|---|
| Transmitted power (EIRP) | | 22 dBm (158 mW) | — |
| FSPL propagation | at 0.4 m, 868 MHz | 23.25 dB | 0.48 |
| Transmission gain (plaster, 3 cm) | ( dB) | 23.25 dB (corrected) | — |
| Received power after plaster | | dBm (757 μW) | — |
| Rectenna antenna S11 (coupling) | S11 = dB (≈98%) | 742 μW | 98 |
| Rectenna antenna gain | () | 1 174 μW | — |
| RF/DC conversion | Typical rectifier efficiency | 728 μW | 62 |
| Global efficiency | Output/Input | 0.46% (728 μW/158 mW) | 0.46 |
| EMS (SRC to STO) | Storage charge efficiency (min/max) | — | 50/90 |
| EMS (STO to LOAD) | Discharge efficiency (to load) | — | 80 |
Table 6.
Summary of average recharge times as a function of transmission power.
Table 6.
Summary of average recharge times as a function of transmission power.
| Transmission Power (dBm) | Average Recharge Time (min) |
|---|
| +14 dBm | 58 |
| +16 dBm | 31 |
| +18 dBm | 22 |
| +20 dBm | 10 |
Table 7.
Comparative summary of wireless battery-free sensor architectures.
Table 7.
Comparative summary of wireless battery-free sensor architectures.
| Parameter | [17] | [9] | This Work |
|---|
| Year | 2023 | 2024 | 2025 |
| Communication Frequency | 2.45 GHz NRF24L01 | 868 MHz LoRa | 868 MHz LoRa |
| Emission Source | Dedicated RF transmitter, 14 dBi | RF-powered node (WPT) | LoRa Gateway |
| Emission Frequency | 868 MHz | 868 MHz | 868 MHz |
| Continuous Source | Yes | Yes | No |
| Emission Power | 27 dBm | 33 dBm EIRP | 14–20 dBm (reg./STM) 1 |
| Max Distance | 13.5 m | <10 m | <10 m |
| Antenna | Dipole 2.6 dBi | Dipole 1.5 dBi | Dipole 2 dBi |
| Use Reflector | Yes | Yes | No |
| Rectenna Array Size (Elements) | 6 | 1 | 4 |
| Energy Storage | Capacitor 100 µF | Supercapacitor 22 mF | Supercapacitor 330 mF |
| Disclaimer/Publisher’s Note: The statements, opinions and data contained in all publications are solely those of the individual author(s) and contributor(s) and not of MDPI and/or the editor(s). MDPI and/or the editor(s) disclaim responsibility for any injury to people or property resulting from any ideas, methods, instructions or products referred to in the content. |
© 2025 by the authors. Licensee MDPI, Basel, Switzerland. This article is an open access article distributed under the terms and conditions of the Creative Commons Attribution (CC BY) license (https://creativecommons.org/licenses/by/4.0/).

