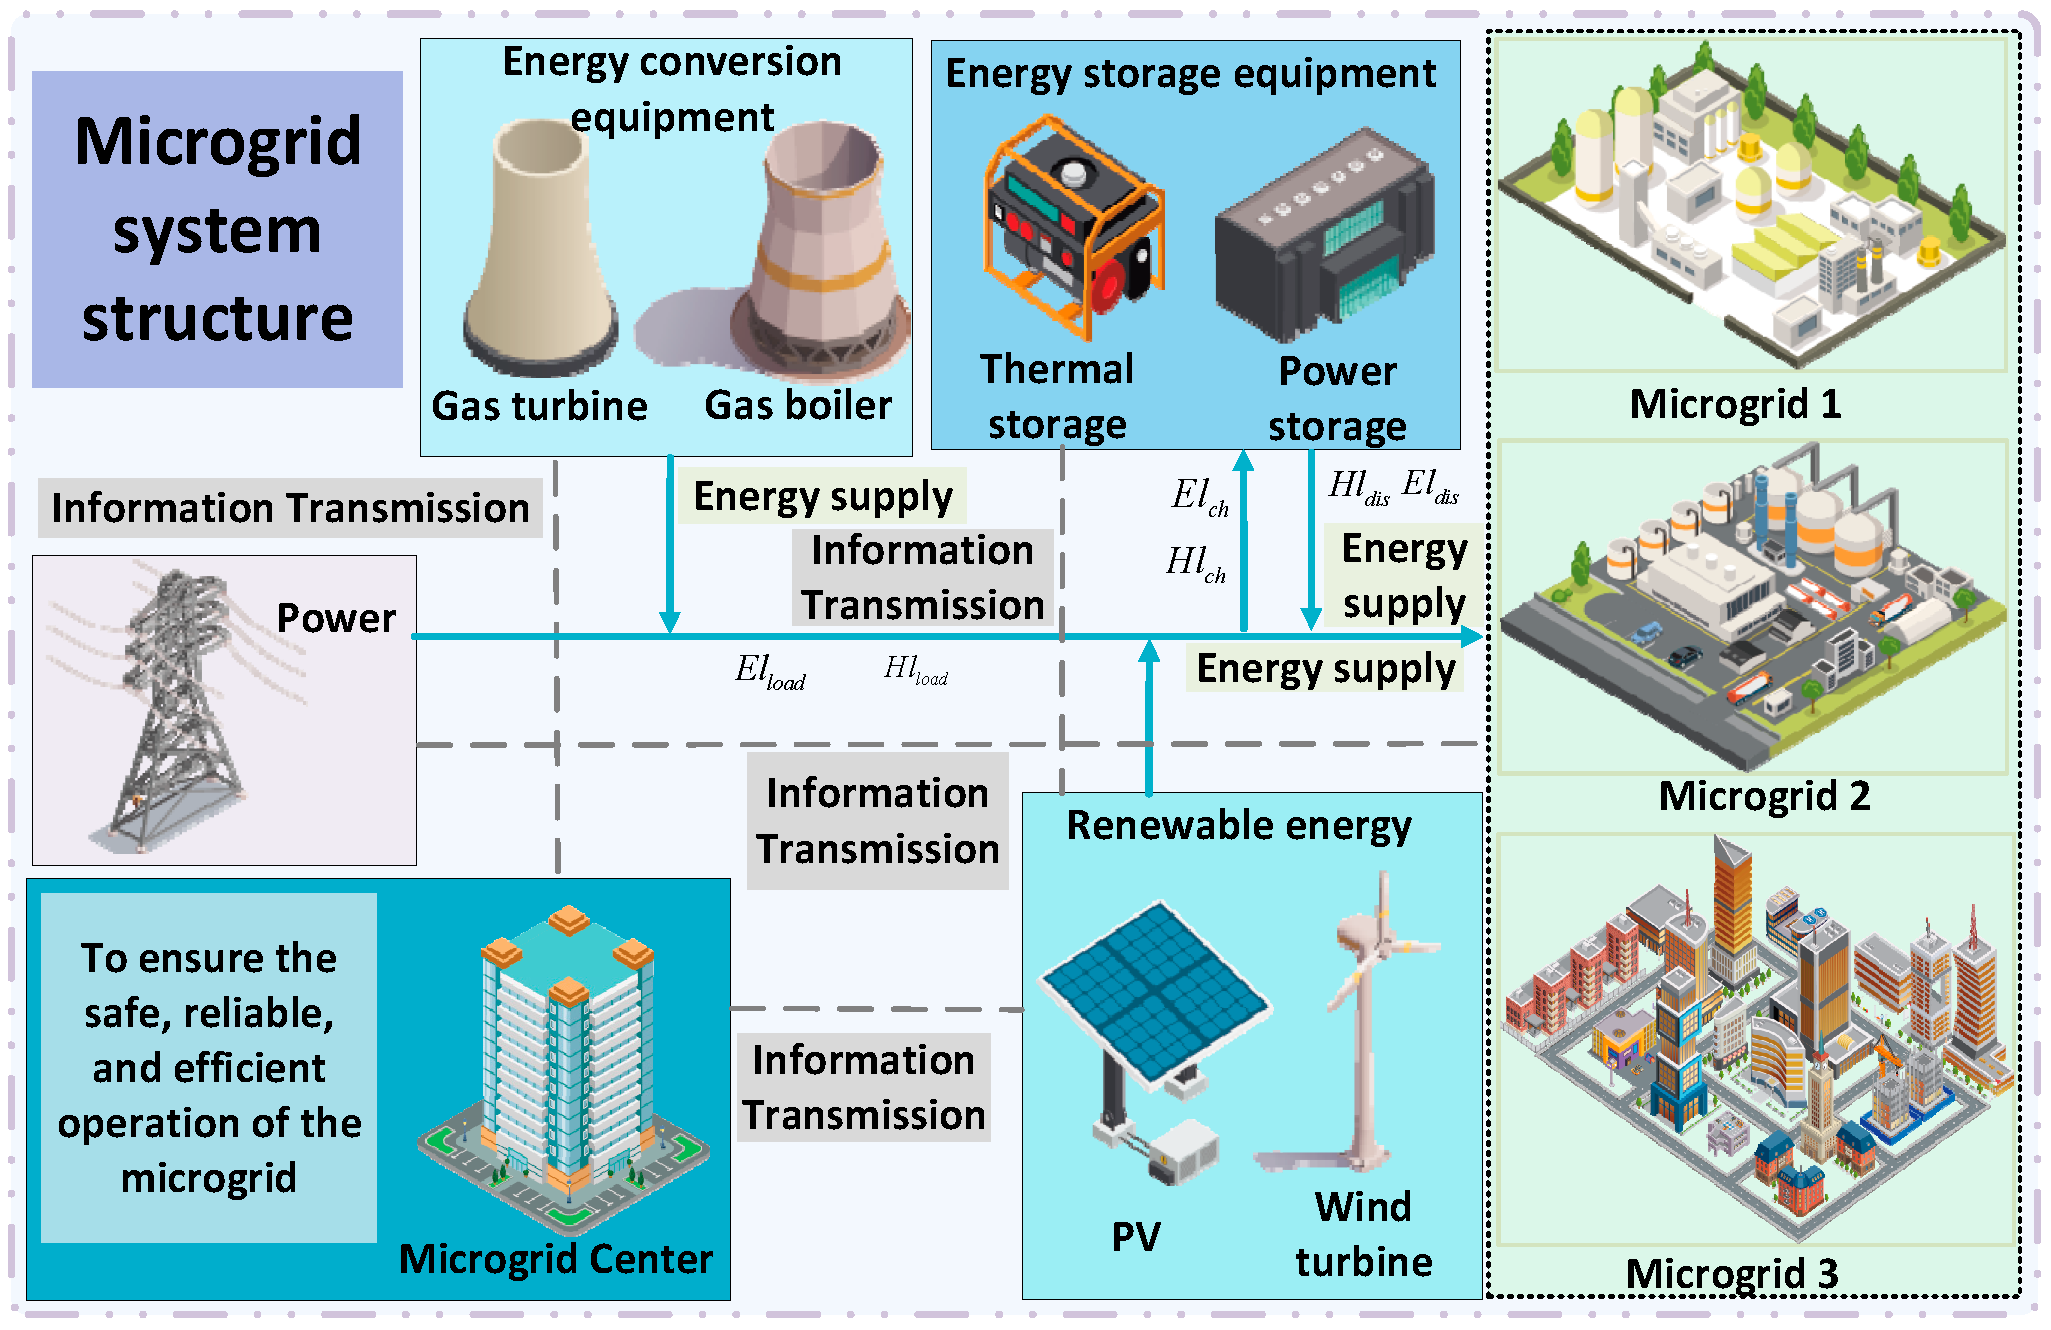
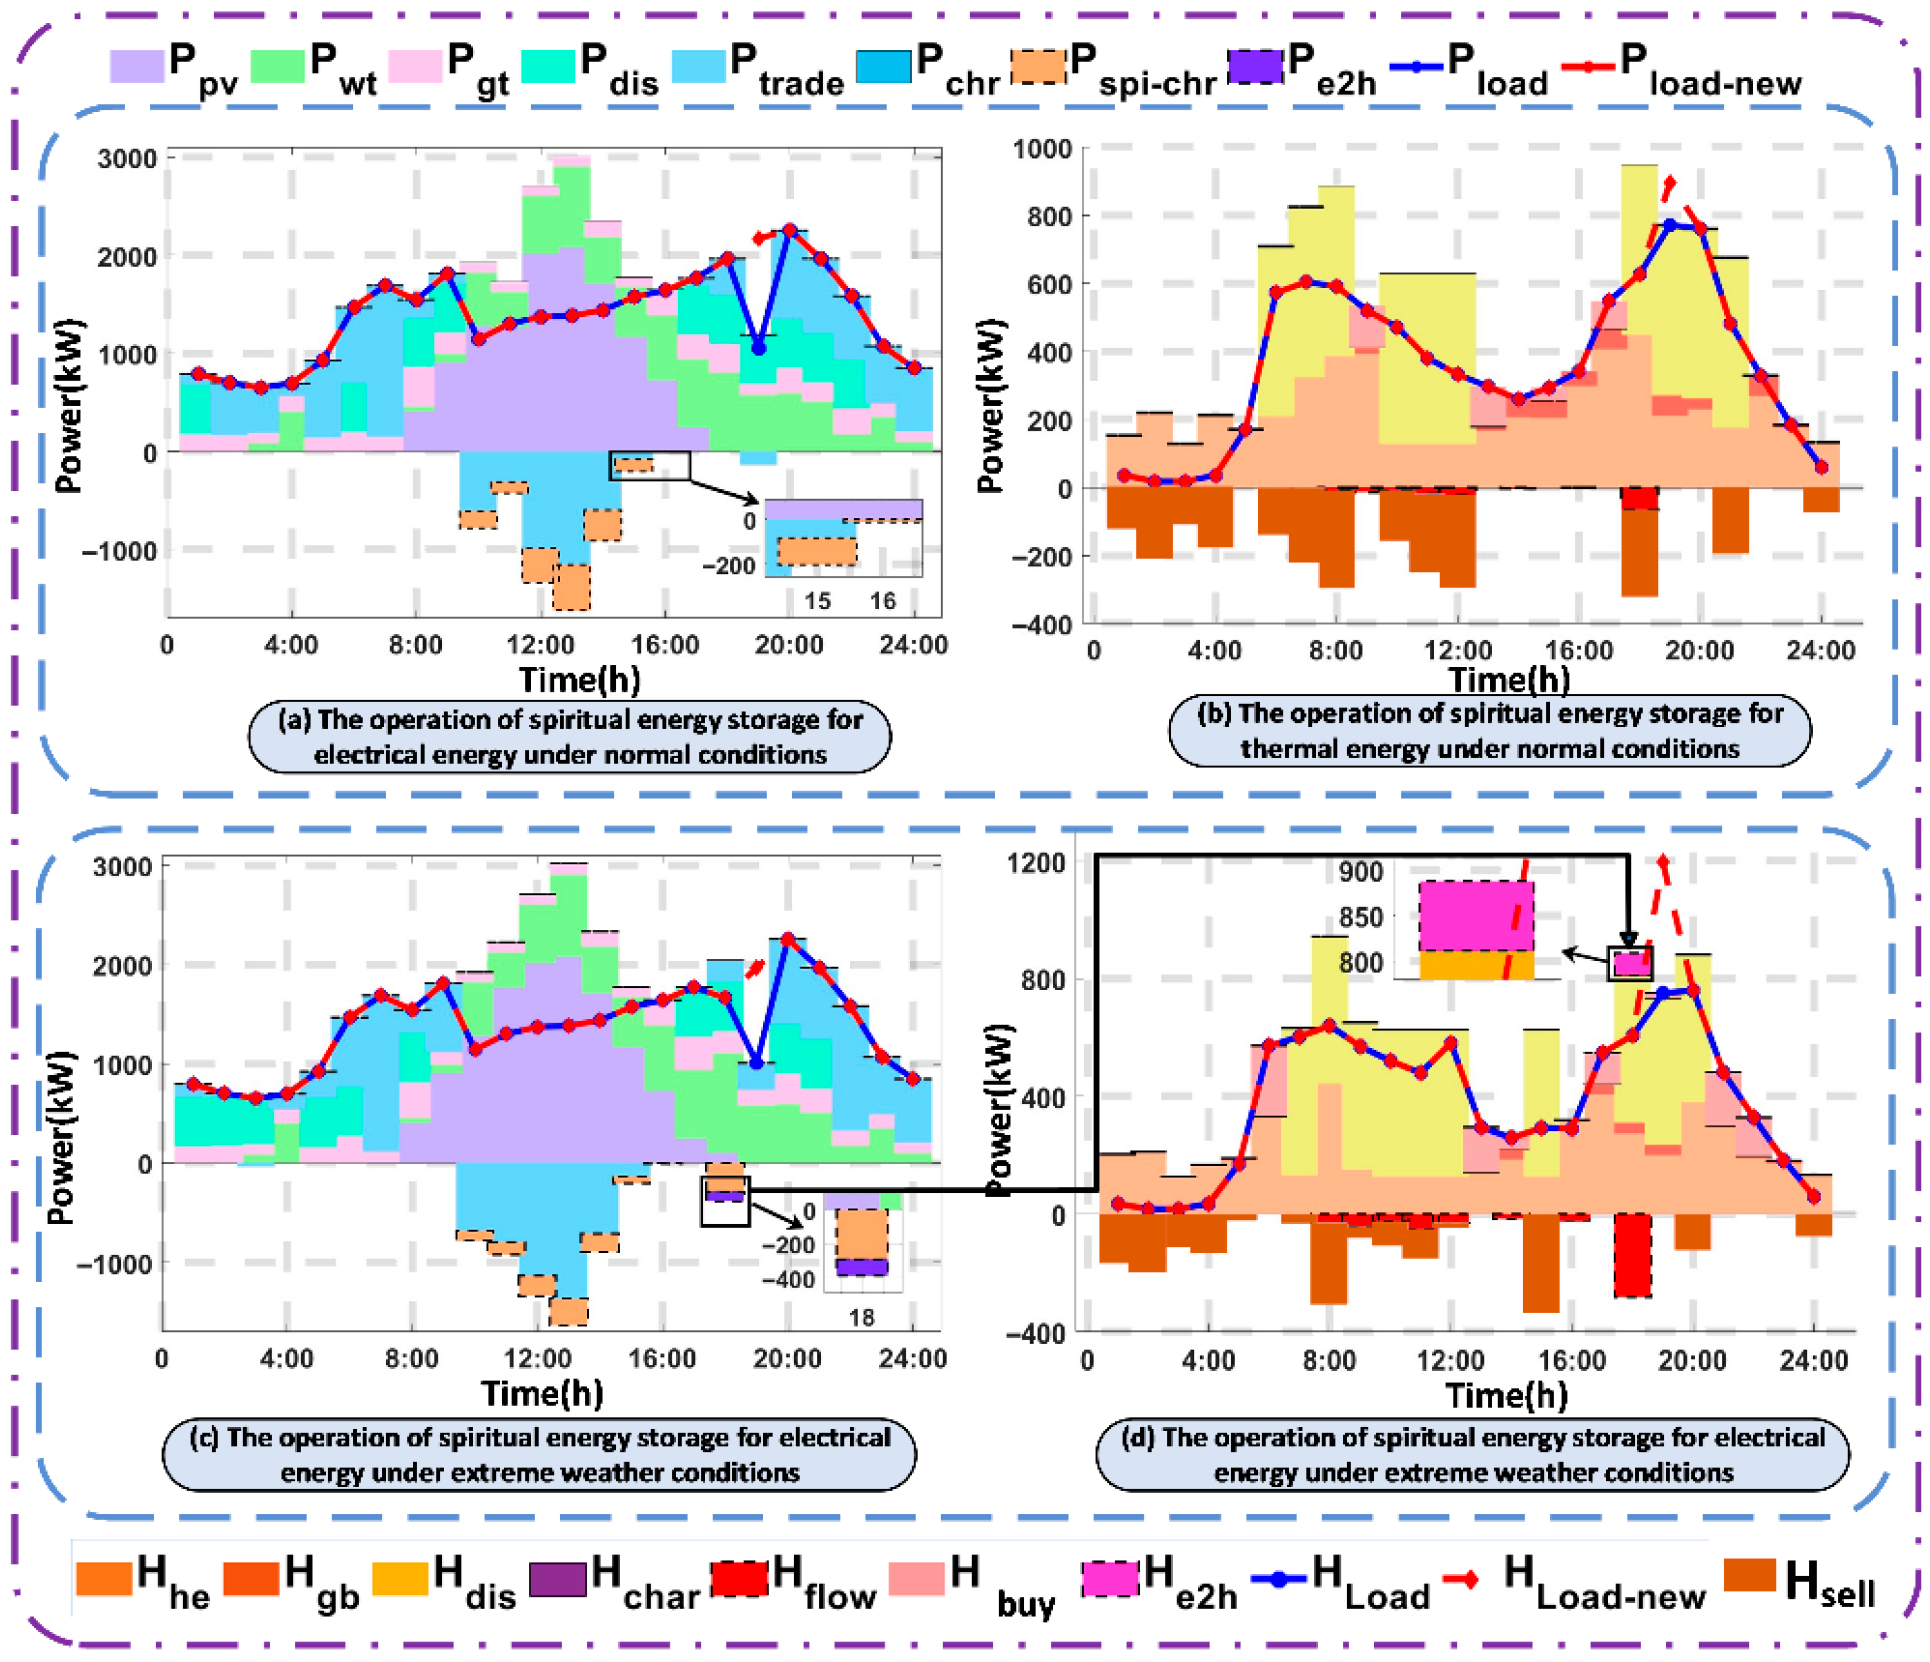
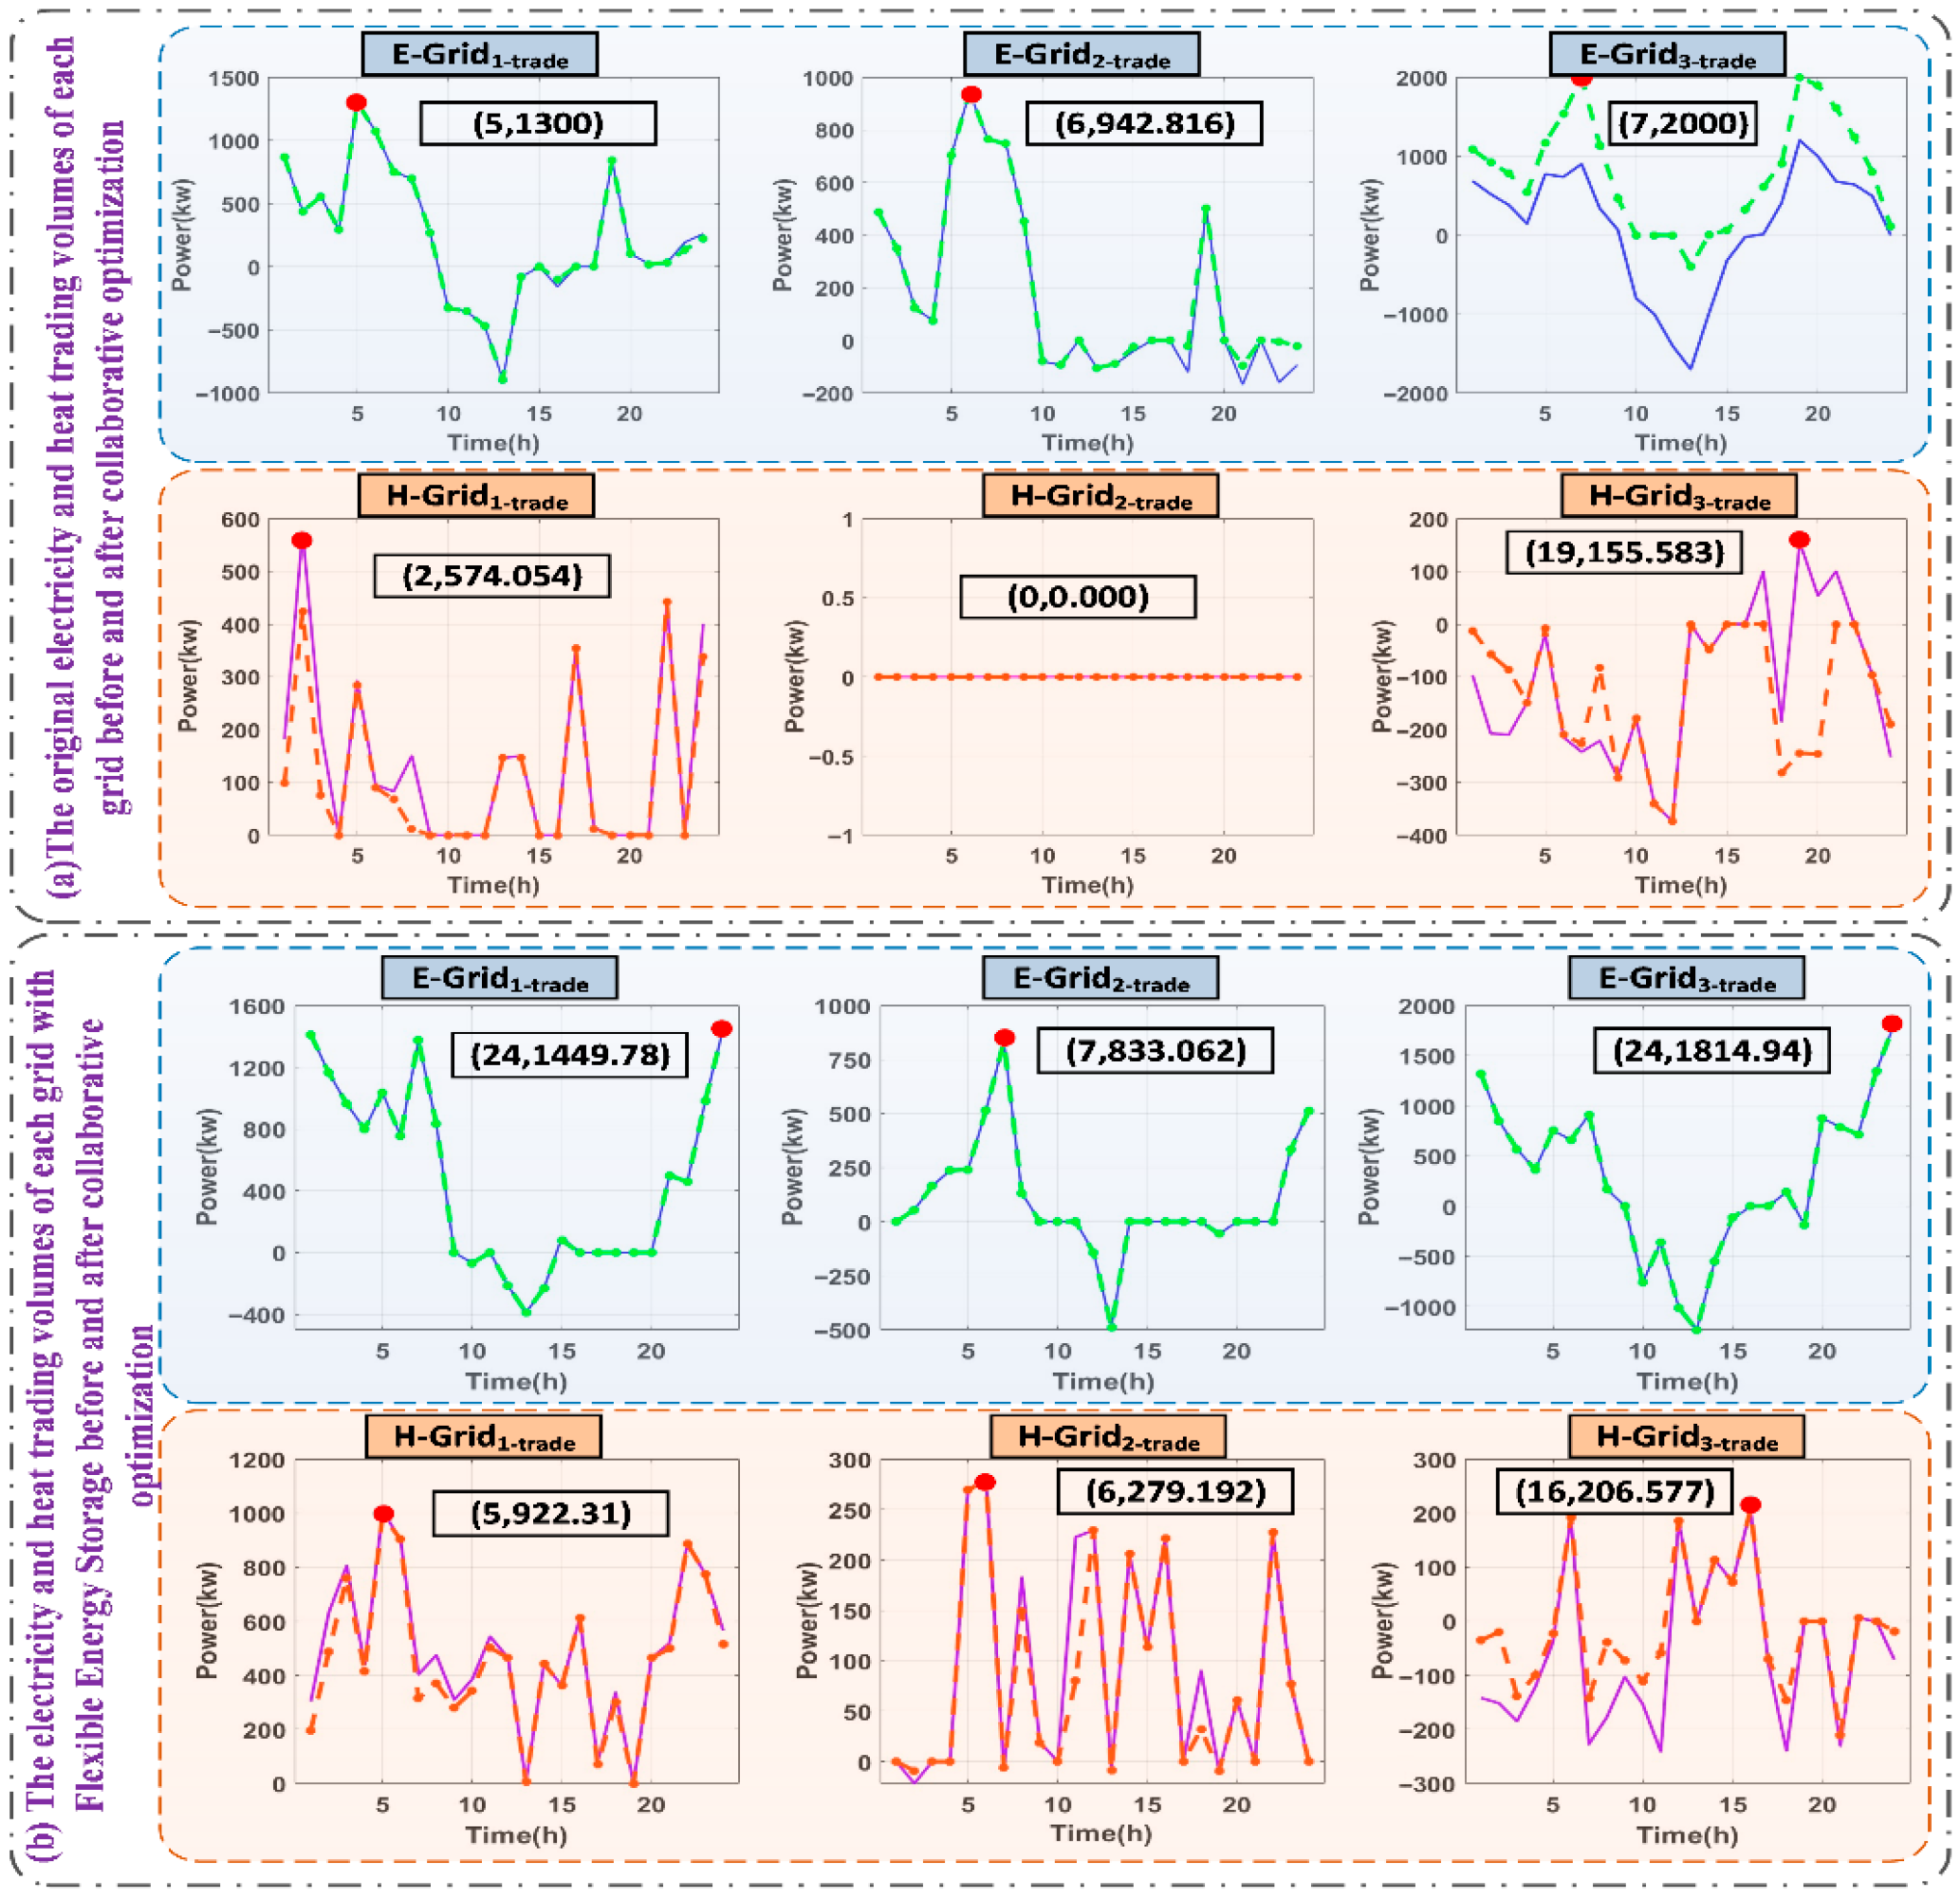
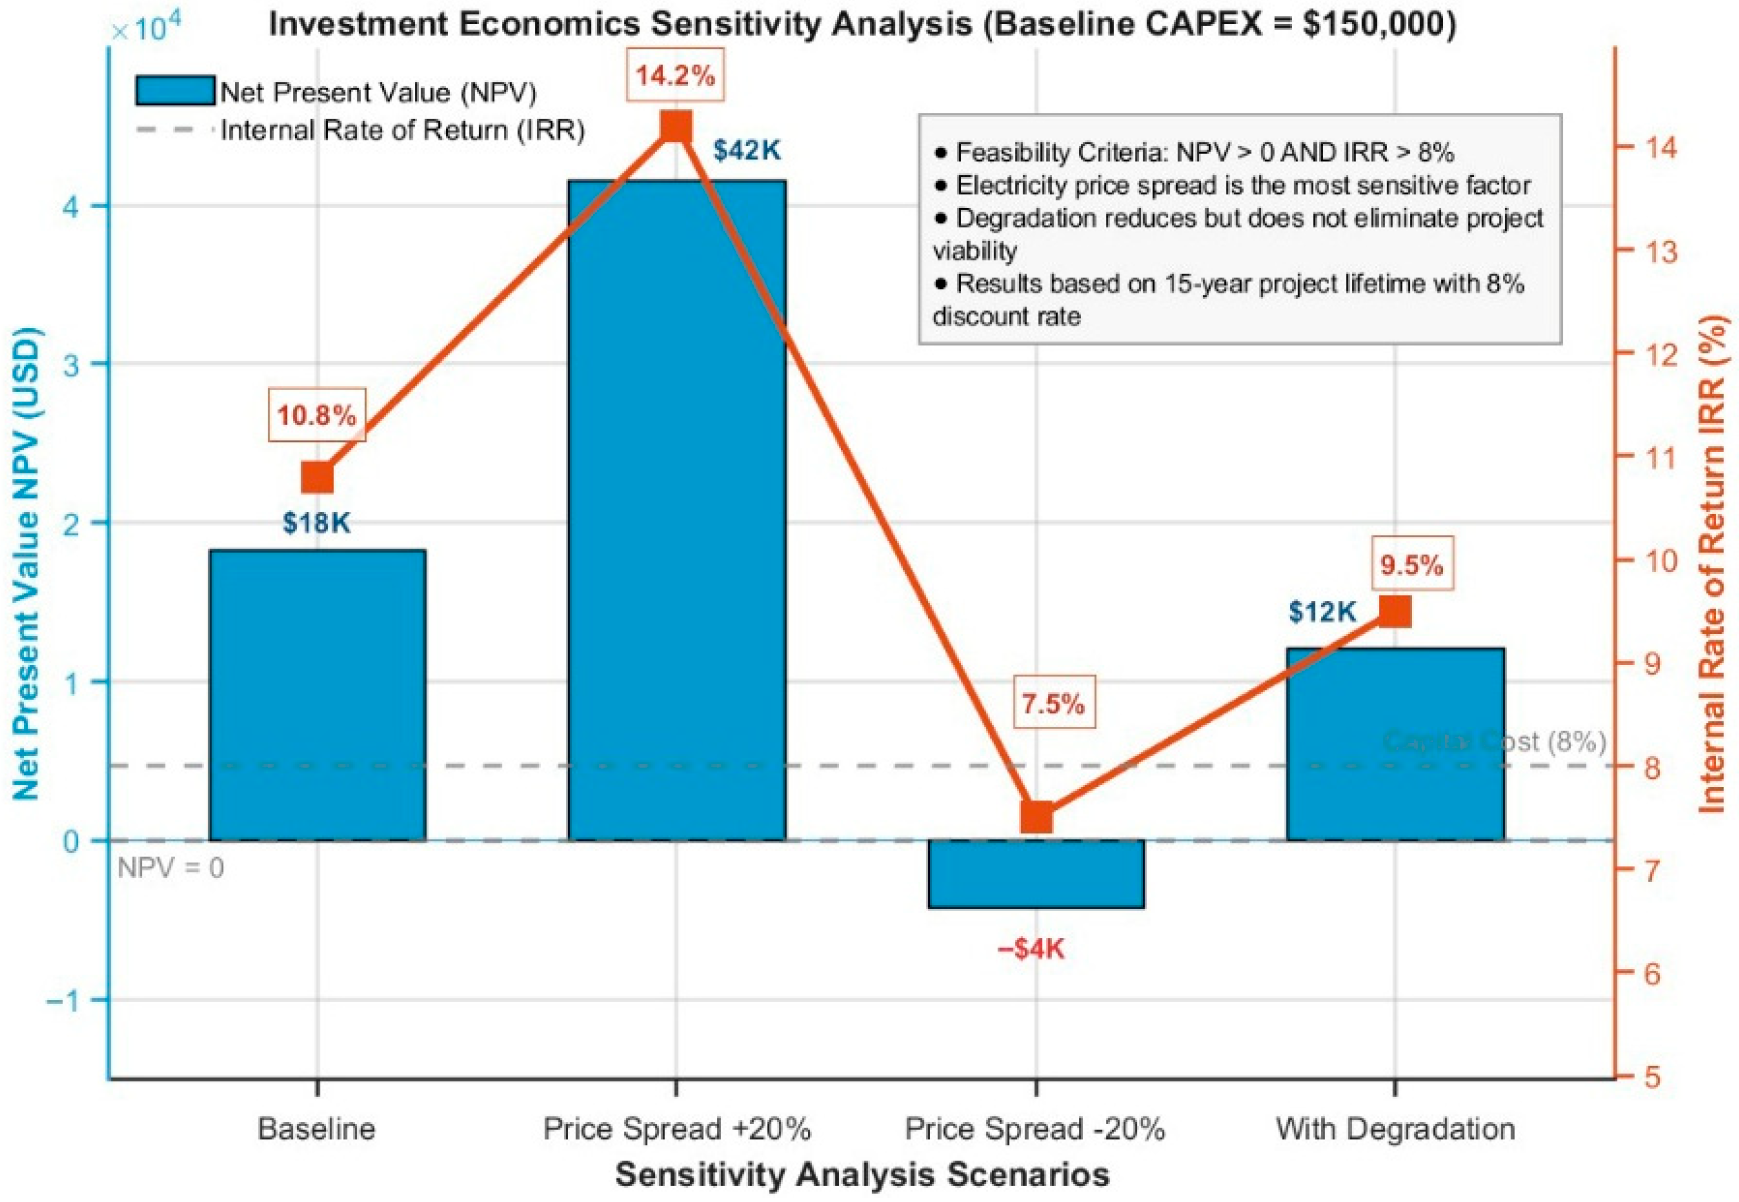
2.1. Equipment Models
- (1)
Renewable Energy
Photovoltaic power generation and wind power generation are the primary sources of clean energy in microgrids. The core characteristic is low carbon emissions, and mathematical models are represented by the following equations:
where
denotes the rated output power of the photovoltaic unit under standard test conditions;
represents the actual solar irradiance;
is the standard irradiance (1000 W/m
2);
denotes the ambient temperature;
refers to the standard temperature (25 °C);
is the temperature coefficient;
signifies the rated output power of the wind turbine under standard conditions;
indicates the instantaneous wind speed;
is the rated wind speed, typically 12 m/s;
and
represent the cut-in (2.5 m/s) and cut-out (18 m/s) wind speeds, respectively.
- (2)
Gas Boilers and Gas Turbines
Gas boilers generate thermal energy using natural gas as fuel within a microgrid. These exhibit high thermal efficiency, typically ranging between 85% and 95%, making them suitable for large-scale heating applications. Gas turbines, on the other hand, consume natural gas to convert chemical energy into thermal energy, demonstrating load-following characteristics. Additionally, these can function as power sources by converting chemical energy into mechanical energy to drive generators, thereby supplying electricity. These energy conversion processes are represented by the following equations:
where
is the natural gas consumption of the gas boiler;
is the thermal efficiency coefficient of the gas boiler (0.93%);
is the natural gas consumption of the gas turbine;
represents the loss coefficient of the gas turbine, typically 0.35%;
is the power generation efficiency coefficient of the gas turbine (0.9%); and
signifies the calorific value of natural gas, typically 9.7 kWh/m
3.
- (3)
Energy Storage Equipment
During off-peak periods in microgrids, energy storage devices operate in charging and heat storage modes. During peak periods, they switch to discharging and heat release modes. By adjusting electrical and thermal energy through charging and discharging, they balance load demands and enhance system stability, as expressed by the following equation:
where
is the charging status of the electrical storage device (0.98%);
is the discharge efficiency factor (0.98%);
is the charging power;
is the discharging power;
is the self-dissipation factor of the device (0.02%);
is the duration of a time step.
2.2. Operational Constraints
Microgrids establish constraints around power balance and equipment operational limitations. Power balance ensures that energy supply equals demand at all times, with the constraint formula as follows:
- (1)
Development of the supercapacitor capacity allocation model:
where
is the power purchased from the main grid by the microgrid;
is the power sold to the main grid by the microgrid;
is the thermal energy charging power;
is the thermal energy discharging power;
is the thermal power purchased by the microgrid;
is the thermal power sold by the microgrid.
The microgrid transaction constraint formula is as follows:
where
and
represent the lower and upper bounds for the microgrid’s electrical power exchange with the main grid, respectively;
and
denote the corresponding constraints on the minimum and maximum thermal power exchange;
and
are the net electrical and thermal power exchanged between microgrid
k and the common coupling point or other microgrids at time
t, as defined in the transaction balance;
and
represent the transmission capacity limits of the electrical line and heating pipe, respectively.
Equipment operating constraints form the core component of the microgrid model. These constraints define the operational conditions for devices within the system, ensuring the practical feasibility of scheduling. The operating constraint formulas for photovoltaic and wind power generation are as follows:
where
and
are the minimum and maximum power output of the wind turbine, respectively.
The operational constraint equations for gas boilers and gas turbines are as follows:
where
and
are the minimum and maximum electrical power output of the gas turbine, respectively;
and
are the minimum and maximum thermal power output of the gas boiler, respectively.
The operational constraints for energy storage equipment are as follows:
where
∈{0,1} are binary variables representing the operating status of the electrical storage device, with 0 indicating charging and 1 indicating discharging;
is the minimum charge and discharge power of the electrical storage device, respectively;
and
are the minimum and maximum discharging power of the electrical storage device, respectively;
and
are the minimum and maximum thermal power output of the thermal storage device, respectively.
2.3. Objective Function
Microgrids are composed of three distinct load zones: urban commercial district microgrids, industrial park microgrids, and residential area microgrids. The formula for the comprehensive cost of a microgrid is as follows:
where
and
are the electricity purchase price and electricity sale price, respectively;
is the maintenance coefficient of the device;
is the power of the device within the microgrid;
LGT and
LGT are the fuel characteristic variation values for the gas turbine and gas boiler, respectively;
is the unit cost of fuel;
is the trading price of the microgrid;
is the pollution cost; with values of 0.6370, 0.2583, and 0.1047, respectively,
~
are the weights obtained from the judgment matrix [
22];
is the economic cost of the microgrid under three different load types.
The comprehensive cost objective function defined in Equation (9) incorporates economic, operational, and environmental factors. The weights (
,
,
) and pollution cost factors are not arbitrary but are derived from established methodologies to ensure the model’s objectivity and relevance. The determination of the weights
,
, and
for the economic costs of the three different load zones (urban commercial district, industrial park, and residential area) was based on the judgment matrix provided in [
22] using the Analytic Hierarchy Process (AHP). The AHP structured the problem by defining the objective, prioritizing load zones for cost minimization, and the three alternatives, which are the load zones themselves. A panel of microgrid planning and operation experts provided pairwise comparisons, judging the relative importance of each zone against criteria such as peak demand intensity, the economic impact of power outages, and regional energy policy focus. The resulting judgment matrix was processed to obtain the final weights
,
, and
. The consistency ratio (CR) of the matrix was calculated to be 0.04, which is below the threshold of 0.1, confirming the logical consistency of the judgments and the reliability of the derived weights. Furthermore, the specific values used in this study are consistent with the emission cost parameters established in the foundational work of [
22], ensuring alignment with the referenced bi-level scheduling model.
2.4. A Dynamic Pressure-Aware and Spatiotemporal Collaborative Optimization Scheduling Strategy Driven by Flexible Energy Storage
To address the challenge of achieving dynamic balance between supply and demand in microgrid systems, these systems feature coupled electrical, thermal, and cooling energy flows. This paper proposes a dynamic pressure-aware spatiotemporal collaborative optimization scheduling strategy. The strategy is driven by “flexible energy storage.” This strategy aims to transcend the limitations of traditional energy storage. Traditional storage primarily shifts energy across time and space. Our strategy establishes a closed-loop intelligent decision-making framework, which follows the sequence: “state perception → dynamic assessment → flexible energy storage → smart conversion → load optimization.”
The core innovation lies in two interconnected concepts. First, “Dynamic Pressure Awareness” provides the system with a capability analogous to a “nervous system”. This capability enables the system not only to sense the current state of multi-energy flows but also to quantitatively assess and anticipate future moments of severe supply-demand conflict. This function shifts the system’s operational paradigm. It moves from passively responding to immediate imbalances to proactively identifying and preparing for critical stresses. Second, “Flexible Energy Storage” redefines the role of storage in integrated energy systems. It goes beyond merely shifting electricity in time. The strategy incorporates two key dimensions of flexibility: it decides “what form of energy to store or use” (electricity, heat, or cooling) and “how to optimally allocate it across space and time.” Together, these capabilities allow the system to strategically pre-store and pre-allocate decentralized energy surpluses along optimal spatiotemporal paths, thereby enhancing overall resilience, economy, and operational reliability.
In this study, we establish the theoretical foundation and ideal performance benchmark for this strategy under a key methodological assumption. We assume perfect knowledge of the load and renewable generation profiles throughout the entire optimization period. This assumption allows us to utilize existing data to validate the strategy’s rationality. This approach enables us to isolate and validate the core decision-making logic of the strategy. It also eliminates the confounding effects of forecasting uncertainty.
Under the perfect information assumption, the proposed strategy begins with the construction of a comprehensive system state perception layer. The strategy utilizes a high-precision real-time monitoring network. This network continuously collects data on the supply and load of electrical, thermal, and cooling energy. Building on this foundation, the energy state at each moment
t is quantified with precision:
where
is the surplus power of energy source;
denotes the deficit power of energy source;
indicates the energy input within the microgrid;
signifies the energy output from the microgrid; the variables
e,
h, and
c represent electrical energy, thermal energy, and cooling energy, respectively.
This quantification process not only records data but, more importantly, establishes a comprehensive ‘energy situational map’ for the system. This map provides a solid foundation for the intelligent decision-making processes of intelligent energy storage.
After obtaining panoramic state data, the strategy advances to the dynamic pressure assessment phase. Traditional methods often view energy deficits in isolation. They neglect the coupling relationships and substitution potentials among different energy sources. This strategy innovatively proposes a comprehensive pressure index
for the system. This index considers the overall system perspective. It also integrates the potential for electrical energy surpluses to address deficits in thermal and cooling energy through conversion devices such as heat pumps and electric chillers.
where
is the efficiency coefficient for the conversion of energy source
j into energy source
i, while
t* denotes the critical pressure moment when the supply-demand conflict for energy is most pronounced.
Once determined, the core of the strategy—intelligent energy storage-driven spatiotemporal coordinated scheduling—commences comprehensively. This phase embodies the essence of ‘flexible’. The system does not merely store the current surplus energy for future use. Rather, it intelligently decides at each preceding ‘present’ moment what type of energy should be stored, how much should be stored, and how to optimize the storage path. It makes these decisions based on foreseeing the crisis at time t*.
The conversion efficiency coefficient
in Equation (11) and
in Equation (14) are critical parameters that quantify the energy loss during the conversion from energy type
j to type
i. These coefficients are primarily determined by the physical characteristics of the conversion devices (e.g., heat pumps, electric chillers) and are treated as constants for a given device under normal operating conditions in this study. Their values are summarized in
Table 2.
To achieve this, the strategy constructs a spatiotemporal coordinated scheduling weight
(As shown in Equation (12)) for each energy source
i. The calculation of this index incorporates two key elements: first, the temporal proximity, which indicates that moments
τ closer to
t* have reduced energy delivery losses and time decay, thus holding greater scheduling value and priority; second, the resource availability, representing the proportion of the available surplus of a particular energy source at a given moment compared to the total available surplus. By integrating these two factors and normalizing them, the strategy generates a scientific scheduling weight for each energy type at every historical moment, ensuring that the limited energy reserves are allocated to the most needed and effective spatiotemporal nodes.
where
is the available resource amount of energy source
i at moment
τ, and
ts denotes the start time for scheduling.
Equation (12) ensures the economic efficiency of the energy storage actions, achieving a unification of ‘flexibility’ and ‘rationality.’
Following this, based on the calculated weights and accounting for the cost losses during the energy storage process, the specific energy allocations to be pre-stored or deployed for the critical moment
t* are determined for each historical moment.
where
is the target adjustment amount of energy source
i at moment
τ, and
ωi denotes the storage cost coefficient for energy source
i.
Subsequently, the strategy enters the intelligent conversion phase of multiple energy flows. Given that electrical energy possesses a high quality and flexible conversion capabilities, after the initial allocation is completed, the strategy examines whether the allocations for thermal and cooling energy exceed their respective available surpluses. If deficits are identified, the system will activate an intelligent energy routing mechanism, prioritizing the use of electrical energy surpluses for supplementation. This follows a clear hierarchy: thermal energy deficits are addressed first, followed by cooling energy deficits. The conversion process is not conducted without limitation; rather, it is constrained by both the real-time status of electrical energy surpluses and the efficiency of conversion devices. The system accurately computes the electrical energy required for achieving the energy conversion while ensuring that the fundamental allocation tasks for electrical energy are not compromised. This process significantly enhances the collaborative synergy between different forms of energy.
where
denotes the efficiency of converting energy from source
i to source
j.
After thoroughly leveraging internal resources and making internal adjustments through energy conversion, the strategy accurately calculates the final energy gap that remains, which is compensated by external systems or backup resources following all optimization measures:
where
represents the energy gap for energy source
i.
Finally, based on the anticipated effects of the series of optimized scheduling measures, the strategy performs intelligent adjustments to the original load curve at the critical moment t*. By reducing the demands for electrical, thermal, and cooling loads at this moment, the system ensures safe and stable operation while significantly decreasing reliance on costly backup resources.
In summary, this strategy integrates several key processes. These include real-time monitoring, situational forecasting, intelligent energy storage, multi-energy conversion, and load regulation. It integrates them into a coherent and systematic decision-making process. The strategy achieves proactive optimization of multi-energy flows in the microgrid across the time dimension. It also enables flexible inter-support among different energy types. This provides robust technical support for establishing an efficient, reliable, and green microgrid system. The parameters are listed in
Table 2.
The conversion process is not conducted without limitation; rather, it is constrained by both the real-time status of electrical energy surpluses and the efficiency of conversion devices. The key parameters for the primary energy conversion and storage components considered in this study, including their typical performance ranges and characteristics, are summarized in
Table 2. For the modeling in this work, specific nominal values within these typical ranges are used as constants under the perfect foresight assumption. The framework of the proposed strategy is illustrated in
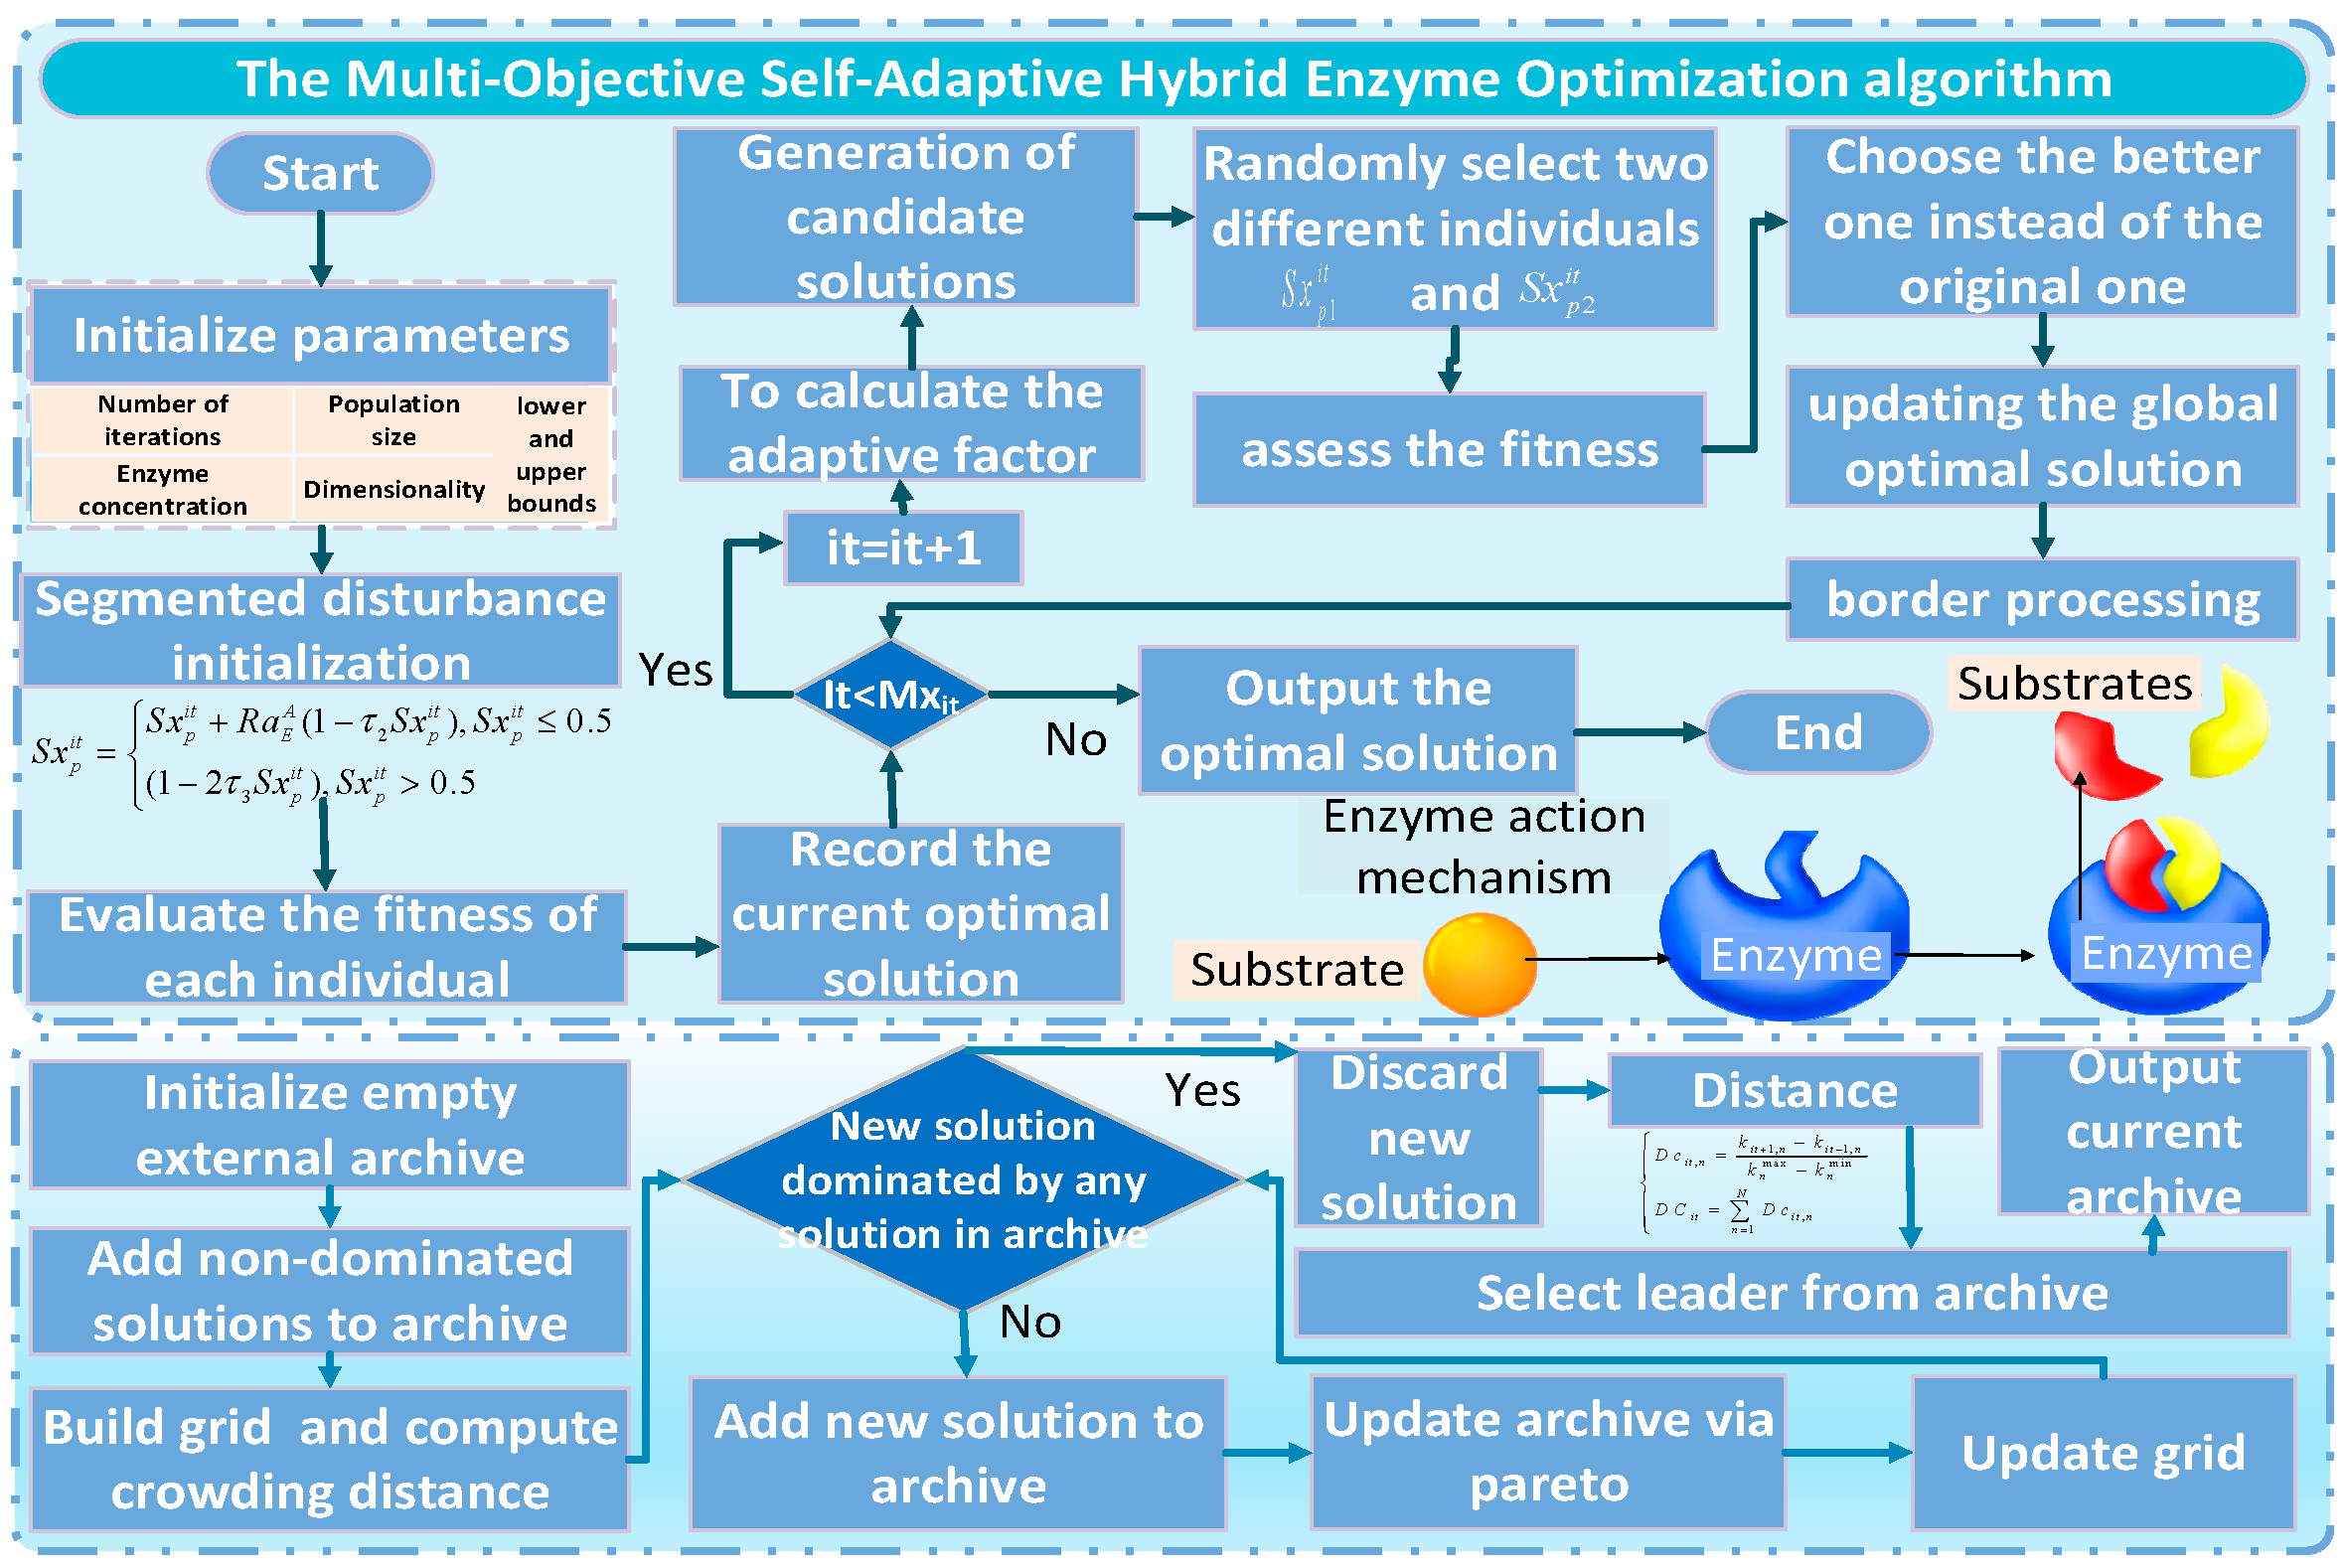
Figure 2.
