Article

Polyformaldehyde Fiber Shotcrete Bending Fracture Test and Finite Element Simulation Research

1
Faculty of Land Resources Engineering, Kunming University of Science and Technology, Kunming 650093, China
2
Yunnan Mineral Resources Development and Utilization of Solid Waste Resources International Technology Transfer Center, Kunming 650093, China
3
Yunnan Phosphorus Resource Technology Innovation Center, Kunming 650600, China
4
Yunnan Phosphate Chemical Group Co., Ltd., Kunming 650600, China
5
China Nonferrous Metals Industry Kunming Survey, Design and Research Co., Ltd., Kunming 650600, China
6
Chongqing Yuntianhua Tianju New Material Co., Ltd., Chongqing 401221, China
*
Author to whom correspondence should be addressed.
Eng 2025, 6(11), 322; https://doi.org/10.3390/eng6110322
Submission received: 28 September 2025 / Revised: 31 October 2025 / Accepted: 4 November 2025 / Published: 11 November 2025

Abstract

As a support material for mine roadways, shotcrete (SC) exhibits performance limitations in extreme deep-mining environments characterized by high stress and water seepage. Polyoxymethylene (POM) fiber, with its properties of high strength, high modulus, and corrosion resistance, holds potential for application in surrounding rock support of deep roadways. To investigate the effect of POM fiber on the flexural performance of shotcrete, four-point bending tests were conducted on fiber-reinforced concrete specimens with different fiber lengths and dosages. Combined with ABAQUS numerical simulation, damage simulation analysis was performed on each group of specimens, and the stress propagation state of the fibers was tracked. The results show that the flexural strength of polyoxymethylene fiber shotcrete (PFS) increases with the increase in fiber length and dosage, and the influence of fiber dosage is more significant. POM fiber can effectively inhibit the crack development of shotcrete, enhancing its crack resistance and residual strength. The load-deflection curves indicate that PFS exhibits excellent fracture toughness, with the P9L42 group showing the highest flexural strength improvement, reaching an increase of 94%. The numerical simulation results are in good agreement with the experimental conditions, accurately reflecting the damage state and load-deflection response of each group of concrete specimens. Based on the above research, POM fiber is more conducive to meeting the stability requirements of roadway surrounding rock support, providing a scientific basis for the application of PFS in mine roadway surrounding rock support.

1. Introduction

Shotcrete support, a technology that uses high-pressure spraying equipment to rapidly spray concrete mixtures onto the working surface, is widely applied in the support of highways, tunnels, and mine roadways. However, with the deepening of mine mining, roadways are often plagued by problems such as large deformation, roof collapse, rock burst, and blasting impact, leading to frequent spalling failure of shotcrete [1,2,3]. Especially under high stress or mining disturbance, the loose zone or plastic zone of the surrounding rock continues to develop, making it difficult to control the stability of the roadway surrounding rock. This seriously endangers the safety of roadway excavation and operation, thus imposing higher requirements on the mechanical properties of shotcrete for roadway support [4].
At present, many scholars have conducted research on the mechanical properties of fiber-reinforced concrete. Jingjun Li et al. [5,6] found that when the steel fiber content is 2.0 vol%, the flexural performance improvement effect on lightweight aggregate concrete and coarse aggregate ultra-high performance concrete is optimal; its fracture energy is proportional to the dosage and better than the reinforcement effect of 1.1 vol% high-performance polypropylene fiber. Jiu-chang Zhang et al. [7] studied the crack resistance of concrete materials through tensile strength and fracture toughness tests, and the results showed that increasing the steel fiber length and volume fraction can effectively improve the tensile strength and fracture toughness of concrete. Jong-Han Lee et al. [8] investigated the effects of concrete strength and steel fiber dosage on the flexural capacity of concrete, and the results indicated that the equivalent flexural strength ratio determined by the first peak strength and energy absorption capacity increases with the increase in fiber volume fraction but decreases with the increase in concrete strength. Jin Liu et al. [9] carried out splitting tensile strength tests and three-point bending tests at three temperature points, and the results showed that the fracture energy of concrete is inversely proportional to temperature, and the steel fiber volume ratio is proportional to the fracture energy. Huang Jiechao et al. [10,11,12] studied the effects of different lengths of chopped basalt fibers, different dosages of carbon nanotube-carbon fibers, and five different types of fibers on the mechanical properties of concrete. They concluded that the concrete specimens mixed with 6 mm fibers have the highest flexural strength; the carbon nanotube-carbon fiber composite with a dosage of 0.3% increases the compressive strength and flexural strength by 8.79% and 27.76%, respectively, compared with plain concrete; and micro-wire copper-plated steel fibers have the greatest improvement effect on the compressive toughness of concrete and can effectively inhibit the cracking and spalling of concrete. Yue Jianguang et al. [13] conducted splitting tensile strength tests and three-point bending tests to study the effects of fiber content, printing method, and other factors on the fracture mechanical properties of printed carbon fiber concrete. The results showed that when the fiber content increases, the integrity of the material affects the fiber bridging effect, showing a positive correlation. Zheng Shansuo et al. [14] studied the effects of cellulose fiber and rice husk ash dosages on the mechanical properties of concrete, and concluded that the initial flexural cracking strength and ultimate flexural strength of concrete are positively correlated with the cellulose fiber dosage and rice husk ash dosage. Chen Yuliang et al. [15] studied the mechanical behavior of steel fiber recycled concrete under cyclic loading, and found that the addition of steel fibers improves the peak strain and residual strength of recycled concrete. Zou Qiqi et al. [16] studied the effect of coarse fiber volume dosage on the mechanical properties of C40 and C50 concrete, and the results showed that the addition of coarse fibers can significantly improve the splitting tensile strength of concrete; when the volume dosage is 1.5 vol%, the splitting tensile strength of the C40 group concrete increases by 40%. Cheng-Yong Liu et al. [17] studied the effects of different types and dosages of fibers on the mechanical properties of concrete, and found that the flexural strength increases with the increase in dosage. Wang Chunsheng et al. [18] studied the influence law of copolymerized formaldehyde fibers on the flexural performance of ultra-high performance cement matrix, and confirmed that the fibers can effectively inhibit the crack initiation process of the matrix at an appropriate dosage and significantly improve the load-bearing capacity of the material before crack propagation. Qin Nan et al. [19] studied the safety of POM fiber high-strength concrete under impact loading, and concluded that the addition of POM fibers can improve the toughness of concrete specimens. Huang Daguan et al. [20] studied the mechanical properties of basalt-polypropylene fiber reinforced concrete, and found that the basalt fiber dosage is positively correlated with the splitting tensile strength, and the improvement effect on the splitting tensile strength is greater than that of polypropylene fiber. Zhang et al. [7] studied the tensile strength and flexural ductility of POM fiber-reinforced concrete through experiments, and confirmed that the increase in fiber length and dosage parameters can significantly optimize the tensile performance and fracture toughness of the composite material. Wang Zhenhui et al. [21] studied the effects of POM fiber length and dosage on the mechanical properties of airport pavement concrete, and the results showed that POM fibers can effectively inhibit the expansion of internal cracks and skin peeling; when the fiber length and dosage increase, the ductile failure characteristics of concrete become more obvious. Zhiqiang Zhang et al. [22] conducted experimental and numerical studies on the flexural behavior and fracture performance of steel fiber-reinforced shotcrete (SFRS), and concluded that random functions can be used to simulate the random distribution of steel fibers, and the proposed 3D discrete element model and meso-parameters of bonded particles obtained from parameter calibration can provide results for studying the flexural behavior and failure characteristics of SFRS. Nawal Kishor Banjara et al. [23] conducted monotonic loading and fatigue loading tests on plain concrete (sprayed concrete, SC) and fiber concrete with steel fiber volume ratios of 0.5%, 1%, and 2%, and evaluated the stress intensity factor and fatigue failure cycle number of SC and fiber concrete specimens. The results showed that the fatigue life estimated by the numerical model is in good agreement with the experimental results. Zhiyun Deng et al. [24] studied the tensile and compressive mechanical properties of multi-scale polypropylene fiber concrete and constructed a two-dimensional finite element model. Considering the model accuracy of factors such as fiber distribution, the maximum relative error of compressive strength (tensile strength) is 2.35% (13.19%), which is in good agreement with the experimental results. Based on previous studies, Chira and Kumar used the concrete elastoplastic damage model to simulate the damage behavior of concrete with different fiber contents, and found that the experimental results are in good agreement with the numerical simulation results [25]. Liang and Wu constructed a 3D finite element model of steel fiber concrete, in which fibers form a dense network structure through random distribution, and concrete is regarded as an equivalent isotropic medium. The embedded contact between fibers and concrete is simulated, which reasonably explains the secondary hardening phenomenon of steel fiber concrete under ultimate bearing capacity [26].
To sum up, at present, the mechanical properties of different fiber concretes are mostly analyzed through experimental methods such as compression, tension, and three-point bending tests, while comprehensive studies combining physical experiments and numerical simulations are relatively scarce. Polyoxymethylene (POM) fiber is a high-performance synthetic fiber with high strength and high ultimate elongation [27,28], and its application in mine roadway support is relatively limited. In this study, a combination of physical experiments and numerical simulations was adopted. Taking SC specimens as the control group, four-point bending tests were conducted on POM fiber concrete with different lengths and dosages to study its flexural performance. Based on the experimental results, a concrete plastic damage model (CDP) was established to verify the accuracy of the experimental data. The research shows that the optimal length and dosage ratio of POM fibers and other parameters were obtained, and the flexural strength of polyoxymethylene fiber shotcrete (PFS) was significantly improved. It indicates that POM fibers can effectively enhance the performance of concrete, better meet the stability requirements of roadway surrounding rock support, and thus provide a scientific basis for the application of fiber shotcrete in mine roadway surrounding rock support.

2. Experiments

2.1. Materials

In the experiment, 42.5# ordinary Portland cement was used, with a density of 3100 g/cm3. Coarse aggregates were graded gravel with a particle size of 5–20 mm, fine aggregates were sand with a particle size of 0.15–4.75 mm, and an alkaline accelerator was used. The fiber type used in the experiment was POM fiber, and its mechanical parameters are shown in Table 1.

2.2. Mix Proportion

According to the standard GB/T 50081-2019 [29] and relevant engineering examples, C20 grade concrete was used, with a water-cement ratio of 0.6 and a sand ratio of 30%. The water consumption in the concrete mix proportion was 185 kg/m3, the cement dosage was 300 kg/m3, the aggregate dosage was 1260 kg/m3, and the accelerator dosage was 15 kg/m3. The appearance of the selected polyoxymethylene fibers is shown in Figure 1. The fiber length (30 mm, 36 mm, 42 mm) and dosage (5 kg/m3, 7 kg/m3, 9 kg/m3) were the main experimental variables. The PFS test mix proportions are shown in Table 2. The specimens were grouped and numbered according to the fiber length and dosage. For example, P5L30 indicates that the POM fiber dosage is 5 kg/m3 and the fiber length (L) is 30 mm.

2.3. Experimental Process and Method

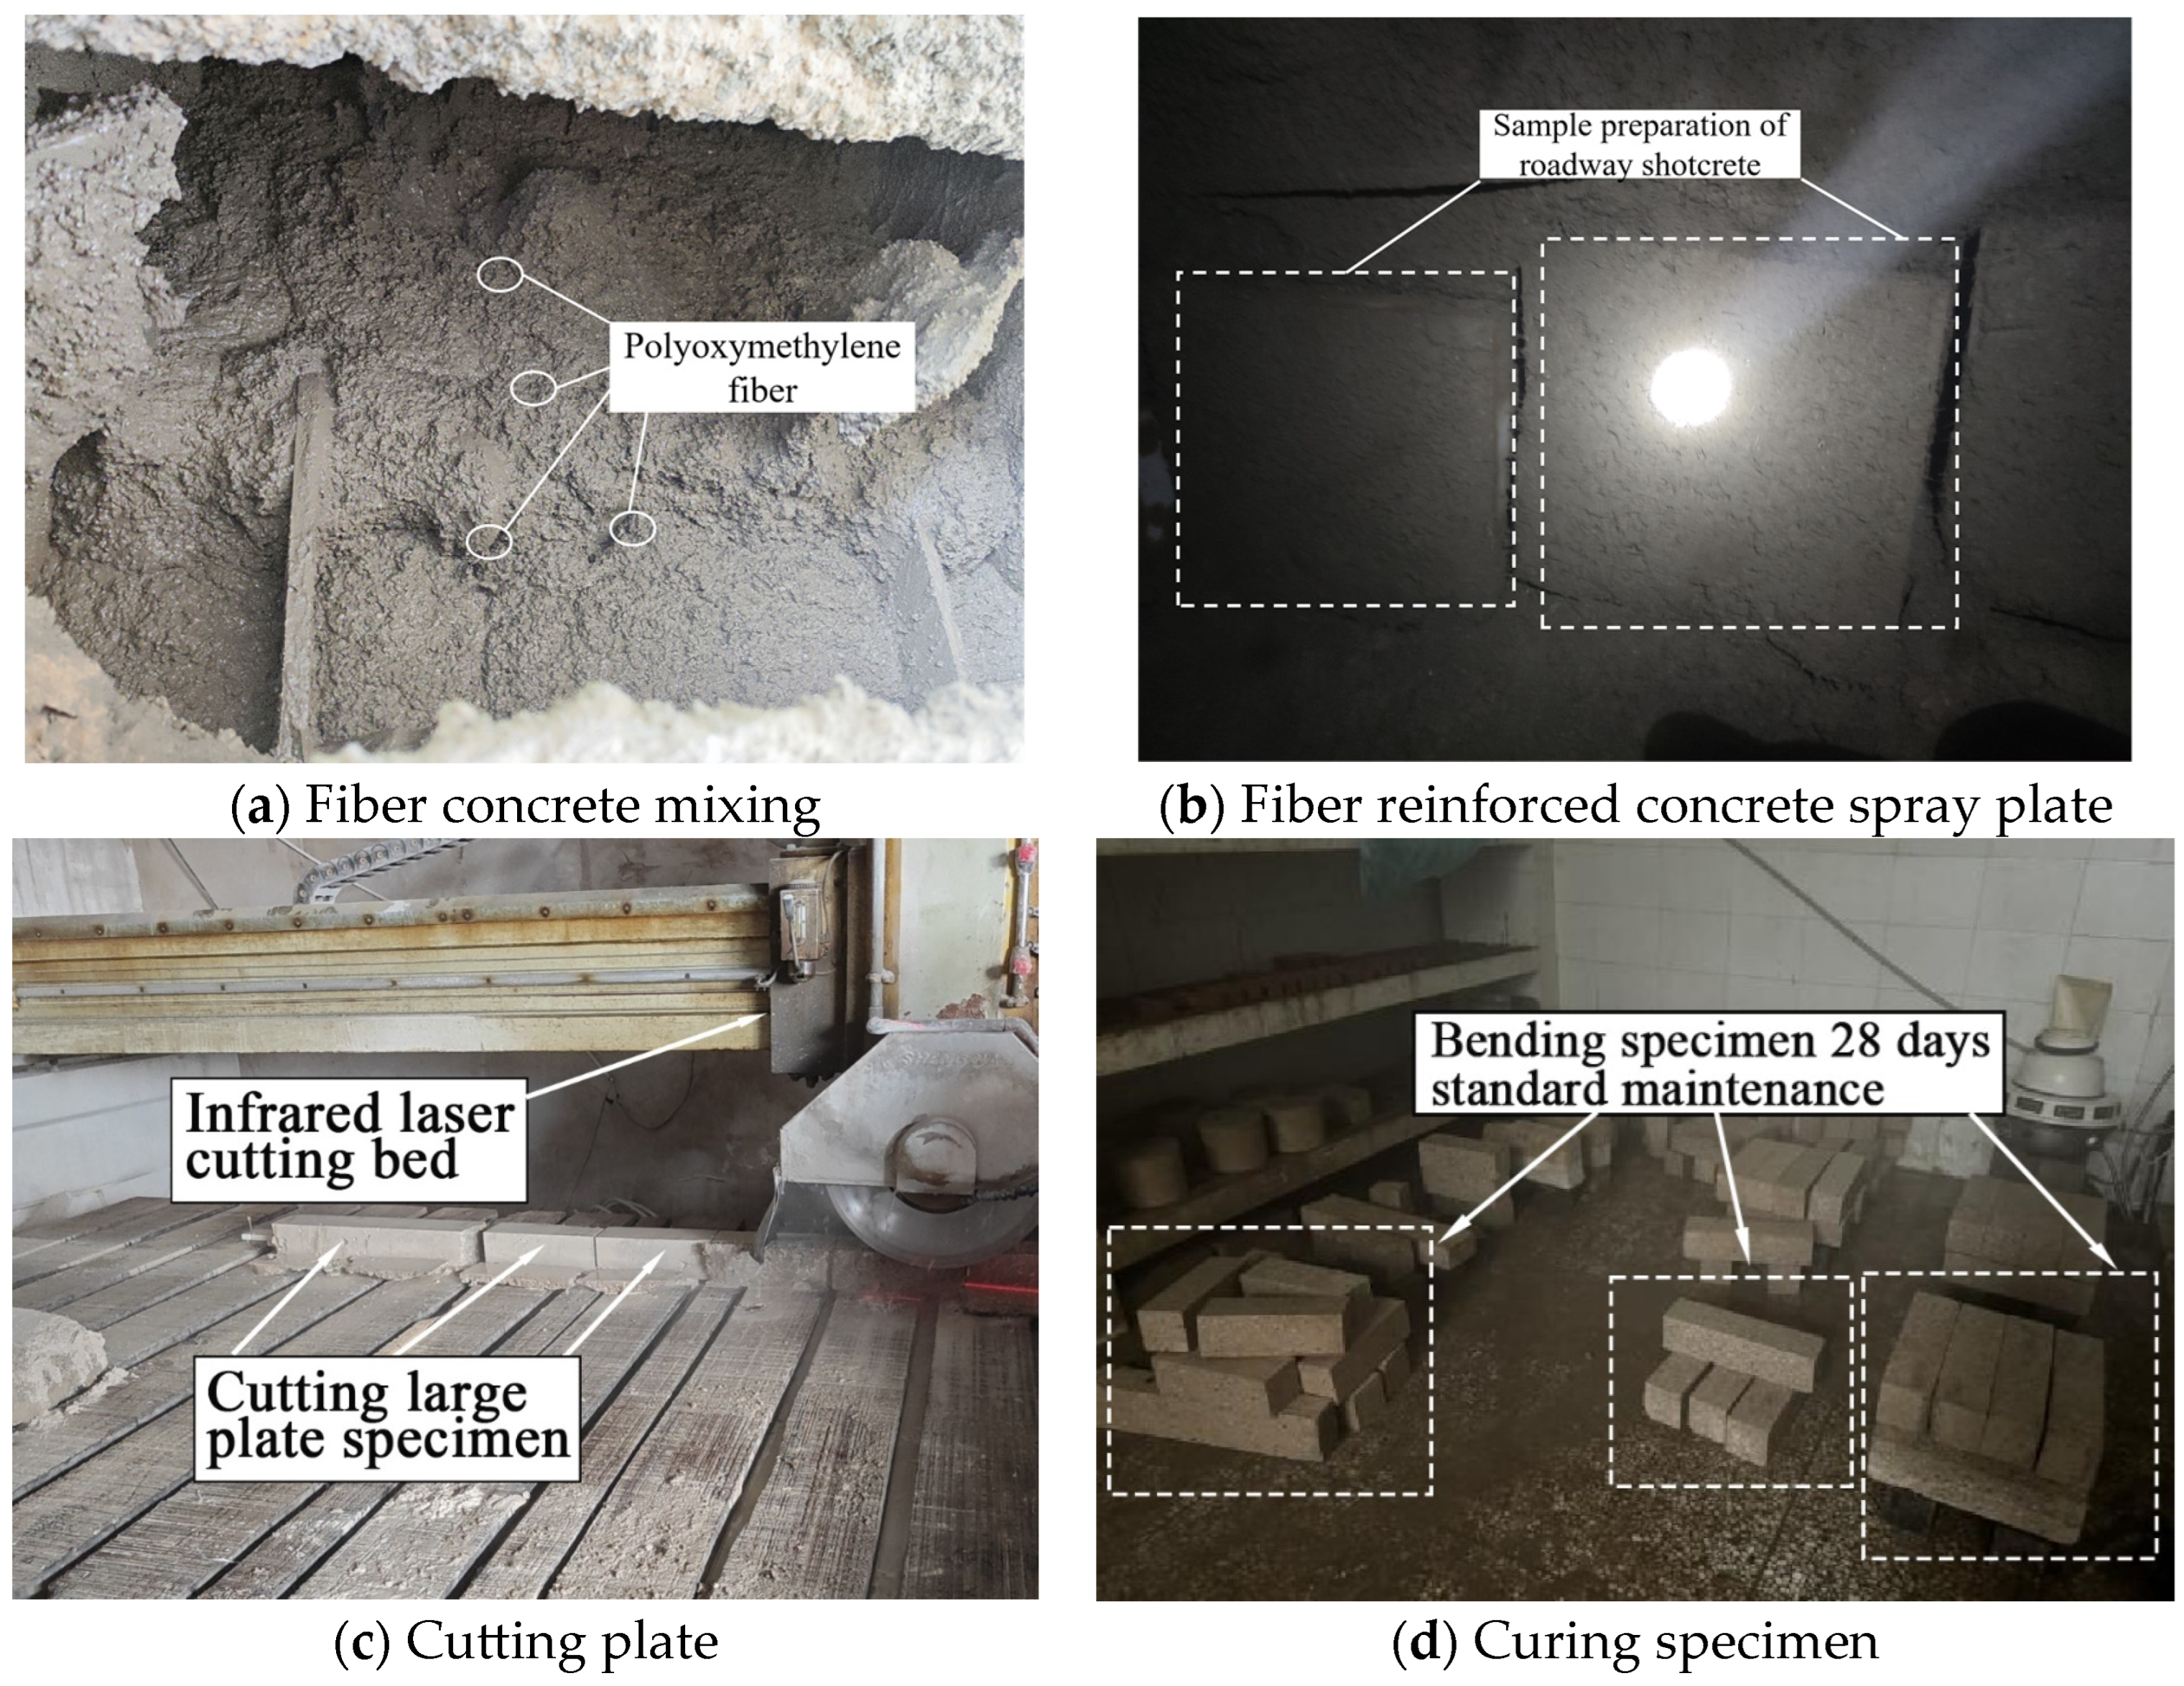
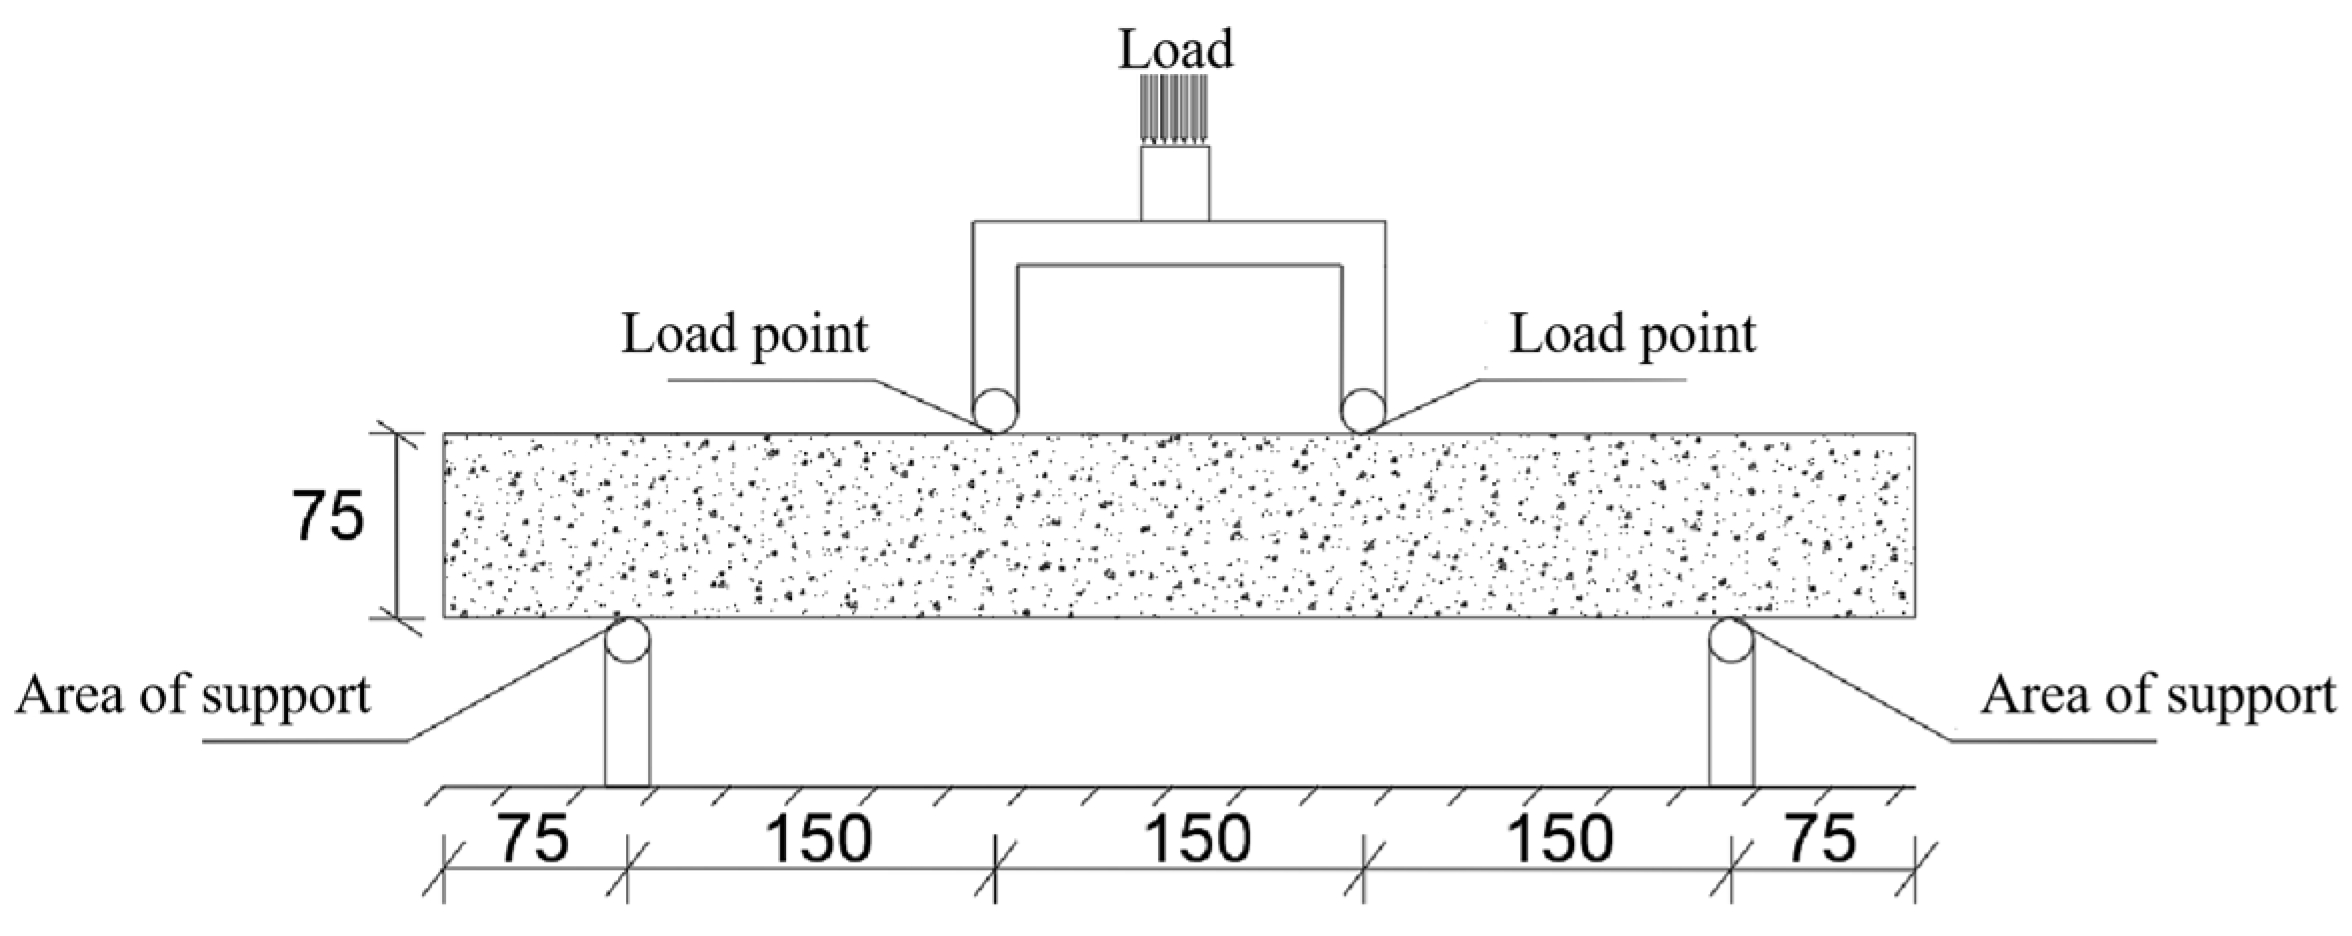
According to the standard JGJ/T 372-2016 [30], in the roadway specimen preparation, the wet spraying process was used for shotcrete. The shotcrete mold (600 mm × 600 mm × 100 mm) was placed at an angle of approximately 80° on the roadway side of the spraying working surface, and the spray gun sprayed the mold layer by layer from bottom to top to prepare the specimens. The specimens were left to stand in the humid underground environment of the mine for 2 days and then demolded. Subsequently, they were moved to a standard curing room with a temperature of 20 ± 2 °C and a relative humidity of not less than 95% for curing. After 7 days of curing, a laser cutting machine (Shandong Songli Machinery Co., Ltd., Liaocheng, China) was used to cut small beam specimens of 600 mm × 125 mm × 75 mm. All specimens were cured until the 28-day age before the test was conducted. The process is shown in Figure 2. For the four-point bending test, there were 3 specimens in each group, totaling 30 specimens. The test results were taken as the arithmetic average of the 3 specimens. A microcomputer-controlled electro-hydraulic servo universal testing machine (model WAW-300D) (Hebei Jingerxin Instrument & Equipment Co., Ltd., Beijing, China) was used for the test, and the four-point loading method was adopted. For the load-deflection curve test of bending, before the deflection of the beam reached 0.5 mm, the mid-span deformation speed of the beam was controlled at 0.20 mm/min. After that, the mid-span deformation of the beam was increased to 1.0 mm/min to measure the mid-span deflection. The loading diagram is shown in Figure 3.

2.4. Calculation of Experimental Results

According to the standard GB 50086-2015 [31], the four-point bending strength of the concrete beam was calculated using Formula (1):
f f = P 0.1 l b h 2
In Formula (1), ff is the standard flexural strength of shotcrete (MPa); P0.1 is the point where the oblique line of the deflection value in the linear segment of the curve is translated by 0.1 mm and intersects with the load-deflection curve (N); l is the span between the supports (mm), h is the cross-sectional height of the specimen (mm); b is the cross-sectional width of the specimen (mm).

3. Experiment Results and Analyses

3.1. Failure State Analysis

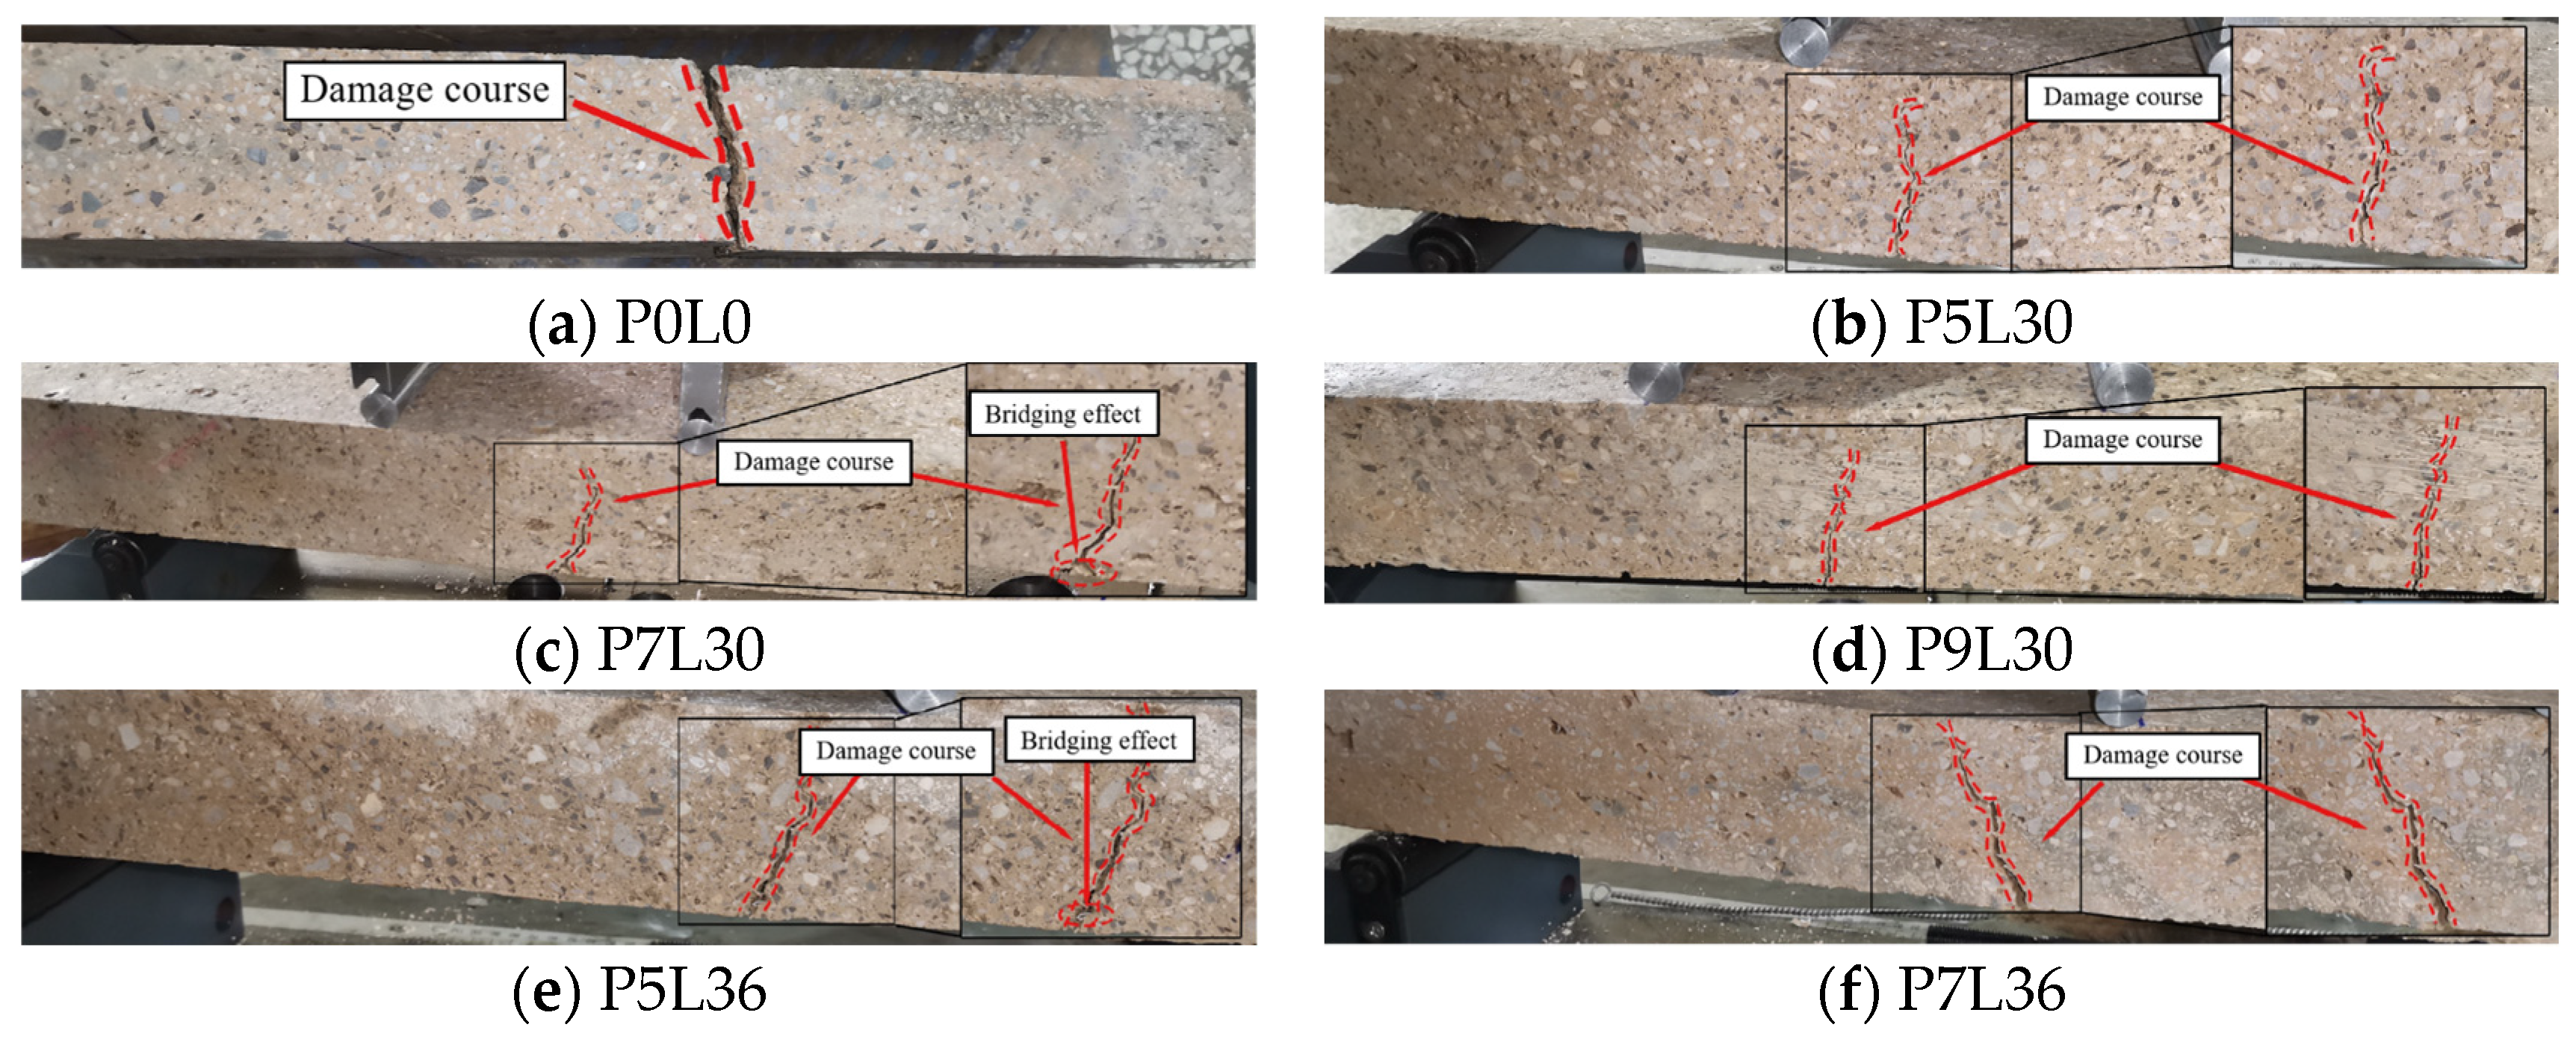
Figure 4 shows the four-point bending failure characteristics of the specimens. The plain concrete group (P0L0) exhibited typical brittle fracture during failure, and the initial mid-span crack expanded rapidly, leading to complete separation of the specimen. The specimens mixed with fibers showed a progressive failure mode: in the low-dosage group (P5L30/36/42), short and fine cracks formed after reaching the peak load, the fiber bridging effect was weak, and the crack expansion was random; in the medium-dosage group (P7L30/36/42), the crack extension length increased, and the fibers were exposed and cross-linked to form an effective stress transfer path for expansion; in the high-dosage group (P9L30/36/42), the crack width and extension length further increased, the fiber bridging effect was sufficient, and the crack expansion showed a stable linear law. The test shows that increasing the fiber dosage can enhance the crack control ability, and the failure mode of the specimen changes from brittle fracture to ductile layered failure.

3.2. Load-Deflection Curves

Figure 5 and Figure 6 show the load-deflection curves of each group of PFS specimens under the conditions of equal dosage and equal length, respectively. Compared with the SC group, all fiber-reinforced groups showed ductile failure characteristics, and the test was terminated when the post-peak deflection reached 4 mm. As shown in Figure 5, under the condition of equal dosage, the 30 mm short fibers had limited bridging effect due to their short length, resulting in a small peak load; the 36 mm fibers formed a continuous three-dimensional constraint network due to their aspect ratio, resulting in a good bridging effect and a large peak load; the 42 mm long fibers were conducive to stress transfer due to their dense distribution, resulting in the most significant improvement in bending load and the largest peak load; all of which were higher than those of the SC group. As shown in Figure 6, under the condition of equal length, the 5 kg/m3 fibers had a small number of volumes and large spacing, resulting in early crack initiation and rapid expansion, and a small peak load; the 7 kg/m3 fibers had a moderate number of volumes and small spacing, forming a discontinuous bridging path, delaying the crack penetration, and a large improvement in peak load; the 9 kg/m3 fibers had a large number of volumes, and the fibers formed a bridging ductile damage zone through the cross-linked network, resulting in the largest peak load. The test shows that the fiber bridging network can regulate the expansion of cracks and realize the improvement of fracture energy.

3.3. Analysis of Flexural Strength of Fiber Reinforced Concrete

According to the standard JGJ/T 372-2016, the four-point bending strength test was repeated on 3 concrete specimens in each group to obtain the flexural strength value of each specimen. The mean value μ, standard deviation σ and coefficient of variation cv of the flexural strength of each group of concrete specimens were calculated using Formulas (2) and (3), respectively, for statistical analysis, as shown in Table 3. According to the standard GB 50164-92 [32], the coefficient of variation cv of each group of fiber concrete specimens should not be greater than 5%. The test results show that the relative dispersion degree of the data of each group of specimens is low, the data is concentrated, the test accuracy is high, and the data is reliable.
σ = 1 N i = 1 N ( x i μ ) 2
c v = σ μ × 100 %
In the formulas, xi is the flexural strength value of each specimen; N is the number of flexural strength values (3 in total); μ is the mean value.
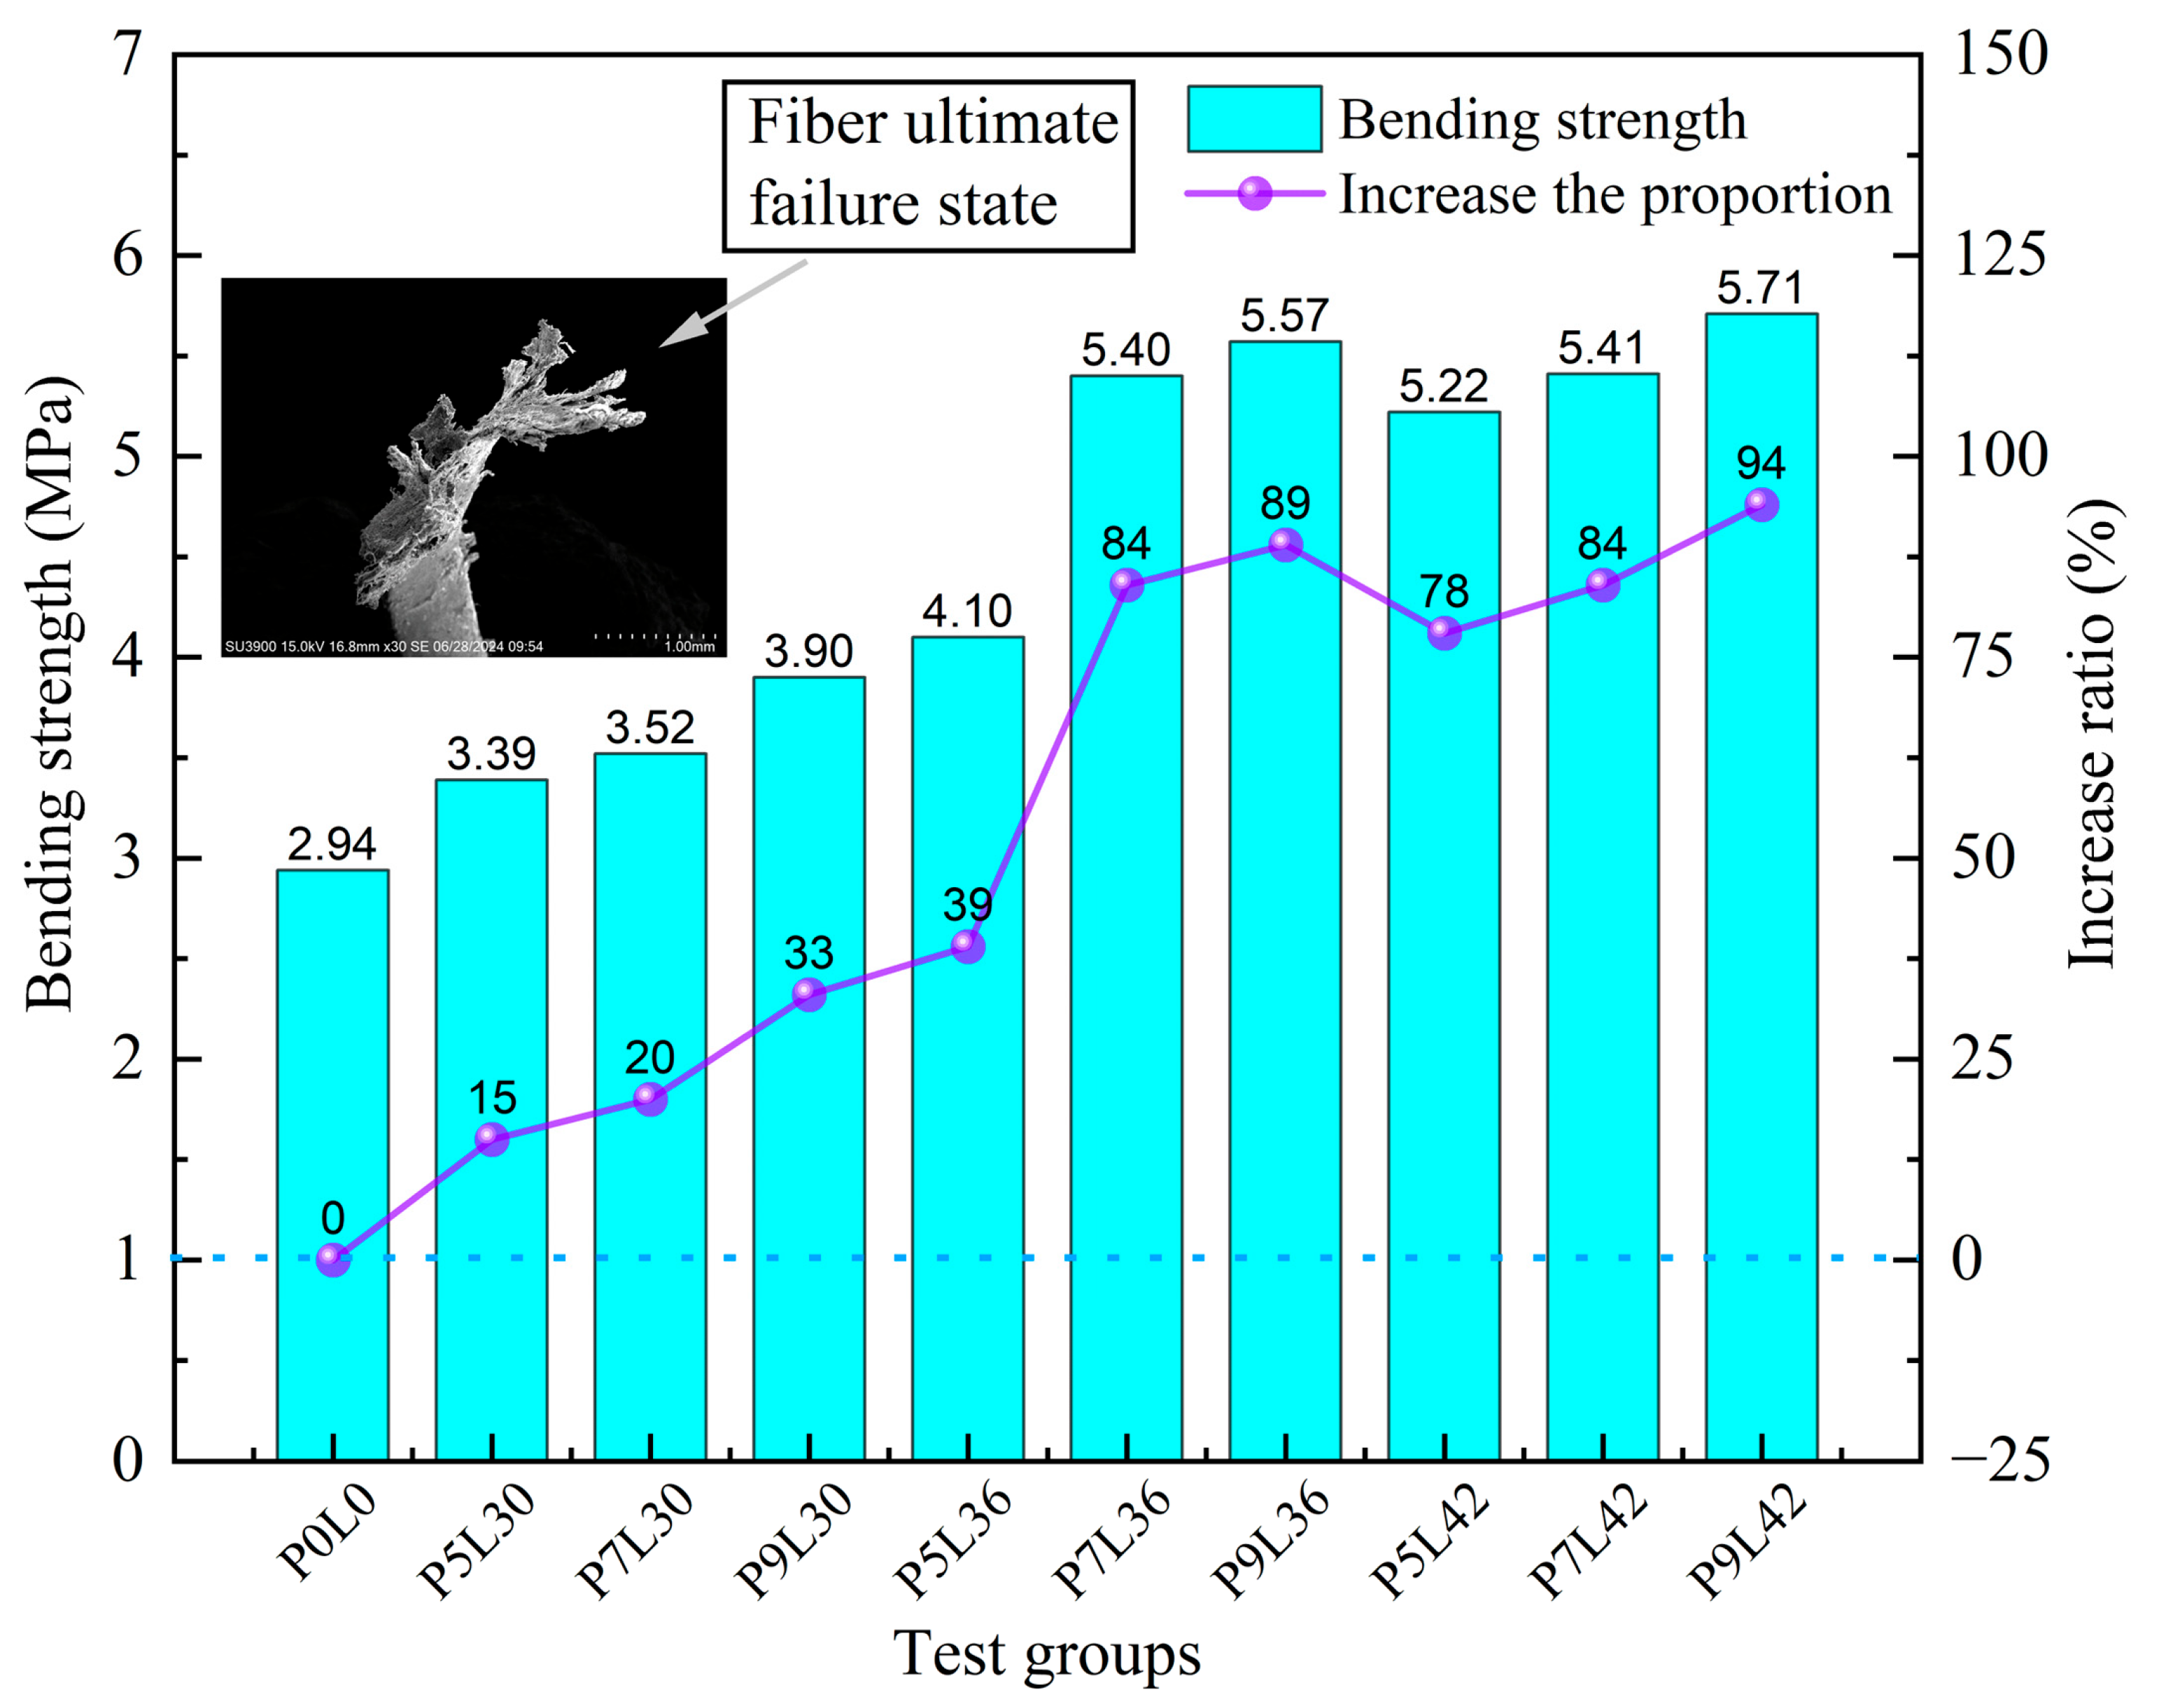
The comparison of the flexural strength of each group of fiber concrete specimens is shown in Figure 7. Compared with the plain concrete control group, the flexural strength of each group of specimens increased by 0.45–2.77 MPa, with an increase ratio of 10–100%. It can be seen that the addition of POM fibers with different lengths and dosages improves the flexural strength of concrete to varying degrees, and both are positively correlated with the flexural strength; among them, the increase in dosage contributes more significantly to the strength gain. This is mainly because the POM fibers are flat in shape, which limits the plastic shrinkage and microcracks caused by concentrated loads, and reduces the expansion of microcracks. In the fiber spacing theory, it is found that fibers can eliminate the stress of pre-cracks. When the load is continuously applied near the peak load, large cracks will occur on the surface of the fiber concrete beam and continue to expand. When the POM fibers pass through the large cracks, they can play a good bridging role, reduce the displacement deformation at both ends of the cracks, and redistribute the load. The addition of POM fibers can improve the flexural strength and toughness of the concrete matrix.

3.4. Flexural Toughness Analysis of Fiber Reinforced Concrete

The toughness of a material can be characterized by quantitative indicators, which represent the ability of the matrix to inhibit crack expansion and maintain crack bearing capacity after cracking. Among them, the fiber reinforcement effect is often evaluated by toughness parameters [33]. According to the standard ASTM C1609/C1609M-19 [34], the four-point bending test was conducted using unnotched beams, with 3 specimens in each group, and the results were taken as the arithmetic average. This effectively reduces the impact of the randomness of a single crack on the overall performance evaluation. Although there is dispersion, through parallel comparison of multiple groups and multiple specimens, the performance differences and laws between different mix proportions can be clearly identified [35,36]. The toughness was evaluated through the constitutive response of the four-point bending test curve, and the analyzed parameters included the specimen load, flexural strength, deflection, and the integral area T value under the specific deflection curve. The P1.0, P2.0, and P4.0 load values were obtained by controlling the deflection at 1.0 mm, 2.0 mm, and 4.0 mm in Figure 6 and Figure 7. Combined with the bending formula, the residual strength parameters f1.0, f2.0, f4.0, and the energy absorption integral model T4 of the load-deflection curve from 0 mm to 4.0 mm were calculated. The toughness index results are shown in Figure 8.
In Figure 8, when 30 mm fibers were used with a dosage of 5 kg/m3, the specimens showed low residual strength characteristic values. However, with the increase in fiber length and dosage, the residual strength indexes f1.0, f2.0, and f4.0 showed an increasing trend. Both the ultimate bearing capacity and the strength after the failure stage were improved, resulting in enhanced energy dissipation of the specimens during the failure process. However, due to the more obvious fiber agglomeration in the P9L42 group with a higher fiber dosage, the residual strength attenuation rate accelerated. With the increase in fiber length (30 mm→36 mm→42 mm) and dosage (5 kg/m3→7 kg/m3→9 kg/m3), the energy absorption value of the specimen’s load-deflection curve in the deflection range of 0–4.0 mm approximately doubled. It can be seen that increasing the fiber length and dosage can significantly improve the energy consumption of the specimens. Among them, when the fiber length is 42 mm and the dosage is 9 kg/m3, the specimens have the best flexural toughness value.

4. Numerical Simulation

4.1. Physical Model of Polyformaldehyde Fiber Concrete

Based on the secondary development of the ABAQUS finite element software, Python 3.12 scripts were used to realize the random dispersion distribution of fibers and the control of geometric parameters [37,38]. The fibers were embedded in the concrete model in the form of trusses. The size of the flexural specimen of fiber concrete was exactly the same as that in the laboratory test, and the model is shown in Figure 9. Other auxiliary components were geometrically simplified under the premise of ensuring the stress simulation characteristics of the flexural specimens. The numerical convergence of the finite element analysis significantly depends on the discretized mesh parameters. Through the calculation of mesh element density, under the condition that the computer operation efficiency allows, the concrete was divided into a mesh size of 8 mm, with the element type of C3D8R; the fibers were divided into a mesh size of 3.50 mm, with the element type of T3D2. The constraint between the fibers and the concrete was set in the form of an embedded region. The weight coefficient rounding error was 1 × 10⁻⁶, and the external percentage tolerance was set to 0.05. At the same time, the bond-slip between the concrete and the fibers was ignored [39,40]. In addition, the constraints and boundary conditions of the model are essential. The rollers are used to provide support and transfer stress and do not participate in the stress analysis. Therefore, in this model, the top and bottom rollers were set as rigid materials. The contact mode between the specimen and the top roller and bottom roller was set as surface-to-surface contact. The tangential behavior was set as “penalty” contact, and the normal behavior was set as “hard” contact. Displacement constraints were applied to the bottom support rollers to release the rotational degrees of freedom, and a vertical downward displacement of 4 mm was applied to the top rollers of the concrete to simulate the radial bending stress state of the specimens.

4.2. Material Plastic Damage Constitutive

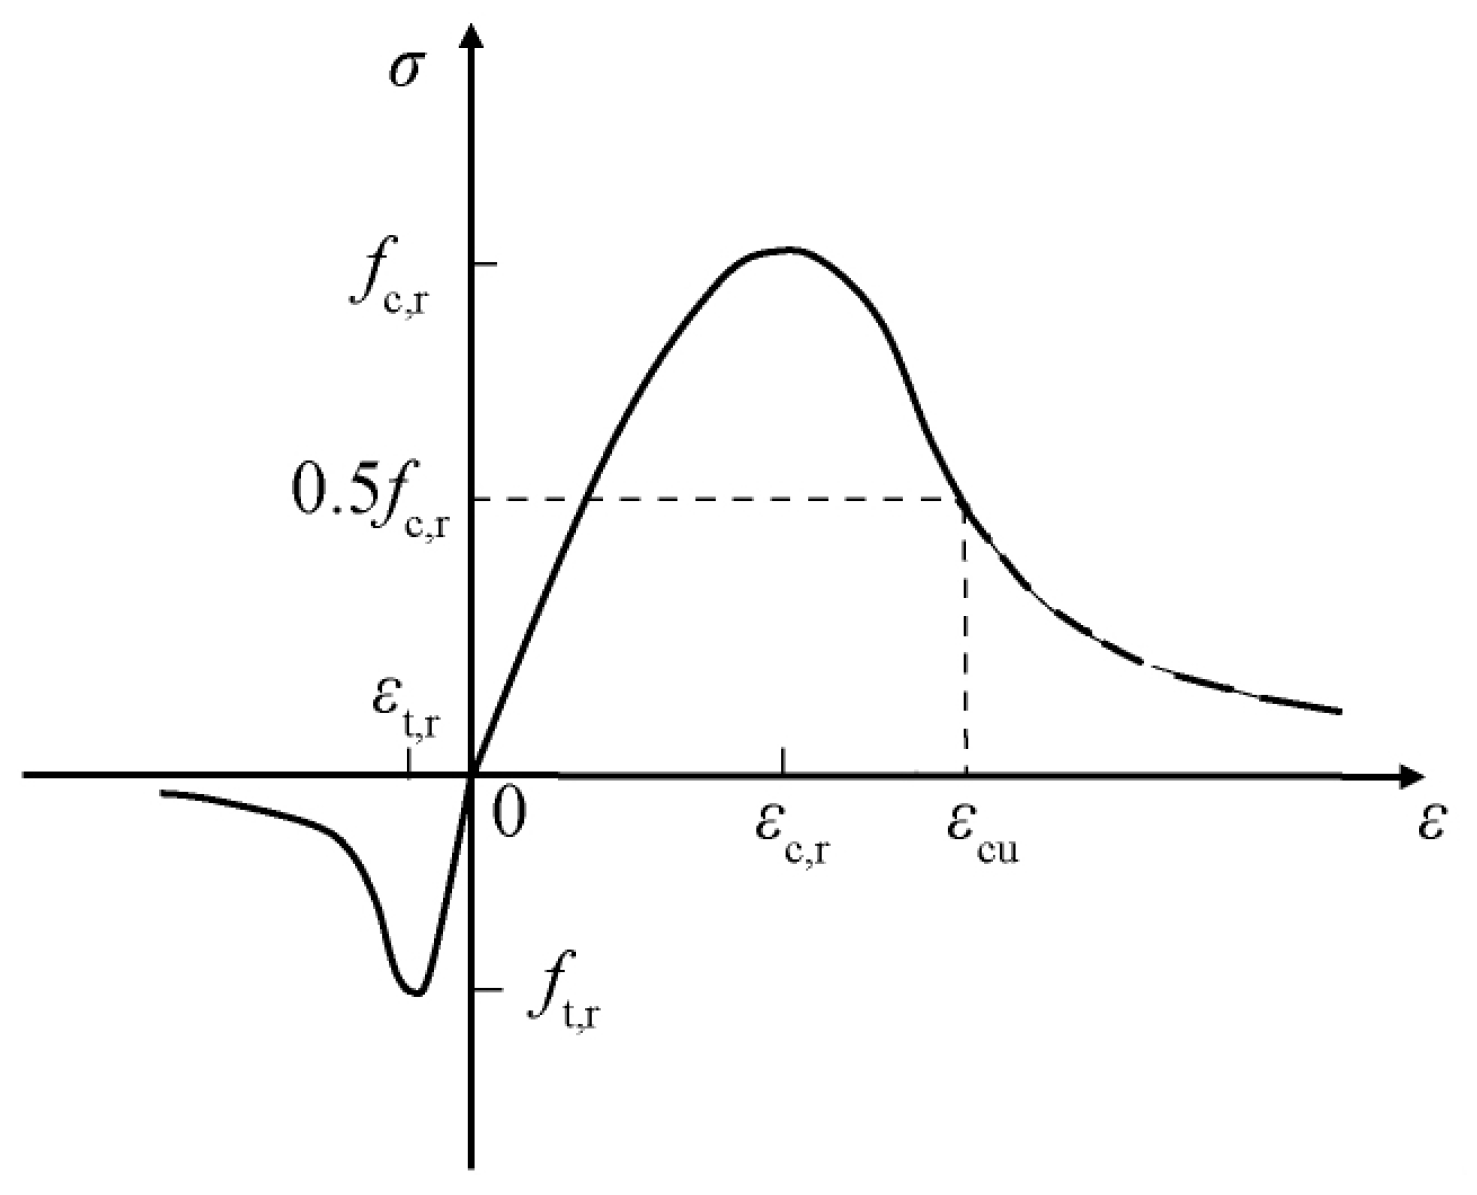
The concrete plastic damage model (CDP) in ABAQUS was used for the simulation of the concrete four-point bending test. This model is specially designed for the multi-axial nonlinear mechanical response. By coupling elastic deformation, plastic flow, and damage evolution, a stress–strain constitutive equation was constructed, and the synchronous simulation of the dynamic crack expansion process and the continuous accumulation of damage variables was realized. Its failure is based on the energy dissipation criterion, which accurately defines the critical state of the material from damage initiation to complete failure. The core advantage of the CDP lies in its characterization of the nonlinear response of materials under multi-axial stress states, including the comprehensive simulation of key mechanical characteristics such as strength degradation, damage evolution, and plastic deformation. The POM fiber material exhibits a linear elastic constitutive relationship under tensile load, and its stress–strain response shows an ideal linear characteristic, which conforms to Hooke’s law, and there is no residual strain after unloading. When the strain value exceeds the critical threshold, the material will enter the nonlinear damage stage until final fracture. The concrete parameters in the CDP were determined using the constitutive relationship of the standard GB/T50010-2010 [41]. The uniaxial stress–strain curve was calculated using Formulas (4) and (5), as shown in Figure 10. To deal with the model calculation that is not easy to converge, the damage evolution parameters provided by the standard cannot be directly applied to the CDP. SIDOROFF [42] proposed that the elastic complementary energy has the same form on damaged and undamaged materials under stress. The damage factor based on this assumption was calculated using Formula (6).
Tensile   stress :   σ = 1 d t E c ε
Compression   stress :   σ = ( 1 d c ) E c ε
d = 1 σ E 0 ε
In the formulas: σ and ε are calculated using Formulas (4) and (5); E0 is the initial elastic modulus of concrete.
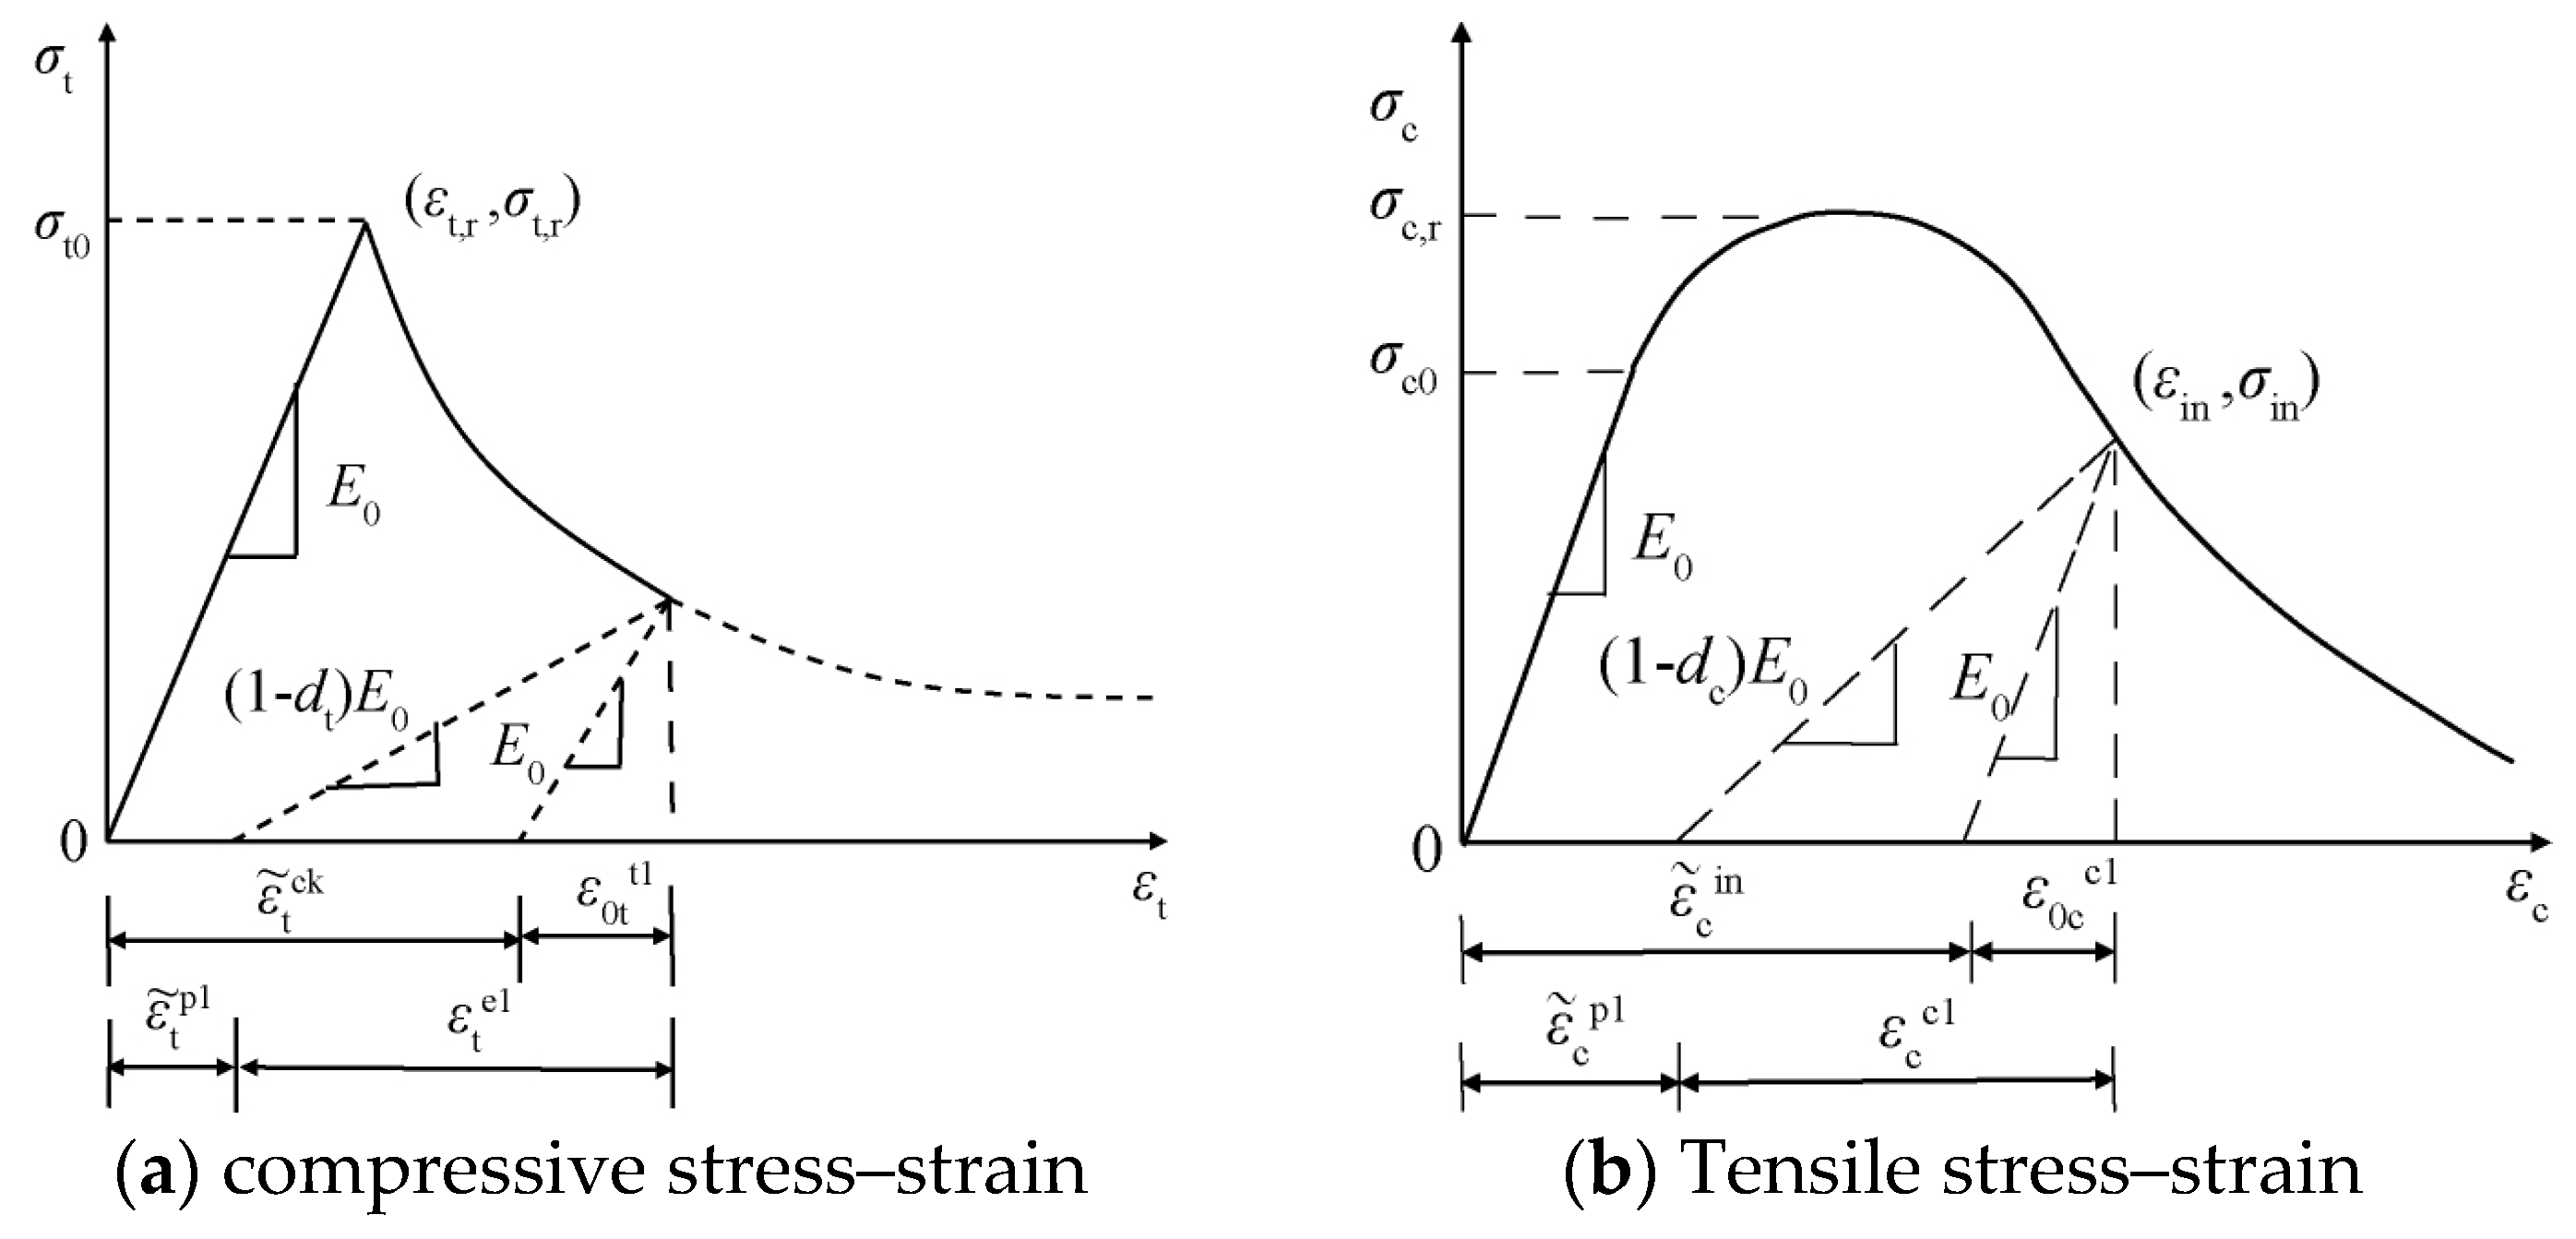
Based on the CDP constitutive model, the concrete failure mechanism mainly includes two typical modes: cracking failure caused by strain softening after tensile stress yield, and crushing failure caused by hardening-softening transformation under compressive stress. The model requires that the equivalent plastic strains in tension and compression are always positive and increase continuously with the accumulation of damage factors. The elastic stage was defined by selecting the stress–strain interval between 0.50 εc,r and 0.60 εc,r. Figure 11 reveals the interaction law of tensile and compressive strain parameters in the model. The inelastic strains under compression and tension can be calculated using Formulas (7) and (8):
ε ~ c i n = ε c ε 0 c e l ε 0 c e l = σ c E 0 ε ~ c p l = ε ~ c i n d c ( 1 d c ) σ c E 0
In the formula: ε ~ c i n is the inelastic strain under compression; σc and εc are compressive stress and compressive strain; ε ~ 0 c e l is the elastic compressive strain corresponding to the initial elastic modulus; ε ~ c p l is the plastic strain under compression.
ε ~ t c k = ε t ε 0 t e l ε 0 t e l = σ t E 0 ε ~ t p l = ε ~ t c k d t ( 1 d t ) σ t E 0
In the formula: ε ~ t c k is tensile inelastic strain; σt and εt are tensile stress and tensile strain; ε ~ 0 t e l is the elastic tensile strain corresponding to the initial elastic modulus; ε ~ t p l is the plastic strain under tension.

4.3. Model Parameter

According to the current standard GB/T50010-2010, the core parameters of the concrete plastic damage model (CDP) were determined through the stress–strain constitutive relationship, as shown in Table 4. At the same time, to avoid the mesh sensitivity of tensile softening, this study adopted a softening constitutive based on fracture energy (Gf), following the principle of the Hillerborg crack band model to ensure that the energy dissipation of crack expansion is independent of the mesh size. The model improves the calculation convergence by controlling the characteristic length of the element and supplementing it with viscous parameters [43,44,45].

4.4. Simulation Results

Based on the numerical-experimental comparative analysis method, the failure state, mechanical curve characteristics, and bending load-bearing performance of fiber-reinforced concrete were systematically verified to evaluate the reliability of the numerical model.

4.4.1. Failure State and Analysis

Figure 12 shows the failure results of each group of specimens obtained by numerical simulation calculation, in which the DAMAGET cloud diagram was used to express the crack expansion and damage degree of the specimens during the stress process. The plain concrete specimens mainly showed centralized fracture in the middle, with a narrow failure area; while the maximum damage area of the fiber group specimens extended to the vicinity of the supports, and their failure morphology was consistent with the crack development law of the test (Figure 5). The numerical simulation results effectively reproduce the longitudinal cracking behavior of the beam members. The distribution of tensile damage is approximately linear, reflecting the crack distribution in the tensile zone of the fiber concrete beam, which is consistent with the actual situation of the concrete beam specimens. The tensile zone damage gradient constructed in this modeling shows a quasi-linear characteristic, and this damage characteristic has a good geometric similarity with the crack expansion path of the test specimens.

4.4.2. Analysis of Fiber Reinforcement Mechanism

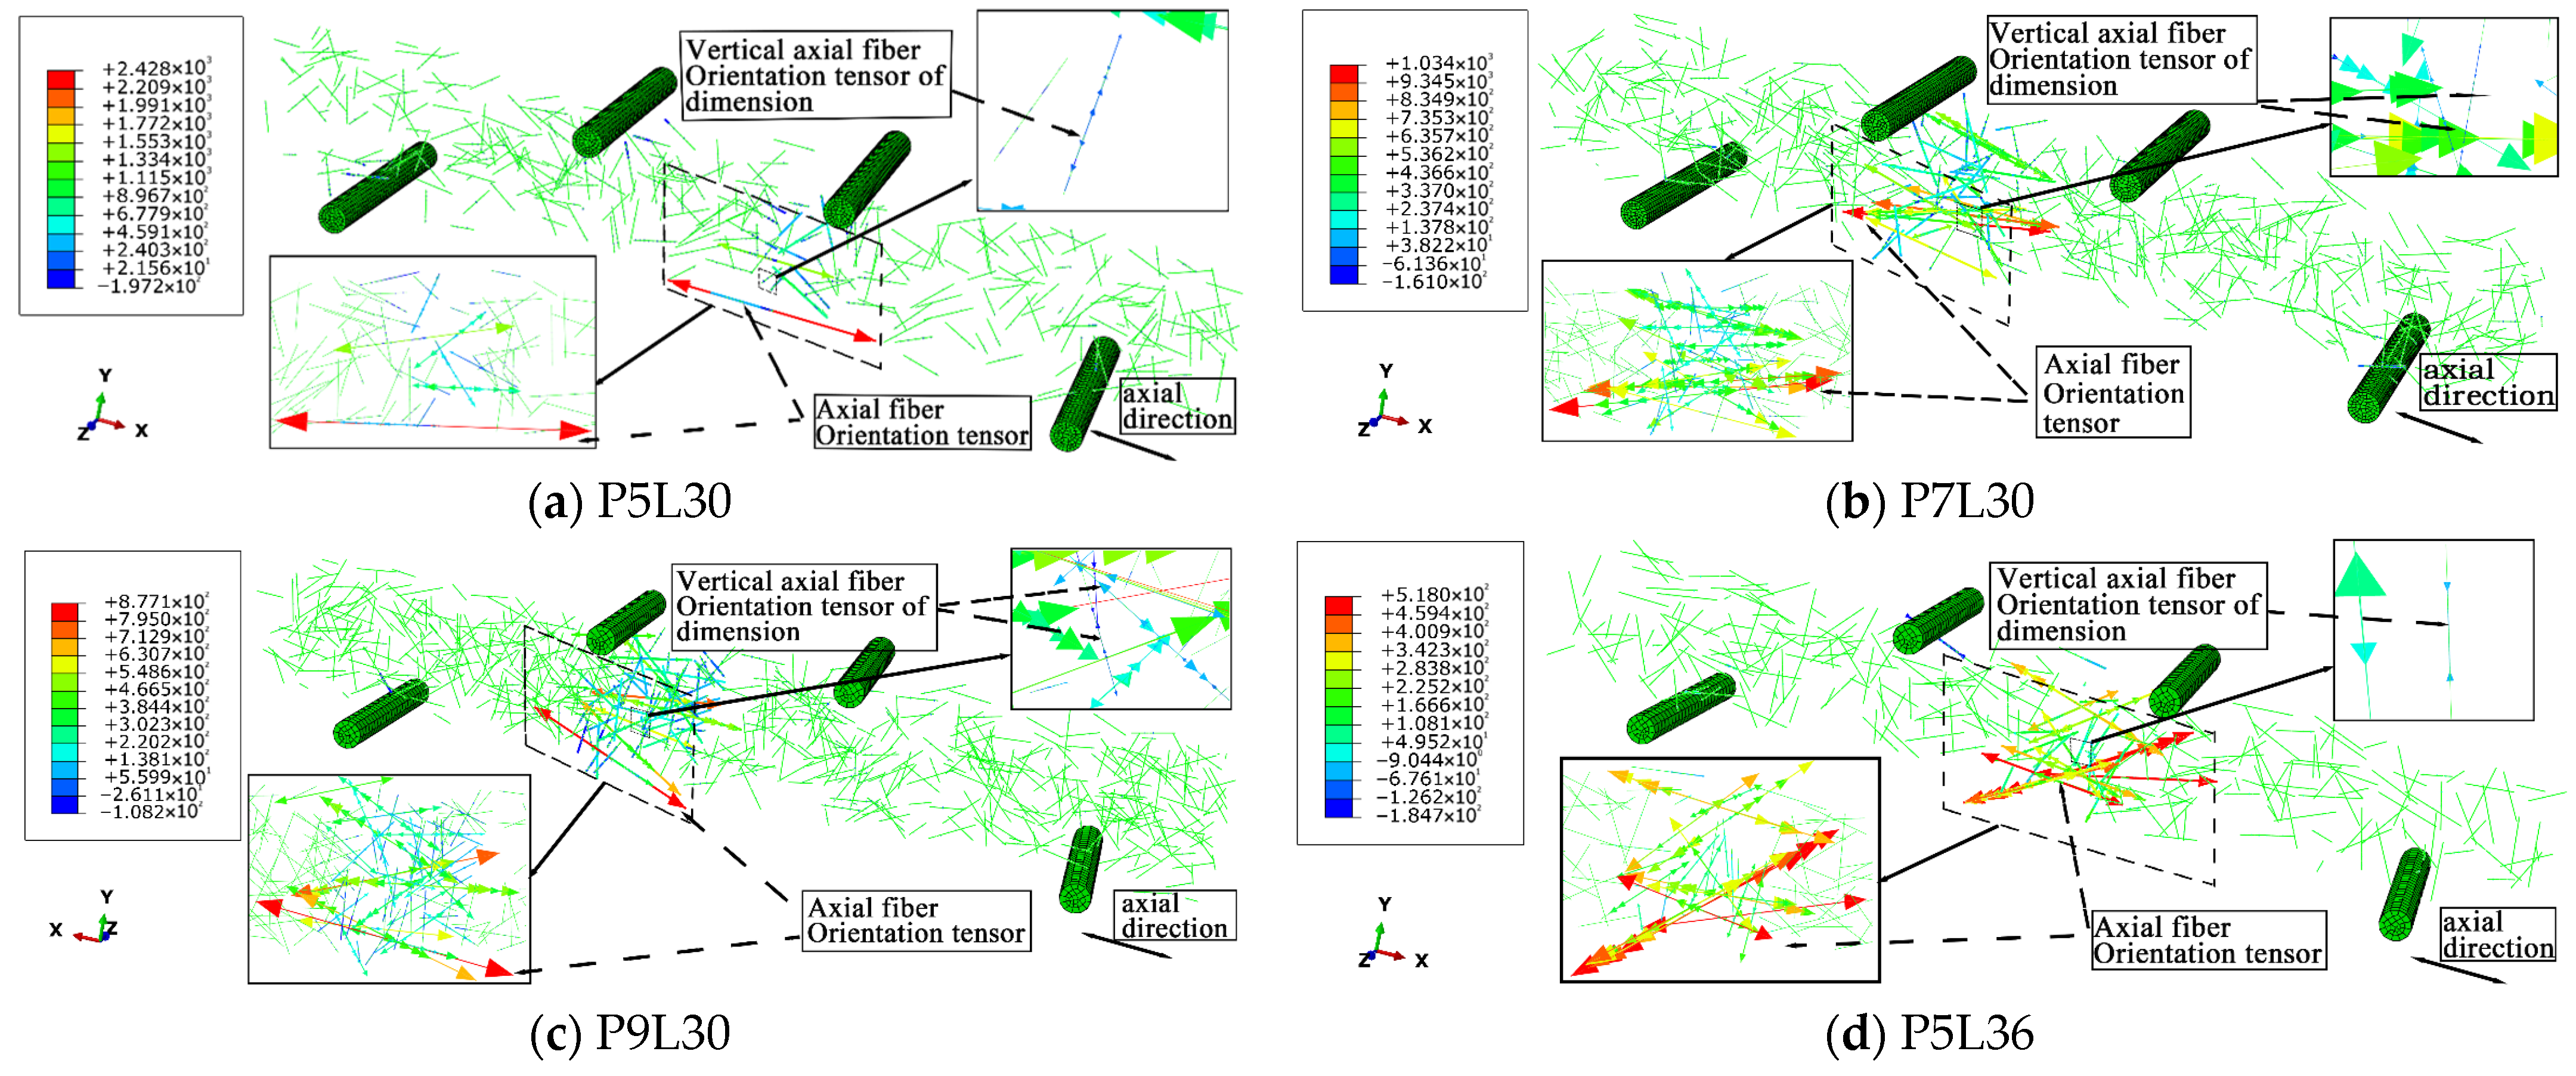
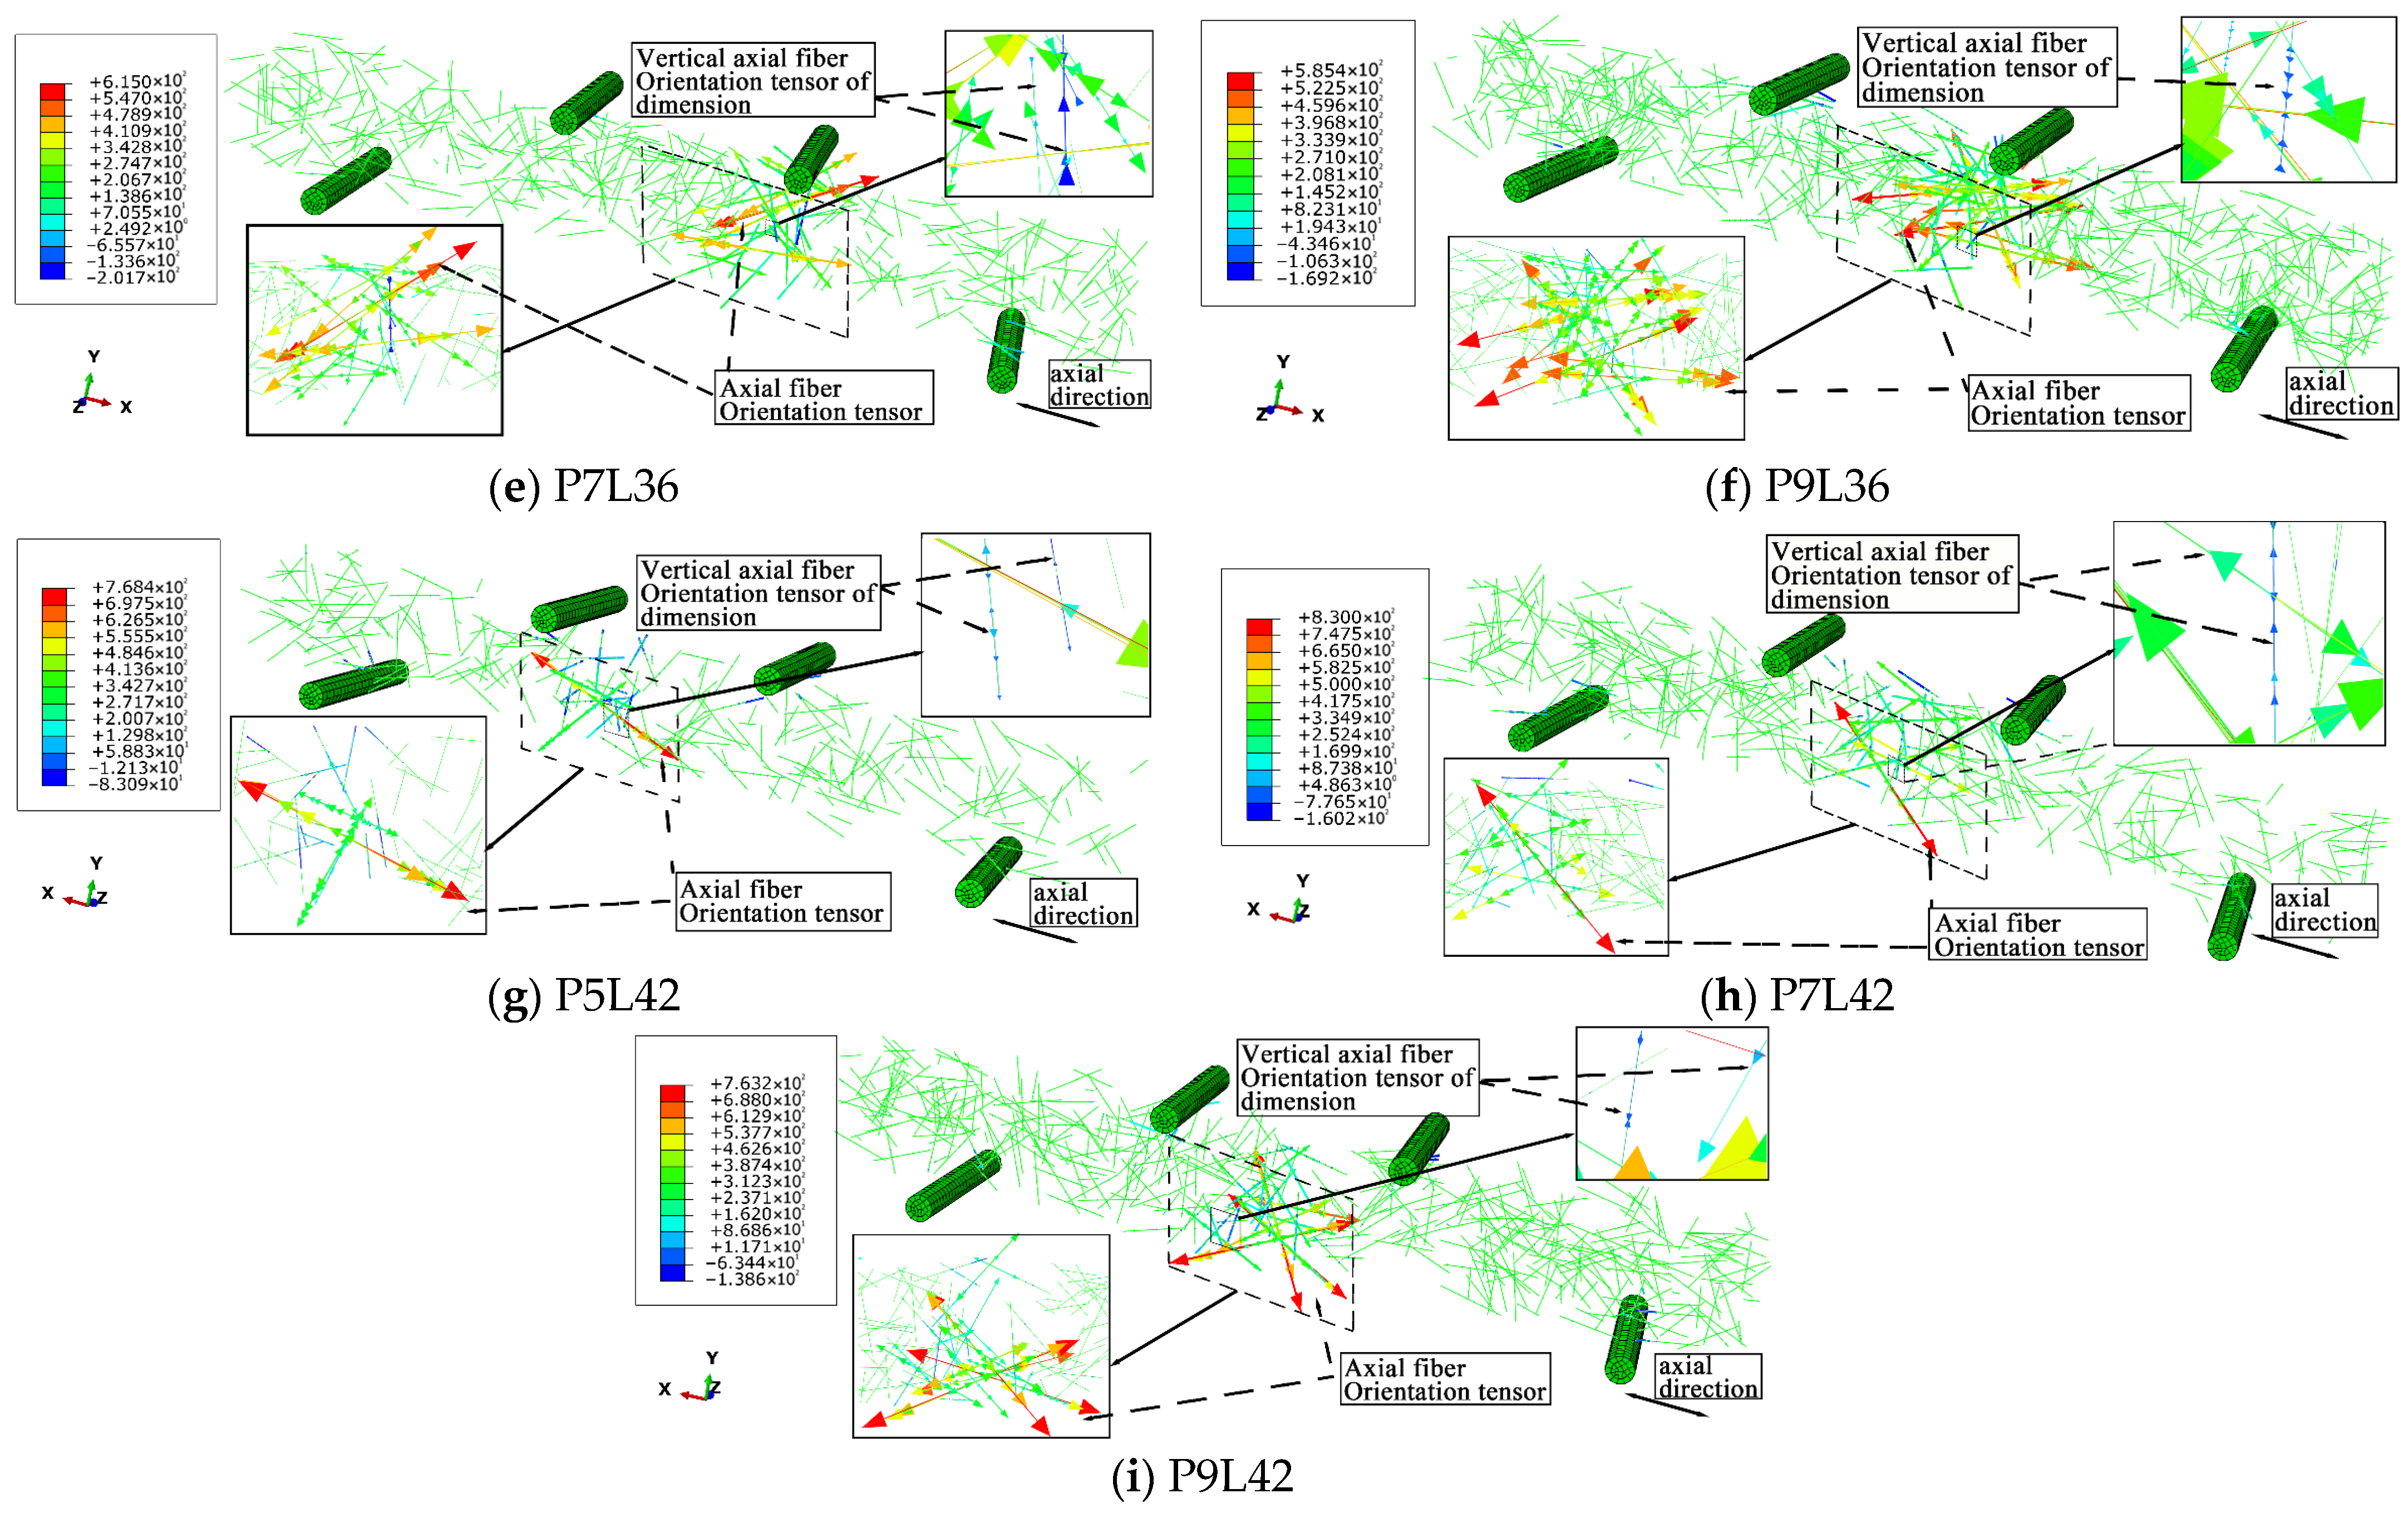
Figure 13 shows the stress cloud diagram of the internal fibers when the fiber concrete specimens reach the peak load. In the initial stage of stress, the POM fibers and concrete act together to form a bridging state. The fiber concrete has linear elastic characteristics, and its mechanical behavior is mapped with the load-deflection response characteristics. With the continuous increase in the load, the matrix damage gradually develops, and with the upward movement of the neutral axis, an obvious stress concentration phenomenon is formed in the main crack area. Although the fiber stress value is at a low level, its bridging effect also effectively delays the damage of the matrix. In addition, Figure 14 shows the distribution cloud diagram of the fiber orientation tensor in the concrete. The analysis shows that when the fiber orientation deviates from the axial direction of the specimen, its tensile load-bearing capacity is not fully utilized, resulting in a small stress of the fiber orientation tensor and a low contribution rate to the flexural strength of the specimen; when the fiber orientation is close to the axial direction of the specimen, the fibers can be fully stretched, thus effectively bearing the load, the stress of the fiber orientation tensor is large, and the contribution rate to the flexural strength of the specimen is high. The maximum/minimum stress values of the fiber orientation tensor in the high-dosage groups (P9L30/36/42) are 877 MPa/−108 MPa, 585 MPa/−169 MPa, and 763 MPa/−138 MPa, respectively, among which the P9L42 group has a relatively large stress fluctuation range of the fiber orientation tensor.

4.4.3. Load-Deflection Curve

As shown in Figure 15, the trends of the load-deflection curves of the test and simulation are basically consistent. The simulation curve shows a linear relationship before cracking, which is consistent with the load-deflection curve of the actual test. However, after entering the softening stage with the increase in the load, the simulation value of the numerical simulation results is higher than the actual test value. This deviation mainly comes from two aspects: first, the numerical simulation adopts an idealized bonding method, and the simulation setting does not fully consider the bond-slip relationship between the fibers and the concrete, while the initial micro-defects existing in the actual fiber shotcrete weaken the bridging ability of the fibers [46,47]; second, the concrete damage plastic model used in the simulation regards the material as a uniform continuous medium, while the aggregate distribution, microcracks, and defects inside the actual concrete are random, and the inhomogeneity not captured by the simulation will lead to a faster attenuation of the load-bearing capacity [48,49].

4.4.4. Bending Strength Analysis

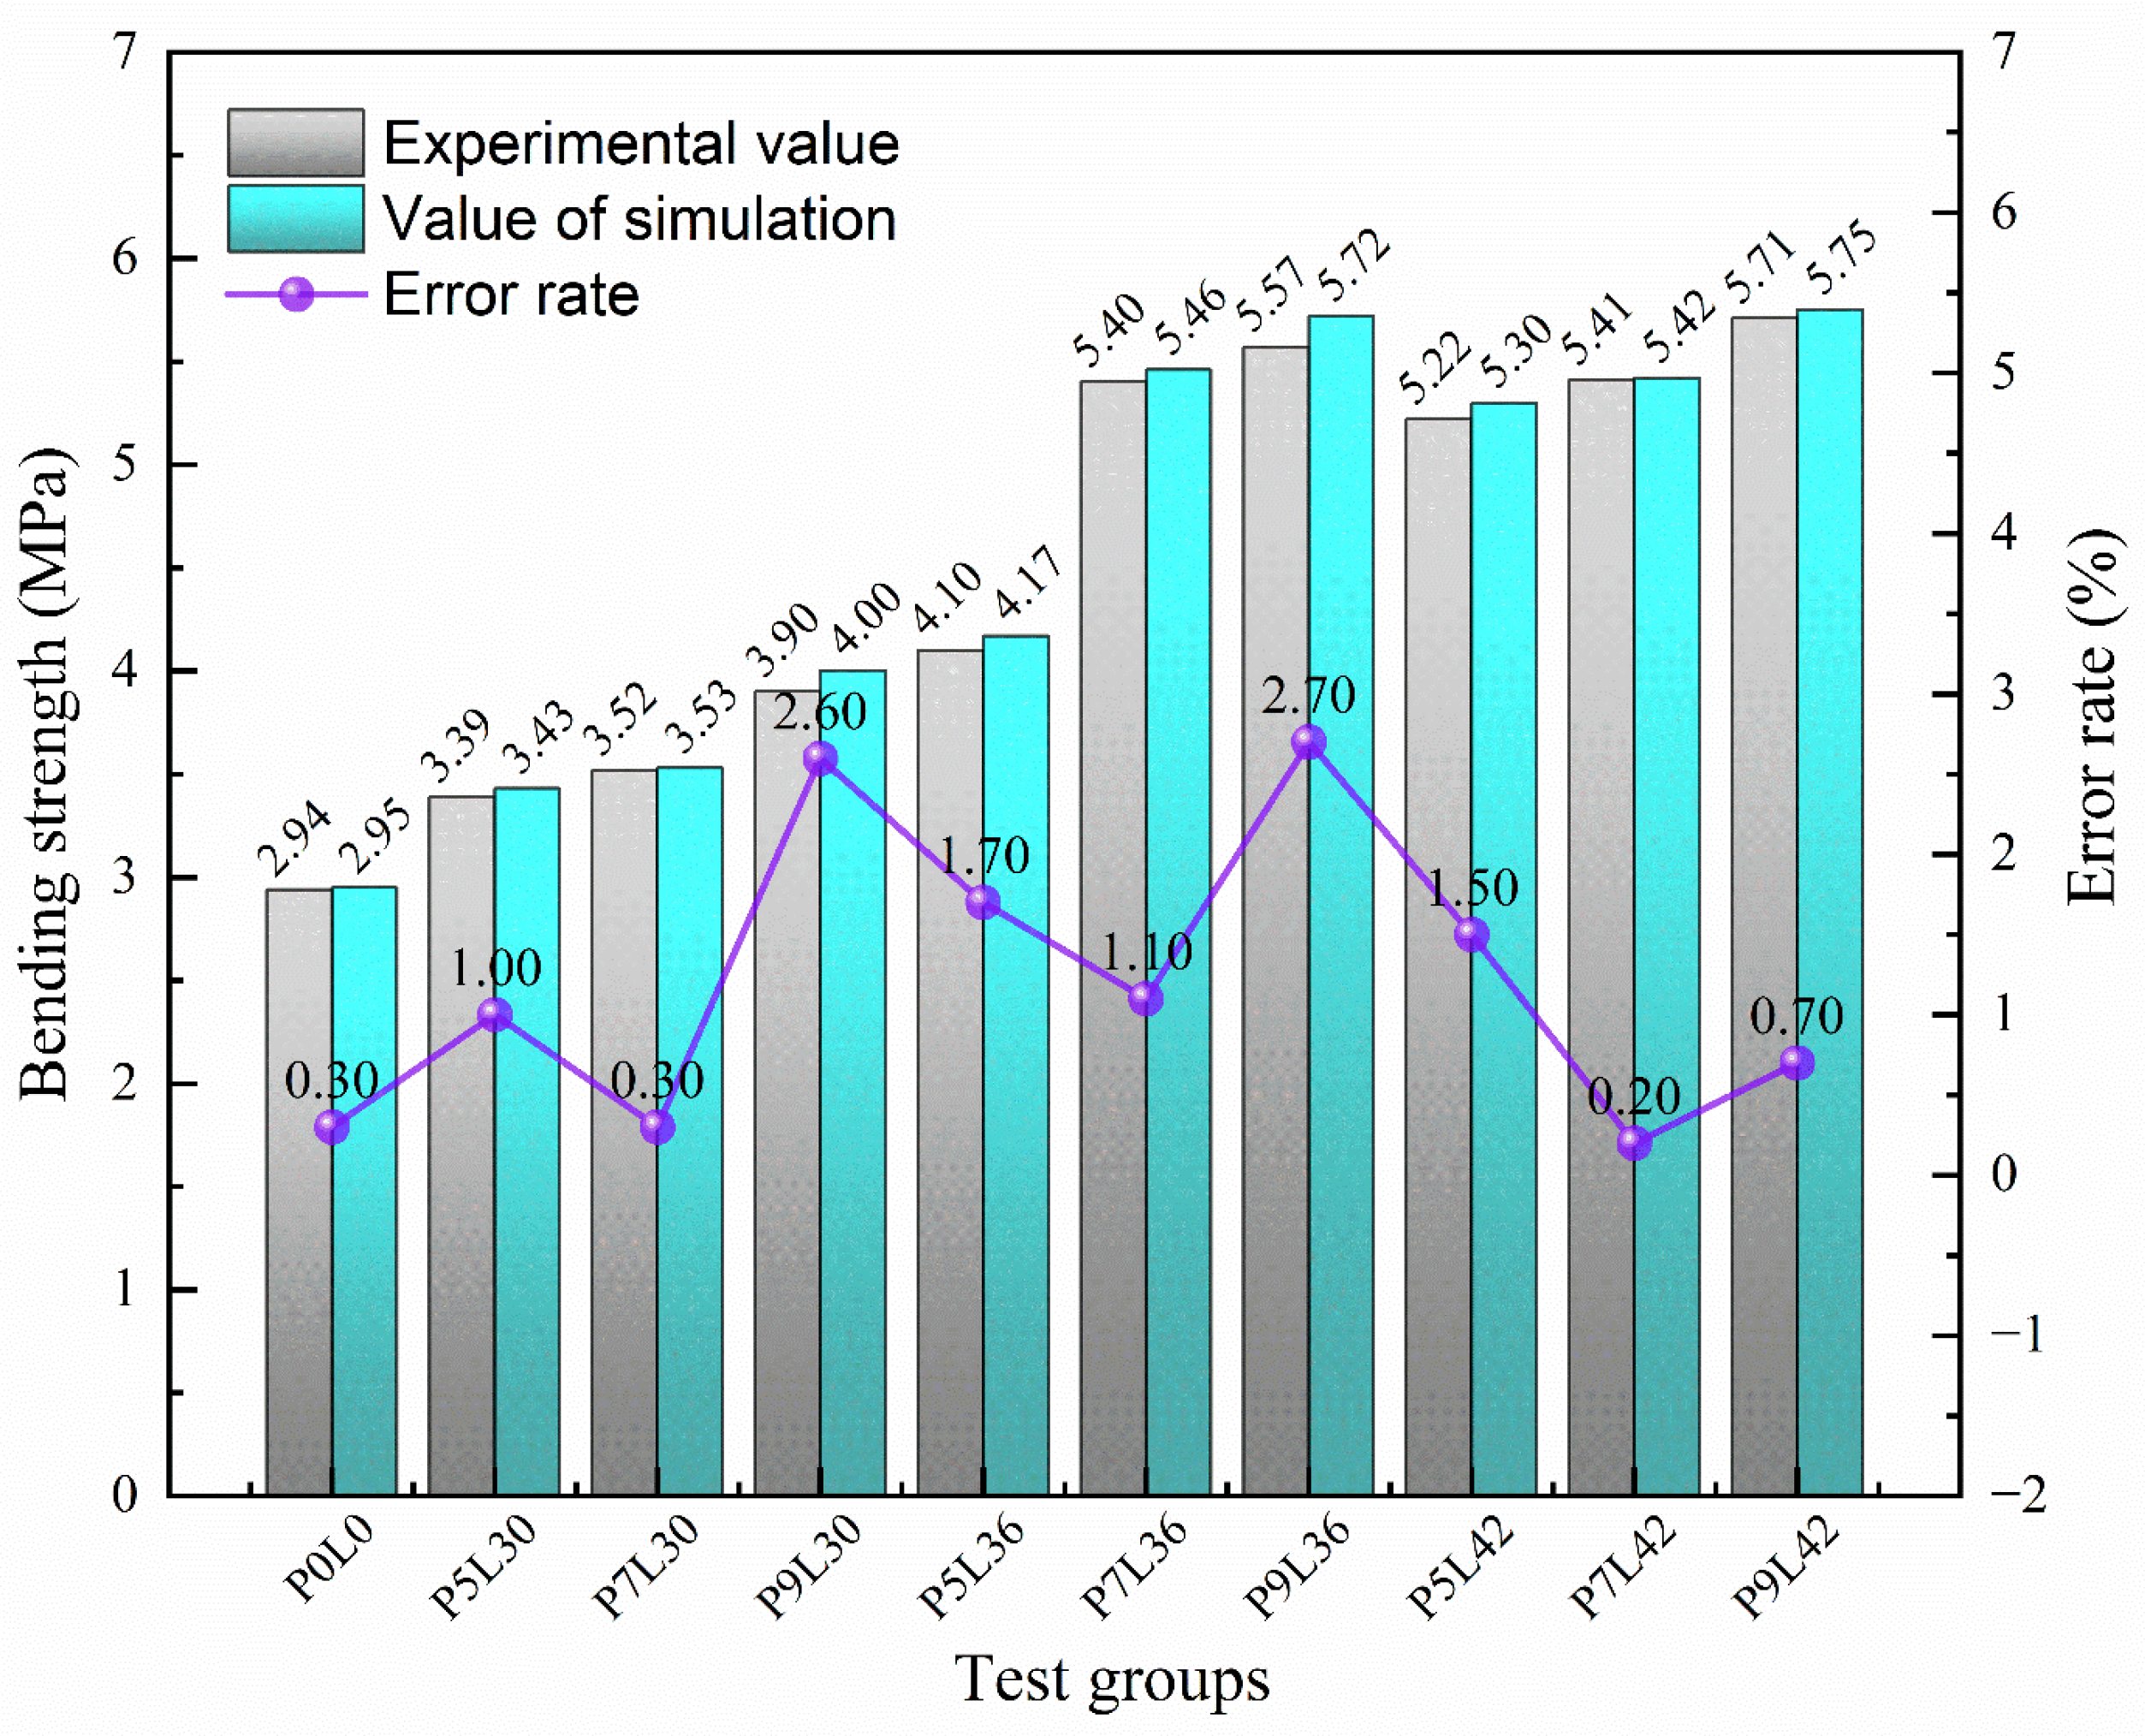
As shown in Figure 16, the test and simulation results on the influence of fiber length and dosage on the flexural strength of concrete are basically consistent, and the flexural strength increases with the increase in fiber length and dosage. The simulation values are in good agreement with the test values, with specific errors of 0.3%, 1%, 0.3%, 2.6%, 1.7%, 1.1%, 2.7%, 1.5%, 0.2%, and 0.7%, respectively, and the maximum error is only about 3%, which is within the allowable range. In addition, the finite element model not only accurately reflects the test laws but also reveals the mechanical behavior and failure process that cannot be directly observed in the test, which fills the gaps and defects of the test to a certain extent. To sum up, the finite element model is considered reasonable.

5. Conclusions

In this study, through four-point bending tests and ABAQUS numerical simulations, the effects of POM fibers with different lengths and dosages on the flexural performance of shotcrete were systematically analyzed. The results show that POM fibers can effectively inhibit the crack development of shotcrete and enhance its crack resistance and residual strength. At the same time, the numerical simulation tracks the stress propagation state of the fibers, thus demonstrating the application potential of fiber shotcrete in engineering.
(1)
In the four-point bending test, the SC specimens quickly developed cracks in the middle during loading, which continued to expand and eventually fractured into two segments, showing typical brittle failure. The specimens mixed with fibers showed significant differences: in the low-dosage group (P5L30/36/42), the cracks were thin and short at the maximum load, the fiber bridging effect was weak, and the crack expansion was disordered; in the medium-dosage group (P7L30/36/42), the crack length increased, the fibers were partially exposed and showed a linear expansion trend, and the bridging effect was enhanced; in the high-dosage group (P9L30/36/42), the crack width was the largest but the distribution was concentrated, more fibers were exposed and formed a continuous bridging network, and the cracks expanded regularly along a straight line. By inhibiting the crack width and guiding the expansion path, the fibers effectively improve the brittle fracture mode of SC, resulting in a more complete failure morphology, and the toughening effect is significantly enhanced with the increase in dosage.
(2)
After adding fibers, the load-deflection curves of PFS show similar trends, the failure mode changes from brittle fracture to ductile failure, the post-peak softening segment is significantly extended, and the residual load-bearing capacity is improved. Under the same dosage, the 42 mm long fibers are conducive to stress transfer due to their dense distribution, resulting in the most significant improvement in bending load and the largest peak load. Under the same length, the 9 kg/m3 fibers form a bridging ductile damage zone through the cross-linked network due to their large volume quantity, resulting in the largest peak load. The order of significant improvement in flexural strength of each group of PFS is: P9L42 > P9L36 > P7L42 > P7L36 > P5L42 > P5L36 > P9L30 > P7L30 > P5L30 > P0L0. Compared with the plain concrete group, the flexural strength of the fiber groups increased by 0.45–2.77 MPa, with an increase ratio of 10–100%. Among them, the P9L42 group has the highest flexural strength of PFS, which is 5.71 MPa, with an increase ratio of 94%. That is, the fiber ratio of 42 mm in length and 9 kg/m3 in dosage has the best improvement effect on SC.
(3)
The numerical simulation analysis shows that the plastic damage failure and load-deflection curves of each group of concrete specimens are in good agreement with the experimental conditions, and the fiber stress cloud diagrams all reflect that the internal fiber laws of the concrete are basically consistent. Among them, the fiber orientation tensor distribution cloud diagram reflects that, when the fiber arrangement direction is consistent with the axial direction of the specimen, the contribution rate to the flexural strength of the specimen is higher. The maximum/minimum stress values of the fiber orientation tensor in the P9L42 group are 763 MPa/−138 MPa, with an obvious fluctuation range.
(4)
To study the flexural performance of PFS specimens, this study adopted a method combining physical tests and numerical simulations. Based on the test data, a finite element model was established using the plastic damage (CDP) model. The simulation results are in good agreement with the test results, with a maximum error of only 2.7%, verifying the accuracy of the model. Moreover, the model was used to expand the fiber orientation tensor analysis, and the effects of fiber length and dosage were systematically studied, thus obtaining the optimal length and dosage ratio of POM fibers and the flexural strength parameters of PFS. The results show that, compared with SC, the PFS material mixed with POM fibers can significantly improve the flexural performance, which is more conducive to meeting the stability requirements of the roadway surrounding rock support. This study provides a scientific basis for the application of PFS in mine roadway surrounding rock support.

Author Contributions

Conceptualization and methodology, Y.Z., G.W. and B.Z.; Formal analysis, B.Z. data collection, G.W.; validation, Y.Z.; writing—original draft preparation, Y.Z.; review and editing, Y.L., M.W. (Menglai Wang) and S.L.; project administration, M.Y., M.W. (Mingqiang Wang) and Y.M. All authors have read and agreed to the published version of the manuscript.

Funding

This research was funded by Central guide local science and technology development funds grant number [202407AC110019]; national Key R & D Program grant number [2024YFC2909500]; Yunnan Provincial Department of Science and Technology Plan Key Projects grant number [202401AS070071]; Yunnan ‘Xingdian Yingcai Support Plan’ innovation team grant number [202505AS350002].

Institutional Review Board Statement

Not applicable.

Informed Consent Statement

Not applicable.

Data Availability Statement

Data are contained within the article.

Conflicts of Interest

Authors Menglai Wang, Shujian Li and Mingli Yuan were employed by the company Yunnan Phosphate Chemical Group Co., Ltd. Author Yanlin Li was employed by the company China Nonferrous Metals Industry Kunming Survey, Design and Research Co., Ltd. Author Yubo Ma was employed by the company Chongqing Yuntianhua Tianju New Material Co., Ltd. The remaining authors declare that the research was conducted in the absence of any commercial or financial relationships that could be construed as a potential conflict of interest.

References

  1. Xie, H.; Zhang, R.; Zhang, Z.; Gao, M.; Li, C.; He, Z.; Li, C.; Liu, T. Deep Earth Science and Deep Earth Engineering Technology Exploration and Thinking. J. Coal 2023, 48, 3959–3978. [Google Scholar]
  2. Manchao, H.; Heping, X.; Suping, P.; Yaodong, J. Study on rock mechanics in deep mining. J. Rock Mech. Eng. 2005, 24, 2803–2813. [Google Scholar]
  3. Wu, A.; Sun, W.; Han, B.; Hong-Jiang, W.; Shao-Yong, W.; Gong-Cheng, L. Effect of temperature on wet shotcrete support strength in cold mining area and its engineering application. J. Min. Saf. Eng. 2015, 32, 697–705. [Google Scholar]
  4. Wang, Q.; Jiang, Z.; Jiang, B.; Kang, H.; Zhang, C. physical simulation test on dynamic impact and energy absorption control of deep roadway. Accord. J. Rock Mech. Eng. 2024, 43, 2081–2091. [Google Scholar]
  5. Li, J.; Niu, J.; Wan, C.; Liu, X.; Jin, Z. Comparison of flexural property between high performancepolypropylene fiber reinforced lightweight aggregate concrete and steel fiber reinforced lightweight aggregate concrete. Constr. Build. Mater. 2017, 157, 729–736. [Google Scholar] [CrossRef]
  6. Wang, S.; Zhu, H.; Liu, F.; Cheng, S.; Wang, B.; Yang, L. Effects of steel fibers and concrete strength on flexural toughness of ultra-high performance concrete with coarse aggregate. Case Stud. Constr. Mater. 2022, 17, e01170. [Google Scholar] [CrossRef]
  7. Zhang, J.C.; Li, B.J.; Chen, W.Y.; Guo, R.X. Experimental investigations on tensile strength and fracture toughness of a polyoxymethylene fiber reinforced concrete. Theor. Appl. Fract. Mech. 2024, 130, 104250. [Google Scholar] [CrossRef]
  8. Lee, J.H.; Cho, B.; Choi, E. Flexural capacity of fiber reinforced concrete with a consideration of concrete strength and fiber content. Constr. Build. Mater. 2017, 138, 222–231. [Google Scholar] [CrossRef]
  9. Jin, L.; Jia, L.; Zhang, R. Mesoscopic numerical study on fracture behavior of steel fiber reinforced concrete at low temperature. Eng. Mech. 2023, 40 (Suppl. S1), 200–206. [Google Scholar]
  10. Huang, J.; Chen, H. Effect of basalt fiber length on mechanical properties and frost resistance of concrete. J. Funct. Mater. 2025, 56, 3194–3201. [Google Scholar]
  11. Xia, W.; Lu, S.; Bai, E.; Xu, J.; Du, Y.; Yao, A. Study on the mechanical properties of carbon nanotube-carbon fiber composite modified concrete. J. Mater. Rep. 2023, 37, 110–118. [Google Scholar]
  12. He, Y.; Huang, W.; Guo, J.; Chen, X.; Yan, M.; Wang, J. Residual mechanical properties of co-polyoxymethylene fiber ultra-high performance concrete after high temperature. Silic. J. 2022, 50, 839–848. [Google Scholar]
  13. Yue, J.; Wang, J.; Wu, Y.; Zhang, H.; Ye, Z.; Zhang, R. Experimental study and numerical simulation on fracture mechanical properties of 3D printed carbon fiber reinforced concrete J/OL. J. Build. Struct. 2023, 45, 243–252. [Google Scholar]
  14. Zheng, S.; Hu, J.; Zhang, X.; Yang, F.; Zhou, L.; Ruan, S. Experimental study on mechanical properties of green high performance fiber reinforced concrete. J. Hunan Univ. 2024, 51, 155–164. [Google Scholar]
  15. Chen, Y.; Li, H.; Ye, P.; Chen, Z.; Xu, H. Experiment on mechanical properties of steel fiber recycled concrete under cyclic loading. J. Compos. Mater. 2022, 39, 5574–5585. [Google Scholar]
  16. Zou, Q.; Chen, J.; Fu, B.; Teng, J. Mechanical properties of glass fiber composite solid waste reinforced concrete. J. Compos. Mater. 2025, 42, 1489–1501. [Google Scholar]
  17. Liu, C.Y.; Wang, H.Q.; Liu, X.F.; Niu, M.X.; Wu, J.F. Experimental study and numerical simulation of the effect of different fiber types on the basic mechanical properties of shotcrete. Sci. Rep. 2024, 14, 26573. [Google Scholar] [CrossRef]
  18. Wang, C.; Zhang, Y.; Duan, L. Bending performance test of ultra-high performance cement-based composites with copolyformaldehyde fiber. J. Compos. 2024, 41, 373–382. [Google Scholar]
  19. Qin, N.; Li, Q.; Xu, B. Pore characteristics and dynamic mechanical properties of polyformaldehyde fiber reinforced high strength concrete. J. Yangtze River Acad. Sci. 2023, 40, 180–186. [Google Scholar]
  20. Huang, D.; Niu, D.; Liu, Y.; Su, L.; Xia, Q. Study on mechanical properties, permeability and pore structure of basalt-polypropylene fiber reinforced concrete. Proc. Yangtze River Acad. Sci. 2023, 40, 147–152. [Google Scholar]
  21. Wang, Z.; Guo, R.; Guo, L.; Xia, H.; Zhang, J. Study on mechanical properties of polyformaldehyde fiber airport pavement concrete based on orthogonal test. Road Traffic Sci. Technol. 2023, 40, 57–65. [Google Scholar]
  22. Zhang, Z.; Zhu, X.; Zhang, Y.; Gong, R. Experimental and numerical investigation on flexural and fracture performance of steel fiber reinforced shotcrete. Constr. Build. Mater. 2022, 315, 125645. [Google Scholar] [CrossRef]
  23. Banjara, N.K.; Ramanjaneyulu, K. Experimental Investigations and Numerical Simulations on the Flexural Fatigue Behavior of Plain and Fiber-Reinforced Concrete. J. Mater. Civ. Eng. 2018, 30, 04018151. [Google Scholar] [CrossRef]
  24. Deng, Z.; Chen, P.; Liu, X.; Du, L.; Tan, J.; Liang, N. Study on the tensile and compressive mechanical properties of multi-scale fiber-reinforced concrete: Laboratory test and mesoscopic numerical simulation. J. Build. Eng. 2024, 86, 108852. [Google Scholar] [CrossRef]
  25. Chira, A.; Kumar, A.; Vlach, T.; Laiblová, L.; Škapin, A.S.; Hájek, P. Property improvements of alkali resistant glass fibers/epoxy composite with nanosilica for textile reinforced concrete applications. Mater. Des. 2015, 89, 146–155. [Google Scholar] [CrossRef]
  26. Liang, X.; Wu, C. Meso-scale modelling of steel fiber reinforced concrete with high strength. Constr. Build. Mater. 2018, 165, 187–198. [Google Scholar] [CrossRef]
  27. Hu, H.; Liu, J.; Wang, J. Analysis of Toughness and Acoustic Emission Characteristics of Fiber-reinforced Concrete. J. China Coal Soc. 2023, 48, 1209–1219. [Google Scholar]
  28. Zhang, W.; Xu, X.; Wang, H.; Wei, F.; Zhang, Y. Experimental and numerical analysis of interfacial bonding strength of polyoxymethylene reinforced cement composites. Constr. Build. Mater. 2019, 207, 1–9. [Google Scholar] [CrossRef]
  29. GB/T 50081-2019; Standard for Test Methods of Physical and Mechanical Properties of Concrete. China Construction Industry Publishing House: Beijing, China, 2019.
  30. JGJ/T 372-2016; Technical Specification for Application of Shotcrete. China Construction Industry Press: Beijing, China, 2016.
  31. GB 50086-2015; Technical Code for Rock and Soil Anchor and Shotcrete Support Engineering. China Construction Industry Press: Beijing, China, 2015.
  32. GB 50164-92; Concrete Quality Control Standard. China Construction Industry Publishing House: Beijing, China, 1993.
  33. Deng, Z.; Wang, H.; Liu, Y. Flexural toughness and fracture properties of eco-steel fiber reinforced concrete. J. Build. Sci. Eng. 2017, 34, 111–118. [Google Scholar]
  34. ASTM C1609/C1609M-19; Standard Test Method for Flexural Performance of Fiber-Reinforced Concrete (Using Beam with Third-Point Loading). ASTM International: West Conshohocken, PA, USA, 2012.
  35. Ding, Y.; Wang, Y.; Sun, X. Test method and evaluation standard for flexural toughness of steel fiber reinforced concrete. J. Build. Mater. 2014, 17, 76–82. [Google Scholar]
  36. Xu, H.; Deng, Z. Experimental Study on Mechanical Properties of New Ultra-High Performance Concrete. Concrete 2016, 4, 20–23. [Google Scholar]
  37. Wang, W.; Zhu, J.; Cheng, X.; Liu, S.; Jiang, D.; Wang, W. Numerical simulation of strength of basalt fiber permeable concrete based on CT technology. Case Stud. Constr. Mater. 2022, 17, e01348. [Google Scholar] [CrossRef]
  38. Yao, Y.; Zhong, Y.; Su, Z.; Muhammad, R.; Wang, D.; Li, Y.; Li, S.; Sun, G. Micromechanical analyses of unidirectional (UD) discontinuous flax fiber reinforced composites. Compos. Sci. Technol. 2024, 258, 110893. [Google Scholar] [CrossRef]
  39. Zhong, Y. Study on the Properties of Self-Compacting Vibration-Damping Soil for Fat Groove Backfilling. Master’s Thesis, Guangzhou University, Guangzhou, China, 2025. [Google Scholar]
  40. Mu, X. Study on the Bearing Capacity of Thin-Layer Comb Tenon Steel-Concrete Joints. Master’s Thesis, Northwest A&F University, Xianyang, China, 2025. [Google Scholar]
  41. GB/T 50010-2010; Design Standard of Concrete Structure. China Building Industry Press: Beijing, China, 2010.
  42. Sidoroff, F. Description of Anisotropic Damage Application to Elasticity; Springer: Berlin, Germany, 1981; pp. 237–244. [Google Scholar]
  43. Hillerborg, A.; Modéer, M.; Petersson, P.E. Analysis of crack formation and crack growth in concrete by means of fracture mechanics and finite elements. Cem. Concr. Res. 1976, 6, 773–781. [Google Scholar] [CrossRef]
  44. Wang, Z.; Niu, D.; Zhang, G. Comparison and parameter analysis of simulation and test on flexural performance of SFRC beams. J. Chin. Ceram. Soc. 2020, 39, 1401–1408. [Google Scholar]
  45. Xiao, J.; Li, Y.; Wang, Y. Numerical simulation analysis on seismic performance of recycled concrete shear walls. China Civ. Eng. J. 2016, 49, 21–30. [Google Scholar]
  46. Ding, Y.; Wang, Y. Experimental Study on Workability of Fiber Self-Compacting High-Performance Concrete. China Civ. Eng. J. 2015, 11, 51–57. [Google Scholar]
  47. Liu, Z.; Xiao, Y.; Li, J. Study on single fiber pull-out test and numerical simulation of steel fiber reinforced concrete. Eng. Mech. 2018, 35, 118–127. [Google Scholar] [CrossRef]
  48. Jin, J.; Du, X.; Liu, J. Numerical simulation of mechanical properties of steel fiber high-strength concrete based on mesomechanics. China Civ. Eng. J. 2012, 45 (Suppl. S1), 102–107. [Google Scholar]
  49. Pan, H.; Li, G.; Yao, J. Mesoscopic numerical simulation and experimental study on flexural performance of steel fiber reinforced concrete. J. Build. Struct. 2016, 37, 121–128. [Google Scholar]
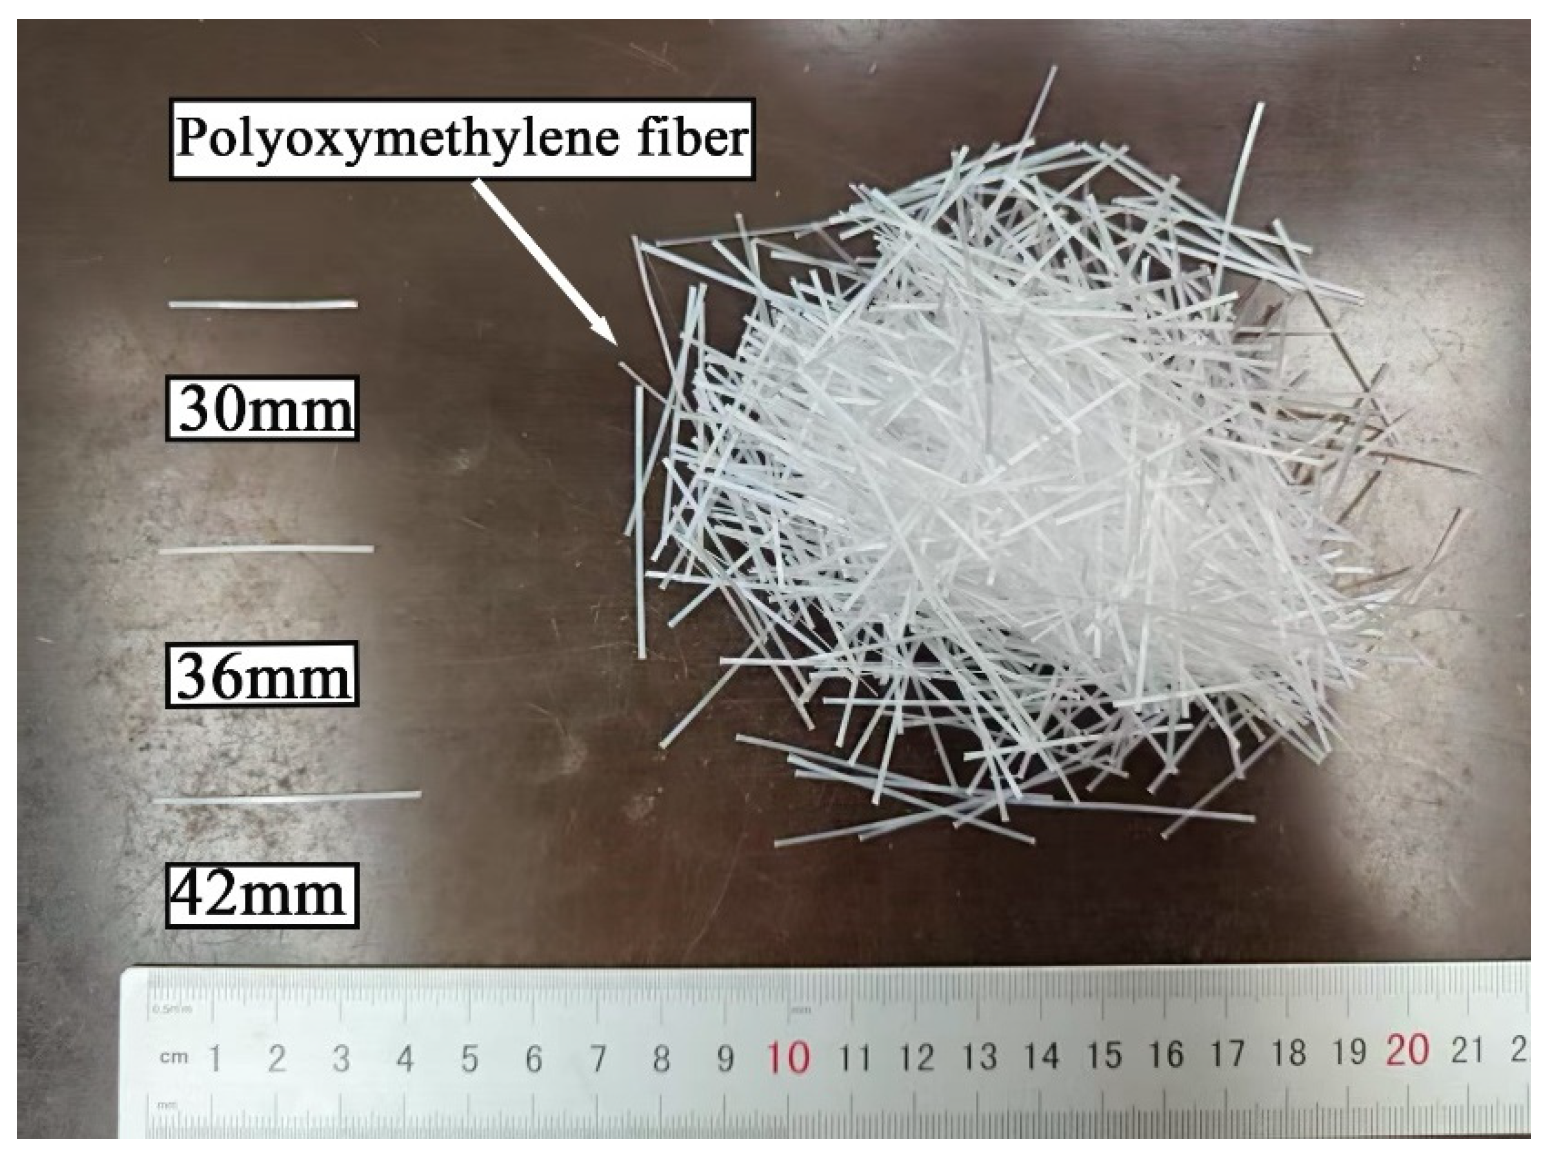
Figure 1. Appearance of polyoxymethylene fiber.
Eng 06 00322 g001
Figure 2. Preparation of fiber reinforced concrete specimens: (a) Fiber concrete mixing; (b) Fiber concrete spray plate; (c) Cutting plate; (d) Curing specimen.
Eng 06 00322 g002
Figure 3. Test loading diagram (mm).
Eng 06 00322 g003
Figure 4. Failure state of concrete specimen: (a) P0L0; (b) P5L30; (c) P7L30; (d) P9L30; (e) P5L36; (f) P7L36; (g) P9L36; (h) P5L42; (i) P7L42; (j) P9L42.
Eng 06 00322 g004aEng 06 00322 g004b
Figure 5. Load-deflection curves of fibers with different lengths: (a) 30 mm fiber length; (b) 36 mm fiber length; (c) 42 mm fiber length.
Eng 06 00322 g005
Figure 6. Load-deflection curves of different fiber content: (a) 5 kg/m3 fiber; (b) 7 kg/m3 fiber content; (c) 9 kg/m3 fiber content.
Eng 06 00322 g006
Figure 7. Flexural strength and proportion of fiber reinforced concrete.
Eng 06 00322 g007
Figure 8. Results of toughness index: (a) Residual strength; (b) Energy absorption.
Eng 06 00322 g008
Figure 9. Bending numerical model of fiber reinforced concrete: (a) Concrete model; (b) Fiber model.
Eng 06 00322 g009
Figure 10. Uniaxial stress–strain curve of concrete.
Eng 06 00322 g010
Figure 11. Stress–strain relationship of concrete plastic damage mode: (a) compressive stress–strain; (b) Tensile stress–strain.
Eng 06 00322 g011
Figure 12. Tensile damage cloud diagram of fiber reinforced concrete: (a) P0L0; (b) P5L30; (c) P7L30; (d) P9L30; (e) P5L36; (f) P7L36; (g) P9L36; (h) P5L42; (i) P7L42; (j) P9L42.
Eng 06 00322 g012aEng 06 00322 g012b
Figure 13. The stress cloud diagram of fiber in concrete: (a) P5L30; (b) P7L30; (c) P9L30; (d) P5L36; (e) P7L36; (f) P9L36; (g) P5L42; (h) P7L42; (i) P9L42.
Eng 06 00322 g013aEng 06 00322 g013b
Figure 14. Fiber orientation tensor distribution nephogram: (a) P5L30; (b) P7L30; (c) P9L30; (d) P5L36; (e) P7L36; (f) P9L36; (g) P5L42; (h) P7L42; (i) P9L42.
Eng 06 00322 g014aEng 06 00322 g014b
Figure 15. Concrete load deflection curve test and simulation comparison: (a) 30 mm fiber length; (b) 36 mm fiber length; (c) 42 mm fiber length.
Eng 06 00322 g015
Figure 16. Comparison of simulation data and test data.
Eng 06 00322 g016
Table 1. Mechanical parameters of fibers.
Density (g/cm3)Length (mm)Equivalent Diameter (mm)Tensile Strength (MPa)Elongation at Break (%)Elastic Modulus (GPa)Temperature (°C)
1.4130, 36, 420.44>100013~15%>1045~100 °C
Table 2. Fiber concrete mix ratio.
GroupingCement (kg/m3)Aggregate (kg/m3)Water (kg/m3)Fiber Length (mm)Fiber Content (kg/m3)Rapid Setting Admixture (kg/m3)
P0L03001260185--15
P5L30300126018530515
P7L30300126018530715
P9L30300126018530915
P5L36300126018536515
P7L36300126018536715
P9L36300126018536915
P5L42300126018542515
P7L42300126018542715
P7L42300126018542915
Table 3. Statistical values of flexural strength of fiber reinforced concrete.
Groupff/MPaGroupingff/MPa
xiμσcv(%)xiμσcv(%)
P0L02.842.940.072.38%P7L365.345.400.040.74%
3.005.43
2.995.43
P5L303.283.390.082.36%P9L365.485.570.071.26%
3.475.59
3.425.64
P7L303.503.520.030.85%P5L425.205.220.020.38%
3.575.22
3.505.25
P9L303.923.90.082.05%P7L425.335.410.061.11%
3.995.48
3.805.42
P5L363.944.100.122.93%P9L425.635.710.091.58%
4.175.65
4.205.84
Table 4. Concrete model parameters.
Dilatation AngleEccentricityfb0/fc0KViscous Parameter
380.11.160.666670.0005
Disclaimer/Publisher’s Note: The statements, opinions and data contained in all publications are solely those of the individual author(s) and contributor(s) and not of MDPI and/or the editor(s). MDPI and/or the editor(s) disclaim responsibility for any injury to people or property resulting from any ideas, methods, instructions or products referred to in the content.